Embed Size (px)
Citation preview

This information is confidential and was prepared by Bain & Company solely for the use of our client; it is not to be relied on by any 3rd party without Bain's prior written consent
DRAFT
India Investment Atlas
Jan 2018

This information is confidential and was prepared by Bain & Company solely for the use of our client; it is not to be relied on by any 3rd party without Bain's prior written consent 2
The India investment atlas seeks to derive four sets of insights from FDI inflows
Key questions Key questions
Aggregate trends in FDI
• How have FDI inflows grown historically? How does this compare to peers?
• Which sectors benefit? What are sectoral trends vis-à-vis manufacturing and services?
• Who are the recipients of FDI? What is the degree of consolidation in flows?
Benefits of FDI
• What do recipients use the funds for? Capex/ Capital block creation vs. M&A vs. financial funding (opex)
• How do these trends of usage vary by sector?
• How does FDI impact employment generation?
Source of FDI
• From which countries do flows originate? (Given and “true” origin)
• How do these trends vary by sector?
• What are the dynamics by investor type? (Industry investors vs. Financial investors)
Regulations / Ease of FDI
• What type of flows require approval?
• What are the trends by sector?

This information is confidential and was prepared by Bain & Company solely for the use of our client; it is not to be relied on by any 3rd party without Bain's prior written consent 3
Approach and methodology
Key questionsWhat we have done
Areas covered Specific analyses done
Aggregatetrends in FDI
• Historical trends in FDI
• Key sectors, recipients
• Degree of ‘consolidation’ in flows- #, size of txns.
• Peer benchmarking
• Analysis of two year (FY15-17) equity flows of $83B across 24K transactions to 9000+ recipients
• Analysis of H1 FY18
Benefits of FDI
(Impact in terms of financial performance,
employment, debt reduction, etc.)
• Financial performance of FDI recipients (vs. others)
• Analysis of 6433 companies that have received FDI (RBI Census)
• Impact on employment• Mapping of FDI to sector
employment intensity
• Split of inflows across capex, M&A, debt retirement, opex
• Bottom up build across 277 recipients ($52B, 63% of total) by sector
Source of FDI
(countries/ investors driving inflows)
• Origin country and “true” origin
• Flows through tax advantaged geos
• Dynamics (in terms of ‘true’ origin) by investor type
• Tracking back origin of ~730 investors accounting for $52B (63% of total)
Regulations / Ease of FDI
• % approvals by sector, transaction size, origin
• Analysis of two year (FY15-17) flows

This information is confidential and was prepared by Bain & Company solely for the use of our client; it is not to be relied on by any 3rd party without Bain's prior written consent 4
Summary observations and implications
• India’s FDI inflows have accelerated since FY15, growing at 15% p.a. over the past 2 years, relative to historical growth of 1.3% p.a. over FY09-15
- Over the last two years, India has outperformed other developing countries in FDI inflows as well (inflows de-grew at 4% p.a. for the latter, over the past 2 years)
• FY15-17 saw 24K transactions to 9K+ recipients; Inflows are highly concentrated with top 150 recipients accounting for 60% of value; inflows continue to be broad-based in terms of sectors
- While the government can accelerate efforts to increase inflows to MSMEs, a set of concentrated recipients spread across 8-10 key sectors of the economy bodes well for India’s growth story going forward
• Service-oriented sectors have gained share of total inflows (59% in FY15-17 vs. 45% over FY13-15) vis-à-vis manufacturing
- Average transaction size for inflows into services sectors is smaller relative to manufacturing; however, the number of recipients is considerably higher than manufacturing
- New economy companies dominate computer related & trading sectors which account for 30% of incremental growth (FY15-17 vs. FY13-15), with an additional 35% from services sector dominated by insurance & financial services cos
- In addition to services, Electricals & electronics, Materials and Textiles saw high growth between FY14 and FY17; Energy, Auto, Pharma and Education also displayed significant uptick in H1FY18
- India has a significant share of global flows in services sectors (Information, Telecom, computer related and financial services), but continues to be underpenetrated in others
- Sectors such as pharma, energy, electronics, textiles and business services are under-penetrated but have shown strong recent growth
• Increased FDI inflows indicate better economy-wide performance: Historically, FDI receiving cos. have outperformed others on profitability (1.5X) and ROE (1.4X)

This information is confidential and was prepared by Bain & Company solely for the use of our client; it is not to be relied on by any 3rd party without Bain's prior written consent 5
Summary observations and implications
• Employment generation not likely to be impacted due to shift of inflows away from manufacturing-higher share of flows to services are directed towards med-high employment intensity sub-sectors
- Hence, even though % of FDI into manufacturing has declined, impact on job creation likely to be limited, given most inflows within manufacturing are to lower employment intensive sectors (Auto, Chemicals)
• FDI supports capital formation across both services & manufacturing sectors with 65% of total funds used towards gross capital assets (vs. debt reduction / opex)
- Service sector recipients of FDI focus on capital asset formation (typically branch building/ expansion) to the same extent as manufacturing sector recipients (~50% of recipients for both)
• Sectors can be classified based on India’s penetration of global flows, employment intensity and growth trends – high employment sectors with poor performance to be prioritized for focus
• Top 3 “true” countries of origin are USA, Japan and Singapore; India has significant headroom to improve its share of wallet with top investors despite significant growth in inflows
- Flows from 7 countries including key global investors USA, Canada and Japan have grown significantly since FY14; Increased flows from Switzerland, Netherlands and Singapore seen in H1FY18
- However, share of wallet of top investors is <5% for 7/12 investors; leading global investors like Spain, Sweden, Italy currently invest minimally in India
- Flows from tax advantage geographies have increased from 59% (FY08-12) to 67% (FY13-17) with Mauritius & Singapore leading, though these are expected to decline going forward, with DTAA agreements in place
- Investors can be classified based on existing relationship with India, size of outflows and growth trends – Large investors with low share of wallet or poor/volatile growth to be prioritized for focus

This information is confidential and was prepared by Bain & Company solely for the use of our client; it is not to be relied on by any 3rd party without Bain's prior written consent 6
Summary observations and implications
• In terms of investor type, financial investors use tax advantaged geos more than industrial investors (~90% vs. 55% of total FDI respectively)
• Service sectors see higher % of flows through tax adv geos (78% vs. 58% for mfg) driven by higher share of FI’s and higher likelihood of industry investors to use tax adv geos for services
- FI’s likelier to invest in services accounting for 31% of flows to these sectors vs. 22% for manufacturing sectors
- Industry investors are 2X more likely to route service transactions through tax adv geos than for mfg sectors
• Ease of investing in India has improved over time; approvals are concentrated on larger size transactions & those that are routed through tax advantaged geographies
- Approvals account for <13% of all transactions in FY15-17, driven largely by telecom, services sector
- 22% of transactions of >$500M require approvals vs. <5% of those <$5M
- 17% of FDI inflows through tax advantage geographies are subject to approval vs. 8% of others

This information is confidential and was prepared by Bain & Company solely for the use of our client; it is not to be relied on by any 3rd party without Bain's prior written consent 7
Summary: Sectors and investors prioritized for focus
Sectors with strong performance Investors with strong performance
… with whom India has high SoW but poor traction or
volatile relationship
… that have a negligible/
nascent relationship with
India but show strong traction
… that are under-penetrated but showing strong
traction
…where India has established
presence but with poor or volatile
growth
Sectors to focus on
High penetration of global flows
and high, consistent growth
High share of wallet and high,
consistent growth
Investors to focus on
High employment sectors… Large investors that…
• Information, telecom & computer related
• Trading
• Auto
• Machinery & Equipment
• Health
• Business services
• Textiles
• USA
• Japan
• UAE
• Switzerland
• Russia
• Germany
• Canada
• China
• South Korea
• Ireland
• France
• Materials
• Financial services

This information is confidential and was prepared by Bain & Company solely for the use of our client; it is not to be relied on by any 3rd party without Bain's prior written consent 8
Global economic crisis and recovery Launch of MII
Drivers
• Global economic crisis impacts inflows
• Falling valuations cause spike of large M&A in 2012 e.g. BP-Reliance, Vodafone-Essar, Vedanta-Cairn
• Recovery beginning FY13
• Govt opens up defence
• Reforms in construction, retail, insurance
• Special provisions made for start ups
Since FY15 India’s FDI inflows have grown at 15% CAGR…
Launch of MII Sep ‘14
CAGR09-151.3%
CAGR15-1715%
Note: FDI Total flows include FDI Equity Flows, reinvested earnings and other capital; FY18(E) calculations done using H1FY18 FDI inflowsSource: DIPP Factsheet, April 2000- March 2017
CAGR:-2% CAGR: -4%
H1 FY18 flows grew by 16% over H1 FY17
inflows

This information is confidential and was prepared by Bain & Company solely for the use of our client; it is not to be relied on by any 3rd party without Bain's prior written consent 9
… ahead of its developing country peers; Lower FDI Stock/GDP indicates further headroom for growth
Note: G20 developing countries include Argentina, Brazil, China, Indonesia, Russia, Mexico, Saudi Arabia, South Africa, Turkey; ASEAN include all 10 member countries; G33 includes all 48 member countries except Cuba & India; Next 11 includes all 11 member countriesSource: World Investment Report, 2017
India’s FDI inward stock/GDP is 14% vs 30% developing country avg

This information is confidential and was prepared by Bain & Company solely for the use of our client; it is not to be relied on by any 3rd party without Bain's prior written consent 10
FDI flows are concentrated amongst recipients with only 150 companies (of ~9K) receiving 60% of total
TOP 150 RECIPIENTS DRIVE ~60% OF ALL FDI EQUITY INFLOWS
TOP 10 RECIPIENTS ACCOUNT FOR 20% OF FDI
Name Sector $M
Vodafone India Ltd Telecom 2501
Serene Senior LivingConstruction/Real estate
2252
Ambuja Cements Ltd.Materials manufacturing
1661
Triguna Hospitality Ventures (India) Pvt
Hotels & tourism* 1654
Jasper Infotech Pvt Ltd (Snapdeal)
Computer software/hardware
1585
Tata Teleservices Ltd Telecom 1574
Insitel Services Pvt Ltd (Sistema Jsfc Subsidiary)
Trading 1457
Amazon Seller Services Pvt. Ltd.
Trading 1442
Star India Pvt Ltd Info & Broadcasting 1158
Ani Technologies Pvt Ltd (Ola Cabs)
Computer software/hardware
1002
Benefits of FDI flows are limited to a few companies; MSMEs which have higher labour intensity receive limited fund flows
Source: DIPP Remittance Data FY15-17

This information is confidential and was prepared by Bain & Company solely for the use of our client; it is not to be relied on by any 3rd party without Bain's prior written consent 11
This consolidation has increased over time with average FDI inflows/recipient increasing by 35% since FY14
Source: DIPP Remittance Data, 2000-2017

This information is confidential and was prepared by Bain & Company solely for the use of our client; it is not to be relied on by any 3rd party without Bain's prior written consent 12
However, inflows continue to be broad based in terms of sectors, even with a concentrated set of recipients
Note: Sector classification based on DIPP definitions e.g. Triguna included in services though active in ‘hotels & tourism’; *Top 146 recipients with total investment of $100M+ from FY15-17 depicted Source: DIPP Remittance Data FY15-17

This information is confidential and was prepared by Bain & Company solely for the use of our client; it is not to be relied on by any 3rd party without Bain's prior written consent 13
Services sectors gained share driven by large number of recipients; Manufacturing sectors more consolidated
Targeted support to potential manufacturing recipients in raising funds could increase flows in underpenetrated sectors
Note: Sector classification based on DIPP definitions; Services oriented includes services, computer, education, hospitals, tourism, information, telecom, trading; Manufacturing oriented includes Auto, Chemicals, Construction, Natural resources, Energy, F&B, Pharma, Textiles, Wood & paper, Machinery, Electronics, MaterialsSource: DIPP Remittance Data FY15-17, Bain Analysis
Top 3 recipients
ServicesComp. related
Trading Telecom Const. Auto Energy Electronics ChemicalsNatural
resources
TrigunaEmpowerIndusInd
Jasper Ani Tech.Accenture
InsitelAmazon
IKEA
VodafoneTata Tele
Viom Networks
SerenePRLDLF
SuzukiGeneral
Ford
AdaniMeenakshi EnergyPipavav Energy
EssarToshiba
Crompton Greaves
ShellUPL
Kansai Nerolac Paints
JSWEssel Mining
POSCO
SERVICE ORIENTED SECTORS GAINED SHARE
SERVICES SECTORS HAVE MORE RECIPIENTS BUT LOWER AVG. TNXVALUES THAN MFG RECIPIENTS

This information is confidential and was prepared by Bain & Company solely for the use of our client; it is not to be relied on by any 3rd party without Bain's prior written consent 14
FY15-17 vsH1FY18
% Top 10 sectors
75% 77%
Note: Sector classification based on Bain sector definitions; M&E represents Machinery & EquipmentSource: Sector-wise DIPP Remittance Data FY’01-17, Bain Analysis
75%
FY13-15 vsFY15-17
Vodafone receiving $6B inflows
TELECOM AND COMPUTER SOFTWARE/HARDWARE GAINED SHARE IN FY15-17 &SHOW UPTICK IN H1FY18
Top 10 sectors account for ~80% of flows; Services, computer related and trading lead

This information is confidential and was prepared by Bain & Company solely for the use of our client; it is not to be relied on by any 3rd party without Bain's prior written consent 15
7 sectors have grown significantly since 2014; Trading additionally shows uptick in H1FY18
Note: Total FDI Equity Inflows in India grew at 21% CAGR FY14-17; Uptick in FY18 for sectors with CAGR >40% FY17-FY18ESource: Sector-wise FDI Inflows, DIPP
2013-14 2016-17CAGR
(FY14-FY17)Uptick in H1FY18*
Electricals & electronics
480 2,602 76%
Materials 447 2,197 70%
Telecom 1,307 5,564 62%
Services 2,669 9,840 54%
Computer S/W H/W 1,126 3,652 48%
Textiles 205 621 45%
Info & broadcasting 542 1,570 43%
Natural resources 696 1,676 34%
Trading 1,355 2,789 27%
Hotel & Tourism 486 916 24%
Chemicals 807 1,404 20%
Energy 1,480 1,897 9%
Construction 1,711 1,966 5%
Health 685 747 3%
Auto 1,517 1,609 2%
Machinery & equipment 1,102 1,127 1%
Misc 757 542 -11%
Pharma 1,279 857 -12%
Education 262 160 -15%
F&B 4,828 964 -42%
>=40% 0-20% <=0%20-40%

This information is confidential and was prepared by Bain & Company solely for the use of our client; it is not to be relied on by any 3rd party without Bain's prior written consent 16
Compared to global flows, India remains under penetrated on several fast growing sectors
Vietnam, China,
Malaysia
China, Mexico, Indonesia
China (EY, Deloitte, PWC), Egypt, Vietnam
China, Mexico, Indonesia
China, Vietnam, Mexico
China, Mexico, Malaysia
Efforts to be focused on med-high employment, underpenetrated sectors: Textiles, F&B, Machinery & Equipment, Business services
Note: Telecom included in Info & computer; CAGR unavailable for Logistics; Overall services CAGR used for business and financial servicesSource: UNCTAD, DIPP Database, FDI markets database, Bain Analysis
High growth sectors
Leading developing
country recipients
Under-penetrated
Over-penetrated
CAGR(FY14-17)>40% or CAGR FY17-FY18E
>40%

This information is confidential and was prepared by Bain & Company solely for the use of our client; it is not to be relied on by any 3rd party without Bain's prior written consent 17
FDI inflows are correlated to higher performance on both profitability as well as ROE
… AND 1.4X HIGHER ROE THAN NON FDI COMPANIES
Note: The analysis is based on 6433 Companies that received FDISource: Finances of Foreign Direct Investment Companies, 2015-16 - RBI, Bain Analysis
FDI COMPANIES HAVE 1.5X HIGHER PROFITABILITY…
Benefits of FDI

This information is confidential and was prepared by Bain & Company solely for the use of our client; it is not to be relied on by any 3rd party without Bain's prior written consent 18
Larger share of FDI into services is directed towards med-high employment generating sectors
Benefits of FDI
MFG: ~34% OF FDI TOWARDS SECTORS WITH >7.5 JOBS /$M
SERVICES: ~61% OF FDI TOWARDS SECTORS WITH >7.5 JOBS /$M
Note: Med-High defined as 7.5 jobs/$M; Multiplier effect on employment not captured; Data for Jan 2014 – Dec 2017 accounting for $171B Capex and 780K jobs taken Source: FDI Markets database, Bain analysis
Avg jobs/$M= 3.5 Avg jobs/$M= 6.3
Efforts to be focused on med-high employment, underpenetrated sectors: Textiles, F&B, Chemicals, Pharma, Business services

This information is confidential and was prepared by Bain & Company solely for the use of our client; it is not to be relied on by any 3rd party without Bain's prior written consent 19
A study of a subset of projects further highlights that select service sectors create the most jobs/$
Services
Manufacturing
Benefits of FDI
Note: Multiplier effect on employment not captured; Data for Jan 2014 – Dec 2017 for top 10 sectors usedSource: FDI Markets Database, Bain Analysis
TOP 10 SECTORS: ACROSS $56B OF CAPEX INVESTMENT, A TOTAL OF 4,75,000 JOBS WERE CREATED I.E. 8.5 JOBS CREATED PER $1M
Top 10 sectors shown

This information is confidential and was prepared by Bain & Company solely for the use of our client; it is not to be relied on by any 3rd party without Bain's prior written consent 20
Despite share gain by service oriented sectors, capital asset formation increased
GROSS CAPITAL ASSET CREATION HAS INCREASED IN MFG, SERVICES…
…DRIVEN BY EXTERNAL SOURCES BEYOND DEBT FUNDING
Benefits of FDI
Potential uses of funds: Capital asset creation, debt retirement, M&A and opex fundingIn case of acquisition of shares, fund flow is to existing shareholders, benefits of which are not
captured
Note: This analysis is based on 6,433 Companies that received FDISource: RBI report: ‘Finances of FDI Companies, 2015-16’, Bain Analysis

This information is confidential and was prepared by Bain & Company solely for the use of our client; it is not to be relied on by any 3rd party without Bain's prior written consent 21
Sector Comments
Trading• Opening of new outlets/ warehouses e.g. IKEA
entry into India, Amazon warehouse expansion
FinancialServices
• Branch expansions e.g. IndusInd added 200 branches
Computer Related
• Expansion and acquisitions e.g. Snapdeal opened 6 logistics center, acquired 12 companies
Insurance• Branch expansions and investment in technology
e.g. HDFC Ergo GIC: investment in software
Bottom up study also shows that service recipients are equally likely to indulge in capital formation
Benefits of FDI
Avg.
Services 52%
Manufacturing 52%
Sector Comments
Chemicals
• Expansion of production capacity e.g. UPL plant in Gujarat, Sintex plant in Gujarat
Auto• Opening new manufacturing plants e.g. Suzuki
Motor Corp Guj started production in Feb 2017
Energy
• Launch of new plants, new entry e.g. ThemalPowertech Corporation recently entered; Azure power solar project in Punjab
Note: Data across 172 recipients shown; Only sectors with 5 or more recipients shown; Recipients whose gross blocks moved >20% were included to calculate change in BS; Excludes construction sector due to limited data availabilitySource: Bain Analysis

This information is confidential and was prepared by Bain & Company solely for the use of our client; it is not to be relied on by any 3rd party without Bain's prior written consent 22
Moreover, services recipients were more likely to use funds for M&A…
Note: Data across 172 recipients shown; Only sectors with 5 or more recipients shown; M&As in the time frame of 2014-17 have been considered; Financial details for construction sector companies not available, hence has not been displayedSource: Bain Analysis
Benefits of FDI
Avg.
Services 28%
Manufacturing 13%
Sector Examples Sector Examples
TradingMyntra acquisition of 3 cos incl Xerio retail, Grid ant tech
ChemicalsUPL: Acquired Serra Bonita, Advanta
Comp Related
Snapdeal acquired 12 companies, Ola acquired 5 companies
EnergyAdani acquired 4 cos incl Korba west power, Power undertaking
Financial services
Kotak Mahindra: Acquired 5 cos including BSS Microfinance, Airtel Payments Bank, ING Vysya Bank Ltd
Natural Resources
JSW Steel acquired Welspun Maxsteel, Mahindra acquired Bill Forge

This information is confidential and was prepared by Bain & Company solely for the use of our client; it is not to be relied on by any 3rd party without Bain's prior written consent 23
… while manufacturing recipients were more likely to use funds for debt retirement
Note: Data across 172 recipients shown; Only sectors with 5 or more recipients shown; Recipients whose liabilities moved >20%were included to calculate change in BS; Financial details for construction sector companies not available, hence has not been displayed; Source: Bain Analysis
Benefits of FDI
Sector Examples Sector Examples
LogisticsSterling Port: Liabilities reduced from INR 4.6B to INR 1.9B
ChemicalsLanxess India: Liabilities reduced from INR 7B to 2B
Business support
Avendus Capital Pvt Ltd: Liabilities reduced from INR 31M to 0 M
AutoGeneral Motors India: Liabilities reduced from INR 15B to INR 2B
Prof. services
Subex Limited: Liabilities reduced from INR 5 B to INR400 M
ElectronicsNovateur Electricals: Liabilities reduced from INR 13B to 8B
Avg.
Services 10%
Manufacturing 17%

This information is confidential and was prepared by Bain & Company solely for the use of our client; it is not to be relied on by any 3rd party without Bain's prior written consent 24
Employment intensity (Jobs/$M capex)
India’s penetration of global flows
Growth trend: Volatility & recent traction
Sectors can be classified on the basis of 3 criteria (1/2)
1
2
3
Large: >$25B (Top 15) Low: <7/$MHigh: >7/$M
High impact sectors for focus Lower impact sectors
Low/ under-penetrated: <2%High/ over-penetrated: >2%
High share of global sector flows increases ability to win by providing
existing base
Under-penetration indicates high upside potential depending on India’s competitive
advantage
Strong recent traction implying momentum for future expansion
Efforts needed in order to ensure more consistent flows and higher growth
Limited or volatile traction: CAGR<25%Strong recent traction: CAGR >25%
Source: Bain Analysis
Benefits of FDI

This information is confidential and was prepared by Bain & Company solely for the use of our client; it is not to be relied on by any 3rd party without Bain's prior written consent 25
Sectors can be classified on the basis of 3 criteria (2/2)
India’s penetration of global flows
High/ over-penetrated: >2% Low/ underpenetrated: <2%
1
2 Employment Intensity
Growth trend: Volatility & recent traction
3
Sectors with strong performance:
Sectors to focus on:High employment
sectors with
• High share sectors with consistent and high growth
• High penetration but volatile or poor traction
• Strong traction but low/ no penetration
Benefits of FDI
High: >7 jobs/$M Low: <7 jobs/$M High: >7 jobs/$M Low: <7 jobs/$M
Source: Bain Analysis
Strong recent traction:
CAGR>25%
Limited or volatile traction:
CAGR <25%
Strong recent traction:
CAGR>25%
Limited or volatile traction:
CAGR <25%
Strong recent traction:
CAGR>25%
Limited or volatile traction:
CAGR <25%
Strong recent traction:
CAGR>25%
Limited or volatile traction:
CAGR <25%
Info, telecom & computer
Trading
Auto
Machinery & Equipment
Health
Materials
Financial services
Construction
Hotels & tourism
Business services
Textiles
F&B
Electricals & electronics
Chemicals
Energy
Pharma
Natural resources

This information is confidential and was prepared by Bain & Company solely for the use of our client; it is not to be relied on by any 3rd party without Bain's prior written consent 26
Overall, FDI from tax advantage geos is increasing; Tax advantage geo flows are more consolidated
TAX ADVANTAGE GEOS ACCOUNT FOR ~67% OF FLOWS; SINGAPORE, NETHERLANDS GAIN
SHARE
%pt share gainFY13-17
vs.FY08-12
LARGER TRANSACTIONS ARE MORE LIKELY TO COME THROUGH TAX ADVANTAGE GEOS
Source of FDI
Note: Tax advantage geos classified based on report titled “Closing the Flood Gates”, Norwegian Ministry of Foreign Affairs (mid, premier category only); These countries represent ‘given origin’Source: DIPP Factsheet, April 2000 - June 2017; Bain analysis
Cyprus
UK

This information is confidential and was prepared by Bain & Company solely for the use of our client; it is not to be relied on by any 3rd party without Bain's prior written consent 27
% GlobalFlows
(2016)
CAGR(FY14-FY17)
Uptick in H1FY18
Bermuda 0% 442%
Canada 5% 193%
Mauritius 0% 48%
U.S.A 21% 43%
Japan 10% 40%
South Korea 2% 39%
UAE 1% 38%
France 4% 26%
Italy 2% 23%
Switzerland 2% 15%
Netherlands 12% 14%
Singapore 2% 13%
Cyprus 0% 3%
Germany 2% 1%
United Kingdom -1% -23%
Note: Total FDI Equity Inflows in India grew at 21% CAGR FY14-17; -ve Global flows are recorded for UK since WIR accounts for intra-company loan movement resulting in –ve outflows; top 15 investors based on FY17 inflows have been represented; LHS represents ‘given origin’Source: Country-wise FDI Data, DIPP; World Investment Report , 2017
7 countries, including leading global investors USA & Canada have significantly increased flows to India
>=35% 0-20% <=0%20-35%
TOP 10 COUNTRIES ACCOUNT FOR ~90% OF FLOWS IN 2016-17
BERMUDA & CANADA GREW OVER LAST 4 YEARS, SWITZERLAND GAINED IN H1FY18
Source of FDI

This information is confidential and was prepared by Bain & Company solely for the use of our client; it is not to be relied on by any 3rd party without Bain's prior written consent 28
USA, UK use tax advantage geos the most; US, Japan & Singapore are top 3 “true” origin countries
COMPUTER SOFTWARE & HARDWARE SECTOR RECEIVES 94%* OF FLOWS THROUGH GEOS OFFERING TAX ADVANTAGE
Source of FDI
USA & JAPAN DRIVE HIGHEST FDI
INFLOWS
Note: Data shown for 662 investors; Analysis done for top recipients of each sector covering $9331M of services, $5778M of computer S/H, $4181M of trading, $5474M of Telecom, $1598M of Energy, $1168M of Electrical & Electronic, $2706M of Automobile, $4088M of construction, $1888M of Chemicals, $1808M of Natural Resources & $9759M of OthersSource: DIPP Remittance Data, 2000-2017

This information is confidential and was prepared by Bain & Company solely for the use of our client; it is not to be relied on by any 3rd party without Bain's prior written consent 29
Scope to increase SoW with existing investors; add’lpotential with other top global investors not investing today
SIGNIFICANT HEADROOM FOR INDIA TO GAIN SOW WITH CURRENT INVESTORS – 8/13 INVESTORS HAVE <5% SOW
TARGET TOP GLOBAL INVESTORS CURRENTLY
NOT INVESTING IN INDIA
Spain:
$42B global outflows
$168M current India
Inflow (2016)
Sweden:
$23B global outflows
Current India Investment NA
Italy:
$23B global outflows
$123M current India Inflow (2016)
Finland:
$23B global outflows
Current India Investment NA
Note: All outflows represent flows in 2016; top investors based on FY17 inflows shown after mapping to ‘True Origin’; SOW for Tax Adv. Geos has been calculated using net outflows; SOW for Singapore & HongKong not shown as net outflows are negativeSource: World Investment Report, 2017; UK Global Outflows Data is from their govt website
Non-Tax Adv. Geos
Tax Adv. Geos
Legend:
Source of FDI

This information is confidential and was prepared by Bain & Company solely for the use of our client; it is not to be relied on by any 3rd party without Bain's prior written consent 30
Size of investor outflows
India’s existing relationship with investor
Growth trend: Volatility & recent traction
Investors can be classified on the basis of 3 criteria (1/2)
1
2
3
Large: >$25B (Top 15) Med – Small: <$25BLarge: >$25B (Top 15)
Global investors of significance, with large potential upside from increasing
share of wallet
Smaller scale investors, limited upside from increasing share of wallet
Low share of wallet: <2%High share of wallet: >2%
Existing relationship increases ability to win by providing existing base
Lowered ability to win when relationship needs to be initiated
Strong recent traction implying momentum for future expansion
Limited or negative traction and/or volatile inflows to India indicates poor quality of
relationship
Limited or volatile traction: CAGR<25% or volatility >0.8
Strong recent traction: CAGR >25%
Source: Bain Analysis
Source of FDI

This information is confidential and was prepared by Bain & Company solely for the use of our client; it is not to be relied on by any 3rd party without Bain's prior written consent 31
Investors can be classified on the basis of 3 criteria (2/2)
India’s existing relationship with investor
High: Share of wallet >2% Low: Share of wallet <2%
1
2 Employment Intensity
Growth trend: Volatility & recent traction
3
Countries with strong performance:
Investors to focus on: Large with
• High SoW & consistent, high growth
• High SoW but volatile or poor traction
• Strong traction but low/ no SoW
Benefits of FDI
Large: >$25B(Top 15)
Med – Small:<$25B
Large: >$25B(Top 15)
Med – Small:<$25B
Source: Bain Analysis
Strong recent traction:
CAGR>25%
Limited or volatile traction:
CAGR <25%
Strong recent traction:
CAGR>25%
Limited or volatile traction:
CAGR <25%
Strong recent traction:
CAGR>25%
Limited or volatile traction:
CAGR <25%
Strong recent traction:
CAGR>25%
Limited or volatile traction:
CAGR <25%
USA
Japan
Switzerland
Russia
Germany
Ireland
France
UAE
Singapore
UK
South Africa
Canada
China
Korea
HK
Spain

This information is confidential and was prepared by Bain & Company solely for the use of our client; it is not to be relied on by any 3rd party without Bain's prior written consent 32
Financial investors account for 28% of total, investing higher in services; More likely to use tax advantage geos
Source of FDI
COMPUTER S/W & H/W HAS THE HIGHEST SHARE OF FLOWS FROMFINANCIAL INVESTORS
Note: Financial Investors includes PE, VC, Hedge Funds, Asset Mgmt.; Analysis done for top recipients of each sector covering$9331M of services, $5778M of computer S/H, $4181M of trading, $5474M of Telecom, $1598M of Energy, $1168M of Electrical & Electronic, $2706M of Automobile, $4088M of construction, $1888M of Chemicals, $1808M of Natural Resources & $9759M of Others; Source: DIPP Remittance Data, 2000-2017, Bain Analysis
Avg.
Services 32%
Manufacturing 24%
FINANCIAL INVESTORS USE TAX ADVANTAGE GEOS MORE

This information is confidential and was prepared by Bain & Company solely for the use of our client; it is not to be relied on by any 3rd party without Bain's prior written consent 33
Additionally, industry investors prefer to route service related transactions through tax advantage geos
Source: DIPP Remittance Data, 2000-2017; Bain analysis
Source of FDI
Avg.
Services 65%
Manufacturing 30%

This information is confidential and was prepared by Bain & Company solely for the use of our client; it is not to be relied on by any 3rd party without Bain's prior written consent 34
Hence, service related industries see higher use of tax advantage geos than manufacturing industries
~78% OF FDI INFLOWS FOR THE SERVICES SECTOR CAME THROUGH TAX ADVANTAGE GEOS COMPARED TO 58% FOR MANUFACTURING SECTOR
Services Manufacturing
(78%) (58%)
Note: Tax advantage geos classified based on report titled “Closing the Flood Gates”, Norwegian Ministry of Foreign Affairs (mid, premier category only); Sector classification as per DIPP Source: DIPP Remittance Data, 2000-2017
Source of FDI

This information is confidential and was prepared by Bain & Company solely for the use of our client; it is not to be relied on by any 3rd party without Bain's prior written consent 35
Ease of investing improved over the last 15 years; However, high inflow sectors telecom, services require a high % of approvals
>65% CUMULATIVE FDI INFLOWS IN THE LAST 5 YEARS CAME THROUGH AUTOMATIC ROUTE
Note: Calendar year data has been used due to unavailability of financial year dataSource: Statement on Year-wise/Route-wise FDI Equity Inflows, SIA, Jan 2000 to March 2017
Increasingly easy for investors to invest, reflecting positively on reforms made
4 SECTORS DRIVE FLOWS THROUGH APPROVAL ROUTE; SERVICES, TELECOM SIGNIFICANT
Further analysis of telecom, services transactions required to determine need
for easing policy restrictions
Ease of regulations

This information is confidential and was prepared by Bain & Company solely for the use of our client; it is not to be relied on by any 3rd party without Bain's prior written consent 36
Larger size transactions and flows sourced from tax advantage geos have higher approval %ges
Ease of regulations
~22% OF DEALS GREATER THAN $500M REQUIRED APPROVAL
~17% FDI INFLOWS FROM TAX ADVANTAGE GEOS NEEDED APPROVAL
Source: DIPP remittance Data, 2000-2017

This information is confidential and was prepared by Bain & Company solely for the use of our client; it is not to be relied on by any 3rd party without Bain's prior written consent 37
Next Steps
Potential areas to explore further
Key aspects to cover
Aggregate• Handbook of
best practices
• International best practices in attracting FDI and impact of the same
• State-wise best practices applied
Benefits of FDI
• Engagement plan by sector
• Prioritize focus sectors based on
• Benefits: Employment, capex, GDP
• Ability to drive FDI flows: Size of global pool, India’s competitive advantage
• Identify potential recipients
• Align on areas of support
• State-wise assessment of FDI benefits
• Evaluate which states receive end flows, by sector
• Impact of FDI flows by state: capital assets created, employment generated
Source of FDI
• Mandate by country/ trade mission
• Prioritize focus countries based on
• Attractiveness: Full potential, sector overlap with priority sectors
• Ability to win: India’s competitive advantage vs. current top recipient countries
• Create playbook for each country including i) Key sectors ii) Top investor companies to target iii) Potential recipients
• Impact of new DTAA agreements
• Estimate potential impact on FDI flows of new DTAA agreements
Regulations• Impact of
liberalization• Understand historical impact of liberalization on FDI inflows - by sector and
investor

This information is confidential and was prepared by Bain & Company solely for the use of our client; it is not to be relied on by any 3rd party without Bain's prior written consent 38
Backup

This information is confidential and was prepared by Bain & Company solely for the use of our client; it is not to be relied on by any 3rd party without Bain's prior written consent 39
7 sectors have grown significantly since 2014
Note: Total FDI Equity Inflows in India grew at 21% CAGR FY14-17Source: Sector-wise FDI Inflows, DIPP
2013-14 2014-15 2015-16 2016-17CAGR
(FY14-FY17)H1FY18 FY17-FY18E
Electricals & electronics 480 902 812 2,602 76% 541 -58%
Materials 447 286 97 2,197 70% 84 -92%
Telecom 1,307 2,895 1,324 5,564 62% 6,084 119%
Services 2,669 5,371 8,282 9,840 54% 4,367 -11%
Computer S/W H/W 1,126 2,296 5,904 3,652 48% 3,045 67%
Textiles 205 232 247 621 45% 217 -30%
Info & broadcasting 542 328 1,132 1,570 43% 402 -49%
Natural resources 696 2,123 1,080 1,676 34% 118 -86%
Trading 1,355 2,897 4,108 2,789 27% 1,563 12%
Hotel & Tourism 486 777 1,333 916 24% 470 3%
Chemicals 807 1,043 1,494 1,404 20% 897 28%
Energy 1,480 1,323 1,645 1,897 9% 1,537 62%
Construction 1,711 1,639 4,623 1,966 5% 1,246 27%
Health 685 568 742 747 3% 497 33%
Auto 1,517 2,726 2,527 1,609 2% 1,235 54%
Machinery & equipment 1,102 1,187 1,184 1,127 1% 607 8%
Misc 757 953 943 542 -11% 280 3%
Pharma 1,279 1,498 754 857 -12% 864 102%
Education 262 79 231 160 -15% 223 179%
F&B 4,828 919 849 964 -42% 581 21%
>=40% 0-20% <=0%20-40%

This information is confidential and was prepared by Bain & Company solely for the use of our client; it is not to be relied on by any 3rd party without Bain's prior written consent 40
Sectors can be classified on the basis of 3 criteria: India’s share of global sector flows, employment, growth trends
Auto 4,136 136,310 3.0% 8.28 2% 0.91
Health 1,490 21,340 7.0% 8.08 3% 0.36
Machinery & equipment
2,311 82,050 2.8% 7.75 1% 0.49
Legend>2% >7 >20 % <0.6
<2% <7 <20 % >0.6
SectorCurrent size($M)
Global pool($M)
Penetration(Share %)
Employment(Jobs/$M)
CAGR(FY13-17)
Volatility
Info, Telecom & computer
19,146 44,796 42.7% 14.38 48% 0.01
Trading 6,897 114,954 6.0% 8.71 27% 0.34
Materials 2,294 59,500 3.9% 3.86 70% 0.58
Financial services 9,598 243,661 3.9% 3.78 54% 0.30
Construction 6,589 224,009 2.9% 3.16 5% 0.81
Hotel & Tourism 2,247 46,833 4.8% 2.87 24% 0.70
Pharma 1,611 208,350 0.8% 5.84 -12% 0.7
Natural resources 2,756 328,212 0.8% 0.84 34% 0.99
Energy 3,542 346,555 1.0% 0.11 9% 0.75
Business services 4,438 325,841 1.4% 15.91 54% 0.30
Textiles 868 57,688 1.5% 15.58 45% 0.32
F&B 1,813 212,929 0.9% 8.77 -42% 0.91
Electricals & electronics
3,414 186,174 1.8% 3.62 76% 0.31
Chemicals 2,899 169,055 1.7% 6.32 20% 0.1
Note: Information & broadcasting, Telecom, Computer S/W H/W have been clubbed for comparison to global flows; Volatility has been calculated by 1-R2 (explained variance) value of sector flows over FY13-17Source: Bain Analysis
Sectors with high share and growth
Sectors with strong performance
High penetration/ employment with
poor growth
High growth/ employment with
low share
Sectors for focus
Low employment, under-penetrated
Under-penetrated, poor growth
Low employment with poor or volatile growth

This information is confidential and was prepared by Bain & Company solely for the use of our client; it is not to be relied on by any 3rd party without Bain's prior written consent 41
While few mfg. sectors have higher % of exports, overall focus remains on Indian consumers
Note: Export to sales % obtained for FY16; % FDI equity inflows FY15-17 depicted; Transport Storage & communication comprises of Logistics Services & Information & BroadcastingSource: St 11: Select Financial Ratios of the select 6,433 FDI Companies - Industry Group Wise, RBI; DIPP remittance data FY15-17;
SELECT MFG. SECTORS HAVE HIGHER % OF EXPORT SALES
Services Manufacturing

This information is confidential and was prepared by Bain & Company solely for the use of our client; it is not to be relied on by any 3rd party without Bain's prior written consent 42
Note: Total FDI Equity Inflows in India grew at 21% CAGR FY14-17; -ve Global flows are recorded for UK since WIR accounts for intra-company loan movement resulting in –ve outflows; top 15 investors based on FY17 inflows have been representedSource: Country-wise FDI Data, DIPP; World Investment Report , 2017
5 countries, including leading global investors USA & Japan have significantly increased flows to India
2013-14 2014-15 2015-16 2016-17% Global Flows
(2016)CAGR
(FY14-FY17)
Bermuda 11 91 106 286 0% 442%
Canada 2 14 3 333 5% 193%
Mauritius 4,859 9,030 8,355 15,728 0% 48%
U.S.A 806 1,824 4,192 2,379 21% 43%
Japan 1,718 2,084 2,614 4,709 10% 40%
South Korea 174 147 246 466 2% 39%
UAE 255 367 985 675 1% 38%
France 305 635 598 614 4% 26%
Italy 196 220 335 368 2% 23%
Switzerland 341 337 240 514 2% 15%
Netherlands 2,270 3,436 2,643 3,367 12% 14%
Singapore 5,985 6,742 13,692 8,711 2% 13%
Cyprus 557 598 508 604 0% 3%
Germany 1,038 1,125 986 1,069 2% 1%
United Kingdom
3,215 1,447 898 1,483 -1% -23%
>=35% 0-20% <=0%20-35%

This information is confidential and was prepared by Bain & Company solely for the use of our client; it is not to be relied on by any 3rd party without Bain's prior written consent 43
Note: Total FDI Equity Inflows in India grew at 21% CAGR FY14-17; Only investors >$100M flows in FY17 have been shown; Volatility is the 1-R2 value for India inflows of a country from FY13-17Source: Country-wise FDI Data, DIPP; World Investment Report , 2017; *Office for National Statistics, UK
Investors can be classified on the basis of size, share of wallet and growth trends
Flows to India $M
$M Global flows
SOW (%)CAGR
(FY13-FY17)Volatility
USA 13,476 299,003 5 43% 0.42
Japan 5,724 145,242 4 40% 0.39
UAE 1,011 15,711 15 38% 0.34
Canada 861 66,403 1 193% 0.26
China 983 183,100 1 31% 0.71
South Korea 292 27,274 1 39% 0.52
Russia 1,603 27,272 6 -11% 0.99
Switzerland 2,075 30,648 7 15% 0.74
France 1,969 57,328 3 26% 0.94
Germany 875 34,558 3 1% 0.67
Ireland 741 44,548 3 -57% 0.89
Singapore 5,034 23,888 N/A 13% 0.40
UK 3,501 12,600 28 0% 0.93
South Africa 373 3,382 11 -23% 0.94
Hong Kong 635 62,460 0 -2% 0.73
Spain 168 41,789 0 -13% 0.24
Legend:>$1B >$25B >2 >25% <0.5
>0.5B-$1B <$25B 1-2 0-25% 0.5-0.8
<0.5B <1 < 0% >0.8
Investors with strong relationship and growth
Large investors with recent strong traction
Large investors with strong existing relationship but poor or volatile growth
Small investors with poor or volatile growth
Large investors with no relationship

This information is confidential and was prepared by Bain & Company solely for the use of our client; it is not to be relied on by any 3rd party without Bain's prior written consent 44
Top investors covering 50% of FDI Equity Inflows spread across sectors
Note: The investors represented here are true investors ie. Parent companies of given investors & represents 304 investorsSource: Bain analysis

This information is confidential and was prepared by Bain & Company solely for the use of our client; it is not to be relied on by any 3rd party without Bain's prior written consent 45
Share of Delhi, TN and KTK RBI offices growing in the last 4 years
Note: CY data has been used due to unavailability of FY dataSource: SIA Monthly bulletin
IN THE LAST 4 YEARS, DEL, TN AND KTK GAINED SHARE OVER MH
HOWEVER, IN FY17 THE TREND REVERSED DUE TO MH’S EFFORTS, SLOWING E-COMMERCE
• Slowing investments in e-commerce impacted flows to Delhi, KTK, TN
• Maharashtra's textile park and coastal economic zone led to gains
CY13-16 vs. CY00-12

This information is confidential and was prepared by Bain & Company solely for the use of our client; it is not to be relied on by any 3rd party without Bain's prior written consent 46
Backup: Sector mapping
Bain sector tag (23 sectors)
DIPP sector maps (63 sectors*)
Services Services, Air transport, sea transport, Consultancy, Agri Services
Machinery & equipment Agricultural machinery, Boilers & Steam generating plants, Commercial & household equipment, Earth moving machinery, Industrial Instruments, Industrial Machinery, Machine Tools, Medical appliances, Railway components, Scientific Instruments
Natural resources Coal, Metallurgical industries, Mining, Petroleum & natural gas
Chemicals Chemicals, Dye stuffs, Fertilizers
Construction Construction activities, Construction development
Electricals & electronics Electrical equipment, Electronics, Prime movers
Energy Power, Non-conventional energy
F&B Food processing, fermentation industries, Sugar, Tea & coffee, Vegetable oils
Information Information & BroadcastingPrinting of books
Materials Cement & Gypsum, Ceramics, Glass
Wood & paper Paper & pulp, Timber
Textiles & leather Textiles, Leather
Trading Trading, Retail trading
Others Rubber, Glue & gelatin, Soaps & Cosmetics, Diamond & Gold, Misc mechanical & engineering
As-Is: Computer software & hardware, Auto, Telecom, Hospitals, Hotels & Tourism, Misc, Pharma, Defence, Education
N/A: Coir, Mathematical, surveying & drawing instruments, Photographic raw film & paper

This information is confidential and was prepared by Bain & Company solely for the use of our client; it is not to be relied on by any 3rd party without Bain's prior written consent 47
Appendix
• Details of top 10 recipients by sector
• Top 5 recipients and investors using tax advantage geographies by sector

This information is confidential and was prepared by Bain & Company solely for the use of our client; it is not to be relied on by any 3rd party without Bain's prior written consent 48
# RecipientTotal
Inflow($M)
YrInvestor
Use of Funds Details of use of fundsGiven True
1
Empower Research Knowledge Services Pvt Ltd
663FY16
• Headstrong Consulting (Singapore) Pte Ltd
• Genpact • Funding for hiring SMEs (up ~75%)
2IndusInd Bank Ltd
520FY17
• Various • IndusInd Group
• Added 200 branches in FY17
• Acquisition of The Royal Bank of Scotland NV Diamond & jewelry Financing Business & Loan Portfolio
3Kotak Mahindra Bank Ltd
397FY17
• Sumitomo Mitsui Banking Corporation
• Heliconia PTE Ltd
• ING Mauritius Investments
• Sumitomo Mitsui Banking Corporation
• Temasek Holdings
• ING Group
• Acquisition of BSS Microfinance Pvt Ltd, Institutional Investor Advisory Services India Ltd, Airtel Payments Bank Ltd, ING Vysya Bank Ltd, Multi-commodity Exchange of India Ltd
4Reliance Life Insurance Company Ltd
338FY16
• Nippon Life Insurance Company
• Nippon Life Insurance Company
• Flows through acquisition
5Serco BPO Pvt Ltd
325FY16
• Serco International SARL
• Serco Facilities Management BV
• Serco
• Reduction in debt from INR 20B to INR 6.5B FY15-16
Note: 20% share of recipients computed on total service equity FDI for FY15-17 of $18,113M; True Investors have been marked as parent companies of given investors; Only top investors have been shown for a recipient;Source: DIPP Remittance Data, 2000-2017; Bain Analysis
CapexDebt retirement
M&A OpexIndustry Financial Investors
Services: Top 10 recipients account for ~20% of FDI (1/2)

This information is confidential and was prepared by Bain & Company solely for the use of our client; it is not to be relied on by any 3rd party without Bain's prior written consent 49
# Recipient Total
Inflow($M)
YrInvestor
Use of Funds
Details of use of fundsGiven True
6Tata AIA Life Insurance Company
307FY17
• AIA International Limited
• AIA Group • N.A
7 Jet Airways 306FY16
• Etihad Airways• Etihad
Aviation Group
• Investment to finance increasing operating expenses
8SBI Life Insurance Company Ltd
264FY17
• Value Line Pte Ltd (Singapore)
• Macritchie Investments Pte Ltd (Singapore)
• Cisco Systems,
• Temasek Holdings
• Opened Regional offices in Delhi, Mumbai & Patna
9Cholamandalam MS General Insurance Co Ltd
261
FY16,FY17
• Mitsui Sumitomo Insurance Company Ltd
• AXA India Holdings
• Mitsui Sumitomo Insurance Group,
• AXA Asia SAS
• Acquisition of White Data Systems Pvt Ltd, i-Loads, a platform by White Data systems is a logistics provider
10HDFC Standard Life Insurance Company Ltd
257FY17
• Standard Life (Mauritius Holdings) 2006
• Standard Life Aberdeen Investment company
• Flows through Acquisition
Total (Top 10) $3,638M
Note: 20% share of recipients computed on total service equity FDI for FY15-17 of $18,113M; True Investors have been marked as parent companies of given investors; Only top investors have been shown for a recipient;Source: DIPP Remittance Data, 2000-2017; Bain Analysis
CapexDebt retirement
M&A OpexIndustry Financial Investors
Services: Top 10 recipients account for ~20% of FDI (1/2)
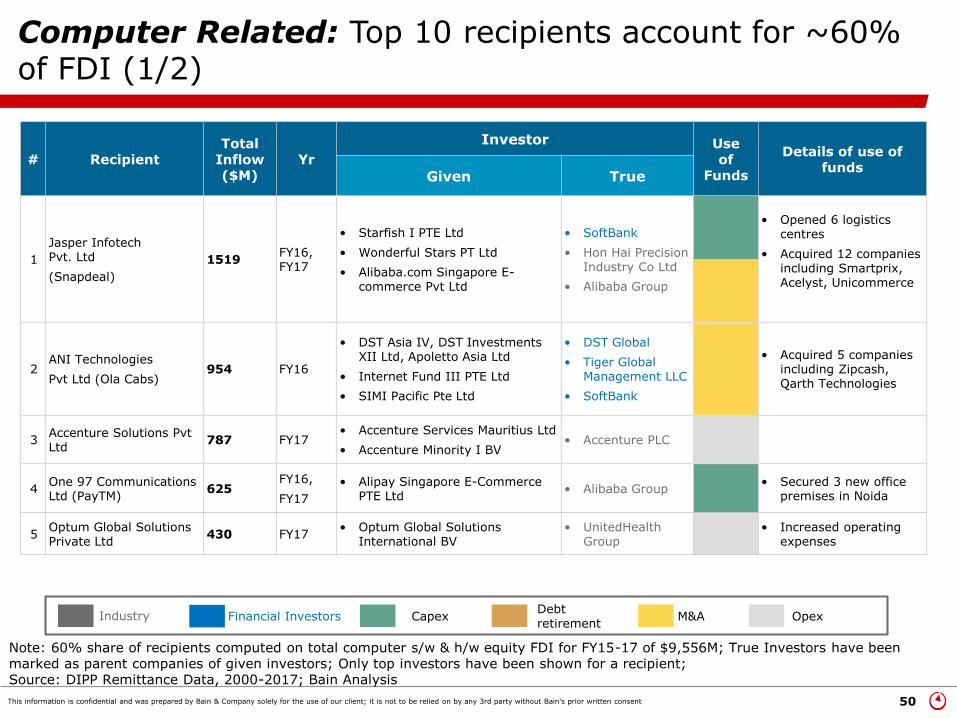
This information is confidential and was prepared by Bain & Company solely for the use of our client; it is not to be relied on by any 3rd party without Bain's prior written consent 50
# RecipientTotal
Inflow($M)
Yr
Investor Use of
Funds
Details of use of funds
Given True
1
Jasper InfotechPvt. Ltd
(Snapdeal)
1519FY16, FY17
• Starfish I PTE Ltd
• Wonderful Stars PT Ltd
• Alibaba.com Singapore E-commerce Pvt Ltd
• SoftBank
• Hon Hai Precision Industry Co Ltd
• Alibaba Group
• Opened 6 logistics centres
• Acquired 12 companies including Smartprix, Acelyst, Unicommerce
2ANI Technologies
Pvt Ltd (Ola Cabs)954 FY16
• DST Asia IV, DST Investments XII Ltd, Apoletto Asia Ltd
• Internet Fund III PTE Ltd
• SIMI Pacific Pte Ltd
• DST Global
• Tiger Global Management LLC
• SoftBank
• Acquired 5 companies including Zipcash, Qarth Technologies
3Accenture Solutions Pvt Ltd
787 FY17• Accenture Services Mauritius Ltd
• Accenture Minority I BV• Accenture PLC
4One 97 CommunicationsLtd (PayTM)
625FY16,
FY17
• Alipay Singapore E-Commerce PTE Ltd
• Alibaba Group• Secured 3 new office
premises in Noida
5Optum Global Solutions Private Ltd
430 FY17• Optum Global Solutions
International BV• UnitedHealth
Group• Increased operating
expenses
CapexDebt retirement
M&A OpexIndustry Financial Investors
Computer Related: Top 10 recipients account for ~60% of FDI (1/2)
Note: 60% share of recipients computed on total computer s/w & h/w equity FDI for FY15-17 of $9,556M; True Investors have been marked as parent companies of given investors; Only top investors have been shown for a recipient;Source: DIPP Remittance Data, 2000-2017; Bain Analysis

This information is confidential and was prepared by Bain & Company solely for the use of our client; it is not to be relied on by any 3rd party without Bain's prior written consent 51
# Recipient Total
Inflow($M)
Yr
Investor Use of
Funds
Details of use of fundsGiven True
6Flipkart InternetPvt Ltd
394 FY16 • Flipkart Marketplace Pvt Ltd • Flipkart• Acquired 5 companies
including PhonePe Internet Ltd, CE Info Systems Pvt Ltd
7 IBIBO Group Pvt ltd 311FY16, FY17
• MIH India Ecommerce Pvt Ltd
• MIF Internet SEA PTE Ltd
• Naspers Ltd• Acquired Saaranya
Hospitality Technologies Pvt Ltd
8TATA Communication Data Centre Pvt Ltd
269 FY17 • STT India DC PTE Ltd• Temasek
Holdings• Acquired Smart ICT Services
Pvt Ltd
9GETIT Infoservices Pvt Ltd
(AskMe)232
FY16,
FY17
• Astro Entertainments Networks Ltd
• Astro All Asia Networks PLC
• Acquired Acelity BestAtLowest Online Services Pvt Ltd
10AMAZON Data Services IndiaPvt Ltd
208 FY17• A 100 ROW, INC
• Amazon.com, INC• Amazon
Total (Top 10) $5,729M -
Note: 60% share of recipients computed on total computer s/w & h/w equity FDI for FY15-17 of $9,556M; True Investors have been marked as parent companies of given investors; Only top investors have been shown for a recipient;Source: DIPP Remittance Data, 2000-2017; Bain Analysis
CapexDebt retirement
M&A OpexIndustry Financial Investors
Computer Related: Top 10 recipients account for ~60% of FDI (1/2)

This information is confidential and was prepared by Bain & Company solely for the use of our client; it is not to be relied on by any 3rd party without Bain's prior written consent 52
Note: 62% share of recipients computed on total trading equity FDI for FY15-17 of $6,894M; True Investors have been marked as parent companies of given investors; Only top investors for each recipient shownSource: DIPP Remittance Data, 2000-2017; Bain Analysis
# Recipient
Total Inflo
w($M)
Yr
Investor Use of
Funds
Details of use of funds
Given True
1Insitel Services Pvt Ltd
1457FY16,FY17
• SSA Fund (Singapore) PTE Ltd
• Sistema • Opened 10 new MTS Mitra stores across Mumbai, India
2Amazon Seller Services Pvt Ltd
1442FY16, FY17
• Amazon Asia Pacific Resources Pvt Ltd
• Amazon Eurasia Holdings S. A. R. L
• Amazon
• New warehouses in Tumkur, Hoskote, and a fulfilment centre in BLR
• Acquisition of EMVANTAGE PaymentsPvt Ltd
3 IKEA India Pvt Ltd 387FY16, FY17
• Ingka HoldingOverseas B.V.
• Ingka Pro Holding B. V.
• Stichting Ingka Foundation
• Entering Indian market for first time
• Opening stores in Hyderabad, Mumbai, Delhi, Bengaluru
• First manufacturing shop in UP
4FCA India Automobiles Pvt Ltd
178FY16,FY17
• FCA Italy SPA• Fiat Chrysler
Automobiles• Loss Funding
5 Ricoh India Ltd 165 FY17
• NRG Group Limited • Ricoh • Increase in Inventory
• Expansion of Data centre in Kolkata, hence increase in remuneration costs
CapexDebt retirement
M&A OpexIndustry Financial Investors
Trading: Top 10 recipients account for ~62% of FDI (1/2)

This information is confidential and was prepared by Bain & Company solely for the use of our client; it is not to be relied on by any 3rd party without Bain's prior written consent 53
# Recipient Total
Inflow($M)
YrInvestor
Use of Funds
Details of use of fundsGiven True
6Myntra Designs Pvt Ltd
165FY16,FY1
7
• FK Myntra Holdings Pvt Ltd
• Flipkart Ltd• Flipkart
• Acquisition of 3 companies including Xerio Retail Pvt Ltd,Grid Ant technologies Pvt Ltd
7Adani Enterprises Ltd
154 FY16
• Gudami International PTE Ltd
• Deutsche Bank AG London
• Valiant Mauritius Partners Ltd
• PMC ProjectsIndia
• Deutsche Bank
• Valiant Capital Partners
• Reduction in debt from INR 719 B to INR 194B
8Decathlon Sports India Pvt Ltd
134FY16,FY17
• Decathlon SA • Decathlon• Opening new outlets-
plans of expanding to 50-60 outlets by 2019
9
Supermarket GrocerySupplies Pvt Ltd
104FY16,FY17
• Abraaj basket I Pvt Ltd
• Bessemer India Capital Holdings II Ltd
• Abraaj Group
• Bessemer Venture Partners
• Expansion of services in new cities, and new products & brands
• Acquired Delyver RetailNetwrok Pvt Ltd
10Arvind Fashions Ltd
101 FY17• Plenty Private Equity Fund
• Plenty CI Fund I LTd• Multiple Alternate
Asset• N.A.
Total (Top 10)
$4289M
Note: 62% share of recipients computed on total trading equity FDI for FY15-17 of $6,894M; True Investors have been marked as parent companies of given investors; Only top investors for each recipient shownSource: DIPP Remittance Data, 2000-2017; Bain Analysis
CapexDebt retirement
M&A OpexIndustry Financial Investors
Trading: Top 10 recipients account for ~62% of FDI (2/2)

This information is confidential and was prepared by Bain & Company solely for the use of our client; it is not to be relied on by any 3rd party without Bain's prior written consent 54
Note: 51% share of recipients computed on total Construction equity FDI for FY15-17 of $6,596M; True Investors have been marked as parent companies of given investors; Only top investors for each recipient shownSource: DIPP Remittance Data, 2000-2017; Bain Analysis
# RecipientTotal
Inflow($M)
Yr
InvestorUse of Funds
Details of use of funds
Given True
1Serene Senior Living (Covai Sr Care )
2252 FY16 • Signature India LLC• Sterling-
Signature Senior Care Pvt Ltd
• Upcomingprojects near Chennai
2 PRL Developers 227 FY16
• Foglight Investment Ltd
• Broad Street Investments (Singapore) Pte
• Warburg Princus Group
• Goldman Sachs
• NA
3 DLF Midtown Pvt Ltd 223 FY16, FY17 • Reco Moti Pte Ltd • GIC, Singapore • NA
4M/S Soma Tollways Pvt Ltd
123 FY17• AIRRO (Mauritius) Holdings
VI• JP Morgan • NA
5Fedex Express Transportation & Supply
106 FY17
• Federal Express Europe Inc • FedEx
• NA
CapexDebt retirement
M&A OpexIndustry Financial Investors
Construction: Top 10 recipients account for ~51% of FDI (1/2)

This information is confidential and was prepared by Bain & Company solely for the use of our client; it is not to be relied on by any 3rd party without Bain's prior written consent 55
# Recipient Total
Inflow($M)
Yr
InvestorUse of Funds
Details of use of funds
Given True
6Instakart Services Pvt Ltd
98 FY16• Klick2Shop Logistics
Services International• Flipkart • NA
7Experion Developers Pvt Ltd
79FY16,FY17
• Experion holdings Pte Ltd
• AT CapitalGroup
• NA
8SSN Logistics Pvt Ltd
78 FY16• Internet Fund III Pte Ltd
• Nexus Ventures III Ltd
• Tiger Global Management LLC
• Nexus Venture Partners
• Capital deployed to build infrastructure and designservices for e-commerce, hyper-local commerce, C2C commerce
9Unitech Developers & Projects Ltd
75 FY16
• BSREP india Office Holdings III Pte Ltd
• BSREP Moon C5 LP
• Brookfield Asset Management
• NA
10IOT Infrastructure& Energy Services Ltd
69FY16, FY17
• Oil Tanking India GMBH• Marquard &
bahls
• Liabilities reduced from INR 7.6 B to INR 5 B
Total (Top 10) $ 3331 M
Note: 51% share of recipients computed on total Construction equity FDI for FY15-17 of $6,596M; True Investors have been marked as parent companies of given investors; Only top investors for each recipient shownSource: DIPP Remittance Data, 2000-2017; Bain Analysis
Construction: Top 10 recipients account for ~51% of FDI (2/2)
CapexDebt retirement
M&A OpexIndustry Financial Investors

This information is confidential and was prepared by Bain & Company solely for the use of our client; it is not to be relied on by any 3rd party without Bain's prior written consent 56
Note: 60% share of recipients computed on total auto equity FDI for FY15-17 of $4,136M; True Investors have been marked as parent companies of given investors; Only top investors for each recipient shownSource: DIPP Remittance Data, 2000-2017; Bain Analysis
# RecipientTotal
Inflow($M)
Yr
InvestorUse of Funds
Details of use of funds
Given True
1Suzuki Motor Gujarat Pvt Ltd
844FY16, FY17
• Suzuki Motor Corporation
• Suzuki
• Establishing a manufacturing project in Ahmedabad
• Establishing new training centre in Mehsana, Gujarat
2General Motors India Pvt Ltd
490FY16,FY17
• SAIC General Motors Investments Ltd
• SAIC Motor,GM
• Debt reduced from INR 16 B to INR 2 B
3 Ford India Pvt Ltd 254FY16, FY17
• Ford Motor Company
• Ford InternationalServices LLC
• FordMotor Company
• Establishing a new global engineering & technology center in Chennai
• Vehicle Personalisation Center in Chennai
4Daimler India Commercial Vehicles Pvt Ltd
237 FY16 • Daimler AG• Daimler
AG• Open a new bus plant &
regional centre in Chennai
5Suzuki Motorcycle India Pvt Ltd
150 FY17• Suzuki Motor
Corporation• Suzuki
• Cash and Bank Balance went from INR 1 B to INR 11 B
CapexDebt retirement
M&A OpexIndustry Financial Investors
Auto: Top 10 recipients account for ~60% of FDI (1/2)

This information is confidential and was prepared by Bain & Company solely for the use of our client; it is not to be relied on by any 3rd party without Bain's prior written consent 57
# Recipient Total
Inflow($M)
Yr
InvestorUse of Funds
Details of use of fundsGiven True
6Isuzu Motors India Pvt Ltd
120 FY17• Isuzu Motors Asia Ltd
• Mitsubishi Corporation
• Isuzu Motors Ltd
• Mitsubishi Corporation
• Operating expenses increased
7Caparo Engineering India Pvt Ltd
115 FY16
• Caparo India Ltd
• Blue Elephant FinanceLtd
• Caparo
• Blue Elephant Capital Management
• New automotive componentsplant in southern India
• Debt reduced from INR 3.4 B to INR 2.3 B
8Komatsu India Pvt Ltd
98 FY17
• Komatsu Limited
• Komatsu Asia & Pacific PTE Ltd
• Komatsu Limited• Established a new hydraulic
excavator plant in Chennai
9Cosma International India Pvt Ltd
83FY16, FY17
• Magna Financing Luxembourg SARL
• Magna Cyprus Holding Ltd
• Magna International
• Opened a new manufacturing plant in Pune
10Rivigo ServicesPvt Ltd
74 FY17• Spring Canter
Investment Ltd• Warburg Princus
• Expansion of service offeringsacross India
Total (Top 10) $2467
Note: 60% share of recipients computed on total auto equity FDI for FY15-17 of $4,136M; True Investors have been marked as parent companies of given investors; Only top investors for each recipient shownSource: DIPP Remittance Data, 2000-2017; Bain Analysis
CapexDebt retirement
M&A OpexIndustry Financial Investors
Auto: Top 10 recipients account for ~60% of FDI (2/2)

This information is confidential and was prepared by Bain & Company solely for the use of our client; it is not to be relied on by any 3rd party without Bain's prior written consent 58
Note: 89% share of recipients computed on total telecom equity FDI for FY15-17 of $6,887M; True Investors have been marked as parent companies of given investors; Only top investors for each recipient shownSource: DIPP Remittance Data, 2000-2017; Bain Analysis
# RecipientTotal
Inflow($M)
Yr
InvestorUse of Funds
Details of use of funds
Given True
1Vodafone India Ltd
2501 FY17
• Euro Pacific Securities Ltd
• Prime Metals Ltd
• Mobilvest
• Euro Pacific Capital
• Vodafone Group
• Expansion into other states
• Opened 2 global design stores in Pune
• New data center being set up
2Tata Teleservices Ltd
1574 FY17 • NTT Docomo Inc• Nippon Telegraph
& Telephone Corporation
• Loss Funding
3Viom Networks Ltd
893FY16, FY17
• ATC Asia Pacific PTE Ltd • ATC Asia Pacific Pte Ltd
• Debt of INR 58 B before being acquired by ATC
4
Videocon International Electronics Ltd
460FY16, FY17
• Videocon Mauritiu Energy Ltd
• VideoconIndustries Ltd
• NA
5Bharti Infratel
273 FY16
• QIB Class(total 33 investors)
• Anchor Investors(total 6 investors)
• Individual Investors
• Cash & Bank balance went up from INR 1.6 B to INR 31 B
CapexDebt retirement
M&A OpexIndustry Financial Investors
Telecom: Top 10 recipients account for ~91% of FDI (1/2)

This information is confidential and was prepared by Bain & Company solely for the use of our client; it is not to be relied on by any 3rd party without Bain's prior written consent 59
# Recipient Total
Inflow($M)
YrInvestor
Use of Funds
Details of use of fundsGiven True
6 Tata Sky Ltd 182FY16, FY17
• Omega FII Investments Pte Ltd
• Network Digital Distribution Services
• Baytree Investments
• Tata Capital
• News Corporation
• Temasek Holdings
• Upgradation of Technology and Expansion
7 Hike Limited 124 FY17 • Hike Global ltd • Hike Ltd
• Funds raised for expansion
• Acquisition of Thought Mechanics Inc
8Unitech Wireless Tamil Nadu Pvt Ltd
104FY16, FY17
• Hike Global Pte Ltd
• Telenor Asia Pte Ltd• Hike Ltd
• Telenor• N. A.
Total (Top 8) $6111 M
Note: 89% share of recipients computed on total telecom equity FDI for FY15-17 of $6,887M; True Investors have been marked as parent companies of given investors; Only top investors for each recipient shownSource: DIPP Remittance Data, 2000-2017; Bain Analysis
CapexDebt retirement
M&A OpexIndustry Financial Investors
Telecom: Top 10 recipients account for ~91% of FDI (2/2)

This information is confidential and was prepared by Bain & Company solely for the use of our client; it is not to be relied on by any 3rd party without Bain's prior written consent 60
Note: 52% share of recipients computed on total energy equity FDI for FY15-17 of $3,540M; True Investors have been marked as parent companies of given investors; Only top investors for each recipient shownSource: DIPP Remittance Data, 2000-2017; Bain Analysis
# RecipientTotal
Inflow($M)
Yr
InvestorUse of Funds
Details of use of funds
Given True
1Meenakshi Energy Pvt Ltd
389FY16, FY17
• Engie Global Developments BV
• GDF Suez International Development
• Engie SA• Cash & Bank Balance increased
significantly
2Adani PowerLtd
298 FY16
• Worldwide Emerging Market Holding Ltd
• Afro Asia Trade & Investments Ltd
• WorldwideEmerging Market Holding Ltd
• Afro Asia Trade & Investments Ltd
• Acquisition of 4 companies including Power Undertaking, Korba West Power Company Ltd
3PipavavEnergy Pvt Ltd
190FY17 • Videocon Mauritius
Energy Ltd• Videocon
Industries• Reduction in liabilities from
INR 2 B to 60K
4Ostro Energy Pvt Ltd
178
FY16, FY17
• Ostro Renewable Power Ltd
• Ostro Renewal Power Ltd
• Ostro Renewable Power Ltd
• Setting up of 2 wind farms in Andhra Pradesh
• Acquisition of Prathamesh Solarfarms Pvt Ltd
5Azure Power India Pvt Ltd
175FY16, FY17
• Azure Power Global Ltd
• Societe De Promotion Et De participation
• Azure Power Global Ltd
• Agence Francais Development
• Construction of solar project in Punjab
CapexDebt retirement
M&A OpexIndustry Financial Investors
Energy: Top 10 recipients account for ~52% of FDI (1/2)

This information is confidential and was prepared by Bain & Company solely for the use of our client; it is not to be relied on by any 3rd party without Bain's prior written consent 61
# Recipient Total
Inflow($M)
YrInvestor
Use of Funds
Details of use of fundsGiven True
6 NCC Power Projects Ltd 170FY16, FY17
• Sembcorp Utilities PTE Ltd
• Sembcorp Industries Ltd
• Launch of a coal-fired power plant in Andhra Pradesh
7IL and FS Tamil Nadu Power Company Ltd
132 FY16• A S Coal Resources PTE
Ltd• Individual
• 600 MW coal-based unit in Tamil Nadu
8 Greenko Energies Pvt Ltd 109 FY17 • Greenko Mauritius• Greenko
Group• NA
9Thermal Powertech Corporation India Ltd
106 FY16• Sembcorp Utilities PTE
Ltd • Sembcorp Industries Ltd
• Launch of a coal-fired power plant in Nellore, Andhra Pradesh
10 Sembcorp Gayatri Power Ltd 97 FY17• Sembcorp Utilities PTE
Ltd • Sembcorp Industries Ltd
• Launch of a coal-fired power plant in Nellore, Andhra Pradesh
Total (Top 10) $1844 M
Note: 52% share of recipients computed on total energy equity FDI for FY15-17 of $3,540M; True Investors have been marked as parent companies of given investors; Only top investors for each recipient shownSource: DIPP Remittance Data, 2000-2017; Bain Analysis
CapexDebt retirement
M&A OpexIndustry Financial Investors
Energy: Top 10 recipients account for ~52% of FDI (2/2)

This information is confidential and was prepared by Bain & Company solely for the use of our client; it is not to be relied on by any 3rd party without Bain's prior written consent 62
# Recipient
Total Inflo
w($M)
Yr
InvestorType
Use of
Funds
Details of use of fundsGiven True
1 Essar Power Ltd 956FY17, FY16
• Essar Power Holdings Ltd
• Essar Power Hazira Holdings Ltd
• Essar Group I• Capacity expansion at
Hazira & other plants in India
2Toshiba JSW Power System P.L.
305FY16, FY17
• Toshiba Corporation
• Toshiba corporation
I• Expansion of manufacturing
facility in Chennai
3Crompton Greaves Consumer Electricals Ltd
300 FY17
• Amalfiaco Ltd
• Macritchie Investments PTE Ltd
• Advent International Corp
• Temasek Holdings
R• Cash and Bank Balance
increased
4GE India Industrial Pvt Ltd
293 FY17• GE India Pacific Pvt
Ltd• GE
I• Multi-modal factory in Pune
• 2 R&D centres being set up
5Luminous Power Technologies Pvt Ltd
145 FY17• Schneider Electric
South East Asia (HQ)• Schneider Electric
SEI
• Reduction in liabilities from INR 600M to INR 300M
6Novateur Electrical & Digital Systems Pvt Ltd
126 FY16• Legrand Nederland
BV
• Legrand
I• Reduction in liabilities fro
INR 13B to INR 8 B
Total (Top 6)$2125 M
Note: 62% share of recipients computed on total electrical & electronic equity FDI for FY15-17 of $3,414M; True Investors have been marked as parent companies of given investors; Only top investors for each recipient shownSource: DIPP Remittance Data, 2000-2017; Bain Analysis
CapexDebt retirement
M&A OpexIndustry Financial Investors
Electronics: Top 6 recipients account for ~62% of FDI

This information is confidential and was prepared by Bain & Company solely for the use of our client; it is not to be relied on by any 3rd party without Bain's prior written consent 63
Note: 65% share of recipients computed on total Chemicals equity FDI for FY15-17 of $2,900M; True Investors have been marked as parent companies of given investors; Only top investors for each recipient shownSource: DIPP Remittance Data, 2000-2017; Bain Analysis
# RecipientTotal
Inflow($M)
Yr
InvestorUse of Funds
Details of use of funds
Given True
1Shell India Markets Pvt Ltd
834FY16, FY17
• Shell Gas BV
• Shell India Ventures PTE Ltd
• Royal Dutch Shell• Scaling up number of retail
stations
2 UPL td 492 FY17 • As per list• Individual
Investors
• Expansion of production capacity of Nitrogen plant in Jhagadia
• Acquisition of Serra Bonita Sements SA, Advanta Ltd
3Kansai NerolacPaints Ltd
157 FY17 • Kansai Paint Co Ltd• Kansai Paint Co
Ltd• Reduction in liabilities from
INR 571 M to NR 294 M
4Sintex Industries Ltd
115 FY16• As per Annexure
• ICICI Bank UK PLC
• IndividualInvestors
• ICICI Bank
• Expansion of yarn plant in Gujarat
5Lanxess India Pvt Ltd
87FY16, FY17
• Lanxess Deutschland GMBH
• Lanxess Deutsche GMBH
• Lanxess AG
• Reduction of liabilities from INR 7 B to INR 2 B
CapexDebt retirement
M&A OpexIndustry Financial Investors
Chemicals: Top 9 recipients account for ~65% of FDI (1/2)

This information is confidential and was prepared by Bain & Company solely for the use of our client; it is not to be relied on by any 3rd party without Bain's prior written consent 64
# Recipient Total
Inflow($M)
YrInvestor
Use of Funds
Details of use of fundsGiven True
6 Hyderabad Chemical Ltd 57 FY16• Nihon Nohyaku Co Ltd
• Nichino Service Co Ltd
• Nihon Nohyaku Co Ltd
• NA
7 Chiripal Poly Films Ltd 53FY16, FY17
• Amber Finance Ltd
• Waldorf Investments Ltd
• Amber Financial Investments Ltd
• Waldorf Investments Ltd
• Expansion at textile park in Bidaj, Gujarat
8 Excel Crop Care Ltd 50 FY17• Sumitomo Chemical Co
Ltd, Japan
• Sumitomo Mitsui Trust Group
• Setting up of pesticide plant in Gujarat
• Liabilities reduced from INR 86 M to INR 29M
9 Renewsys India Ltd 49FY16, FY17
• Far East Holdings Ltd
• Far East Holdings International Ltd
• Acquisition of Solar Semiconductor Pvt Ltd
Total (Top 9) $1894 M
Note: 65% share of recipients computed on total Chemicals equity FDI for FY15-17 of $2,900M; True Investors have been marked as parent companies of given investors; Only top investors for each recipient shownSource: DIPP Remittance Data, 2000-2017; Bain Analysis
CapexDebt retirement
M&A OpexIndustry Financial Investors
Chemicals: Top 9 recipients account for ~65% of FDI (2/2)

This information is confidential and was prepared by Bain & Company solely for the use of our client; it is not to be relied on by any 3rd party without Bain's prior written consent 65
# Recipient Total
Inflow($M)
Yr
InvestorUse of Funds
Details of use of fundsGiven True
1 JSW Steel Ltd 719 FY17• JFE Steel
Corporation, Japan• JFE Steel Corporation
• Acquisition of JSW Industrial Gases Pvt Ltd, Welspun Maxsteel Ltd
2Essel Mining & Industries Ltd
483 FY16• Surya Abha
Investment Pte Ltd• Surya Abha
Investments Pte Ltd• NA
3POSCO Maharashtra Steels Pvt Ltd
318FY16, FY17
• POSCO • POSCO• Setting up new steel
plant in Maharashtra
4Mahindra CIE Automotive Ltd
122FY16, FY17
• Participaciones Internacionales Autometa
• Ainos Holdings Ltd
• CIE Automotive
• Kedaara Capital Investment Managers Ltd
• Acquisition of Bill Forge Pvt Ltd
5Castex Technologies Ltd
108FY16, FY17
• Standard Chartered Bank
• Deutsche Bank
• Swiss Finance Corp Mauritius Ltd
• Standard Chartered
• Deutsche Bank AG
• UBS AG
• Losses at INR 613.52cr in FY16
6Haldia Petrochemicals Ltd
99 FY17• Essex Development
Investments (Mauritius) • The Chatterjee Group
• Cash and Bank Balance increased
Total (Top 6) $1849 M
Note: 67% share of recipients computed on total Natural Resources equity FDI for FY15-17 of $2,754M; True Investors have been marked as parent companies of given investors; Only top investors of each recipient shownSource: DIPP Remittance Data, 2000-2017; Bain Analysis
CapexDebt retirement
M&A OpexIndustry Financial Investors
Natural resources: Top 6 recipients account for ~67% of FDI

This information is confidential and was prepared by Bain & Company solely for the use of our client; it is not to be relied on by any 3rd party without Bain's prior written consent 66
# Recipient Total
Inflow($M)
Yr
InvestorUse of Funds
Details of use of funds
Given True
1 Ambuja Cements Ltd. 1661 FY17 • Holderind Investments Ltd • Holcim Ltd
• Expansion of grinding unit in Bengal
• Liabilities reduced from INR 316 M to INR 236M
2Triguna Hospitality Ventures (India) Pvt
1654FY16, FY17
• APHV India Investco Pvt Ltd
• AAP Singapore Pte Ltd
• GIC
• Accor, SA
• Capital infusion for expansion
3 Star India Pvt Ltd 1158FY16,FY17
• Buzzer Investments Ltd
• Star Entertainment Holdings Ltd
• News Corporation
• Star EntertainmentGroup
• Losses at INR 1273B
• Acquisition of 4 companies including Star Den Media Services Ltd, Mashal Sport
4Procter & Gamble Home Products Ltd
515FY16, FY17
• Procter & Gamble Overseas India BV
• Procter & Gamble
• Manufacturing Project in Telangana
5 Mylan Laboratories Ltd 373 FY17 • Mylan Group BV, Netherlands • Mylan • Acquisition of Jai Pharma
6Hindustan Coco-Cola Holdings Pvt Ltd
344 FY17• Hindustan Coca Cola Holdings
Pvt Ltd• The Coca Cola
Comoany• Liabilities reduced from INR
1468M to INR 934M
Note: 53% share of recipients computed on total FDI equity received by other sectors for FY15-17 of $19,813M; True Investors have been marked as parent companies of given investors; Only top investors of each recipient shownSource: DIPP Remittance Data, 2000-2017; Bain Analysis
CapexDebt retirement
M&A OpexIndustry Financial Investors
Others: Top 34 recipients account for ~53% of FDI

This information is confidential and was prepared by Bain & Company solely for the use of our client; it is not to be relied on by any 3rd party without Bain's prior written consent 67
# Recipient Total
Inflow($M)
Yr
InvestorUse of Funds
Details of use of funds
Given True
7Emerson Process Management (India) Pvt.
333 FY17
• Rutherfurd Acquisitions Ltd
• EmersonElectric
• Acquisition of Ameya Transmission Gears Ltd
8Holderind Investments Ltd (Mauritius)
319 FY17 • Ambuja Cement • Holcim Ltd • NA
9 Abbott Healthcare Pvt Ltd 303 FY16• Abbott Asia holdings
Ltd• Abbott
Laboratories• Loss Funding
10 Aster Dm Healthcare Pvt Ltd 257 FY17 • Rimco(Mauritius)• Rimco
Investments LLC
• Establishing 2 hospitals in Kerala
• Acquisition of 2 hospitals
11Leighton Contractors (India) Pvt Ltd
243FY16, FY17
• Leighton International Ltd
• Leighton Asia • Loss funding
12Utv Software Communication Limited
228 FY17• The Walt Disney
Company(SEA)
• The Walt Disney Company
• NA
CapexDebt retirement
M&A OpexIndustry Financial Investors
Note: 53% share of recipients computed on total FDI equity received by other sectors for FY15-17 of $19,813M; True Investors have been marked as parent companies of given investors; Only top investors of each recipient shownSource: DIPP Remittance Data, 2000-2017; Bain Analysis
Others: Top 34 recipients account for ~53% of FDI

This information is confidential and was prepared by Bain & Company solely for the use of our client; it is not to be relied on by any 3rd party without Bain's prior written consent 68
# Recipient Total
Inflow($M)
Yr
InvestorUse of Funds
Details of use of fundsGiven True
13Michelin India Tamilnadu Tyres Pvt Ltd
193FY16,FY17
• Compagnie Financiere Du Groupe Michelin
• Michelin
• Set up a factory & R&D centre in Chennai
• Liabilities reduced from INR 8B to INR 5B
14 Vijay Television Pvt Ltd 181 FY17 • SVJ Holding Ltd• News
Corporation
• Cash and Bank BalanceIncreased
15Oravel Stays Private Limited (OYO Rooms)
181FY16,FY17
• Softbank Group Capital Ltd
• Sequoia Capital Ltd
• SoftbankGroup
• Sequoia Capital
• Loss funding
16 Jubilant Generics Limited 174FY16,FY17
• Jubilant Pharma Ltd• Jubilant Life
Sciences Ltd• NA
17Manipal Health Enterprises Pvt. Ltd.
171FY16,FY17
• TPG Asia VI SF Pte Ltd • TPG Capital
• Expansion of hospital in major Indian cities
18 Prism Tv Private Limited 154 FY16• Nickelodeon Asia
Holdings Pte Ltd• Viacom • Loss funding
CapexDebt retirement
M&A OpexIndustry Financial Investors
Note: 53% share of recipients computed on total FDI equity received by other sectors for FY15-17 of $19,813M; True Investors have been marked as parent companies of given investors; Only top investors of each recipient shownSource: DIPP Remittance Data, 2000-2017; Bain Analysis
Others: Top 34 recipients account for ~53% of FDI

This information is confidential and was prepared by Bain & Company solely for the use of our client; it is not to be relied on by any 3rd party without Bain's prior written consent 69
# Recipient Total
Inflow($M)
Yr
InvestorUse of Funds
Details of use of fundsGiven True
19 Quikr India Pvt Ltd 148FY16,FY17
• Quickr India (Mauritius) Holdings Ltd
• Quickr India
• Capital infusion for expansion
• Acquisition of 8 companies including Cryptopy TechnologiesPvt Ltd, maxHeap Technologies Pvt Ltd
20 Mars International India P. Ltd. 144FY16,FY17
• Mars Overseas Holdings Incorporated
• Mars Incorporated
• Setting up amanufacturingplant in Pune
21Sterling Sez And Infrastructure Ltd
143FY16,FY17
• Niche Investment Holdings Pvt Ltd
• NCY Equity Growth Investment
• Niche Investments Pvt Ltd
• NCY High Yield trust PLC
• Liabilities reduced fromINR 7600M to INR 445M
22 Jet Privilege Pvt Ltd 136 FY16 • Etihad Airways• Etihad Aviation
Group
• Cash and Bank Balance increased
23 Ferrero India Pvt. Ltd. 135FY16, FY17
• Ferrero SPA • Ferrero SPA • Loss funding
CapexDebt retirement
M&A OpexIndustry Financial Investors
Note: 53% share of recipients computed on total FDI equity received by other sectors for FY15-17 of $19,813M; True Investors have been marked as parent companies of given investors; Only top investors of each recipient shownSource: DIPP Remittance Data, 2000-2017; Bain Analysis
Others: Top 34 recipients account for ~53% of FDI

This information is confidential and was prepared by Bain & Company solely for the use of our client; it is not to be relied on by any 3rd party without Bain's prior written consent 70
#Recipient
Total Inflow($M)
Yr
Investor Use of Funds
Details of use of funds
Given True
24United Breweries Ltd
135 FY16• Heineken
International BV• Heineken
Holding
• Capacity expansion of plant in Goa
• Acquisition of Pacific Spirits Pvt Ltd, Mangalore Chemicals & Fertilisers Ltd
• Liabilities reduced from INR 5B to INR 2B
25Coffee Day Enterprises Limited
132 FY16
• NLS Mauritius LLC
• KKR Mauritius PE Investments II Ltd
• New Silk route Capital
• KKR Group
• Liabilities reduced from INR 15B to INR 6B
• Acquisition of Coffee Day Overseas Pvt Ltd
26Reid & Taylor India Ltd
117 FY17 • Indivest Pte Ltd • GIC • Liabilities reduced from INR 1351M to INR 76M
27Metropolis Healthcare Limited
117 FY16• CA Lotus
Investments• Lotus Capital
• Liabilities reduced from INR 161 M to INR 36M
• Acquisition of Sanjeevani Path Lab
28International Hospital Limited
116 FY16• Fortis Global
HealthcareInfrastructure
• Religare • Loss Funding
29Make My Trip India Pvt Ltd
114FY16, FY17
• Make My trip Ltd • MakeMyTrip• Capital infusion for technology license fees
• Acquisition of Ibibo Group, MyGola Inc
CapexDebt retirement
M&A OpexIndustry Financial Investors
Note: 53% share of recipients computed on total FDI equity received by other sectors for FY15-17 of $19,813M; True Investors have been marked as parent companies of given investors; Only top investors of each recipient shownSource: DIPP Remittance Data, 2000-2017; Bain Analysis
Others: Top 34 recipients account for ~53% of FDI

This information is confidential and was prepared by Bain & Company solely for the use of our client; it is not to be relied on by any 3rd party without Bain's prior written consent 71
# Recipient Total Inflow($M)
Yr
InvestorUse of Funds
Details of use of funds
Given True
30 Suzlon Energy Ltd 113FY16,FY17
• Various
• Clearwater Capital Partners
• Individual
• Clearwater Capital Partners, LLC
• Liabilities reduced from INR 116B to INR 92B
31Lafarge Aggregates& Concretes India P Lt
110 FY17 • Financiere Lafarge • LafargeHolcim• Liabilities down
from INR 879M to 0 M
32 Pmt Machines Ltd 108FY16,FY17
• Niche Investments Holdings Pte Ltd
• NCY Equity Growth Investments
• Niche Investments Pvt Ltd
• NCY High Yield Trust PLC
• Liabilities reduced from INR 302M to 237M
33Sapphire Foods India Pvt Ltd
104 FY16
• Goldman Sachs InvestmentHoldings
• Sapphire Foods Mauritius Ltd
• Goldman Sachs
• Sapphire Foods India Pvt Ltd
• Loss Funding
34 Samhi Hotels Pvt Ltd 103 FY16
• Goldman Sachs Investment Holdings
• International Finance Corporation
• Goldman Sachs
• World Bank Group
• Acquisition of 3hotel chains
Total (Top 34) $10,511 M
CapexDebt retirement
M&A OpexIndustry Financial Investors
Note: 53% share of recipients computed on total FDI equity received by other sectors for FY15-17 of $19,813M; True Investors have been marked as parent companies of given investors; Only top investors of each recipient shownSource: DIPP Remittance Data, 2000-2017; Bain Analysis
Others: Top 34 recipients account for ~53% of FDI

This information is confidential and was prepared by Bain & Company solely for the use of our client; it is not to be relied on by any 3rd party without Bain's prior written consent 72
Appendix
• Details of top 10 recipients by sector
• Top 5 recipients and investors using tax advantage geographies by sector

This information is confidential and was prepared by Bain & Company solely for the use of our client; it is not to be relied on by any 3rd party without Bain's prior written consent 73
Across most sectors the largest investors, both financial and industry, use tax advantage geos 1/3
Sector
Recipient
Tax Advantage geos Non-Tax Adv. Geos
Servic
es
($18,1
13M
)
Triguna Hospitality Ventures (India) Pvt. Ltd
IndusInd Bank Ltd.
Empower Research Knowledge Services Pvt
Reliance Life Insurance Co. Ltd.
Hindustan Coco-Cola Holdings Pvt Ltd Birla Sunlife Insurance Company
Serco BPO Private Limited Kotak Mahindra Bank Ltd
Tata AIA Life Insurance Company HDFC Ergo General Insurance Co. Ltd.
$3,305M (18%) $1,367M (8%)
Co
mp
ute
r H
/W
&
S/
W($
9,5
56M
) Jasper Infotech Pvt. Ltd Amazon Data Services India Private Ltd.
ANI Technologies Pvt. Ltd Clues Network Private Limited
Accenture Solutions Private Limited Jade E Services Pvt Ltd
One 97 Communications Limited Veritas Software Technologies India Pt. Lt
Optum Global Solutions (India) Private Ltd.
ANI Technologies Pvt Ltd
$4,338M (45%) $515M (5%)
Trad
ing
($
6894M
)
Insitel Services Pvt Ltd FCA India Automobiles Pvt Ltd (Fiat Grp)
Amazon Seller Services Pvt. Ltd. Ricoh India Limited
Ikea India Private Limited Decathlon Sports India Pvt. Ltd
Myntra Designs Private Limited Reebok India Company
Supermarket Grocery Supplies Pvt. Lt.
Koovs Marketing Consulting Private Ltd.
$3,555 (52%) $616M (9%)
Note: Represents flows coming through tax haven Vs non-tax havens; Bain sector classification used; Tax havens classified based on report titled “Closing the Flood Gates”, Norwegian Ministry of Foreign Affairs (mid, premier category only); Source: DIPP Sector-wise remittance data FY’15-17
Financial/ Return InvestorsIndustry Investors n.a
Source of FDI
Investors
Tax Advantage geos Non-Tax Adv. Geos
APHV India Investco. Pvt Ltd Nippon Life Insurance Company
AAPC Singapore Pte Ltd Sun Life Financial (India) Insurance Inv
Headstrong Consulting (Singapore) Pte Lt
Ergo International Ag
Serco International S.A.R.L CDC Group Plc
AIA International Limited Sumito Mitsui Banking Corporation
$2,943M (16%) $1,343M (7%)
Accenture Services Mauritius Ltd A 100 Row, Inc
Starfish I Pte Ltd. Clues Network Inc
Optum Global Solutions International Bv
Veritas Operating Corporation
Alipay Singapore E-Commerce Pte Ltd Jabong GMBH
Flipkart Marketplace Private Limited Vanguard World Fund
$2,587M (27%) $453M (5%)
Amazon Asia Pacific Resources Private Lt.
NRG Group Limited
SSA Fund (Singapore) Pte. Ltd. Decathlon Sa
Ingka Holding Overseas B.V. FCA Italy S,P.A.
Amazon Eurasia Holdings S.A.R.L Sharp Corporation
Fk Myntra Holdings Private Limited Koovs Plc
$3,319M (48%) $582M (8%)

This information is confidential and was prepared by Bain & Company solely for the use of our client; it is not to be relied on by any 3rd party without Bain's prior written consent 74
Across most sectors the largest investors, both financial and industry, use tax advantage geos 2/3
Sector
Recipient
Tax Advantage geos Non-Tax Adv. Geos
Tele
com
($
6,8
87M
)
Vodafone India Ltd Tata Teleservices Ltd
Viom Networks Limited Netmagic Solutions Pvt Ltd
Videocon International Electronics Ltd. Tikona Digital Networks Pvt Ltd
Bharti Infratel Ltd Digital Payments Processing Ltd
Tata Sky Ltd Augere Wireless Broadband India Pvt Ltd
$4,310M (63%) $1,700M (25%)
Co
nstr
ucti
on
($
6,5
96M
)
PRL Developers Pvt Ltd Serene Senior Living (Covai Sr Care)
DLF Midtown Private Limited Fedex Express Transportation &Supply
M/S Soma Tollways Pvt Ltd. IOT Infrastructure & Energy Services Ltd
Instakart Services Private Ltd Areva Solar India Pvt Ltd
Experion Developers Private Ltd SolaireDirect Energy India Pvt Ltd
$750M (11%) $2,514M (38%)
Au
tom
ob
ile
($4,1
36M
)
Cosma International India Pvt Ltd Suzuki Motor Gujarat Private Limited
Isuzu Motors India Pvt Ltd General Motors India Pvt Ltd
Rivigo Services Pvt. Ltd Ford India Private Limited
General Motors India Pvt Ltd Daimler India Commercial Vehicles Pvt Ltd.
Lear Automotive India Pvt Ltd Suzuki Motorcycle India Pvt. Ltd.
$356M (9%) $1,911M (46%)
Financial/ Return InvestorsIndustry Investors n.a
Note: Represents flows coming through tax haven Vs non-tax havens; Bain sector classification used; Tax havens classified based on report titled “Closing the Flood Gates”, Norwegian Ministry of Foreign Affairs (mid, premier category only); Source: DIPP Sector-wise remittance data FY’15-17
Source of FDI
Investors
Tax Advantage geos Non-Tax Adv. Geos
ATC Asia Pacific Pte Ltd NTT Docomo Inc
Euro Pacific Securities Ltd NTT Communications Corporation
Videocon Mauritius Energy Ltd NTT Docomo
Prime Metals Ltd International Finance Corporation
Mobilvest Calpian Inc
$2,814M (41%) $1,695M (25%)
RECO MOTI Pte Ltd Signature India Llc
Foglight Investment Ltd Oil Tanking India GmBH
Airro (Mauritius) Holdings Vi Federal Express Europe Inc.
Resimmo Pcc - Mauritius Areva Solar Inc
Klick2Shop Logistics Services International
Owais Usmani
$694M (11%) $2,507M (38%)
Isuzu Motors Asia Limited Suzuki Motor Corporation
Spring Canter Investment Ltd SAIC General Motors Investment Ltd.
SAIC General Motors Investment Ltd Daimler AG
Komatsu Asia & Pacific Pte. Ltd Ford Motor Company
Lear Corporation Mauritius Ltd Showa Corporation
$320M (8%) $1,934 (47%)

This information is confidential and was prepared by Bain & Company solely for the use of our client; it is not to be relied on by any 3rd party without Bain's prior written consent 75
Across most sectors the largest investors, both financial and industry, use tax advantage geos 3/3
Sector
Recipient
Tax Advantage geos Non-Tax Adv. Geos
En
erg
y
($3,5
40M
)
M/S Meenakshi Energy Pvt Ltd Adani Power Limited
Adani Power Limited Tadas Wind Energy Private Limited
Pipavav Energy Pvt Ltd Areva Solar India Pvt Ltd
Ostro Energy Pvt Ltd Renew Power Ventures Private Ltd.
NCC Power Projects Limited SBG Cleantech Projectco Private Limited
$1,040M (30%) $280M (8%)
Ele
ctr
ical&
Ele
ctr
on
ic
($3,4
14M
)
Essar Power Ltd Toshiba JSW Power System P.L.
Crompton Greaves Consumer Electricals Li
Robert Bosch Starter Motors Generators
GE India Industrial Private Limited TMEIC Industrial Systems India
Luminous Power Technologies Pvt. Ltd.
TBEA Energy (India) Pvt Ltd
Novateur Electrical & Digital Systems
Hi-Lex India Private Limited
$1,820M (53%) $504M (15%)
Ch
em
icals
($
2,9
00M
)
Shell India Markets Private Ltd Kansai Nerolac Paints Ltd
UPL Limited Lanxess India Pvt Ltd
Sintex Industries Ltd Hyderabad Chemical Ltd
Chiripal Poly Films Ltd Excel Crop Care Limited
Renewsys India Pvt Ltd Toyotsu Rare Earths India Pvt Ltd
$1,535M (53%) $420M (14%)
Financial/ Return InvestorsIndustry Investors n.a
Note: Represents flows coming through tax haven Vs non-tax havens; Bain sector classification used; Tax havens classified based on report titled “Closing the Flood Gates”, Norwegian Ministry of Foreign Affairs (mid, premier category only); Source: DIPP Sector-wise remittance data FY’15-17
Source of FDI
Investors
Tax Advantage geos Non-Tax Adv. Geos
Engie Global Developments B.V. Orix Corporation
Sembcorp Utilities Pte Ltd Areva Solar Inc
Videocon Mauritius Energy Ltd. Asian Development Bank
A S Coal Resources Pte Limited DEG-Deutsche-Investitions-Und-Entwicklun
Greenko Mauritius The Northern Trust Company
$1023M (30%) $305M (9%)
Essar Power Holdings Ltd Toshiba Corporation
GE Pacific Private Limited Robert Bosch Starter Motors Generators
Essar Power Hazira Holdings Ltd Toshiba Mitsubishi Electric Industrial
Amalfiaco Limited TBEA Shenyang Transformer Group Ltd.
Schneider Electric South East Asia (HQ)
Man Diesel & Turbo
$1,391M (41%) $500M (15%)
Shell Gas B V Kansai Paint Co Ltd
Shell Overseas Investments B.V Lanxess Deutschland Gmbh
Shell India Ventures Pte Ltd Nihon Nohyaku Co Ltd
Mandala Rose Co-Investment Ltd Sumitomo Chemical Company Ltd.
IPG Mauritius Ltd Indorama Ventures Global Services Ltd
$912M (31%) $406M (14%)


![120124 - Corporate intro boilerplate (3).pptx [Read-Only] information is confidential and was prepared by Bain & Company solely for the use of our client; it is not to be relied We’ve](https://img.pdfslide.us/doc/110x75/5addc7a57f8b9ae1408d6d32/120124-corporate-intro-boilerplate-3pptx-read-only-information-is-confidential.jpg)