Embed Size (px)
Citation preview

THIS REPORT CONTAINS ASSESSMENTS OF COMMODITY AND TRADE ISSUES MADE BY
USDA STAFF AND NOT NECESSARILY STATEMENTS OF OFFICIAL U.S. GOVERNMENT
POLICY
Date:
GAIN Report Number:
Approved By:
Prepared By:
Report Highlights:
Indian MY 2014/15 wheat production should hit 96 MMT from 31.5 MHA (both records) if favorable
weather and moisture conditions continue. MY 2014/15 rice production is forecast at 104 MMT from
44 MHA but depends on the 2014 monsoon. Pulse production is forecast down to 18 MMT on
production shifts to wheat. MY 2013/14 guar output was down on lower area planted due to weaker
prices. MY 2014/15 exports of wheat, rice and corn are forecast down from the year prior due to
softening global prices.
Santosh K. Singh
Allan Mustard
2014
Grain and Feed Annual
India
IN4005
2/14/2014
Required Report - public distribution
Commodities:
Production:
Riding on a wave of back-to-back bumper crops since 2005, India is heading for another record wheat
harvest this summer on record planting and favorable growing conditions in major wheat growing
areas. Assuming normal weather conditions through harvest (April), Post forecasts marketing year
(MY) 2014/15 wheat production at 96 MMT compared to last year’s 92.5 MMT and the previous record
of 94.9 MMT in MY 2012/13.
Timely harvest of the preceding kharif (winter harvested) crops coupled with good late season
(September-October) monsoon rainfall provided favorable soil moisture conditions for wheat planting in
most growing areas. The timely announcement of the minimum support price (MSP) of wheat by the
Government of India (GOI), relatively strong market prices in MY 2013/14 and the expectations of
additional bonuses from the state governments (over and above the GOI’s MSP) due to the upcoming
Parliamentary elections in April 2014 encouraged farmers to plant additional area to wheat. The
Ministry of Agriculture’s latest provisional wheat area planted estimate for MY 2014/15 is 31.5 million
hectares, an unprecedented increase of more than six percent over last year’s record area.
Adequate soil moisture and relatively low temperatures during November/December provided optimal
conditions for emergence and tillering. Scattered rains during December/January have been beneficial
for the standing wheat crop, currently in the flowering and early seed setting stages. There have been no
incidents of pest or disease outbreaks in the major growing areas. These conditions have fueled the
expectation of a bumper 2014 wheat harvest as trade sources are currently estimating the crop in the
range of 94 to 98 MMT. While the official advance estimates for the upcoming wheat crop have not
been released, media reports have quoted senior government sources as expecting the crop to touch 100
MMT.
Weather from February through harvest (April) will be critical as a rise in temperature during critical
grain filling in February/March and/or rains and hailstorms at the time of harvest in March/April could
affect productivity prospects. An extended winter and low temperatures through the first week of April,
as experienced in the record production year of 2012, could bolster yield prospects. Assuming normal
weather conditions from now on, Post forecasts the MY 2013/14 wheat yield lower at 3.0 tons/hectare
compared to the MY 2012/13 record yield of 3.2 tons/hectare.
Indian wheat is largely a soft/medium hard, medium protein, white bread wheat, somewhat similar to
U.S. hard white wheat. Wheat grown in central and western India is typically harder, with higher
protein and gluten, compared to wheat grown in northern India. India also produces around one million
tons of durum wheat, mostly in the states of Madhya Pradesh and Rajasthan. Farmers are increasingly
shifting from durum wheat to higher yielding non-durum varieties as the durum yield is significantly
lower than that of regular wheat varieties and the government’s continued increase of MSP has reduced
the price premium. Most durum wheat is typically purchased by the private trade at a price premium for
processing into higher value/branded bakery and confectionary products.
Wheat
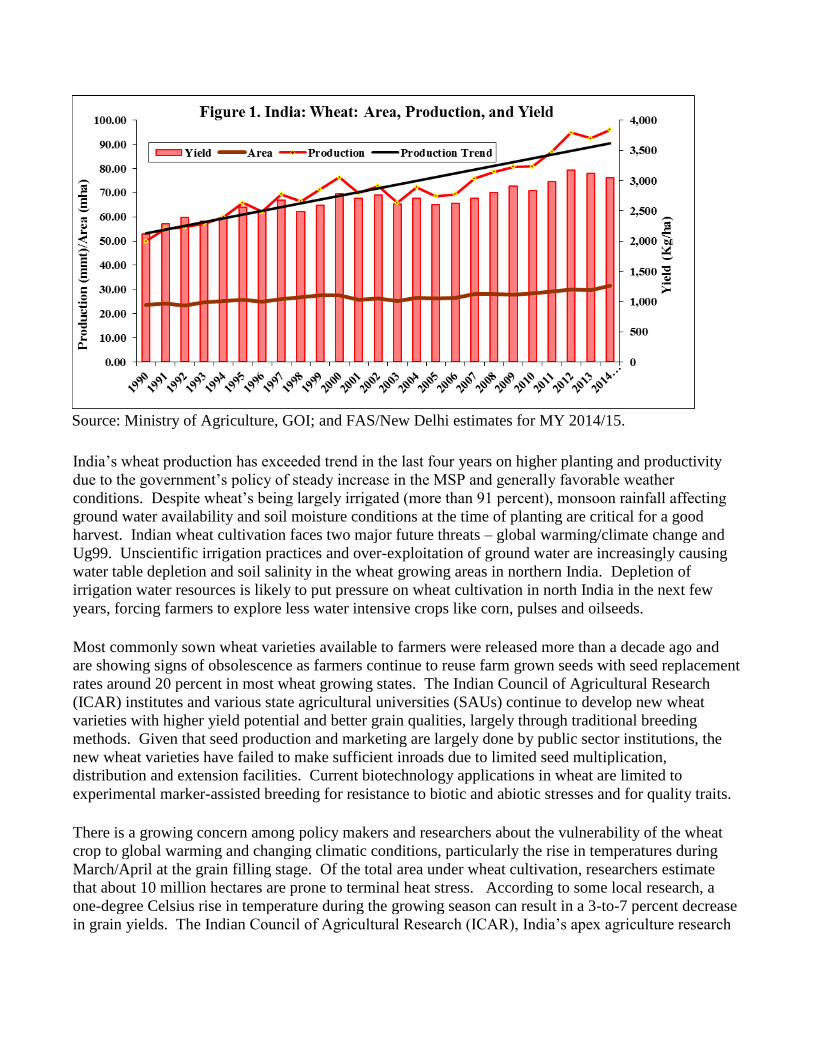
Source: Ministry of Agriculture, GOI; and FAS/New Delhi estimates for MY 2014/15.
India’s wheat production has exceeded trend in the last four years on higher planting and productivity
due to the government’s policy of steady increase in the MSP and generally favorable weather
conditions. Despite wheat’s being largely irrigated (more than 91 percent), monsoon rainfall affecting
ground water availability and soil moisture conditions at the time of planting are critical for a good
harvest. Indian wheat cultivation faces two major future threats – global warming/climate change and
Ug99. Unscientific irrigation practices and over-exploitation of ground water are increasingly causing
water table depletion and soil salinity in the wheat growing areas in northern India. Depletion of
irrigation water resources is likely to put pressure on wheat cultivation in north India in the next few
years, forcing farmers to explore less water intensive crops like corn, pulses and oilseeds.
Most commonly sown wheat varieties available to farmers were released more than a decade ago and
are showing signs of obsolescence as farmers continue to reuse farm grown seeds with seed replacement
rates around 20 percent in most wheat growing states. The Indian Council of Agricultural Research
(ICAR) institutes and various state agricultural universities (SAUs) continue to develop new wheat
varieties with higher yield potential and better grain qualities, largely through traditional breeding
methods. Given that seed production and marketing are largely done by public sector institutions, the
new wheat varieties have failed to make sufficient inroads due to limited seed multiplication,
distribution and extension facilities. Current biotechnology applications in wheat are limited to
experimental marker-assisted breeding for resistance to biotic and abiotic stresses and for quality traits.
There is a growing concern among policy makers and researchers about the vulnerability of the wheat
crop to global warming and changing climatic conditions, particularly the rise in temperatures during
March/April at the grain filling stage. Of the total area under wheat cultivation, researchers estimate
that about 10 million hectares are prone to terminal heat stress. According to some local research, a
one-degree Celsius rise in temperature during the growing season can result in a 3-to-7 percent decrease
in grain yields. The Indian Council of Agricultural Research (ICAR), India’s apex agriculture research

agency, along with various state agriculture universities (SAUs) is closely researching the potential
climate risks to wheat to develop appropriate response mechanisms and technologies to mitigate risks.
Indian wheat also faces the threat of the dreaded wheat rust Ug99, as more than three-fourths of wheat
acreage is planted to varieties susceptible to the disease. Although agricultural researchers assert that
the agro-climatic conditions in the major wheat belt of northern India are not conducive to the spread of
Ug99, the highly mutative nature of the Ug99 strain could make India’s wheat growing belt vulnerable
to this rust. Consequently, ICAR and the SAUs continuously survey and monitor the wheat crop for
various rusts, including Ug99. ICAR is also screening newly developed wheat varieties in the country
for resistance to Ug99. The government has been encouraging replacing susceptible varieties with
Ug99-resistant varieties in the major wheat growing area.
Consumption:
Wheat consumption (FSI) in MY 2014/15 is forecast at 87 MMT on sufficient domestic production and
expected higher supplies of subsidized government wheat through the Public Distribution System (PDS)
with the implementation of the new National Food Security Act (NFSA, see GAIN reports IN3105 and
IN3037). Expected near-record government procurement is likely to increase the already ‘more-than-
sufficient government wheat stocks, forcing the government to continue sale of wheat at subsidized
prices to local millers through the Open Market Sales Scheme (OMSS). Wheat for feed consumption
and residual is forecast at 4.5 MMT on expected steady demand from the dairy feed sector and damage
to the abnormally large government-held wheat stocks.
Wheat (FSI) consumption in MY 2013/14 is estimated to increase by more than eight percent to 86.9
MMT on higher government wheat sales under the PDS and OMSS programs. Since November 2013,
local millers have been sourcing government wheat for meeting the bulk of their consumption
requirement as open market availability of wheat has been very tight. Wheat for feed consumption in
MY 2013/14 is estimated at 4.8 million tons on strong demand from the dairy/poultry sector and higher
supplies of damaged/inferior wheat from government stocks. Market sources report that a significant
portion of the lower quality wheat leaked from the PDS finds its way into the livestock feed sector.
Also see attachment.
Wheat is the staple food for most Indians, mostly consumed in the form of homemade chapattis or rotis
(unleavened flat bread) using custom milled atta (whole wheat flour). Some wheat is also used for
various wheat-based processed products like raised breads, “biscuits” (cookies) and other bakery items.
Their share of the market is gradually rising. With growth in the economy and an expanding middle
class, Indian households are diversifying their consumption patterns with an expanding share of high-
value and high-protein items, like fruits, dairy products, meat, and processed foods. Recent National
Sample Survey Organization surveys indicate that per-capita consumption of wheat at household levels
has been relatively flat over the last decade (see IN2026).
Typically, whole wheat is distributed through the public distribution system to be subsequently custom
milled by the household for home use. Most wheat retained by farmers (40-45 percent), after saving
some quantities for seed use for the next season, is also custom milled, mostly in the chakkies (small
flour mills) for home consumption and small quantities for feed use (mostly lactating cows and

buffaloes). Nevertheless, branded and packaged wheat atta marketed by large food companies is
gaining market share in urban areas due to convenience.
The organized milling sector is relatively small with about 1,000 medium to large flourmills in India,
with aggregate milling capacity of 24-25 MMT, which mill mostly maida (flour) and semolina to cater
to institutional demand, and produce bran flakes for the mixed feed industry. However, the average
capacity utilization by these mills is only around 45-50 percent, processing about 12 million tons wheat
every year.
Some quantity of government-held wheat (mostly spoiled or of inferior quality) is also used for animal
feed. Market sources report higher usage of wheat for animal feed in the last few years due to higher
spoilage and leakage from the government PDS at significantly lower prices.
Government Procurement
Due to a steady increase in the government support price and back-to-back record production,
government food grain (wheat and rice) procurement increased strongly during 2007 to 2012. However,
government wheat procurement in MY 2013/14 went down to 25.1 MMT, a whopping 34 percent below
the previous year, largely due to relatively high open market prices and speculation about domestic
production lower than officially claimed. Forecast record production and the higher procurement price
(MSP plus expected additional state bonuses) are likely to fuel the MY 2014/15 wheat procurement
higher to 36 MMT. However, domestic prices and limits to the effectiveness of government
procurement operations may temper the overall procurement prospects.
Given the likelihood of Parliamentary elections in April 2014, the formation of the new government will
coincide with the peak wheat arrival and government procurement season (May-June). Post-election
formation and functioning of the new government will also influence wheat procurement volumes,
particularly in the states of Uttar Pradesh, Madhya Pradesh and Bihar, where the crop comes late.
Market sources report that wheat procurement may exceed 40 MMT (against the previous record of 38.2
MMT in 2012) if domestic market prices fall under the influence of weak international prices and the
government ensures effective procurement in most states.
Upcoming high wheat procurement will likely aggravate the government’s food grain storage problems,
particularly in the major origination states of Punjab, Haryana, and Madhya Pradesh. The government’s
current roofed storage capacity, including leased space, is estimated at around 53-54 MMT, wherein
higher value rice gets priority over wheat for storage. Assuming a normal pace of procurement and
sales by the government, wheat stocks on June 1, 2014, are likely to balloon to an estimated 48 MMT
while rice stocks are estimated at 31 MMT. Consequently, large quantities of government wheat will
have to be kept in the open under tarpaulin cover and plinth (CAP) storage including temporary open
storage space during the procurement period (May-July). Storage under these conditions results in
significant losses due to damage from rain, temperature fluctuations, rodent/pests, and losses to
pilferage.
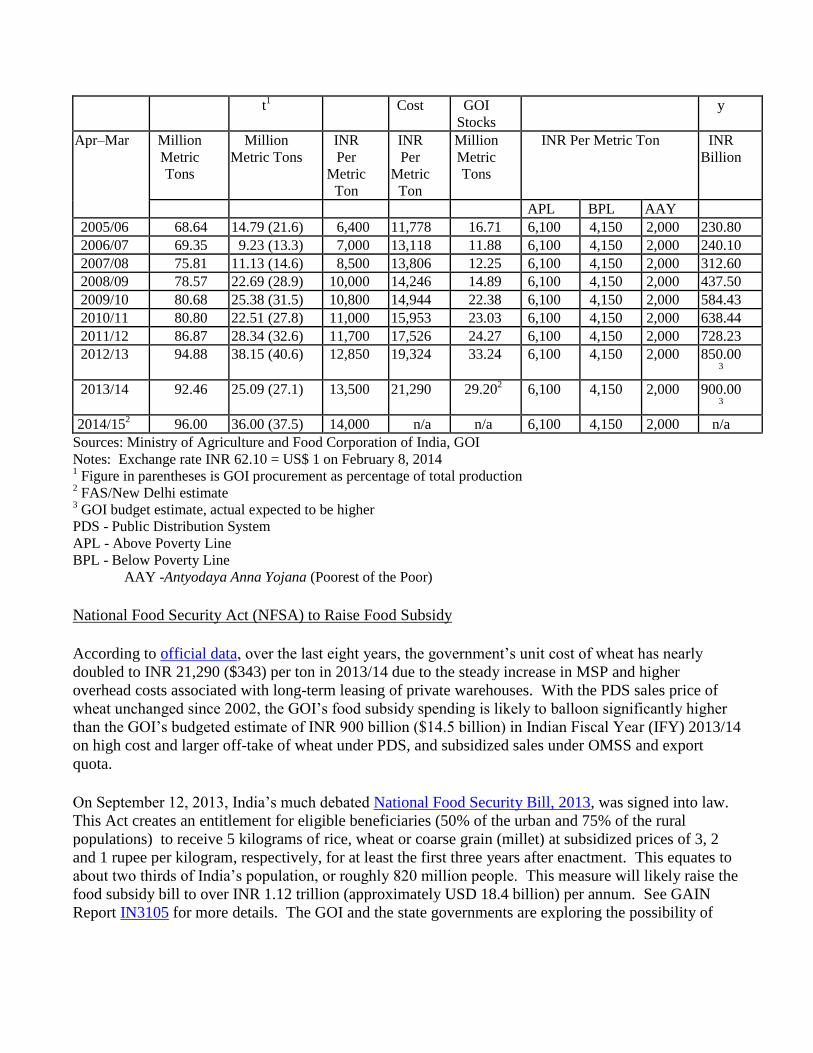
Table 1. India: Government Wheat Procurement and PDS Operation
Marketin
g Year
Productio
n
GOI
Procuremen
MSP GOI
Total
Offtake
from
PDS Issue Price Food
Subsid
t1 Cost GOI
Stocks
y
Apr–Mar Million
Metric
Tons
Million
Metric Tons
INR
Per
Metric
Ton
INR
Per
Metric
Ton
Million
Metric
Tons
INR Per Metric Ton INR
Billion
APL BPL AAY
2005/06 68.64 14.79 (21.6) 6,400 11,778 16.71 6,100 4,150 2,000 230.80
2006/07 69.35 9.23 (13.3) 7,000 13,118 11.88 6,100 4,150 2,000 240.10
2007/08 75.81 11.13 (14.6) 8,500 13,806 12.25 6,100 4,150 2,000 312.60
2008/09 78.57 22.69 (28.9) 10,000 14,246 14.89 6,100 4,150 2,000 437.50
2009/10 80.68 25.38 (31.5) 10,800 14,944 22.38 6,100 4,150 2,000 584.43
2010/11 80.80 22.51 (27.8) 11,000 15,953 23.03 6,100 4,150 2,000 638.44
2011/12 86.87 28.34 (32.6) 11,700 17,526 24.27 6,100 4,150 2,000 728.23
2012/13 94.88 38.15 (40.6) 12,850 19,324 33.24 6,100 4,150 2,000 850.003
2013/14 92.46 25.09 (27.1) 13,500 21,290 29.202 6,100 4,150 2,000 900.00
3
2014/152 96.00 36.00 (37.5) 14,000 n/a n/a 6,100 4,150 2,000 n/a
Sources: Ministry of Agriculture and Food Corporation of India, GOI
Notes: Exchange rate INR 62.10 = US$ 1 on February 8, 2014 1 Figure in parentheses is GOI procurement as percentage of total production
2 FAS/New Delhi estimate
3 GOI budget estimate, actual expected to be higher
PDS - Public Distribution System
APL - Above Poverty Line
BPL - Below Poverty Line
AAY -Antyodaya Anna Yojana (Poorest of the Poor)
National Food Security Act (NFSA) to Raise Food Subsidy
According to official data, over the last eight years, the government’s unit cost of wheat has nearly
doubled to INR 21,290 ($343) per ton in 2013/14 due to the steady increase in MSP and higher
overhead costs associated with long-term leasing of private warehouses. With the PDS sales price of
wheat unchanged since 2002, the GOI’s food subsidy spending is likely to balloon significantly higher
than the GOI’s budgeted estimate of INR 900 billion ($14.5 billion) in Indian Fiscal Year (IFY) 2013/14
on high cost and larger off-take of wheat under PDS, and subsidized sales under OMSS and export
quota.
On September 12, 2013, India’s much debated National Food Security Bill, 2013, was signed into law.
This Act creates an entitlement for eligible beneficiaries (50% of the urban and 75% of the rural
populations) to receive 5 kilograms of rice, wheat or coarse grain (millet) at subsidized prices of 3, 2
and 1 rupee per kilogram, respectively, for at least the first three years after enactment. This equates to
about two thirds of India’s population, or roughly 820 million people. This measure will likely raise the
food subsidy bill to over INR 1.12 trillion (approximately USD 18.4 billion) per annum. See GAIN
Report IN3105 for more details. The GOI and the state governments are exploring the possibility of

phased implementation of the proposed law by 2015, but the actual implementation will depend on its
priority as accorded by the new government after the upcoming Parliamentary elections.
Prices
Source: Agmarket News (http://agmarkweb.dacnet.ic.in), Ministry of Agriculture, GOI
Despite sufficient domestic supplies (near-record production and record opening stocks), domestic
wheat prices in MY 2013/14 have been very firm on strong demand and relatively tight open-market
wheat supplies. Domestic prices have started weakening since January on expectation of a record
upcoming crop and weak international prices. Spot prices in the first week of February 2014 were
ranging between INR 15,200 ($245) to INR 17,700 ($285) per metric ton in major producing states.
Government wheat is currently available to local millers under the OMS scheme in the price range of
INR 15,400 ($248) to INR 17,500 ($281) per ton. More than sufficient opening stocks, expected weak
international prices and forecast record domestic production will pressure the domestic prices further
through the first quarter of MY 2014/15. However, government’s support price and procurement
operation would contain any significant decline in domestic wheat prices.
Trade:
Indian wheat exports took off in August 2012 after the GOI announced exports of wheat from
government stocks. However, weak international prices have affected government wheat exports during
MY 2013/14, forcing the government to lower the export floor prices from $300 per ton to $260 per ton
in November 2013. The increasing implied subsidization of government wheat exports is a major
concern for the government on meeting its World Trade Organization commitments, and the
government is unlikely to lower the export floor price below $260.
India’s MY 2014/15 wheat exports are forecast to decline to 3 MMT, most of which will be private
exports (open-market wheat procured by private trade) and some spillover of government wheat from
the existing current two MMT quota announced in August 2013. With international prices expected to
remain depressed during the upcoming marketing year, it will be very difficult for the government to

export wheat with $260-per-ton floor price. Due to the increase in the procurement price (INR 14,000
($225) to INR 15,500 ($250) per ton) for the upcoming season, the government will have to raise the
subsidy significantly higher to off load any wheat in the export market. With OMSS reserve prices in
major states ranging from $248-$281 per ton, domestic millers, opposition politicians and foreign
competitors will object to any lowering of the minimum export price. However, export prospects may
improve if either international prices improve or the value of Indian rupee declines significantly.
MY 2013/14 wheat exports are estimated at 6 million tons as Indian wheat has not been very price
competitive in the international market. The government announced the two-MMT export quota in
August 2013, but global wheat prices have been on a downward trend and the government parastatals
assigned to export the quota are struggling to find buyers. See IN4001 for more information on the
government wheat tenders and export performance through January 2014.
Table 2. India: Government Wheat Tenders Against the New Export Quota
Agency Quantity Allocated or
Tendered (Tons)
Tender
Close
Shipment
Period
Price
(US$ per ton
FOB)
Port of
Loading
STC 120,000 Nov 15,
2013
Nov 25-Dec
28,2013
286.20 Mundra
PEC 70,000 Nov 15,
2013
Nov 20-Dec 20,
2013
289.90 Krishnapatnam
PEC 90,000 Nov 15,
2013
Nov 20-Dec 20,
2013
284.70 Kandla
MMTC 60,000 Nov 15,
2013
Nov 22-Dec 21,
2013
285.95 Kakinada
MMTC 55,000 Dec 12,
2013
Dec 22,2013-
Jan 25, 2014
283.10 Pipavav
PEC 110,000(120,000)1 Dec 12,
2013
Dec 23, 2013-
Jan 25,2014
285.41 Kandla
PEC 35,000 Dec 12,
2013
Dec 22,2013-
Jan 25, 2014
287.10 Vizag
PEC 70,000 Dec 16,
2013
Dec 26, 2013-
Jan 31, 2014
281.50 Krishnapatnam
MMTC 85,000 (100,000)1 Dec 23,
2013
Jan 3-Feb 4,
2014
283.11 Kakinada
STC 40,000(200,000)1 Dec 23,
2013
Jan 4-Feb 3,
2014
288.30 Mundra
STC 125,000(160,000)1 Jan 8,
2014
Jan 18-Feb 18,
2014
282.60 Mundra
STC 70,000 Jan 10,
2014
Feb 1-Feb 28,
2014
283.60 Chennai
PEC 45,000 (120,000)1 Jan 14,
2014
Jan 20-Feb 25,
2014
281.31 Kandla
PEC 70,000 Jan 14,
2014
Jan 20-Feb 25,
2014
279.52 Vizag
STC 40,000 (120,000)1 Jan 23,
2014
Feb 1, Mar 5,
2014
278.20 Mundra
MMTC 60,000 Feb 3, Feb 10-Mar 10, NA Pipavav

2014 2014
PEC 100,000 Feb 14,
2014
Feb 25-Mar 25,
2014
NA Kandla
MMTC 80,000 Feb 14,
2014
Feb 20-Mar 19,
2014
NA Kakinada
PEC 70,000 Feb 24,
2014
Feb 28-Mar 28,
2014
NA Krishnapatnam
STC 50,000 Feb 24,
2014
March 6-April
6, 2014
NA Chennai
STC 150,000 Feb 24,
2014
March 6-April
6, 2014
NA Mundra
Tenders Cancelled
PEC 40,000 Oct 4,
2013
Oct 15-Nov
15,2013
Cancelled Kandla
STC 60,000 Oct 4,
2013
Oct 15-Nov
15,2013
Cancelled Mundra
MMTC 50,000 Oct 4,
2013
Oct 15-Nov
15,2013
Cancelled Mundra
MMTC 60,000 Jan 14,
2014
Jan 20-Feb 24,
2014
Cancelled Pipavav
MMTC 120,000 Jan 23,
2014
Feb 1-Mar 5,
2014
Cancelled Kakinada
PEC 100,000 Feb 3,
2014
Feb 10-Mar 10,
2014
Cancelled Krishnapatnam
PEC 35,000 Feb 12,
2014
Feb 20-Mar 25,
2014
Withdrawn Vizag
Note: STC- State Trading Corporation; PEC - Project Export Corporation; and MMTC - Minerals and Metals
Trading Corporation 1 Tender allocated partially, with figure in parenthesis indicating the total quantity tendered.
Provisional official trade statistics indicate that wheat exports for April to November 2013 reached 3.8
million tons, with the major export destinations being Bangladesh, Korea, Indonesia, Saudi Arabia,
Djibouti, Yemen, Philippines and other Asian countries (see Table 4). A significant share of India’s
wheat exports is meant for feed use, particularly in southeast Asia and the Middle East. Due to tight
open-market wheat supplies, private exports of wheat have come down significantly since November
2013, and most recent wheat exports have been from government-held stocks. In addition, wheat
product shipment is estimated at around 100,000 metric tons, mostly wheat flour. At the current pace of
exports, MY 2012/13 exports are estimated to reach 6.0 million tons (1.2 million tons government
wheat and the balance private exports and wheat products).
Despite continuation of the zero import duty policy, opportunities for imports of wheat into India since
MY 2011/12 have been precluded due to subsidized sales of wheat under OMSS. Imported wheat is
relatively costlier to local millers vis-à-vis local wheat after accounting for shipping, clearance and
inland transport costs.
Stocks:

Government wheat stocks have been drawn down in MY 2013/14 due to lower procurement and higher
sale of wheat in the domestic market. Government-held wheat stocks on February 1, 2013, were
estimated at 24.2 MMT compared to 30.8 MMT at the same time last year, but still significantly higher
than the government’s desired peak stock of 20.1 MMT (on July 1).
Source: Food Corporation of India, GOI
Assuming current pace of exports and domestic off take in February/March, MY 2013/14 ending stocks
are estimated at 19.0 MMT compared to 24.2 MMT for MY 2012/13 ending stocks. MY 2014/15
ending stocks are forecast to increase to 20.5 MMT on expected higher procurement and lower offtake
of government wheat for exports. Nevertheless, these stocks are more than three times the
government’s desired stocks of 7 million tons (4 million tons buffer and 3 million tons of strategic
reserve).
Estimates of privately-held wheat stocks are not available, but are expected to be minimal due to risks
stemming from anti-hoarding provisions of the Essential Commodities Act. The PS&D table does not
include privately held stocks.
Policy:
Research & Development:
The agriculture sector is a high priority for the GOI, wherein the planned allocation for agriculture and
allied sectors was raised by 18 percent to INR 187.81 billion ($3.4 billion) in the budget for Indian
fiscal year 2013/14 (April-March). While the crop wise allocation is not available, rice and wheat
account for the majority of spending as they have been the focus crops for food security. The GOI
supports research, development and extension activities for transfer of new varieties and improved
production technologies (seed, implements, pest management) to farmers. ICAR conducts wheat
research and development at the national level, which is complemented by state agricultural universities,
regional research institutions, and state agricultural extension agencies at the regional and state levels.

The central and state governments also support farmers by subsidizing input supplies and agricultural
credit at affordable prices.
In 2007, the government launched a National Food Security Mission (NFSM) (http://nfsm.gov.in/) to
address food security concerns due to the slowdown in the growth of food grain production in the last
decade (2000). Given that further growth in area under wheat is limited, the NFSM seeks to bridge the
yield gap through promotion and dissemination of improved technologies: seed, integrated nutrient
management, integrated pest management and resource conservation technologies, particularly in the
western and central states. Besides the NFSM, other targeted programs like the National Agriculture
Development Program (Rashtriya Krishi Vikas Yojana) and Special Program to Bring the Green
Revolution to Eastern India are being implemented by the GOI through the state governments.
Price Support:
The GOI establishes a minimum support price (MSP) for wheat on the basis of recommendations by the
Commission for Agricultural Costs and Prices (CACP). Some states also provide additional bonus to
their farmers over and above the MSP out of their own exchequers. The state governments of Rajasthan
and Madhya Pradesh gave a bonus of INR 1,500 ($24) per ton to their farmers under the MSP program
in MY 2013/14 and are likely to extend it in MY 2014/15 also. Government parastatals like the Food
Corporation of India (FCI) and various state marketing agencies bear the mandate to procure wheat at
the MSP for central government stocks. Subsequently, the government allocates wheat for distribution
through the public distribution system and welfare schemes at a subsidized price. In years of surplus
procurement and stocks, the government sells wheat in the open market to the private trade at market
prices. The government policies relating to the MSP for essential agricultural crops and the price for
the PDS supply serve the twin objectives of providing remunerative prices to farmers and affordable
prices to poor consumers. See tables 1 and 18 for historical MSPs.
Trade Policy:
On September 9, 2011, the GOI removed the ban on exports of wheat, which had been enforced since
February 2007, with some exceptions – occasionally allowing exports to countries like Nepal,
Bangladesh and Afghanistan on humanitarian grounds. On July 3, 2012, the government approved
exports of two million tons of wheat from government-held wheat stocks to bring the government food
grain stocks down to a more manageable level. Three government parastatals were designated to
undertake the exports through open tenders, and the two-million-ton quota was exhausted by December
2012. On December 26, 2013, the government approved the export of an additional 2.5 million tons of
wheat from government-held stocks for shipment through June 2013 (see IN3001). In August 2013, the
government announced a new 2-MMT export quota, but had to lower the export floor price from $300
per ton to $260 per ton in November 2013. The off take of the government wheat has been very slow
due to weak international prices. Exports of wheat from government-held stocks are unlikely to
continue unless international prices improve significantly.
Currently, wheat imports by the government and private trade incur zero import duty. The government
lowered the duty on wheat imports to zero in September 2006 for a short period and this was
subsequently extended indefinitely in October 2007. The GOI’s phytosanitary requirement pertaining to
the 31 specified quarantine weed seeds (wheat sample drawn from a single consignment not to contain

more than 100 quarantine seeds per 200 kg sample) and other SPS issues have effectively barred U.S.
wheat shipments to India.
Marketing:
The rapidly growing fast food industry and modernizing wheat-based food industry generate demand for
specialty flours (used in pizzas and burger buns) that require varieties of wheat India does not grow. In
addition, market sources report steadily declining acreage under local ‘hard and high-protein’ wheat
varieties like Sharbati and Lok-1 grown in central India could create a shortage of high-protein wheat
for blending of flour for the rapidly growing baking/confectionary industry. However, U.S. wheat
continues to be denied market access to India despite numerous discussions at the technical and policy
levels.
Production, Supply and Demand Data Statistics:
Table 3. India: Commodity, Wheat, PSD (Area in Thousand Hectares, Quantity in Thousand Metric Tons, Yield in MT/Hectare)
Wheat
India
2012/2013 2013/2014 2014/2015
Market Year Begin: Apr
2012
Market Year Begin: Apr
2013
Market Year Begin: Apr
2014
USDA
Official New Post
USDA
Official New Post
USDA
Official New Post
Area Harvested 29,860 29,860 29,400 29,600 31,500
Beginning
Stocks
19,950 19,950 24,200 24,200 19,000
Production 94,880 94,880 92,460 92,460 96,000
MY Imports 16 16 20 20 0
TY Imports 20 20 20 20 0
TY Imp. from
U.S.
0 0 0 0 0
Total Supply 114,846 114,846 116,680 116,680 115,000
MY Exports 6,824 6,824 6,500 6,000 3,000
TY Exports 8,648 8,648 5,500 5,500 3,000
Feed and
Residual
3,400 3,400 3,500 4,800 4,500
FSI
Consumption
80,422 80,422 86,480 86,880 87,000
Total
Consumption
83,822 83,822 89,980 91,680 91,500
Ending Stocks 24,200 24,200 20,200 19,000 20,500
Total
Distribution
114,846 114,846 116,680 116,680 115,000
Yield 3. 3.1775 3. 3.1236 3.0476

Table 4. India: Commodity, Wheat, Prices Table
Prices In Rupees per uom metric ton
Year 2011 2012 2013 %Change
Jan 14,611 13,106 16,279 24.2
Feb 14,724 13,561 16,953 25.0
Mar 13,983 13,033 16,171 24.1
Apr 13,790 13,699 14,925 8.9
May 13,112 13,423 15,822 17.9
Jun 12,762 13,529 16,816 24.3
Jul 13,164 13,961 16,391 17.4
Aug 13,049 15,339 16,698 8.9
Sep 12,858 15,789 16,351 3.6
Oct 12,274 15,780 16,936 7.3
Nov 13,019 16,924 18,370 8.5
Dec 13,036 16,397 18,084 10.3
Exchange Rate 62.10 Local Currency/US$
Date of Quote 02/8/2014 MM/DD/YYYY
National Average Monthly Wholesale Price of Wheat Source: Agmarket News (http://agmarkweb.dacnet.ic.in), Ministry of Agriculture, GOI.
Table 5. India: Commodity, Wheat1, Export Trade Matrix
Time Period April-March Units Metric Tons
Exports for MY 2012/13
MY 2013/142
U.S. 105 U.S. 31
Others
Bangladesh 1,774,039 Bangladesh 1,284,917
Korea Republic 1,053,751 Korea Republic 630,652
Yemen 507,233 U.A.E. 370,937
U.A.E. 498,131 Indonesia 309,647
Djibouti 461,109 Saudi Arabia 138,600
Ethiopia 395,677 Djibouti 137,609
Indonesia 375,433 Yemen 104,541
Thailand 300,685 Philippines 100,342
Oman 206,965 Oman 95,893
Tanzania 197,691 Thailand 85,543
Philippines 185,108 Malaysia 77,020
Qatar 104,843 Vietnam 70,577
Total for Others 6,060,665 Total for Others 3,406,278
Others not Listed 454,042 Others not Listed 365,974

Grand Total 6,514,812 Grand Total 3,772,283 1 Trade figures in the PSD includes wheat products.
2 Provisional data for the period April thru November 2012
Source: Global Trade Atlas & Directorate General of Commercial Intelligence, GOI.
Commodities:
Production:
Assuming normal weather conditions and normal southwest monsoon (June –September), India’s MY
2014/15 (October/September) rice output is forecast higher at 104 MMT from 44.0 million hectares,
marginally higher than the estimated MY 2013/14 production of 103 MMT. Timely and well
distributed 2013 monsoon rains lowered cost of cultivation and supported good yields. Relatively
strong prices during MY 2013/14 (Figure 5) further augmented farmers’ returns, which should
encourage them to continue to plant rice in the upcoming season upon the onset of 2014 monsoon.
While the weakening of global prices may affect local prices for the upcoming rabi (winter planted)
rice, expectation of continued increase in the government’s MSP mitigates rice growers’ concerns about
potential significant price declines. However, a timely and well distributed (over space and time)
monsoon would be critical for the MY 2014/15 rice crop. A poor/erratic 2014 monsoon could bring
down production by 10-12 million tons from the forecast level as more than 40 percent of rice area is
unirrigated.
Despite higher planting of kharif rice, ‘below-normal’ monsoon rains during July-August in the states of
Uttar Pradesh, Bihar and some pockets of other eastern states affected yield prospects. Planting of rabi
(winter) rice is currently ahead of last year’s level on improved soil moisture due to the late monsoon
rains in September/October. Consequently, Post estimates MY 2013/14 rice production at 103 million
tons (90 million tons kharif rice and 13 million tons rabi rice).
Rice is one of the most important food crops of India, cultivated throughout the country and
contributing more than 40 percent of total food grain production. Rice is predominantly a rainfed crop,
planted in the kharif season after the onset of the monsoon in June. However, there is a small rabi crop
taken in the states of West Bengal, Andhra Pradesh, Odisha and Tamil Nadu. India’s rice production
shows a steady upward trend, but production is subject to wide year-on-year fluctuations compared to
wheat as a significant portion of the crop is not irrigated.
Rice, Milled

Source: Ministry of Agriculture, GOI; and FAS/New Delhi estimates for MY 2013/14 and 2014/15.
Normal and near-normal monsoons since 2010 have supported higher yields, but Indian rice yields are
below the world average. There are both wide variation in the levels of rice productivity among the
major producing states in the country and scope for increasing productivity by expanding irrigation
facilities and adopting technology. In 2010/11, the government launched a Special Program to Bring
the Green Revolution to Eastern India by promoting the Green Revolution and other improved
technologies to the eastern region of the country comprising Bihar, Chhattisgarh, Jharkhand, eastern
Uttar Pradesh, West Bengal, and Odisha. The government is promoting a “System of Rice
Intensification” technology in some rice growing states, which requires less water and chemical
fertilizer but is highly labor intensive. The eastern states have realized significant productivity gains
due to the various government programs supporting Indian rice production in the last few years.
Many agricultural experts have expressed concerns that the current rice production techniques impose
serious environmental burdens and cannot sustain projected food demand after 2020. Surplus rice
growing states like Punjab, Haryana, Uttar Pradesh, and Andhra Pradesh follow intensive rice-wheat or
rice-rice cropping systems, and are facing severe environmental issues, including declining water tables,
deteriorating soil health and emergence of resistant disease/pests in the growing areas. Indian rice
cultivation also faces the challenge of climate change as a significant share of the rice crop is produced
in coastal regions, which are susceptible to a rise in the sea level. Climate change issues like glacier
melting and aberrations in the monsoon rain patterns may also potentially affect the rice crop. However,
a significant cropping shift out of rice is not imminent in the near future due to the government’s
continued emphasis on supporting rice-wheat production through minimum support price (MSP)
procurement and a lack of more profitable crop rotation alternatives.
India’s long-grain Basmati rice production has been growing strongly after the introduction of the
PUSA 1121 variety, an evolved high-yielding variety. Indian Basmati rice is traditionally grown in
Punjab, Haryana and western Uttar Pradesh. Market reports suggest that cultivation of PUSA 1121 has
spread to other parts of Uttar Pradesh ad Madhya Pradesh. Basmati rice production in MY 2013/14 is
estimated at 7.5 MMT from 1.8 million hectares compared to record production of 7.8 MMT from 1.9
million hectares in MY 2011/12. Basmati growers have realized good prices during the current season

on strong export demand. Consequently, Basmati production in MY 2014/15 is forecast to increase to
8.5 MMT from 2.0 million hectares.
There are about 45-50 varieties of hybrid rice, most developed by private seed companies, of which
about 25 are popular in the market. The National Food Security Mission set a target to plant three
million hectares to hybrid rice by 2011-12. Despite sustained government efforts, area under hybrid rice
is estimated not to have gained in the recent years, and was estimated at 1.8 million hectares in 2013/14,
unchanged from last year. Most of the hybrid rice is cultivated in eastern India - eastern Uttar Pradesh,
Bihar, Jharkhand, and Chhattisgarh. Growth of area under hybrid rice is severely hampered by (i) the
inability of the existing hybrids to cater to the vast diversity in consumer preference for rice, (ii) low
incremental yields, and (iii) poor milling quality over traditional varieties. Nevertheless, several private
seed companies and public sector institutions are developing improved hybrid rice varieties targeting
quality and yield enhancement traits, which should accelerate hybrid rice adoption by Indian farmers.
Efforts are also underway, mostly in the private sector, to develop transgenic rice varieties to
incorporate resistance to various pests, diseases and abiotic stresses. However, approvals and
commercialization of transgenic rice are still years away.
Consumption:
Rice is the major staple food for a majority of Indians (about 70 per cent of the population) across the
country. Rice consumption in MY 2014/15 is forecast to increase by three percent to 98 million tons on
expected sufficient domestic supplies and higher sales of government rice through the PDS as various
states implement the new NFSA. Rice consumption in MY 2013/14 is estimated at 95.0 MMT
compared to 93.5 MMT in MY 2012/13, a modest increase of 1.5 percent, almost equal to the
population growth rate (1.4 percent per annum). Strong domestic prices have restrained growth in
domestic consumption in the last two years.
Source: Agmarket News (http://agmarkweb.dacnet.ic.in), Ministry of Agriculture, GOI.

Domestic rice prices have shown a strong upward trend since the beginning of MY 2012/13 (see Table
8), fueled by significant hikes in the MSP for paddy rice (Table 6) and relatively tight domestic supplies
(strong government procurement and exports). Domestic prices have started weakening since
December 2013 on faltering exports.
More than 4,000 varieties of rice are grown in India to meet the varied consumer preferences. For
government procurement purposes, rice is classified into two categories - Common (length to breadth
ratio less than 2.5) and Grade A (length to breadth ratio more than 2.5). In the past, most rice under the
government procurement program came through a mandatory levy on local millers. Depending on the
state, local rice millers must sell to the government a fixed portion of their milled rice (ranging from 75
percent in Punjab and Haryana to 50 percent in Andhra Pradesh, and even lower in marginal surplus
states) at pre-established rates, called the “levy price,” which are linked to the MSP of paddy rice plus
milling costs. With the government’s raising the MSP significantly in recent years, local millers have
reduced their purchases of paddy rice for milling. Thus, the government has been procuring larger
quantities of paddy rice bought at the support price, which is subsequently custom-milled for the
government by private millers at government expense for storage and distribution through PDS.
Table 6. India: Government’s Rice Procurement and PDS Operation
Marketin
g Year
Productio
n
GOI
Procurement1
MSP for
Paddy
(Unmilled
Rice
Common
variety)
GOI
Economi
c Cost
Offtak
e from
GOI
Stocks
PDS Issue Price
Oct-Sept Million
Metric
Tons
Million
Metric Tons
INR per
metric ton
INR Per
metric ton
Million
Metric
Tons
INR. per metric ton
APL BPL AAY
2005/06 91.79 27.58 (30.0) 5,700 13,912 n/a 7,95
0
5,65
0
2,00
0
2006/07 93.35 25.11 (26.9) 6,200 15,499 n/a 7,95
0
4,15
0
2,00
0
2007/08 96.69 28.74 (29.7) 7,450 17,407 n/a 7,95
0
4,15
0
2,00
0
2008/09 99.18 34.10 (34.4) 9,000 18,201 25.69 7,95
0
4,15
0
2,00
0
2009/10 89.09 32.03 (36.0) 10,000 19,831 28.35 7,95
0
4,15
0
2,00
0

2010/11 95.98 34.20 (35.6) 10,000 21,229 31.97 7,95
0
4,15
0
2,00
0
2011/12 105.30 35.06 (33.3) 10,800 23,049 31.44 7,95
0
4,15
0
2,00
0
2012/13 104.40 34.02 (32.6) 12,500 26,485 31.37 7,95
0
4,15
0
2,00
0
2013/142 103.00 31.00 (30.1) 13,100 29,180 n/a 7,95
0
4,15
0
2,00
0
2014/152 104.00 n/a n/a n/a n/a 7,95
0
4,15
0
2,00
0
Source: Ministry of Agriculture and Food Corporation of India, GOI
Notes: Exchange rate INR 62.1 = US$ 1 on February 8, 2014 1- Figure in parentheses is GOI procurement as percentage of total production
2 - FAS/New Delhi estimate
PDS - Public Distribution System; APL - Above Poverty Line; BPL - Below Poverty Line; and
AAY -Antyodaya Anna Yojana (Poorest of the Poor)
The government raised the MSP for paddy rice by nearly 5 percent for the MY 2013/14, and has set a
rice procurement target of 36 MMT against last year’s procurement of 34.0 MMT. Government rice
procurement as of February 7, 2014, was estimated at 21.9 MMT compared to 23.8 MMT last year
during the corresponding period. However, recent weakening of open market price of rice may support
government rice procurement in coming months. Consequently, total GOI rice procurement in MY
2011/12 is expected to reach 31.0 million tons, much lower than the government target. As in the case
of wheat, there has been no increase in the retail price of rice distributed through the PDS since July 1,
2002, while the MSP has more than doubled over the last decade, contributing to the GOI’s growing
food subsidy budget.
The livestock feed industry uses deoiled rice bran, rice waste from the milling industries, and small
quantities of broken/damaged rice in the poultry and livestock feed sectors. However, there are no
official or industry estimates available of feed consumption.
Trade:
India’s rice exports for MY 2014/15 are forecast lower at 8.0 MMT (split equally between Basmati and
non-Basmati) on expected weak international prices and expected lower import demand from Iran. An
expected increase in the MSP for the upcoming season will sustain domestic prices and affect MY
2013/14 export prospects. However, a depreciation in the value of the Indian rupee or an increase in
global prices could raise the exports higher than the current forecast.
Since CY 2012, India has emerged as the world’s leading exporter of rice. Preliminary CY 2013 export
figures from official and private sources indicate export sales totaling 10.5 MMT. Major export
destinations were Iran, Saudi Arabia, Senegal, South Africa, U.A.E, Cameroon and other African
countries. Iran emerged as a major buyer of Indian rice (mostly long grain PUSA 1121 variety) under
the India-Iran rupee escrow mechanism against the oil import bill. Trade sources report that exports of
long grain Basmati rice to Iran have slowed since October 2013 following the withdrawal of Iran
sanctions by the United States and five other nations.

Source: Monthly exports through November 2013 from DGCIS, GOI; December 2013 derived from rice
shipping data compiled by a private source, which does not break out Basmati and non-Basmati
Based on preliminary official trade data and shipping data compiled by a private source, India’s MY
2012/13 rice exports for the first three months are estimated at 2.4 MMT compared to 2.8 MMT last
year during the same period. Although official trade data are not available, market sources report that
exports have recovered since December 2013 as domestic prices eased and stronger export demand.
Post continues to estimate MY 2013/14 exports at 10.0 MMT assuming no significant changes in the
price parity of Indian rice in the international market. However, global prices and the value of Indian
rupee will affect exports prospects in the coming months.
Stocks:
Due to the relatively weak rice procurement in the ongoing MY 2013/14, government-held rice stocks
on February 1, 2014, declined to 31.7 MMT compared to 35.4 MMT at the same time last year. At the
current pace of domestic sales and expecting higher rabi season procurement, government rice stocks on
October 1, 2014 (MY 2010/11 ending stocks) are expected to decline to 20.0 MMT compared to 23.1
MMT on October 1, 2013, but still more than double the desired stocks of 14.2 million tons.

Source: Food Corporation of India, GOI
There is no published information, official or industry, about privately held rice stocks. Expected weak
export demand and domestic prices are likely to result in higher buildup of privately held MY 2013/14
ending stocks, estimated at 3.1 MMT compared to 2.0 MMT at the end of MY 2012/13. The rice PS&D
table includes both government stocks and estimated privately held stocks.
Policy:
Production:
The government’s production policy for rice is the same as for wheat. Additionally, the GOI, with the
support of state governments, has undertaken various rice-specific development schemes like the
Special Rice Development Program (SRDP) and Promotion of Hybrid Rice (price subsidies on seed).
Price/Market Support:
The government undertakes a domestic price support, procurement and distribution program for rice
similar to that for wheat. The GOI has banned futures trading in rice since September 2007 on price
inflation concerns as policy makers believe that futures trading may lead to speculation.
Trade:
On September 9, 2011, the government lifted the export ban on non-Basmati rice, which had been in
effect since September 2007 (with ad hoc humanitarian exports exempted from time to time). Exports
of Basmati rice continued without quantitative restriction throughout the period, subject to a minimum
export price (MEP), which changed from time to time. On July 4, 2012, the government removed the
MEP requirement on exports of Basmati rice.
In March 2008, the GOI removed the import duty on rice, although there has been no importation of rice
since then.

Marketing:
Indian high-quality Basmati and select premium ‘short grain’ varieties compete against U.S. rice in
several markets, particularly Middle East and European countries.
Production, Supply and Demand Data Statistics:
Table 7. India: Commodity, Rice, Milled, PSD (Area in thousand hectares and quantity in thousand metric tons, Yield in MT/Hectare)
Rice,
Milled
India
2012/2013 2013/2014 2014/2015
Market Year Begin: Oct
2012
Market Year Begin: Oct
2014
Market Year Begin: Oct
2014
USDA
Official New Post
USDA
Official New Post
USDA
Official New Post
Area Harvested 42,410 42,410 43,500 43,500 44,000
Beginning Stocks 25,100 25,100 25,100 25,100 23,100
Milled Production 104,400 104,400 103,000 103,000 104,000
Rough Production 156,616 156,616 154,515 154,515 156,016
Milling Rate
(.9999)
6,666 6,666 6,666 6,666 6,666
MY Imports 0 0 0 0 0
TY Imports 0 0 0 0 0
TY Imp. from U.S. 0 0 0 0 0
Total Supply 129,500 129,500 128,100 128,100 127,100
MY Exports 10,900 10,900 10,000 10,000 8,000
TY Exports 10,500 10,500 10,000 10,000 8,000
Consumption and
Residual
93,500 93,500 95,000 95,000 98,000
Ending Stocks 25,100 25,100 23,100 23,100 21,100
Total Distribution 129,500 129,500 128,100 128,100 127,100
Yield (Rough) 4. 3.6929 4. 3.5521 3.5458
Table 8. India: Commodity, Rice, Milled, Prices Table
Prices In Rupees per uom metric ton

Year 2011 2012 2013 % Change
Jan 23,578 23,105 27,828 20.4
Feb 23,998 22,764 26,300 15.5
Mar 23,507 23,193 24,577 6.0
Apr 24,370 23,750 25,825 8.7
May 23,935 23,324 26,777 14.8
Jun 24,936 22,827 27,190 19.1
Jul 20,915 22,940 26,682 16.3
Aug 21,872 23,918 26,295 9.9
Sep 21,205 23,305 26,905 15.4
Oct 22,999 24,079 27,501 14.2
Nov 22,548 24,406 29,241 19.8
Dec 23,386 25,876 29,215 12.9
Exchange Rate 62.10 Local Currency/US$
Date of Quote 02/8/2014 MM/DD/YYYY
National Average Monthly Wholesale Price of Common Rice
Source: Agmarket News (http://agmarkweb.dacnet.ic.in), Ministry of Agriculture, GOI.
Table 9. India: Commodity, Rice, Milled, Export Trade Matrix
Time Period Jan-Dec Units Metric Tons
Exports for CY 2012
CY 20131
U.S. 119,795 U.S. 119,123
Others Others
Nigeria 1,171,694 Iran 1,504,496
Iran 874,538 Saudi Arabia 813,663
Senegal 865,450 Senegal 676,198
Saudi Arabia 861,210 South Africa 439,480
Cote d Ivoire 683,247 U.A.E 346,115
U.A.E. 593,754 Cameroon 288,744
Benin 470,220 Liberia 283,162
South Africa 385,774 Cote D Ivoire 278,335
Indonesia 345,885 Yemen 195,459
Nepal 337,308 Kuwait 169,734
Iraq 264,927 Bangladesh 167,191
Total for Others 6,854,007 Total for Others 5,162,577
Others Not Listed 3,576,567 Others 4,279,907
Grand Total 10,550,369 Grand Total 9,561,607
Note: 1 Provisional official data for the period January thru November 2013.
Source: Global Trade Atlas & Directorate General of Commercial Intelligence, GOI.
Commodities:

Author Defined:
COARSE GRAINS
Production:
Assuming normal 2014 monsoon and weather conditions, India’s MY 2014/15 coarse grain production
is forecast higher at 41.7 MMT, compared to MY 2013/14 production of 40.5 MMT, on higher
planting. Relatively low market prices during MY 2013/14 will affect planting of corn in the upcoming
season while planting of sorghum and millet should recoup some area that had shifted to competing
crops last year. The MY 2014/15 production forecast includes 22 MMT of corn, 12 MMT of millet, 6
MMT of sorghum and 1.7 MMT of barley. Most coarse grains are cultivated in the kharif season (more
than three fourths), with some corn, sorghum and barley taken as rabi season crop. With only about 15
percent of the coarse area under irrigation, performance of 2014 monsoon rains is critical for planting
and productivity of the kharif coarse grain crops. While monsoon rains also affect planting prospects of
the rabi crop, winter rains are essential for higher yields and prolonged frosts during the critical crop
growth stage (December-January) could temper yield prospects.
The timely and well distributed 2013 monsoon and consequent excellent soil moisture conditions
encouraged farmers to shift area from ‘low value’ coarse grains like sorghum and millet to other
competing crops (corn, pulses, oilseeds, and to some extent wheat). The Ministry of Agriculture’s
provisional planting estimates show lower planting of millet and sorghum in MY 2013/14. However,
favorable planting conditions coupled with relatively firm domestic prices in MY 2012/13 resulted in a
7-percent increase in planting of MY 2013/14 corn. Consequently, Post’s total coarse grain production
estimate for MY 2013/14 is estimated at 40.54 million tons, which includes a record 23.0 MMT of corn,
10.5 MMT of millet, 5.2 MMT of sorghum, and 1.7 MMT of barley.
Sorghum
Millet
Corn
Barley

Source: Ministry of Agriculture, GOI; and FAS/New Delhi estimates for MY 2013/14 and 2014/15.
Corn production in India has shown a steady upward trend in recent years on higher planting and
improving productivity due to wider adoption of hybrid seeds. Market sources report planting of hybrid
corn at 60 percent, which is expected to grow further in the near future as farmers shift area out of
traditional cultivars to higher-yielding hybrid varieties. Corn production has also been supported by
growing demand from the local poultry, animal feed and starch industry and exports. However, largely
rain-fed millet and sorghum production fluctuates year to year depending on the performance of the
monsoon. In the absence of any major productivity enhancing technology breakthrough and demand
from commercial/industrial sector in decades, these crops are facing increasing competition from corn,
cotton, soybeans, and pulses in major states, especially with the expansion in irrigation.
Production of barley, a relatively small winter crop in north India, has also been relatively steady around
1.7 MMT in recent years on continued demand from the malting and brewing industry, which has been
growing at 10-12 percent per annum in the last decade. Traditionally barley production in India consists
of feed-type, six-row varieties, unsuitable for malting. In the last few years a few good malting-type
barley varieties have been developed under public-private breeding programs, which are gradually
replacing feed barley. Trade sources report that some malting and brewing companies have started
contract farming of malting barley in Rajasthan, Punjab and Haryana.
Several Indian seed companies and public sector research institutions are working on the development
of various genetically engineered (GE) crops, including corn and sorghum. While public opinion of GE
crops has been generally ambivalent, the regulatory policy environment has been regressive in the last
few years. Several anti-biotech environmental and consumer groups have been running aggressive and
sustained campaigns against GE crops and products in India. See GAIN report IN3083 for further
information on agricultural biotechnology in India.

Consumption:
Coarse grain consumption in MY 2014/15 is forecast to increase to 38.6 MMT compared to 37.0 MMT
in MY 2013/14 on expected higher domestic production and strong demand from animal feed and
industrial users on expected low prices. With corn prices declining since the beginning of MY 2013/14,
there has been a strong resurgence in demand for corn and other coarse grains by poultry and animal
feed sector and industrial users (starch, ethanol). Given sufficient domestic supplies, demand from
these sectors is likely to remain strong in MY 2014/15 assuming no major change in the current price
and economic growth environment.
Food use accounts for a major share of consumption of sorghum, millet, and barley, while corn is
increasingly being used for feed and industrial use, particularly poultry feed and starch. Some new
barley varieties are being used for brewing (around 600,000 metric tons).
Traditionally, coarse cereals were the staple diet of Indians. Since early 1970s, coarse cereals have been
increasingly replaced by rice and wheat due to genetic improvement (Green Revolution) and the
government’s focus on these two crops for food security. Economic growth has also led to a steady
shift away from coarse grains as they are perceived as inferior to rice and wheat by consumers with
rising income levels. Nevertheless, coarse grains remain the staple diet for a large section of the
subsistence farmers and rural poor in growing areas. Consumption of coarse grains is also improving
among particularly “health conscious” and diabetes-prone Indians for their richer nutrient and fiber
contents.
Growing demand from the animal feed (poultry) and industrial starch sectors continues to fuel
consumption of corn. After two consecutive slowdown years, the poultry industry has bounced back in
MY 2013/14 with improved profit margins due to relatively low corn prices and stable poultry product
prices. Assuming stable price parity, corn demand from the poultry industry is expected to grow by 12
percent in MY 2013/14 and 8 percent in MY 2014/15. Corn demand for starch, mainly used by the
textile industry, has also recovered strongly on improved demand resulting from a rebound of the textile
industry following MY2012/13’s slowdown. In MY 2014/15, more than half of corn consumption will
go for feed use (10.8 MMT), primarily for poultry feed, with about 1.8 MMT consumed by the starch
industry, about 1.2 MMT for alcohol and other industrial use, and the balance for food.
Sorghum and millet are largely used for food while inferior quality products (rain damaged) go for
cattle feed. The high tannin content of Indian sorghum restricts its use in poultry rations, but its use in
the production of spirits, industrial alcohol, and starch is reportedly increasing. India’s domestic ethanol
program is based on molasses, a sugar industry byproduct, as feed stock, and does not allow use of
cereal grains for producing ethanol for fuel. Consequently, the domestic ethanol program does not
affect the domestic market for food, feed and trade in cereal grains and their byproducts.
Prices
Despite strong domestic demand, corn prices have declined in MY 2012/13 on weak international prices
and strong domestic supplies.

Source: Agmarket News (http://agmarkweb.dacnet.ic.in), Ministry of Agriculture, GOI
Corn prices across the major markets in the first week of February 2013 ranged from INR 11,800 ($190)
to INR 13,250 ($213) per metric ton, about 5 percent lower than previous-year prices during the
corresponding period. Prices of other coarse grains have been higher on lower production. National
average sorghum prices in the first week of February 2013 were estimated at INR 18,300 ($295) per
metric ton, about 7 percent higher than last year, and pearl millet prices at INR15,600 ($251) per metric
ton, about 24 percent over last year.
Trade:
India’s corn exports in MY 2014/15 are forecast lower at 2.5 million tons on expected strong domestic
demand. Typically Indian corn is discounted for quality vis-à-vis other origins and export volumes
largely depend on the price competitiveness of Indian corn in the global market. Consequently, any
significant improvement in international corn prices or weakening of the value of Indian rupee may
improve the export prospects. India exports most of its corn to southeast Asian countries like Vietnam,
Indonesia, Malaysia, Taiwan, and neighboring Bangladesh. Occasionally, India exports small quantities
of sorghum and barley, largely to neighboring countries and the Middle East. Relatively tight domestic
supplies are likely to limit exports of sorghum and barley in MY 2014/15 to small quantities.
After two consecutive years of record corn exports, MY 2012/13 exports are estimated to decline to 3
MMT on relatively weak export demand and strong domestic off take. Market sources report that
Indian corn is barely competitive in the global market due to weak international prices. Provisional
export figures compiled by a private source for the first two months of MY 2013/14 (November-
December 2013) estimate corn shipments at about 440,000 metric tons compared to 780,000 metric tons
during the corresponding period last year. Market sources report that export prospects are likely to
improve after the harvest of rabi corn in March, bringing down domestic prices. India’s ability to ship
in relatively small lots is also an important selling factor in neighboring and south Asian markets.

Assuming stable global corn prices for the remaining part of the season, MY 2013/14 exports are
estimated to reach 3.0 million tons, more than 36 percent lower than last year’s record exports.
Policy
Production:
The GOI production policy and programs for coarse grains are nominally the same as for wheat and
rice, but with significantly lower attention and budgetary support. The government’s minimum support
price (MSP) procurement program and food distribution program through public distribution system
(PDS) for coarse grains are very limited and less effective than those for rice and wheat. During the
current season, the government has had to intermittently undertake MSP operations in the states of
Andhra Pradesh, Karnataka and Maharashtra, procuring about 500,000 metric tons of corn by end of
January 2014.
Unlike wheat and rice, the government does not typically maintain a buffer stock of coarse grains to
keep prices in check. The GOI does not allow use of food grains, including coarse cereals, for ethanol
for fuel. Efforts to produce ethanol from other feed stocks like sweet sorghum stover and crop waste are
still in an experimental stage.
The current biotech regulatory policy environment continues to hamper approval of genetically
engineered corn, even though some of the events are at an advanced stage of regulatory approval. Most
biotech events in other coarse grains are still at the developmental stage, and are yet to be submitted for
regulatory approval.
Trade:
Currently, GOI imposes no restrictions on exports of corn, millet, sorghum, or barley, and imports are
allowed subject to the effective import duty and phytosanitary conditions specified in the Plant
Quarantine (Regulation of Imports into India) Order 2003. The basic import duty on sorghum and
millet is 50 percent, and zero for barley. Imports of corn outside the TRQ are subject to a 50-percent
import duty.
India’s existing trade policy allows imports of corn under a tariff rate quota (TRQ) of 500,000 metric
tons at zero duty. To import corn under TRQ at zero duty, the importer must obtain a Tariff Rate Quota
Allocation Certificate issued by the Directorate General of Foreign Trade (DGFT). The Certificate is
issued in accordance with the procedure as may be specified by the EXIM Facilitation Committee from
time to time through a public notice. However, TRQ imports are managed only through specified state
trading enterprises and cooperatives, and thus are not accessible to private trade. The TRQ was not
utilized in 2012/13 and imports under TRQ are unlikely in the coming marketing year.
The GOI’s phytosanitary requirement pertaining to the limitation on weed seeds, ergot and other SPS
issues, and absence of approval of biotechnology events have effectively banned U.S. coarse grain
exports to India, including corn and barley. Imports of any biotech product, including genetically
modified corn and products, are subject to approval by India’s biotech regulatory agency, the Genetic

Engineering Appraisal Committee (GEAC). The GEAC has approved no biotech coarse grains or
byproducts for import.
Marketing
India currently does not import corn or other coarse grains. However, the growth of the poultry and
starch industries may eventually create demand for imported corn in next five to ten years, while growth
in the brewing industry may fuel demand for malting barley in near future.
Production, Supply, and Demand Data Statistics:
Table 10. India: Commodity, Corn, PSD (Area in Thousand Hectares, Quantity in Thousand Metric Tons, Yield in MT/Hectare)
Corn
India
2012/2013 2013/2014 2014/2015
Market Year Begin: Nov
2012 Market Year Begin: Nov
2013 Market Year Bein: Nov
2014
USDA
Official New Post
USDA
Official New Post
USDA
Official New Post
Area Harvested 8,710 8,910 9,400 9,500 9,000
Beginning
Stocks 570 570 619 619 1,529
Production 22,230 22,230 23,000 23,000 22,000
MY Imports 10 10 10 10 10
TY Imports 10 10 10 10 10
TY Imp. from
U.S. 0 0 0 0 0
Total Supply 22,810 22,810 23,629 23,629 23,539
MY Exports 4,691 4,691 3,000 3,000 2,500
TY Exports 4,768 4,768 3,000 3,000 2,500
Feed and
Residual 8,900 8,900 10,100 10,100 10,800
FSI
Consumption 8,600 8,600 9,000 9,000 9,500
Total
Consumption 17,500 17,500 19,100 19,100 20,300
Ending Stocks 619 619 1,529 1,529 739
Total
Distribution 22,810 22,810 23,629 23,629 23,539
Yield 3. 2.4949 2. 2.4211 2.4444

Table 11. India: Commodity, Corn, Prices Table
Prices In Rupees per uom Metric ton
Year 2011 2012 2013 %Change
Jan 9,676 11,696 13,084 11.9
Feb 9,902 10,952 13,405 22.4
Mar 10,308 11,137 13,368 20.0
Apr 10,976 10,928 12,977 18.8
May 10,755 10,794 12,555 16.3
Jun 10,856 10,439 13,093 25.4
Jul 10,476 11,337 14,181 25.1
Aug 10,951 11,728 12,714 8.4
Sep 10,155 12,025 13,716 14.1
Oct 9,729 11,826 13,237 11.9
Nov 10,277 12,537 13,634 8.7
Dec 10,464 13,243 13,005 -1.8
Exchange Rate 62.1 Local Currency/US$
Date of Quote 02/08/14 MM/DD/YYYY
National Average Monthly Wholesale Prices of Corn Source: Agmarket News (http://agmarkweb.dacnet.ic.in), Ministry of Agriculture, GOI.
Table 12. India: Commodity, Sorghum, PSD (Area in Thousand Hectares, Quantity in Thousand Metric Tons, Yield in MT/Hectare)
Sorghum India
2012/2013 2013/2014 2014/2015
Market Year Begin: Nov
2012 Market Year Begin: Nov
2013 Market Year Begin: Nov
2014
USDA
Official New Post
USDA
Official New Post
USDA
Official New Post
Area Harvested 6,300 6,300 6,000 5,900 6,200
Beginning Stocks 223 223 145 145 125
Production 5,300 5,300 5,500 5,200 6,000
MY Imports 0 0 0 0 0
TY Imports 0 0 0 0 0
TY Imp. from U.S. 0 0 0 0 0
Total Supply 5,523 5,523 5,645 5,345 6,125
MY Exports 228 228 50 20 50
TY Exports 231 231 50 20 50
Feed and Residual 750 750 750 700 800
FSI Consumption 4,400 4,400 4,700 4,500 5,000
Total Consumption 5,150 5,150 5,450 5,200 5,800
Ending Stocks 145 145 145 125 275
Total Distribution 5,523 5,523 5,645 5,345 6,125
Yield 1. 0.8413 1. 0.8814 0.9677

Table 13. India: Commodity, Millet, PSD (Area in Thousand Hectares, Quantity in Thousand Metric Tons, Yield in MT/Hectare)
Millet
India
2012/2013 2013/2014 2014/2015
Market Year Begin: Nov
2012 Market Year Begin: Nov
2013 Market Year Begin: Nov
2014
USDA
Official New Post
USDA
Official New Post
USDA
Official New Post
Area Harvested 9,100 9,100 10,000 9,200 10,500
Beginning Stocks 790 790 450 450 350
Production 10,760 10,760 11,500 10,600 12,000
MY Imports 0 0 0 0 0
TY Imports 0 0 0 0 0
TY Imp. from U.S. 0 0 0 0 0
Total Supply 11,550 11,550 11,950 11,050 12,350
MY Exports 0 0 0 0 0
TY Exports 0 0 0 0 0
Feed and Residual 1,400 1,400 1,500 1,200 1,500
FSI Consumption 9,700 9,700 10,000 9,500 10,000
Total Consumption 11,100 11,100 11,500 10,700 11,500
Ending Stocks 450 450 450 350 850
Total Distribution 11,550 11,550 11,950 11,050 12,350
Yield 1. 1.1824 1. 1.1522 1.1429
Table 14. India: Commodity, Barley, PSD (Area in Thousand Hectares, Quantity in Thousand Metric Tons, Yield in MT/Hectare)
Barley
India
2012/2013 2013/2014 2014/2015
Market Year Begin: Apr
2012 Market Year Begin: Apr
2013 Market Year Begin: Apr
2014
USDA
Official New Post
USDA
Official New Post
USDA
Official New Post
Area Harvested 770 770 780 790 810
Beginning Stocks 242 242 110 110 200
Production 1,620 1,620 1,740 1,740 1,700
MY Imports 40 40 50 50 50
TY Imports 50 50 50 50 50
TY Imp. from U.S. 0 0 0 0 0
Total Supply 1,902 1,902 1,900 1,900 1,950
MY Exports 267 267 350 100 100
TY Exports 542 542 50 100 100
Feed and Residual 200 200 200 200 250
FSI Consumption 1,325 1,325 1,250 1,400 1,500
Total Consumption 1,525 1,525 1,450 1,600 1,750
Ending Stocks 110 110 100 200 100
Total Distribution 1,902 1,902 1,900 1,900 1,950
Yield 2. 2.1039 2. 2.2025 2.0988
PULSES

Production
India is the world’s largest producer, consumer and importer of pulses. India’s MY 2014/15
(April/March) pulse production is forecast at 18.0 MMT, marginally lower than MY 2013/14 record
production of 18.5 MMT. Most states received relatively higher monsoon rains during September-
October coinciding with the harvest of kharif pulses (mostly pigeon pea, mung beans, and black
matpe). Consequently, production of kharif pulses is estimated lower at 5.8 MMT compared to last
year’s 5.9 MMT on harvest losses due to untimely rains. According to the preliminary planting figures
from the Ministry of Agriculture, area under rabi pulses (mainly chickpeas, lentils, and peas) through
January 2014 is estimated higher at 15.6 million hectares compared to 14.9 million hectares last year.
Soil moisture and weather conditions have been generally favorable in most growing areas for planting
of pulses. However, market sources reports shift of traditional chickpea growing areas with some
irrigation facilities to wheat due to relatively weak chickpea prices. Nevertheless, good monsoon rains
during September-October has supported overall planting of rabi pulses, including chickpeas, as
additional traditionally fallow land has been brought under cultivation on sufficient soil moisture at the
time of planting. The area shift in chickpea acreage is likely to result in overall lower yield than last
year’s record. Consequently, rabi pulse production is estimated lower at 12.2 MMT compared to last
year’s record 12.5 MMT.
Source: Ministry of Agriculture, GOI; and FAS/New Delhi estimates for MY 2014/15
Pulses are grown both in the kharif and rabi seasons with more than two thirds produced in the latter.
Most pulses are grown under rainfed conditions (85 percent) using subsistence agricultural practices.
Consequently, pulse production largely depends on the monsoon, winter rains and temperature
conditions. Limited varietal improvements, low resilience to soil moisture stress, poor pest resistance,
and low input use have contributed to low yields. Madhya Pradesh, Uttar Pradesh, Maharashtra, Andhra
Pradesh, and Karnataka together account for about 70 percent of the country’s pulse production, with
Madhya Pradesh contributing more than 25 percent.
In the last few years, the government has raised the minimum support prices (MSPs) for pulses
relatively higher than for rice and wheat (see Table 18) to encourage a production shift away from rice
and wheat. The government also has various other programs to support pulse development (see policy
section). Despite the government’s recent measures, pulse cultivation in India has been unable to
compete with less risky crops like wheat and rice, traditionally the GOI’s focus crop for food security.
Pulse production has not been attractive to farmers due to a largely ineffective procurement policy and
historically low government support of improved production technology vis-à-vis wheat and rice.
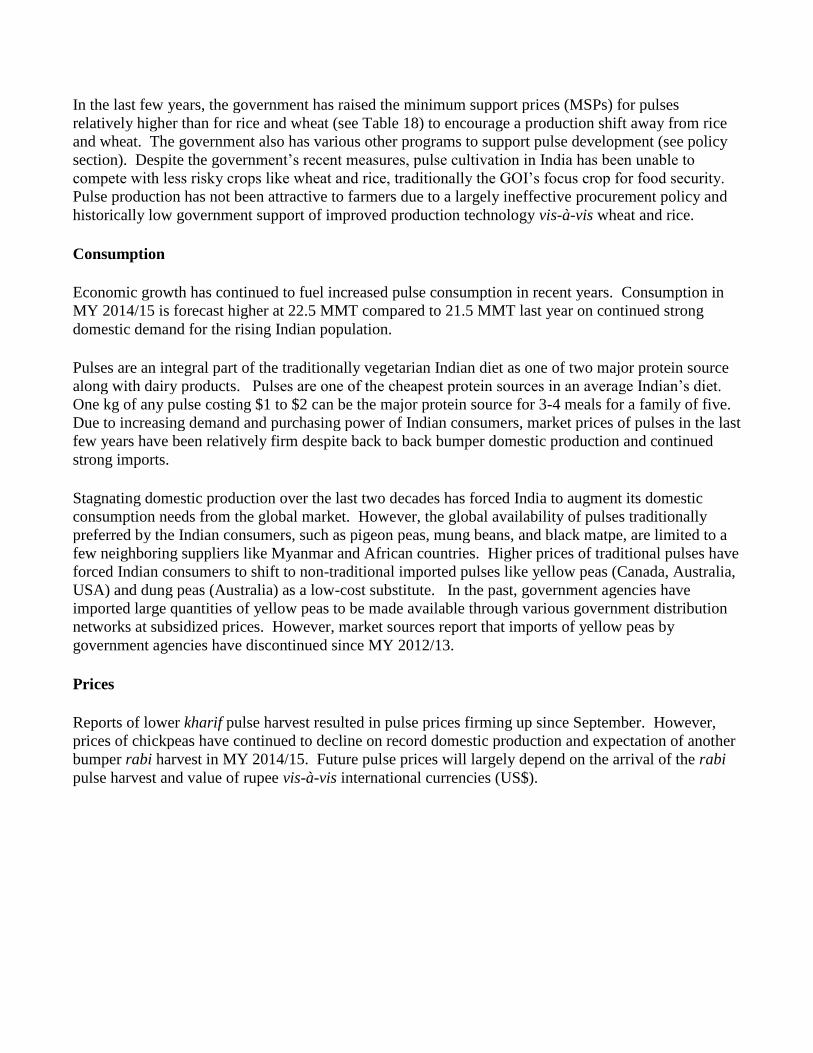
Consumption
Economic growth has continued to fuel increased pulse consumption in recent years. Consumption in
MY 2014/15 is forecast higher at 22.5 MMT compared to 21.5 MMT last year on continued strong
domestic demand for the rising Indian population.
Pulses are an integral part of the traditionally vegetarian Indian diet as one of two major protein source
along with dairy products. Pulses are one of the cheapest protein sources in an average Indian’s diet.
One kg of any pulse costing $1 to $2 can be the major protein source for 3-4 meals for a family of five.
Due to increasing demand and purchasing power of Indian consumers, market prices of pulses in the last
few years have been relatively firm despite back to back bumper domestic production and continued
strong imports.
Stagnating domestic production over the last two decades has forced India to augment its domestic
consumption needs from the global market. However, the global availability of pulses traditionally
preferred by the Indian consumers, such as pigeon peas, mung beans, and black matpe, are limited to a
few neighboring suppliers like Myanmar and African countries. Higher prices of traditional pulses have
forced Indian consumers to shift to non-traditional imported pulses like yellow peas (Canada, Australia,
USA) and dung peas (Australia) as a low-cost substitute. In the past, government agencies have
imported large quantities of yellow peas to be made available through various government distribution
networks at subsidized prices. However, market sources report that imports of yellow peas by
government agencies have discontinued since MY 2012/13.
Prices
Reports of lower kharif pulse harvest resulted in pulse prices firming up since September. However,
prices of chickpeas have continued to decline on record domestic production and expectation of another
bumper rabi harvest in MY 2014/15. Future pulse prices will largely depend on the arrival of the rabi
pulse harvest and value of rupee vis-à-vis international currencies (US$).

Source: Agmarket News (http://agmarkweb.dacnet.ic.in), Ministry of Agriculture, GOI.
Trade
Continued strong domestic demand fueled India’s pulse imports in MY 2012/13 to a record 4.1 MMT
compared to 3.6 MMT in the previous year and the previous record of 3.8 MMT in MY 2009/10.
Imports in MY 2013/14 are estimated lower at 3.2 MMT on improved domestic supplies (record
production) and higher cost of imports (depreciation in the value of Indian rupee). Imports are forecast
to recover in MY 2014/15 to 3.6 MMT on continued strong domestic demand provided the value of the
Indian rupee and international prices remain stable.
The value of the Indian rupee declined sharply from May 2013 (INR 52-53/USD) to a historic low in
August 2013 (INR 67-68/USD). Since then the Indian rupee has recovered and stabilized at around INR
62-63/USD, which is about 20 percent lower than the average value of the Indian rupee in MY 2012/13
(INR 53/USD). Preliminary official trade data for the first eight months of MY 2013/14 estimate pulse
imports at 1.99 MMT compared to 2.47 MMT during the same period last year.
Table 15. India: Imports of Pulses by Type and Major Suppliers (Quantity in Thousand Metric

Tons)
Type 2010/11 2011/12 2012/13 Major Suppliers
Dry Peas 1,504.6 2,039.7 1,370.3 Canada, Russia, USA, Australia, France,
Ukraine
Pigeon Peas1 346.1 Na Na
Myanmar, Tanzania, Mozambique, China,
Malawi
Mung Beans 432.0 409.3 642.8 Myanmar, Australia, Uzbekistan, Tanzania,
Kenya
Chickpeas 100.7 206.5 697.6 Australia, Russia. Tanzania, Myanmar,
Mexico, USA
Lentils 161.2 117.9 506.3 Canada, Australia, USA, Myanmar, Turkey
Kidney Beans 105.6 63.3 147.0 China, Myanmar, Ethiopia, Kenya,
Madagascar
Other Beans 73.0 131.1 187.4 Myanmar, Brazil, Madagascar, Tanzania,
France
Other Dried
Legumes 127.7 658.3 506.4 Myanmar, Tanzania, Malawi, Mozambique,
Kenya
Total 2,851.0 3,626.1 4,057.9 Source: Directorate General of Commercial Intelligence, GOI 1 Breakout for imports of pigeon pea not available for MY 2012/13 and MY 2013/14, and is included in
other dried legumes.
Yellow pea imports reached a record high of 2.04 MMT in MY 2011/12, largely driven by government
imports. With the government imports declining sharply in last two years, yellow pea imports have
moderated since MY 2012/13. While a breakout of MY 2013/14 pulse imports is not available, market
sources report that yellow peas continue to account for a dominant share as they are relatively cheaper
vis-a-vis other pulses. However, imports of chickpea are likely to decline sharply on weak domestic
prices.
India imports dry green peas, yellow peas, lentils and garbanzo beans (chickpeas) from the United
States, which are typically higher priced. India is the second largest export market for U.S. pulses after
Mexico. Imports of pulses from the United States had grown strongly from 2005 to 2009, reaching a
record level of 224,250 metric tons in CY 2009, declining to 84,143 metric tons in CY 2011, and
subsequently recovering to 181,221 metric tons in CY 2013.
Policy
Production:
Traditionally, the GOI’s food grain production programs have focused on rice and wheat, with limited
investment in pulses. Stagnating domestic production, rising imports and escalating domestic prices
have forced the government to assess strategies for enhancing domestic production of pulses. In 2010,
the government launched the Accelerated Pulse Development Program as part of the National Food
Security Mission. Pulses were included in the government’s National Food Security Mission. The
government also launched under the National Agriculture Development Program (Rashtriya Krishi

Vikas Yojna or RKVY) a focus program in targeted 60,000 villages in unirrigated areas for increasing
pulse crop productivity and strengthening market linkages.
Market Support/Intervention:
Over the last five years, the government raised the MSP of various pulse crops by 70 to 115 percent
over MY 2008/09 levels to promote pulse cultivation over rice and wheat (see Table 18). The Indian
government has also disallowed futures trading in pigeon pea and mung beans until further notice under
the erroneous assumption that futures contract trading is responsible for the high prices of pulses.
Several state governments periodically impose stocks limits on pulses held by the private trade in an
effort to control prices.
The GOI has authorized government agencies/trading companies such as National Agriculture
Marketing Federation (NAFED), State Trading Corporation (STC), Project and Equipment Corporation
(PEC) Ltd., and Minerals and Metals Trading Corporation (MMTC) to import pulses for sale in the
domestic market at subsidized prices. In October 2012, the government approved distribution of
imported pulses through the PDS with a subsidy of INR 20 per kilogram ($320 per ton) to the
designated importing agencies. However, market sources report negligible imports under the program
to date.
Trade:
In June 2006, the GOI exempted pulses from the applicable 10-percent import duty through March 31,
2009, to control prices in the domestic market. This exemption has been periodically extended and is
currently applicable till March 31, 2014. At the same time, the GOI also imposed a ban on the export of
pulses, with the exception of large chickpeas or garbanzos, called Kabuli chana in Hindi, which has
been periodically extended and is currently applicable till March 31, 2014. The government is likely to
extend the current export bans and import tariff at zero duty for another year, i.e., until March 31, 2015.
Effective January 1, 2004, pulse (including chickpeas, peas and lentils) imports from all origins to India
were subject to fumigation by methyl bromide at the port of loading, apparently to protect domestic
production from stem and bulb nematode, pea cyst nematode, and bruchids, per the Plant Quarantine
Regulation of Import into India Order, 2003. As methyl bromide is being phased out due to
environmental concerns in most countries, it is increasingly difficult and costly to fumigate pulses with
methyl bromide at the port of origin in many countries. However, the GOI has allowed fumigation by
methyl bromide at the port of arrival in India on an ad hoc basis, granting periodic extensions. The
GOI has granted the methyl bromide fumigation on arrival arrangement for pulses coming from the
United States up to March 31, 2014, which is likely to be extended further.
Marketing
Due to stagnant domestic production and limited scope for increasing area under pulses, India will
continue to import pulses in coming years. However, India is a ‘price buyer’ of pulses with some
resistance to the premium for higher U.S. quality products, especially when lower-cost pulses are
available from other competitors. Key to improving the U.S. position in the Indian pulse market is
expanding the supply of yellow peas and chickpeas at competitive prices. Most U.S. type beans (navy

beans, black beans, pintos, and lima beans) are relatively unknown in India, but can be introduced if
price competitive.
The GOI is encouraging Indian companies to explore opportunities to produce pulses overseas, either
through contract farming or by purchasing/leasing land in several African and South American
countries. In the absence of any crop specific incentives by the government, the companies involved in
overseas agriculture are likely to take planting and marketing decisions based on international market
prices.
Statistical Tables
Table 16. India: Commodity, Pulses, PSD (Area in Thousand Hectares, Quantity in Thousand Metric Tons, Yield in MT/Hectare)
Pulses
India
2011/2012 2012/2013 2013/2014 2014/15
Market Year
Begin: Apr
2011
Market
Year Begin:
Apr 2012
Market Year
Begin: Apr
2013
Market Year
Begin: Apr
2013
Post
Estimate Post
Estimate Post Estimate
Post
Estimate
Area Harvested 26,280 25,665 25,200 26,350
Beginning Stocks 3,011 5,877 6,525 6,613
Production 18,240 17,090 18,450 18,000
MY Imports 3,626 4,058 3,200 3,600
Total Supply 24,877 27,025 28,175 28,213
MY Exports 0 0 0 0
Feed and Residual 0 0 0 0
FSI Consumption 19,000 20,500 21,500 22,500
Total Consumption 19,000 20,500 21,500 22,500
Ending Stocks 5,877 6,525 6,675 5,713
Total Distribution 24,877 27,025 28,175 28,213
Yield 0.6941 0.6659 0.7321 0.6831
Table 17. India: Production of Pulses by Type (Quantity in Thousand Metric Tons)
Pulse\Year 2001/02 2005/06 2009/10 2010/11 2011/12 2012/13 2013/14 2014/15
Chick Pea 3.85 5.47 7.06 7.48 8.22 7.70 8.88 8.50
Pigeon Pea 2.25 2.35 2.27 2.46 2.86 2.65 3.07 3.00
Black Matpe 1.29 1.33 1.17 1.23 1.76 1.77 1.90 1.80
Mung Beans 1.03 1.06 1.04 0.69 1.80 1.63 1.20 1.30
Lentils 0.92 0.99 0.95 1.03 0.94 0.90 1.02 1.00
Others 1.73 1.93 2.08 1.77 2.66 2.44 2.38 2.40
Total 11.07 13.13 14.57 14.66 18.24 17.09 18.45 17.00
Source: Ministry of Agriculture, GOI; and FAS/New Delhi estimates for MY 2014/15

Table 18. India: Minimum Support Prices for Major Food Grains (INR/Metric ton)
Crop 2008/09 2009/10 2010/11 2011/12 2012/13 2013/14
Rice, paddy (common) 9,000 10,000 10,000 10,800 12,500 13,100
Rice, paddy (Grade A) 9,300 10,300 10,300 11,100 12,800 13,450
Wheat 10,000 10,800 11,000 11,200 12,850 13,500
Corn 8,400 8,400 8,800 9,800 11,750 13,100
Sorghum (hybrid) 8,400 8,400 8,800 9,800 15,000 15,000
Pearl millet 8,400 8,400 8,800 9,800 11,750 13,100
Spiked millet 9,150 9,150 9,650 10,500 15,000 15,000
Barley 6,500 6,800 7,500 7,800 9,800 9,800
Chickpeas 16,000 17,300 17,600 21,000 28,000 30,000
Lentils 17,000 18,700 18,700 22,500 28,000 29,000
Pigeon peas 20,000 23,000 30,000 32,000 38,500 43,000
Mung beans 25,200 27,600 31,700 35,000 44,000 45,000
Black matpe 25,200 25,200 29,000 33,000 43,000 43,000
Exchange Rate – INR /USD 45.99 47.42 45.58 51.00 53.0 62.0
Source: Department of Agriculture and Cooperation, Ministry of Agriculture, GOI
GUAR BEAN
Guar bean, also known as cluster bean (Cyamopsis tertragonoloba), has turned into a ‘miracle crop’ for
Indian farmers. Guar products emerged as India’s single largest agricultural export in 2012, surpassing
rice. With about 80 percent of total exports destined for the United States, guar gum has emerged as
India’s largest single export to the United States, surpassing the perennial leader, jewelry. India is the
world’s largest producer of guar bean and exporter of guar gum and other products, accounting for
nearly 80 percent of global share.
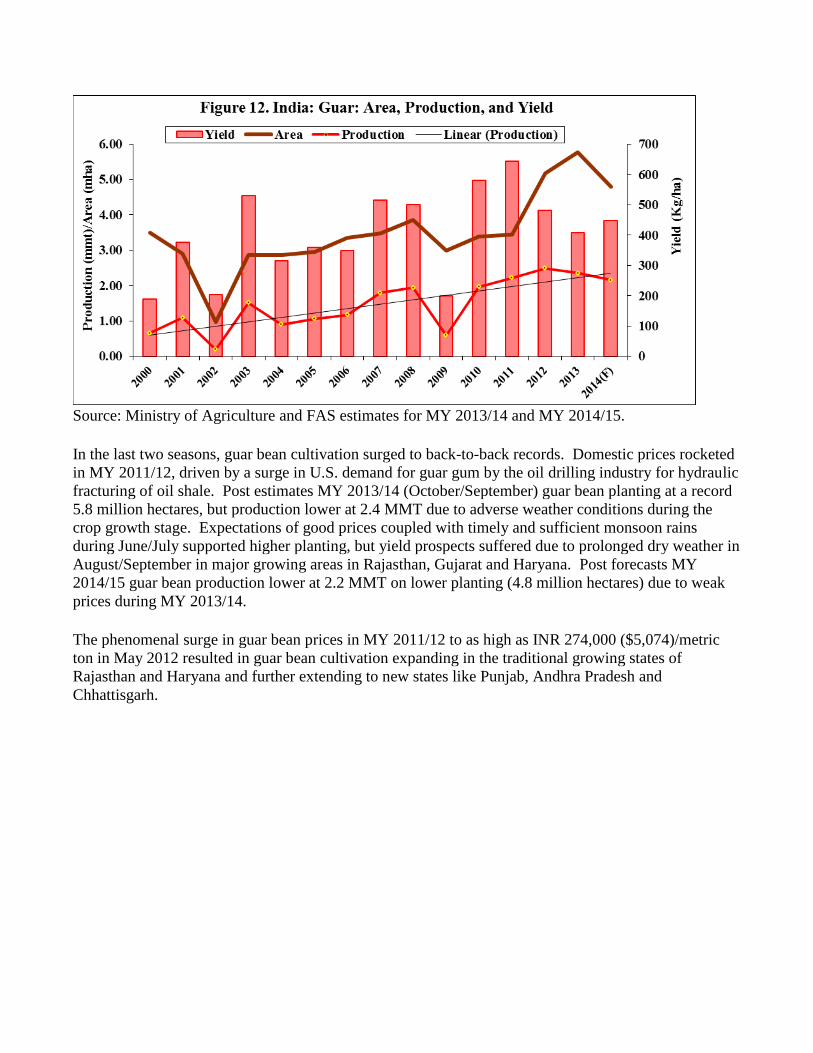
Source: Ministry of Agriculture and FAS estimates for MY 2013/14 and MY 2014/15.
In the last two seasons, guar bean cultivation surged to back-to-back records. Domestic prices rocketed
in MY 2011/12, driven by a surge in U.S. demand for guar gum by the oil drilling industry for hydraulic
fracturing of oil shale. Post estimates MY 2013/14 (October/September) guar bean planting at a record
5.8 million hectares, but production lower at 2.4 MMT due to adverse weather conditions during the
crop growth stage. Expectations of good prices coupled with timely and sufficient monsoon rains
during June/July supported higher planting, but yield prospects suffered due to prolonged dry weather in
August/September in major growing areas in Rajasthan, Gujarat and Haryana. Post forecasts MY
2014/15 guar bean production lower at 2.2 MMT on lower planting (4.8 million hectares) due to weak
prices during MY 2013/14.
The phenomenal surge in guar bean prices in MY 2011/12 to as high as INR 274,000 ($5,074)/metric
ton in May 2012 resulted in guar bean cultivation expanding in the traditional growing states of
Rajasthan and Haryana and further extending to new states like Punjab, Andhra Pradesh and
Chhattisgarh.

Source: Agmarket News (http://agmarkweb.dacnet.ic.in), Ministry of Agriculture, GOI.
Although the prices moderated significantly in MY 2012/13, speculation on higher prices encouraged
farmers to shift more area from competing crops (cotton, coarse grains and pulses) to guar in MY
2013/14. However, prices have continued to decline in MY 2013/14 on weak export demand due to
stocks buildup in the major importing country, the United States. Assuming prices remain weak
through June 2014 at the time of planting for the next crop, some farmers are likely to revert back to
planting competing crops, particularly in the non-traditional areas. In the traditional guar growing areas,
farmers are likely to continue planting guar bean as current price levels provide sufficient returns due to
the low cost of cultivation.