Embed Size (px)
Citation preview
For Private Circulation Only. FOR IMPORTANT INFORMATION ABOUT KOTAK SECURITIES’ RATING SYSTEM AND OTHER DISCLOSURES. REFER TO THE END OF THIS MATERIAL.
INDIA DAILYApril 18, 2013 India 17-Apr 1-day1-mo 3-mo
Sensex 18,731 (0.1) (2.9) (6.5)
Nifty 5,689 (0.0) (2.5) (6.2)
Global/Regional indices
Dow Jones 14,619 (0.9) 1.2 7.1
Nasdaq Composite 3,205 (1.8) (1.0) 2.2
FTSE 6,244 (1.0) (3.3) 1.5
Nikkie 13,228 (1.2) 8.2 21.2
Hang Seng 21,446 (0.6) (2.9) (9.1)
KOSPI 1,911 (0.7) (2.9) (3.9)
Value traded – India
Cash (NSE+BSE) 153 123 133
Derivatives (NSE) 2,009 1,642 1,327
Deri. open interest 1,529 1,467 1,546
Forex/money market
Change, basis points
17-Apr 1-day 1-mo 3-mo
Rs/US$ 54.3 5 13 52
10yr govt bond, % 7.9 - (8) (5)
Net investment (US$mn)
16-Apr MTD CYTD
FIIs 118 66 10,216
MFs (19) (17) (1,325)
Top movers
Change, %
Best performers 17-Apr 1-day 1-mo 3-mo
SUNP IN Equity 914.3 2.8 9.8 28.4
UNSP IN Equity 2155.4 6.0 8.0 19.6
LPC IN Equity 672.4 2.2 9.5 14.3
GMRI IN Equity 21.9 (1.8) 3.3 10.4
ESOIL IN Equity 84.9 4.6 1.8 9.6
Worst performers
MMTC IN Equity 215.0 (0.4) (25.6) (64.8)
HDIL IN Equity 48.8 (0.8) (23.9) (59.8)
EDSL IN Equity 58.8 1.5 (24.7) (56.9)
IVRC IN Equity 20.3 (1.7) (18.2) (52.7)
WLCO IN Equity 51.1 4.8 (1.7) (48.6)
Contents
Daily Alerts
Results
TCS: When good is not good enough
Good quarter - India business drives growth
Steady metrics - strong employee additions continue
Performance highlights the strengths of TCS but does not indicate improvement in spending
REDUCE rating stays; stock trades at expensive valuations
HCL Technologies: An effort-less growth
Good headline numbers but the devil lies in the details
Effort-less growth - headcount declines for the second consecutive quarter
Profitability is unsustainable with stretched core metrics
Maintain REDUCE rating; expect moderation in growth
YES Bank: No slowdown as yet; financial advisory contribution remains high
Financial markets continue to provide strong earnings support
Issues persist: Earnings to see deterioration while low tier-1 ratio is a key risk; maintain REDUCE
Financial advisory ~45% of PBT/non-interest income; transaction banking income subdued
Sector
Technology: Proposed US immigration bill - outcome uncertain, but impact very high
Key clauses impacting Indian IT names in the proposed US immigration bill
For private Circulation Only. FOR IMPORTANT INFORMATION ABOUT KOTAK SECURITIES’ RATING SYSTEM AND OTHER DISCLOSURES, REFER TO THE END OF THIS MATERIAL.
Good quarter—India business drives growth
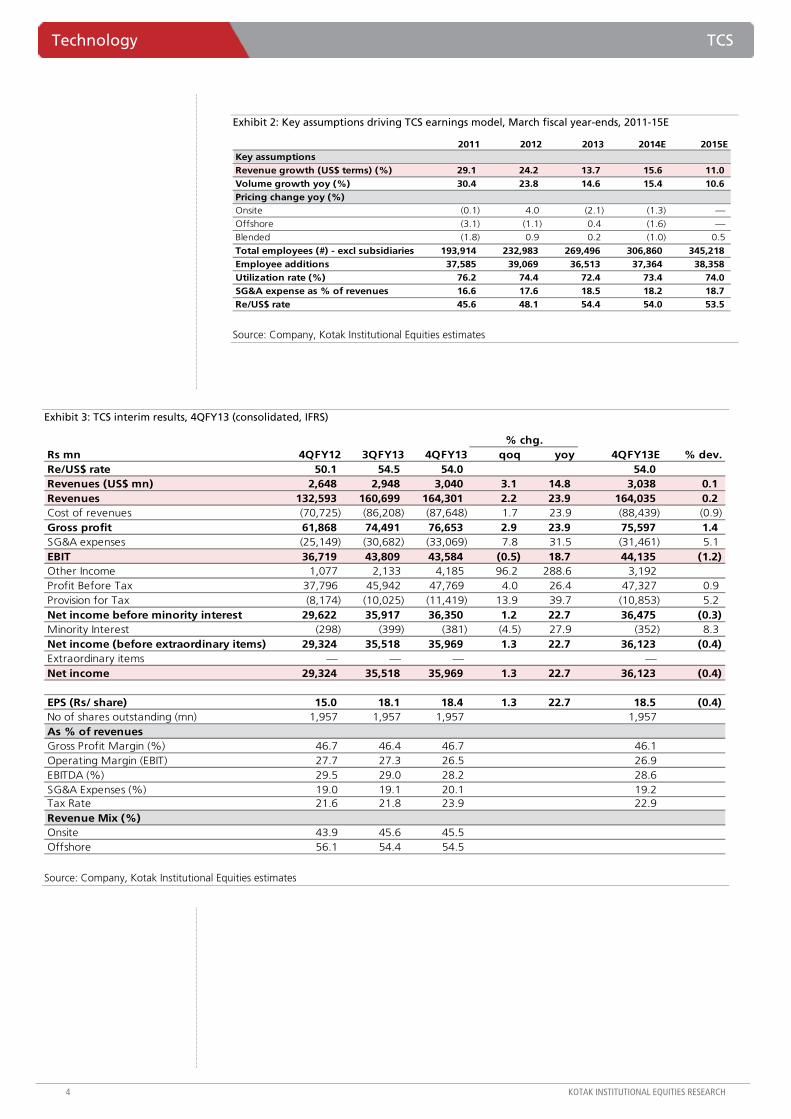
TCS delivered a good but in-line quarter with 3.1% sequential revenue growth to US$3.04 bn. Revenue growth was India-led with 19.4% qoq growth. The international business grew at a more modest 1.8% sequentially. EBIT margin declined 73 bps to 26.5% driven by 98 bps impact from proposal to settle class action suit in the State of California. Adjusted EBIT margin increased 25 bps qoq and down 20 bps on yoy comparison. Net income of Rs36 bn was helped by Rs1.24 bn of forex gain versus loss of Rs734 mn in 3QFY13.
Steady metrics—strong employee additions continue
Revenues involving equipment sale contributed 35% of incremental revenues for the quarter. Overall metrics were healthy—the company added 12,559 employees in the quarter. Growth was broad-based across verticals. Growth was strong across various services with the exception of consulting, asset leveraged solutions and business process outsourcing.
Performance highlights the strengths of TCS but does not indicate improvement in spending
The performance highlights the strength of execution but does not do enough to indicate a healthier spending environment. Modest growth in international business, decline in consulting revenues and weak performance/commentary of peers indicate that discretionary spending may not be as strong. The Street, on the other hand, has already assumed significant recovery in IT spending for 2013. This is captured in upgrades in estimates across the sector. Expect downgrades to start soon as reality sinks in of a not-so-good demand environment and competitive pressures.
REDUCE rating stays; stock trades at expensive valuations
We take stock of 4QFY13 performance and incorporate the Alti acquisition in our estimates, leading to 1% increase in revenue estimates, with organic revenue estimates unchanged. We cut FY2014E EPS estimate by 0.5% to Rs79.6 on account of higher tax rate. The stock trades at expensive 18.3X FY2014E earnings. TCS may be the best relative play in the sector but that does not guarantee absolute returns in a challenging growth environment with competitive pressures. We stay Cautious on TCS and Tier-1 IT.
TCS (TCS)
Technology
When good is not good enough. TCS delivered a steady quarter with 3.1% US$ revenue growth. Growth was led by the India geography that grew 19.4% qoq. TCS continues to excel with creditable performance at a time when peers are struggling. However, this may not be enough to drive absolute stock returns, especially in light of elevated expectations from TCS and challenges facing the industry. Valuations at 18X FY2014E earnings are full. We broadly maintain our estimates and REDUCE rating; TP increases marginally to Rs1,350 (from Rs1,320) on roll-over to June 2014 financials.
TCSStock data Forecasts/Valuations 2013 2014E 2015E
52-week range (Rs) (high,low) EPS (Rs) 71.3 79.6 87.4Market Cap. (Rs bn) 2,851.0 EPS growth (%) 31.2 11.7 9.8
Shareholding pattern (%) P/E (X) 20.4 18.3 16.7Promoters 74.0 Sales (Rs bn) 629.9 722.4 794.1FIIs 15.0 Net profits (Rs bn) 139.6 155.9 171.1MFs 1.1 EBITDA (Rs bn) 180.7 208.3 226.5
Price performance (%) 1M 3M 12M EV/EBITDA (X) 15.2 12.8 11.4Absolute (7.2) 6.9 34.4 ROE (%) 38.0 34.5 31.8Rel. to BSE-30 (3.8) 14.0 24.5 Div. Yield (%) 1.5 2.2 2.4
Company data and valuation summary
1,598-1,040
REDUCE
APRIL 18, 2013
RESULT
Coverage view: Cautious
Price (Rs): 1,457
Target price (Rs): 1,350
BSE-30: 18,731
TCS Technology
KOTAK INSTITUTIONAL EQUITIES RESEARCH 3
Management indicates recovery in discretionary spending
TCS management indicated a better outlook for CY2013 led by better clarity on spending by clients, with little delay in decision making. The management highlighted that CY2013 budgeting cycle had begun with more certainty than in CY2012, and more importantly, with greater chance of budgets translating into discretionary spends. The management is confident of (1) performing better than Nasscom’s 12-14% growth outlook for FY2014E and (2) protecting profitability at 27% even after absorbing lower-margin Alti acquisition.
FY2013 roundup—strong market share gains continue
TCS has grown 13.7% in revenues in FY2013 to US$11.57 bn, adding US$1.4 bn in absolute revenues during the year. Outperforming India-listed peers by 1-8% on materially higher revenue base is encouraging and highlights the strength of the execution engine. More heartening was strengthening of leadership in core verticals and impressive growth in new service offerings. Growth rates did slow down though to 13.7% from 24.2% in FY2012. EBIT margin declined 65 bps despite significant currency tailwind of 530 bps (Re depreciation of 13.3%). The company generated FCF of Rs97 bn in FY2013.
Other key result highlights
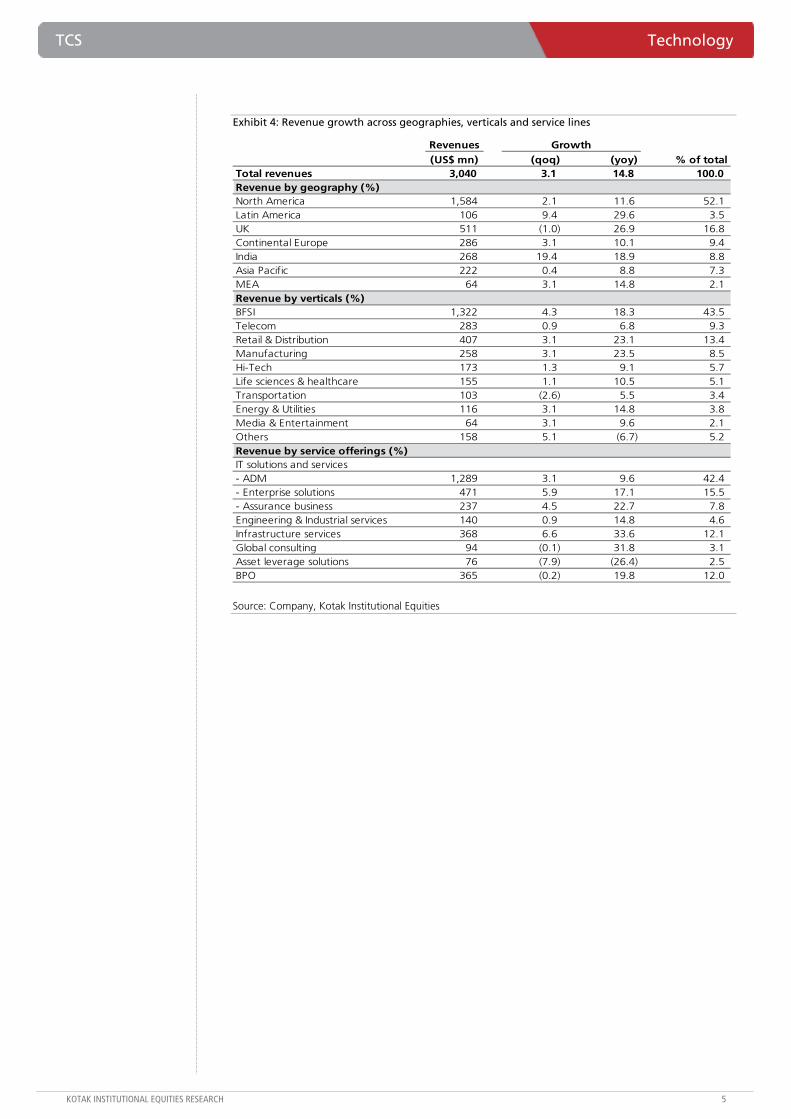
Growth was broad-based across verticals except transportation and telecom. BFSI led the growth with a strong 4.3% qoq increase, while manufacturing grew 3.1%. Transportation declined 2.6%.
Among geographies, North America grew 2.1% while UK declined 1% (due to currency impact). Continental Europe had a good quarter, growing 3.1%. Revenue growth was led by India, which grew 19.4% qoq.
Infrastructure services grew 6.6% qoq, while ADM and enterprise solutions grew 3.1% and 5.9%, respectively.
TCS won 11 large deals in the quarter with wins across verticals and geographies.
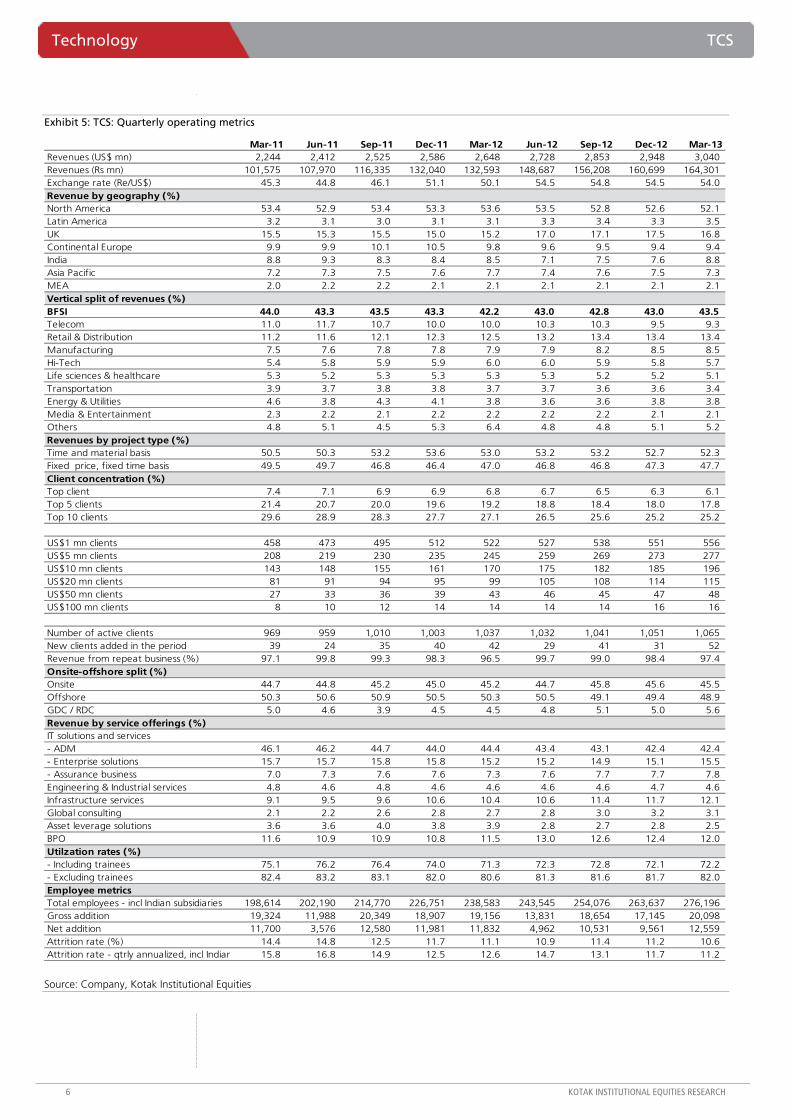
TCS closed the quarter with a consolidated headcount of 276,196, a net addition of 12,559 from the previous quarter.
Attrition in IT services for the quarter ended Mar 2013 was at 9.4% (down from 9.8% in 3QFY13). Quarterly annualized attrition went down to 11.2% from 11.7% in the previous quarter.
Utilization (ex-trainees) was up 30 bps qoq to 82% while utilization (including trainees) was up 5 bps qoq to 72.2%.
Exhibit 1: TCS: Key changes to FY2014E-15E estimates
Rs mn 2014E 2015E 2014E 2015E 2014E 2015ERevenues 722,438 794,083 715,605 786,087 1.0 1.0 EBIT 195,088 212,283 192,670 209,443 1.3 1.4 Net Profit 155,867 171,140 156,586 170,682 (0.5) 0.3 EPS (Rs/ share) 79.6 87.4 80.0 87.2 (0.5) 0.3
Revenues (US$ mn) (a) 13,373 14,848 13,247 14,699 1.0 1.0 Revenue growth (%) 15.6 11.0 14.4 11.0
Re/$ rate 54.0 53.5 54.0 53.48 0.0 0.0 EBIT margin 27.0 26.7 26.9 26.6
Notes:(a) Revenues include 10-months of consolidation of Alti. Revenue growth estimates other wise remains unchanged
New Old Change (%)
Source: Kotak Institutional Equities estimates
Technology TCS
4 KOTAK INSTITUTIONAL EQUITIES RESEARCH
Exhibit 2: Key assumptions driving TCS earnings model, March fiscal year-ends, 2011-15E
2011 2012 2013 2014E 2015EKey assumptionsRevenue growth (US$ terms) (%) 29.1 24.2 13.7 15.6 11.0 Volume growth yoy (%) 30.4 23.8 14.6 15.4 10.6 Pricing change yoy (%)Onsite (0.1) 4.0 (2.1) (1.3) —
Offshore (3.1) (1.1) 0.4 (1.6) —
Blended (1.8) 0.9 0.2 (1.0) 0.5
Total employees (#) - excl subsidiaries 193,914 232,983 269,496 306,860 345,218 Employee additions 37,585 39,069 36,513 37,364 38,358 Utilization rate (%) 76.2 74.4 72.4 73.4 74.0 SG&A expense as % of revenues 16.6 17.6 18.5 18.2 18.7 Re/US$ rate 45.6 48.1 54.4 54.0 53.5
Source: Company, Kotak Institutional Equities estimates
Exhibit 3: TCS interim results, 4QFY13 (consolidated, IFRS)
Rs mn 4QFY12 3QFY13 4QFY13 qoq yoy 4QFY13E % dev.Re/US$ rate 50.1 54.5 54.0 54.0 Revenues (US$ mn) 2,648 2,948 3,040 3.1 14.8 3,038 0.1 Revenues 132,593 160,699 164,301 2.2 23.9 164,035 0.2 Cost of revenues (70,725) (86,208) (87,648) 1.7 23.9 (88,439) (0.9) Gross profit 61,868 74,491 76,653 2.9 23.9 75,597 1.4 SG&A expenses (25,149) (30,682) (33,069) 7.8 31.5 (31,461) 5.1 EBIT 36,719 43,809 43,584 (0.5) 18.7 44,135 (1.2) Other Income 1,077 2,133 4,185 96.2 288.6 3,192 Profit Before Tax 37,796 45,942 47,769 4.0 26.4 47,327 0.9 Provision for Tax (8,174) (10,025) (11,419) 13.9 39.7 (10,853) 5.2 Net income before minority interest 29,622 35,917 36,350 1.2 22.7 36,475 (0.3) Minority Interest (298) (399) (381) (4.5) 27.9 (352) 8.3 Net income (before extraordinary items) 29,324 35,518 35,969 1.3 22.7 36,123 (0.4) Extraordinary items — — — —Net income 29,324 35,518 35,969 1.3 22.7 36,123 (0.4)
EPS (Rs/ share) 15.0 18.1 18.4 1.3 22.7 18.5 (0.4) No of shares outstanding (mn) 1,957 1,957 1,957 1,957 As % of revenuesGross Profit Margin (%) 46.7 46.4 46.7 46.1 Operating Margin (EBIT) 27.7 27.3 26.5 26.9 EBITDA (%) 29.5 29.0 28.2 28.6 SG&A Expenses (%) 19.0 19.1 20.1 19.2 Tax Rate 21.6 21.8 23.9 22.9 Revenue Mix (%)Onsite 43.9 45.6 45.5 Offshore 56.1 54.4 54.5
% chg.
Source: Company, Kotak Institutional Equities estimates
TCS Technology
KOTAK INSTITUTIONAL EQUITIES RESEARCH 5
Exhibit 4: Revenue growth across geographies, verticals and service lines
Revenues Growth(US$ mn) (qoq) (yoy) % of total
Total revenues 3,040 3.1 14.8 100.0 Revenue by geography (%)North America 1,584 2.1 11.6 52.1 Latin America 106 9.4 29.6 3.5 UK 511 (1.0) 26.9 16.8 Continental Europe 286 3.1 10.1 9.4 India 268 19.4 18.9 8.8 Asia Pacific 222 0.4 8.8 7.3 MEA 64 3.1 14.8 2.1 Revenue by verticals (%)BFSI 1,322 4.3 18.3 43.5 Telecom 283 0.9 6.8 9.3 Retail & Distribution 407 3.1 23.1 13.4 Manufacturing 258 3.1 23.5 8.5 Hi-Tech 173 1.3 9.1 5.7 Life sciences & healthcare 155 1.1 10.5 5.1 Transportation 103 (2.6) 5.5 3.4 Energy & Utilities 116 3.1 14.8 3.8 Media & Entertainment 64 3.1 9.6 2.1 Others 158 5.1 (6.7) 5.2 Revenue by service offerings (%)IT solutions and services- ADM 1,289 3.1 9.6 42.4 - Enterprise solutions 471 5.9 17.1 15.5 - Assurance business 237 4.5 22.7 7.8 Engineering & Industrial services 140 0.9 14.8 4.6 Infrastructure services 368 6.6 33.6 12.1 Global consulting 94 (0.1) 31.8 3.1 Asset leverage solutions 76 (7.9) (26.4) 2.5 BPO 365 (0.2) 19.8 12.0
Source: Company, Kotak Institutional Equities
Technology TCS
6 KOTAK INSTITUTIONAL EQUITIES RESEARCH
Exhibit 5: TCS: Quarterly operating metrics
Mar-11 Jun-11 Sep-11 Dec-11 Mar-12 Jun-12 Sep-12 Dec-12 Mar-13Revenues (US$ mn) 2,244 2,412 2,525 2,586 2,648 2,728 2,853 2,948 3,040 Revenues (Rs mn) 101,575 107,970 116,335 132,040 132,593 148,687 156,208 160,699 164,301 Exchange rate (Re/US$) 45.3 44.8 46.1 51.1 50.1 54.5 54.8 54.5 54.0 Revenue by geography (%)North America 53.4 52.9 53.4 53.3 53.6 53.5 52.8 52.6 52.1 Latin America 3.2 3.1 3.0 3.1 3.1 3.3 3.4 3.3 3.5 UK 15.5 15.3 15.5 15.0 15.2 17.0 17.1 17.5 16.8 Continental Europe 9.9 9.9 10.1 10.5 9.8 9.6 9.5 9.4 9.4 India 8.8 9.3 8.3 8.4 8.5 7.1 7.5 7.6 8.8 Asia Pacific 7.2 7.3 7.5 7.6 7.7 7.4 7.6 7.5 7.3 MEA 2.0 2.2 2.2 2.1 2.1 2.1 2.1 2.1 2.1 Vertical split of revenues (%)BFSI 44.0 43.3 43.5 43.3 42.2 43.0 42.8 43.0 43.5 Telecom 11.0 11.7 10.7 10.0 10.0 10.3 10.3 9.5 9.3 Retail & Distribution 11.2 11.6 12.1 12.3 12.5 13.2 13.4 13.4 13.4 Manufacturing 7.5 7.6 7.8 7.8 7.9 7.9 8.2 8.5 8.5 Hi-Tech 5.4 5.8 5.9 5.9 6.0 6.0 5.9 5.8 5.7 Life sciences & healthcare 5.3 5.2 5.3 5.3 5.3 5.3 5.2 5.2 5.1 Transportation 3.9 3.7 3.8 3.8 3.7 3.7 3.6 3.6 3.4 Energy & Utilities 4.6 3.8 4.3 4.1 3.8 3.6 3.6 3.8 3.8 Media & Entertainment 2.3 2.2 2.1 2.2 2.2 2.2 2.2 2.1 2.1 Others 4.8 5.1 4.5 5.3 6.4 4.8 4.8 5.1 5.2 Revenues by project type (%)Time and material basis 50.5 50.3 53.2 53.6 53.0 53.2 53.2 52.7 52.3 Fixed price, fixed time basis 49.5 49.7 46.8 46.4 47.0 46.8 46.8 47.3 47.7 Client concentration (%)Top client 7.4 7.1 6.9 6.9 6.8 6.7 6.5 6.3 6.1 Top 5 clients 21.4 20.7 20.0 19.6 19.2 18.8 18.4 18.0 17.8 Top 10 clients 29.6 28.9 28.3 27.7 27.1 26.5 25.6 25.2 25.2
US$1 mn clients 458 473 495 512 522 527 538 551 556 US$5 mn clients 208 219 230 235 245 259 269 273 277 US$10 mn clients 143 148 155 161 170 175 182 185 196 US$20 mn clients 81 91 94 95 99 105 108 114 115 US$50 mn clients 27 33 36 39 43 46 45 47 48 US$100 mn clients 8 10 12 14 14 14 14 16 16
Number of active clients 969 959 1,010 1,003 1,037 1,032 1,041 1,051 1,065 New clients added in the period 39 24 35 40 42 29 41 31 52 Revenue from repeat business (%) 97.1 99.8 99.3 98.3 96.5 99.7 99.0 98.4 97.4 Onsite-offshore split (%)Onsite 44.7 44.8 45.2 45.0 45.2 44.7 45.8 45.6 45.5 Offshore 50.3 50.6 50.9 50.5 50.3 50.5 49.1 49.4 48.9 GDC / RDC 5.0 4.6 3.9 4.5 4.5 4.8 5.1 5.0 5.6 Revenue by service offerings (%)IT solutions and services- ADM 46.1 46.2 44.7 44.0 44.4 43.4 43.1 42.4 42.4 - Enterprise solutions 15.7 15.7 15.8 15.8 15.2 15.2 14.9 15.1 15.5 - Assurance business 7.0 7.3 7.6 7.6 7.3 7.6 7.7 7.7 7.8 Engineering & Industrial services 4.8 4.6 4.8 4.6 4.6 4.6 4.6 4.7 4.6 Infrastructure services 9.1 9.5 9.6 10.6 10.4 10.6 11.4 11.7 12.1 Global consulting 2.1 2.2 2.6 2.8 2.7 2.8 3.0 3.2 3.1 Asset leverage solutions 3.6 3.6 4.0 3.8 3.9 2.8 2.7 2.8 2.5 BPO 11.6 10.9 10.9 10.8 11.5 13.0 12.6 12.4 12.0 Utilzation rates (%)- Including trainees 75.1 76.2 76.4 74.0 71.3 72.3 72.8 72.1 72.2 - Excluding trainees 82.4 83.2 83.1 82.0 80.6 81.3 81.6 81.7 82.0 Employee metricsTotal employees - incl Indian subsidiaries 198,614 202,190 214,770 226,751 238,583 243,545 254,076 263,637 276,196 Gross addition 19,324 11,988 20,349 18,907 19,156 13,831 18,654 17,145 20,098 Net addition 11,700 3,576 12,580 11,981 11,832 4,962 10,531 9,561 12,559 Attrition rate (%) 14.4 14.8 12.5 11.7 11.1 10.9 11.4 11.2 10.6 Attrition rate - qtrly annualized, incl Indian 15.8 16.8 14.9 12.5 12.6 14.7 13.1 11.7 11.2
Source: Company, Kotak Institutional Equities
TCS Technology
KOTAK INSTITUTIONAL EQUITIES RESEARCH 7
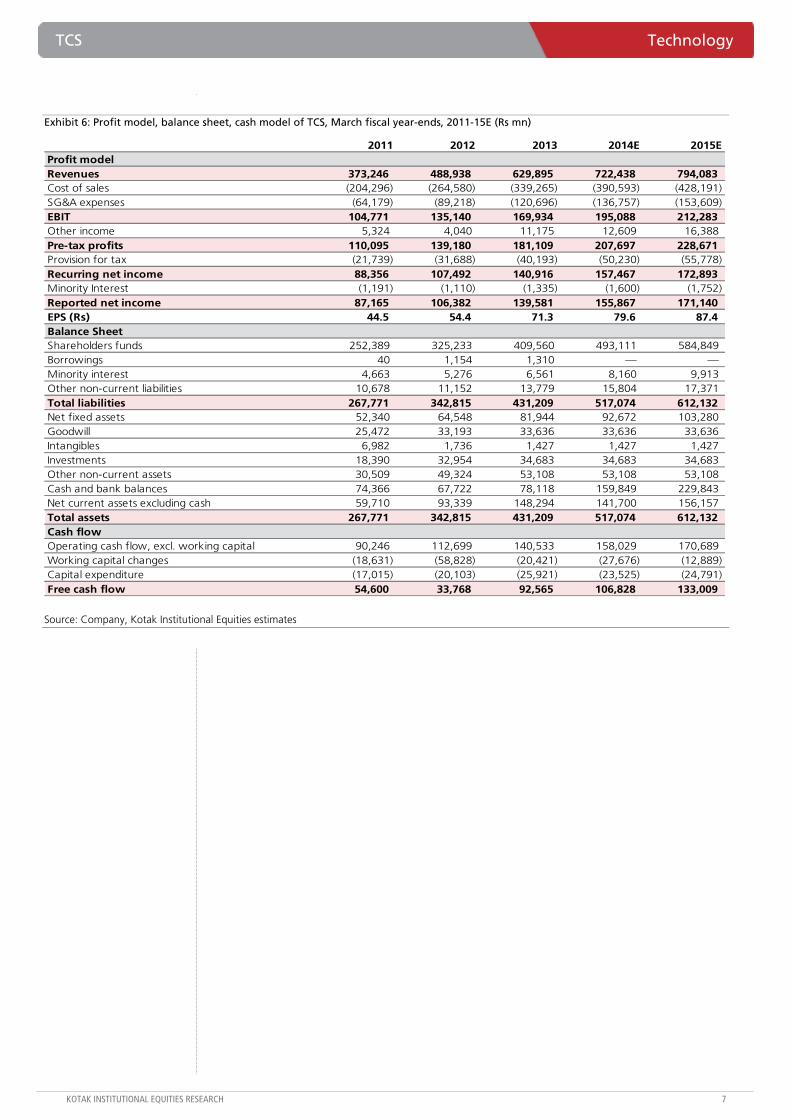
Exhibit 6: Profit model, balance sheet, cash model of TCS, March fiscal year-ends, 2011-15E (Rs mn)
2011 2012 2013 2014E 2015EProfit modelRevenues 373,246 488,938 629,895 722,438 794,083 Cost of sales (204,296) (264,580) (339,265) (390,593) (428,191) SG&A expenses (64,179) (89,218) (120,696) (136,757) (153,609) EBIT 104,771 135,140 169,934 195,088 212,283 Other income 5,324 4,040 11,175 12,609 16,388 Pre-tax profits 110,095 139,180 181,109 207,697 228,671 Provision for tax (21,739) (31,688) (40,193) (50,230) (55,778) Recurring net income 88,356 107,492 140,916 157,467 172,893 Minority Interest (1,191) (1,110) (1,335) (1,600) (1,752) Reported net income 87,165 106,382 139,581 155,867 171,140 EPS (Rs) 44.5 54.4 71.3 79.6 87.4 Balance SheetShareholders funds 252,389 325,233 409,560 493,111 584,849 Borrowings 40 1,154 1,310 — —Minority interest 4,663 5,276 6,561 8,160 9,913 Other non-current liabilities 10,678 11,152 13,779 15,804 17,371 Total liabilities 267,771 342,815 431,209 517,074 612,132 Net fixed assets 52,340 64,548 81,944 92,672 103,280 Goodwill 25,472 33,193 33,636 33,636 33,636 Intangibles 6,982 1,736 1,427 1,427 1,427 Investments 18,390 32,954 34,683 34,683 34,683 Other non-current assets 30,509 49,324 53,108 53,108 53,108 Cash and bank balances 74,366 67,722 78,118 159,849 229,843 Net current assets excluding cash 59,710 93,339 148,294 141,700 156,157 Total assets 267,771 342,815 431,209 517,074 612,132 Cash flowOperating cash flow, excl. working capital 90,246 112,699 140,533 158,029 170,689 Working capital changes (18,631) (58,828) (20,421) (27,676) (12,889) Capital expenditure (17,015) (20,103) (25,921) (23,525) (24,791) Free cash flow 54,600 33,768 92,565 106,828 133,009
Source: Company, Kotak Institutional Equities estimates
For private Circulation Only. FOR IMPORTANT INFORMATION ABOUT KOTAK SECURITIES’ RATING SYSTEM AND OTHER DISCLOSURES, REFER TO THE END OF THIS MATERIAL.
Good headline numbers but the devil lies in the details
HCLT reported 3.2% qoq revenue growth to US$1,191 mn, in line with our estimate. Net income of Rs10.2 bn was 8.2% ahead of our estimate and largely contributed by beat on other income. Revenue growth for the quarter was once again infra-led, which grew 8.6% qoq and 41.6% yoy. Growth in software services was muted at 1% qoq and 4.8% yoy. EBTIDA margin was stable at 22% and 30 bps ahead of our estimate. Margin performance of the company continues to surprise us. The company announced US$1 bn worth of new deal singings for the quarter.
Effort-less growth—headcount declines for the second consecutive quarter
Employee metrics of HCLT are puzzling. Overall and IT services headcount declined for the second consecutive quarter. Net employee addition was a marginal 1,752 on a yoy basis (2.4% growth). Quarterly annualized attrition rate increased to 28% from 24.8% in 2QFY13. High and sticky attrition is a surprise for a company that is performing well. What is even more surprising is that the company increased utilization rates by 190 bps to 83.8%, despite such high attrition. Peers have struggled to maintain utilization at reasonable levels during periods of high attrition.
Profitability is unsustainable with stretched core metrics
At the risk of repetition, we are surprised with HCLT’s high profitability and the near convergence with Wipro. That HCLT has lower offshore pricing (16-18% lower than Infosys and Wipro), inefficient employee pyramid captured by delay in absorption of freshers, higher subcontracting costs (at least 2X of peers) and growth that is driven by relatively lower-margin infra management business raises concerns on sustainability. We find management guidance of margins aggressive.
Maintain REDUCE rating; expect moderation in growth
Revenue growth that is single-service driven, stretched operating metrics with unsustainable profitability and sticky attrition numbers raise the risk profile of the business. Valuations at 14X FY2014E earnings are not inexpensive either. We maintain our REDUCE rating with unchanged 12-month forward target price of Rs650/share.
HCL Technologies (HCLT)
Technology
An effort-less growth. Growth without/or marginal people addition has been the hallmark of HCLT’s performance for past the few quarters. 3QFY13 was no different, with solid revenue growth of 3.2% despite people decline. HCLT’s per person revenue productivity is now 13-25% higher than other Tier-1 IT even as the reported offshore pricing is lower than peers. Profitability for the quarter was supported by unsustainable increase in utilization rates. We maintain our Cautious stance—high-risk business and unsustainable margins worry us. Maintain REDUCE with unchanged target price.
HCL TechnologiesStock data Forecasts/Valuations 2013 2014E 2015E
52-week range (Rs) (high,low) EPS (Rs) 53.9 55.9 59.7Market Cap. (Rs bn) 537.9 EPS growth (%) 55.8 3.9 6.6
Shareholding pattern (%) P/E (X) 13.9 13.4 12.6Promoters 62.1 Sales (Rs bn) 253.5 286.2 309.3FIIs 21.8 Net profits (Rs bn) 38.0 39.8 42.5MFs 3.9 EBITDA (Rs bn) 55.6 56.6 59.7
Price performance (%) 1M 3M 12M EV/EBITDA (X) 9.0 8.4 7.6Absolute (5.1) 6.7 56.2 ROE (%) 31.7 26.1 23.4Rel. to BSE-30 (1.6) 13.7 44.8 Div. Yield (%) 1.1 1.3 1.6
Company data and valuation summary
810-453
REDUCE
APRIL 18, 2013
RESULT
Coverage view: Cautious
Price (Rs): 751
Target price (Rs): 650
BSE-30: 18,731
HCL Technologies Technology
KOTAK INSTITUTIONAL EQUITIES RESEARCH 9
Solid signings of TCVs but require more data to appreciate the scope of incremental work
HCLT announced aggregate TCVs of deals worth US$1 bn, 90% of which is in the rebid market. While this is down from US$1.5 bn for the same quarter in the previous year, yet this is creditable, especially after similar signings in 2QFY13. While deals signed in the quarter are impressive on face value, more disclosures are required on the quality of the deals—nature of work and timeframe of execution—to help us put the numbers into context. For example, an existing relationship converted into a longer tenure contract would lead to incremental TCV; however, utility of such TCVs would be limited if there is no increase in annualized billing.
We do a theoretical exercise of the potential incremental revenues of HCLT on the basis of following assumptions—(1) average tenure of a TCV is 5 years, (2) we assume signings of US$250 mn in quarters where TCV signed does not fall above the deal value filter, (3) revenues from deals signed are realized with a one quarter lag, and (4) assume all revenues are incremental in nature. Based on these assumptions, TCVs over the past 18 months work out to US$5 bn; this amounts to annualized billing of US$1 bn. During the same period, incremental revenues added by the company stands at US$205 mn (assuming a 3% revenue growth in 4QFY13); if our assumption of average execution cycle is right, then new deals would have contributed US$250 mn of the US$205 mn incremental revenues. Exhibit 5 details our analysis.
Interesting highlights from 3QFY13 performance
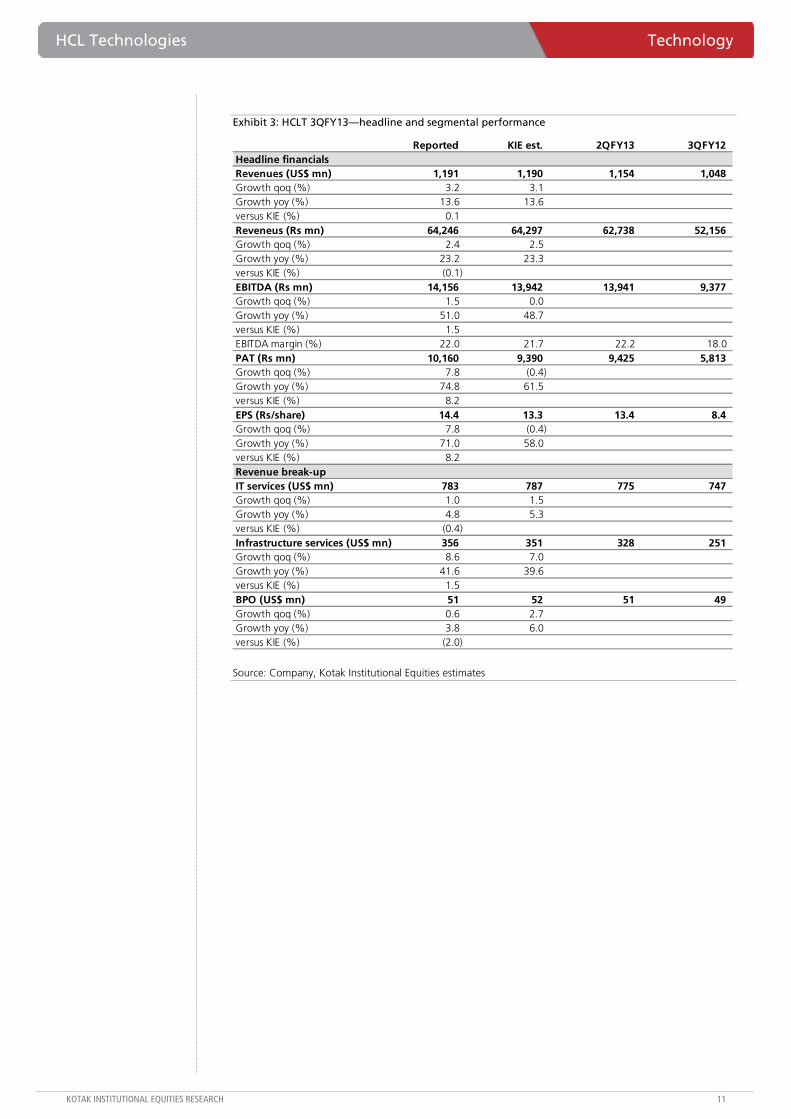
Infrastructure management contributed 77.2% of incremental revenues for the quarter and 73.3% of the incremental revenues over the past 12 months. Software services growth has slowed down further to 4.8% yoy.
Software services headcount declined 1,638 qoq and 2,398 on a yoy basis. Overall headcount declined for the second consecutive quarter.
Revenue productivity at over US$56 k per employee per annum is the highest in the sector and 25% ahead of TCS.
Attrition in IT services stands at 21.1% on quarterly annualized basis, surprisingly high for a company that appears to be doing relatively well. Exhibit 6 details the sticky nature of attrition.
Onsite utilization rate was steady at 97%, intriguing on three counts—(1) HCLT has achieved it despite the highest percentage of re-badged employees (client employees taken on vendor rolls), (2) high attrition rates, and (3) no other company has achieved such a similar number. Sustainability remains a serious question mark, however.
Blended utilization rate, excluding trainees of 83.8% in IT services, is the highest in the industry. Blended utilization rate including trainees is also the highest in the sector; it is surprising that attrition rates in IT services of 21.1% on annualization of quarterly numbers is also the highest in the sector. Exhibit 6 details quarterly annualized attrition in IT services (software services + infra services) over the past few quarters.
FCF generation was strong at US$156 mn (FCF/EBITDA conversion of 58% was down from 88% in the previous quarter though).
Technology HCL Technologies
10 KOTAK INSTITUTIONAL EQUITIES RESEARCH
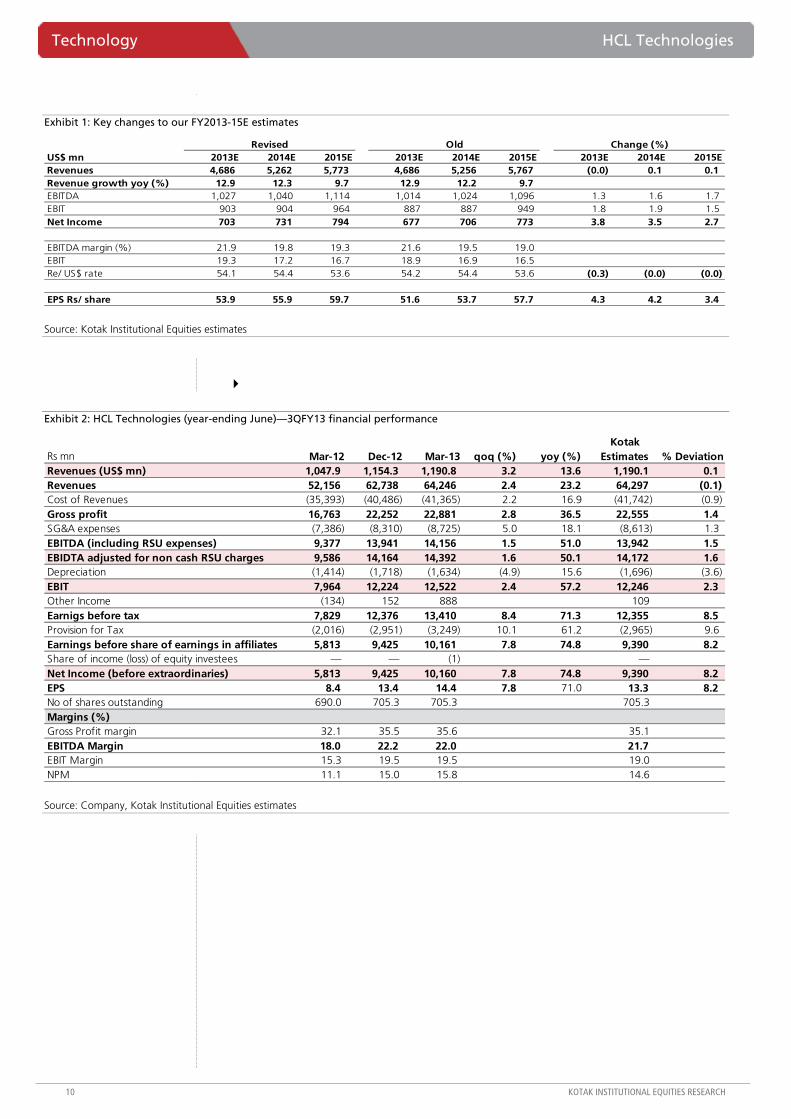
Exhibit 1: Key changes to our FY2013-15E estimates
US$ mn 2013E 2014E 2015E 2013E 2014E 2015E 2013E 2014E 2015ERevenues 4,686 5,262 5,773 4,686 5,256 5,767 (0.0) 0.1 0.1 Revenue growth yoy (%) 12.9 12.3 9.7 12.9 12.2 9.7 EBITDA 1,027 1,040 1,114 1,014 1,024 1,096 1.3 1.6 1.7 EBIT 903 904 964 887 887 949 1.8 1.9 1.5 Net Income 703 731 794 677 706 773 3.8 3.5 2.7
EBITDA margin (%) 21.9 19.8 19.3 21.6 19.5 19.0 EBIT 19.3 17.2 16.7 18.9 16.9 16.5 Re/ US$ rate 54.1 54.4 53.6 54.2 54.4 53.6 (0.3) (0.0) (0.0)
EPS Rs/ share 53.9 55.9 59.7 51.6 53.7 57.7 4.3 4.2 3.4
Revised Old Change (%)
Source: Kotak Institutional Equities estimates
Exhibit 2: HCL Technologies (year-ending June)—3QFY13 financial performance
Kotak Rs mn Mar-12 Dec-12 Mar-13 qoq (%) yoy (%) Estimates % DeviationRevenues (US$ mn) 1,047.9 1,154.3 1,190.8 3.2 13.6 1,190.1 0.1 Revenues 52,156 62,738 64,246 2.4 23.2 64,297 (0.1) Cost of Revenues (35,393) (40,486) (41,365) 2.2 16.9 (41,742) (0.9) Gross profit 16,763 22,252 22,881 2.8 36.5 22,555 1.4 SG&A expenses (7,386) (8,310) (8,725) 5.0 18.1 (8,613) 1.3 EBITDA (including RSU expenses) 9,377 13,941 14,156 1.5 51.0 13,942 1.5 EBIDTA adjusted for non cash RSU charges 9,586 14,164 14,392 1.6 50.1 14,172 1.6 Depreciation (1,414) (1,718) (1,634) (4.9) 15.6 (1,696) (3.6) EBIT 7,964 12,224 12,522 2.4 57.2 12,246 2.3 Other Income (134) 152 888 109Earnigs before tax 7,829 12,376 13,410 8.4 71.3 12,355 8.5 Provision for Tax (2,016) (2,951) (3,249) 10.1 61.2 (2,965) 9.6 Earnings before share of earnings in affiliates 5,813 9,425 10,161 7.8 74.8 9,390 8.2 Share of income (loss) of equity investees — — (1) —Net Income (before extraordinaries) 5,813 9,425 10,160 7.8 74.8 9,390 8.2 EPS 8.4 13.4 14.4 7.8 71.0 13.3 8.2 No of shares outstanding 690.0 705.3 705.3 705.3 Margins (%)Gross Profit margin 32.1 35.5 35.6 35.1 EBITDA Margin 18.0 22.2 22.0 21.7 EBIT Margin 15.3 19.5 19.5 19.0 NPM 11.1 15.0 15.8 14.6
Source: Company, Kotak Institutional Equities estimates
HCL Technologies Technology
KOTAK INSTITUTIONAL EQUITIES RESEARCH 11
Exhibit 3: HCLT 3QFY13—headline and segmental performance
Reported KIE est. 2QFY13 3QFY12Headline financialsRevenues (US$ mn) 1,191 1,190 1,154 1,048 Growth qoq (%) 3.2 3.1 Growth yoy (%) 13.6 13.6 versus KIE (%) 0.1 Reveneus (Rs mn) 64,246 64,297 62,738 52,156 Growth qoq (%) 2.4 2.5 Growth yoy (%) 23.2 23.3 versus KIE (%) (0.1) EBITDA (Rs mn) 14,156 13,942 13,941 9,377 Growth qoq (%) 1.5 0.0 Growth yoy (%) 51.0 48.7 versus KIE (%) 1.5 EBITDA margin (%) 22.0 21.7 22.2 18.0 PAT (Rs mn) 10,160 9,390 9,425 5,813 Growth qoq (%) 7.8 (0.4) Growth yoy (%) 74.8 61.5 versus KIE (%) 8.2 EPS (Rs/share) 14.4 13.3 13.4 8.4 Growth qoq (%) 7.8 (0.4) Growth yoy (%) 71.0 58.0 versus KIE (%) 8.2 Revenue break-upIT services (US$ mn) 783 787 775 747 Growth qoq (%) 1.0 1.5 Growth yoy (%) 4.8 5.3 versus KIE (%) (0.4) Infrastructure services (US$ mn) 356 351 328 251 Growth qoq (%) 8.6 7.0 Growth yoy (%) 41.6 39.6 versus KIE (%) 1.5 BPO (US$ mn) 51 52 51 49 Growth qoq (%) 0.6 2.7 Growth yoy (%) 3.8 6.0 versus KIE (%) (2.0)
Source: Company, Kotak Institutional Equities estimates
Technology HCL Technologies
12 KOTAK INSTITUTIONAL EQUITIES RESEARCH
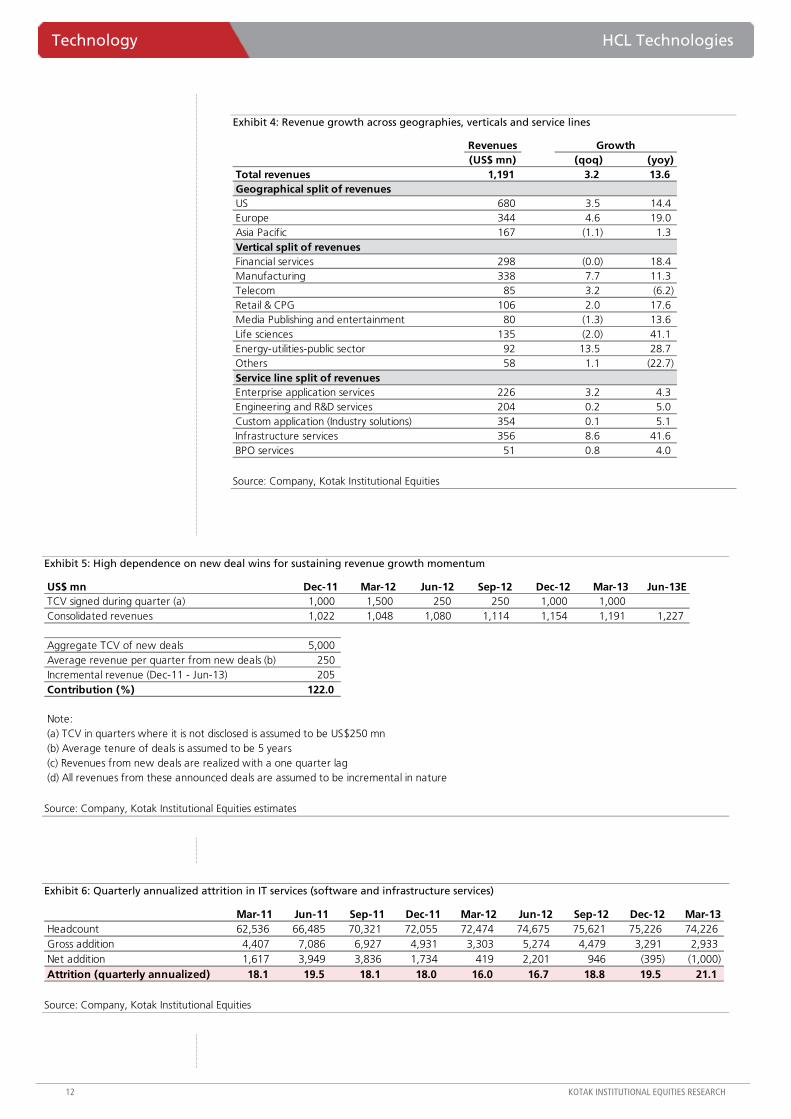
Exhibit 4: Revenue growth across geographies, verticals and service lines
Revenues Growth(US$ mn) (qoq) (yoy)
Total revenues 1,191 3.2 13.6 Geographical split of revenuesUS 680 3.5 14.4 Europe 344 4.6 19.0 Asia Pacific 167 (1.1) 1.3 Vertical split of revenuesFinancial services 298 (0.0) 18.4 Manufacturing 338 7.7 11.3 Telecom 85 3.2 (6.2) Retail & CPG 106 2.0 17.6 Media Publishing and entertainment 80 (1.3) 13.6 Life sciences 135 (2.0) 41.1 Energy-utilities-public sector 92 13.5 28.7 Others 58 1.1 (22.7) Service line split of revenuesEnterprise application services 226 3.2 4.3 Engineering and R&D services 204 0.2 5.0 Custom application (Industry solutions) 354 0.1 5.1 Infrastructure services 356 8.6 41.6 BPO services 51 0.8 4.0
Source: Company, Kotak Institutional Equities
Exhibit 5: High dependence on new deal wins for sustaining revenue growth momentum
US$ mn Dec-11 Mar-12 Jun-12 Sep-12 Dec-12 Mar-13 Jun-13ETCV signed during quarter (a) 1,000 1,500 250 250 1,000 1,000 Consolidated revenues 1,022 1,048 1,080 1,114 1,154 1,191 1,227
Aggregate TCV of new deals 5,000 Average revenue per quarter from new deals (b) 250 Incremental revenue (Dec-11 - Jun-13) 205 Contribution (%) 122.0
Note:(a) TCV in quarters where it is not disclosed is assumed to be US$250 mn(b) Average tenure of deals is assumed to be 5 years(c) Revenues from new deals are realized with a one quarter lag(d) All revenues from these announced deals are assumed to be incremental in nature
Source: Company, Kotak Institutional Equities estimates
Exhibit 6: Quarterly annualized attrition in IT services (software and infrastructure services)
Mar-11 Jun-11 Sep-11 Dec-11 Mar-12 Jun-12 Sep-12 Dec-12 Mar-13Headcount 62,536 66,485 70,321 72,055 72,474 74,675 75,621 75,226 74,226 Gross addition 4,407 7,086 6,927 4,931 3,303 5,274 4,479 3,291 2,933 Net addition 1,617 3,949 3,836 1,734 419 2,201 946 (395) (1,000) Attrition (quarterly annualized) 18.1 19.5 18.1 18.0 16.0 16.7 18.8 19.5 21.1
Source: Company, Kotak Institutional Equities
HCL Technologies Technology
KOTAK INSTITUTIONAL EQUITIES RESEARCH 13
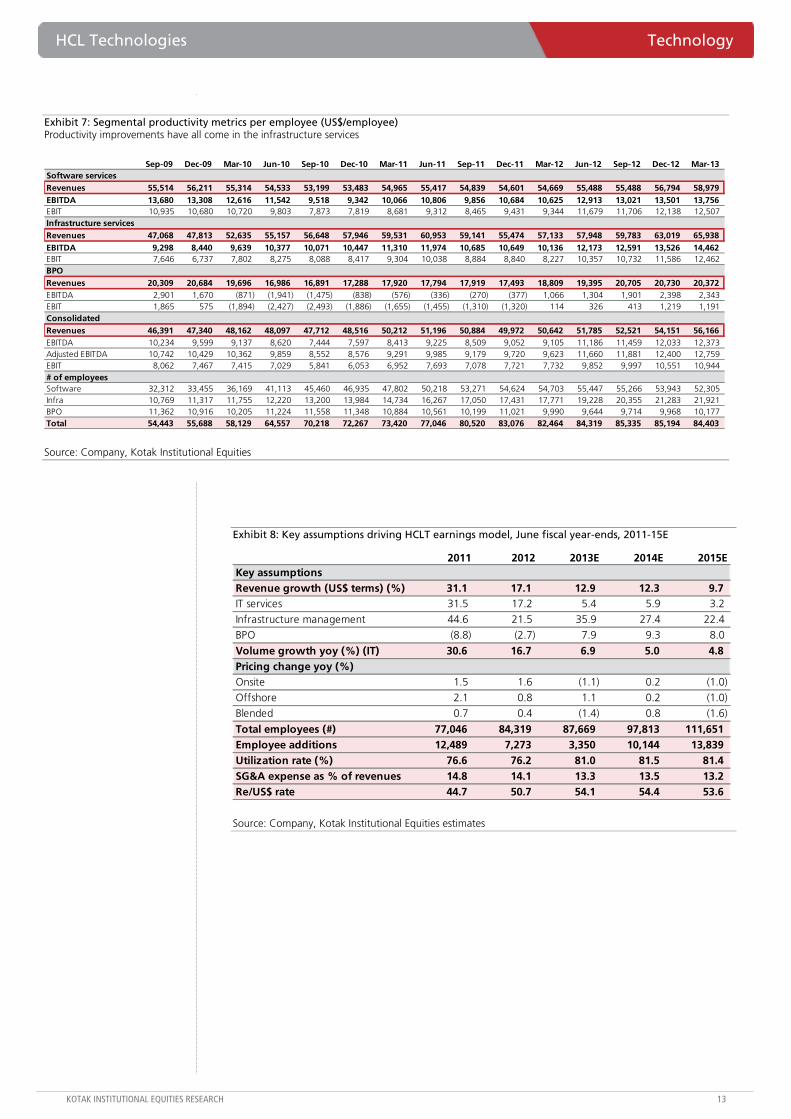
Exhibit 7: Segmental productivity metrics per employee (US$/employee) Productivity improvements have all come in the infrastructure services
Sep-09 Dec-09 Mar-10 Jun-10 Sep-10 Dec-10 Mar-11 Jun-11 Sep-11 Dec-11 Mar-12 Jun-12 Sep-12 Dec-12 Mar-13Software servicesRevenues 55,514 56,211 55,314 54,533 53,199 53,483 54,965 55,417 54,839 54,601 54,669 55,488 55,488 56,794 58,979 EBITDA 13,680 13,308 12,616 11,542 9,518 9,342 10,066 10,806 9,856 10,684 10,625 12,913 13,021 13,501 13,756 EBIT 10,935 10,680 10,720 9,803 7,873 7,819 8,681 9,312 8,465 9,431 9,344 11,679 11,706 12,138 12,507 Infrastructure servicesRevenues 47,068 47,813 52,635 55,157 56,648 57,946 59,531 60,953 59,141 55,474 57,133 57,948 59,783 63,019 65,938 EBITDA 9,298 8,440 9,639 10,377 10,071 10,447 11,310 11,974 10,685 10,649 10,136 12,173 12,591 13,526 14,462 EBIT 7,646 6,737 7,802 8,275 8,088 8,417 9,304 10,038 8,884 8,840 8,227 10,357 10,732 11,586 12,462 BPORevenues 20,309 20,684 19,696 16,986 16,891 17,288 17,920 17,794 17,919 17,493 18,809 19,395 20,705 20,730 20,372 EBITDA 2,901 1,670 (871) (1,941) (1,475) (838) (576) (336) (270) (377) 1,066 1,304 1,901 2,398 2,343 EBIT 1,865 575 (1,894) (2,427) (2,493) (1,886) (1,655) (1,455) (1,310) (1,320) 114 326 413 1,219 1,191 ConsolidatedRevenues 46,391 47,340 48,162 48,097 47,712 48,516 50,212 51,196 50,884 49,972 50,642 51,785 52,521 54,151 56,166 EBITDA 10,234 9,599 9,137 8,620 7,444 7,597 8,413 9,225 8,509 9,052 9,105 11,186 11,459 12,033 12,373 Adjusted EBITDA 10,742 10,429 10,362 9,859 8,552 8,576 9,291 9,985 9,179 9,720 9,623 11,660 11,881 12,400 12,759 EBIT 8,062 7,467 7,415 7,029 5,841 6,053 6,952 7,693 7,078 7,721 7,732 9,852 9,997 10,551 10,944 # of employeesSoftware 32,312 33,455 36,169 41,113 45,460 46,935 47,802 50,218 53,271 54,624 54,703 55,447 55,266 53,943 52,305 Infra 10,769 11,317 11,755 12,220 13,200 13,984 14,734 16,267 17,050 17,431 17,771 19,228 20,355 21,283 21,921 BPO 11,362 10,916 10,205 11,224 11,558 11,348 10,884 10,561 10,199 11,021 9,990 9,644 9,714 9,968 10,177 Total 54,443 55,688 58,129 64,557 70,218 72,267 73,420 77,046 80,520 83,076 82,464 84,319 85,335 85,194 84,403
Source: Company, Kotak Institutional Equities
Exhibit 8: Key assumptions driving HCLT earnings model, June fiscal year-ends, 2011-15E
2011 2012 2013E 2014E 2015EKey assumptionsRevenue growth (US$ terms) (%) 31.1 17.1 12.9 12.3 9.7 IT services 31.5 17.2 5.4 5.9 3.2
Infrastructure management 44.6 21.5 35.9 27.4 22.4
BPO (8.8) (2.7) 7.9 9.3 8.0
Volume growth yoy (%) (IT) 30.6 16.7 6.9 5.0 4.8 Pricing change yoy (%)Onsite 1.5 1.6 (1.1) 0.2 (1.0)
Offshore 2.1 0.8 1.1 0.2 (1.0)
Blended 0.7 0.4 (1.4) 0.8 (1.6)
Total employees (#) 77,046 84,319 87,669 97,813 111,651 Employee additions 12,489 7,273 3,350 10,144 13,839 Utilization rate (%) 76.6 76.2 81.0 81.5 81.4 SG&A expense as % of revenues 14.8 14.1 13.3 13.5 13.2 Re/US$ rate 44.7 50.7 54.1 54.4 53.6
Source: Company, Kotak Institutional Equities estimates
Technology HCL Technologies
14 KOTAK INSTITUTIONAL EQUITIES RESEARCH
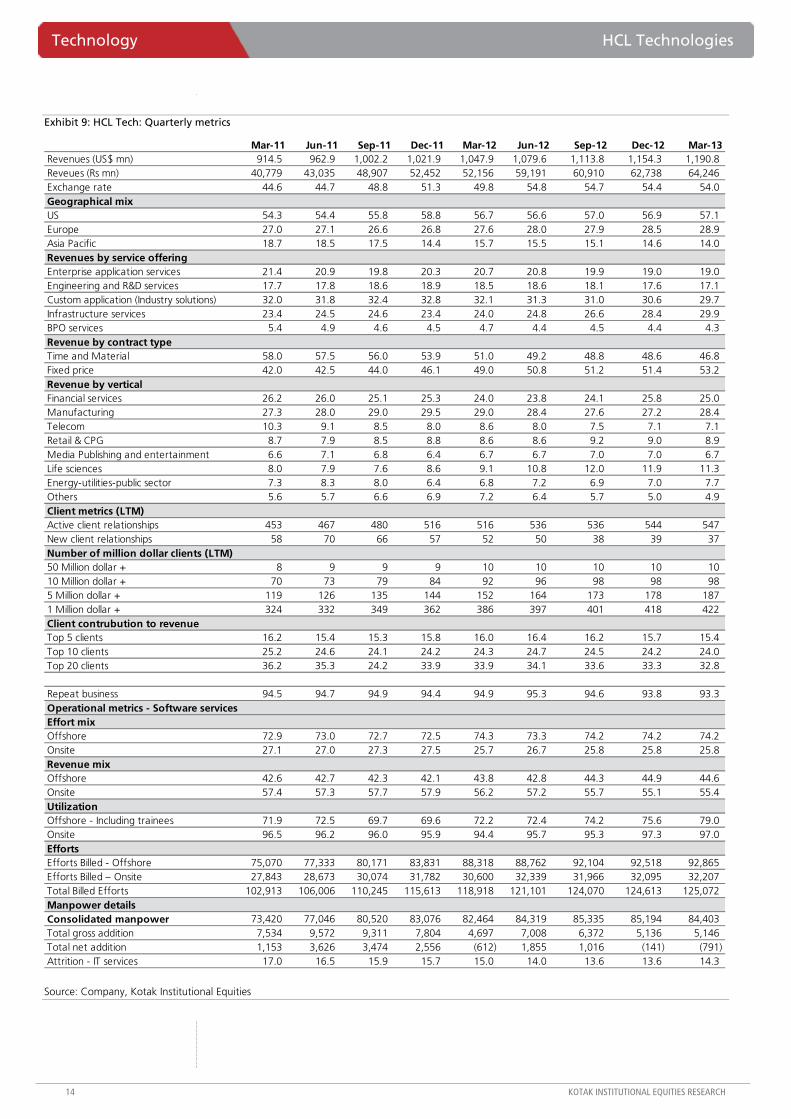
Exhibit 9: HCL Tech: Quarterly metrics
Mar-11 Jun-11 Sep-11 Dec-11 Mar-12 Jun-12 Sep-12 Dec-12 Mar-13Revenues (US$ mn) 914.5 962.9 1,002.2 1,021.9 1,047.9 1,079.6 1,113.8 1,154.3 1,190.8 Reveues (Rs mn) 40,779 43,035 48,907 52,452 52,156 59,191 60,910 62,738 64,246 Exchange rate 44.6 44.7 48.8 51.3 49.8 54.8 54.7 54.4 54.0 Geographical mixUS 54.3 54.4 55.8 58.8 56.7 56.6 57.0 56.9 57.1 Europe 27.0 27.1 26.6 26.8 27.6 28.0 27.9 28.5 28.9 Asia Pacific 18.7 18.5 17.5 14.4 15.7 15.5 15.1 14.6 14.0 Revenues by service offeringEnterprise application services 21.4 20.9 19.8 20.3 20.7 20.8 19.9 19.0 19.0 Engineering and R&D services 17.7 17.8 18.6 18.9 18.5 18.6 18.1 17.6 17.1 Custom application (Industry solutions) 32.0 31.8 32.4 32.8 32.1 31.3 31.0 30.6 29.7 Infrastructure services 23.4 24.5 24.6 23.4 24.0 24.8 26.6 28.4 29.9 BPO services 5.4 4.9 4.6 4.5 4.7 4.4 4.5 4.4 4.3 Revenue by contract typeTime and Material 58.0 57.5 56.0 53.9 51.0 49.2 48.8 48.6 46.8 Fixed price 42.0 42.5 44.0 46.1 49.0 50.8 51.2 51.4 53.2 Revenue by verticalFinancial services 26.2 26.0 25.1 25.3 24.0 23.8 24.1 25.8 25.0 Manufacturing 27.3 28.0 29.0 29.5 29.0 28.4 27.6 27.2 28.4 Telecom 10.3 9.1 8.5 8.0 8.6 8.0 7.5 7.1 7.1 Retail & CPG 8.7 7.9 8.5 8.8 8.6 8.6 9.2 9.0 8.9 Media Publishing and entertainment 6.6 7.1 6.8 6.4 6.7 6.7 7.0 7.0 6.7 Life sciences 8.0 7.9 7.6 8.6 9.1 10.8 12.0 11.9 11.3 Energy-utilities-public sector 7.3 8.3 8.0 6.4 6.8 7.2 6.9 7.0 7.7 Others 5.6 5.7 6.6 6.9 7.2 6.4 5.7 5.0 4.9 Client metrics (LTM)Active client relationships 453 467 480 516 516 536 536 544 547 New client relationships 58 70 66 57 52 50 38 39 37 Number of million dollar clients (LTM)50 Million dollar + 8 9 9 9 10 10 10 10 10 10 Million dollar + 70 73 79 84 92 96 98 98 98 5 Million dollar + 119 126 135 144 152 164 173 178 187 1 Million dollar + 324 332 349 362 386 397 401 418 422 Client contrubution to revenueTop 5 clients 16.2 15.4 15.3 15.8 16.0 16.4 16.2 15.7 15.4 Top 10 clients 25.2 24.6 24.1 24.2 24.3 24.7 24.5 24.2 24.0 Top 20 clients 36.2 35.3 24.2 33.9 33.9 34.1 33.6 33.3 32.8
Repeat business 94.5 94.7 94.9 94.4 94.9 95.3 94.6 93.8 93.3 Operational metrics - Software servicesEffort mixOffshore 72.9 73.0 72.7 72.5 74.3 73.3 74.2 74.2 74.2 Onsite 27.1 27.0 27.3 27.5 25.7 26.7 25.8 25.8 25.8 Revenue mixOffshore 42.6 42.7 42.3 42.1 43.8 42.8 44.3 44.9 44.6 Onsite 57.4 57.3 57.7 57.9 56.2 57.2 55.7 55.1 55.4 UtilizationOffshore - Including trainees 71.9 72.5 69.7 69.6 72.2 72.4 74.2 75.6 79.0 Onsite 96.5 96.2 96.0 95.9 94.4 95.7 95.3 97.3 97.0 EffortsEfforts Billed - Offshore 75,070 77,333 80,171 83,831 88,318 88,762 92,104 92,518 92,865 Efforts Billed – Onsite 27,843 28,673 30,074 31,782 30,600 32,339 31,966 32,095 32,207 Total Billed Efforts 102,913 106,006 110,245 115,613 118,918 121,101 124,070 124,613 125,072 Manpower detailsConsolidated manpower 73,420 77,046 80,520 83,076 82,464 84,319 85,335 85,194 84,403 Total gross addition 7,534 9,572 9,311 7,804 4,697 7,008 6,372 5,136 5,146 Total net addition 1,153 3,626 3,474 2,556 (612) 1,855 1,016 (141) (791) Attrition - IT services 17.0 16.5 15.9 15.7 15.0 14.0 13.6 13.6 14.3
Source: Company, Kotak Institutional Equities
HCL Technologies Technology
KOTAK INSTITUTIONAL EQUITIES RESEARCH 15
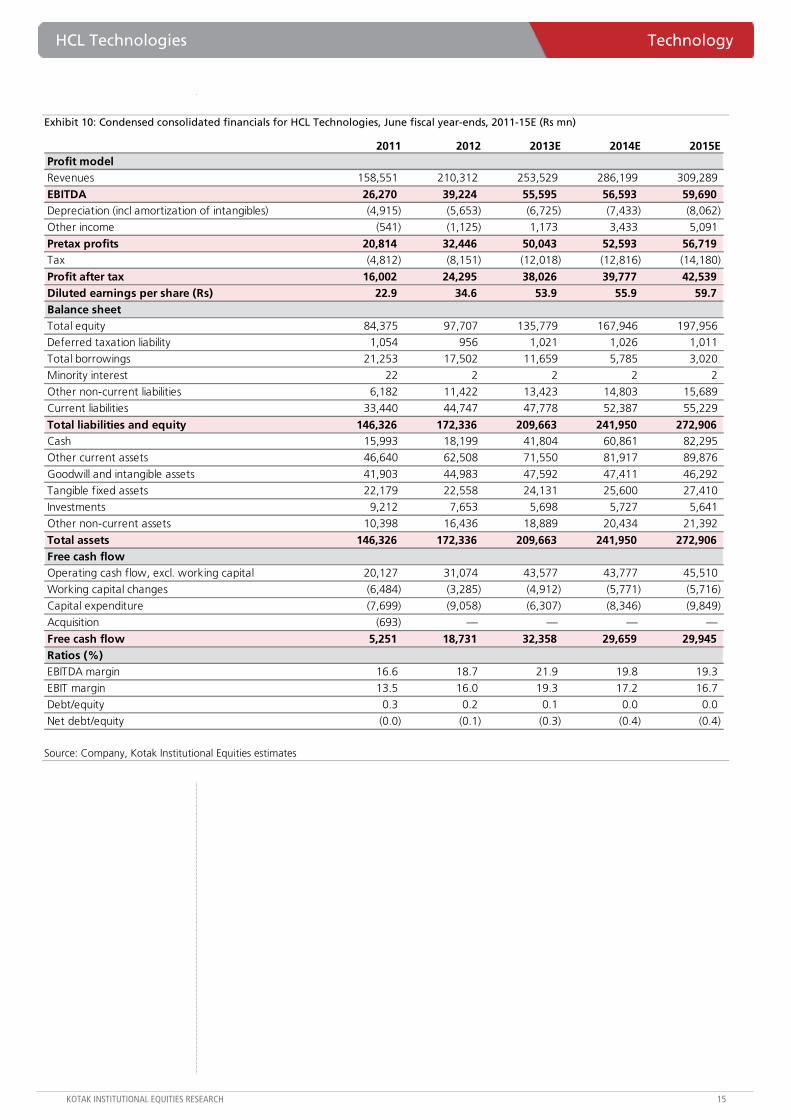
Exhibit 10: Condensed consolidated financials for HCL Technologies, June fiscal year-ends, 2011-15E (Rs mn)
2011 2012 2013E 2014E 2015EProfit model Revenues 158,551 210,312 253,529 286,199 309,289
EBITDA 26,270 39,224 55,595 56,593 59,690 Depreciation (incl amortization of intangibles) (4,915) (5,653) (6,725) (7,433) (8,062)
Other income (541) (1,125) 1,173 3,433 5,091
Pretax profits 20,814 32,446 50,043 52,593 56,719 Tax (4,812) (8,151) (12,018) (12,816) (14,180)
Profit after tax 16,002 24,295 38,026 39,777 42,539 Diluted earnings per share (Rs) 22.9 34.6 53.9 55.9 59.7 Balance sheetTotal equity 84,375 97,707 135,779 167,946 197,956
Deferred taxation liability 1,054 956 1,021 1,026 1,011
Total borrowings 21,253 17,502 11,659 5,785 3,020
Minority interest 22 2 2 2 2
Other non-current liabilities 6,182 11,422 13,423 14,803 15,689
Current liabilities 33,440 44,747 47,778 52,387 55,229
Total liabilities and equity 146,326 172,336 209,663 241,950 272,906 Cash 15,993 18,199 41,804 60,861 82,295
Other current assets 46,640 62,508 71,550 81,917 89,876
Goodwill and intangible assets 41,903 44,983 47,592 47,411 46,292
Tangible fixed assets 22,179 22,558 24,131 25,600 27,410
Investments 9,212 7,653 5,698 5,727 5,641
Other non-current assets 10,398 16,436 18,889 20,434 21,392
Total assets 146,326 172,336 209,663 241,950 272,906 Free cash flowOperating cash flow, excl. working capital 20,127 31,074 43,577 43,777 45,510
Working capital changes (6,484) (3,285) (4,912) (5,771) (5,716)
Capital expenditure (7,699) (9,058) (6,307) (8,346) (9,849)
Acquisition (693) — — — —
Free cash flow 5,251 18,731 32,358 29,659 29,945 Ratios (%)EBITDA margin 16.6 18.7 21.9 19.8 19.3
EBIT margin 13.5 16.0 19.3 17.2 16.7
Debt/equity 0.3 0.2 0.1 0.0 0.0
Net debt/equity (0.0) (0.1) (0.3) (0.4) (0.4)
Source: Company, Kotak Institutional Equities estimates
For private Circulation Only. FOR IMPORTANT INFORMATION ABOUT KOTAK SECURITIES’ RATING SYSTEM AND OTHER DISCLOSURES, REFER TO THE END OF THIS MATERIAL.
Financial markets continue to provide strong earnings support
Yes Bank reported another quarter of strong performance with earnings growth (33% yoy) driven by balance sheet growth (35% yoy), NIM expansion (40% NII growth) and strong fee income. Treasury income contribution was high at 8% of PBT or ~10 bps of investments. Low loan impairment and favorable phase of the interest rate cycle are giving a strong foundation to focus on growth, but we remain cautious on the ability to maintain NPLs at these levels (net NPL at 0.01%). Non-interest income continues to be driven primarily by volatile financial markets (investment banking and corporate finance advisory business).
Issues persist: Earnings to see deterioration while low tier-1 ratio is a key risk; maintain REDUCE
We broadly maintain our estimates for FY2014-15E but marginally tweak our NIM assumption downward as the competitive intensity is likely to increase over the medium term in corporate loans. We expect subdued earnings growth (8% CAGR for FY2013-15E) despite moderate NIM expansion as risk of loan impairment remains high. The contribution from non-interest income could see a slowdown from financial advisory but partially offset by higher income from treasury. We do not have a positive view on loan impairment which should result in credit costs normalizing from current low levels, as stress emerging from large corporate loans remains high (management outlook for FY2014E is at ~50-60 bps as compared to our estimates of ~100-120 bps by FY2015E). We maintain our fair value of the bank (12 months forward) at `450 (unchanged) which implies 2.3X book and 12X EPS. Maintain REDUCE.
Financial advisory ~45% of PBT/non-interest income; transaction banking income subdued
Fee income continues to surprise positively on the back of strong performance from financial advisory. The contribution from financial advisory has increased to ~45% of non-interest income/PBT as compared to ~20% of fee income a few years ago. We expect a decline in contribution from this business given the lumpy nature of these transactions and a higher contribution in FY2013. Growth in transaction banking (~33% yoy) is slower than expected despite strong investments by the bank and healthy client additions in the previous few years.
YES Bank (YES)
Banks/Financial Institutions
No slowdown as yet; financial advisory contribution remains high. 4QFY13 was a strong quarter for Yes Bank with earnings (33% yoy) driven by healthy business/revenue growth. Loan impairment was negligible but management outlook appears to be a lot more cautious, in our view. The contribution of volatile financial advisory income remains high (~45% of PBT/non-interest income)—a key disappointment. Quality of earnings is likely to deteriorate with higher reliance on treasury income while low tier-1 ratio remains a key risk in light of possible normalization of credit costs. Maintain REDUCE.
Yes BankStock data Forecasts/Valuations 2013 2014E 2015E
52-week range (Rs) (high,low) EPS (Rs) 36.3 36.9 41.0Market Cap. (Rs bn) 169.2 EPS growth (%) 31.0 1.8 11.1
Shareholding pattern (%) P/E (X) 13.2 13.0 11.7Promoters 25.8 NII (Rs bn) 22.2 28.2 34.5FIIs 48.3 Net profits (Rs bn) 13.0 13.2 14.7MFs 5.3 BVPS 161.8 190.4 222.2
Price performance (%) 1M 3M 12M P/B (X) 3.0 2.5 2.2Absolute 1.2 (8.5) 29.1 ROE (%) 24.8 20.9 19.7Rel. to BSE-30 5.0 (2.5) 19.7 Div. Yield (%) 1.3 1.3 1.4
Company data and valuation summary
545-285
REDUCE
APRIL 18, 2013
RESULT
Coverage view: Cautious
Price (Rs): 479
Target price (Rs): 450
BSE-30: 18,731
QUICK NUMBERS
• Net income grows 33% yoy; NII grows 42% yoy
• Gross NPLs at 0.2%; net NPLs at 0.01%; restructured loans at 0.3%
• Maintain REDUCE; TP unchanged
YES Bank Banks/Financial Institutions
KOTAK INSTITUTIONAL EQUITIES RESEARCH 17
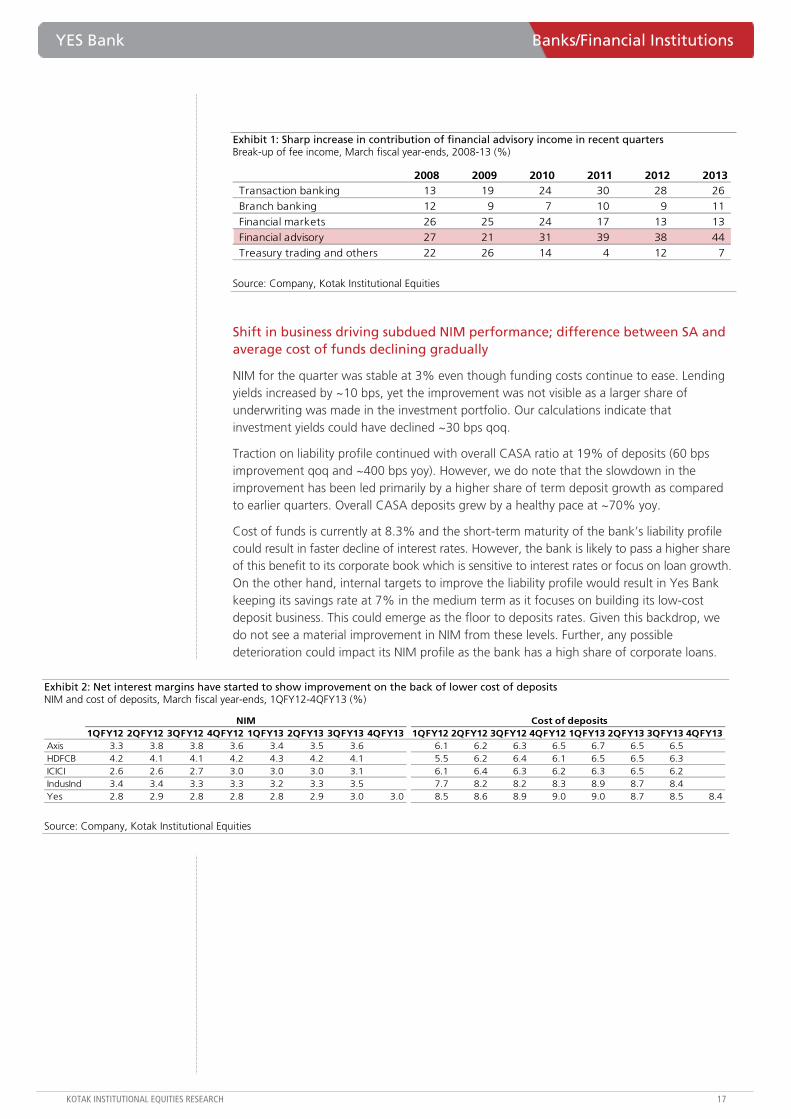
Exhibit 1: Sharp increase in contribution of financial advisory income in recent quarters Break-up of fee income, March fiscal year-ends, 2008-13 (%)
2008 2009 2010 2011 2012 2013Transaction banking 13 19 24 30 28 26
Branch banking 12 9 7 10 9 11
Financial markets 26 25 24 17 13 13
Financial advisory 27 21 31 39 38 44
Treasury trading and others 22 26 14 4 12 7
Source: Company, Kotak Institutional Equities
Shift in business driving subdued NIM performance; difference between SA and average cost of funds declining gradually
NIM for the quarter was stable at 3% even though funding costs continue to ease. Lending yields increased by ~10 bps, yet the improvement was not visible as a larger share of underwriting was made in the investment portfolio. Our calculations indicate that investment yields could have declined ~30 bps qoq.
Traction on liability profile continued with overall CASA ratio at 19% of deposits (60 bps improvement qoq and ~400 bps yoy). However, we do note that the slowdown in the improvement has been led primarily by a higher share of term deposit growth as compared to earlier quarters. Overall CASA deposits grew by a healthy pace at ~70% yoy.
Cost of funds is currently at 8.3% and the short-term maturity of the bank’s liability profile could result in faster decline of interest rates. However, the bank is likely to pass a higher share of this benefit to its corporate book which is sensitive to interest rates or focus on loan growth. On the other hand, internal targets to improve the liability profile would result in Yes Bank keeping its savings rate at 7% in the medium term as it focuses on building its low-cost deposit business. This could emerge as the floor to deposits rates. Given this backdrop, we do not see a material improvement in NIM from these levels. Further, any possible deterioration could impact its NIM profile as the bank has a high share of corporate loans.
Exhibit 2: Net interest margins have started to show improvement on the back of lower cost of deposits NIM and cost of deposits, March fiscal year-ends, 1QFY12-4QFY13 (%)
1QFY12 2QFY12 3QFY12 4QFY12 1QFY13 2QFY13 3QFY13 4QFY13 1QFY12 2QFY12 3QFY12 4QFY12 1QFY13 2QFY13 3QFY13 4QFY13Axis 3.3 3.8 3.8 3.6 3.4 3.5 3.6 6.1 6.2 6.3 6.5 6.7 6.5 6.5HDFCB 4.2 4.1 4.1 4.2 4.3 4.2 4.1 5.5 6.2 6.4 6.1 6.5 6.5 6.3ICICI 2.6 2.6 2.7 3.0 3.0 3.0 3.1 6.1 6.4 6.3 6.2 6.3 6.5 6.2IndusInd 3.4 3.4 3.3 3.3 3.2 3.3 3.5 7.7 8.2 8.2 8.3 8.9 8.7 8.4Yes 2.8 2.9 2.8 2.8 2.8 2.9 3.0 3.0 8.5 8.6 8.9 9.0 9.0 8.7 8.5 8.4
NIM Cost of deposits
Source: Company, Kotak Institutional Equities
Banks/Financial Institutions YES Bank
18 KOTAK INSTITUTIONAL EQUITIES RESEARCH
Exhibit 3: CASA ratio is at 19% on the basis of deposits Break-up of liabilities, March fiscal year-ends, 2009-13 (%)
2009 2010 2011 2012 2013CASA 8.7 10.5 10.3 15.0 18.9
Current account 7.5 9.1 8.6 9.9 10.0 Savings account 1.2 1.5 1.8 5.1 9.0
Fixed depositsBranch banking 12.0 11.3 13.2 18.0 16.6 Certificate of deposits 12.0 17.3 10.9 9.0 11.5 Institutional deposits 67.3 60.9 65.6 58.0 53.0 CASA / (Assets - Networth) 6.6 8.5 8.6 10.7 13.6
Source: Company, Kotak Institutional Equities
Exhibit 4: Progress of phase-2 is growing as per initial estimates March fiscal year-ends, 2010-15
2010 2013 2015 2010-15E 2010-2013 2013-2015EBranches (#) 150 430 900 43.1 42.1 44.7
ATM (#) 94 951 2,000 84.3 116.3 45.0
Employees (#) 3,034 7,024 12,750 33.3 32.3 34.7 Deposits (Rs bn) 268 670 1,250 36.1 35.7 36.6
Loans (Rs bn) 222 470 1,000 35.1 28.4 45.9
Balance sheet (Rs bn) 364 991 1,500 32.8 39.7 23.0
Phase 2 Growth (%)
Notes: (a) Yes Bank has revised the number of its branches upwards and ATM downwards in FY2012.
Source: Company, Kotak Institutional Equities
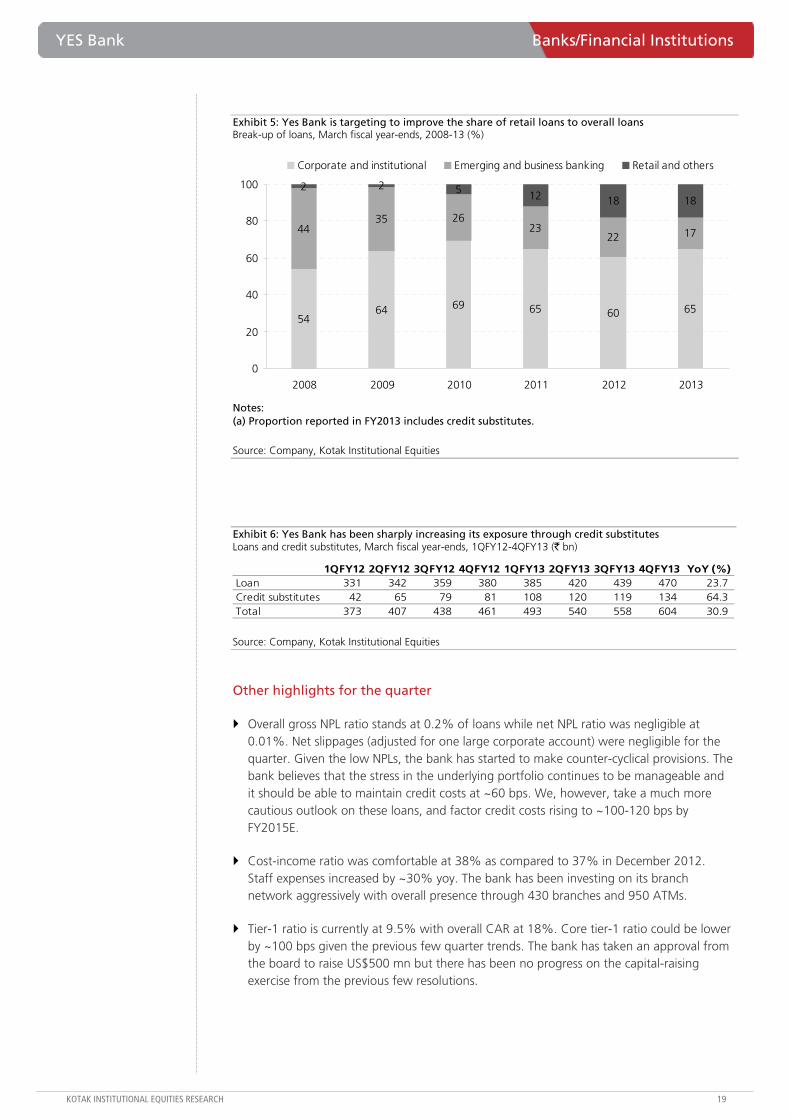
Loan growth strong at 24% yoy; credit substitutes pick up at ~65% yoy
Loans (including loan substitutes) continue to grow ahead of industry average at 31% yoy, led by healthy growth in loans (24% yoy) and substitutes (64% yoy). The slowdown in credit substitutes has again picked up after a muted performance in previous few quarters.
Large corporate exposure is ~65% of loans while mid-corporate exposure is ~17% of loans. Retail loans (18% of loans, including SME) increased primarily from priority lending exposure. Investments in retail banking continue but meaningful contribution is likely to emerge only over the next few years.
We expect overall loan growth at 20% CAGR for FY2013-15E. The bank could see a shortfall in meeting its internal targets on loan growth for FY2015E as it would need to double the balance sheet from current levels.
YES Bank Banks/Financial Institutions
KOTAK INSTITUTIONAL EQUITIES RESEARCH 19
Exhibit 5: Yes Bank is targeting to improve the share of retail loans to overall loans Break-up of loans, March fiscal year-ends, 2008-13 (%)
5464 69 65 60 65
4435 26
2322 17
2 2 5 12 18 18
0
20
40
60
80
100
2008 2009 2010 2011 2012 2013
Corporate and institutional Emerging and business banking Retail and others
Notes: (a) Proportion reported in FY2013 includes credit substitutes.
Source: Company, Kotak Institutional Equities
Exhibit 6: Yes Bank has been sharply increasing its exposure through credit substitutes Loans and credit substitutes, March fiscal year-ends, 1QFY12-4QFY13 (` bn)
1QFY12 2QFY12 3QFY12 4QFY12 1QFY13 2QFY13 3QFY13 4QFY13 YoY (%)Loan 331 342 359 380 385 420 439 470 23.7 Credit substitutes 42 65 79 81 108 120 119 134 64.3 Total 373 407 438 461 493 540 558 604 30.9
Source: Company, Kotak Institutional Equities
Other highlights for the quarter
Overall gross NPL ratio stands at 0.2% of loans while net NPL ratio was negligible at 0.01%. Net slippages (adjusted for one large corporate account) were negligible for the quarter. Given the low NPLs, the bank has started to make counter-cyclical provisions. The bank believes that the stress in the underlying portfolio continues to be manageable and it should be able to maintain credit costs at ~60 bps. We, however, take a much more cautious outlook on these loans, and factor credit costs rising to ~100-120 bps by FY2015E.
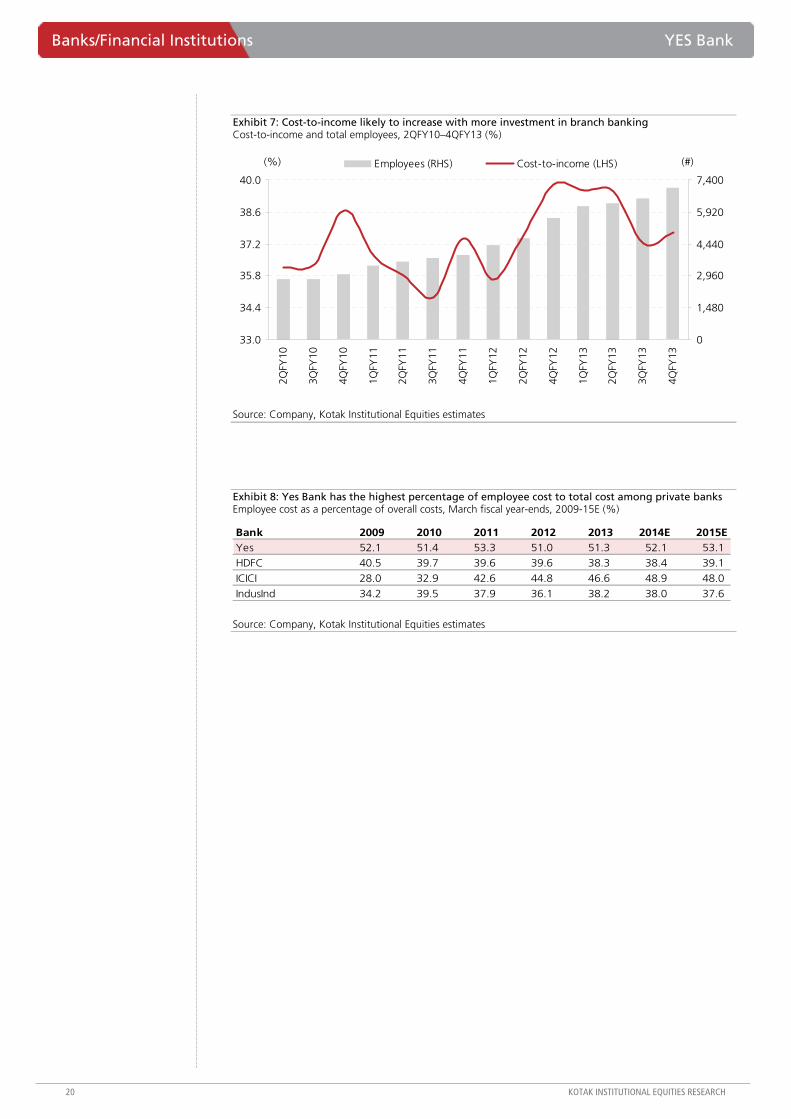
Cost-income ratio was comfortable at 38% as compared to 37% in December 2012. Staff expenses increased by ~30% yoy. The bank has been investing on its branch network aggressively with overall presence through 430 branches and 950 ATMs.
Tier-1 ratio is currently at 9.5% with overall CAR at 18%. Core tier-1 ratio could be lower by ~100 bps given the previous few quarter trends. The bank has taken an approval from the board to raise US$500 mn but there has been no progress on the capital-raising exercise from the previous few resolutions.
Banks/Financial Institutions YES Bank
20 KOTAK INSTITUTIONAL EQUITIES RESEARCH
Exhibit 7: Cost-to-income likely to increase with more investment in branch banking Cost-to-income and total employees, 2QFY10–4QFY13 (%)
33.0
34.4
35.8
37.2
38.6
40.0
2QFY
10
3QFY
10
4QFY
10
1QFY
11
2QFY
11
3QFY
11
4QFY
11
1QFY
12
2QFY
12
4QFY
12
1QFY
13
2QFY
13
3QFY
13
4QFY
13
0
1,480
2,960
4,440
5,920
7,400
Employees (RHS) Cost-to-income (LHS)(%) (#)
Source: Company, Kotak Institutional Equities estimates
Exhibit 8: Yes Bank has the highest percentage of employee cost to total cost among private banks Employee cost as a percentage of overall costs, March fiscal year-ends, 2009-15E (%)
Bank 2009 2010 2011 2012 2013 2014E 2015EYes 52.1 51.4 53.3 51.0 51.3 52.1 53.1
HDFC 40.5 39.7 39.6 39.6 38.3 38.4 39.1
ICICI 28.0 32.9 42.6 44.8 46.6 48.9 48.0
IndusInd 34.2 39.5 37.9 36.1 38.2 38.0 37.6
Source: Company, Kotak Institutional Equities estimates
YES Bank Banks/Financial Institutions
KOTAK INSTITUTIONAL EQUITIES RESEARCH 21
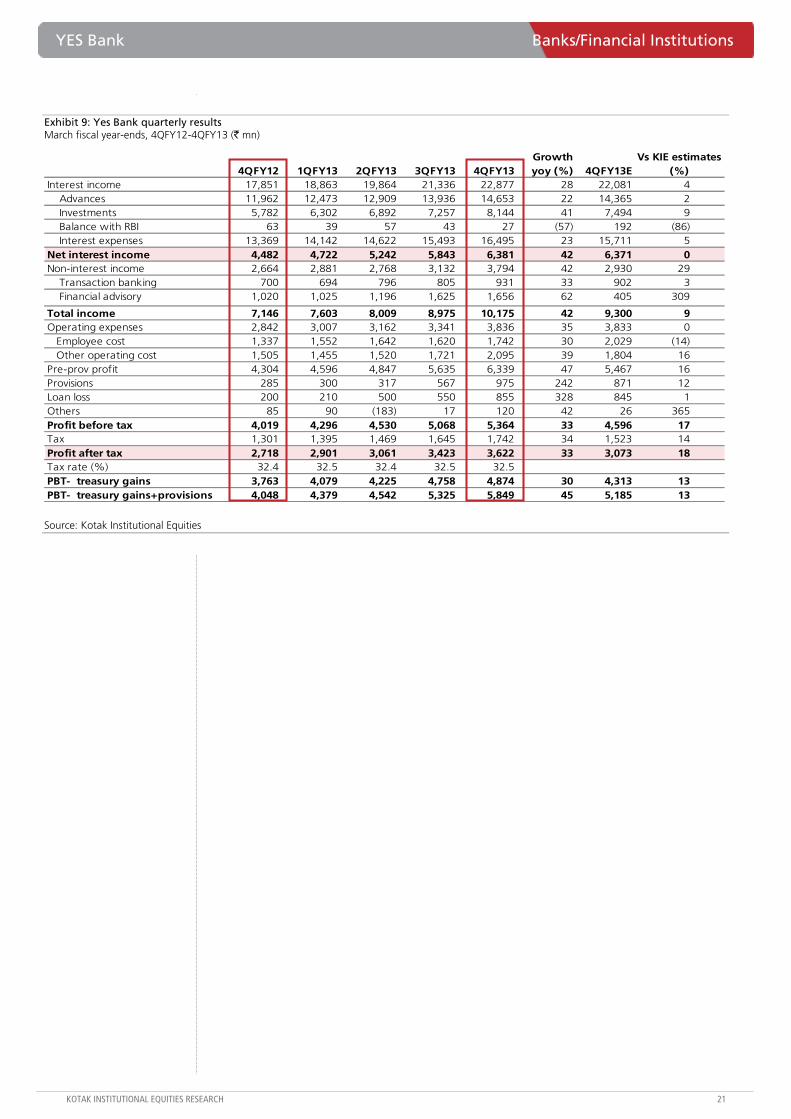
Exhibit 9: Yes Bank quarterly results March fiscal year-ends, 4QFY12-4QFY13 (` mn)
4QFY12 1QFY13 2QFY13 3QFY13 4QFY13Growth yoy (%) 4QFY13E
Vs KIE estimates (%)
Interest income 17,851 18,863 19,864 21,336 22,877 28 22,081 4 Advances 11,962 12,473 12,909 13,936 14,653 22 14,365 2 Investments 5,782 6,302 6,892 7,257 8,144 41 7,494 9 Balance with RBI 63 39 57 43 27 (57) 192 (86)Interest expenses 13,369 14,142 14,622 15,493 16,495 23 15,711 5
Net interest income 4,482 4,722 5,242 5,843 6,381 42 6,371 0 Non-interest income 2,664 2,881 2,768 3,132 3,794 42 2,930 29
Transaction banking 700 694 796 805 931 33 902 3 Financial advisory 1,020 1,025 1,196 1,625 1,656 62 405 309
Total income 7,146 7,603 8,009 8,975 10,175 42 9,300 9 Operating expenses 2,842 3,007 3,162 3,341 3,836 35 3,833 0 Employee cost 1,337 1,552 1,642 1,620 1,742 30 2,029 (14) Other operating cost 1,505 1,455 1,520 1,721 2,095 39 1,804 16 Pre-prov profit 4,304 4,596 4,847 5,635 6,339 47 5,467 16 Provisions 285 300 317 567 975 242 871 12 Loan loss 200 210 500 550 855 328 845 1 Others 85 90 (183) 17 120 42 26 365 Profit before tax 4,019 4,296 4,530 5,068 5,364 33 4,596 17 Tax 1,301 1,395 1,469 1,645 1,742 34 1,523 14 Profit after tax 2,718 2,901 3,061 3,423 3,622 33 3,073 18 Tax rate (%) 32.4 32.5 32.4 32.5 32.5 PBT- treasury gains 3,763 4,079 4,225 4,758 4,874 30 4,313 13 PBT- treasury gains+provisions 4,048 4,379 4,542 5,325 5,849 45 5,185 13
Source: Kotak Institutional Equities
Banks/Financial Institutions YES Bank
22 KOTAK INSTITUTIONAL EQUITIES RESEARCH
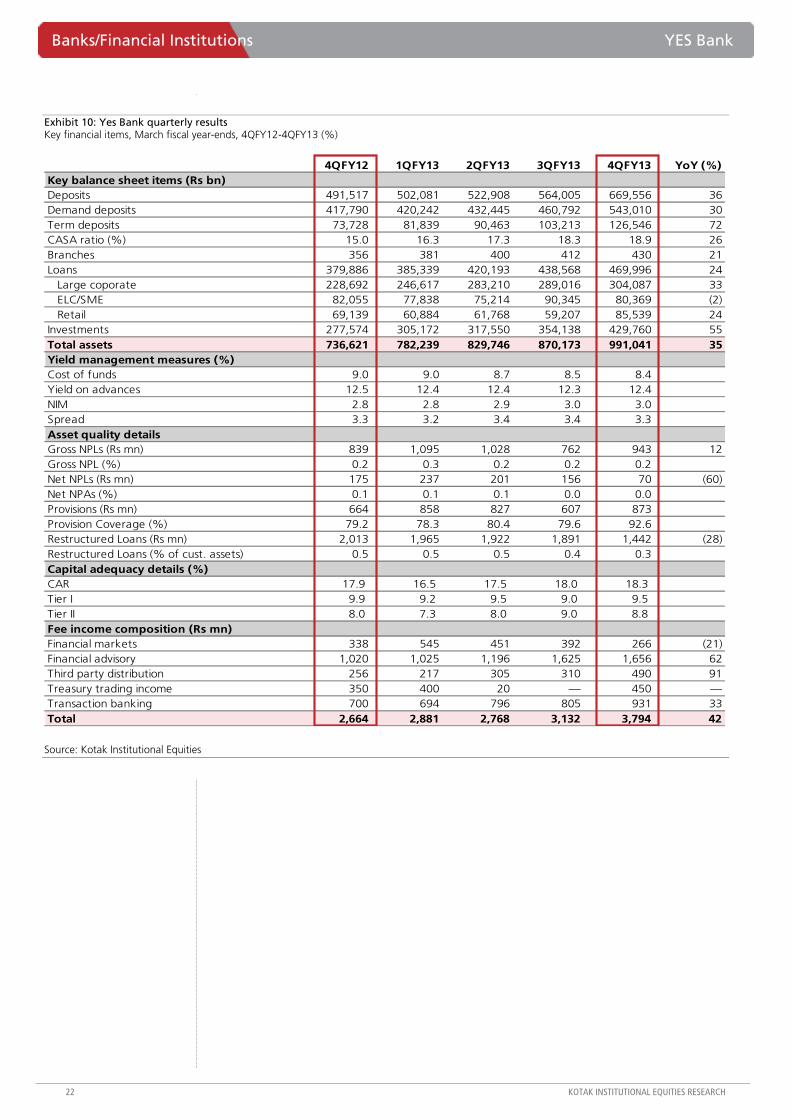
Exhibit 10: Yes Bank quarterly results Key financial items, March fiscal year-ends, 4QFY12-4QFY13 (%)
4QFY12 1QFY13 2QFY13 3QFY13 4QFY13 YoY (%)Key balance sheet items (Rs bn)Deposits 491,517 502,081 522,908 564,005 669,556 36 Demand deposits 417,790 420,242 432,445 460,792 543,010 30 Term deposits 73,728 81,839 90,463 103,213 126,546 72 CASA ratio (%) 15.0 16.3 17.3 18.3 18.9 26 Branches 356 381 400 412 430 21 Loans 379,886 385,339 420,193 438,568 469,996 24 Large coporate 228,692 246,617 283,210 289,016 304,087 33 ELC/SME 82,055 77,838 75,214 90,345 80,369 (2) Retail 69,139 60,884 61,768 59,207 85,539 24 Investments 277,574 305,172 317,550 354,138 429,760 55 Total assets 736,621 782,239 829,746 870,173 991,041 35 Yield management measures (%)Cost of funds 9.0 9.0 8.7 8.5 8.4 Yield on advances 12.5 12.4 12.4 12.3 12.4 NIM 2.8 2.8 2.9 3.0 3.0 Spread 3.3 3.2 3.4 3.4 3.3 Asset quality detailsGross NPLs (Rs mn) 839 1,095 1,028 762 943 12 Gross NPL (%) 0.2 0.3 0.2 0.2 0.2 Net NPLs (Rs mn) 175 237 201 156 70 (60)Net NPAs (%) 0.1 0.1 0.1 0.0 0.0 Provisions (Rs mn) 664 858 827 607 873 Provision Coverage (%) 79.2 78.3 80.4 79.6 92.6 Restructured Loans (Rs mn) 2,013 1,965 1,922 1,891 1,442 (28)Restructured Loans (% of cust. assets) 0.5 0.5 0.5 0.4 0.3 Capital adequacy details (%)CAR 17.9 16.5 17.5 18.0 18.3 Tier I 9.9 9.2 9.5 9.0 9.5 Tier II 8.0 7.3 8.0 9.0 8.8 Fee income composition (Rs mn)Financial markets 338 545 451 392 266 (21)Financial advisory 1,020 1,025 1,196 1,625 1,656 62 Third party distribution 256 217 305 310 490 91 Treasury trading income 350 400 20 — 450 —Transaction banking 700 694 796 805 931 33 Total 2,664 2,881 2,768 3,132 3,794 42
Source: Kotak Institutional Equities
YES Bank Banks/Financial Institutions
KOTAK INSTITUTIONAL EQUITIES RESEARCH 23
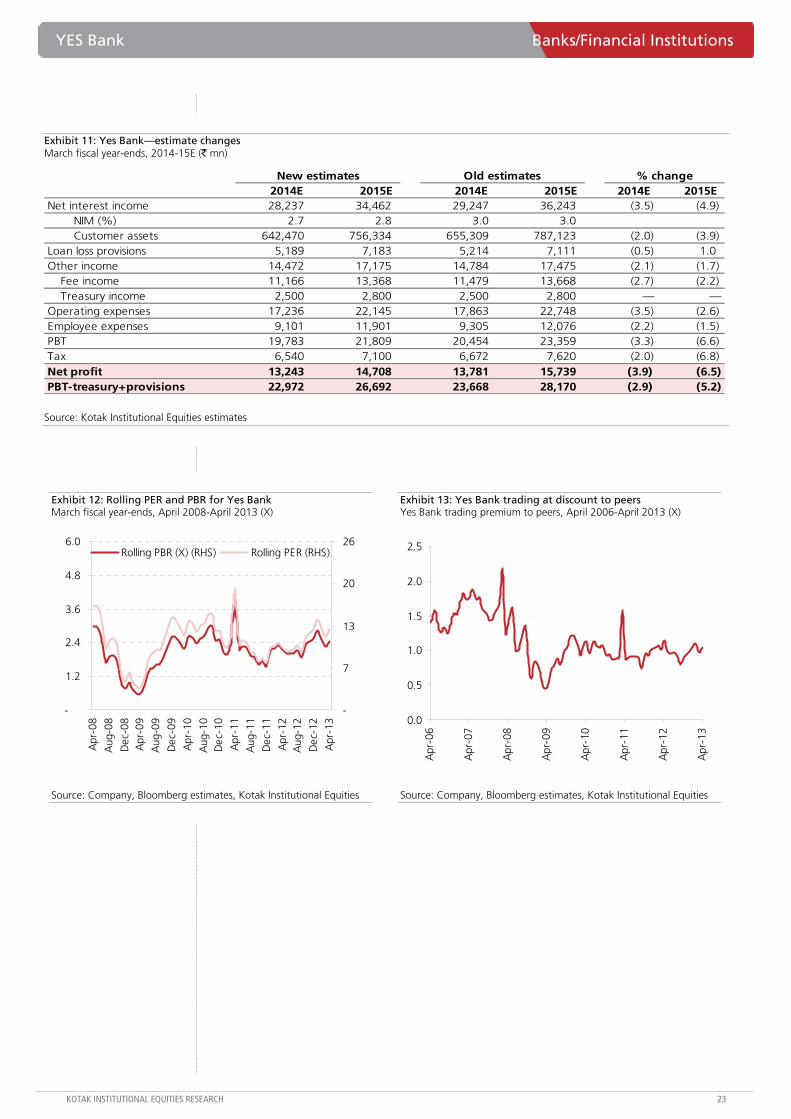
Exhibit 11: Yes Bank—estimate changes March fiscal year-ends, 2014-15E (` mn)
New estimates Old estimates % change2014E 2015E 2014E 2015E 2014E 2015E
Net interest income 28,237 34,462 29,247 36,243 (3.5) (4.9)NIM (%) 2.7 2.8 3.0 3.0 Customer assets 642,470 756,334 655,309 787,123 (2.0) (3.9)
Loan loss provisions 5,189 7,183 5,214 7,111 (0.5) 1.0 Other income 14,472 17,175 14,784 17,475 (2.1) (1.7)
Fee income 11,166 13,368 11,479 13,668 (2.7) (2.2)Treasury income 2,500 2,800 2,500 2,800 — —
Operating expenses 17,236 22,145 17,863 22,748 (3.5) (2.6)Employee expenses 9,101 11,901 9,305 12,076 (2.2) (1.5)PBT 19,783 21,809 20,454 23,359 (3.3) (6.6)Tax 6,540 7,100 6,672 7,620 (2.0) (6.8)Net profit 13,243 14,708 13,781 15,739 (3.9) (6.5)PBT-treasury+provisions 22,972 26,692 23,668 28,170 (2.9) (5.2)
Source: Kotak Institutional Equities estimates
Exhibit 12: Rolling PER and PBR for Yes Bank March fiscal year-ends, April 2008-April 2013 (X)
-
1.2
2.4
3.6
4.8
6.0
Apr
-08
Aug
-08
Dec
-08
Apr
-09
Aug
-09
Dec
-09
Apr
-10
Aug
-10
Dec
-10
Apr
-11
Aug
-11
Dec
-11
Apr
-12
Aug
-12
Dec
-12
Apr
-13
-
7
13
20
26Rolling PBR (X) (RHS) Rolling PER (RHS)
Source: Company, Bloomberg estimates, Kotak Institutional Equities
Exhibit 13: Yes Bank trading at discount to peers Yes Bank trading premium to peers, April 2006-April 2013 (X)
0.0
0.5
1.0
1.5
2.0
2.5
Apr
-06
Apr
-07
Apr
-08
Apr
-09
Apr
-10
Apr
-11
Apr
-12
Apr
-13
Source: Company, Bloomberg estimates, Kotak Institutional Equities
Banks/Financial Institutions YES Bank
24 KOTAK INSTITUTIONAL EQUITIES RESEARCH
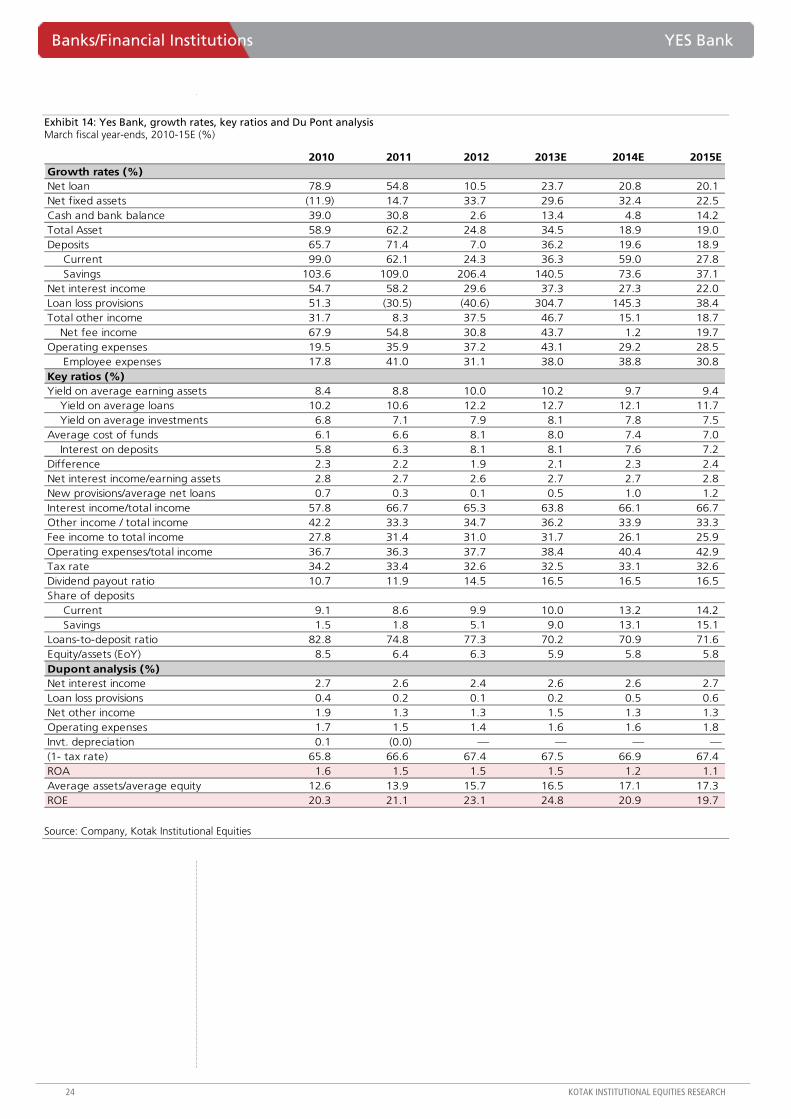
Exhibit 14: Yes Bank, growth rates, key ratios and Du Pont analysis March fiscal year-ends, 2010-15E (%)
2010 2011 2012 2013E 2014E 2015EGrowth rates (%)Net loan 78.9 54.8 10.5 23.7 20.8 20.1 Net fixed assets (11.9) 14.7 33.7 29.6 32.4 22.5 Cash and bank balance 39.0 30.8 2.6 13.4 4.8 14.2 Total Asset 58.9 62.2 24.8 34.5 18.9 19.0 Deposits 65.7 71.4 7.0 36.2 19.6 18.9 Current 99.0 62.1 24.3 36.3 59.0 27.8 Savings 103.6 109.0 206.4 140.5 73.6 37.1 Net interest income 54.7 58.2 29.6 37.3 27.3 22.0 Loan loss provisions 51.3 (30.5) (40.6) 304.7 145.3 38.4 Total other income 31.7 8.3 37.5 46.7 15.1 18.7 Net fee income 67.9 54.8 30.8 43.7 1.2 19.7 Operating expenses 19.5 35.9 37.2 43.1 29.2 28.5 Employee expenses 17.8 41.0 31.1 38.0 38.8 30.8 Key ratios (%)Yield on average earning assets 8.4 8.8 10.0 10.2 9.7 9.4
Yield on average loans 10.2 10.6 12.2 12.7 12.1 11.7 Yield on average investments 6.8 7.1 7.9 8.1 7.8 7.5
Average cost of funds 6.1 6.6 8.1 8.0 7.4 7.0 Interest on deposits 5.8 6.3 8.1 8.1 7.6 7.2
Difference 2.3 2.2 1.9 2.1 2.3 2.4 Net interest income/earning assets 2.8 2.7 2.6 2.7 2.7 2.8 New provisions/average net loans 0.7 0.3 0.1 0.5 1.0 1.2 Interest income/total income 57.8 66.7 65.3 63.8 66.1 66.7 Other income / total income 42.2 33.3 34.7 36.2 33.9 33.3 Fee income to total income 27.8 31.4 31.0 31.7 26.1 25.9 Operating expenses/total income 36.7 36.3 37.7 38.4 40.4 42.9 Tax rate 34.2 33.4 32.6 32.5 33.1 32.6 Dividend payout ratio 10.7 11.9 14.5 16.5 16.5 16.5 Share of deposits Current 9.1 8.6 9.9 10.0 13.2 14.2 Savings 1.5 1.8 5.1 9.0 13.1 15.1 Loans-to-deposit ratio 82.8 74.8 77.3 70.2 70.9 71.6 Equity/assets (EoY) 8.5 6.4 6.3 5.9 5.8 5.8 Dupont analysis (%)Net interest income 2.7 2.6 2.4 2.6 2.6 2.7 Loan loss provisions 0.4 0.2 0.1 0.2 0.5 0.6 Net other income 1.9 1.3 1.3 1.5 1.3 1.3 Operating expenses 1.7 1.5 1.4 1.6 1.6 1.8 Invt. depreciation 0.1 (0.0) — — — —(1- tax rate) 65.8 66.6 67.4 67.5 66.9 67.4 ROA 1.6 1.5 1.5 1.5 1.2 1.1 Average assets/average equity 12.6 13.9 15.7 16.5 17.1 17.3 ROE 20.3 21.1 23.1 24.8 20.9 19.7
Source: Company, Kotak Institutional Equities
YES Bank Banks/Financial Institutions
KOTAK INSTITUTIONAL EQUITIES RESEARCH 25
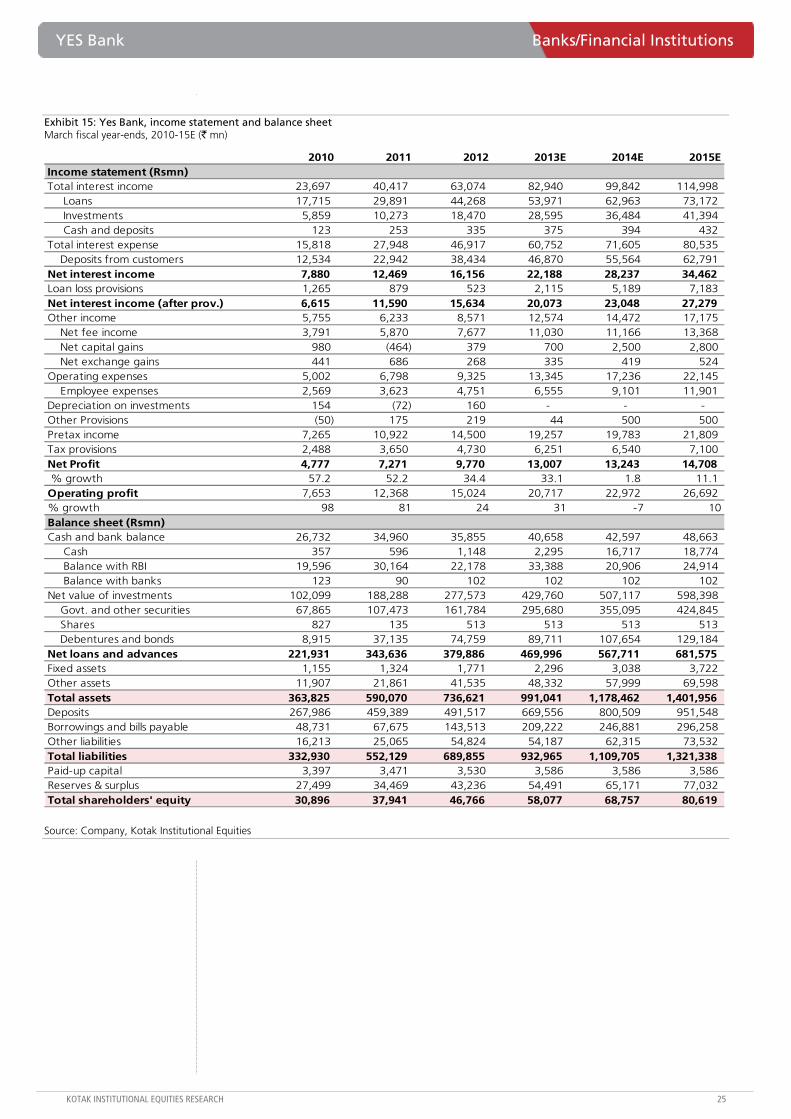
Exhibit 15: Yes Bank, income statement and balance sheet March fiscal year-ends, 2010-15E (` mn)
2010 2011 2012 2013E 2014E 2015EIncome statement (Rsmn)Total interest income 23,697 40,417 63,074 82,940 99,842 114,998 Loans 17,715 29,891 44,268 53,971 62,963 73,172 Investments 5,859 10,273 18,470 28,595 36,484 41,394 Cash and deposits 123 253 335 375 394 432 Total interest expense 15,818 27,948 46,917 60,752 71,605 80,535
Deposits from customers 12,534 22,942 38,434 46,870 55,564 62,791 Net interest income 7,880 12,469 16,156 22,188 28,237 34,462 Loan loss provisions 1,265 879 523 2,115 5,189 7,183 Net interest income (after prov.) 6,615 11,590 15,634 20,073 23,048 27,279 Other income 5,755 6,233 8,571 12,574 14,472 17,175
Net fee income 3,791 5,870 7,677 11,030 11,166 13,368 Net capital gains 980 (464) 379 700 2,500 2,800 Net exchange gains 441 686 268 335 419 524
Operating expenses 5,002 6,798 9,325 13,345 17,236 22,145 Employee expenses 2,569 3,623 4,751 6,555 9,101 11,901
Depreciation on investments 154 (72) 160 - - - Other Provisions (50) 175 219 44 500 500 Pretax income 7,265 10,922 14,500 19,257 19,783 21,809 Tax provisions 2,488 3,650 4,730 6,251 6,540 7,100 Net Profit 4,777 7,271 9,770 13,007 13,243 14,708 % growth 57.2 52.2 34.4 33.1 1.8 11.1 Operating profit 7,653 12,368 15,024 20,717 22,972 26,692 % growth 98 81 24 31 -7 10Balance sheet (Rsmn)Cash and bank balance 26,732 34,960 35,855 40,658 42,597 48,663 Cash 357 596 1,148 2,295 16,717 18,774 Balance with RBI 19,596 30,164 22,178 33,388 20,906 24,914 Balance with banks 123 90 102 102 102 102 Net value of investments 102,099 188,288 277,573 429,760 507,117 598,398
Govt. and other securities 67,865 107,473 161,784 295,680 355,095 424,845 Shares 827 135 513 513 513 513 Debentures and bonds 8,915 37,135 74,759 89,711 107,654 129,184
Net loans and advances 221,931 343,636 379,886 469,996 567,711 681,575 Fixed assets 1,155 1,324 1,771 2,296 3,038 3,722 Other assets 11,907 21,861 41,535 48,332 57,999 69,598 Total assets 363,825 590,070 736,621 991,041 1,178,462 1,401,956 Deposits 267,986 459,389 491,517 669,556 800,509 951,548 Borrowings and bills payable 48,731 67,675 143,513 209,222 246,881 296,258 Other liabilities 16,213 25,065 54,824 54,187 62,315 73,532 Total liabilities 332,930 552,129 689,855 932,965 1,109,705 1,321,338 Paid-up capital 3,397 3,471 3,530 3,586 3,586 3,586 Reserves & surplus 27,499 34,469 43,236 54,491 65,171 77,032 Total shareholders' equity 30,896 37,941 46,766 58,077 68,757 80,619
Source: Company, Kotak Institutional Equities
For private Circulation Only. FOR IMPORTANT INFORMATION ABOUT KOTAK SECURITIES’ RATING SYSTEM AND OTHER DISCLOSURES, REFER TO THE END OF THIS MATERIAL.
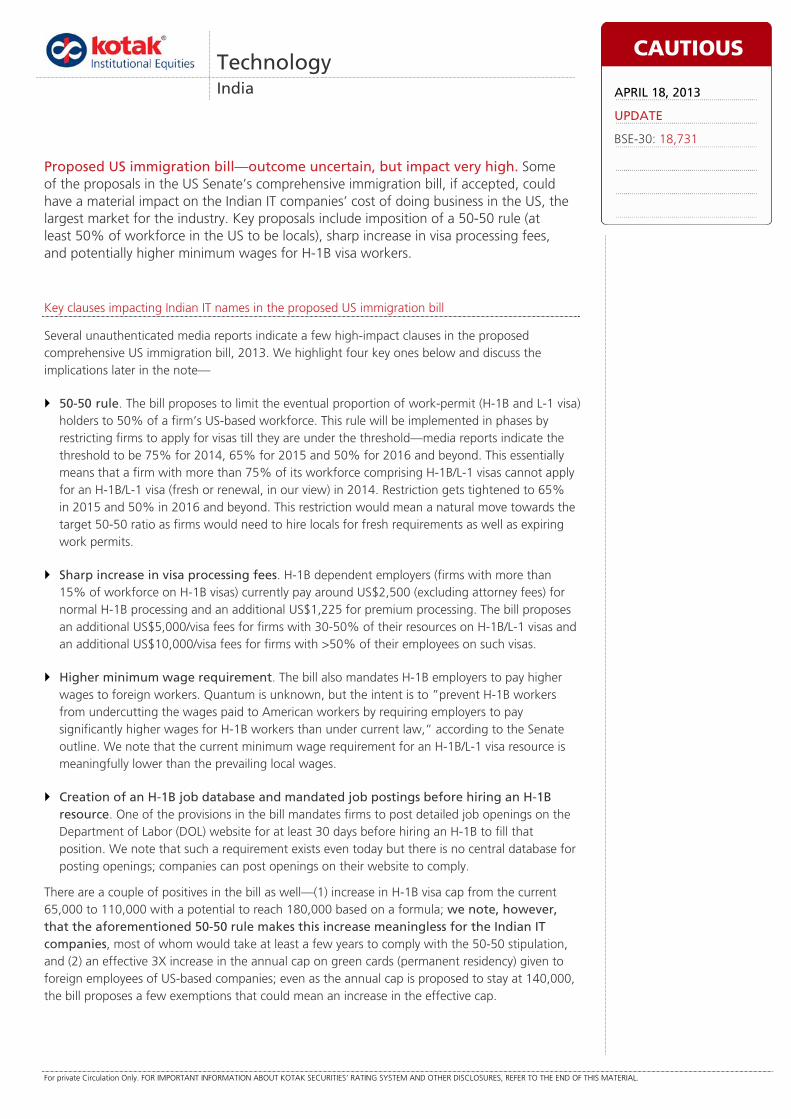
Key clauses impacting Indian IT names in the proposed US immigration bill
Several unauthenticated media reports indicate a few high-impact clauses in the proposed comprehensive US immigration bill, 2013. We highlight four key ones below and discuss the implications later in the note—
50-50 rule. The bill proposes to limit the eventual proportion of work-permit (H-1B and L-1 visa) holders to 50% of a firm’s US-based workforce. This rule will be implemented in phases by restricting firms to apply for visas till they are under the threshold—media reports indicate the threshold to be 75% for 2014, 65% for 2015 and 50% for 2016 and beyond. This essentially means that a firm with more than 75% of its workforce comprising H-1B/L-1 visas cannot apply for an H-1B/L-1 visa (fresh or renewal, in our view) in 2014. Restriction gets tightened to 65% in 2015 and 50% in 2016 and beyond. This restriction would mean a natural move towards the target 50-50 ratio as firms would need to hire locals for fresh requirements as well as expiring work permits.
Sharp increase in visa processing fees. H-1B dependent employers (firms with more than 15% of workforce on H-1B visas) currently pay around US$2,500 (excluding attorney fees) for normal H-1B processing and an additional US$1,225 for premium processing. The bill proposes an additional US$5,000/visa fees for firms with 30-50% of their resources on H-1B/L-1 visas and an additional US$10,000/visa fees for firms with >50% of their employees on such visas.
Higher minimum wage requirement. The bill also mandates H-1B employers to pay higher wages to foreign workers. Quantum is unknown, but the intent is to ”prevent H-1B workers from undercutting the wages paid to American workers by requiring employers to pay significantly higher wages for H-1B workers than under current law,” according to the Senate outline. We note that the current minimum wage requirement for an H-1B/L-1 visa resource is meaningfully lower than the prevailing local wages.
Creation of an H-1B job database and mandated job postings before hiring an H-1B resource. One of the provisions in the bill mandates firms to post detailed job openings on the Department of Labor (DOL) website for at least 30 days before hiring an H-1B to fill that position. We note that such a requirement exists even today but there is no central database for posting openings; companies can post openings on their website to comply.
There are a couple of positives in the bill as well—(1) increase in H-1B visa cap from the current 65,000 to 110,000 with a potential to reach 180,000 based on a formula; we note, however, that the aforementioned 50-50 rule makes this increase meaningless for the Indian IT companies, most of whom would take at least a few years to comply with the 50-50 stipulation, and (2) an effective 3X increase in the annual cap on green cards (permanent residency) given to foreign employees of US-based companies; even as the annual cap is proposed to stay at 140,000, the bill proposes a few exemptions that could mean an increase in the effective cap.
Technology India
Proposed US immigration bill—outcome uncertain, but impact very high. Some of the proposals in the US Senate’s comprehensive immigration bill, if accepted, could have a material impact on the Indian IT companies’ cost of doing business in the US, the largest market for the industry. Key proposals include imposition of a 50-50 rule (at least 50% of workforce in the US to be locals), sharp increase in visa processing fees, and potentially higher minimum wages for H-1B visa workers.
CAUTIOUS
APRIL 18, 2013
UPDATE
BSE-30: 18,731
Technology India
KOTAK INSTITUTIONAL EQUITIES RESEARCH 27
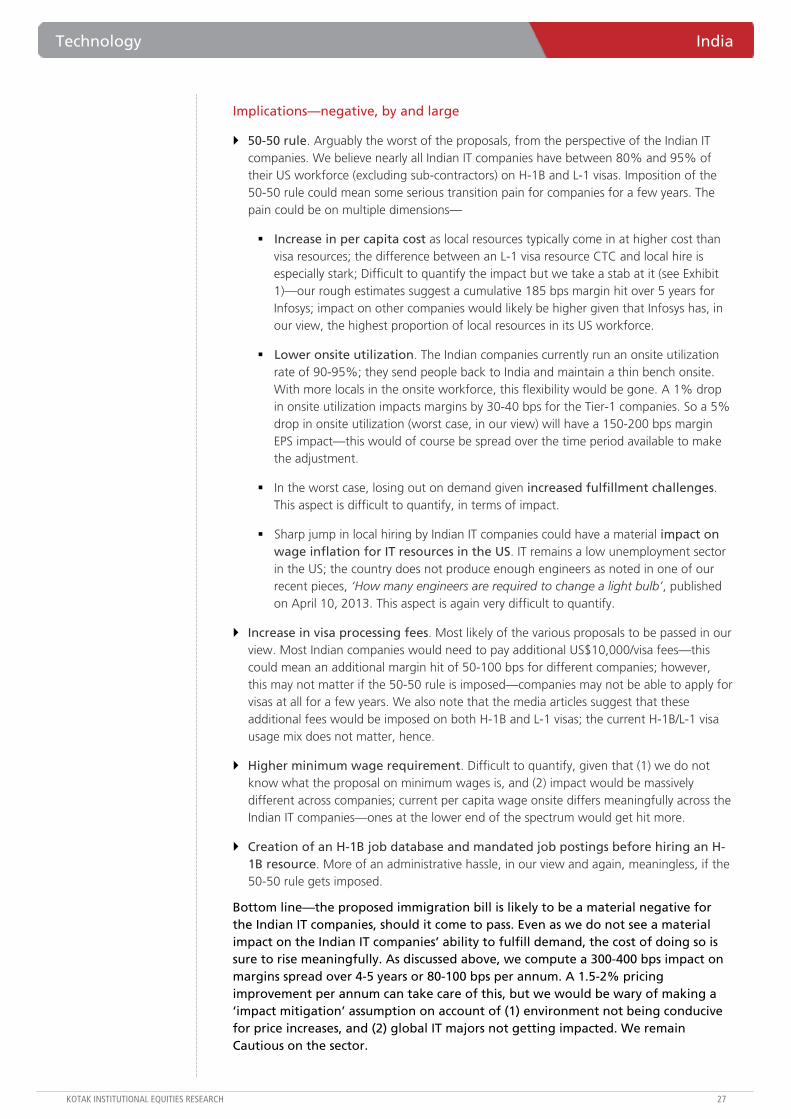
Implications—negative, by and large
50-50 rule. Arguably the worst of the proposals, from the perspective of the Indian IT companies. We believe nearly all Indian IT companies have between 80% and 95% of their US workforce (excluding sub-contractors) on H-1B and L-1 visas. Imposition of the 50-50 rule could mean some serious transition pain for companies for a few years. The pain could be on multiple dimensions—
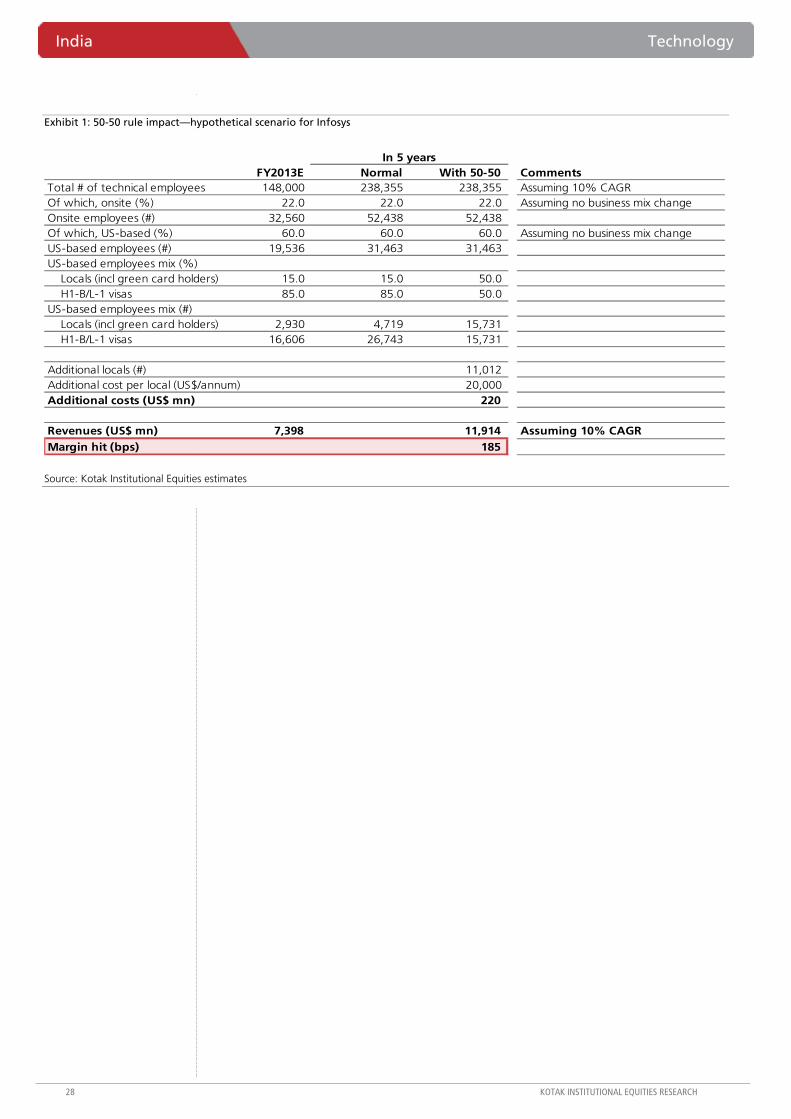
Increase in per capita cost as local resources typically come in at higher cost than visa resources; the difference between an L-1 visa resource CTC and local hire is especially stark; Difficult to quantify the impact but we take a stab at it (see Exhibit 1)—our rough estimates suggest a cumulative 185 bps margin hit over 5 years for Infosys; impact on other companies would likely be higher given that Infosys has, in our view, the highest proportion of local resources in its US workforce.
Lower onsite utilization. The Indian companies currently run an onsite utilization rate of 90-95%; they send people back to India and maintain a thin bench onsite. With more locals in the onsite workforce, this flexibility would be gone. A 1% drop in onsite utilization impacts margins by 30-40 bps for the Tier-1 companies. So a 5% drop in onsite utilization (worst case, in our view) will have a 150-200 bps margin EPS impact—this would of course be spread over the time period available to make the adjustment.
In the worst case, losing out on demand given increased fulfillment challenges. This aspect is difficult to quantify, in terms of impact.
Sharp jump in local hiring by Indian IT companies could have a material impact on wage inflation for IT resources in the US. IT remains a low unemployment sector in the US; the country does not produce enough engineers as noted in one of our recent pieces, ‘How many engineers are required to change a light bulb’, published on April 10, 2013. This aspect is again very difficult to quantify.
Increase in visa processing fees. Most likely of the various proposals to be passed in our view. Most Indian companies would need to pay additional US$10,000/visa fees—this could mean an additional margin hit of 50-100 bps for different companies; however, this may not matter if the 50-50 rule is imposed—companies may not be able to apply for visas at all for a few years. We also note that the media articles suggest that these additional fees would be imposed on both H-1B and L-1 visas; the current H-1B/L-1 visa usage mix does not matter, hence.
Higher minimum wage requirement. Difficult to quantify, given that (1) we do not know what the proposal on minimum wages is, and (2) impact would be massively different across companies; current per capita wage onsite differs meaningfully across the Indian IT companies—ones at the lower end of the spectrum would get hit more.
Creation of an H-1B job database and mandated job postings before hiring an H-1B resource. More of an administrative hassle, in our view and again, meaningless, if the 50-50 rule gets imposed.
Bottom line—the proposed immigration bill is likely to be a material negative for the Indian IT companies, should it come to pass. Even as we do not see a material impact on the Indian IT companies’ ability to fulfill demand, the cost of doing so is sure to rise meaningfully. As discussed above, we compute a 300-400 bps impact on margins spread over 4-5 years or 80-100 bps per annum. A 1.5-2% pricing improvement per annum can take care of this, but we would be wary of making a ‘impact mitigation’ assumption on account of (1) environment not being conducive for price increases, and (2) global IT majors not getting impacted. We remain Cautious on the sector.
India Technology
28 KOTAK INSTITUTIONAL EQUITIES RESEARCH
Exhibit 1: 50-50 rule impact—hypothetical scenario for Infosys
FY2013E Normal With 50-50 CommentsTotal # of technical employees 148,000 238,355 238,355 Assuming 10% CAGROf which, onsite (%) 22.0 22.0 22.0 Assuming no business mix changeOnsite employees (#) 32,560 52,438 52,438 Of which, US-based (%) 60.0 60.0 60.0 Assuming no business mix changeUS-based employees (#) 19,536 31,463 31,463 US-based employees mix (%)
Locals (incl green card holders) 15.0 15.0 50.0 H1-B/L-1 visas 85.0 85.0 50.0
US-based employees mix (#)Locals (incl green card holders) 2,930 4,719 15,731 H1-B/L-1 visas 16,606 26,743 15,731
Additional locals (#) 11,012 Additional cost per local (US$/annum) 20,000 Additional costs (US$ mn) 220
Revenues (US$ mn) 7,398 11,914 Assuming 10% CAGRMargin hit (bps) 185
In 5 years
Source: Kotak Institutional Equities estimates
In
dia D
aily Sum
mary - A
pril 18, 2013
29
KOTAK IN
STITUTIO
NAL EQ
UITIES RESEARCH
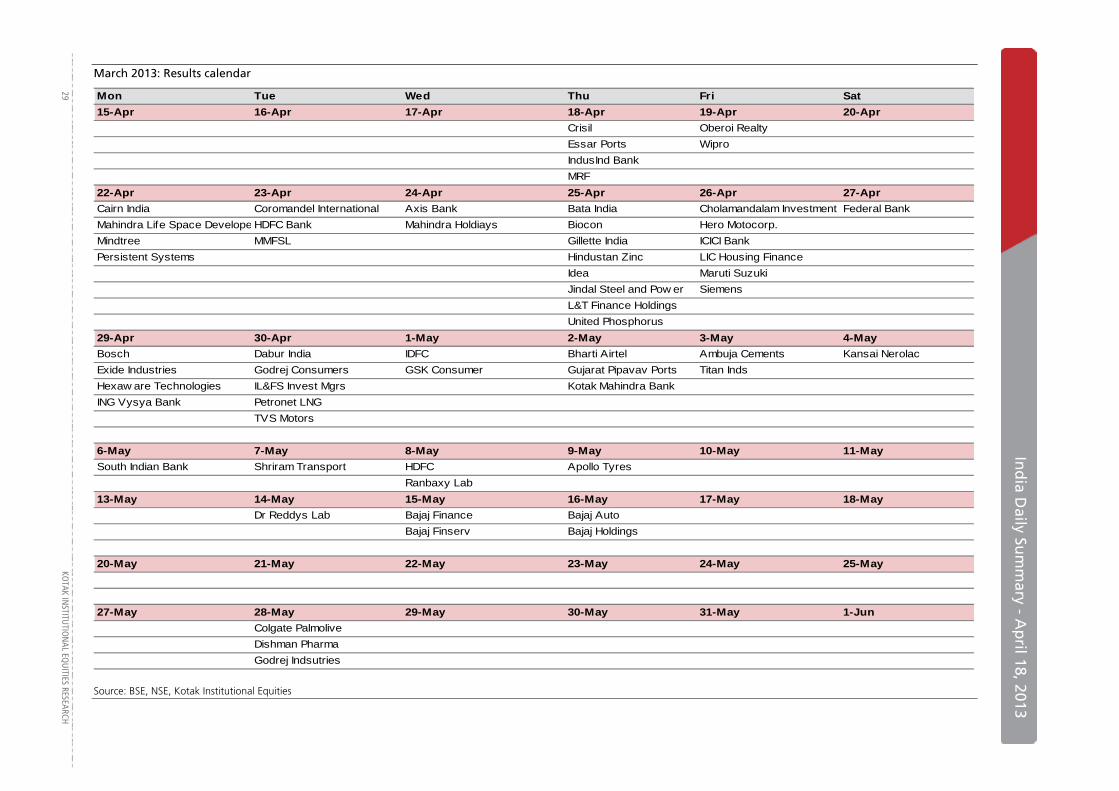
March 2013: Results calendar
Mon Tue Wed Thu Fri Sat15-Apr 16-Apr 17-Apr 18-Apr 19-Apr 20-AprCMC Reliance Industries HCL Technologies Crisil Oberoi Realty
Puravankara Projects Essar Ports WiproTCS IndusInd BankYes Bank MRF
22-Apr 23-Apr 24-Apr 25-Apr 26-Apr 27-AprCairn India Coromandel International Axis Bank Bata India Cholamandalam Investment Federal BankMahindra Life Space Develope HDFC Bank Mahindra Holdiays Biocon Hero Motocorp.Mindtree MMFSL Gillette India ICICI BankPersistent Systems Hindustan Zinc LIC Housing Finance
Idea Maruti SuzukiJindal Steel and Pow er SiemensL&T Finance HoldingsUnited Phosphorus
29-Apr 30-Apr 1-May 2-May 3-May 4-MayBosch Dabur India IDFC Bharti Airtel Ambuja Cements Kansai NerolacExide Industries Godrej Consumers GSK Consumer Gujarat Pipavav Ports Titan IndsHexaw are Technologies IL&FS Invest Mgrs Kotak Mahindra BankING Vysya Bank Petronet LNG
TVS Motors
6-May 7-May 8-May 9-May 10-May 11-MaySouth Indian Bank Shriram Transport HDFC Apollo Tyres
Ranbaxy Lab13-May 14-May 15-May 16-May 17-May 18-May
Dr Reddys Lab Bajaj Finance Bajaj AutoBajaj Finserv Bajaj Holdings
20-May 21-May 22-May 23-May 24-May 25-May
27-May 28-May 29-May 30-May 31-May 1-JunColgate PalmoliveDishman PharmaGodrej Indsutries
Source: BSE, NSE, Kotak Institutional Equities
KO
TAK INSTITUTIO
NAL EQ
UITIES RESEARCH 30
In
dia D
aily Sum
mary - A
pril 1
Ind
ia Daily Su
mm
ary - Ap
ril 18, 2013
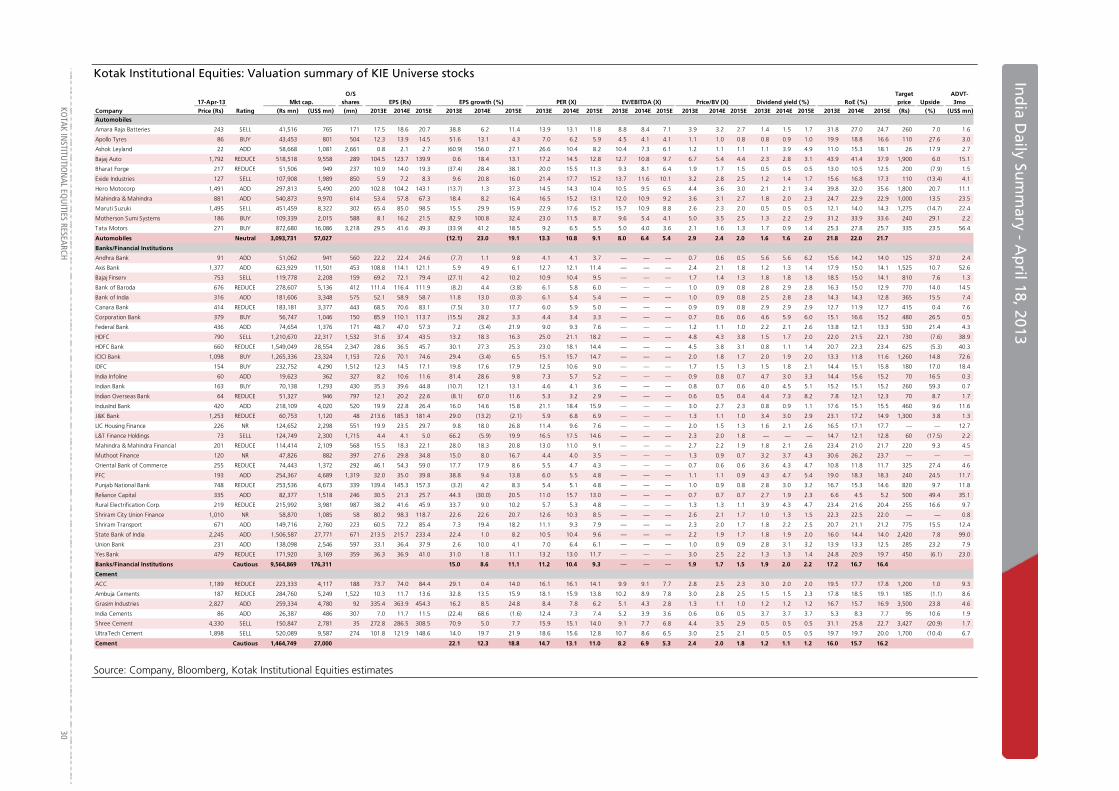
Kotak Institutional Equities: Valuation summary of KIE Universe stocks
17-Apr-13 Mkt cap.O/S
shares EPS (Rs) EPS growth (%) PER (X) EV/EBITDA (X) RoE (%)Target price Upside
ADVT-3mo
Company Price (Rs) Rating (Rs mn) (US$ mn) (mn) 2013E 2014E 2015E 2013E 2014E 2015E 2013E 2014E 2015E 2013E 2014E 2015E 2013E 2014E 2015E 2013E 2014E 2015E 2013E 2014E 2015E (Rs) (%) (US$ mn)Automobiles
Amara Raja Batteries 243 SELL 41,516 765 171 17.5 18.6 20.7 38.8 6.2 11.4 13.9 13.1 11.8 8.8 8.4 7.1 3.9 3.2 2.7 1.4 1.5 1.7 31.8 27.0 24.7 260 7.0 1.6
Apollo Tyres 86 BUY 43,453 801 504 12.3 13.9 14.5 51.6 13.1 4.3 7.0 6.2 5.9 4.5 4.1 4.1 1.1 1.0 0.8 0.8 0.9 1.0 19.9 18.8 16.6 110 27.6 3.0
Ashok Leyland 22 ADD 58,668 1,081 2,661 0.8 2.1 2.7 (60.9) 156.0 27.1 26.6 10.4 8.2 10.4 7.3 6.1 1.2 1.1 1.1 1.1 3.9 4.9 11.0 15.3 18.1 26 17.9 2.7
Bajaj Auto 1,792 REDUCE 518,518 9,558 289 104.5 123.7 139.9 0.6 18.4 13.1 17.2 14.5 12.8 12.7 10.8 9.7 6.7 5.4 4.4 2.3 2.8 3.1 43.9 41.4 37.9 1,900 6.0 15.1
Bharat Forge 217 REDUCE 51,506 949 237 10.9 14.0 19.3 (37.4) 28.4 38.1 20.0 15.5 11.3 9.3 8.1 6.4 1.9 1.7 1.5 0.5 0.5 0.5 13.0 10.5 12.5 200 (7.9) 1.5
Exide Industries 127 SELL 107,908 1,989 850 5.9 7.2 8.3 9.6 20.8 16.0 21.4 17.7 15.2 13.7 11.6 10.1 3.2 2.8 2.5 1.2 1.4 1.7 15.6 16.8 17.3 110 (13.4) 4.1
Hero Motocorp 1,491 ADD 297,813 5,490 200 102.8 104.2 143.1 (13.7) 1.3 37.3 14.5 14.3 10.4 10.5 9.5 6.5 4.4 3.6 3.0 2.1 2.1 3.4 39.8 32.0 35.6 1,800 20.7 11.1
Mahindra & Mahindra 881 ADD 540,873 9,970 614 53.4 57.8 67.3 18.4 8.2 16.4 16.5 15.2 13.1 12.0 10.9 9.2 3.6 3.1 2.7 1.8 2.0 2.3 24.7 22.9 22.9 1,000 13.5 23.5
Maruti Suzuki 1,495 SELL 451,459 8,322 302 65.4 85.0 98.5 15.5 29.9 15.9 22.9 17.6 15.2 15.7 10.9 8.8 2.6 2.3 2.0 0.5 0.5 0.5 12.1 14.0 14.3 1,275 (14.7) 22.4
Motherson Sumi Systems 186 BUY 109,339 2,015 588 8.1 16.2 21.5 82.9 100.8 32.4 23.0 11.5 8.7 9.6 5.4 4.1 5.0 3.5 2.5 1.3 2.2 2.9 31.2 33.9 33.6 240 29.1 2.2
Tata Motors 271 BUY 872,680 16,086 3,218 29.5 41.6 49.3 (33.9) 41.2 18.5 9.2 6.5 5.5 5.0 4.0 3.6 2.1 1.6 1.3 1.7 0.9 1.4 25.3 27.8 25.7 335 23.5 56.4
Automobiles Neutral 3,093,731 57,027 (12.1) 23.0 19.1 13.3 10.8 9.1 8.0 6.4 5.4 2.9 2.4 2.0 1.6 1.6 2.0 21.8 22.0 21.7
Banks/Financial Institutions
Andhra Bank 91 ADD 51,062 941 560 22.2 22.4 24.6 (7.7) 1.1 9.8 4.1 4.1 3.7 — — — 0.7 0.6 0.5 5.6 5.6 6.2 15.6 14.2 14.0 125 37.0 2.4
Axis Bank 1,377 ADD 623,929 11,501 453 108.8 114.1 121.1 5.9 4.9 6.1 12.7 12.1 11.4 — — — 2.4 2.1 1.8 1.2 1.3 1.4 17.9 15.0 14.1 1,525 10.7 52.6
Bajaj Finserv 753 SELL 119,778 2,208 159 69.2 72.1 79.4 (27.1) 4.2 10.2 10.9 10.4 9.5 — — — 1.7 1.4 1.3 1.8 1.8 1.8 18.5 15.0 14.1 810 7.6 1.3
Bank of Baroda 676 REDUCE 278,607 5,136 412 111.4 116.4 111.9 (8.2) 4.4 (3.8) 6.1 5.8 6.0 — — — 1.0 0.9 0.8 2.8 2.9 2.8 16.3 15.0 12.9 770 14.0 14.5
Bank of India 316 ADD 181,606 3,348 575 52.1 58.9 58.7 11.8 13.0 (0.3) 6.1 5.4 5.4 — — — 1.0 0.9 0.8 2.5 2.8 2.8 14.3 14.3 12.8 365 15.5 7.4
Canara Bank 414 REDUCE 183,181 3,377 443 68.5 70.6 83.1 (7.5) 3.0 17.7 6.0 5.9 5.0 — — — 0.9 0.9 0.8 2.9 2.9 2.9 12.7 11.9 12.7 415 0.4 7.6
Corporation Bank 379 BUY 56,747 1,046 150 85.9 110.1 113.7 (15.5) 28.2 3.3 4.4 3.4 3.3 — — — 0.7 0.6 0.6 4.6 5.9 6.0 15.1 16.6 15.2 480 26.5 0.5
Federal Bank 436 ADD 74,654 1,376 171 48.7 47.0 57.3 7.2 (3.4) 21.9 9.0 9.3 7.6 — — — 1.2 1.1 1.0 2.2 2.1 2.6 13.8 12.1 13.3 530 21.4 4.3
HDFC 790 SELL 1,210,670 22,317 1,532 31.6 37.4 43.5 13.2 18.3 16.3 25.0 21.1 18.2 — — — 4.8 4.3 3.8 1.5 1.7 2.0 22.0 21.5 22.1 730 (7.6) 38.9
HDFC Bank 660 REDUCE 1,549,049 28,554 2,347 28.6 36.5 45.7 30.1 27.3 25.3 23.0 18.1 14.4 — — — 4.5 3.8 3.1 0.8 1.1 1.4 20.7 22.3 23.4 625 (5.3) 40.3
ICICI Bank 1,098 BUY 1,265,336 23,324 1,153 72.6 70.1 74.6 29.4 (3.4) 6.5 15.1 15.7 14.7 — — — 2.0 1.8 1.7 2.0 1.9 2.0 13.3 11.8 11.6 1,260 14.8 72.6
IDFC 154 BUY 232,752 4,290 1,512 12.3 14.5 17.1 19.8 17.6 17.9 12.5 10.6 9.0 — — — 1.7 1.5 1.3 1.5 1.8 2.1 14.4 15.1 15.8 180 17.0 18.4
India Infoline 60 ADD 19,623 362 327 8.2 10.6 11.6 81.4 28.6 9.8 7.3 5.7 5.2 — — — 0.9 0.8 0.7 4.7 3.0 3.3 14.4 15.6 15.2 70 16.5 0.3
Indian Bank 163 BUY 70,138 1,293 430 35.3 39.6 44.8 (10.7) 12.1 13.1 4.6 4.1 3.6 — — — 0.8 0.7 0.6 4.0 4.5 5.1 15.2 15.1 15.2 260 59.3 0.7
Indian Overseas Bank 64 REDUCE 51,327 946 797 12.1 20.2 22.6 (8.1) 67.0 11.6 5.3 3.2 2.9 — — — 0.6 0.5 0.4 4.4 7.3 8.2 7.8 12.1 12.3 70 8.7 1.7
IndusInd Bank 420 ADD 218,109 4,020 520 19.9 22.8 26.4 16.0 14.6 15.8 21.1 18.4 15.9 — — — 3.0 2.7 2.3 0.8 0.9 1.1 17.6 15.1 15.5 460 9.6 11.6
J&K Bank 1,253 REDUCE 60,753 1,120 48 213.6 185.3 181.4 29.0 (13.2) (2.1) 5.9 6.8 6.9 — — — 1.3 1.1 1.0 3.4 3.0 2.9 23.1 17.2 14.9 1,300 3.8 1.3
LIC Housing Finance 226 NR 124,652 2,298 551 19.9 23.5 29.7 9.8 18.0 26.8 11.4 9.6 7.6 — — — 2.0 1.5 1.3 1.6 2.1 2.6 16.5 17.1 17.7 — — 12.7
L&T Finance Holdings 73 SELL 124,749 2,300 1,715 4.4 4.1 5.0 66.2 (5.9) 19.9 16.5 17.5 14.6 — — — 2.3 2.0 1.8 — — — 14.7 12.1 12.8 60 (17.5) 2.2
Mahindra & Mahindra Financial 201 REDUCE 114,414 2,109 568 15.5 18.3 22.1 28.0 18.3 20.8 13.0 11.0 9.1 — — — 2.7 2.2 1.9 1.8 2.1 2.6 23.4 21.0 21.7 220 9.3 4.5
Muthoot Finance 120 NR 47,826 882 397 27.6 29.8 34.8 15.0 8.0 16.7 4.4 4.0 3.5 — — — 1.3 0.9 0.7 3.2 3.7 4.3 30.6 26.2 23.7 — — —
Oriental Bank of Commerce 255 REDUCE 74,443 1,372 292 46.1 54.3 59.0 17.7 17.9 8.6 5.5 4.7 4.3 — — — 0.7 0.6 0.6 3.6 4.3 4.7 10.8 11.8 11.7 325 27.4 4.6
PFC 193 ADD 254,367 4,689 1,319 32.0 35.0 39.8 38.8 9.4 13.8 6.0 5.5 4.8 — — — 1.1 1.1 0.9 4.3 4.7 5.4 19.0 18.3 18.3 240 24.5 11.7
Punjab National Bank 748 REDUCE 253,536 4,673 339 139.4 145.3 157.3 (3.2) 4.2 8.3 5.4 5.1 4.8 — — — 1.0 0.9 0.8 2.8 3.0 3.2 16.7 15.3 14.6 820 9.7 11.8
Reliance Capital 335 ADD 82,377 1,518 246 30.5 21.3 25.7 44.3 (30.0) 20.5 11.0 15.7 13.0 — — — 0.7 0.7 0.7 2.7 1.9 2.3 6.6 4.5 5.2 500 49.4 35.1
Rural Electrification Corp. 219 REDUCE 215,992 3,981 987 38.2 41.6 45.9 33.7 9.0 10.2 5.7 5.3 4.8 — — — 1.3 1.3 1.1 3.9 4.3 4.7 23.4 21.6 20.4 255 16.6 9.7
Shriram City Union Finance 1,010 NR 58,870 1,085 58 80.2 98.3 118.7 22.6 22.6 20.7 12.6 10.3 8.5 — — — 2.6 2.1 1.7 1.0 1.3 1.5 22.3 22.5 22.0 — — 0.8
Shriram Transport 671 ADD 149,716 2,760 223 60.5 72.2 85.4 7.3 19.4 18.2 11.1 9.3 7.9 — — — 2.3 2.0 1.7 1.8 2.2 2.5 20.7 21.1 21.2 775 15.5 12.4
State Bank of India 2,245 ADD 1,506,587 27,771 671 213.5 215.7 233.4 22.4 1.0 8.2 10.5 10.4 9.6 — — — 2.2 1.9 1.7 1.8 1.9 2.0 16.0 14.4 14.0 2,420 7.8 99.0
Union Bank 231 ADD 138,098 2,546 597 33.1 36.4 37.9 2.6 10.0 4.1 7.0 6.4 6.1 — — — 1.0 0.9 0.9 2.8 3.1 3.2 13.9 13.3 12.5 285 23.2 7.9
Yes Bank 479 REDUCE 171,920 3,169 359 36.3 36.9 41.0 31.0 1.8 11.1 13.2 13.0 11.7 — — — 3.0 2.5 2.2 1.3 1.3 1.4 24.8 20.9 19.7 450 (6.1) 23.0
Banks/Financial Institutions Cautious 9,564,869 176,311 15.0 8.6 11.1 11.2 10.4 9.3 — — — 1.9 1.7 1.5 1.9 2.0 2.2 17.2 16.7 16.4
Cement
ACC 1,189 REDUCE 223,333 4,117 188 73.7 74.0 84.4 29.1 0.4 14.0 16.1 16.1 14.1 9.9 9.1 7.7 2.8 2.5 2.3 3.0 2.0 2.0 19.5 17.7 17.8 1,200 1.0 9.3
Ambuja Cements 187 REDUCE 284,760 5,249 1,522 10.3 11.7 13.6 32.8 13.5 15.9 18.1 15.9 13.8 10.2 8.9 7.8 3.0 2.8 2.5 1.5 1.5 2.3 17.8 18.5 19.1 185 (1.1) 8.6
Grasim Industries 2,827 ADD 259,334 4,780 92 335.4 363.9 454.3 16.2 8.5 24.8 8.4 7.8 6.2 5.1 4.3 2.8 1.3 1.1 1.0 1.2 1.2 1.2 16.7 15.7 16.9 3,500 23.8 4.6
India Cements 86 ADD 26,387 486 307 7.0 11.7 11.5 (22.4) 68.6 (1.6) 12.4 7.3 7.4 5.2 3.9 3.6 0.6 0.6 0.5 3.7 3.7 3.7 5.3 8.3 7.7 95 10.6 1.9
Shree Cement 4,330 SELL 150,847 2,781 35 272.8 286.5 308.5 70.9 5.0 7.7 15.9 15.1 14.0 9.1 7.7 6.8 4.4 3.5 2.9 0.5 0.5 0.5 31.1 25.8 22.7 3,427 (20.9) 1.7
UltraTech Cement 1,898 SELL 520,089 9,587 274 101.8 121.9 148.6 14.0 19.7 21.9 18.6 15.6 12.8 10.7 8.6 6.5 3.0 2.5 2.1 0.5 0.5 0.5 19.7 19.7 20.0 1,700 (10.4) 6.7
Cement Cautious 1,464,749 27,000 22.1 12.3 18.8 14.7 13.1 11.0 8.2 6.9 5.3 2.4 2.0 1.8 1.2 1.1 1.2 16.0 15.7 16.2
Price/BV (X) Dividend yield (%)
Source: Company, Bloomberg, Kotak Institutional Equities estimates
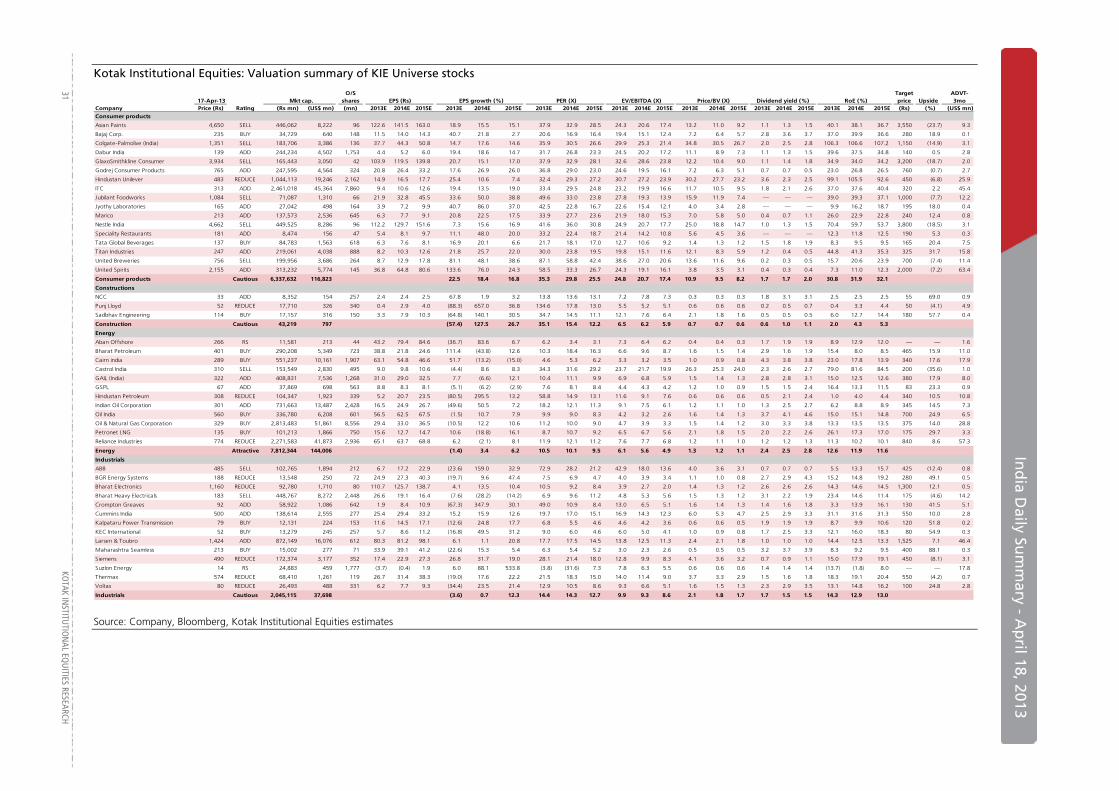
In
dia D
aily Sum
mary - A
pril 18, 2013
31
KOTAK IN
STITUTIO
NAL EQ
UITIES RESEARCH
Kotak Institutional Equities: Valuation summary of KIE Universe stocks
17-Apr-13 Mkt cap.O/S
shares EPS (Rs) EPS growth (%) PER (X) EV/EBITDA (X) Price/BV (X) RoE (%)Target price Upside
ADVT-3mo
Company Price (Rs) Rating (Rs mn) (US$ mn) (mn) 2013E 2014E 2015E 2013E 2014E 2015E 2013E 2014E 2015E 2013E 2014E 2015E 2013E 2014E 2015E 2013E 2014E 2015E 2013E 2014E 2015E (Rs) (%) (US$ mn)Consumer products
Asian Paints 4,650 SELL 446,062 8,222 96 122.6 141.5 163.0 18.9 15.5 15.1 37.9 32.9 28.5 24.3 20.6 17.4 13.2 11.0 9.2 1.1 1.3 1.5 40.1 38.1 36.7 3,550 (23.7) 9.3
Bajaj Corp. 235 BUY 34,729 640 148 11.5 14.0 14.3 40.7 21.8 2.7 20.6 16.9 16.4 19.4 15.1 12.4 7.2 6.4 5.7 2.8 3.6 3.7 37.0 39.9 36.6 280 18.9 0.1
Colgate-Palmolive (India) 1,351 SELL 183,706 3,386 136 37.7 44.3 50.8 14.7 17.6 14.6 35.9 30.5 26.6 29.9 25.3 21.4 34.8 30.5 26.7 2.0 2.5 2.8 106.3 106.6 107.2 1,150 (14.9) 3.1
Dabur India 139 ADD 244,234 4,502 1,753 4.4 5.2 6.0 19.4 18.6 14.7 31.7 26.8 23.3 24.5 20.2 17.2 11.1 8.9 7.3 1.1 1.3 1.5 39.6 37.5 34.8 140 0.5 2.8
GlaxoSmithkline Consumer 3,934 SELL 165,443 3,050 42 103.9 119.5 139.8 20.7 15.1 17.0 37.9 32.9 28.1 32.6 28.6 23.8 12.2 10.4 9.0 1.1 1.4 1.8 34.9 34.0 34.2 3,200 (18.7) 2.0
Godrej Consumer Products 765 ADD 247,595 4,564 324 20.8 26.4 33.2 17.6 26.9 26.0 36.8 29.0 23.0 24.6 19.5 16.1 7.2 6.3 5.1 0.7 0.7 0.5 23.0 26.8 26.5 760 (0.7) 2.7
Hindustan Unilever 483 REDUCE 1,044,113 19,246 2,162 14.9 16.5 17.7 25.4 10.6 7.4 32.4 29.3 27.2 30.7 27.2 23.9 30.2 27.7 23.2 3.6 2.3 2.5 99.1 105.5 92.6 450 (6.8) 25.9
ITC 313 ADD 2,461,018 45,364 7,860 9.4 10.6 12.6 19.4 13.5 19.0 33.4 29.5 24.8 23.2 19.9 16.6 11.7 10.5 9.5 1.8 2.1 2.6 37.0 37.6 40.4 320 2.2 45.4
Jubilant Foodworks 1,084 SELL 71,087 1,310 66 21.9 32.8 45.5 33.6 50.0 38.8 49.6 33.0 23.8 27.8 19.3 13.9 15.9 11.9 7.4 — — — 39.0 39.3 37.1 1,000 (7.7) 12.2
Jyothy Laboratories 165 ADD 27,042 498 164 3.9 7.2 9.9 40.7 86.0 37.0 42.5 22.8 16.7 22.6 15.4 12.1 4.0 3.4 2.8 — — — 9.9 16.2 18.7 195 18.0 0.4
Marico 213 ADD 137,573 2,536 645 6.3 7.7 9.1 20.8 22.5 17.5 33.9 27.7 23.6 21.9 18.0 15.3 7.0 5.8 5.0 0.4 0.7 1.1 26.0 22.9 22.8 240 12.4 0.8
Nestle India 4,662 SELL 449,525 8,286 96 112.2 129.7 151.6 7.3 15.6 16.9 41.6 36.0 30.8 24.9 20.7 17.7 25.0 18.8 14.7 1.0 1.3 1.5 70.4 59.7 53.7 3,800 (18.5) 3.1
Speciality Restaurants 181 ADD 8,474 156 47 5.4 8.1 9.7 11.1 48.0 20.0 33.2 22.4 18.7 21.4 14.2 10.8 5.6 4.5 3.6 — — — 12.3 11.8 12.5 190 5.3 0.3
Tata Global Beverages 137 BUY 84,783 1,563 618 6.3 7.6 8.1 16.9 20.1 6.6 21.7 18.1 17.0 12.7 10.6 9.2 1.4 1.3 1.2 1.5 1.8 1.9 8.3 9.5 9.5 165 20.4 7.5
Titan Industries 247 ADD 219,061 4,038 888 8.2 10.3 12.6 21.8 25.7 22.0 30.0 23.8 19.5 19.8 15.1 11.6 12.1 8.3 5.9 1.2 0.4 0.5 44.8 41.3 35.3 325 31.7 15.8
United Breweries 756 SELL 199,956 3,686 264 8.7 12.9 17.8 81.1 48.1 38.6 87.1 58.8 42.4 38.6 27.0 20.6 13.6 11.6 9.6 0.2 0.3 0.5 15.7 20.6 23.9 700 (7.4) 11.4
United Spirits 2,155 ADD 313,232 5,774 145 36.8 64.8 80.6 133.6 76.0 24.3 58.5 33.3 26.7 24.3 19.1 16.1 3.8 3.5 3.1 0.4 0.3 0.4 7.3 11.0 12.3 2,000 (7.2) 63.4
Consumer products Cautious 6,337,632 116,823 22.5 18.4 16.8 35.3 29.8 25.5 24.8 20.7 17.4 10.9 9.5 8.2 1.7 1.7 2.0 30.8 31.9 32.1
Constructions
NCC 33 ADD 8,352 154 257 2.4 2.4 2.5 67.8 1.9 3.2 13.8 13.6 13.1 7.2 7.8 7.3 0.3 0.3 0.3 1.8 3.1 3.1 2.5 2.5 2.5 55 69.0 0.9
Punj Lloyd 52 REDUCE 17,710 326 340 0.4 2.9 4.0 (88.3) 657.0 36.8 134.6 17.8 13.0 5.5 5.2 5.1 0.6 0.6 0.6 0.2 0.5 0.7 0.4 3.3 4.4 50 (4.1) 4.9
Sadbhav Engineering 114 BUY 17,157 316 150 3.3 7.9 10.3 (64.8) 140.1 30.5 34.7 14.5 11.1 12.1 7.6 6.4 2.1 1.8 1.6 0.5 0.5 0.5 6.0 12.7 14.4 180 57.7 0.4
Construction Cautious 43,219 797 (57.4) 127.5 26.7 35.1 15.4 12.2 6.5 6.2 5.9 0.7 0.7 0.6 0.6 1.0 1.1 2.0 4.3 5.3
Energy
Aban Offshore 266 RS 11,581 213 44 43.2 79.4 84.6 (36.7) 83.6 6.7 6.2 3.4 3.1 7.3 6.4 6.2 0.4 0.4 0.3 1.7 1.9 1.9 8.9 12.9 12.0 — — 1.6
Bharat Petroleum 401 BUY 290,208 5,349 723 38.8 21.8 24.6 111.4 (43.8) 12.6 10.3 18.4 16.3 6.6 9.6 8.7 1.6 1.5 1.4 2.9 1.6 1.9 15.4 8.0 8.5 465 15.9 11.0
Cairn india 289 BUY 551,237 10,161 1,907 63.1 54.8 46.6 51.7 (13.2) (15.0) 4.6 5.3 6.2 3.3 3.2 3.5 1.0 0.9 0.8 4.3 3.8 3.8 23.0 17.8 13.9 340 17.6 17.9
Castrol India 310 SELL 153,549 2,830 495 9.0 9.8 10.6 (4.4) 8.6 8.3 34.3 31.6 29.2 23.7 21.7 19.9 26.3 25.3 24.0 2.3 2.6 2.7 79.0 81.6 84.5 200 (35.6) 1.0
GAIL (India) 322 ADD 408,831 7,536 1,268 31.0 29.0 32.5 7.7 (6.6) 12.1 10.4 11.1 9.9 6.9 6.8 5.9 1.5 1.4 1.3 2.8 2.8 3.1 15.0 12.5 12.6 380 17.9 8.0
GSPL 67 ADD 37,869 698 563 8.8 8.3 8.1 (5.1) (6.2) (2.9) 7.6 8.1 8.4 4.4 4.3 4.2 1.2 1.0 0.9 1.5 1.5 2.4 16.4 13.3 11.5 83 23.3 0.9
Hindustan Petroleum 308 REDUCE 104,347 1,923 339 5.2 20.7 23.5 (80.5) 295.5 13.2 58.8 14.9 13.1 11.6 9.1 7.6 0.6 0.6 0.6 0.5 2.1 2.4 1.0 4.0 4.4 340 10.5 10.8
Indian Oil Corporation 301 ADD 731,663 13,487 2,428 16.5 24.9 26.7 (49.6) 50.5 7.2 18.2 12.1 11.3 9.1 7.5 6.1 1.2 1.1 1.0 1.3 2.5 2.7 6.2 8.8 8.9 345 14.5 7.3
Oil India 560 BUY 336,780 6,208 601 56.5 62.5 67.5 (1.5) 10.7 7.9 9.9 9.0 8.3 4.2 3.2 2.6 1.6 1.4 1.3 3.7 4.1 4.6 15.0 15.1 14.8 700 24.9 6.5
Oil & Natural Gas Corporation 329 BUY 2,813,483 51,861 8,556 29.4 33.0 36.5 (10.5) 12.2 10.6 11.2 10.0 9.0 4.7 3.9 3.3 1.5 1.4 1.2 3.0 3.3 3.8 13.3 13.5 13.5 375 14.0 28.8
Petronet LNG 135 BUY 101,213 1,866 750 15.6 12.7 14.7 10.6 (18.8) 16.1 8.7 10.7 9.2 6.5 6.7 5.6 2.1 1.8 1.5 2.0 2.2 2.6 26.1 17.3 17.0 175 29.7 3.3
Reliance Industries 774 REDUCE 2,271,583 41,873 2,936 65.1 63.7 68.8 6.2 (2.1) 8.1 11.9 12.1 11.2 7.6 7.7 6.8 1.2 1.1 1.0 1.2 1.2 1.3 11.3 10.2 10.1 840 8.6 57.3
Energy Attractive 7,812,344 144,006 (1.4) 3.4 6.2 10.5 10.1 9.5 6.1 5.6 4.9 1.3 1.2 1.1 2.4 2.5 2.8 12.6 11.9 11.6
Industrials
ABB 485 SELL 102,765 1,894 212 6.7 17.2 22.9 (23.6) 159.0 32.9 72.9 28.2 21.2 42.9 18.0 13.6 4.0 3.6 3.1 0.7 0.7 0.7 5.5 13.3 15.7 425 (12.4) 0.8
BGR Energy Systems 188 REDUCE 13,548 250 72 24.9 27.3 40.3 (19.7) 9.6 47.4 7.5 6.9 4.7 4.0 3.9 3.4 1.1 1.0 0.8 2.7 2.9 4.3 15.2 14.8 19.2 280 49.1 0.5
Bharat Electronics 1,160 REDUCE 92,780 1,710 80 110.7 125.7 138.7 4.1 13.5 10.4 10.5 9.2 8.4 3.9 2.7 2.0 1.4 1.3 1.2 2.6 2.6 2.6 14.3 14.6 14.5 1,300 12.1 0.5
Bharat Heavy Electricals 183 SELL 448,767 8,272 2,448 26.6 19.1 16.4 (7.6) (28.2) (14.2) 6.9 9.6 11.2 4.8 5.3 5.6 1.5 1.3 1.2 3.1 2.2 1.9 23.4 14.6 11.4 175 (4.6) 14.2
Crompton Greaves 92 ADD 58,922 1,086 642 1.9 8.4 10.9 (67.3) 347.9 30.1 49.0 10.9 8.4 13.0 6.5 5.1 1.6 1.4 1.3 1.4 1.6 1.8 3.3 13.9 16.1 130 41.5 5.1
Cummins India 500 ADD 138,614 2,555 277 25.4 29.4 33.2 15.2 15.9 12.6 19.7 17.0 15.1 16.9 14.3 12.3 6.0 5.3 4.7 2.5 2.9 3.3 31.1 31.6 31.3 550 10.0 2.8
Kalpataru Power Transmission 79 BUY 12,131 224 153 11.6 14.5 17.1 (12.6) 24.8 17.7 6.8 5.5 4.6 4.6 4.2 3.6 0.6 0.6 0.5 1.9 1.9 1.9 8.7 9.9 10.6 120 51.8 0.2
KEC International 52 BUY 13,279 245 257 5.7 8.6 11.2 (16.8) 49.5 31.2 9.0 6.0 4.6 6.0 5.0 4.1 1.0 0.9 0.8 1.7 2.5 3.3 12.1 16.0 18.3 80 54.9 0.3
Larsen & Toubro 1,424 ADD 872,149 16,076 612 80.3 81.2 98.1 6.1 1.1 20.8 17.7 17.5 14.5 13.8 12.5 11.3 2.4 2.1 1.8 1.0 1.0 1.0 14.4 12.5 13.3 1,525 7.1 46.4
Maharashtra Seamless 213 BUY 15,002 277 71 33.9 39.1 41.2 (22.6) 15.3 5.4 6.3 5.4 5.2 3.0 2.3 2.6 0.5 0.5 0.5 3.2 3.7 3.9 8.3 9.2 9.5 400 88.1 0.3
Siemens 490 REDUCE 172,374 3,177 352 17.4 22.9 27.3 26.8 31.7 19.0 28.1 21.4 18.0 12.8 9.9 8.3 4.1 3.6 3.2 0.7 0.9 1.1 15.0 17.9 19.1 450 (8.1) 3.1
Suzlon Energy 14 RS 24,883 459 1,777 (3.7) (0.4) 1.9 6.0 88.1 533.8 (3.8) (31.6) 7.3 7.8 6.3 5.5 0.6 0.6 0.6 1.4 1.4 1.4 (13.7) (1.8) 8.0 — — 17.8
Thermax 574 REDUCE 68,410 1,261 119 26.7 31.4 38.3 (19.0) 17.6 22.2 21.5 18.3 15.0 14.0 11.4 9.0 3.7 3.3 2.9 1.5 1.6 1.8 18.3 19.1 20.4 550 (4.2) 0.7
Voltas 80 REDUCE 26,493 488 331 6.2 7.7 9.3 (34.4) 23.5 21.4 12.9 10.5 8.6 9.3 6.6 5.1 1.6 1.5 1.3 2.3 2.9 3.5 13.1 14.8 16.2 100 24.8 2.8
Industrials Cautious 2,045,115 37,698 (3.6) 0.7 12.3 14.4 14.3 12.7 9.9 9.3 8.6 2.1 1.8 1.7 1.7 1.5 1.5 14.3 12.9 13.0
Dividend yield (%)
Source: Company, Bloomberg, Kotak Institutional Equities estimates
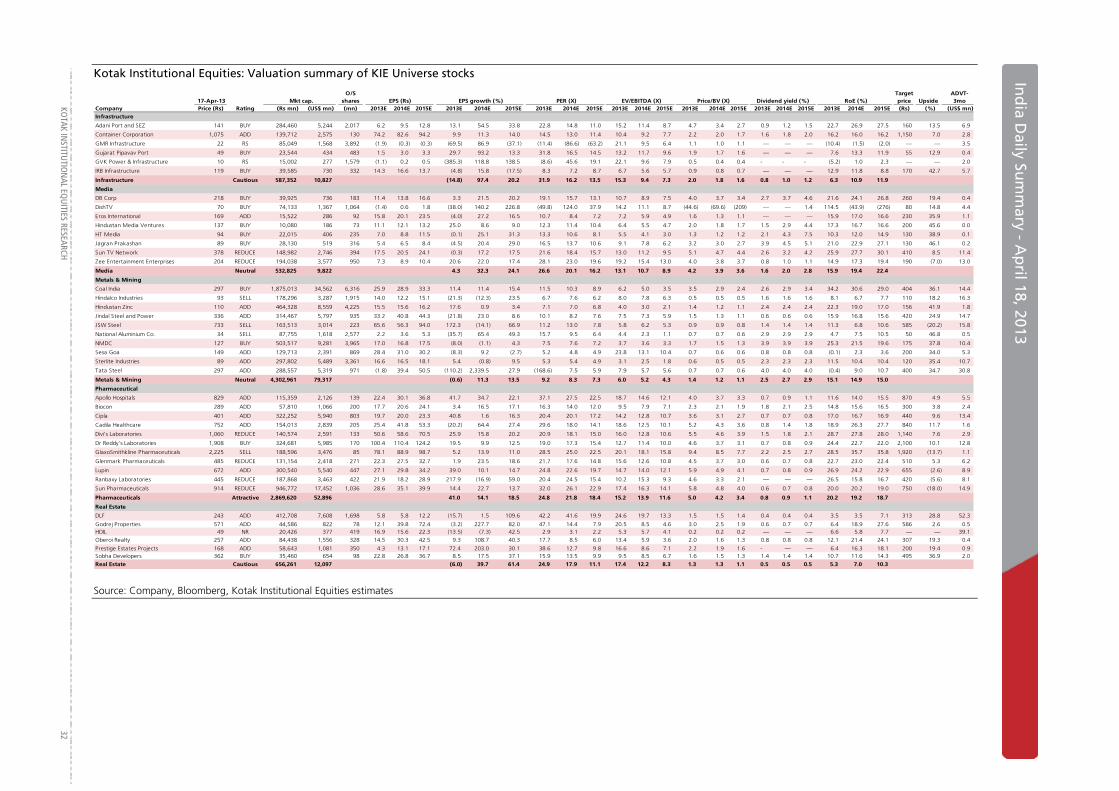
KO
TAK INSTITUTIO
NAL EQ
UITIES RESEARCH 32
In
dia D
aily Sum
mary - A
pril 1
Ind
ia Daily Su
mm
ary - Ap
ril 18, 2013
Kotak Institutional Equities: Valuation summary of KIE Universe stocks
17-Apr-13 Mkt cap.O/S
shares EPS (Rs) EPS growth (%) PER (X) EV/EBITDA (X) Price/BV (X) RoE (%)Target price Upside
ADVT-3mo
Company Price (Rs) Rating (Rs mn) (US$ mn) (mn) 2013E 2014E 2015E 2013E 2014E 2015E 2013E 2014E 2015E 2013E 2014E 2015E 2013E 2014E 2015E 2013E 2014E 2015E 2013E 2014E 2015E (Rs) (%) (US$ mn)Infrastructure
Adani Port and SEZ 141 BUY 284,460 5,244 2,017 6.2 9.5 12.8 13.1 54.5 33.8 22.8 14.8 11.0 15.2 11.4 8.7 4.7 3.4 2.7 0.9 1.2 1.5 22.7 26.9 27.5 160 13.5 6.9
Container Corporation 1,075 ADD 139,712 2,575 130 74.2 82.6 94.2 9.9 11.3 14.0 14.5 13.0 11.4 10.4 9.2 7.7 2.2 2.0 1.7 1.6 1.8 2.0 16.2 16.0 16.2 1,150 7.0 2.8
GMR Infrastructure 22 RS 85,049 1,568 3,892 (1.9) (0.3) (0.3) (69.5) 86.9 (37.1) (11.4) (86.6) (63.2) 21.1 9.5 6.4 1.1 1.0 1.1 — — — (10.4) (1.5) (2.0) — — 3.5
Gujarat Pipavav Port 49 BUY 23,544 434 483 1.5 3.0 3.3 29.7 93.2 13.3 31.8 16.5 14.5 13.2 11.7 9.6 1.9 1.7 1.6 — — — 7.6 13.3 11.9 55 12.9 0.4
GVK Power & Infrastructure 10 RS 15,002 277 1,579 (1.1) 0.2 0.5 (385.3) 118.8 138.5 (8.6) 45.6 19.1 22.1 9.6 7.9 0.5 0.4 0.4 - - - (5.2) 1.0 2.3 — — 2.0
IRB Infrastructure 119 BUY 39,585 730 332 14.3 16.6 13.7 (4.8) 15.8 (17.5) 8.3 7.2 8.7 6.7 5.6 5.7 0.9 0.8 0.7 — — — 12.9 11.8 8.8 170 42.7 5.7
Infrastructure Cautious 587,352 10,827 (14.8) 97.4 20.2 31.9 16.2 13.5 15.3 9.4 7.3 2.0 1.8 1.6 0.8 1.0 1.2 6.3 10.9 11.9
Media
DB Corp 218 BUY 39,925 736 183 11.4 13.8 16.6 3.3 21.5 20.2 19.1 15.7 13.1 10.7 8.9 7.5 4.0 3.7 3.4 2.7 3.7 4.6 21.6 24.1 26.8 260 19.4 0.4
DishTV 70 BUY 74,133 1,367 1,064 (1.4) 0.6 1.8 (38.0) 140.2 226.8 (49.8) 124.0 37.9 14.2 11.1 8.7 (44.6) (69.6) (209) — — 1.4 114.5 (43.9) (276) 80 14.8 4.4
Eros International 169 ADD 15,522 286 92 15.8 20.1 23.5 (4.0) 27.2 16.5 10.7 8.4 7.2 7.2 5.9 4.9 1.6 1.3 1.1 — — — 15.9 17.0 16.6 230 35.9 1.1
Hindustan Media Ventures 137 BUY 10,080 186 73 11.1 12.1 13.2 25.0 8.6 9.0 12.3 11.4 10.4 6.4 5.5 4.7 2.0 1.8 1.7 1.5 2.9 4.4 17.3 16.7 16.6 200 45.6 0.0
HT Media 94 BUY 22,015 406 235 7.0 8.8 11.5 (0.1) 25.1 31.3 13.3 10.6 8.1 5.5 4.1 3.0 1.3 1.2 1.2 2.1 4.3 7.5 10.3 12.0 14.9 130 38.9 0.1
Jagran Prakashan 89 BUY 28,130 519 316 5.4 6.5 8.4 (4.5) 20.4 29.0 16.5 13.7 10.6 9.1 7.8 6.2 3.2 3.0 2.7 3.9 4.5 5.1 21.0 22.9 27.1 130 46.1 0.2
Sun TV Network 378 REDUCE 148,982 2,746 394 17.5 20.5 24.1 (0.3) 17.2 17.5 21.6 18.4 15.7 13.0 11.2 9.5 5.1 4.7 4.4 2.6 3.2 4.2 25.9 27.7 30.1 410 8.5 11.4
Zee Entertainment Enterprises 204 REDUCE 194,038 3,577 950 7.3 8.9 10.4 20.6 22.0 17.4 28.1 23.0 19.6 19.2 15.4 13.0 4.0 3.8 3.7 0.8 1.0 1.1 14.9 17.3 19.4 190 (7.0) 13.0
Media Neutral 532,825 9,822 4.3 32.3 24.1 26.6 20.1 16.2 13.1 10.7 8.9 4.2 3.9 3.6 1.6 2.0 2.8 15.9 19.4 22.4
Metals & Mining
Coal India 297 BUY 1,875,013 34,562 6,316 25.9 28.9 33.3 11.4 11.4 15.4 11.5 10.3 8.9 6.2 5.0 3.5 3.5 2.9 2.4 2.6 2.9 3.4 34.2 30.6 29.0 404 36.1 14.4
Hindalco Industries 93 SELL 178,296 3,287 1,915 14.0 12.2 15.1 (21.3) (12.3) 23.5 6.7 7.6 6.2 8.0 7.8 6.3 0.5 0.5 0.5 1.6 1.6 1.6 8.1 6.7 7.7 110 18.2 16.3
Hindustan Zinc 110 ADD 464,328 8,559 4,225 15.5 15.6 16.2 17.6 0.9 3.4 7.1 7.0 6.8 4.0 3.0 2.1 1.4 1.2 1.1 2.4 2.4 2.4 22.3 19.0 17.0 156 41.9 1.8
Jindal Steel and Power 336 ADD 314,467 5,797 935 33.2 40.8 44.3 (21.8) 23.0 8.6 10.1 8.2 7.6 7.5 7.3 5.9 1.5 1.3 1.1 0.6 0.6 0.6 15.9 16.8 15.6 420 24.9 14.7
JSW Steel 733 SELL 163,513 3,014 223 65.6 56.3 94.0 172.3 (14.1) 66.9 11.2 13.0 7.8 5.8 6.2 5.3 0.9 0.9 0.8 1.4 1.4 1.4 11.3 6.8 10.6 585 (20.2) 15.8
National Aluminium Co. 34 SELL 87,755 1,618 2,577 2.2 3.6 5.3 (35.7) 65.4 49.3 15.7 9.5 6.4 4.4 2.3 1.1 0.7 0.7 0.6 2.9 2.9 2.9 4.7 7.5 10.5 50 46.8 0.5
NMDC 127 BUY 503,517 9,281 3,965 17.0 16.8 17.5 (8.0) (1.1) 4.3 7.5 7.6 7.2 3.7 3.6 3.3 1.7 1.5 1.3 3.9 3.9 3.9 25.3 21.5 19.6 175 37.8 10.4
Sesa Goa 149 ADD 129,713 2,391 869 28.4 31.0 30.2 (8.3) 9.2 (2.7) 5.2 4.8 4.9 23.8 13.1 10.4 0.7 0.6 0.6 0.8 0.8 0.8 (0.1) 2.3 3.6 200 34.0 5.3
Sterlite Industries 89 ADD 297,802 5,489 3,361 16.6 16.5 18.1 5.4 (0.8) 9.5 5.3 5.4 4.9 3.1 2.5 1.8 0.6 0.5 0.5 2.3 2.3 2.3 11.5 10.4 10.4 120 35.4 10.7
Tata Steel 297 ADD 288,557 5,319 971 (1.8) 39.4 50.5 (110.2) 2,339.5 27.9 (168.6) 7.5 5.9 7.9 5.7 5.6 0.7 0.7 0.6 4.0 4.0 4.0 (0.4) 9.0 10.7 400 34.7 30.8
Metals & Mining Neutral 4,302,961 79,317 (0.6) 11.3 13.5 9.2 8.3 7.3 6.0 5.2 4.3 1.4 1.2 1.1 2.5 2.7 2.9 15.1 14.9 15.0
Pharmaceutical
Apollo Hospitals 829 ADD 115,359 2,126 139 22.4 30.1 36.8 41.7 34.7 22.1 37.1 27.5 22.5 18.7 14.6 12.1 4.0 3.7 3.3 0.7 0.9 1.1 11.6 14.0 15.5 870 4.9 5.5
Biocon 289 ADD 57,810 1,066 200 17.7 20.6 24.1 3.4 16.5 17.1 16.3 14.0 12.0 9.5 7.9 7.1 2.3 2.1 1.9 1.8 2.1 2.5 14.8 15.6 16.5 300 3.8 2.4
Cipla 401 ADD 322,252 5,940 803 19.7 20.0 23.3 40.8 1.6 16.3 20.4 20.1 17.2 14.2 12.8 10.7 3.6 3.1 2.7 0.7 0.7 0.8 17.0 16.7 16.9 440 9.6 13.4
Cadila Healthcare 752 ADD 154,013 2,839 205 25.4 41.8 53.3 (20.2) 64.4 27.4 29.6 18.0 14.1 18.6 12.5 10.1 5.2 4.3 3.6 0.8 1.4 1.8 18.9 26.3 27.7 840 11.7 1.6
Divi's Laboratories 1,060 REDUCE 140,574 2,591 133 50.6 58.6 70.5 25.9 15.8 20.2 20.9 18.1 15.0 16.0 12.8 10.6 5.5 4.6 3.9 1.5 1.8 2.1 28.7 27.8 28.0 1,140 7.6 2.9
Dr Reddy's Laboratories 1,908 BUY 324,681 5,985 170 100.4 110.4 124.2 19.5 9.9 12.5 19.0 17.3 15.4 12.7 11.4 10.0 4.6 3.7 3.1 0.7 0.8 0.9 24.4 22.7 22.0 2,100 10.1 12.8
GlaxoSmithkline Pharmaceuticals 2,225 SELL 188,596 3,476 85 78.1 88.9 98.7 5.2 13.9 11.0 28.5 25.0 22.5 20.1 18.1 15.8 9.4 8.5 7.7 2.2 2.5 2.7 28.5 35.7 35.8 1,920 (13.7) 1.1
Glenmark Pharmaceuticals 485 REDUCE 131,154 2,418 271 22.3 27.5 32.7 1.9 23.5 18.6 21.7 17.6 14.8 15.6 12.6 10.8 4.5 3.7 3.0 0.6 0.7 0.8 22.7 23.0 22.4 510 5.3 6.2
Lupin 672 ADD 300,540 5,540 447 27.1 29.8 34.2 39.0 10.1 14.7 24.8 22.6 19.7 14.7 14.0 12.1 5.9 4.9 4.1 0.7 0.8 0.9 26.9 24.2 22.9 655 (2.6) 8.9
Ranbaxy Laboratories 445 REDUCE 187,868 3,463 422 21.9 18.2 28.9 217.9 (16.9) 59.0 20.4 24.5 15.4 10.2 15.3 9.3 4.6 3.3 2.1 — — — 26.5 15.8 16.7 420 (5.6) 8.1
Sun Pharmaceuticals 914 REDUCE 946,772 17,452 1,036 28.6 35.1 39.9 14.4 22.7 13.7 32.0 26.1 22.9 17.4 16.3 14.1 5.8 4.8 4.0 0.6 0.7 0.8 20.0 20.2 19.0 750 (18.0) 14.9
Pharmaceuticals Attractive 2,869,620 52,896 41.0 14.1 18.5 24.8 21.8 18.4 15.2 13.9 11.6 5.0 4.2 3.4 0.8 0.9 1.1 20.2 19.2 18.7
Real Estate
DLF 243 ADD 412,708 7,608 1,698 5.8 5.8 12.2 (15.7) 1.5 109.6 42.2 41.6 19.9 24.6 19.7 13.3 1.5 1.5 1.4 0.4 0.4 0.4 3.5 3.5 7.1 313 28.8 52.3
Godrej Properties 571 ADD 44,586 822 78 12.1 39.8 72.4 (3.2) 227.7 82.0 47.1 14.4 7.9 20.5 8.5 4.6 3.0 2.5 1.9 0.6 0.7 0.7 6.4 18.9 27.6 586 2.6 0.5 HDIL 49 NR 20,426 377 419 16.9 15.6 22.3 (13.5) (7.3) 42.5 2.9 3.1 2.2 5.3 5.7 4.1 0.2 0.2 0.2 — — — 6.6 5.8 7.7 — — 39.1
Oberoi Realty 257 ADD 84,438 1,556 328 14.5 30.3 42.5 9.3 108.7 40.3 17.7 8.5 6.0 13.4 5.9 3.6 2.0 1.6 1.3 0.8 0.8 0.8 12.1 21.4 24.1 307 19.3 0.4
Prestige Estates Projects 168 ADD 58,643 1,081 350 4.3 13.1 17.1 72.4 203.0 30.1 38.6 12.7 9.8 16.6 8.6 7.1 2.2 1.9 1.6 - — — 6.4 16.3 18.1 200 19.4 0.9 Sobha Developers 362 BUY 35,460 654 98 22.8 26.8 36.7 8.5 17.5 37.1 15.9 13.5 9.9 9.5 8.5 6.7 1.6 1.5 1.3 1.4 1.4 1.4 10.7 11.6 14.3 495 36.9 2.0
Real Estate Cautious 656,261 12,097 (6.0) 39.7 61.4 24.9 17.9 11.1 17.4 12.2 8.3 1.3 1.3 1.1 0.5 0.5 0.5 5.3 7.0 10.3
Dividend yield (%)
Source: Company, Bloomberg, Kotak Institutional Equities estimates
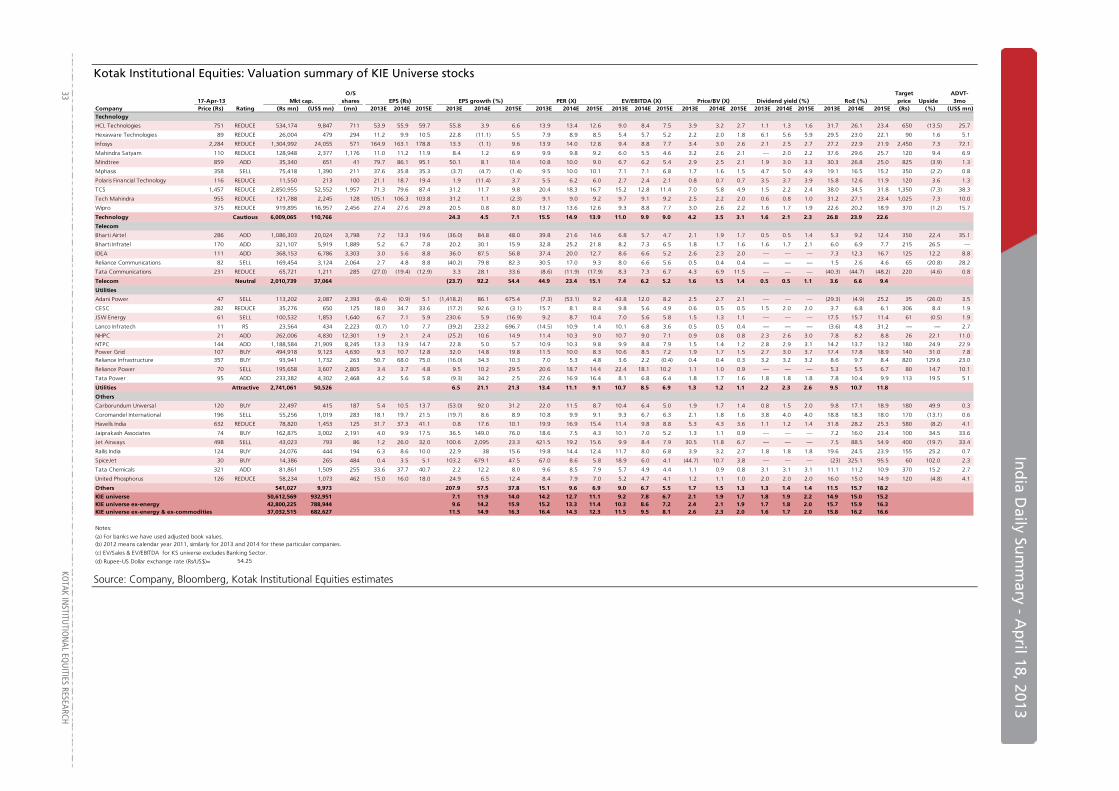
In
dia D
aily Sum
mary - A
pril 18, 2013
33
KOTAK IN
STITUTIO
NAL EQ
UITIES RESEARCH
Kotak Institutional Equities: Valuation summary of KIE Universe stocks
17-Apr-13 Mkt cap.O/S
shares EPS (Rs) EPS growth (%) PER (X) EV/EBITDA (X) Price/BV (X) RoE (%)Target price Upside
ADVT-3mo
Company Price (Rs) Rating (Rs mn) (US$ mn) (mn) 2013E 2014E 2015E 2013E 2014E 2015E 2013E 2014E 2015E 2013E 2014E 2015E 2013E 2014E 2015E 2013E 2014E 2015E 2013E 2014E 2015E (Rs) (%) (US$ mn)Technology
HCL Technologies 751 REDUCE 534,174 9,847 711 53.9 55.9 59.7 55.8 3.9 6.6 13.9 13.4 12.6 9.0 8.4 7.5 3.9 3.2 2.7 1.1 1.3 1.6 31.7 26.1 23.4 650 (13.5) 25.7
Hexaware Technologies 89 REDUCE 26,004 479 294 11.2 9.9 10.5 22.8 (11.1) 5.5 7.9 8.9 8.5 5.4 5.7 5.2 2.2 2.0 1.8 6.1 5.6 5.9 29.5 23.0 22.1 90 1.6 5.1
Infosys 2,284 REDUCE 1,304,992 24,055 571 164.9 163.1 178.8 13.3 (1.1) 9.6 13.9 14.0 12.8 9.4 8.8 7.7 3.4 3.0 2.6 2.1 2.5 2.7 27.2 22.9 21.9 2,450 7.3 72.1
Mahindra Satyam 110 REDUCE 128,948 2,377 1,176 11.0 11.2 11.9 8.4 1.2 6.9 9.9 9.8 9.2 6.0 5.5 4.6 3.2 2.6 2.1 — 2.0 2.2 37.6 29.6 25.7 120 9.4 6.9
Mindtree 859 ADD 35,340 651 41 79.7 86.1 95.1 50.1 8.1 10.4 10.8 10.0 9.0 6.7 6.2 5.4 2.9 2.5 2.1 1.9 3.0 3.3 30.3 26.8 25.0 825 (3.9) 1.3
Mphasis 358 SELL 75,418 1,390 211 37.6 35.8 35.3 (3.7) (4.7) (1.4) 9.5 10.0 10.1 7.1 7.1 6.8 1.7 1.6 1.5 4.7 5.0 4.9 19.1 16.5 15.2 350 (2.2) 0.8
Polaris Financial Technology 116 REDUCE 11,550 213 100 21.1 18.7 19.4 1.9 (11.4) 3.7 5.5 6.2 6.0 2.7 2.4 2.1 0.8 0.7 0.7 3.5 3.7 3.9 15.8 12.6 11.9 120 3.6 1.3
TCS 1,457 REDUCE 2,850,955 52,552 1,957 71.3 79.6 87.4 31.2 11.7 9.8 20.4 18.3 16.7 15.2 12.8 11.4 7.0 5.8 4.9 1.5 2.2 2.4 38.0 34.5 31.8 1,350 (7.3) 38.3
Tech Mahindra 955 REDUCE 121,788 2,245 128 105.1 106.3 103.8 31.2 1.1 (2.3) 9.1 9.0 9.2 9.7 9.1 9.2 2.5 2.2 2.0 0.6 0.8 1.0 31.2 27.1 23.4 1,025 7.3 10.0
Wipro 375 REDUCE 919,895 16,957 2,456 27.4 27.6 29.8 20.5 0.8 8.0 13.7 13.6 12.6 9.3 8.8 7.7 3.0 2.6 2.2 1.6 1.7 1.9 22.6 20.2 18.9 370 (1.2) 15.7
Technology Cautious 6,009,065 110,766 24.3 4.5 7.1 15.5 14.9 13.9 11.0 9.9 9.0 4.2 3.5 3.1 1.6 2.1 2.3 26.8 23.9 22.6
Telecom
Bharti Airtel 286 ADD 1,086,303 20,024 3,798 7.2 13.3 19.6 (36.0) 84.8 48.0 39.8 21.6 14.6 6.8 5.7 4.7 2.1 1.9 1.7 0.5 0.5 1.4 5.3 9.2 12.4 350 22.4 35.1
Bharti Infratel 170 ADD 321,107 5,919 1,889 5.2 6.7 7.8 20.2 30.1 15.9 32.8 25.2 21.8 8.2 7.3 6.5 1.8 1.7 1.6 1.6 1.7 2.1 6.0 6.9 7.7 215 26.5 —
IDEA 111 ADD 368,153 6,786 3,303 3.0 5.6 8.8 36.0 87.5 56.8 37.4 20.0 12.7 8.6 6.6 5.2 2.6 2.3 2.0 — — — 7.3 12.3 16.7 125 12.2 8.8
Reliance Communications 82 SELL 169,454 3,124 2,064 2.7 4.8 8.8 (40.2) 79.8 82.3 30.5 17.0 9.3 8.0 6.6 5.6 0.5 0.4 0.4 — — — 1.5 2.6 4.6 65 (20.8) 28.2
Tata Communications 231 REDUCE 65,721 1,211 285 (27.0) (19.4) (12.9) 3.3 28.1 33.6 (8.6) (11.9) (17.9) 8.3 7.3 6.7 4.3 6.9 11.5 — — — (40.3) (44.7) (48.2) 220 (4.6) 0.8
Telecom Neutral 2,010,739 37,064 (23.7) 92.2 54.4 44.9 23.4 15.1 7.4 6.2 5.2 1.6 1.5 1.4 0.5 0.5 1.1 3.6 6.6 9.4
Utilities
Adani Power 47 SELL 113,202 2,087 2,393 (6.4) (0.9) 5.1 (1,418.2) 86.1 675.4 (7.3) (53.1) 9.2 43.8 12.0 8.2 2.5 2.7 2.1 — — — (29.3) (4.9) 25.2 35 (26.0) 3.5
CESC 282 REDUCE 35,276 650 125 18.0 34.7 33.6 (17.2) 92.6 (3.1) 15.7 8.1 8.4 9.8 5.6 4.9 0.6 0.5 0.5 1.5 2.0 2.0 3.7 6.8 6.1 306 8.4 1.9
JSW Energy 61 SELL 100,532 1,853 1,640 6.7 7.1 5.9 230.6 5.9 (16.9) 9.2 8.7 10.4 7.0 5.6 5.8 1.5 1.3 1.1 — — — 17.5 15.7 11.4 61 (0.5) 1.9
Lanco Infratech 11 RS 23,564 434 2,223 (0.7) 1.0 7.7 (39.2) 233.2 696.7 (14.5) 10.9 1.4 10.1 6.8 3.6 0.5 0.5 0.4 — — — (3.6) 4.8 31.2 — — 2.7
NHPC 21 ADD 262,006 4,830 12,301 1.9 2.1 2.4 (25.2) 10.6 14.9 11.4 10.3 9.0 10.7 9.0 7.1 0.9 0.8 0.8 2.3 2.6 3.0 7.8 8.2 8.8 26 22.1 11.0
NTPC 144 ADD 1,188,584 21,909 8,245 13.3 13.9 14.7 22.8 5.0 5.7 10.9 10.3 9.8 9.9 8.8 7.9 1.5 1.4 1.2 2.8 2.9 3.1 14.2 13.7 13.2 180 24.9 22.9 Power Grid 107 BUY 494,918 9,123 4,630 9.3 10.7 12.8 32.0 14.8 19.8 11.5 10.0 8.3 10.6 8.5 7.2 1.9 1.7 1.5 2.7 3.0 3.7 17.4 17.8 18.9 140 31.0 7.8 Reliance Infrastructure 357 BUY 93,941 1,732 263 50.7 68.0 75.0 (16.0) 34.3 10.3 7.0 5.3 4.8 3.6 2.2 (0.4) 0.4 0.4 0.3 3.2 3.2 3.2 8.6 9.7 8.4 820 129.6 23.0
Reliance Power 70 SELL 195,658 3,607 2,805 3.4 3.7 4.8 9.5 10.2 29.5 20.6 18.7 14.4 22.4 18.1 10.2 1.1 1.0 0.9 — — — 5.3 5.5 6.7 80 14.7 10.1
Tata Power 95 ADD 233,382 4,302 2,468 4.2 5.6 5.8 (9.3) 34.2 2.5 22.6 16.9 16.4 8.1 6.8 6.4 1.8 1.7 1.6 1.8 1.8 1.8 7.8 10.4 9.9 113 19.5 5.1
Utilities Attractive 2,741,061 50,526 6.5 21.1 21.3 13.4 11.1 9.1 10.7 8.5 6.9 1.3 1.2 1.1 2.2 2.3 2.6 9.5 10.7 11.8
Others
Carborundum Universal 120 BUY 22,497 415 187 5.4 10.5 13.7 (53.0) 92.0 31.2 22.0 11.5 8.7 10.4 6.4 5.0 1.9 1.7 1.4 0.8 1.5 2.0 9.8 17.1 18.9 180 49.9 0.3
Coromandel International 196 SELL 55,256 1,019 283 18.1 19.7 21.5 (19.7) 8.6 8.9 10.8 9.9 9.1 9.3 6.7 6.3 2.1 1.8 1.6 3.8 4.0 4.0 18.8 18.3 18.0 170 (13.1) 0.6
Havells India 632 REDUCE 78,820 1,453 125 31.7 37.3 41.1 0.8 17.6 10.1 19.9 16.9 15.4 11.4 9.8 8.8 5.3 4.3 3.6 1.1 1.2 1.4 31.8 28.2 25.3 580 (8.2) 4.1
Jaiprakash Associates 74 BUY 162,875 3,002 2,191 4.0 9.9 17.5 36.5 149.0 76.0 18.6 7.5 4.3 10.1 7.0 5.2 1.3 1.1 0.9 — — — 7.2 16.0 23.4 100 34.5 33.6
Jet Airways 498 SELL 43,023 793 86 1.2 26.0 32.0 100.6 2,095 23.3 421.5 19.2 15.6 9.9 8.4 7.9 30.5 11.8 6.7 — — — 7.5 88.5 54.9 400 (19.7) 33.4
Rallis India 124 BUY 24,076 444 194 6.3 8.6 10.0 22.9 38 15.6 19.8 14.4 12.4 11.7 8.0 6.8 3.9 3.2 2.7 1.8 1.8 1.8 19.6 24.5 23.9 155 25.2 0.7
SpiceJet 30 BUY 14,386 265 484 0.4 3.5 5.1 103.2 679.1 47.5 67.0 8.6 5.8 18.9 6.0 4.1 (44.7) 10.7 3.8 — — — (23) 325.1 95.5 60 102.0 2.3
Tata Chemicals 321 ADD 81,861 1,509 255 33.6 37.7 40.7 2.2 12.2 8.0 9.6 8.5 7.9 5.7 4.9 4.4 1.1 0.9 0.8 3.1 3.1 3.1 11.1 11.2 10.9 370 15.2 2.7
United Phosphorus 126 REDUCE 58,234 1,073 462 15.0 16.0 18.0 24.9 6.5 12.4 8.4 7.9 7.0 5.2 4.7 4.1 1.2 1.1 1.0 2.0 2.0 2.0 16.0 15.0 14.9 120 (4.8) 4.1
Others 541,027 9,973 207.9 57.5 37.8 15.1 9.6 6.9 9.0 6.7 5.5 1.7 1.5 1.3 1.3 1.4 1.4 11.5 15.7 18.2
KIE universe 50,612,569 932,951 7.1 11.9 14.0 14.2 12.7 11.1 9.2 7.8 6.7 2.1 1.9 1.7 1.8 1.9 2.2 14.9 15.0 15.2 KIE universe ex-energy 42,800,225 788,944 9.6 14.2 15.9 15.2 13.3 11.4 10.3 8.6 7.2 2.4 2.1 1.9 1.7 1.8 2.0 15.7 15.9 16.3 KIE universe ex-energy & ex-commodities 37,032,515 682,627 11.5 14.9 16.3 16.4 14.3 12.3 11.5 9.5 8.1 2.6 2.3 2.0 1.6 1.7 2.0 15.8 16.2 16.6
Notes:
(a) For banks we have used adjusted book values.(b) 2012 means calendar year 2011, similarly for 2013 and 2014 for these particular companies.
(c) EV/Sales & EV/EBITDA for KS universe excludes Banking Sector.
(d) Rupee-US Dollar exchange rate (Rs/US$)= 54.25
Dividend yield (%)
Source: Company, Bloomberg, Kotak Institutional Equities estimates
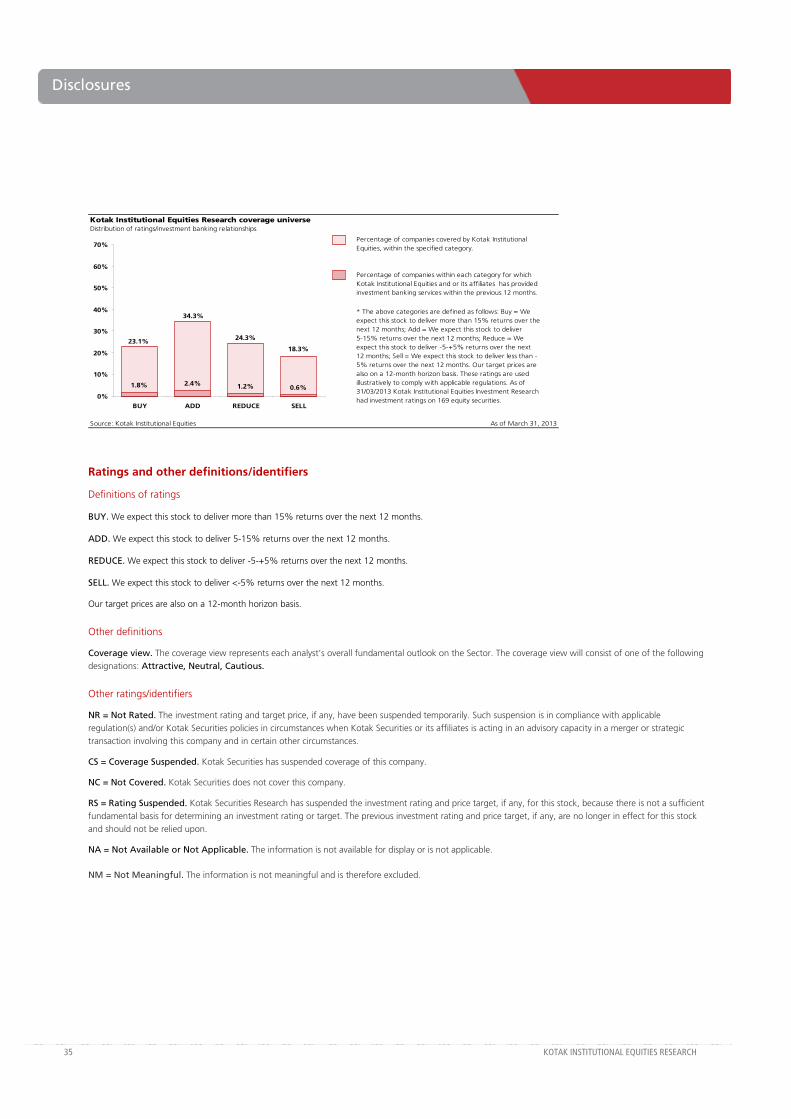
35 KOTAK INSTITUTIONAL EQUITIES RESEARCH
Disclosures
Kotak Institutional Equities Research coverage universeDistribution of ratings/investment banking relationships
Source: Kotak Institutional Equities As of March 31, 2013
Percentage of companies covered by Kotak Institutional Equities, within the specified category.
Percentage of companies within each category for which Kotak Institutional Equities and or its affiliates has provided investment banking services within the previous 12 months.
* The above categories are defined as follows: Buy = We expect this stock to deliver more than 15% returns over the next 12 months; Add = We expect this stock to deliver 5-15% returns over the next 12 months; Reduce = We expect this stock to deliver -5-+5% returns over the next 12 months; Sell = We expect this stock to deliver less than -5% returns over the next 12 months. Our target prices are also on a 12-month horizon basis. These ratings are used illustratively to comply with applicable regulations. As of 31/03/2013 Kotak Institutional Equities Investment Research had investment ratings on 169 equity securities.
18.3%23.1%
34.3%
24.3%
1.8% 2.4% 1.2% 0.6%0%
10%
20%
30%
40%
50%
60%
70%
BUY ADD REDUCE SELL
Ratings and other definitions/identifiers
Definitions of ratings
BUY. We expect this stock to deliver more than 15% returns over the next 12 months.
ADD. We expect this stock to deliver 5-15% returns over the next 12 months.
REDUCE. We expect this stock to deliver -5-+5% returns over the next 12 months.
SELL. We expect this stock to deliver <-5% returns over the next 12 months.
Our target prices are also on a 12-month horizon basis.
Other definitions
Coverage view. The coverage view represents each analyst’s overall fundamental outlook on the Sector. The coverage view will consist of one of the following designations: Attractive, Neutral, Cautious.
Other ratings/identifiers
NR = Not Rated. The investment rating and target price, if any, have been suspended temporarily. Such suspension is in compliance with applicable regulation(s) and/or Kotak Securities policies in circumstances when Kotak Securities or its affiliates is acting in an advisory capacity in a merger or strategic transaction involving this company and in certain other circumstances.
CS = Coverage Suspended. Kotak Securities has suspended coverage of this company.
NC = Not Covered. Kotak Securities does not cover this company.
RS = Rating Suspended. Kotak Securities Research has suspended the investment rating and price target, if any, for this stock, because there is not a sufficient fundamental basis for determining an investment rating or target. The previous investment rating and price target, if any, are no longer in effect for this stock and should not be relied upon.
NA = Not Available or Not Applicable. The information is not available for display or is not applicable.
NM = Not Meaningful. The information is not meaningful and is therefore excluded.
Corporate Office Overseas Offices
Kotak Securities Ltd.
Bakhtawar, 1st Floor
229, Nariman Point
Mumbai 400 021, India
Tel: +91-22-6634-1100
Kotak Mahindra (UK) Ltd
8th Floor, Portsoken House
155-157 Minories
London EC3N 1LS
Tel: +44-20-7977-6900
Kotak Mahindra Inc
50 Main Street, Ste. 890
Westchester Financial Centre
White Plains, New York 10606
Tel:+1-914-997-6120
Copyright 2013 Kotak Institutional Equities (Kotak Securities Limited). All rights reserved.
1. Note that the research analysts contributing to this report may not be registered/qualified as research analysts with FINRA; and
2. Such research analysts may not be associated persons of Kotak Mahindra Inc and therefore, may not be subject to NASD Rule 2711 restrictions on communications with a subject company, public appearances and trading securities held by a research analyst account.
Kotak Securities Limited and its affiliates are a full-service, integrated investment banking, investment management, brokerage and financing group. We along with our affiliates are leading underwriter of securities and participants in virtually all securities trading markets in India. We and our affiliates have investment banking and other business relationships with a significant percentage of the companies covered by our Investment Research Department. Our research professionals provide important input into our investment banking and other business selection processes. Investors should assume that Kotak Securities Limited and/or its affiliates are seeking or will seek investment banking or other business from the company or companies that are the subject of this material and that the research professionals who were involved in preparing this material may participate in the solicitation of such business. Our research professionals are paid in part based on the profitability of Kotak Securities Limited, which include earnings from investment banking and other business. Kotak Securities Limited generally prohibits its analysts, persons reporting to analysts, and members of their households from maintaining a financial interest in the securities or derivatives of any companies that the analysts cover. Additionally, Kotak Securities Limited generally prohibits its analysts and persons reporting to analysts from serving as an officer, director, or advisory board member of any companies that the analysts cover. Our salespeople, traders, and other professionals may provide oral or written market commentary or trading strategies to our clients that reflect opinions that are contrary to the opinions expressed herein, and our proprietary trading and investing businesses may make investment decisions that are inconsistent with the recommendations expressed herein. In reviewing these materials, you should be aware that any or all of the foregoing, among other things, may give rise to real or potential conflicts of interest. Additionally, other important information regarding our relationships with the company or companies that are the subject of this material is provided herein.
This material should not be construed as an offer to sell or the solicitation of an offer to buy any security in any jurisdiction where such an offer or solicitation would be illegal. We are not soliciting any action based on this material. It is for the general information of clients of Kotak Securities Limited. It does not constitute a personal recommendation or take into account the particular investment objectives, financial situations, or needs of individual clients. Before acting on any advice or recommendation in this material, clients should consider whether it is suitable for their particular circumstances and, if necessary, seek professional advice. The price and value of the investments referred to in this material and the income from them may go down as well as up, and investors may realize losses on any investments. Past performance is not a guide for future performance, future returns are not guaranteed and a loss of original capital may occur. Kotak Securities Limited does not provide tax advise to its clients, and all investors are strongly advised to consult with their tax advisers regarding any potential investment.
Certain transactions -including those involving futures, options, and other derivatives as well as non-investment-grade securities - give rise to substantial risk and are not suitable for all investors. The material is based on information that we consider reliable, but we do not represent that it is accurate or complete, and it should not be relied on as such. Opinions expressed are our current opinions as of the date appearing on this material only. We endeavor to update on a reasonable basis the information discussed in this material, but regulatory, compliance, or other reasons may prevent us from doing so. We and our affiliates, officers, directors, and employees, including persons involved in the preparation or issuance of this material, may from time to time have “long” or “short” positions in, act as principal in, and buy or sell the securities or derivatives thereof of companies mentioned herein. For the purpose of calculating whether Kotak Securities Limited and its affiliates holds beneficially owns or controls, including the right to vote for directors, 1% of more of the equity shares of the subject issuer of a research report, the holdings does not include accounts managed by Kotak Mahindra Mutual Fund. Kotak Securities Limited and its non US affiliates may, to the extent permissible under applicable laws, have acted on or used this research to the extent that it relates to non US issuers, prior to or immediately following its publication. Foreign currency denominated securities are subject to fluctuations in exchange rates that could have an adverse effect on the value or price of or income derived from the investment. In addition, investors in securities such as ADRs, the value of which are influenced by foreign currencies affectively assume currency risk. In addition options involve risks and are not suitable for all investors. Please ensure that you have read and understood the current derivatives risk disclosure document before entering into any derivative transactions.
This report has not been prepared by Kotak Mahindra Inc. (KMInc). However KMInc has reviewed the report and, in so far as it includes current or historical information, it is believed to be reliable, although its accuracy and completeness cannot be guaranteed. Any reference to Kotak Securities Limited shall also be deemed to mean and include Kotak Mahindra Inc.