Embed Size (px)
Citation preview
India Consumer Exuberant Valuations, languid pricing and volume growth‐ A recipe for de‐rating 8 May 2013
PhillipCapital (India) Pvt. Ltd.
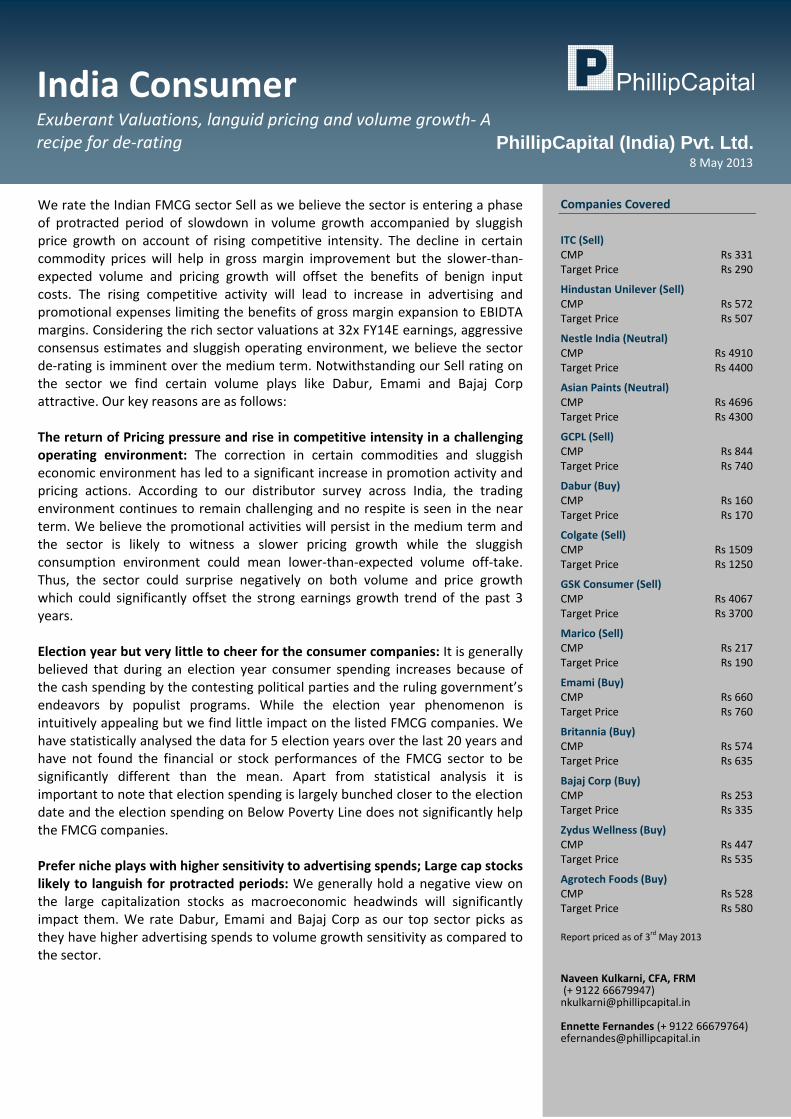
We rate the Indian FMCG sector Sell as we believe the sector is entering a phase of protracted period of slowdown in volume growth accompanied by sluggish price growth on account of rising competitive intensity. The decline in certain commodity prices will help in gross margin improvement but the slower‐than‐expected volume and pricing growth will offset the benefits of benign input costs. The rising competitive activity will lead to increase in advertising and promotional expenses limiting the benefits of gross margin expansion to EBIDTA margins. Considering the rich sector valuations at 32x FY14E earnings, aggressive consensus estimates and sluggish operating environment, we believe the sector de‐rating is imminent over the medium term. Notwithstanding our Sell rating on the sector we find certain volume plays like Dabur, Emami and Bajaj Corp attractive. Our key reasons are as follows: The return of Pricing pressure and rise in competitive intensity in a challenging operating environment: The correction in certain commodities and sluggish economic environment has led to a significant increase in promotion activity and pricing actions. According to our distributor survey across India, the trading environment continues to remain challenging and no respite is seen in the near term. We believe the promotional activities will persist in the medium term and the sector is likely to witness a slower pricing growth while the sluggish consumption environment could mean lower‐than‐expected volume off‐take. Thus, the sector could surprise negatively on both volume and price growth which could significantly offset the strong earnings growth trend of the past 3 years. Election year but very little to cheer for the consumer companies: It is generally believed that during an election year consumer spending increases because of the cash spending by the contesting political parties and the ruling government’s endeavors by populist programs. While the election year phenomenon is intuitively appealing but we find little impact on the listed FMCG companies. We have statistically analysed the data for 5 election years over the last 20 years and have not found the financial or stock performances of the FMCG sector to be significantly different than the mean. Apart from statistical analysis it is important to note that election spending is largely bunched closer to the election date and the election spending on Below Poverty Line does not significantly help the FMCG companies. Prefer niche plays with higher sensitivity to advertising spends; Large cap stocks likely to languish for protracted periods: We generally hold a negative view on the large capitalization stocks as macroeconomic headwinds will significantly impact them. We rate Dabur, Emami and Bajaj Corp as our top sector picks as they have higher advertising spends to volume growth sensitivity as compared to the sector.
Companies Covered
ITC (Sell) CMP Rs 331Target Price Rs 290
Hindustan Unilever (Sell) CMP Rs 572Target Price Rs 507
Nestle India (Neutral) CMP Rs 4910Target Price Rs 4400
Asian Paints (Neutral) CMP Rs 4696Target Price Rs 4300
GCPL (Sell) CMP Rs 844Target Price Rs 740
Dabur (Buy) CMP Rs 160Target Price Rs 170
Colgate (Sell) CMP Rs 1509Target Price Rs 1250
GSK Consumer (Sell) CMP Rs 4067Target Price Rs 3700
Marico (Sell) CMP Rs 217Target Price Rs 190
Emami (Buy) CMP Rs 660Target Price Rs 760
Britannia (Buy) CMP Rs 574Target Price Rs 635
Bajaj Corp (Buy) CMP Rs 253Target Price Rs 335
Zydus Wellness (Buy) CMP Rs 447Target Price Rs 535
Agrotech Foods (Buy) CMP Rs 528Target Price Rs 580 Report priced as of 3rd May 2013 Naveen Kulkarni, CFA, FRM (+ 9122 66679947) [email protected] Ennette Fernandes (+ 9122 66679764) [email protected]
– 2 of 115 –
8 May 2013 / INDIA EQUITY RESEARCH / FMCG SECTOR UPDATE
Table of Contents Return of the pricing pressure; Competitive activity rising ∙∙∙∙∙∙∙∙∙∙∙∙∙∙∙∙∙∙∙∙∙∙∙∙∙∙∙∙∙∙∙∙∙∙∙∙∙∙∙ 3
Channel checks and Distributor survey corroborate volume growth and pricing pressure ∙∙∙∙∙∙∙∙∙∙∙∙∙∙∙∙∙∙∙∙∙∙∙∙∙∙∙∙∙∙∙∙∙∙∙∙∙∙∙∙∙∙∙∙∙∙∙∙∙∙∙∙∙∙∙∙∙∙∙∙∙∙∙∙∙∙∙∙∙∙∙∙∙∙∙∙∙∙∙∙∙∙∙∙∙∙∙∙∙∙∙∙∙∙∙∙∙∙ 7
Distributor Survey portends to tepid demand scenario ∙∙∙∙∙∙∙∙∙∙∙∙∙∙∙∙∙∙∙∙∙∙∙∙∙∙∙∙∙∙∙∙∙∙∙∙∙∙∙∙∙∙∙∙ 13
Election year but very little to cheer about for the consumer companies ∙∙∙∙∙∙∙∙∙∙∙∙∙∙∙ 14
Statistical analysis of election impact ∙∙∙∙∙∙∙∙∙∙∙∙∙∙∙∙∙∙∙∙∙∙∙∙∙∙∙∙∙∙∙∙∙∙∙∙∙∙∙∙∙∙∙∙∙∙∙∙∙∙∙∙∙∙∙∙∙∙∙∙∙∙∙∙∙∙∙∙∙∙∙∙ 18
Limited positive impact of input cost inflation‐ Too little to cheer…………………………… 19
Consensus estimates continue to remain aggressive and disappointments to consensus will lead to a de‐rating ∙∙∙∙∙∙∙∙∙∙∙∙∙∙∙∙∙∙∙∙∙∙∙∙∙∙∙∙∙∙∙∙∙∙∙∙∙∙∙∙∙∙∙∙∙ 20
Companies Section ITC ∙∙∙∙∙∙∙∙∙∙∙∙∙∙∙∙∙∙∙∙∙∙∙∙∙∙∙∙∙∙∙∙∙∙∙∙∙∙∙∙∙∙∙∙∙∙∙∙∙∙∙∙∙∙∙∙∙∙∙∙∙∙∙∙∙∙∙∙∙∙∙∙∙∙∙∙∙∙∙∙∙∙∙∙∙∙∙∙∙∙∙∙∙∙∙∙∙∙∙∙∙∙∙∙∙∙∙∙∙∙∙∙∙∙∙∙∙∙∙∙∙∙∙∙∙∙ 25
Hindustan Unilever ∙∙∙∙∙∙∙∙∙∙∙∙∙∙∙∙∙∙∙∙∙∙∙∙∙∙∙∙∙∙∙∙∙∙∙∙∙∙∙∙∙∙∙∙∙∙∙∙∙∙∙∙∙∙∙∙∙∙∙∙∙∙∙∙∙∙∙∙∙∙∙∙∙∙∙∙∙∙∙∙∙∙∙∙∙∙∙∙∙∙∙∙∙∙∙∙∙∙∙∙ 34
Nestle India ∙∙∙∙∙∙∙∙∙∙∙∙∙∙∙∙∙∙∙∙∙∙∙∙∙∙∙∙∙∙∙∙∙∙∙∙∙∙∙∙∙∙∙∙∙∙∙∙∙∙∙∙∙∙∙∙∙∙∙∙∙∙∙∙∙∙∙∙∙∙∙∙∙∙∙∙∙∙∙∙∙∙∙∙∙∙∙∙∙∙∙∙∙∙∙∙∙∙∙∙∙∙∙∙∙∙∙∙∙∙∙ 39
Asian Paints ∙∙∙∙∙∙∙∙∙∙∙∙∙∙∙∙∙∙∙∙∙∙∙∙∙∙∙∙∙∙∙∙∙∙∙∙∙∙∙∙∙∙∙∙∙∙∙∙∙∙∙∙∙∙∙∙∙∙∙∙∙∙∙∙∙∙∙∙∙∙∙∙∙∙∙∙∙∙∙∙∙∙∙∙∙∙∙∙∙∙∙∙∙∙∙∙∙∙∙∙∙∙∙∙∙∙∙∙∙∙∙ 44
Godrej Consumer Products Limited ∙∙∙∙∙∙∙∙∙∙∙∙∙∙∙∙∙∙∙∙∙∙∙∙∙∙∙∙∙∙∙∙∙∙∙∙∙∙∙∙∙∙∙∙∙∙∙∙∙∙∙∙∙∙∙∙∙∙∙∙∙∙∙∙∙∙∙∙∙∙∙∙∙∙ 50
Dabur India ∙∙∙∙∙∙∙∙∙∙∙∙∙∙∙∙∙∙∙∙∙∙∙∙∙∙∙∙∙∙∙∙∙∙∙∙∙∙∙∙∙∙∙∙∙∙∙∙∙∙∙∙∙∙∙∙∙∙∙∙∙∙∙∙∙∙∙∙∙∙∙∙∙∙∙∙∙∙∙∙∙∙∙∙∙∙∙∙∙∙∙∙∙∙∙∙∙∙∙∙∙∙∙∙∙∙∙∙∙∙∙∙ 55
Colgate Palmolive India ∙∙∙∙∙∙∙∙∙∙∙∙∙∙∙∙∙∙∙∙∙∙∙∙∙∙∙∙∙∙∙∙∙∙∙∙∙∙∙∙∙∙∙∙∙∙∙∙∙∙∙∙∙∙∙∙∙∙∙∙∙∙∙∙∙∙∙∙∙∙∙∙∙∙∙∙∙∙∙∙∙∙∙∙∙∙∙∙∙∙∙∙∙ 60
GlaxoSmithKline Consumer ∙∙∙∙∙∙∙∙∙∙∙∙∙∙∙∙∙∙∙∙∙∙∙∙∙∙∙∙∙∙∙∙∙∙∙∙∙∙∙∙∙∙∙∙∙∙∙∙∙∙∙∙∙∙∙∙∙∙∙∙∙∙∙∙∙∙∙∙∙∙∙∙∙∙∙∙∙∙∙∙∙∙∙∙∙∙∙ 65
Marico Industrires ∙∙∙∙∙∙∙∙∙∙∙∙∙∙∙∙∙∙∙∙∙∙∙∙∙∙∙∙∙∙∙∙∙∙∙∙∙∙∙∙∙∙∙∙∙∙∙∙∙∙∙∙∙∙∙∙∙∙∙∙∙∙∙∙∙∙∙∙∙∙∙∙∙∙∙∙∙∙∙∙∙∙∙∙∙∙∙∙∙∙∙∙∙∙∙∙∙∙∙∙ 70
Emami ∙∙∙∙∙∙∙∙∙∙∙∙∙∙∙∙∙∙∙∙∙∙∙∙∙∙∙∙∙∙∙∙∙∙∙∙∙∙∙∙∙∙∙∙∙∙∙∙∙∙∙∙∙∙∙∙∙∙∙∙∙∙∙∙∙∙∙∙∙∙∙∙∙∙∙∙∙∙∙∙∙∙∙∙∙∙∙∙∙∙∙∙∙∙∙∙∙∙∙∙∙∙∙∙∙∙∙∙∙∙∙∙∙∙∙∙∙∙∙∙ 75
Britannia Industries Ltd ∙∙∙∙∙∙∙∙∙∙∙∙∙∙∙∙∙∙∙∙∙∙∙∙∙∙∙∙∙∙∙∙∙∙∙∙∙∙∙∙∙∙∙∙∙∙∙∙∙∙∙∙∙∙∙∙∙∙∙∙∙∙∙∙∙∙∙∙∙∙∙∙∙∙∙∙∙∙∙∙∙∙∙∙∙∙∙∙∙∙∙∙∙ 87
Bajaj Corp ∙∙∙∙∙∙∙∙∙∙∙∙∙∙∙∙∙∙∙∙∙∙∙∙∙∙∙∙∙∙∙∙∙∙∙∙∙∙∙∙∙∙∙∙∙∙∙∙∙∙∙∙∙∙∙∙∙∙∙∙∙∙∙∙∙∙∙∙∙∙∙∙∙∙∙∙∙∙∙∙∙∙∙∙∙∙∙∙∙∙∙∙∙∙∙∙∙∙∙∙∙∙∙∙∙∙∙∙∙∙∙∙∙∙ 92
Zydus Wellness ∙∙∙∙∙∙∙∙∙∙∙∙∙∙∙∙∙∙∙∙∙∙∙∙∙∙∙∙∙∙∙∙∙∙∙∙∙∙∙∙∙∙∙∙∙∙∙∙∙∙∙∙∙∙∙∙∙∙∙∙∙∙∙∙∙∙∙∙∙∙∙∙∙∙∙∙∙∙∙∙∙∙∙∙∙∙∙∙∙∙∙∙∙∙∙∙∙∙∙∙∙∙∙∙∙∙ 98
AgroTech Foods∙∙∙∙∙∙∙∙∙∙∙∙∙∙∙∙∙∙∙∙∙∙∙∙∙∙∙∙∙∙∙∙∙∙∙∙∙∙∙∙∙∙∙∙∙∙∙∙∙∙∙∙∙∙∙∙∙∙∙∙∙∙∙∙∙∙∙∙∙∙∙∙∙∙∙∙∙∙∙∙∙∙∙∙∙∙∙∙∙∙∙∙∙∙∙∙∙∙∙∙∙∙∙∙∙∙ 105
Appendix ∙∙∙∙∙∙∙∙∙∙∙∙∙∙∙∙∙∙∙∙∙∙∙∙∙∙∙∙∙∙∙∙∙∙∙∙∙∙∙∙∙∙∙∙∙∙∙∙∙∙∙∙∙∙∙∙∙∙∙∙∙∙∙∙∙∙∙∙∙∙∙∙∙∙∙∙∙∙∙∙∙∙∙∙∙∙∙∙∙∙∙∙∙∙∙∙∙∙∙∙∙∙∙∙∙∙∙∙∙∙∙∙∙∙∙∙ 110
– 3 of 115 –
8 May 2013 / INDIA EQUITY RESEARCH / FMCG SECTOR UPDATE
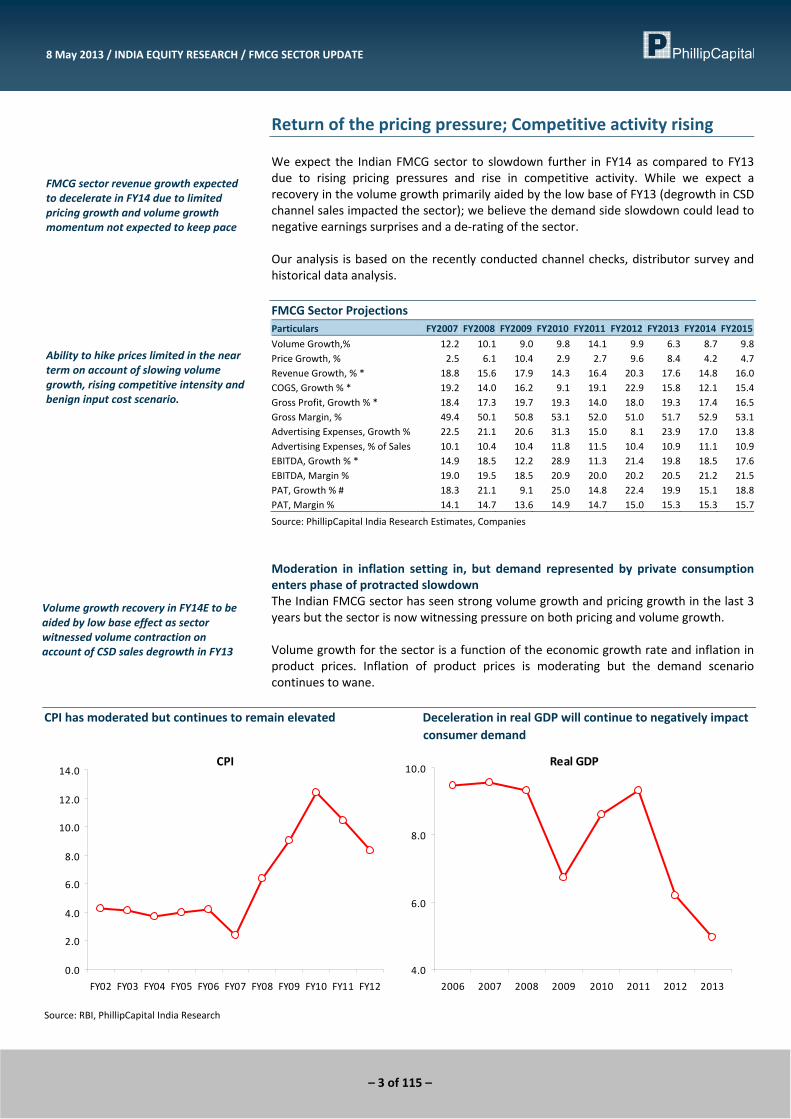
Return of the pricing pressure; Competitive activity rising We expect the Indian FMCG sector to slowdown further in FY14 as compared to FY13 due to rising pricing pressures and rise in competitive activity. While we expect a recovery in the volume growth primarily aided by the low base of FY13 (degrowth in CSD channel sales impacted the sector); we believe the demand side slowdown could lead to negative earnings surprises and a de‐rating of the sector. Our analysis is based on the recently conducted channel checks, distributor survey and historical data analysis. FMCG Sector Projections Particulars FY2007 FY2008 FY2009 FY2010 FY2011 FY2012 FY2013 FY2014 FY2015
Volume Growth,% 12.2 10.1 9.0 9.8 14.1 9.9 6.3 8.7 9.8Price Growth, % 2.5 6.1 10.4 2.9 2.7 9.6 8.4 4.2 4.7Revenue Growth, % * 18.8 15.6 17.9 14.3 16.4 20.3 17.6 14.8 16.0COGS, Growth % * 19.2 14.0 16.2 9.1 19.1 22.9 15.8 12.1 15.4Gross Profit, Growth % * 18.4 17.3 19.7 19.3 14.0 18.0 19.3 17.4 16.5Gross Margin, % 49.4 50.1 50.8 53.1 52.0 51.0 51.7 52.9 53.1Advertising Expenses, Growth % 22.5 21.1 20.6 31.3 15.0 8.1 23.9 17.0 13.8Advertising Expenses, % of Sales 10.1 10.4 10.4 11.8 11.5 10.4 10.9 11.1 10.9EBITDA, Growth % * 14.9 18.5 12.2 28.9 11.3 21.4 19.8 18.5 17.6EBITDA, Margin % 19.0 19.5 18.5 20.9 20.0 20.2 20.5 21.2 21.5PAT, Growth % # 18.3 21.1 9.1 25.0 14.8 22.4 19.9 15.1 18.8PAT, Margin % 14.1 14.7 13.6 14.9 14.7 15.0 15.3 15.3 15.7
Source: PhillipCapital India Research Estimates, Companies
Moderation in inflation setting in, but demand represented by private consumption enters phase of protracted slowdown The Indian FMCG sector has seen strong volume growth and pricing growth in the last 3 years but the sector is now witnessing pressure on both pricing and volume growth. Volume growth for the sector is a function of the economic growth rate and inflation in product prices. Inflation of product prices is moderating but the demand scenario continues to wane.
CPI has moderated but continues to remain elevated Deceleration in real GDP will continue to negatively impact consumer demand
CPI
0.0
2.0
4.0
6.0
8.0
10.0
12.0
14.0
FY02 FY03 FY04 FY05 FY06 FY07 FY08 FY09 FY10 FY11 FY12
Real GDP
4.0
6.0
8.0
10.0
2006 2007 2008 2009 2010 2011 2012 2013
Source: RBI, PhillipCapital India Research
FMCG sector revenue growth expected to decelerate in FY14 due to limited pricing growth and volume growth momentum not expected to keep pace
Volume growth recovery in FY14E to be aided by low base effect as sector witnessed volume contraction on account of CSD sales degrowth in FY13
Ability to hike prices limited in the near term on account of slowing volume growth, rising competitive intensity and benign input cost scenario.
– 4 of 115 –
8 May 2013 / INDIA EQUITY RESEARCH / FMCG SECTOR UPDATE
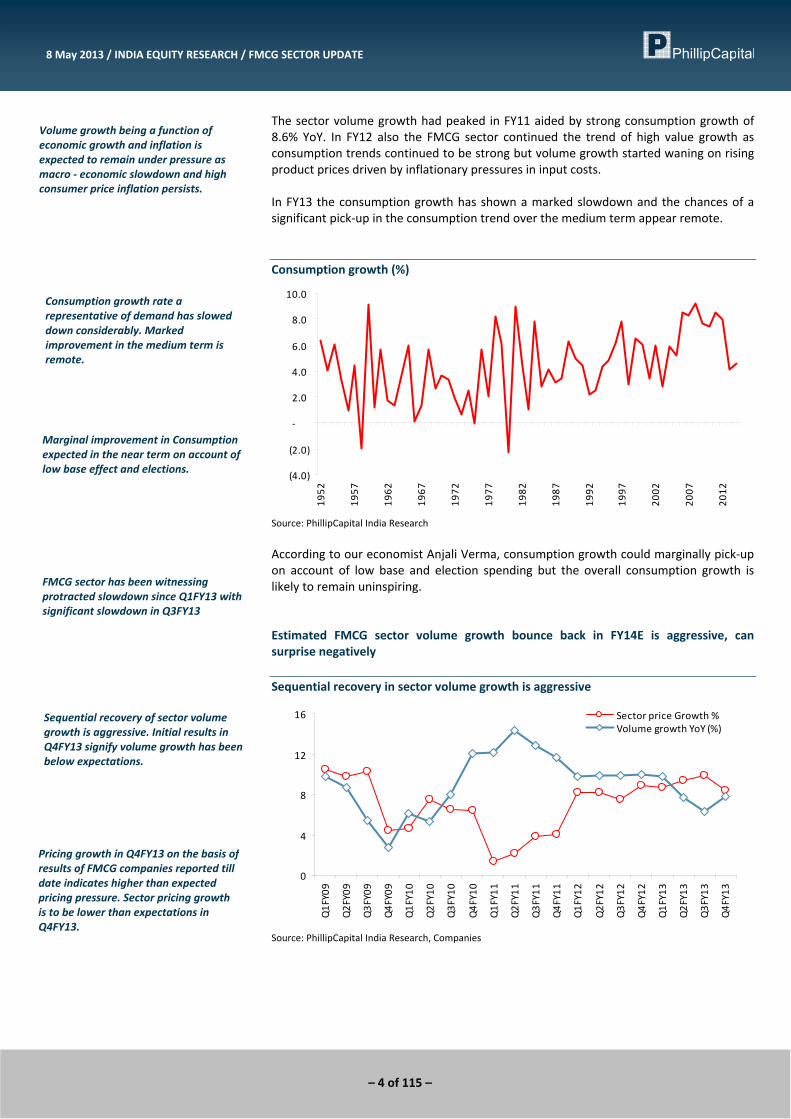
The sector volume growth had peaked in FY11 aided by strong consumption growth of 8.6% YoY. In FY12 also the FMCG sector continued the trend of high value growth as consumption trends continued to be strong but volume growth started waning on rising product prices driven by inflationary pressures in input costs. In FY13 the consumption growth has shown a marked slowdown and the chances of a significant pick‐up in the consumption trend over the medium term appear remote. Consumption growth (%)
(4.0)
(2.0)
‐
2.0
4.0
6.0
8.0
10.0
1952
1957
1962
1967
1972
1977
1982
1987
1992
1997
2002
2007
2012
Source: PhillipCapital India Research
According to our economist Anjali Verma, consumption growth could marginally pick‐up on account of low base and election spending but the overall consumption growth is likely to remain uninspiring. Estimated FMCG sector volume growth bounce back in FY14E is aggressive, can surprise negatively Sequential recovery in sector volume growth is aggressive
0
4
8
12
16
Q1FY09
Q2FY09
Q3FY09
Q4FY09
Q1FY10
Q2FY10
Q3FY10
Q4FY10
Q1FY11
Q2FY11
Q3FY11
Q4FY11
Q1FY12
Q2FY12
Q3FY12
Q4FY12
Q1FY13
Q2FY13
Q3FY13
Q4FY13
Sector price Growth %Volume growth YoY (%)
Source: PhillipCapital India Research, Companies
Volume growth being a function of economic growth and inflation is expected to remain under pressure as macro ‐ economic slowdown and high consumer price inflation persists.
Consumption growth rate a representative of demand has slowed down considerably. Marked improvement in the medium term is remote.
Marginal improvement in Consumption expected in the near term on account of low base effect and elections.
Sequential recovery of sector volume growth is aggressive. Initial results in Q4FY13 signify volume growth has been below expectations.
Pricing growth in Q4FY13 on the basis of results of FMCG companies reported till date indicates higher than expected pricing pressure. Sector pricing growth is to be lower than expectations in Q4FY13.
FMCG sector has been witnessing protracted slowdown since Q1FY13 with significant slowdown in Q3FY13
– 5 of 115 –
8 May 2013 / INDIA EQUITY RESEARCH / FMCG SECTOR UPDATE
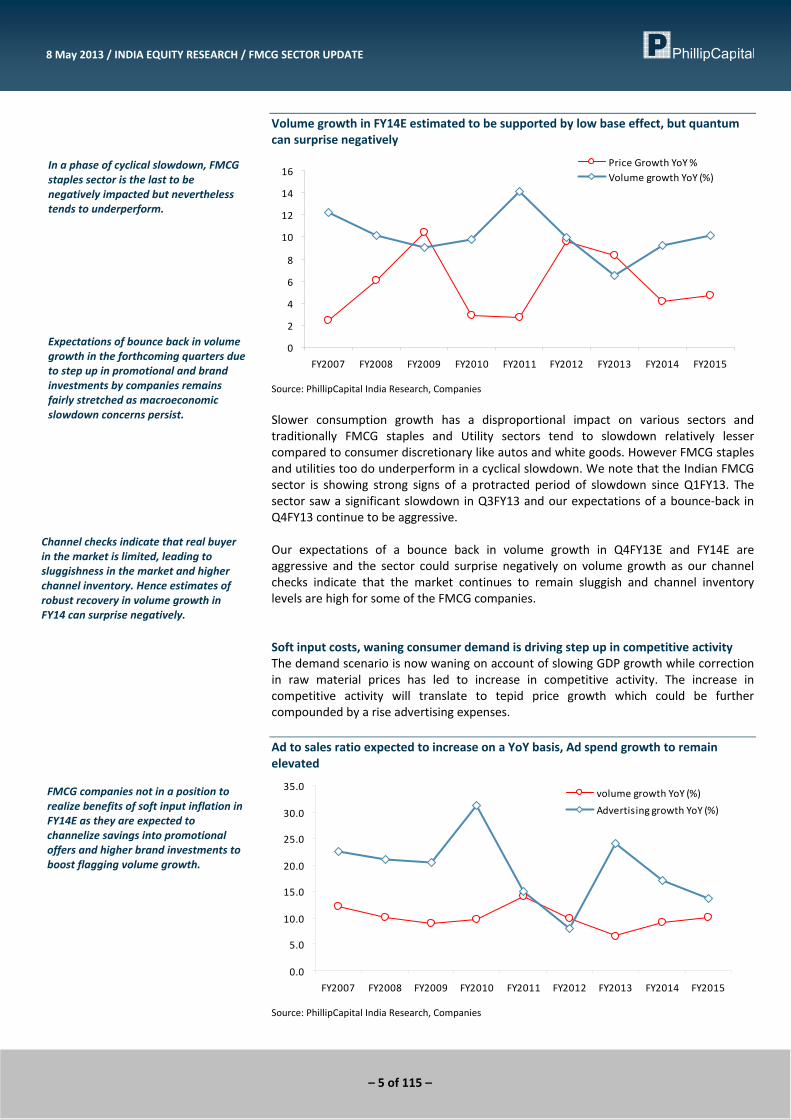
Volume growth in FY14E estimated to be supported by low base effect, but quantum can surprise negatively
0
2
4
6
8
10
12
14
16
FY2007 FY2008 FY2009 FY2010 FY2011 FY2012 FY2013 FY2014 FY2015
Price Growth YoY %Volume growth YoY (%)
Source: PhillipCapital India Research, Companies
Slower consumption growth has a disproportional impact on various sectors and traditionally FMCG staples and Utility sectors tend to slowdown relatively lesser compared to consumer discretionary like autos and white goods. However FMCG staples and utilities too do underperform in a cyclical slowdown. We note that the Indian FMCG sector is showing strong signs of a protracted period of slowdown since Q1FY13. The sector saw a significant slowdown in Q3FY13 and our expectations of a bounce‐back in Q4FY13 continue to be aggressive. Our expectations of a bounce back in volume growth in Q4FY13E and FY14E are aggressive and the sector could surprise negatively on volume growth as our channel checks indicate that the market continues to remain sluggish and channel inventory levels are high for some of the FMCG companies. Soft input costs, waning consumer demand is driving step up in competitive activity The demand scenario is now waning on account of slowing GDP growth while correction in raw material prices has led to increase in competitive activity. The increase in competitive activity will translate to tepid price growth which could be further compounded by a rise advertising expenses. Ad to sales ratio expected to increase on a YoY basis, Ad spend growth to remain elevated
0.0
5.0
10.0
15.0
20.0
25.0
30.0
35.0
FY2007 FY2008 FY2009 FY2010 FY2011 FY2012 FY2013 FY2014 FY2015
volume growth YoY (%)
Advertising growth YoY (%)
Source: PhillipCapital India Research, Companies
In a phase of cyclical slowdown, FMCG staples sector is the last to be negatively impacted but nevertheless tends to underperform.
Expectations of bounce back in volume growth in the forthcoming quarters due to step up in promotional and brand investments by companies remains fairly stretched as macroeconomic slowdown concerns persist.
Channel checks indicate that real buyer in the market is limited, leading to sluggishness in the market and higher channel inventory. Hence estimates of robust recovery in volume growth in FY14 can surprise negatively.
FMCG companies not in a position to realize benefits of soft input inflation in FY14E as they are expected to channelize savings into promotional offers and higher brand investments to boost flagging volume growth.

– 6 of 115 –
8 May 2013 / INDIA EQUITY RESEARCH / FMCG SECTOR UPDATE
Correction in input costs generally tends to increase competitive pressures as market participation from smaller players increases significantly. This generally translates to increase in promotional activity and advertisement expenses for the FMCG companies. We have observed that sector advertising expenses generally increase significantly when input costs soften. We have observed this in FY10 when commodity prices crashed and FMCG companies significantly stepped up their spending. While we expect the FMCG companies to step‐up advertising and promotional spending, we do not expect the spending to be accompanied by a sharp rise in volume growth as the macroeconomic environment continues to remain sluggish.
Competitive intensity has increased in the sector since the past 2 quarters, as companies chase consumers in an environment of slowing consumer demand.
Sector advertising and promotional spend growth is expected to remain elevated in FY14E. However high Ad spends is not expected to translate to robust volume growth on account of sluggish macroeconomic factors.
– 7 of 115 –
8 May 2013 / INDIA EQUITY RESEARCH / FMCG SECTOR UPDATE
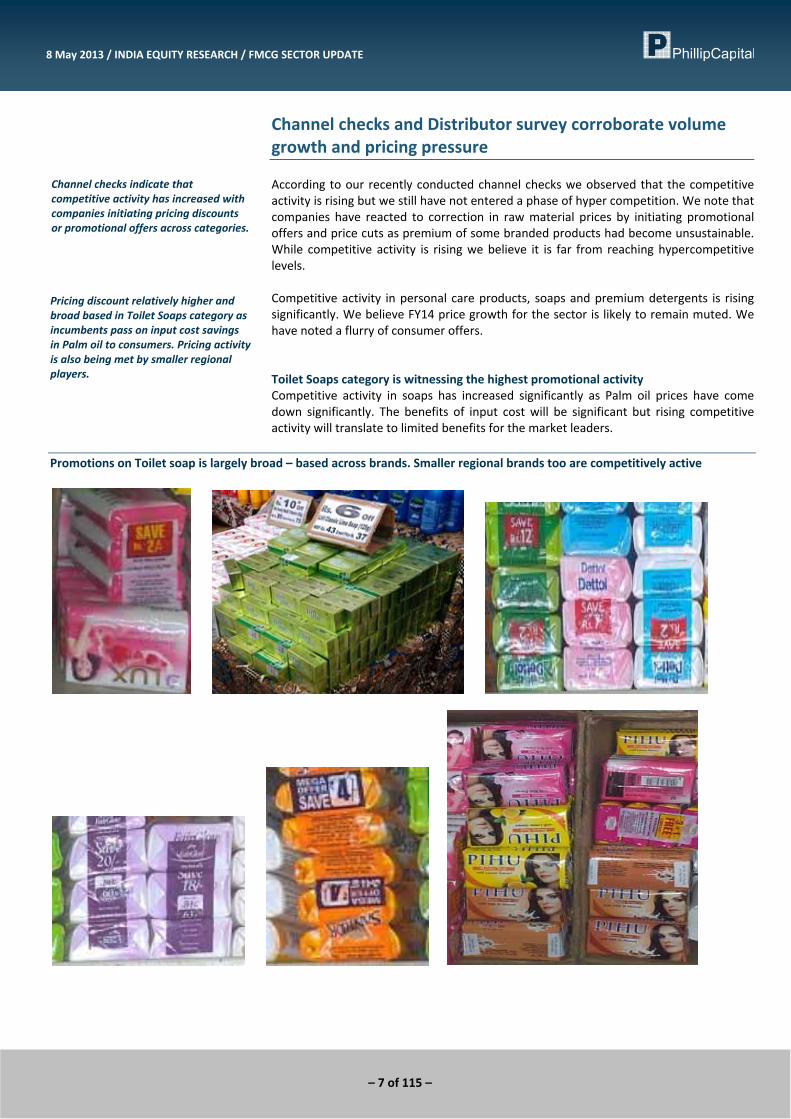
Channel checks and Distributor survey corroborate volume growth and pricing pressure According to our recently conducted channel checks we observed that the competitive activity is rising but we still have not entered a phase of hyper competition. We note that companies have reacted to correction in raw material prices by initiating promotional offers and price cuts as premium of some branded products had become unsustainable. While competitive activity is rising we believe it is far from reaching hypercompetitive levels. Competitive activity in personal care products, soaps and premium detergents is rising significantly. We believe FY14 price growth for the sector is likely to remain muted. We have noted a flurry of consumer offers. Toilet Soaps category is witnessing the highest promotional activity Competitive activity in soaps has increased significantly as Palm oil prices have come down significantly. The benefits of input cost will be significant but rising competitive activity will translate to limited benefits for the market leaders.
Promotions on Toilet soap is largely broad – based across brands. Smaller regional brands too are competitively active
Channel checks indicate that competitive activity has increased with companies initiating pricing discounts or promotional offers across categories.
Pricing discount relatively higher and broad based in Toilet Soaps category as incumbents pass on input cost savings in Palm oil to consumers. Pricing activity is also being met by smaller regional players.
– 8 of 115 –
8 May 2013 / INDIA EQUITY RESEARCH / FMCG SECTOR UPDATE
Promotions on Soaps are a mix of free grammage or pricing offers Brand Company Category SKU (gm) MRP Offer Pricing discount (%)
Lifebuoy Hindustan Unilever Personal Wash 60+10 10 10 gm free ‐14.3Lux Hindustan Unilever Personal Wash 55+10 10 10 gm free ‐15.4Lux Hindustan Unilever Personal Wash 4*(50+5) 40 Rs. 2 off+ 20 gm free ‐14.1Lux Hindustan Unilever Personal Wash 4*100 80 Rs. 10 off ‐12.5 Pears Germshield Hindustan Unilever Personal Wash 75 32 Rs. 5 off ‐15.6Pears Pure & Gentle Hindustan Unilever Personal Wash 75 32 Rs. 5 off ‐15.6Pears Pure & Gentle Hindustan Unilever Personal Wash 175 Rs. 7 off Pears Pure & Gentle Hindustan Unilever Personal Wash 3*125 145 Rs. 10 off ‐6.9Dove Hindustan Unilever Personal Wash 75 42 Rs. 5 off ‐11.9Dove Hindustan Unilever Personal Wash 3*100 138 Rs. 10 off ‐7.2Dettol Reckitt Benckiser Personal Wash 3*125 105 Rs. 12 off ‐11.4Dettol Reckitt Benckiser Personal Wash 4*75 88 Rs. 9 off ‐10.2Dettol Cool Reckitt Benckiser Personal Wash 3*75 69 Rs. 2 off ‐2.9Dettol Skin Care Reckitt Benckiser Personal Wash 3*75 50 Rs. 7 off ‐12.3Santoor Wipro Personal Wash 4*50 44 Rs. 4 off ‐9.1 Fair Glow Godrej Consumer Personal Wash 4*75 80 Rs. 20 off ‐25.0Margo Jyothy Lab Personal Wash 2*100 44 Rs. 4 off ‐9.1Pihu Personal Wash 4*75 48 Rs. 8 off ‐16.7
Source: PhillipCapital India Research, Companies
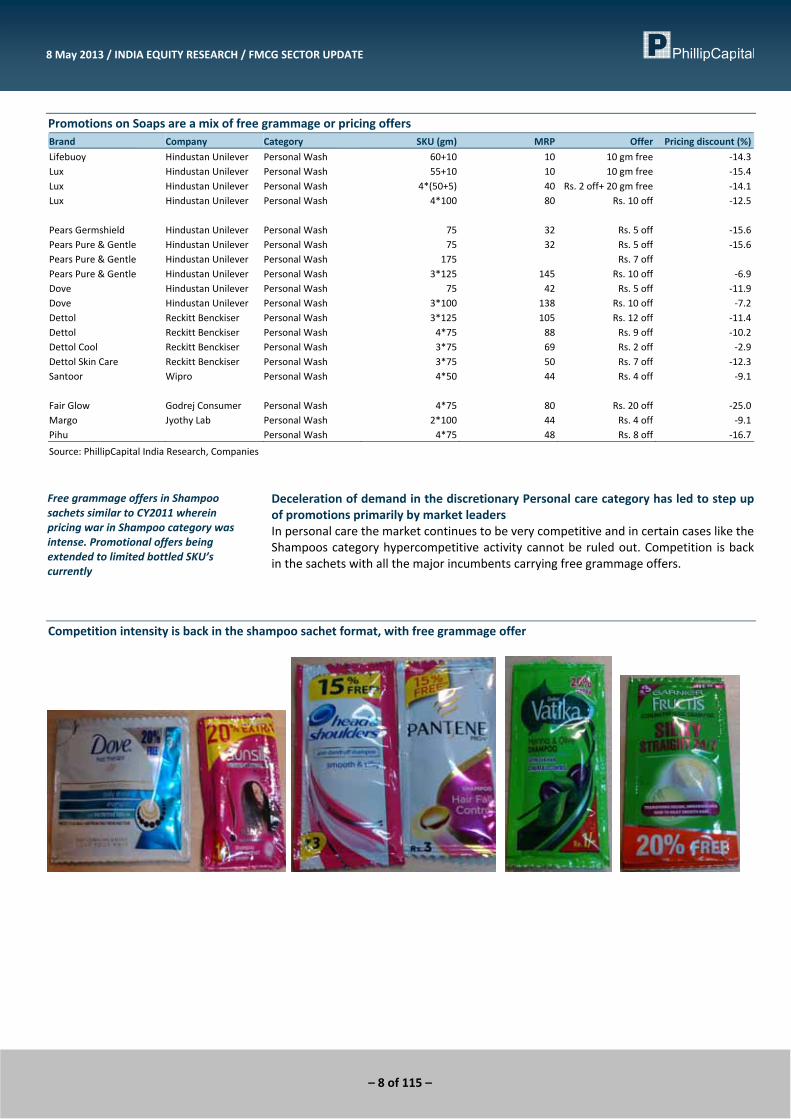
Deceleration of demand in the discretionary Personal care category has led to step up of promotions primarily by market leaders In personal care the market continues to be very competitive and in certain cases like the Shampoos category hypercompetitive activity cannot be ruled out. Competition is back in the sachets with all the major incumbents carrying free grammage offers.
Competition intensity is back in the shampoo sachet format, with free grammage offer
Free grammage offers in Shampoo sachets similar to CY2011 wherein pricing war in Shampoo category was intense. Promotional offers being extended to limited bottled SKU’s currently
– 9 of 115 –
8 May 2013 / INDIA EQUITY RESEARCH / FMCG SECTOR UPDATE
Promotional offers by way of free grammage in sachets and free products with bottled SKU’s make a comeback Brand Company Category SKU (gm) MRP Offer Pricing discount (%)
Dove Hindustan Unilever Shampoo 6.5+1.5 3 20% free ‐18.8Sunsilk Hindustan Unilever Shampoo 5+1 1 20% free ‐16.7Sunsilk Hindustan Unilever Shampoo 180+40 110 Rs. 56 worth conditioner free ‐33.7Head & Shoulders Procter & Gamble Shampoo 6.5+1 3 15% free ‐13.3Pantene Procter & Gamble Shampoo 6.5+1 3 15% free ‐13.3Vatika Dabur Shampoo 5+1 1 20% free ‐16.7Garnier Fructis L'oreal Shampoo 6.5+1.5 3 20% free ‐18.8Garnier Fructis 2 in 1 L'oreal Shampoo 180 + 90 189 Rs. 69 worth conditioner free ‐36.5Garnier Fructis Fall fight L'oreal Shampoo 375+180 340 Rs. 130 worth conditioner free ‐38.2Pantene Pro ‐ V Procter & Gamble Shampoo 340+75 273 Rs. 59 worth conditioner free ‐21.6
Source: PhillipCapital India Research, Companies
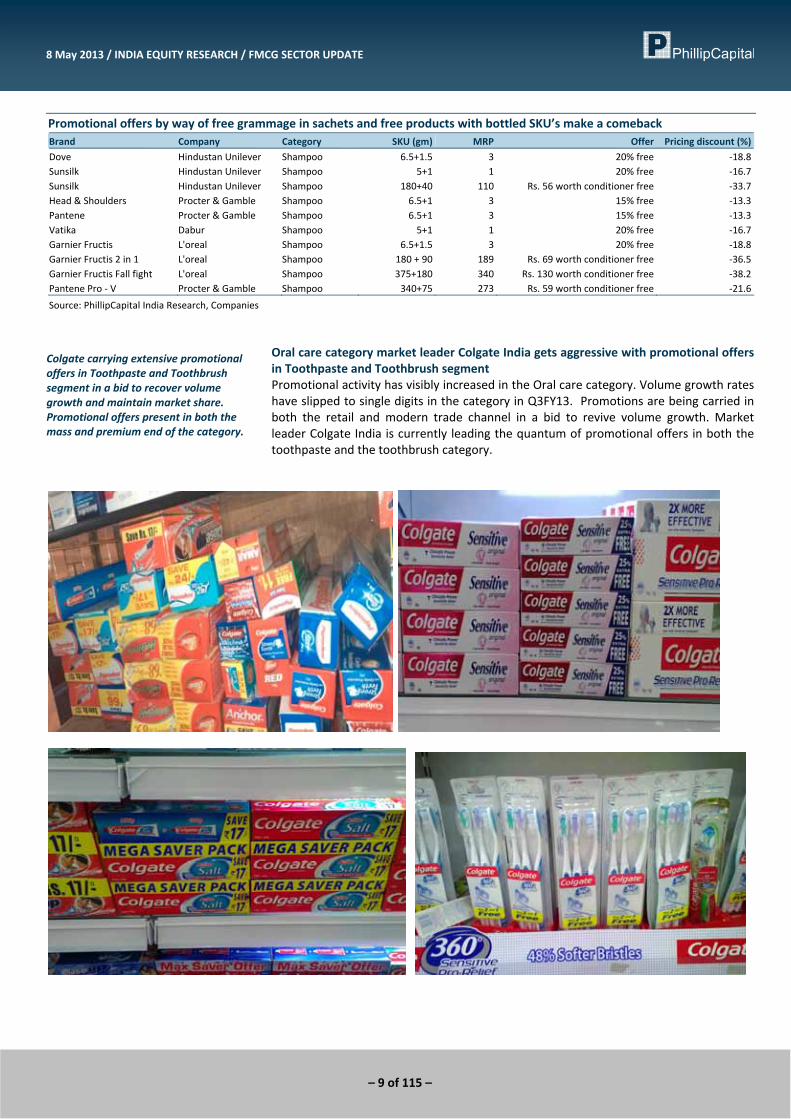
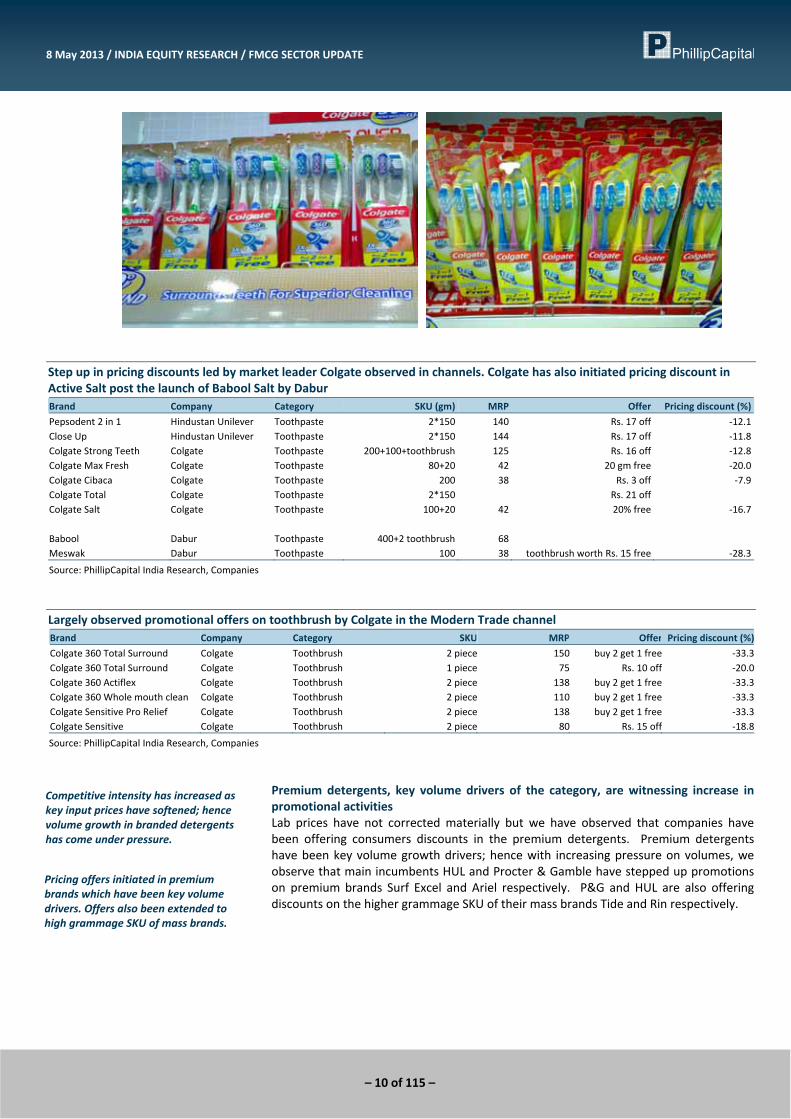
Oral care category market leader Colgate India gets aggressive with promotional offers in Toothpaste and Toothbrush segment Promotional activity has visibly increased in the Oral care category. Volume growth rates have slipped to single digits in the category in Q3FY13. Promotions are being carried in both the retail and modern trade channel in a bid to revive volume growth. Market leader Colgate India is currently leading the quantum of promotional offers in both the toothpaste and the toothbrush category.
Colgate carrying extensive promotional offers in Toothpaste and Toothbrush segment in a bid to recover volume growth and maintain market share. Promotional offers present in both the mass and premium end of the category.
– 10 of 115 –
8 May 2013 / INDIA EQUITY RESEARCH / FMCG SECTOR UPDATE
Step up in pricing discounts led by market leader Colgate observed in channels. Colgate has also initiated pricing discount in Active Salt post the launch of Babool Salt by Dabur Brand Company Category SKU (gm) MRP Offer Pricing discount (%)
Pepsodent 2 in 1 Hindustan Unilever Toothpaste 2*150 140 Rs. 17 off ‐12.1Close Up Hindustan Unilever Toothpaste 2*150 144 Rs. 17 off ‐11.8Colgate Strong Teeth Colgate Toothpaste 200+100+toothbrush 125 Rs. 16 off ‐12.8Colgate Max Fresh Colgate Toothpaste 80+20 42 20 gm free ‐20.0Colgate Cibaca Colgate Toothpaste 200 38 Rs. 3 off ‐7.9Colgate Total Colgate Toothpaste 2*150 Rs. 21 off Colgate Salt Colgate Toothpaste 100+20 42 20% free ‐16.7 Babool Dabur Toothpaste 400+2 toothbrush 68 Meswak Dabur Toothpaste 100 38 toothbrush worth Rs. 15 free ‐28.3
Source: PhillipCapital India Research, Companies
Largely observed promotional offers on toothbrush by Colgate in the Modern Trade channel Brand Company Category SKU MRP Offer Pricing discount (%)
Colgate 360 Total Surround Colgate Toothbrush 2 piece 150 buy 2 get 1 free ‐33.3Colgate 360 Total Surround Colgate Toothbrush 1 piece 75 Rs. 10 off ‐20.0Colgate 360 Actiflex Colgate Toothbrush 2 piece 138 buy 2 get 1 free ‐33.3Colgate 360 Whole mouth clean Colgate Toothbrush 2 piece 110 buy 2 get 1 free ‐33.3Colgate Sensitive Pro Relief Colgate Toothbrush 2 piece 138 buy 2 get 1 free ‐33.3Colgate Sensitive Colgate Toothbrush 2 piece 80 Rs. 15 off ‐18.8
Source: PhillipCapital India Research, Companies
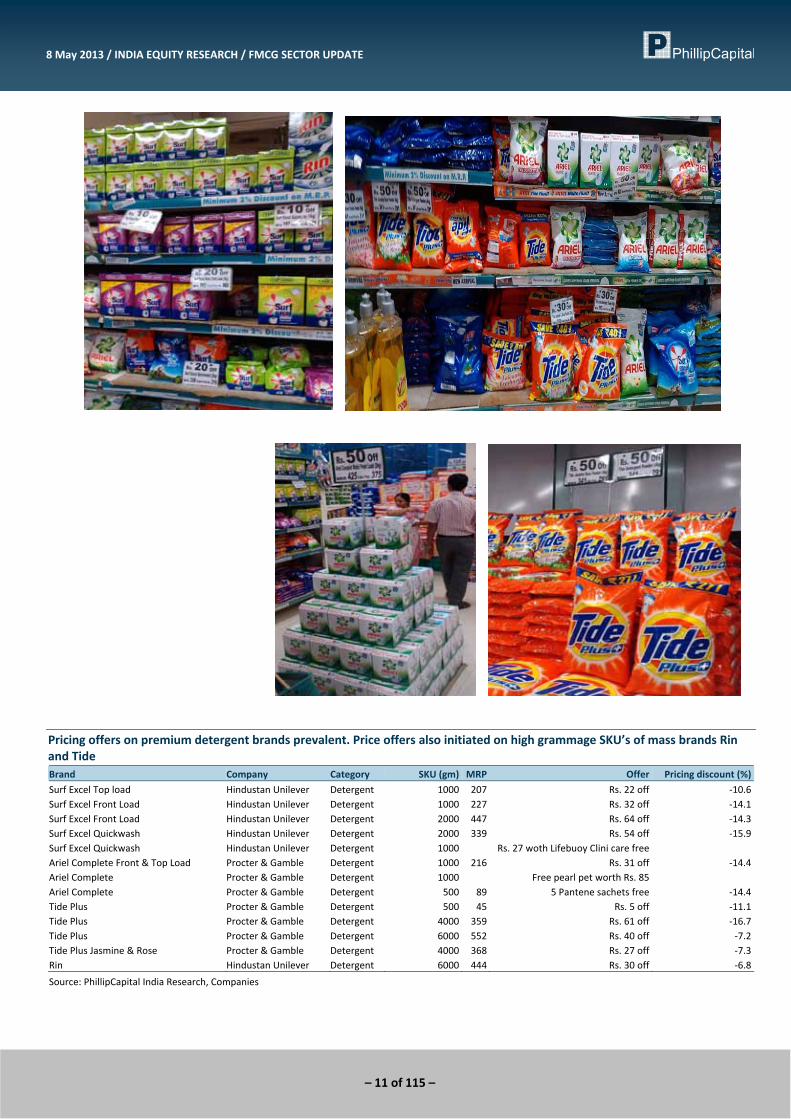
Premium detergents, key volume drivers of the category, are witnessing increase in promotional activities Lab prices have not corrected materially but we have observed that companies have been offering consumers discounts in the premium detergents. Premium detergents have been key volume growth drivers; hence with increasing pressure on volumes, we observe that main incumbents HUL and Procter & Gamble have stepped up promotions on premium brands Surf Excel and Ariel respectively. P&G and HUL are also offering discounts on the higher grammage SKU of their mass brands Tide and Rin respectively.
Competitive intensity has increased as key input prices have softened; hence volume growth in branded detergents has come under pressure.
Pricing offers initiated in premium brands which have been key volume drivers. Offers also been extended to high grammage SKU of mass brands.
– 11 of 115 –
8 May 2013 / INDIA EQUITY RESEARCH / FMCG SECTOR UPDATE
Pricing offers on premium detergent brands prevalent. Price offers also initiated on high grammage SKU’s of mass brands Rin and Tide Brand Company Category SKU (gm) MRP Offer Pricing discount (%)
Surf Excel Top load Hindustan Unilever Detergent 1000 207 Rs. 22 off ‐10.6Surf Excel Front Load Hindustan Unilever Detergent 1000 227 Rs. 32 off ‐14.1Surf Excel Front Load Hindustan Unilever Detergent 2000 447 Rs. 64 off ‐14.3Surf Excel Quickwash Hindustan Unilever Detergent 2000 339 Rs. 54 off ‐15.9Surf Excel Quickwash Hindustan Unilever Detergent 1000 Rs. 27 woth Lifebuoy Clini care free Ariel Complete Front & Top Load Procter & Gamble Detergent 1000 216 Rs. 31 off ‐14.4Ariel Complete Procter & Gamble Detergent 1000 Free pearl pet worth Rs. 85 Ariel Complete Procter & Gamble Detergent 500 89 5 Pantene sachets free ‐14.4Tide Plus Procter & Gamble Detergent 500 45 Rs. 5 off ‐11.1Tide Plus Procter & Gamble Detergent 4000 359 Rs. 61 off ‐16.7Tide Plus Procter & Gamble Detergent 6000 552 Rs. 40 off ‐7.2Tide Plus Jasmine & Rose Procter & Gamble Detergent 4000 368 Rs. 27 off ‐7.3Rin Hindustan Unilever Detergent 6000 444 Rs. 30 off ‐6.8
Source: PhillipCapital India Research, Companies
– 12 of 115 –
8 May 2013 / INDIA EQUITY RESEARCH / FMCG SECTOR UPDATE
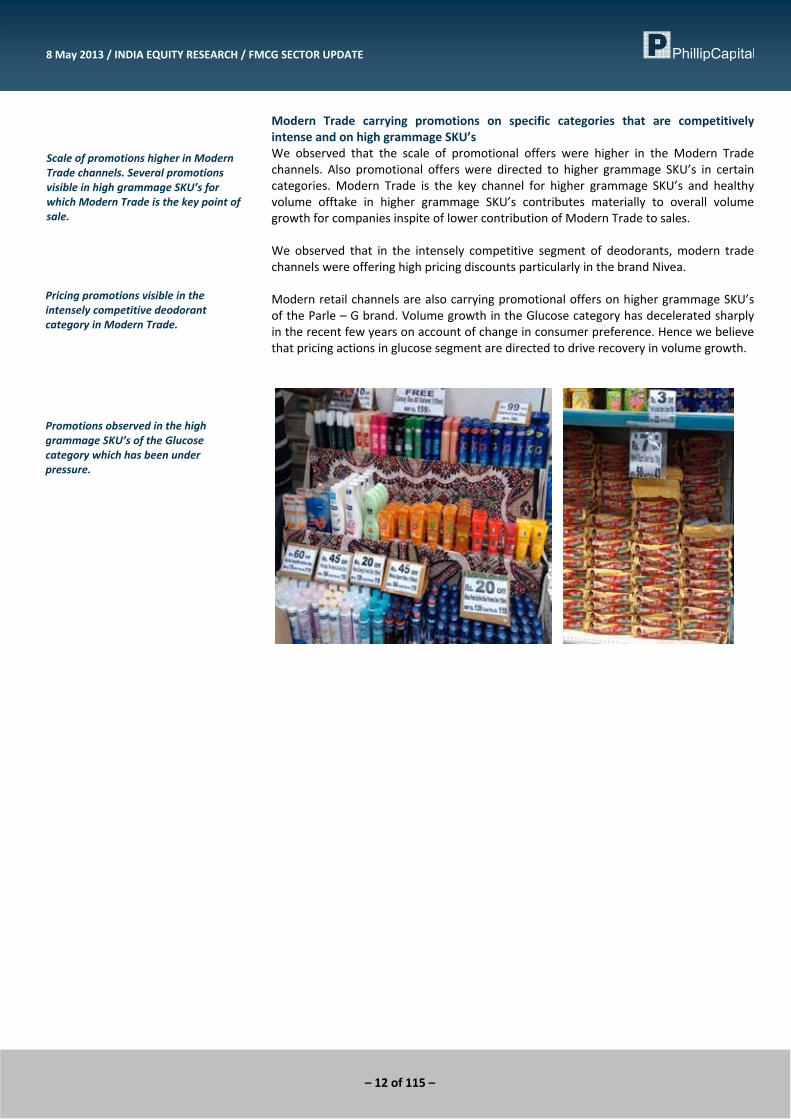
Modern Trade carrying promotions on specific categories that are competitively intense and on high grammage SKU’s We observed that the scale of promotional offers were higher in the Modern Trade channels. Also promotional offers were directed to higher grammage SKU’s in certain categories. Modern Trade is the key channel for higher grammage SKU’s and healthy volume offtake in higher grammage SKU’s contributes materially to overall volume growth for companies inspite of lower contribution of Modern Trade to sales. We observed that in the intensely competitive segment of deodorants, modern trade channels were offering high pricing discounts particularly in the brand Nivea. Modern retail channels are also carrying promotional offers on higher grammage SKU’s of the Parle – G brand. Volume growth in the Glucose category has decelerated sharply in the recent few years on account of change in consumer preference. Hence we believe that pricing actions in glucose segment are directed to drive recovery in volume growth.
Scale of promotions higher in Modern Trade channels. Several promotions visible in high grammage SKU’s for which Modern Trade is the key point of sale.
Pricing promotions visible in the intensely competitive deodorant category in Modern Trade.
Promotions observed in the high grammage SKU’s of the Glucose category which has been under pressure.
– 13 of 115 –
8 May 2013 / INDIA EQUITY RESEARCH / FMCG SECTOR UPDATE
Distributor Survey portends to tepid demand scenario We surveyed 30 distributors of the leading consumer companies across the country and noted similar responses by them. The following are the key responses: Deceleration in consumer demand continues in Q4FY13: Distributors indicated that demand scenario has continued to deteriorate Q4FY13. The volume growth rate has largely been similar on a sequential basis. Consumer demand is not expected to improve in the near term: The muted demand scenario is likely to persist for some more time and distributors do not expect any immediate recovery in demand. Sluggishness more pronounced in the discretionary categories: Demand in the discretionary category primarily Personal Care continues to be significantly weak and some distributors indicated that channel seems to be clogged with increase in inventory days in Q4FY13. Demand in urban markets remains muted: Distributors in smaller towns have indicated that stock from the larger urban markets are being channelized into Tier 2 and Tier 3 cities due to lack of demand in metro cities. This trend has primarily been observed in the Personal Care segment. Inability to meet year end sales targets: FMCG companies had sharply increased distributor sales targets in FY13 which were being successfully met during 9mFY13 as per our previous interactions. However in Q4FY13, certain distributors namely HUL have indicated that they have been unable to meet their monthly sales targets citing demand pressure. Competition from regional brands and unorganized players intensifies in specific categories: Distributors indicated that certain categories like Detergent and coconut hair oil are witnessing increase in competitive activity from regional and unorganized brands. This has led to deceleration in volume growth for the larger branded incumbents. Increase in promotional offers for consumers in the retail channel: As verified by our channel checks, distributors stated that companies have recently stepped up promotional offers for consumers namely HUL, Colgate, Marico and GCPL in specific categories, brands and SKU’s. Election year does not significantly alter the demand scenario: Distributors responded that they have not witnessed any specific pick up in demand primarily during periods of state or Lok Sabha elections. They shared that cash rollouts to voters are utilized for consumption of liquor, foods and white goods. Our channel checks largely substantiate our negative stance on the sector. On the ground consumer demand sluggishness is expected to persist. Recovery is estimated to be protracted in the forthcoming quarters as against current estimates of healthy uptick in volume growth in FY14E.
Post festive season in Q3FY13, consumer demand has decelerated in Q4FY13. Consumer demand is not expected to pick up pace in the near term
Demand in discretionary categories has been negatively impacted. Distributors have mentioned that inventory in channel has increased in Q4FY13
Demand in urban markets being muted as led to stock being dumped into Tier 1 and Tier 2 city markets.
Competition in the market has increased including local and regional players for categories like Detergents and coconut hair oil.
In H1FY13, distributors were able to meet the set aggressive sales targets. However they have been unable to do the same in Q4FY13.
In H1FY13, distributors were able to meet the set aggressive sales targets. However they have been unable to do the same in Q4FY13.
– 14 of 115 –
8 May 2013 / INDIA EQUITY RESEARCH / FMCG SECTOR UPDATE
Election year but very little to cheer about for the consumer companies Elections in India involve cash spending by the contesting political parties. The cash spending by the contesting parties is substantial. We estimate the total cash spending during the Loksabha (General Elections) and state elections to be in the range of ~Rs 350bn over the next 14 months. This amount of cash spending can seemingly spur consumption growth but the historical data shows limited impact on the branded consumer companies. We have tried to analyse the impact on consumer companies using statistical tools and qualitative analysis. The scheduled time frame for general Loksabha elections is May 2014 but certain political developments are indicating earlier elections and the time frame for which is likely to be October 2013. Thus it is fair to assume that FY14 is likely to see some or full impact of the general Loksabha elections. Apart from the Loksabha elections, the current fiscal year will be impacted by state elections. We note that that there are 7 state assembly elections over the next 15 months. Karnataka and Andhra Pradesh will be the biggest amongst the 7 states going into elections. The table below provides the summary of the election cash spending over the next 15 months. Estimated cash spending on elections over the next 15 months
Time period Elections Below Poverty line cash
outlay for election (Rs. Crore)General category cash
outlay for election (Rs. Crore)
Q2 CY2014 Lok Sabha 95,603 98,468 State Elections Q2 CY2013 ‐ Karnataka 16,007 28,257Q4 CY2013 ‐ Rajasthan 6,246 2,515Q4 CY2013 ‐ Chhattisgarh 5,440 889Q4 CY2013 ‐ Delhi 481 3,129Q4 CY2013 ‐ Madhya Pradesh 7,395 15,936Q2 CY2014 ‐ Andhra Pradesh 27,768 16,140Q2 CY2014 ‐ Orissa 6,109 2,924
Sum total 165,048 168,258 Total Spending 333,306 % proportion of total spends 49.5 50.5
Grand Total 333,306
Source: Election Commission of India (ECI), MOSPI, Centre for Media Studies, PhillipCapital India Research
Estimates
As the cash payout during elections varies across states and classes we initiated our analysis with collating data on state wise population breakup into below poverty line and general classes. Secondly, we gathered data on number of voters and voter turnout ratio for State Assembly elections and Lok Sabha election. Centre for media studies (Delhi) has published researched on proportion of state wise population receiving cash handouts based on classes with indicative data of cash payout per person per state. We have based our analysis on the similar research and derived our observations. Also state wise cash payout factor is defined by the degree of the close contest of the election and the critical contribution of the state to nationwide politics. Our cash payout assumptions take into account these factors.
Cash spending during elections is substantial. We expect cash outlay of ~Rs. 350 bn over the next 15 months on 7 state elections and the Lok Sabha elections
However statistical and qualitative analysis indicates that election cash spending has limited impact in spurring consumer demand primarily for branded consumer companies.
Probability of early Lok Sabha elections in Oct 2013 or if Lok Sabha elections are conducted as scheduled in May 2014, we expect FY14 to witness full or some impact of cash spending in the elections.
Cash payout differs across states and classes. Cash payout is a factor of closely contested elections and critical contribution of the state to nationwide politics.
– 15 of 115 –
8 May 2013 / INDIA EQUITY RESEARCH / FMCG SECTOR UPDATE
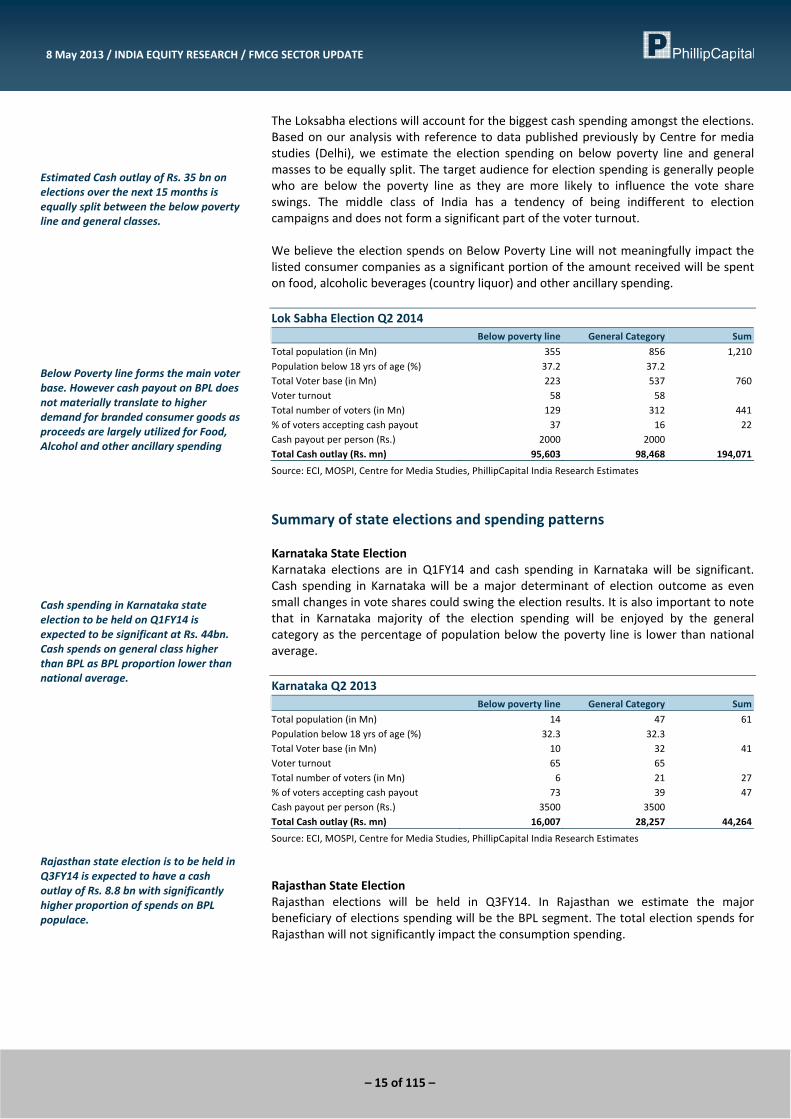
The Loksabha elections will account for the biggest cash spending amongst the elections. Based on our analysis with reference to data published previously by Centre for media studies (Delhi), we estimate the election spending on below poverty line and general masses to be equally split. The target audience for election spending is generally people who are below the poverty line as they are more likely to influence the vote share swings. The middle class of India has a tendency of being indifferent to election campaigns and does not form a significant part of the voter turnout. We believe the election spends on Below Poverty Line will not meaningfully impact the listed consumer companies as a significant portion of the amount received will be spent on food, alcoholic beverages (country liquor) and other ancillary spending. Lok Sabha Election Q2 2014 Below poverty line General Category Sum
Total population (in Mn) 355 856 1,210 Population below 18 yrs of age (%) 37.2 37.2Total Voter base (in Mn) 223 537 760 Voter turnout 58 58Total number of voters (in Mn) 129 312 441 % of voters accepting cash payout 37 16 22Cash payout per person (Rs.) 2000 2000Total Cash outlay (Rs. mn) 95,603 98,468 194,071
Source: ECI, MOSPI, Centre for Media Studies, PhillipCapital India Research Estimates
Summary of state elections and spending patterns Karnataka State Election Karnataka elections are in Q1FY14 and cash spending in Karnataka will be significant. Cash spending in Karnataka will be a major determinant of election outcome as even small changes in vote shares could swing the election results. It is also important to note that in Karnataka majority of the election spending will be enjoyed by the general category as the percentage of population below the poverty line is lower than national average. Karnataka Q2 2013 Below poverty line General Category Sum
Total population (in Mn) 14 47 61 Population below 18 yrs of age (%) 32.3 32.3Total Voter base (in Mn) 10 32 41 Voter turnout 65 65Total number of voters (in Mn) 6 21 27 % of voters accepting cash payout 73 39 47Cash payout per person (Rs.) 3500 3500Total Cash outlay (Rs. mn) 16,007 28,257 44,264
Source: ECI, MOSPI, Centre for Media Studies, PhillipCapital India Research Estimates
Rajasthan State Election Rajasthan elections will be held in Q3FY14. In Rajasthan we estimate the major beneficiary of elections spending will be the BPL segment. The total election spends for Rajasthan will not significantly impact the consumption spending.
Estimated Cash outlay of Rs. 35 bn on elections over the next 15 months is equally split between the below poverty line and general classes.
Below Poverty line forms the main voter base. However cash payout on BPL does not materially translate to higher demand for branded consumer goods as proceeds are largely utilized for Food, Alcohol and other ancillary spending
Cash spending in Karnataka state election to be held on Q1FY14 is expected to be significant at Rs. 44bn. Cash spends on general class higher than BPL as BPL proportion lower than national average.
Rajasthan state election is to be held in Q3FY14 is expected to have a cash outlay of Rs. 8.8 bn with significantly higher proportion of spends on BPL populace.
– 16 of 115 –
8 May 2013 / INDIA EQUITY RESEARCH / FMCG SECTOR UPDATE
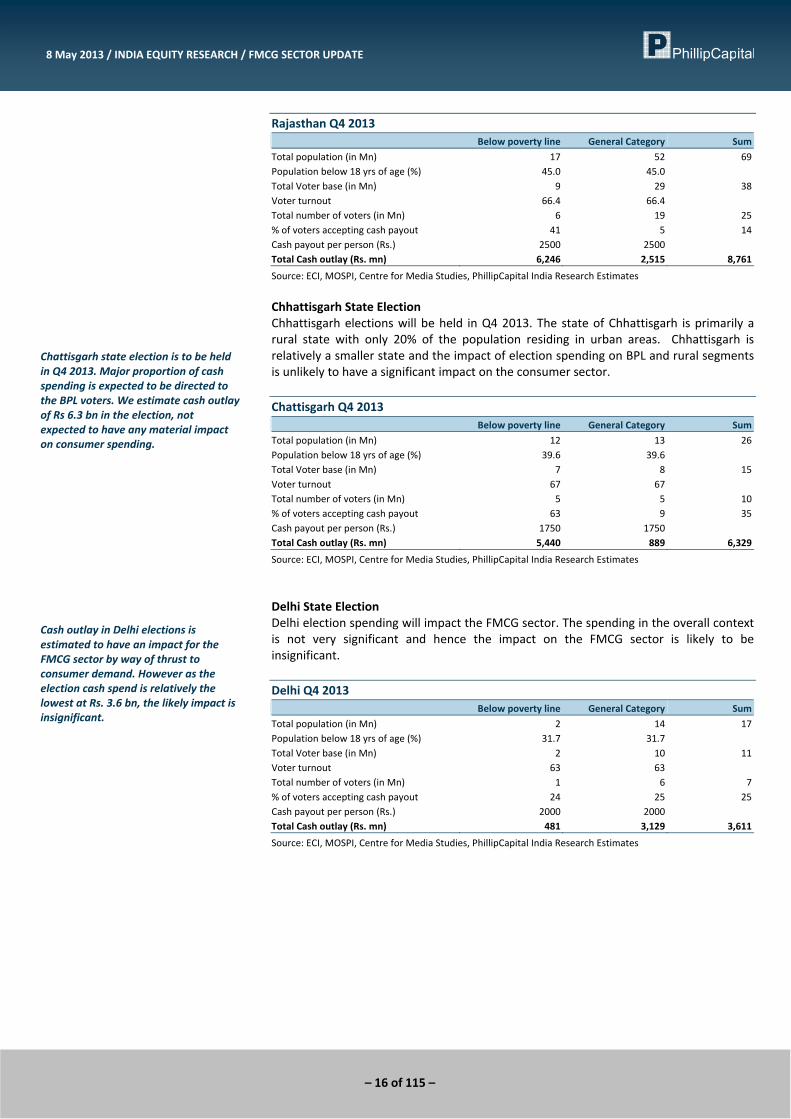
Rajasthan Q4 2013 Below poverty line General Category Sum
Total population (in Mn) 17 52 69 Population below 18 yrs of age (%) 45.0 45.0Total Voter base (in Mn) 9 29 38 Voter turnout 66.4 66.4Total number of voters (in Mn) 6 19 25 % of voters accepting cash payout 41 5 14Cash payout per person (Rs.) 2500 2500Total Cash outlay (Rs. mn) 6,246 2,515 8,761
Source: ECI, MOSPI, Centre for Media Studies, PhillipCapital India Research Estimates
Chhattisgarh State Election Chhattisgarh elections will be held in Q4 2013. The state of Chhattisgarh is primarily a rural state with only 20% of the population residing in urban areas. Chhattisgarh is relatively a smaller state and the impact of election spending on BPL and rural segments is unlikely to have a significant impact on the consumer sector. Chattisgarh Q4 2013 Below poverty line General Category Sum
Total population (in Mn) 12 13 26 Population below 18 yrs of age (%) 39.6 39.6Total Voter base (in Mn) 7 8 15 Voter turnout 67 67Total number of voters (in Mn) 5 5 10 % of voters accepting cash payout 63 9 35Cash payout per person (Rs.) 1750 1750Total Cash outlay (Rs. mn) 5,440 889 6,329
Source: ECI, MOSPI, Centre for Media Studies, PhillipCapital India Research Estimates
Delhi State Election Delhi election spending will impact the FMCG sector. The spending in the overall context is not very significant and hence the impact on the FMCG sector is likely to be insignificant. Delhi Q4 2013 Below poverty line General Category Sum
Total population (in Mn) 2 14 17 Population below 18 yrs of age (%) 31.7 31.7Total Voter base (in Mn) 2 10 11 Voter turnout 63 63Total number of voters (in Mn) 1 6 7% of voters accepting cash payout 24 25 25Cash payout per person (Rs.) 2000 2000Total Cash outlay (Rs. mn) 481 3,129 3,611
Source: ECI, MOSPI, Centre for Media Studies, PhillipCapital India Research Estimates
Chattisgarh state election is to be held in Q4 2013. Major proportion of cash spending is expected to be directed to the BPL voters. We estimate cash outlay of Rs 6.3 bn in the election, not expected to have any material impact on consumer spending.
Cash outlay in Delhi elections is estimated to have an impact for the FMCG sector by way of thrust to consumer demand. However as the election cash spend is relatively the lowest at Rs. 3.6 bn, the likely impact is insignificant.
– 17 of 115 –
8 May 2013 / INDIA EQUITY RESEARCH / FMCG SECTOR UPDATE
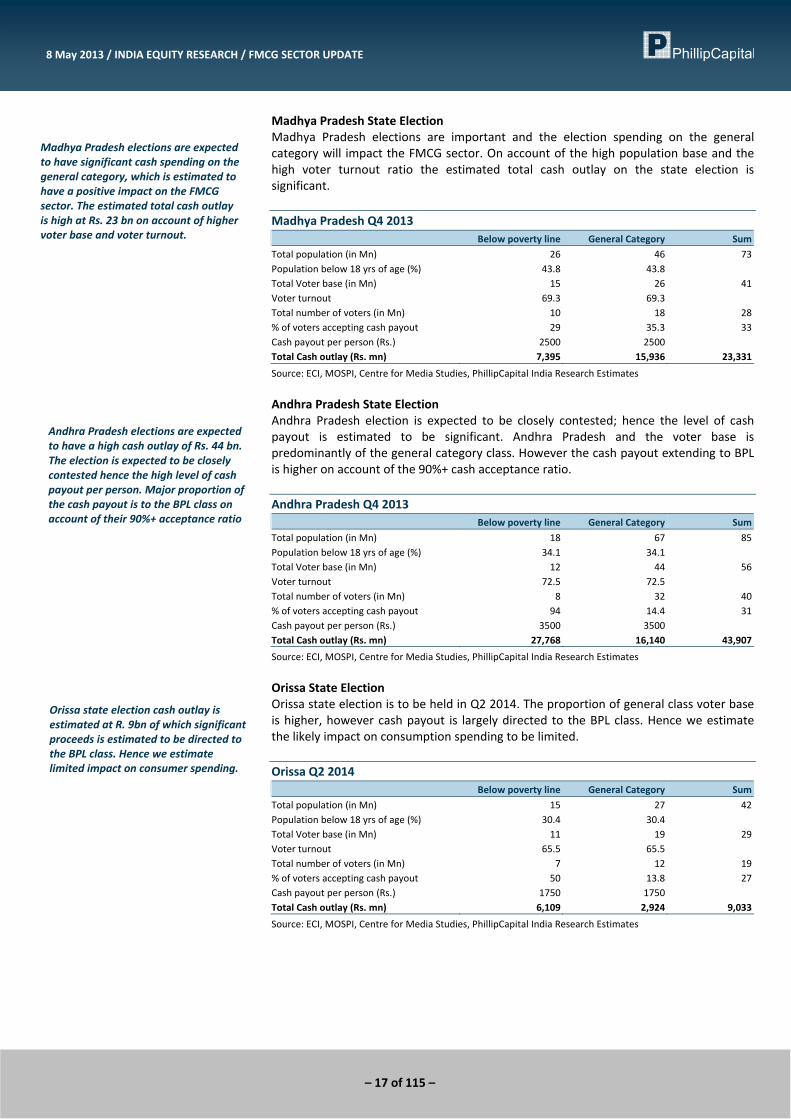
Madhya Pradesh State Election Madhya Pradesh elections are important and the election spending on the general category will impact the FMCG sector. On account of the high population base and the high voter turnout ratio the estimated total cash outlay on the state election is significant. Madhya Pradesh Q4 2013 Below poverty line General Category Sum
Total population (in Mn) 26 46 73 Population below 18 yrs of age (%) 43.8 43.8Total Voter base (in Mn) 15 26 41 Voter turnout 69.3 69.3Total number of voters (in Mn) 10 18 28 % of voters accepting cash payout 29 35.3 33Cash payout per person (Rs.) 2500 2500Total Cash outlay (Rs. mn) 7,395 15,936 23,331
Source: ECI, MOSPI, Centre for Media Studies, PhillipCapital India Research Estimates
Andhra Pradesh State Election Andhra Pradesh election is expected to be closely contested; hence the level of cash payout is estimated to be significant. Andhra Pradesh and the voter base is predominantly of the general category class. However the cash payout extending to BPL is higher on account of the 90%+ cash acceptance ratio. Andhra Pradesh Q4 2013 Below poverty line General Category Sum
Total population (in Mn) 18 67 85 Population below 18 yrs of age (%) 34.1 34.1Total Voter base (in Mn) 12 44 56 Voter turnout 72.5 72.5Total number of voters (in Mn) 8 32 40 % of voters accepting cash payout 94 14.4 31Cash payout per person (Rs.) 3500 3500Total Cash outlay (Rs. mn) 27,768 16,140 43,907
Source: ECI, MOSPI, Centre for Media Studies, PhillipCapital India Research Estimates
Orissa State Election Orissa state election is to be held in Q2 2014. The proportion of general class voter base is higher, however cash payout is largely directed to the BPL class. Hence we estimate the likely impact on consumption spending to be limited. Orissa Q2 2014 Below poverty line General Category Sum
Total population (in Mn) 15 27 42 Population below 18 yrs of age (%) 30.4 30.4Total Voter base (in Mn) 11 19 29 Voter turnout 65.5 65.5Total number of voters (in Mn) 7 12 19 % of voters accepting cash payout 50 13.8 27Cash payout per person (Rs.) 1750 1750Total Cash outlay (Rs. mn) 6,109 2,924 9,033
Source: ECI, MOSPI, Centre for Media Studies, PhillipCapital India Research Estimates
Madhya Pradesh elections are expected to have significant cash spending on the general category, which is estimated to have a positive impact on the FMCG sector. The estimated total cash outlay is high at Rs. 23 bn on account of higher voter base and voter turnout.
Andhra Pradesh elections are expected to have a high cash outlay of Rs. 44 bn. The election is expected to be closely contested hence the high level of cash payout per person. Major proportion of the cash payout is to the BPL class on account of their 90%+ acceptance ratio
Orissa state election cash outlay is estimated at R. 9bn of which significant proceeds is estimated to be directed to the BPL class. Hence we estimate limited impact on consumer spending.
– 18 of 115 –
8 May 2013 / INDIA EQUITY RESEARCH / FMCG SECTOR UPDATE
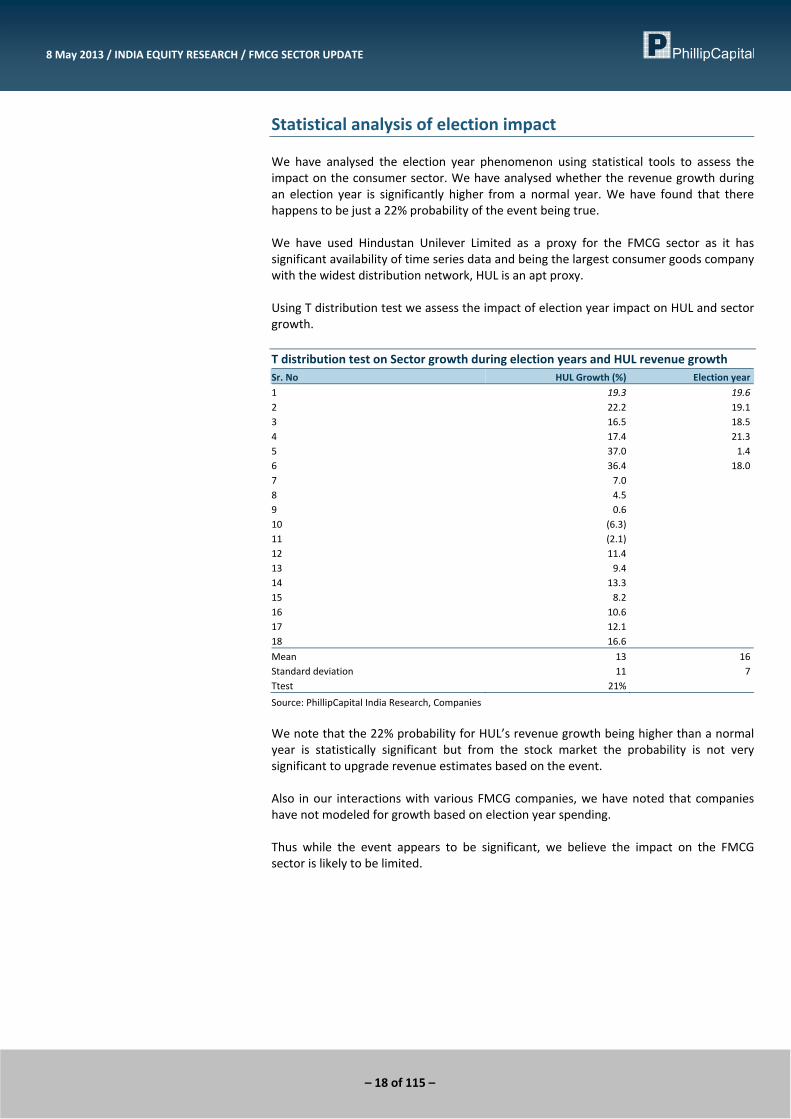
Statistical analysis of election impact We have analysed the election year phenomenon using statistical tools to assess the impact on the consumer sector. We have analysed whether the revenue growth during an election year is significantly higher from a normal year. We have found that there happens to be just a 22% probability of the event being true. We have used Hindustan Unilever Limited as a proxy for the FMCG sector as it has significant availability of time series data and being the largest consumer goods company with the widest distribution network, HUL is an apt proxy. Using T distribution test we assess the impact of election year impact on HUL and sector growth. T distribution test on Sector growth during election years and HUL revenue growth Sr. No HUL Growth (%) Election year
1 19.3 19.6 2 22.2 19.1 3 16.5 18.5 4 17.4 21.3 5 37.0 1.4 6 36.4 18.0 7 7.0 8 4.5 9 0.6 10 (6.3) 11 (2.1) 12 11.4 13 9.4 14 13.3 15 8.2 16 10.6 17 12.1 18 16.6
Mean 13 16 Standard deviation 11 7 Ttest 21%
Source: PhillipCapital India Research, Companies
We note that the 22% probability for HUL’s revenue growth being higher than a normal year is statistically significant but from the stock market the probability is not very significant to upgrade revenue estimates based on the event. Also in our interactions with various FMCG companies, we have noted that companies have not modeled for growth based on election year spending. Thus while the event appears to be significant, we believe the impact on the FMCG sector is likely to be limited.
– 19 of 115 –
8 May 2013 / INDIA EQUITY RESEARCH / FMCG SECTOR UPDATE
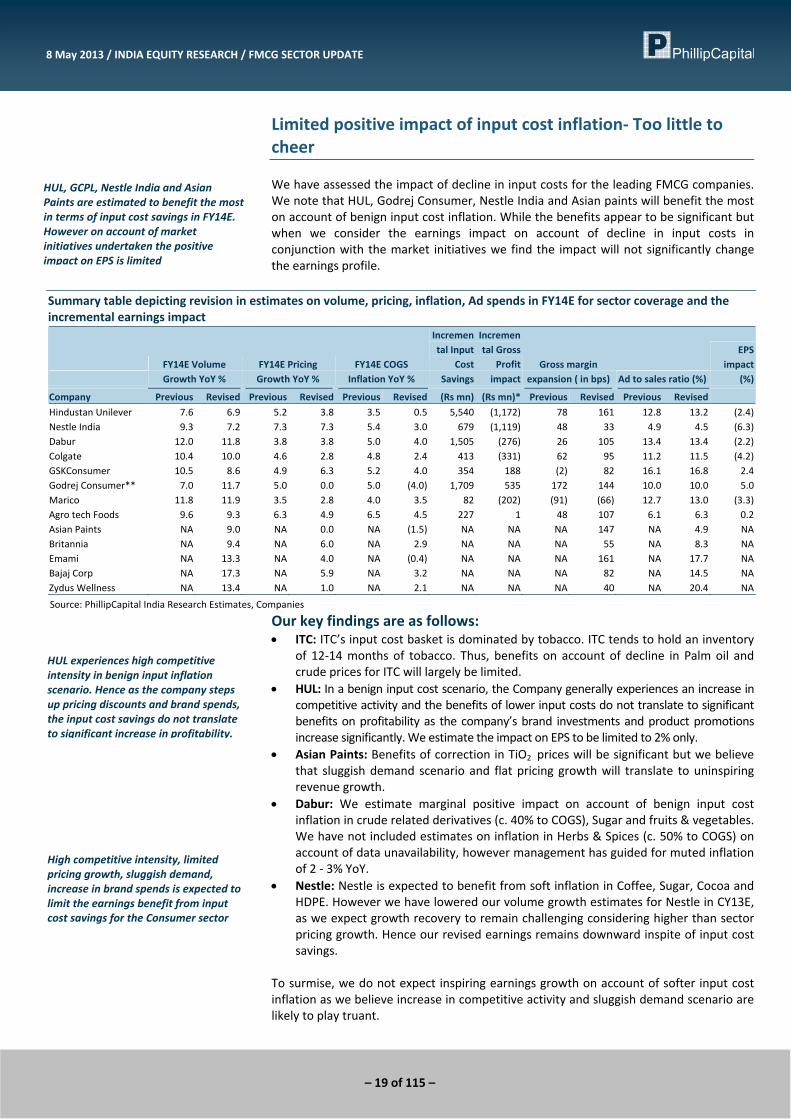
Limited positive impact of input cost inflation‐ Too little to cheer We have assessed the impact of decline in input costs for the leading FMCG companies. We note that HUL, Godrej Consumer, Nestle India and Asian paints will benefit the most on account of benign input cost inflation. While the benefits appear to be significant but when we consider the earnings impact on account of decline in input costs in conjunction with the market initiatives we find the impact will not significantly change the earnings profile.
Summary table depicting revision in estimates on volume, pricing, inflation, Ad spends in FY14E for sector coverage and the incremental earnings impact
FY14E Volume Growth YoY %
FY14E Pricing Growth YoY %
FY14E COGS Inflation YoY %
Incremental Input
Cost Savings
Incremental Gross
Profit impact
Gross margin expansion ( in bps) Ad to sales ratio (%)
EPS impact
(%) Company Previous Revised Previous Revised Previous Revised (Rs mn) (Rs mn)* Previous Revised Previous Revised
Hindustan Unilever 7.6 6.9 5.2 3.8 3.5 0.5 5,540 (1,172) 78 161 12.8 13.2 (2.4)Nestle India 9.3 7.2 7.3 7.3 5.4 3.0 679 (1,119) 48 33 4.9 4.5 (6.3)Dabur 12.0 11.8 3.8 3.8 5.0 4.0 1,505 (276) 26 105 13.4 13.4 (2.2)Colgate 10.4 10.0 4.6 2.8 4.8 2.4 413 (331) 62 95 11.2 11.5 (4.2)GSKConsumer 10.5 8.6 4.9 6.3 5.2 4.0 354 188 (2) 82 16.1 16.8 2.4Godrej Consumer** 7.0 11.7 5.0 0.0 5.0 (4.0) 1,709 535 172 144 10.0 10.0 5.0Marico 11.8 11.9 3.5 2.8 4.0 3.5 82 (202) (91) (66) 12.7 13.0 (3.3)Agro tech Foods 9.6 9.3 6.3 4.9 6.5 4.5 227 1 48 107 6.1 6.3 0.2Asian Paints NA 9.0 NA 0.0 NA (1.5) NA NA NA 147 NA 4.9 NABritannia NA 9.4 NA 6.0 NA 2.9 NA NA NA 55 NA 8.3 NAEmami NA 13.3 NA 4.0 NA (0.4) NA NA NA 161 NA 17.7 NABajaj Corp NA 17.3 NA 5.9 NA 3.2 NA NA NA 82 NA 14.5 NAZydus Wellness NA 13.4 NA 1.0 NA 2.1 NA NA NA 40 NA 20.4 NA
Source: PhillipCapital India Research Estimates, Companies
Our key findings are as follows: • ITC: ITC’s input cost basket is dominated by tobacco. ITC tends to hold an inventory
of 12‐14 months of tobacco. Thus, benefits on account of decline in Palm oil and crude prices for ITC will largely be limited.
• HUL: In a benign input cost scenario, the Company generally experiences an increase in competitive activity and the benefits of lower input costs do not translate to significant benefits on profitability as the company’s brand investments and product promotions increase significantly. We estimate the impact on EPS to be limited to 2% only.
• Asian Paints: Benefits of correction in TiO2 prices will be significant but we believe that sluggish demand scenario and flat pricing growth will translate to uninspiring revenue growth.
• Dabur: We estimate marginal positive impact on account of benign input cost inflation in crude related derivatives (c. 40% to COGS), Sugar and fruits & vegetables. We have not included estimates on inflation in Herbs & Spices (c. 50% to COGS) on account of data unavailability, however management has guided for muted inflation of 2 ‐ 3% YoY.
• Nestle: Nestle is expected to benefit from soft inflation in Coffee, Sugar, Cocoa and HDPE. However we have lowered our volume growth estimates for Nestle in CY13E, as we expect growth recovery to remain challenging considering higher than sector pricing growth. Hence our revised earnings remains downward inspite of input cost savings.
To surmise, we do not expect inspiring earnings growth on account of softer input cost inflation as we believe increase in competitive activity and sluggish demand scenario are likely to play truant.
HUL, GCPL, Nestle India and Asian Paints are estimated to benefit the most in terms of input cost savings in FY14E. However on account of market initiatives undertaken the positive impact on EPS is limited
HUL experiences high competitive intensity in benign input inflation scenario. Hence as the company steps up pricing discounts and brand spends, the input cost savings do not translate to significant increase in profitability.
High competitive intensity, limited pricing growth, sluggish demand, increase in brand spends is expected to limit the earnings benefit from input cost savings for the Consumer sector
– 20 of 115 –
8 May 2013 / INDIA EQUITY RESEARCH / FMCG SECTOR UPDATE
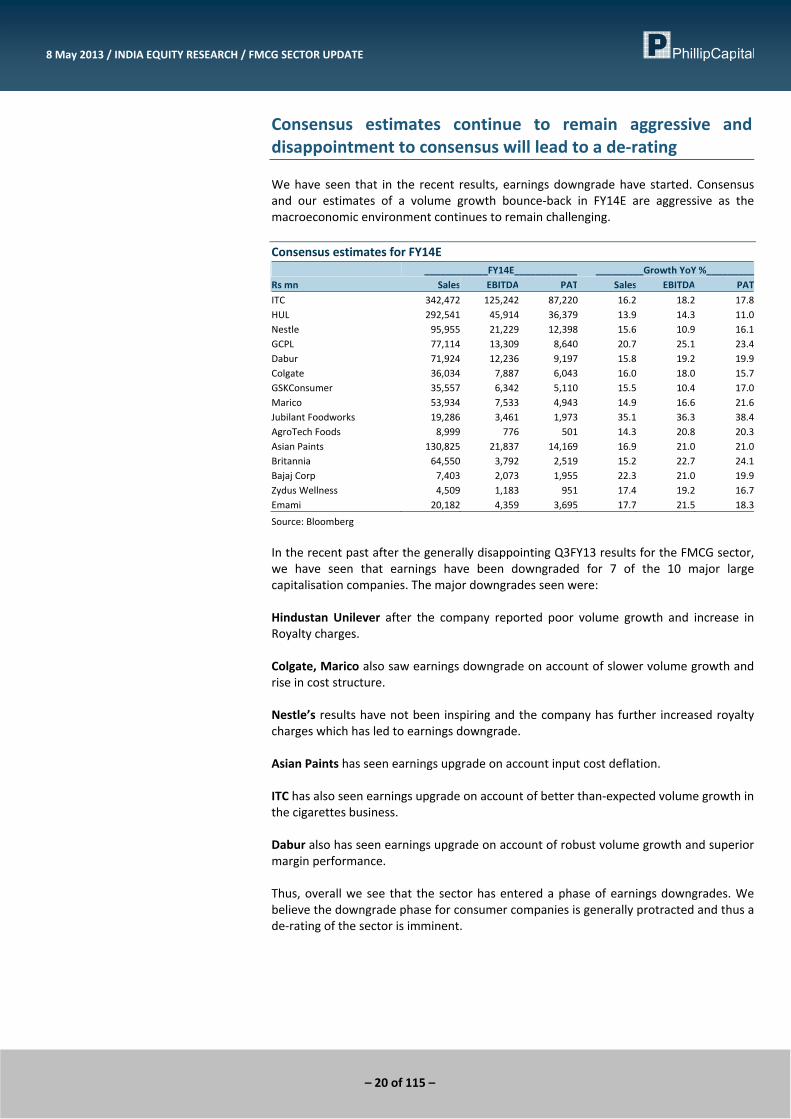
Consensus estimates continue to remain aggressive and disappointment to consensus will lead to a de‐rating We have seen that in the recent results, earnings downgrade have started. Consensus and our estimates of a volume growth bounce‐back in FY14E are aggressive as the macroeconomic environment continues to remain challenging. Consensus estimates for FY14E ____________FY14E____________ _________Growth YoY %_________Rs mn Sales EBITDA PAT Sales EBITDA PAT
ITC 342,472 125,242 87,220 16.2 18.2 17.8HUL 292,541 45,914 36,379 13.9 14.3 11.0Nestle 95,955 21,229 12,398 15.6 10.9 16.1GCPL 77,114 13,309 8,640 20.7 25.1 23.4Dabur 71,924 12,236 9,197 15.8 19.2 19.9Colgate 36,034 7,887 6,043 16.0 18.0 15.7GSKConsumer 35,557 6,342 5,110 15.5 10.4 17.0Marico 53,934 7,533 4,943 14.9 16.6 21.6Jubilant Foodworks 19,286 3,461 1,973 35.1 36.3 38.4AgroTech Foods 8,999 776 501 14.3 20.8 20.3Asian Paints 130,825 21,837 14,169 16.9 21.0 21.0Britannia 64,550 3,792 2,519 15.2 22.7 24.1Bajaj Corp 7,403 2,073 1,955 22.3 21.0 19.9Zydus Wellness 4,509 1,183 951 17.4 19.2 16.7Emami 20,182 4,359 3,695 17.7 21.5 18.3
Source: Bloomberg
In the recent past after the generally disappointing Q3FY13 results for the FMCG sector, we have seen that earnings have been downgraded for 7 of the 10 major large capitalisation companies. The major downgrades seen were: Hindustan Unilever after the company reported poor volume growth and increase in Royalty charges. Colgate, Marico also saw earnings downgrade on account of slower volume growth and rise in cost structure. Nestle’s results have not been inspiring and the company has further increased royalty charges which has led to earnings downgrade. Asian Paints has seen earnings upgrade on account input cost deflation. ITC has also seen earnings upgrade on account of better than‐expected volume growth in the cigarettes business. Dabur also has seen earnings upgrade on account of robust volume growth and superior margin performance. Thus, overall we see that the sector has entered a phase of earnings downgrades. We believe the downgrade phase for consumer companies is generally protracted and thus a de‐rating of the sector is imminent.
– 21 of 115 –
8 May 2013 / INDIA EQUITY RESEARCH / FMCG SECTOR UPDATE
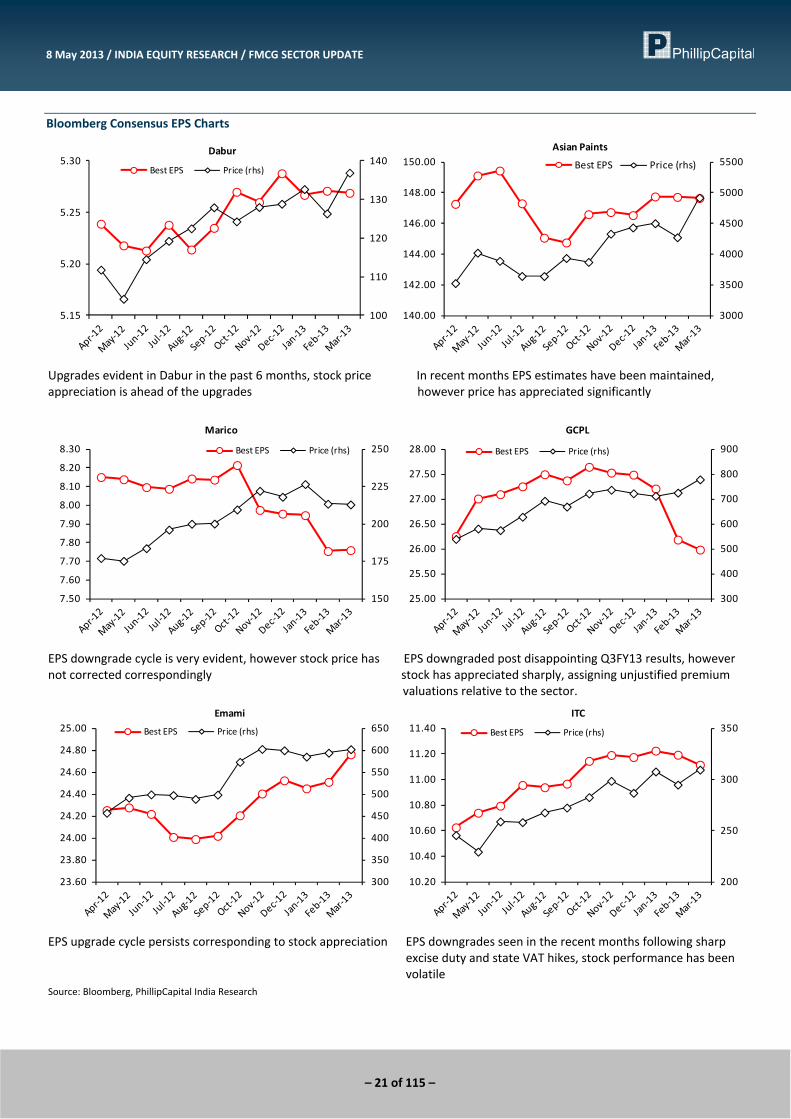
Bloomberg Consensus EPS Charts
100
110
120
130
140
5.15
5.20
5.25
5.30Dabur
Best EPS Price (rhs)
3000
3500
4000
4500
5000
5500
140.00
142.00
144.00
146.00
148.00
150.00Asian Paints
Best EPS Price (rhs)
Upgrades evident in Dabur in the past 6 months, stock price In recent months EPS estimates have been maintained, appreciation is ahead of the upgrades however price has appreciated significantly
150
175
200
225
250
7.50
7.60
7.70
7.80
7.90
8.00
8.10
8.20
8.30
Marico
Best EPS Price (rhs)
300
400
500
600
700
800
900
25.00
25.50
26.00
26.50
27.00
27.50
28.00
GCPL
Best EPS Price (rhs)
EPS downgrade cycle is very evident, however stock price has EPS downgraded post disappointing Q3FY13 results, however not corrected correspondingly stock has appreciated sharply, assigning unjustified premium valuations relative to the sector.
300
350
400
450
500
550
600
650
23.60
23.80
24.00
24.20
24.40
24.60
24.80
25.00Emami
Best EPS Price (rhs)
200
250
300
350
10.20
10.40
10.60
10.80
11.00
11.20
11.40ITC
Best EPS Price (rhs)
EPS upgrade cycle persists corresponding to stock appreciation EPS downgrades seen in the recent months following sharp excise duty and state VAT hikes, stock performance has been volatile Source: Bloomberg, PhillipCapital India Research
– 22 of 115 –
8 May 2013 / INDIA EQUITY RESEARCH / FMCG SECTOR UPDATE
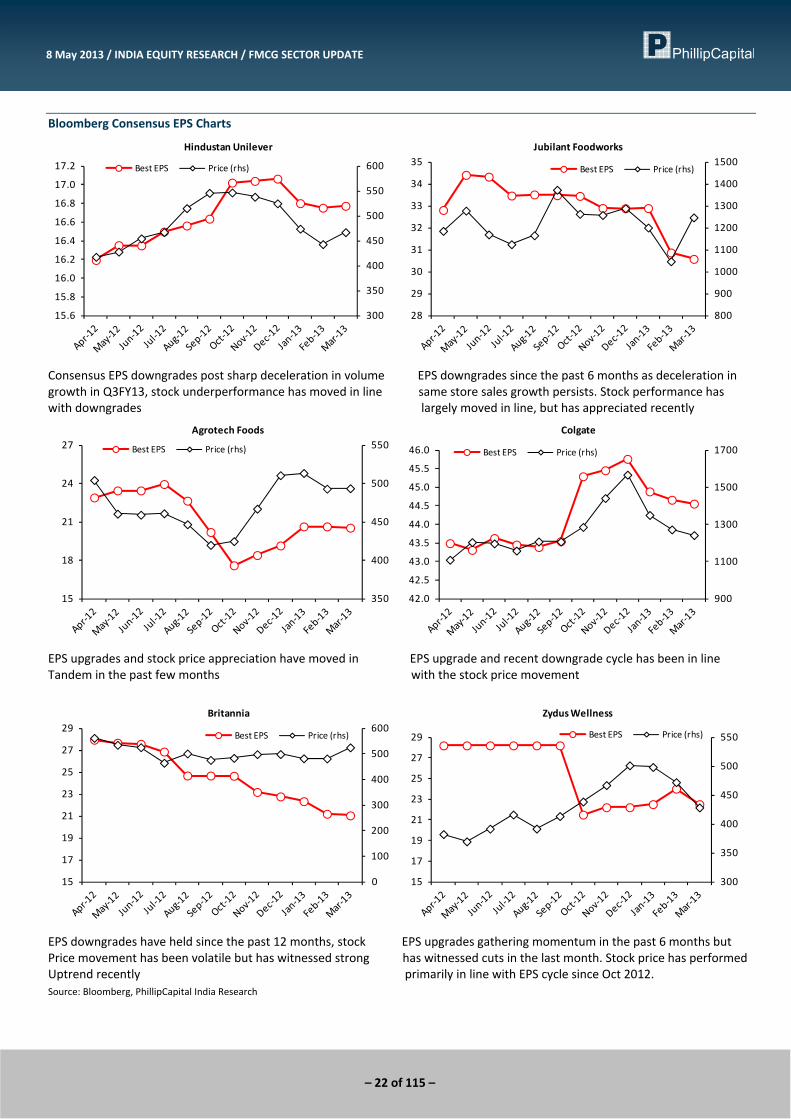
Bloomberg Consensus EPS Charts
300
350
400
450
500
550
600
15.6
15.8
16.0
16.2
16.4
16.6
16.8
17.0
17.2
Hindustan Unilever
Best EPS Price (rhs)
800
900
1000
1100
1200
1300
1400
1500
28
29
30
31
32
33
34
35Jubilant Foodworks
Best EPS Price (rhs)
Consensus EPS downgrades post sharp deceleration in volume EPS downgrades since the past 6 months as deceleration in growth in Q3FY13, stock underperformance has moved in line same store sales growth persists. Stock performance has with downgrades largely moved in line, but has appreciated recently
350
400
450
500
550
15
18
21
24
27Agrotech Foods
Best EPS Price (rhs)
900
1100
1300
1500
1700
42.0
42.5
43.0
43.5
44.0
44.5
45.0
45.5
46.0
Colgate
Best EPS Price (rhs)
EPS upgrades and stock price appreciation have moved in EPS upgrade and recent downgrade cycle has been in line Tandem in the past few months with the stock price movement
0
100
200
300
400
500
600
15
17
19
21
23
25
27
29Britannia
Best EPS Price (rhs)
300
350
400
450
500
550
15
17
19
21
23
25
27
29
Zydus Wellness
Best EPS Price (rhs)
EPS downgrades have held since the past 12 months, stock EPS upgrades gathering momentum in the past 6 months but Price movement has been volatile but has witnessed strong has witnessed cuts in the last month. Stock price has performed Uptrend recently primarily in line with EPS cycle since Oct 2012. Source: Bloomberg, PhillipCapital India Research
– 23 of 115 –
8 May 2013 / INDIA EQUITY RESEARCH / FMCG SECTOR UPDATE
Bloomberg Consensus EPS Charts
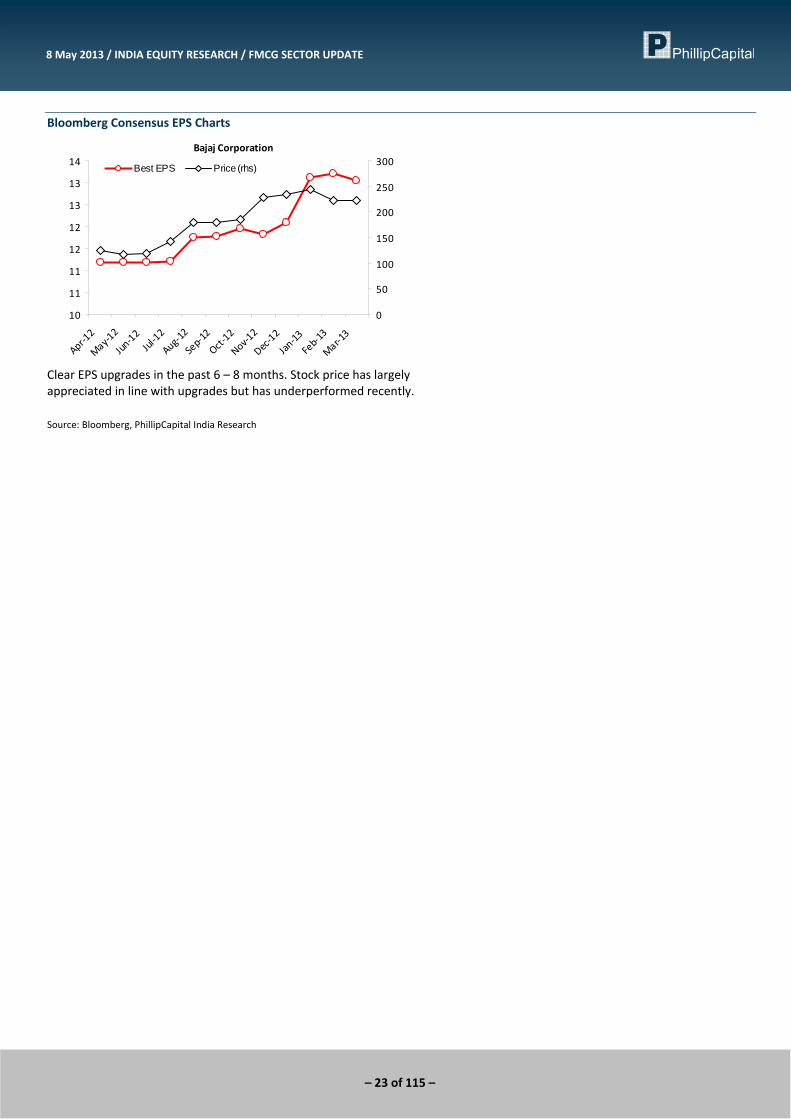
Bajaj Corporation
10
11
11
12
12
13
13
14
Apr‐12
May‐12
Jun‐12
Jul‐12
Aug‐12
Sep‐12
Oct‐12
Nov‐12
Dec‐12
Jan‐13
Feb‐13
Mar‐13
0
50
100
150
200
250
300Best EPS Price (rhs)
Clear EPS upgrades in the past 6 – 8 months. Stock price has largely appreciated in line with upgrades but has underperformed recently. Source: Bloomberg, PhillipCapital India Research

– 24 of 115 –
8 May 2013 / INDIA EQUITY RESEARCH / FMCG SECTOR UPDATE
Compa
nies Section
– 25 of 115 –
ITC Risks getting amplified
FMCG: Company Update 8 May 2013
PhillipCapital (India) Pvt. Ltd.
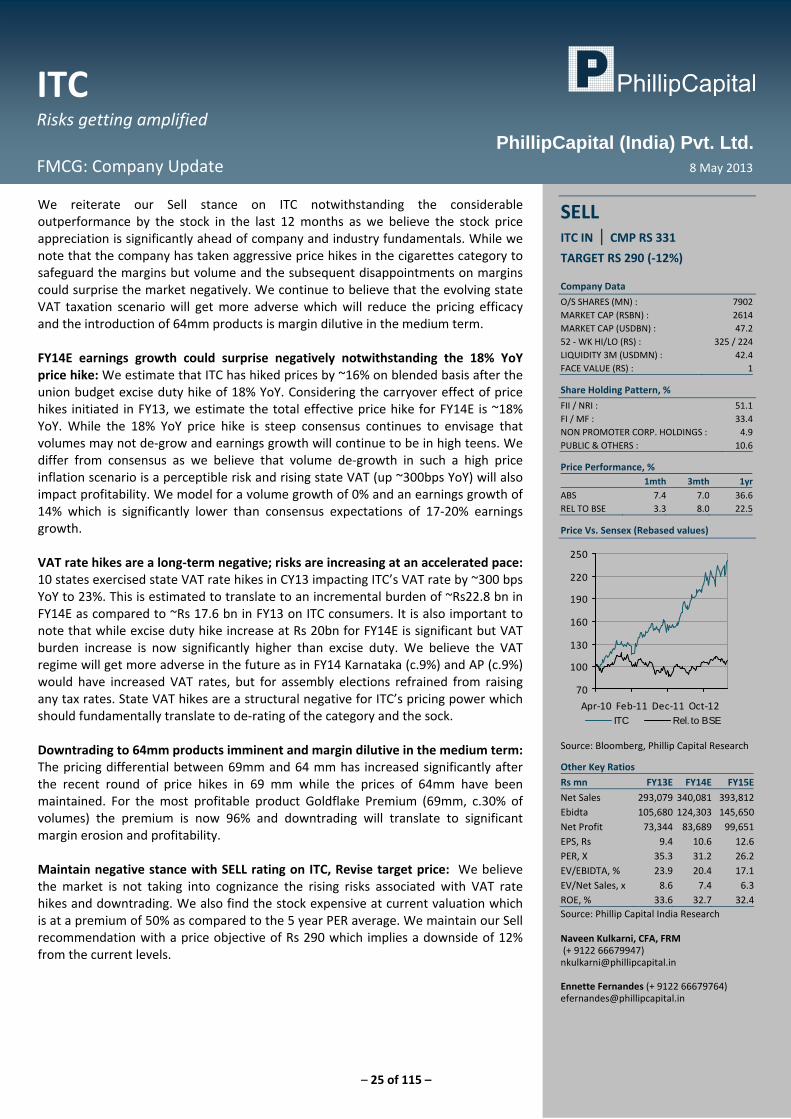
We reiterate our Sell stance on ITC notwithstanding the considerable outperformance by the stock in the last 12 months as we believe the stock price appreciation is significantly ahead of company and industry fundamentals. While we note that the company has taken aggressive price hikes in the cigarettes category to safeguard the margins but volume and the subsequent disappointments on margins could surprise the market negatively. We continue to believe that the evolving state VAT taxation scenario will get more adverse which will reduce the pricing efficacy and the introduction of 64mm products is margin dilutive in the medium term. FY14E earnings growth could surprise negatively notwithstanding the 18% YoY price hike: We estimate that ITC has hiked prices by ~16% on blended basis after the union budget excise duty hike of 18% YoY. Considering the carryover effect of price hikes initiated in FY13, we estimate the total effective price hike for FY14E is ~18% YoY. While the 18% YoY price hike is steep consensus continues to envisage that volumes may not de‐grow and earnings growth will continue to be in high teens. We differ from consensus as we believe that volume de‐growth in such a high price inflation scenario is a perceptible risk and rising state VAT (up ~300bps YoY) will also impact profitability. We model for a volume growth of 0% and an earnings growth of 14% which is significantly lower than consensus expectations of 17‐20% earnings growth. VAT rate hikes are a long‐term negative; risks are increasing at an accelerated pace: 10 states exercised state VAT rate hikes in CY13 impacting ITC’s VAT rate by ~300 bps YoY to 23%. This is estimated to translate to an incremental burden of ~Rs22.8 bn in FY14E as compared to ~Rs 17.6 bn in FY13 on ITC consumers. It is also important to note that while excise duty hike increase at Rs 20bn for FY14E is significant but VAT burden increase is now significantly higher than excise duty. We believe the VAT regime will get more adverse in the future as in FY14 Karnataka (c.9%) and AP (c.9%) would have increased VAT rates, but for assembly elections refrained from raising any tax rates. State VAT hikes are a structural negative for ITC’s pricing power which should fundamentally translate to de‐rating of the category and the sock. Downtrading to 64mm products imminent and margin dilutive in the medium term: The pricing differential between 69mm and 64 mm has increased significantly after the recent round of price hikes in 69 mm while the prices of 64mm have been maintained. For the most profitable product Goldflake Premium (69mm, c.30% of volumes) the premium is now 96% and downtrading will translate to significant margin erosion and profitability. Maintain negative stance with SELL rating on ITC, Revise target price: We believe the market is not taking into cognizance the rising risks associated with VAT rate hikes and downtrading. We also find the stock expensive at current valuation which is at a premium of 50% as compared to the 5 year PER average. We maintain our Sell recommendation with a price objective of Rs 290 which implies a downside of 12% from the current levels.
SELL ITC IN | CMP RS 331
TARGET RS 290 (‐12%) Company Data
O/S SHARES (MN) : 7902MARKET CAP (RSBN) : 2614MARKET CAP (USDBN) : 47.252 ‐ WK HI/LO (RS) : 325 / 224LIQUIDITY 3M (USDMN) : 42.4FACE VALUE (RS) : 1
Share Holding Pattern, %
FII / NRI : 51.1FI / MF : 33.4NON PROMOTER CORP. HOLDINGS : 4.9PUBLIC & OTHERS : 10.6
Price Performance, % 1mth 3mth 1yr
ABS 7.4 7.0 36.6REL TO BSE 3.3 8.0 22.5
Price Vs. Sensex (Rebased values)
70
100
130
160
190
220
250
Apr‐10 Feb‐11 Dec‐11 Oct‐12ITC Rel. to BSE
Source: Bloomberg, Phillip Capital Research
Other Key Ratios
Rs mn FY13E FY14E FY15E
Net Sales 293,079 340,081 393,812Ebidta 105,680 124,303 145,650Net Profit 73,344 83,689 99,651EPS, Rs 9.4 10.6 12.6PER, X 35.3 31.2 26.2EV/EBIDTA, % 23.9 20.4 17.1EV/Net Sales, x 8.6 7.4 6.3ROE, % 33.6 32.7 32.4Source: Phillip Capital India Research Naveen Kulkarni, CFA, FRM (+ 9122 66679947) [email protected] Ennette Fernandes (+ 9122 66679764) [email protected]
– 26 of 115 –
8 May 2013 / INDIA EQUITY RESEARCH / ITC COMPANY UPDATE
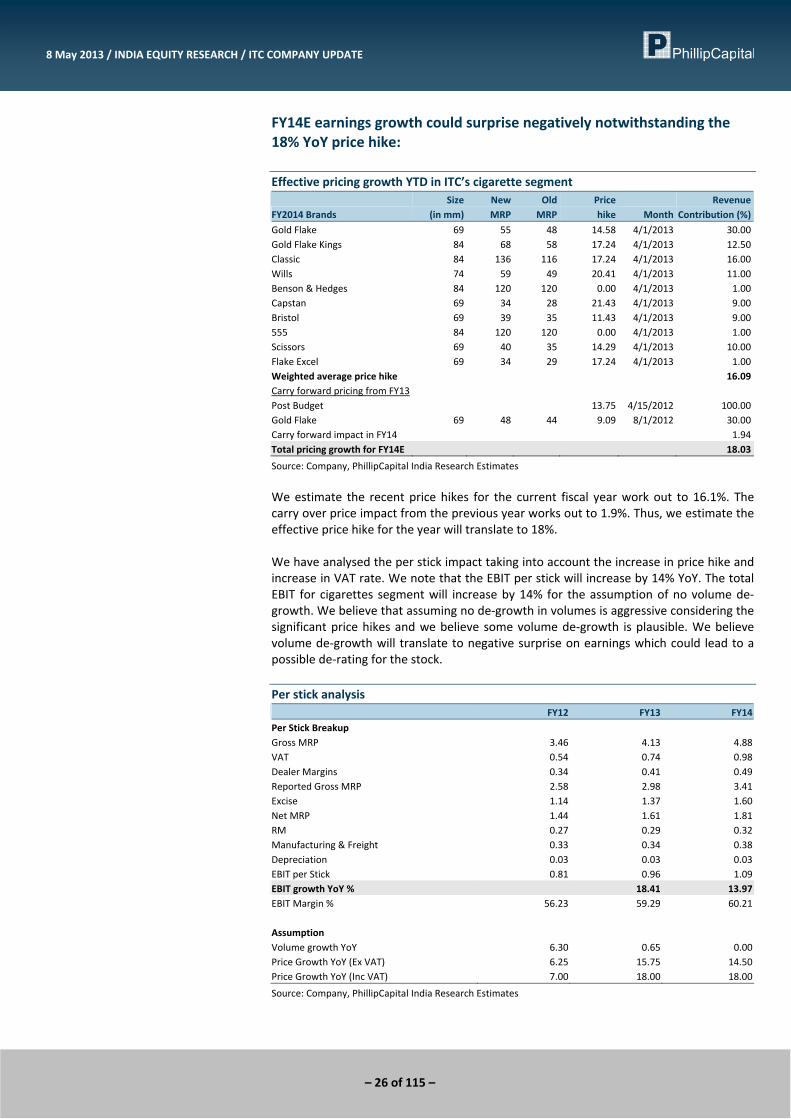
FY14E earnings growth could surprise negatively notwithstanding the 18% YoY price hike: Effective pricing growth YTD in ITC’s cigarette segment
FY2014 Brands Size
(in mm)New MRP
Old MRP
Price hike Month
Revenue Contribution (%)
Gold Flake 69 55 48 14.58 4/1/2013 30.00Gold Flake Kings 84 68 58 17.24 4/1/2013 12.50Classic 84 136 116 17.24 4/1/2013 16.00Wills 74 59 49 20.41 4/1/2013 11.00Benson & Hedges 84 120 120 0.00 4/1/2013 1.00Capstan 69 34 28 21.43 4/1/2013 9.00Bristol 69 39 35 11.43 4/1/2013 9.00555 84 120 120 0.00 4/1/2013 1.00Scissors 69 40 35 14.29 4/1/2013 10.00Flake Excel 69 34 29 17.24 4/1/2013 1.00Weighted average price hike 16.09Carry forward pricing from FY13 Post Budget 13.75 4/15/2012 100.00Gold Flake 69 48 44 9.09 8/1/2012 30.00Carry forward impact in FY14 1.94Total pricing growth for FY14E 18.03
Source: Company, PhillipCapital India Research Estimates
We estimate the recent price hikes for the current fiscal year work out to 16.1%. The carry over price impact from the previous year works out to 1.9%. Thus, we estimate the effective price hike for the year will translate to 18%. We have analysed the per stick impact taking into account the increase in price hike and increase in VAT rate. We note that the EBIT per stick will increase by 14% YoY. The total EBIT for cigarettes segment will increase by 14% for the assumption of no volume de‐growth. We believe that assuming no de‐growth in volumes is aggressive considering the significant price hikes and we believe some volume de‐growth is plausible. We believe volume de‐growth will translate to negative surprise on earnings which could lead to a possible de‐rating for the stock. Per stick analysis FY12 FY13 FY14
Per Stick Breakup Gross MRP 3.46 4.13 4.88VAT 0.54 0.74 0.98Dealer Margins 0.34 0.41 0.49Reported Gross MRP 2.58 2.98 3.41Excise 1.14 1.37 1.60Net MRP 1.44 1.61 1.81RM 0.27 0.29 0.32Manufacturing & Freight 0.33 0.34 0.38Depreciation 0.03 0.03 0.03EBIT per Stick 0.81 0.96 1.09EBIT growth YoY % 18.41 13.97EBIT Margin % 56.23 59.29 60.21 Assumption Volume growth YoY 6.30 0.65 0.00Price Growth YoY (Ex VAT) 6.25 15.75 14.50Price Growth YoY (Inc VAT) 7.00 18.00 18.00
Source: Company, PhillipCapital India Research Estimates
– 27 of 115 –
8 May 2013 / INDIA EQUITY RESEARCH / ITC COMPANY UPDATE
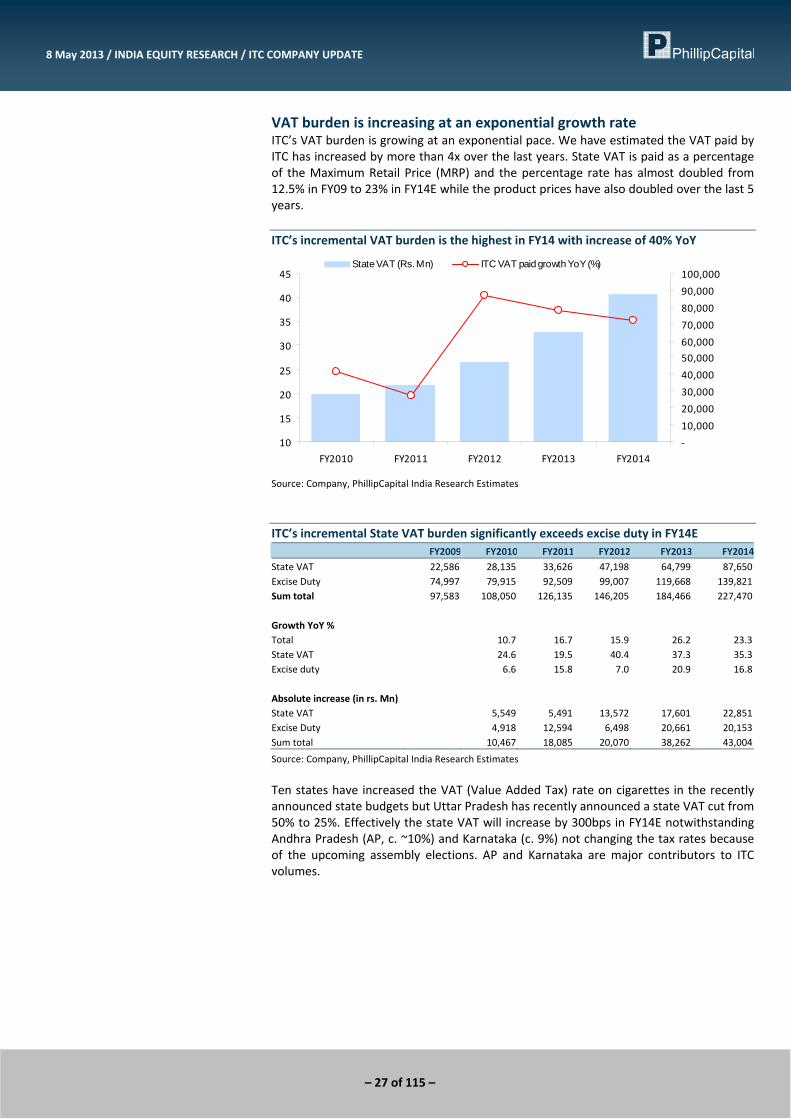
VAT burden is increasing at an exponential growth rate ITC’s VAT burden is growing at an exponential pace. We have estimated the VAT paid by ITC has increased by more than 4x over the last years. State VAT is paid as a percentage of the Maximum Retail Price (MRP) and the percentage rate has almost doubled from 12.5% in FY09 to 23% in FY14E while the product prices have also doubled over the last 5 years. ITC’s incremental VAT burden is the highest in FY14 with increase of 40% YoY
10
15
20
25
30
35
40
45
FY2010 FY2011 FY2012 FY2013 FY2014
‐
10,000
20,000
30,000
40,000
50,000
60,000
70,000
80,000
90,000
100,000State VAT (Rs. Mn) ITC VAT paid growth YoY (%)
Source: Company, PhillipCapital India Research Estimates
ITC’s incremental State VAT burden significantly exceeds excise duty in FY14E FY2009 FY2010 FY2011 FY2012 FY2013 FY2014
State VAT 22,586 28,135 33,626 47,198 64,799 87,650Excise Duty 74,997 79,915 92,509 99,007 119,668 139,821Sum total 97,583 108,050 126,135 146,205 184,466 227,470 Growth YoY % Total 10.7 16.7 15.9 26.2 23.3State VAT 24.6 19.5 40.4 37.3 35.3Excise duty 6.6 15.8 7.0 20.9 16.8 Absolute increase (in rs. Mn) State VAT 5,549 5,491 13,572 17,601 22,851Excise Duty 4,918 12,594 6,498 20,661 20,153Sum total 10,467 18,085 20,070 38,262 43,004
Source: Company, PhillipCapital India Research Estimates
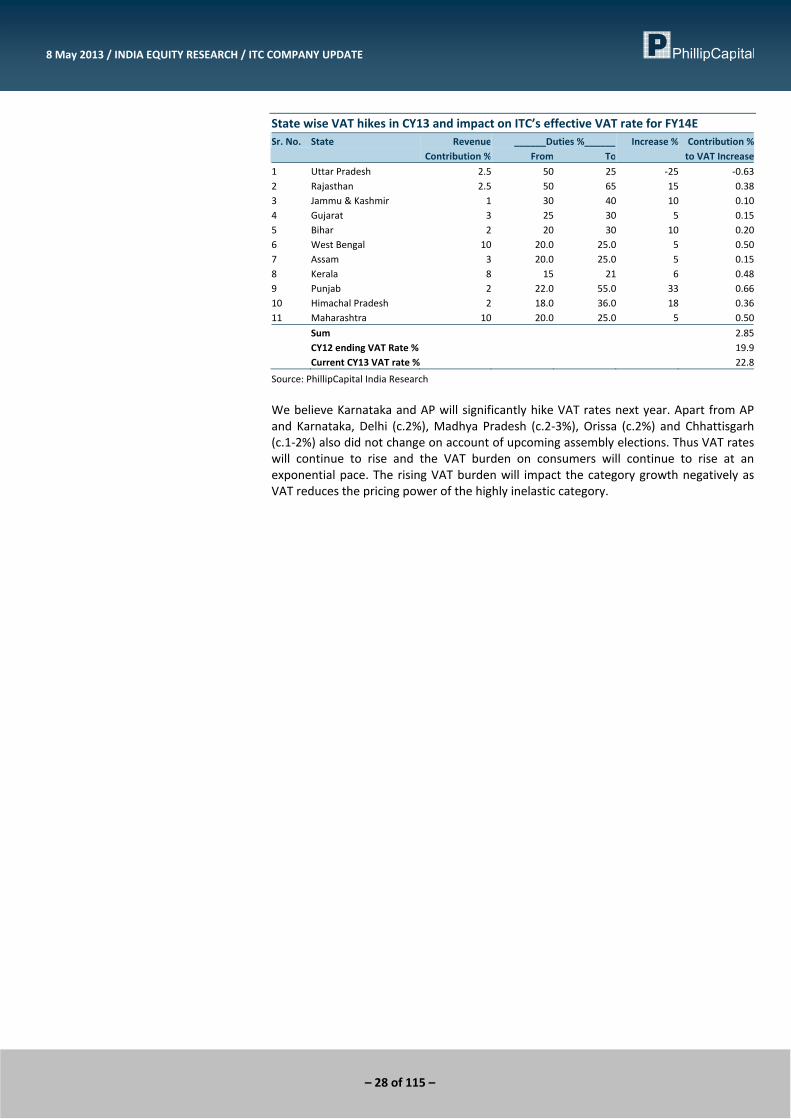
Ten states have increased the VAT (Value Added Tax) rate on cigarettes in the recently announced state budgets but Uttar Pradesh has recently announced a state VAT cut from 50% to 25%. Effectively the state VAT will increase by 300bps in FY14E notwithstanding Andhra Pradesh (AP, c. ~10%) and Karnataka (c. 9%) not changing the tax rates because of the upcoming assembly elections. AP and Karnataka are major contributors to ITC volumes.
– 28 of 115 –
8 May 2013 / INDIA EQUITY RESEARCH / ITC COMPANY UPDATE
State wise VAT hikes in CY13 and impact on ITC’s effective VAT rate for FY14E Sr. No. State Revenue ______Duties %______ Increase % Contribution % Contribution % From To to VAT Increase
1 Uttar Pradesh 2.5 50 25 ‐25 ‐0.632 Rajasthan 2.5 50 65 15 0.383 Jammu & Kashmir 1 30 40 10 0.104 Gujarat 3 25 30 5 0.155 Bihar 2 20 30 10 0.206 West Bengal 10 20.0 25.0 5 0.507 Assam 3 20.0 25.0 5 0.158 Kerala 8 15 21 6 0.489 Punjab 2 22.0 55.0 33 0.6610 Himachal Pradesh 2 18.0 36.0 18 0.3611 Maharashtra 10 20.0 25.0 5 0.50
Sum 2.85 CY12 ending VAT Rate % 19.9 Current CY13 VAT rate % 22.8
Source: PhillipCapital India Research
We believe Karnataka and AP will significantly hike VAT rates next year. Apart from AP and Karnataka, Delhi (c.2%), Madhya Pradesh (c.2‐3%), Orissa (c.2%) and Chhattisgarh (c.1‐2%) also did not change on account of upcoming assembly elections. Thus VAT rates will continue to rise and the VAT burden on consumers will continue to rise at an exponential pace. The rising VAT burden will impact the category growth negatively as VAT reduces the pricing power of the highly inelastic category.
– 29 of 115 –
8 May 2013 / INDIA EQUITY RESEARCH / ITC COMPANY UPDATE
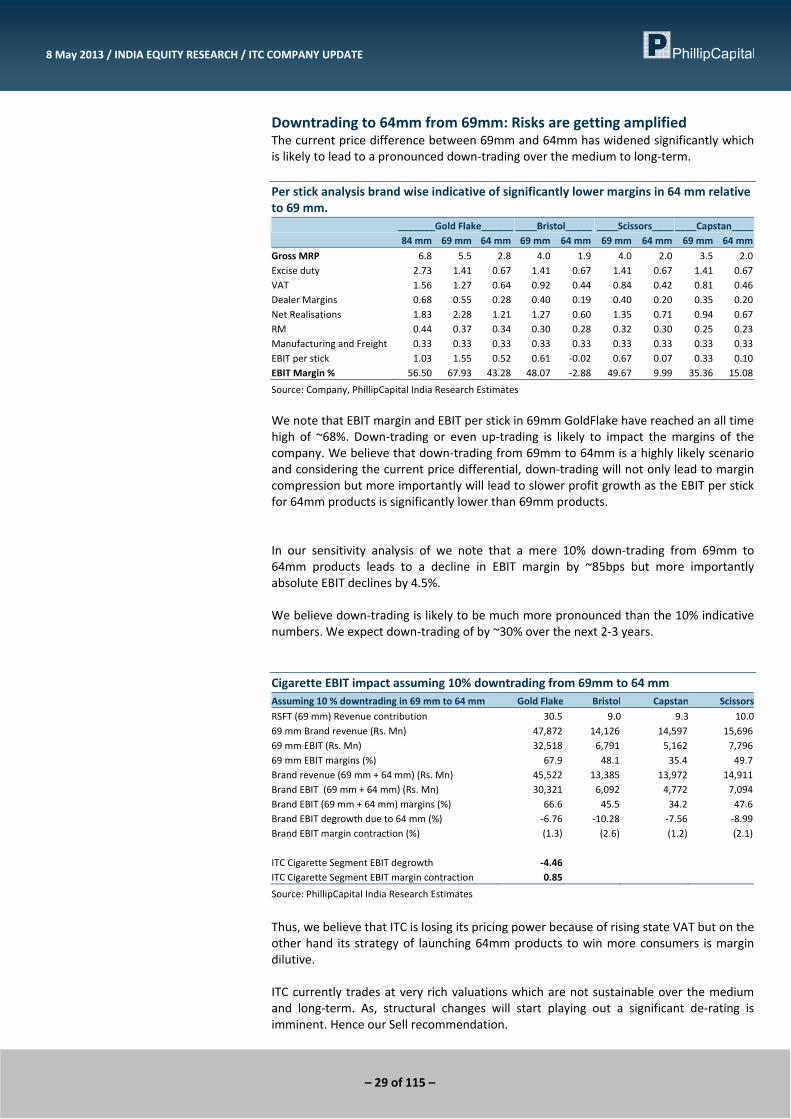
Downtrading to 64mm from 69mm: Risks are getting amplified The current price difference between 69mm and 64mm has widened significantly which is likely to lead to a pronounced down‐trading over the medium to long‐term. Per stick analysis brand wise indicative of significantly lower margins in 64 mm relative to 69 mm. _______Gold Flake______ ____Bristol_____ ____Scissors____ ____Capstan____ 84 mm 69 mm 64 mm 69 mm 64 mm 69 mm 64 mm 69 mm 64 mm
Gross MRP 6.8 5.5 2.8 4.0 1.9 4.0 2.0 3.5 2.0Excise duty 2.73 1.41 0.67 1.41 0.67 1.41 0.67 1.41 0.67VAT 1.56 1.27 0.64 0.92 0.44 0.84 0.42 0.81 0.46Dealer Margins 0.68 0.55 0.28 0.40 0.19 0.40 0.20 0.35 0.20Net Realisations 1.83 2.28 1.21 1.27 0.60 1.35 0.71 0.94 0.67RM 0.44 0.37 0.34 0.30 0.28 0.32 0.30 0.25 0.23Manufacturing and Freight 0.33 0.33 0.33 0.33 0.33 0.33 0.33 0.33 0.33EBIT per stick 1.03 1.55 0.52 0.61 ‐0.02 0.67 0.07 0.33 0.10EBIT Margin % 56.50 67.93 43.28 48.07 ‐2.88 49.67 9.99 35.36 15.08
Source: Company, PhillipCapital India Research Estimates
We note that EBIT margin and EBIT per stick in 69mm GoldFlake have reached an all time high of ~68%. Down‐trading or even up‐trading is likely to impact the margins of the company. We believe that down‐trading from 69mm to 64mm is a highly likely scenario and considering the current price differential, down‐trading will not only lead to margin compression but more importantly will lead to slower profit growth as the EBIT per stick for 64mm products is significantly lower than 69mm products. In our sensitivity analysis of we note that a mere 10% down‐trading from 69mm to 64mm products leads to a decline in EBIT margin by ~85bps but more importantly absolute EBIT declines by 4.5%. We believe down‐trading is likely to be much more pronounced than the 10% indicative numbers. We expect down‐trading of by ~30% over the next 2‐3 years. Cigarette EBIT impact assuming 10% downtrading from 69mm to 64 mm Assuming 10 % downtrading in 69 mm to 64 mm Gold Flake Bristol Capstan Scissors
RSFT (69 mm) Revenue contribution 30.5 9.0 9.3 10.0 69 mm Brand revenue (Rs. Mn) 47,872 14,126 14,597 15,696 69 mm EBIT (Rs. Mn) 32,518 6,791 5,162 7,796 69 mm EBIT margins (%) 67.9 48.1 35.4 49.7 Brand revenue (69 mm + 64 mm) (Rs. Mn) 45,522 13,385 13,972 14,911 Brand EBIT (69 mm + 64 mm) (Rs. Mn) 30,321 6,092 4,772 7,094 Brand EBIT (69 mm + 64 mm) margins (%) 66.6 45.5 34.2 47.6 Brand EBIT degrowth due to 64 mm (%) ‐6.76 ‐10.28 ‐7.56 ‐8.99Brand EBIT margin contraction (%) (1.3) (2.6) (1.2) (2.1) ITC Cigarette Segment EBIT degrowth ‐4.46 ITC Cigarette Segment EBIT margin contraction 0.85
Source: PhillipCapital India Research Estimates
Thus, we believe that ITC is losing its pricing power because of rising state VAT but on the other hand its strategy of launching 64mm products to win more consumers is margin dilutive. ITC currently trades at very rich valuations which are not sustainable over the medium and long‐term. As, structural changes will start playing out a significant de‐rating is imminent. Hence our Sell recommendation.
– 30 of 115 –
8 May 2013 / INDIA EQUITY RESEARCH / ITC COMPANY UPDATE
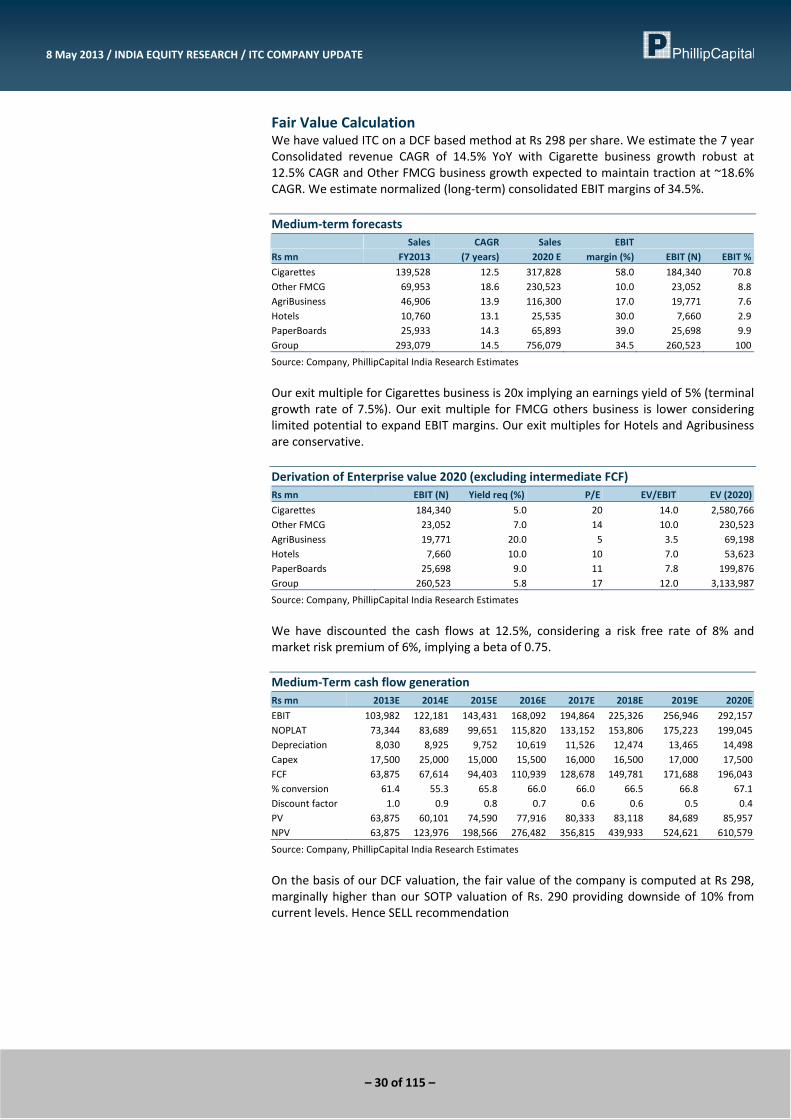
Fair Value Calculation We have valued ITC on a DCF based method at Rs 298 per share. We estimate the 7 year Consolidated revenue CAGR of 14.5% YoY with Cigarette business growth robust at 12.5% CAGR and Other FMCG business growth expected to maintain traction at ~18.6% CAGR. We estimate normalized (long‐term) consolidated EBIT margins of 34.5%. Medium‐term forecasts
Rs mn Sales
FY2013CAGR
(7 years)Sales
2020 E EBIT
margin (%) EBIT (N) EBIT %
Cigarettes 139,528 12.5 317,828 58.0 184,340 70.8Other FMCG 69,953 18.6 230,523 10.0 23,052 8.8AgriBusiness 46,906 13.9 116,300 17.0 19,771 7.6Hotels 10,760 13.1 25,535 30.0 7,660 2.9PaperBoards 25,933 14.3 65,893 39.0 25,698 9.9Group 293,079 14.5 756,079 34.5 260,523 100
Source: Company, PhillipCapital India Research Estimates
Our exit multiple for Cigarettes business is 20x implying an earnings yield of 5% (terminal growth rate of 7.5%). Our exit multiple for FMCG others business is lower considering limited potential to expand EBIT margins. Our exit multiples for Hotels and Agribusiness are conservative. Derivation of Enterprise value 2020 (excluding intermediate FCF) Rs mn EBIT (N) Yield req (%) P/E EV/EBIT EV (2020)
Cigarettes 184,340 5.0 20 14.0 2,580,766Other FMCG 23,052 7.0 14 10.0 230,523AgriBusiness 19,771 20.0 5 3.5 69,198Hotels 7,660 10.0 10 7.0 53,623PaperBoards 25,698 9.0 11 7.8 199,876Group 260,523 5.8 17 12.0 3,133,987
Source: Company, PhillipCapital India Research Estimates
We have discounted the cash flows at 12.5%, considering a risk free rate of 8% and market risk premium of 6%, implying a beta of 0.75. Medium‐Term cash flow generation Rs mn 2013E 2014E 2015E 2016E 2017E 2018E 2019E 2020E
EBIT 103,982 122,181 143,431 168,092 194,864 225,326 256,946 292,157NOPLAT 73,344 83,689 99,651 115,820 133,152 153,806 175,223 199,045Depreciation 8,030 8,925 9,752 10,619 11,526 12,474 13,465 14,498Capex 17,500 25,000 15,000 15,500 16,000 16,500 17,000 17,500FCF 63,875 67,614 94,403 110,939 128,678 149,781 171,688 196,043% conversion 61.4 55.3 65.8 66.0 66.0 66.5 66.8 67.1Discount factor 1.0 0.9 0.8 0.7 0.6 0.6 0.5 0.4PV 63,875 60,101 74,590 77,916 80,333 83,118 84,689 85,957NPV 63,875 123,976 198,566 276,482 356,815 439,933 524,621 610,579
Source: Company, PhillipCapital India Research Estimates
On the basis of our DCF valuation, the fair value of the company is computed at Rs 298, marginally higher than our SOTP valuation of Rs. 290 providing downside of 10% from current levels. Hence SELL recommendation
– 31 of 115 –
8 May 2013 / INDIA EQUITY RESEARCH / ITC COMPANY UPDATE
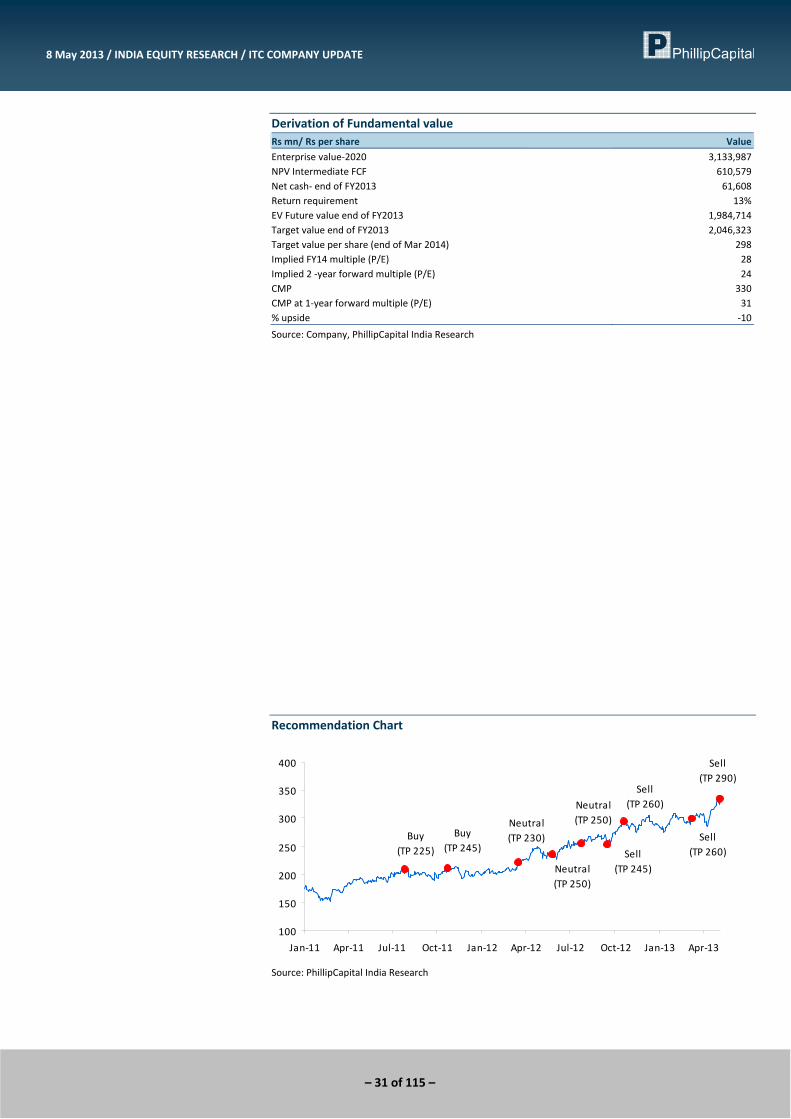
Derivation of Fundamental value Rs mn/ Rs per share Value
Enterprise value‐2020 3,133,987NPV Intermediate FCF 610,579Net cash‐ end of FY2013 61,608Return requirement 13%EV Future value end of FY2013 1,984,714Target value end of FY2013 2,046,323Target value per share (end of Mar 2014) 298Implied FY14 multiple (P/E) 28Implied 2 ‐year forward multiple (P/E) 24CMP 330CMP at 1‐year forward multiple (P/E) 31% upside ‐10
Source: Company, PhillipCapital India Research
Recommendation Chart
Sell(TP 290)
Sell(TP 260)
Buy(TP 225)
Buy(TP 245)
Neutral(TP 230)
Neutral(TP 250)
Neutral(TP 250)
Sell(TP 245)
Sell(TP 260)
100
150
200
250
300
350
400
Jan‐11 Apr‐11 Jul‐11 Oct‐11 Jan‐12 Apr‐12 Jul‐12 Oct‐12 Jan‐13 Apr‐13
Source: PhillipCapital India Research
– 32 of 115 –
8 May 2013 / INDIA EQUITY RESEARCH / ITC COMPANY UPDATE
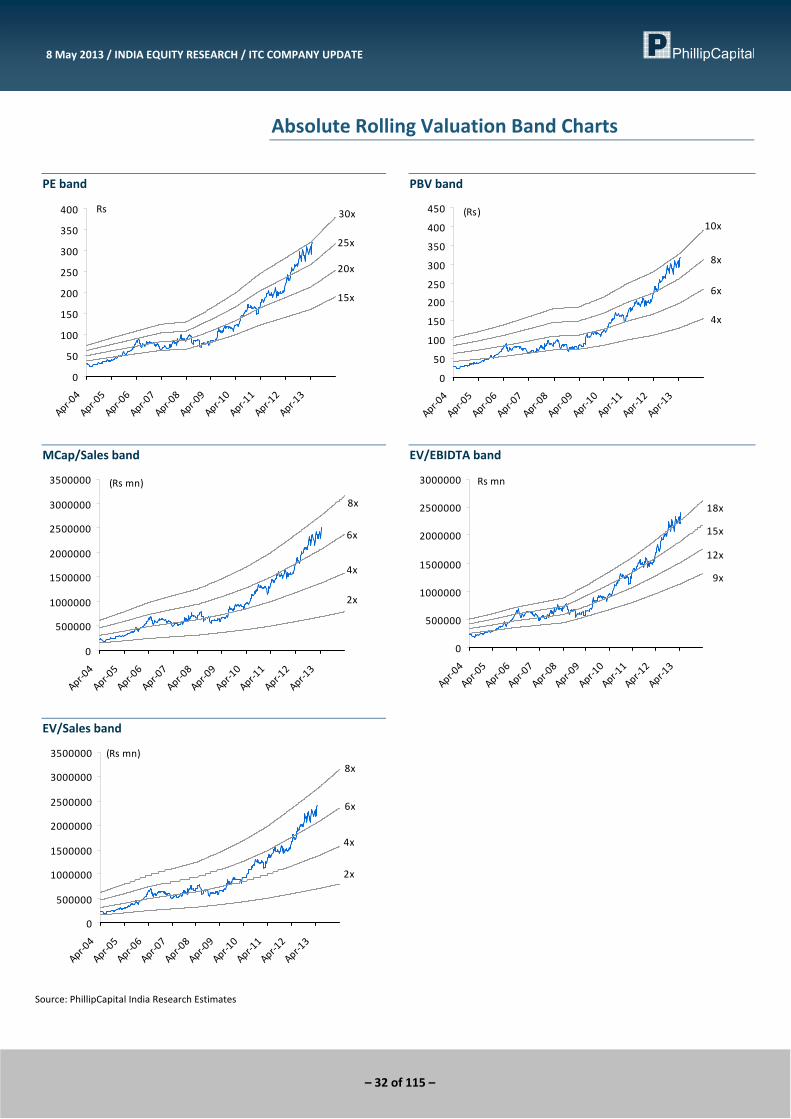
Absolute Rolling Valuation Band Charts
PE band
15x
20x
25x
30x
0
50
100
150
200
250
300
350
400
Apr‐04
Apr‐05
Apr‐06
Apr‐07
Apr‐08
Apr‐09
Apr‐10
Apr‐11
Apr‐12
Apr‐13
Rs
PBV band
4x
6x
8x
10x
0
50
100
150
200
250
300
350
400
450
Apr‐04
Apr‐05
Apr‐06
Apr‐07
Apr‐08
Apr‐09
Apr‐10
Apr‐11
Apr‐12
Apr‐13
(Rs)
MCap/Sales band
2x
4x
6x
8x
0
500000
1000000
1500000
2000000
2500000
3000000
3500000
Apr‐04
Apr‐05
Apr‐06
Apr‐07
Apr‐08
Apr‐09
Apr‐10
Apr‐11
Apr‐12
Apr‐13
(Rs mn)
EV/EBIDTA band
9x
12x
15x
18x
0
500000
1000000
1500000
2000000
2500000
3000000
Apr‐04
Apr‐05
Apr‐06
Apr‐07
Apr‐08
Apr‐09
Apr‐10
Apr‐11
Apr‐12
Apr‐13
Rs mn
EV/Sales band
2x
4x
6x
8x
0
500000
1000000
1500000
2000000
2500000
3000000
3500000
Apr‐04
Apr‐05
Apr‐06
Apr‐07
Apr‐08
Apr‐09
Apr‐10
Apr‐11
Apr‐12
Apr‐13
(Rs mn)
Source: PhillipCapital India Research Estimates
– 33 of 115 –
8 May 2013 / INDIA EQUITY RESEARCH / ITC COMPANY UPDATE
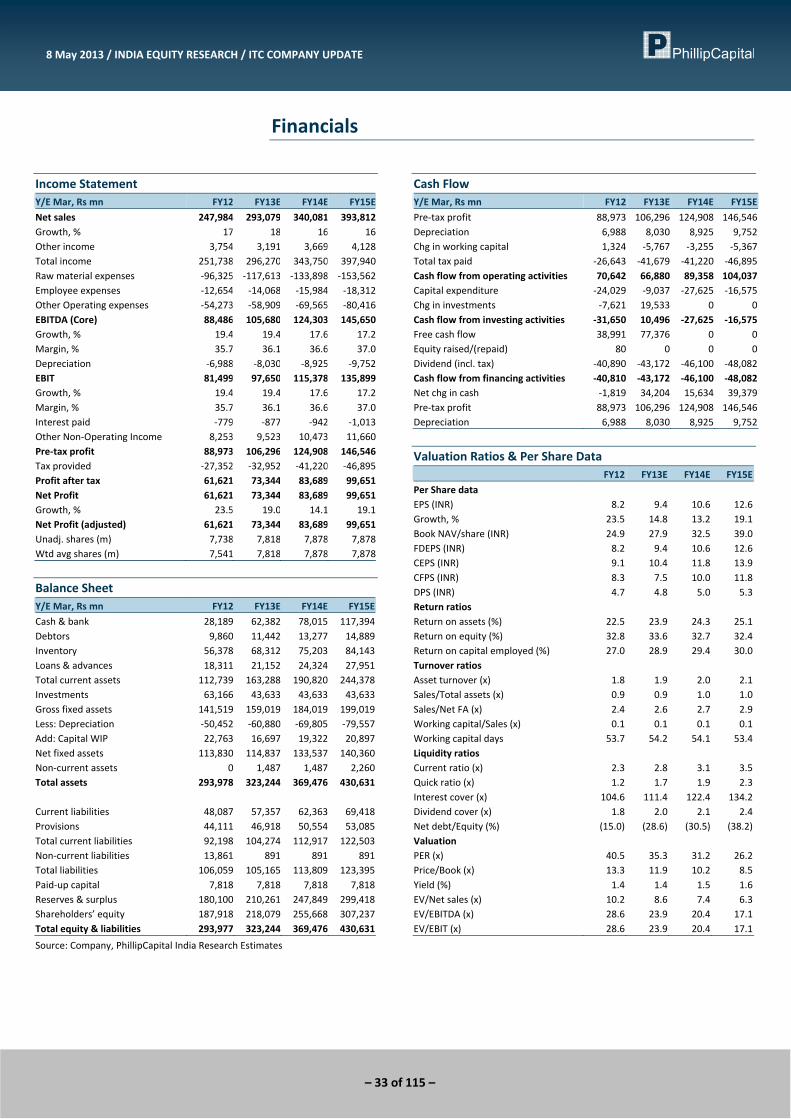
Financials
Income Statement Y/E Mar, Rs mn FY12 FY13E FY14E FY15E
Net sales 247,984 293,079 340,081 393,812Growth, % 17 18 16 16Other income 3,754 3,191 3,669 4,128Total income 251,738 296,270 343,750 397,940Raw material expenses ‐96,325 ‐117,613 ‐133,898 ‐153,562Employee expenses ‐12,654 ‐14,068 ‐15,984 ‐18,312Other Operating expenses ‐54,273 ‐58,909 ‐69,565 ‐80,416EBITDA (Core) 88,486 105,680 124,303 145,650Growth, % 19.4 19.4 17.6 17.2Margin, % 35.7 36.1 36.6 37.0Depreciation ‐6,988 ‐8,030 ‐8,925 ‐9,752EBIT 81,499 97,650 115,378 135,899Growth, % 19.4 19.4 17.6 17.2Margin, % 35.7 36.1 36.6 37.0Interest paid ‐779 ‐877 ‐942 ‐1,013Other Non‐Operating Income 8,253 9,523 10,473 11,660Pre‐tax profit 88,973 106,296 124,908 146,546Tax provided ‐27,352 ‐32,952 ‐41,220 ‐46,895Profit after tax 61,621 73,344 83,689 99,651Net Profit 61,621 73,344 83,689 99,651Growth, % 23.5 19.0 14.1 19.1Net Profit (adjusted) 61,621 73,344 83,689 99,651Unadj. shares (m) 7,738 7,818 7,878 7,878Wtd avg shares (m) 7,541 7,818 7,878 7,878
Balance Sheet Y/E Mar, Rs mn FY12 FY13E FY14E FY15E
Cash & bank 28,189 62,382 78,015 117,394Debtors 9,860 11,442 13,277 14,889Inventory 56,378 68,312 75,203 84,143Loans & advances 18,311 21,152 24,324 27,951Total current assets 112,739 163,288 190,820 244,378Investments 63,166 43,633 43,633 43,633Gross fixed assets 141,519 159,019 184,019 199,019Less: Depreciation ‐50,452 ‐60,880 ‐69,805 ‐79,557Add: Capital WIP 22,763 16,697 19,322 20,897Net fixed assets 113,830 114,837 133,537 140,360Non‐current assets 0 1,487 1,487 2,260Total assets 293,978 323,244 369,476 430,631 Current liabilities 48,087 57,357 62,363 69,418Provisions 44,111 46,918 50,554 53,085Total current liabilities 92,198 104,274 112,917 122,503Non‐current liabilities 13,861 891 891 891Total liabilities 106,059 105,165 113,809 123,395Paid‐up capital 7,818 7,818 7,818 7,818Reserves & surplus 180,100 210,261 247,849 299,418Shareholders’ equity 187,918 218,079 255,668 307,237Total equity & liabilities 293,977 323,244 369,476 430,631
Source: Company, PhillipCapital India Research Estimates
Cash Flow Y/E Mar, Rs mn FY12 FY13E FY14E FY15E
Pre‐tax profit 88,973 106,296 124,908 146,546Depreciation 6,988 8,030 8,925 9,752Chg in working capital 1,324 ‐5,767 ‐3,255 ‐5,367Total tax paid ‐26,643 ‐41,679 ‐41,220 ‐46,895Cash flow from operating activities 70,642 66,880 89,358 104,037Capital expenditure ‐24,029 ‐9,037 ‐27,625 ‐16,575Chg in investments ‐7,621 19,533 0 0Cash flow from investing activities ‐31,650 10,496 ‐27,625 ‐16,575Free cash flow 38,991 77,376 0 0Equity raised/(repaid) 80 0 0 0Dividend (incl. tax) ‐40,890 ‐43,172 ‐46,100 ‐48,082Cash flow from financing activities ‐40,810 ‐43,172 ‐46,100 ‐48,082Net chg in cash ‐1,819 34,204 15,634 39,379Pre‐tax profit 88,973 106,296 124,908 146,546Depreciation 6,988 8,030 8,925 9,752
Valuation Ratios & Per Share Data FY12 FY13E FY14E FY15E
Per Share data EPS (INR) 8.2 9.4 10.6 12.6Growth, % 23.5 14.8 13.2 19.1Book NAV/share (INR) 24.9 27.9 32.5 39.0FDEPS (INR) 8.2 9.4 10.6 12.6CEPS (INR) 9.1 10.4 11.8 13.9CFPS (INR) 8.3 7.5 10.0 11.8DPS (INR) 4.7 4.8 5.0 5.3Return ratios Return on assets (%) 22.5 23.9 24.3 25.1Return on equity (%) 32.8 33.6 32.7 32.4Return on capital employed (%) 27.0 28.9 29.4 30.0Turnover ratios Asset turnover (x) 1.8 1.9 2.0 2.1Sales/Total assets (x) 0.9 0.9 1.0 1.0Sales/Net FA (x) 2.4 2.6 2.7 2.9Working capital/Sales (x) 0.1 0.1 0.1 0.1Working capital days 53.7 54.2 54.1 53.4Liquidity ratios Current ratio (x) 2.3 2.8 3.1 3.5Quick ratio (x) 1.2 1.7 1.9 2.3Interest cover (x) 104.6 111.4 122.4 134.2Dividend cover (x) 1.8 2.0 2.1 2.4Net debt/Equity (%) (15.0) (28.6) (30.5) (38.2)Valuation PER (x) 40.5 35.3 31.2 26.2Price/Book (x) 13.3 11.9 10.2 8.5Yield (%) 1.4 1.4 1.5 1.6EV/Net sales (x) 10.2 8.6 7.4 6.3EV/EBITDA (x) 28.6 23.9 20.4 17.1EV/EBIT (x) 28.6 23.9 20.4 17.1
– 34 of 115 –
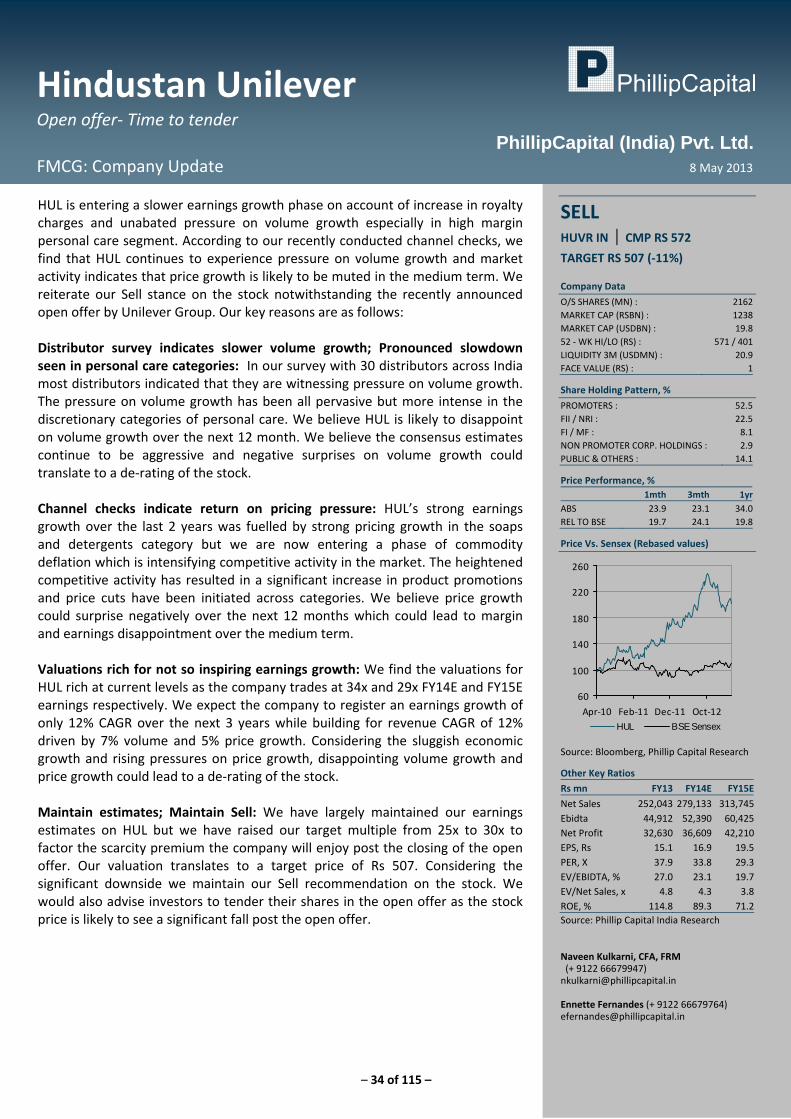
Hindustan Unilever Open offer‐ Time to tender
FMCG: Company Update 8 May 2013
PhillipCapital (India) Pvt. Ltd.
HUL is entering a slower earnings growth phase on account of increase in royalty charges and unabated pressure on volume growth especially in high margin personal care segment. According to our recently conducted channel checks, we find that HUL continues to experience pressure on volume growth and market activity indicates that price growth is likely to be muted in the medium term. We reiterate our Sell stance on the stock notwithstanding the recently announced open offer by Unilever Group. Our key reasons are as follows: Distributor survey indicates slower volume growth; Pronounced slowdown seen in personal care categories: In our survey with 30 distributors across India most distributors indicated that they are witnessing pressure on volume growth. The pressure on volume growth has been all pervasive but more intense in the discretionary categories of personal care. We believe HUL is likely to disappoint on volume growth over the next 12 month. We believe the consensus estimates continue to be aggressive and negative surprises on volume growth could translate to a de‐rating of the stock. Channel checks indicate return on pricing pressure: HUL’s strong earnings growth over the last 2 years was fuelled by strong pricing growth in the soaps and detergents category but we are now entering a phase of commodity deflation which is intensifying competitive activity in the market. The heightened competitive activity has resulted in a significant increase in product promotions and price cuts have been initiated across categories. We believe price growth could surprise negatively over the next 12 months which could lead to margin and earnings disappointment over the medium term. Valuations rich for not so inspiring earnings growth: We find the valuations for HUL rich at current levels as the company trades at 34x and 29x FY14E and FY15E earnings respectively. We expect the company to register an earnings growth of only 12% CAGR over the next 3 years while building for revenue CAGR of 12% driven by 7% volume and 5% price growth. Considering the sluggish economic growth and rising pressures on price growth, disappointing volume growth and price growth could lead to a de‐rating of the stock. Maintain estimates; Maintain Sell: We have largely maintained our earnings estimates on HUL but we have raised our target multiple from 25x to 30x to factor the scarcity premium the company will enjoy post the closing of the open offer. Our valuation translates to a target price of Rs 507. Considering the significant downside we maintain our Sell recommendation on the stock. We would also advise investors to tender their shares in the open offer as the stock price is likely to see a significant fall post the open offer.
SELL HUVR IN | CMP RS 572
TARGET RS 507 (‐11%) Company Data
O/S SHARES (MN) : 2162MARKET CAP (RSBN) : 1238MARKET CAP (USDBN) : 19.852 ‐ WK HI/LO (RS) : 571 / 401LIQUIDITY 3M (USDMN) : 20.9FACE VALUE (RS) : 1
Share Holding Pattern, %
PROMOTERS : 52.5FII / NRI : 22.5FI / MF : 8.1NON PROMOTER CORP. HOLDINGS : 2.9PUBLIC & OTHERS : 14.1
Price Performance, % 1mth 3mth 1yr
ABS 23.9 23.1 34.0REL TO BSE 19.7 24.1 19.8
Price Vs. Sensex (Rebased values)
60
100
140
180
220
260
Apr‐10 Feb‐11 Dec‐11 Oct‐12HUL BSE Sensex
Source: Bloomberg, Phillip Capital Research
Other Key Ratios
Rs mn FY13 FY14E FY15E
Net Sales 252,043 279,133 313,745Ebidta 44,912 52,390 60,425Net Profit 32,630 36,609 42,210EPS, Rs 15.1 16.9 19.5PER, X 37.9 33.8 29.3EV/EBIDTA, % 27.0 23.1 19.7EV/Net Sales, x 4.8 4.3 3.8ROE, % 114.8 89.3 71.2Source: Phillip Capital India Research Naveen Kulkarni, CFA, FRM (+ 9122 66679947) [email protected] Ennette Fernandes (+ 9122 66679764) [email protected]
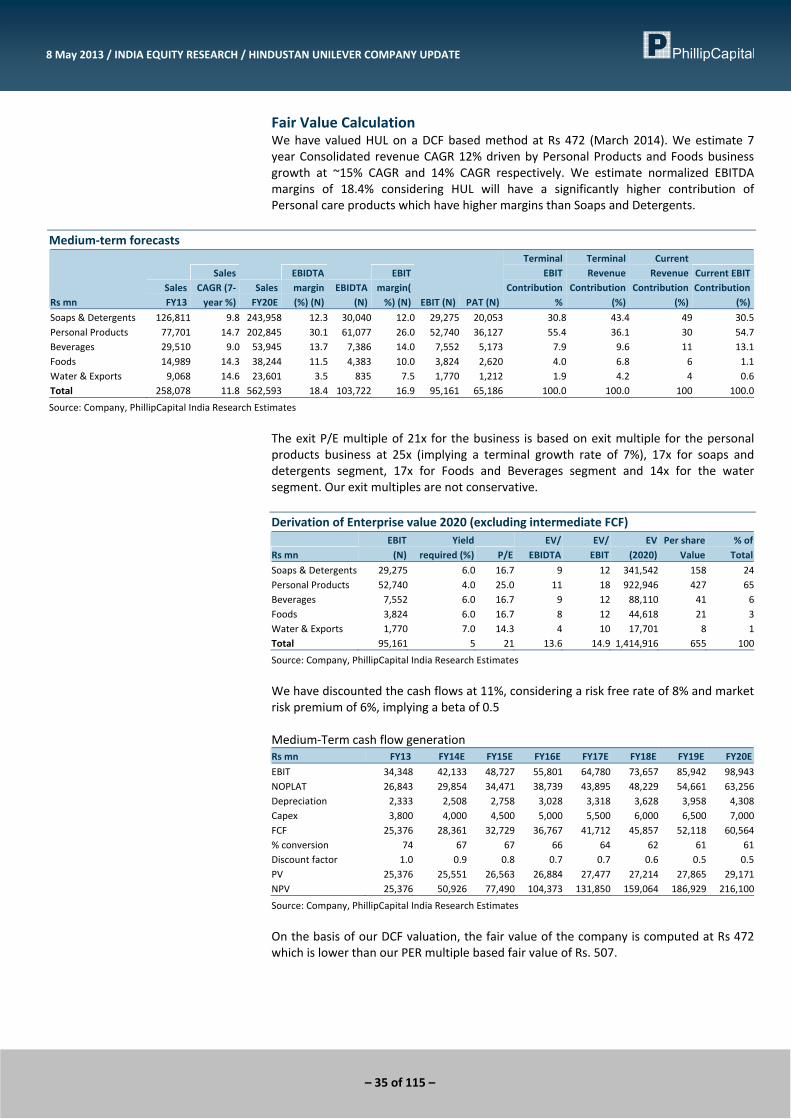
– 35 of 115 –
8 May 2013 / INDIA EQUITY RESEARCH / HINDUSTAN UNILEVER COMPANY UPDATE
Fair Value Calculation We have valued HUL on a DCF based method at Rs 472 (March 2014). We estimate 7 year Consolidated revenue CAGR 12% driven by Personal Products and Foods business growth at ~15% CAGR and 14% CAGR respectively. We estimate normalized EBITDA margins of 18.4% considering HUL will have a significantly higher contribution of Personal care products which have higher margins than Soaps and Detergents.
Medium‐term forecasts
Rs mn Sales FY13
Sales CAGR (7‐year %)
Sales FY20E
EBIDTA margin (%) (N)
EBIDTA (N)
EBIT margin(%) (N) EBIT (N) PAT (N)
Terminal EBIT
Contribution %
Terminal Revenue
Contribution (%)
Current Revenue
Contribution (%)
Current EBIT Contribution
(%)
Soaps & Detergents 126,811 9.8 243,958 12.3 30,040 12.0 29,275 20,053 30.8 43.4 49 30.5Personal Products 77,701 14.7 202,845 30.1 61,077 26.0 52,740 36,127 55.4 36.1 30 54.7Beverages 29,510 9.0 53,945 13.7 7,386 14.0 7,552 5,173 7.9 9.6 11 13.1Foods 14,989 14.3 38,244 11.5 4,383 10.0 3,824 2,620 4.0 6.8 6 1.1Water & Exports 9,068 14.6 23,601 3.5 835 7.5 1,770 1,212 1.9 4.2 4 0.6Total 258,078 11.8 562,593 18.4 103,722 16.9 95,161 65,186 100.0 100.0 100 100.0
Source: Company, PhillipCapital India Research Estimates
The exit P/E multiple of 21x for the business is based on exit multiple for the personal products business at 25x (implying a terminal growth rate of 7%), 17x for soaps and detergents segment, 17x for Foods and Beverages segment and 14x for the water segment. Our exit multiples are not conservative. Derivation of Enterprise value 2020 (excluding intermediate FCF)
Rs mn EBIT (N)
Yield required (%) P/E
EV/ EBIDTA
EV/ EBIT
EV (2020)
Per share Value
% of Total
Soaps & Detergents 29,275 6.0 16.7 9 12 341,542 158 24Personal Products 52,740 4.0 25.0 11 18 922,946 427 65Beverages 7,552 6.0 16.7 9 12 88,110 41 6Foods 3,824 6.0 16.7 8 12 44,618 21 3Water & Exports 1,770 7.0 14.3 4 10 17,701 8 1Total 95,161 5 21 13.6 14.9 1,414,916 655 100
Source: Company, PhillipCapital India Research Estimates
We have discounted the cash flows at 11%, considering a risk free rate of 8% and market risk premium of 6%, implying a beta of 0.5 Medium‐Term cash flow generation Rs mn FY13 FY14E FY15E FY16E FY17E FY18E FY19E FY20E
EBIT 34,348 42,133 48,727 55,801 64,780 73,657 85,942 98,943NOPLAT 26,843 29,854 34,471 38,739 43,895 48,229 54,661 63,256Depreciation 2,333 2,508 2,758 3,028 3,318 3,628 3,958 4,308Capex 3,800 4,000 4,500 5,000 5,500 6,000 6,500 7,000FCF 25,376 28,361 32,729 36,767 41,712 45,857 52,118 60,564% conversion 74 67 67 66 64 62 61 61Discount factor 1.0 0.9 0.8 0.7 0.7 0.6 0.5 0.5PV 25,376 25,551 26,563 26,884 27,477 27,214 27,865 29,171NPV 25,376 50,926 77,490 104,373 131,850 159,064 186,929 216,100
Source: Company, PhillipCapital India Research Estimates
On the basis of our DCF valuation, the fair value of the company is computed at Rs 472 which is lower than our PER multiple based fair value of Rs. 507.
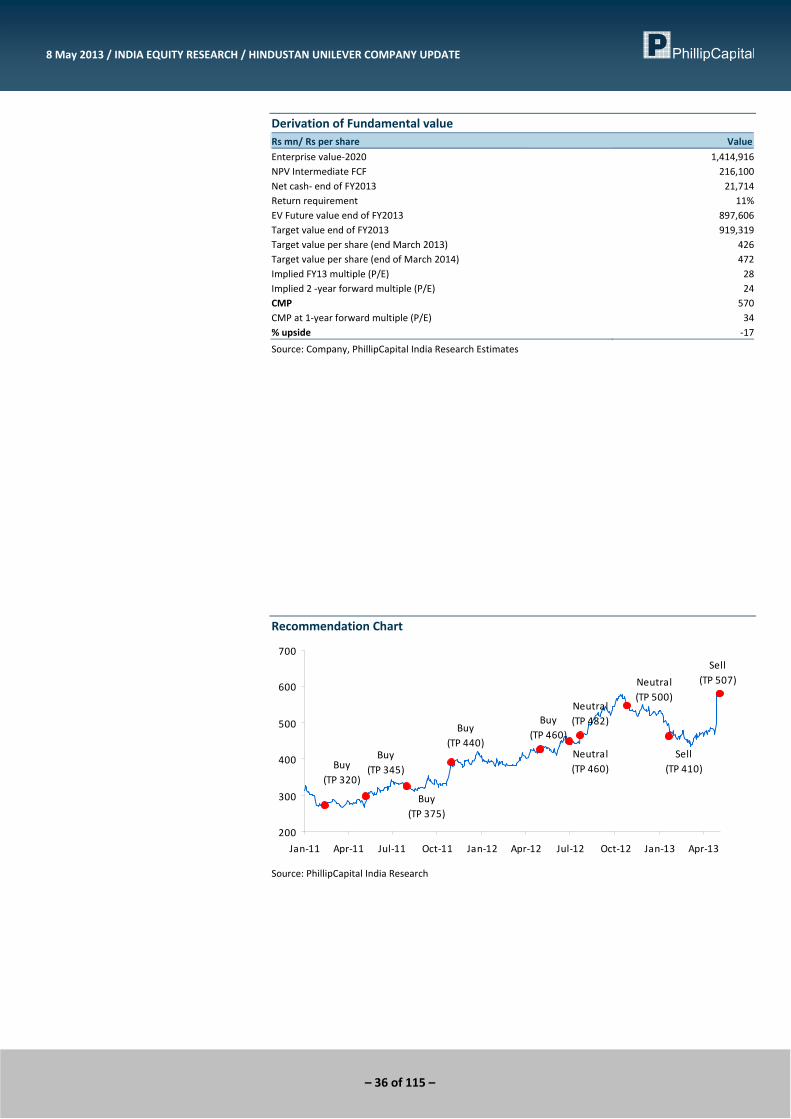
– 36 of 115 –
8 May 2013 / INDIA EQUITY RESEARCH / HINDUSTAN UNILEVER COMPANY UPDATE
Derivation of Fundamental value Rs mn/ Rs per share Value
Enterprise value‐2020 1,414,916NPV Intermediate FCF 216,100Net cash‐ end of FY2013 21,714Return requirement 11%EV Future value end of FY2013 897,606Target value end of FY2013 919,319Target value per share (end March 2013) 426Target value per share (end of March 2014) 472Implied FY13 multiple (P/E) 28Implied 2 ‐year forward multiple (P/E) 24CMP 570CMP at 1‐year forward multiple (P/E) 34% upside ‐17
Source: Company, PhillipCapital India Research Estimates
Recommendation Chart
Sell(TP 507)
Buy(TP 320)
Buy(TP 345)
Buy(TP 375)
Buy(TP 440)
Buy(TP 460)
Neutral(TP 460)
Neutral(TP 482)
Neutral(TP 500)
Sell(TP 410)
200
300
400
500
600
700
Jan‐11 Apr‐11 Jul‐11 Oct‐11 Jan‐12 Apr‐12 Jul‐12 Oct‐12 Jan‐13 Apr‐13
Source: PhillipCapital India Research
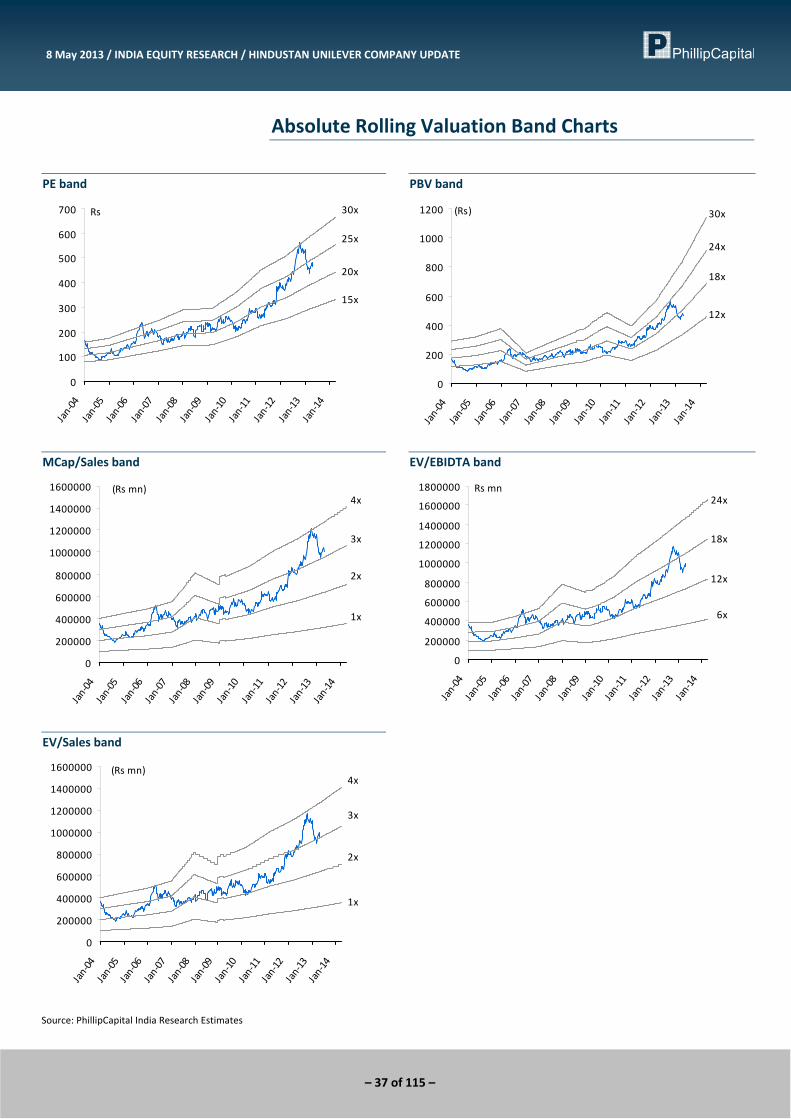
– 37 of 115 –
8 May 2013 / INDIA EQUITY RESEARCH / HINDUSTAN UNILEVER COMPANY UPDATE
Absolute Rolling Valuation Band Charts
PE band
15x
20x
25x
30x
0
100
200
300
400
500
600
700
Jan‐04
Jan‐05
Jan‐06
Jan‐07
Jan‐08
Jan‐09
Jan‐10
Jan‐11
Jan‐12
Jan‐13
Jan‐14
Rs
PBV band
(Rs)
12x
18x
24x
30x
0
200
400
600
800
1000
1200
Jan‐04
Jan‐05
Jan‐06
Jan‐07
Jan‐08
Jan‐09
Jan‐10
Jan‐11
Jan‐12
Jan‐13
Jan‐14
MCap/Sales band
1x
2x
3x
4x
0
200000
400000
600000
800000
1000000
1200000
1400000
1600000
Jan‐04
Jan‐05
Jan‐06
Jan‐07
Jan‐08
Jan‐09
Jan‐10
Jan‐11
Jan‐12
Jan‐13
Jan‐14
(Rs mn)
EV/EBIDTA band
6x
12x
18x
24x
0
200000
400000
600000
800000
1000000
1200000
1400000
1600000
1800000
Jan‐04
Jan‐05
Jan‐06
Jan‐07
Jan‐08
Jan‐09
Jan‐10
Jan‐11
Jan‐12
Jan‐13
Jan‐14
Rs mn
EV/Sales band
(Rs mn)
1x
2x
3x
4x
0
200000
400000
600000
800000
1000000
1200000
1400000
1600000
Jan‐04
Jan‐05
Jan‐06
Jan‐07
Jan‐08
Jan‐09
Jan‐10
Jan‐11
Jan‐12
Jan‐13
Jan‐14
Source: PhillipCapital India Research Estimates
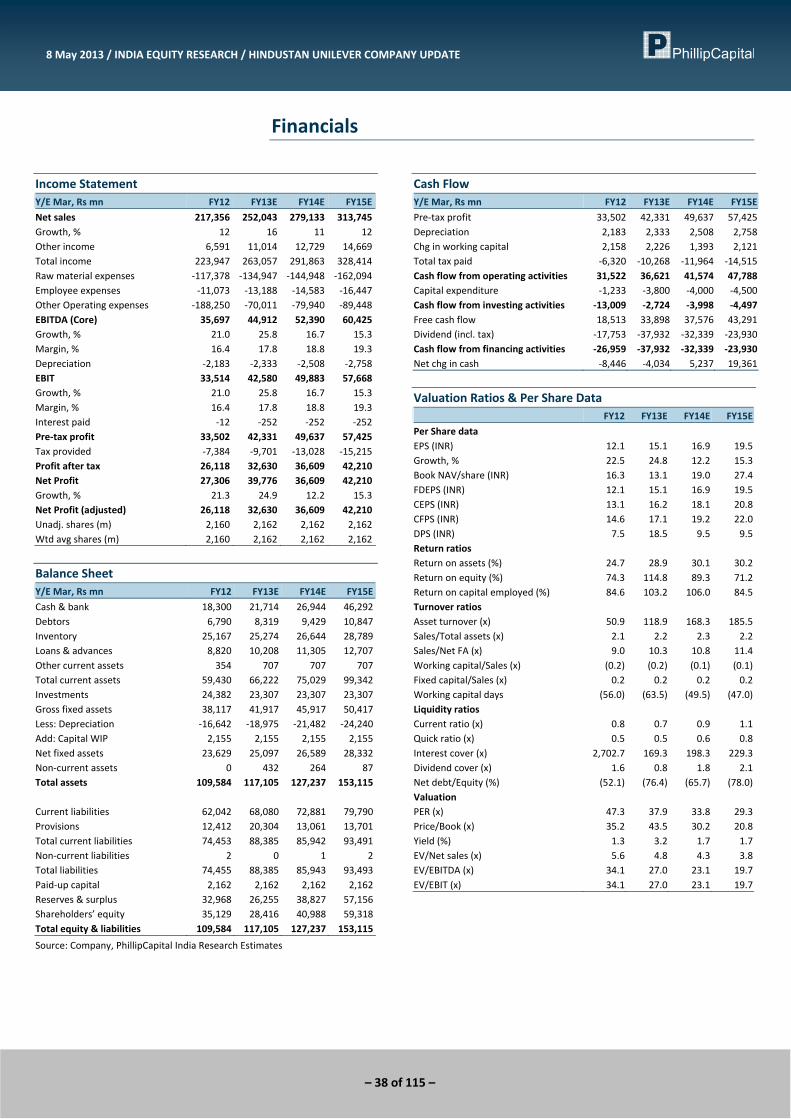
– 38 of 115 –
8 May 2013 / INDIA EQUITY RESEARCH / HINDUSTAN UNILEVER COMPANY UPDATE
Financials
Income Statement Y/E Mar, Rs mn FY12 FY13E FY14E FY15E
Net sales 217,356 252,043 279,133 313,745Growth, % 12 16 11 12Other income 6,591 11,014 12,729 14,669Total income 223,947 263,057 291,863 328,414Raw material expenses ‐117,378 ‐134,947 ‐144,948 ‐162,094Employee expenses ‐11,073 ‐13,188 ‐14,583 ‐16,447Other Operating expenses ‐188,250 ‐70,011 ‐79,940 ‐89,448EBITDA (Core) 35,697 44,912 52,390 60,425Growth, % 21.0 25.8 16.7 15.3Margin, % 16.4 17.8 18.8 19.3Depreciation ‐2,183 ‐2,333 ‐2,508 ‐2,758EBIT 33,514 42,580 49,883 57,668Growth, % 21.0 25.8 16.7 15.3Margin, % 16.4 17.8 18.8 19.3Interest paid ‐12 ‐252 ‐252 ‐252Pre‐tax profit 33,502 42,331 49,637 57,425Tax provided ‐7,384 ‐9,701 ‐13,028 ‐15,215Profit after tax 26,118 32,630 36,609 42,210Net Profit 27,306 39,776 36,609 42,210Growth, % 21.3 24.9 12.2 15.3Net Profit (adjusted) 26,118 32,630 36,609 42,210Unadj. shares (m) 2,160 2,162 2,162 2,162Wtd avg shares (m) 2,160 2,162 2,162 2,162
Balance Sheet Y/E Mar, Rs mn FY12 FY13E FY14E FY15E
Cash & bank 18,300 21,714 26,944 46,292Debtors 6,790 8,319 9,429 10,847Inventory 25,167 25,274 26,644 28,789Loans & advances 8,820 10,208 11,305 12,707Other current assets 354 707 707 707Total current assets 59,430 66,222 75,029 99,342Investments 24,382 23,307 23,307 23,307Gross fixed assets 38,117 41,917 45,917 50,417Less: Depreciation ‐16,642 ‐18,975 ‐21,482 ‐24,240Add: Capital WIP 2,155 2,155 2,155 2,155Net fixed assets 23,629 25,097 26,589 28,332Non‐current assets 0 432 264 87Total assets 109,584 117,105 127,237 153,115 Current liabilities 62,042 68,080 72,881 79,790Provisions 12,412 20,304 13,061 13,701Total current liabilities 74,453 88,385 85,942 93,491Non‐current liabilities 2 0 1 2Total liabilities 74,455 88,385 85,943 93,493Paid‐up capital 2,162 2,162 2,162 2,162Reserves & surplus 32,968 26,255 38,827 57,156Shareholders’ equity 35,129 28,416 40,988 59,318Total equity & liabilities 109,584 117,105 127,237 153,115
Source: Company, PhillipCapital India Research Estimates
Cash Flow Y/E Mar, Rs mn FY12 FY13E FY14E FY15E
Pre‐tax profit 33,502 42,331 49,637 57,425Depreciation 2,183 2,333 2,508 2,758Chg in working capital 2,158 2,226 1,393 2,121Total tax paid ‐6,320 ‐10,268 ‐11,964 ‐14,515Cash flow from operating activities 31,522 36,621 41,574 47,788Capital expenditure ‐1,233 ‐3,800 ‐4,000 ‐4,500Cash flow from investing activities ‐13,009 ‐2,724 ‐3,998 ‐4,497Free cash flow 18,513 33,898 37,576 43,291Dividend (incl. tax) ‐17,753 ‐37,932 ‐32,339 ‐23,930Cash flow from financing activities ‐26,959 ‐37,932 ‐32,339 ‐23,930Net chg in cash ‐8,446 ‐4,034 5,237 19,361
Valuation Ratios & Per Share Data FY12 FY13E FY14E FY15E
Per Share data EPS (INR) 12.1 15.1 16.9 19.5Growth, % 22.5 24.8 12.2 15.3Book NAV/share (INR) 16.3 13.1 19.0 27.4FDEPS (INR) 12.1 15.1 16.9 19.5CEPS (INR) 13.1 16.2 18.1 20.8CFPS (INR) 14.6 17.1 19.2 22.0DPS (INR) 7.5 18.5 9.5 9.5Return ratios Return on assets (%) 24.7 28.9 30.1 30.2Return on equity (%) 74.3 114.8 89.3 71.2Return on capital employed (%) 84.6 103.2 106.0 84.5Turnover ratios Asset turnover (x) 50.9 118.9 168.3 185.5Sales/Total assets (x) 2.1 2.2 2.3 2.2Sales/Net FA (x) 9.0 10.3 10.8 11.4Working capital/Sales (x) (0.2) (0.2) (0.1) (0.1)Fixed capital/Sales (x) 0.2 0.2 0.2 0.2Working capital days (56.0) (63.5) (49.5) (47.0)Liquidity ratios Current ratio (x) 0.8 0.7 0.9 1.1Quick ratio (x) 0.5 0.5 0.6 0.8Interest cover (x) 2,702.7 169.3 198.3 229.3Dividend cover (x) 1.6 0.8 1.8 2.1Net debt/Equity (%) (52.1) (76.4) (65.7) (78.0)Valuation PER (x) 47.3 37.9 33.8 29.3Price/Book (x) 35.2 43.5 30.2 20.8Yield (%) 1.3 3.2 1.7 1.7EV/Net sales (x) 5.6 4.8 4.3 3.8EV/EBITDA (x) 34.1 27.0 23.1 19.7EV/EBIT (x) 34.1 27.0 23.1 19.7
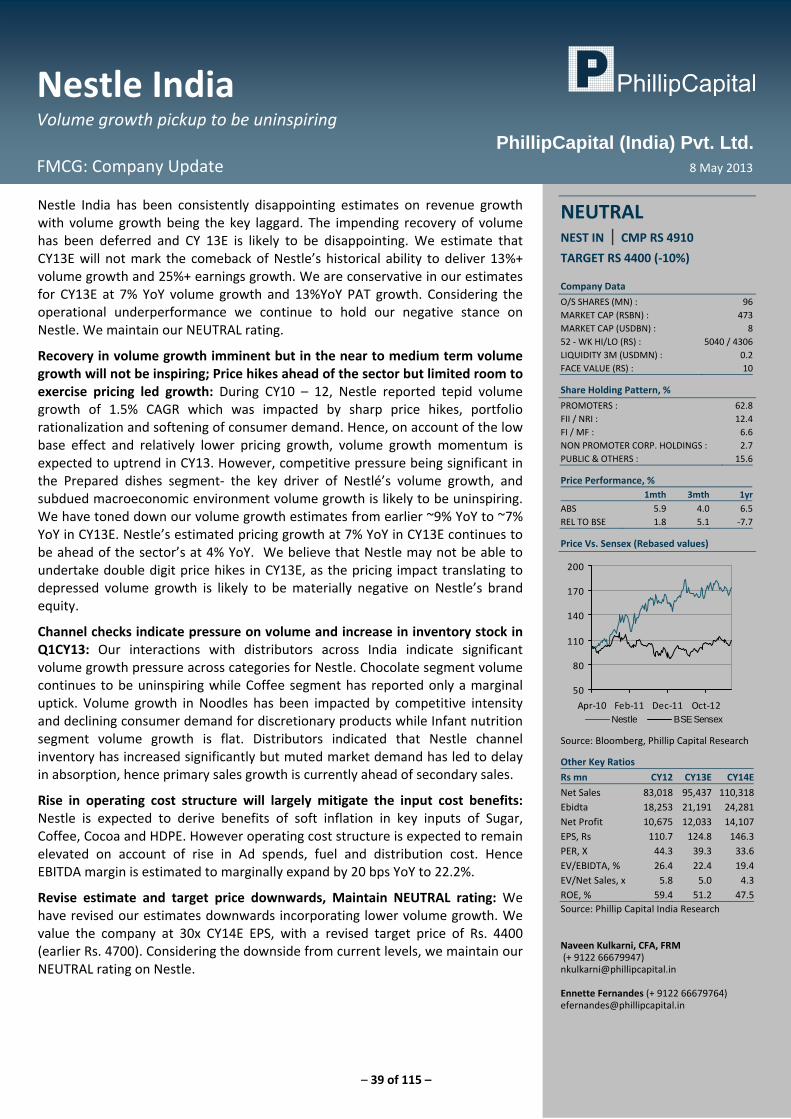
– 39 of 115 –
Nestle India Volume growth pickup to be uninspiring
FMCG: Company Update 8 May 2013
PhillipCapital (India) Pvt. Ltd.
Nestle India has been consistently disappointing estimates on revenue growth with volume growth being the key laggard. The impending recovery of volume has been deferred and CY 13E is likely to be disappointing. We estimate that CY13E will not mark the comeback of Nestle’s historical ability to deliver 13%+ volume growth and 25%+ earnings growth. We are conservative in our estimates for CY13E at 7% YoY volume growth and 13%YoY PAT growth. Considering the operational underperformance we continue to hold our negative stance on Nestle. We maintain our NEUTRAL rating.
Recovery in volume growth imminent but in the near to medium term volume growth will not be inspiring; Price hikes ahead of the sector but limited room to exercise pricing led growth: During CY10 – 12, Nestle reported tepid volume growth of 1.5% CAGR which was impacted by sharp price hikes, portfolio rationalization and softening of consumer demand. Hence, on account of the low base effect and relatively lower pricing growth, volume growth momentum is expected to uptrend in CY13. However, competitive pressure being significant in the Prepared dishes segment‐ the key driver of Nestlé’s volume growth, and subdued macroeconomic environment volume growth is likely to be uninspiring. We have toned down our volume growth estimates from earlier ~9% YoY to ~7% YoY in CY13E. Nestle’s estimated pricing growth at 7% YoY in CY13E continues to be ahead of the sector’s at 4% YoY. We believe that Nestle may not be able to undertake double digit price hikes in CY13E, as the pricing impact translating to depressed volume growth is likely to be materially negative on Nestle’s brand equity.
Channel checks indicate pressure on volume and increase in inventory stock in Q1CY13: Our interactions with distributors across India indicate significant volume growth pressure across categories for Nestle. Chocolate segment volume continues to be uninspiring while Coffee segment has reported only a marginal uptick. Volume growth in Noodles has been impacted by competitive intensity and declining consumer demand for discretionary products while Infant nutrition segment volume growth is flat. Distributors indicated that Nestle channel inventory has increased significantly but muted market demand has led to delay in absorption, hence primary sales growth is currently ahead of secondary sales.
Rise in operating cost structure will largely mitigate the input cost benefits: Nestle is expected to derive benefits of soft inflation in key inputs of Sugar, Coffee, Cocoa and HDPE. However operating cost structure is expected to remain elevated on account of rise in Ad spends, fuel and distribution cost. Hence EBITDA margin is estimated to marginally expand by 20 bps YoY to 22.2%.
Revise estimate and target price downwards, Maintain NEUTRAL rating: We have revised our estimates downwards incorporating lower volume growth. We value the company at 30x CY14E EPS, with a revised target price of Rs. 4400 (earlier Rs. 4700). Considering the downside from current levels, we maintain our NEUTRAL rating on Nestle.
NEUTRAL NEST IN | CMP RS 4910
TARGET RS 4400 (‐10%) Company Data
O/S SHARES (MN) : 96MARKET CAP (RSBN) : 473MARKET CAP (USDBN) : 852 ‐ WK HI/LO (RS) : 5040 / 4306LIQUIDITY 3M (USDMN) : 0.2FACE VALUE (RS) : 10
Share Holding Pattern, %
PROMOTERS : 62.8FII / NRI : 12.4FI / MF : 6.6NON PROMOTER CORP. HOLDINGS : 2.7PUBLIC & OTHERS : 15.6
Price Performance, % 1mth 3mth 1yr
ABS 5.9 4.0 6.5REL TO BSE 1.8 5.1 ‐7.7
Price Vs. Sensex (Rebased values)
50
80
110
140
170
200
Apr‐10 Feb‐11 Dec‐11 Oct‐12Nestle BSE Sensex
Source: Bloomberg, Phillip Capital Research
Other Key Ratios
Rs mn CY12 CY13E CY14E
Net Sales 83,018 95,437 110,318Ebidta 18,253 21,191 24,281Net Profit 10,675 12,033 14,107EPS, Rs 110.7 124.8 146.3PER, X 44.3 39.3 33.6EV/EBIDTA, % 26.4 22.4 19.4EV/Net Sales, x 5.8 5.0 4.3ROE, % 59.4 51.2 47.5Source: Phillip Capital India Research Naveen Kulkarni, CFA, FRM (+ 9122 66679947) [email protected] Ennette Fernandes (+ 9122 66679764) [email protected]

– 40 of 115 –
8 May 2013 / INDIA EQUITY RESEARCH / NESTLE INDIA COMPANY UPDATE
Fair Value Calculation We have valued Nestle based on a DCF based method which includes explicit medium term forecast for the next 8 years to CY2020E. We estimate the 8 year revenue CAGR of 14.5% as the company maintains aggressive stance in the high growth Processed Foods category while it will continue to reap benefits from near monopoly competitive position in Baby Foods. We estimate long‐term normalized EBITDA and PAT margins of 24% and 15% respectively. Medium‐term forecasts
Rs mn Sales 2012
CAGR (8 yrs)
Sales2020 E
EBIDTA mgn (%) (N)
EBIDTA(N)
EBIT mrgn (%) (N)
EBIT (N)
PAT(%) (N)
PAT (N)
Nestle India 83,018 14.5 245,607 23.8 58,423 20.9 51,355 14.6 35,895
Source: Company, PhillipCapital India Research Estimates
We have assigned an exit P/E multiple of 29x CY2020E, implying 2.8x and 11.7x on EV/Sales and EV/EBITDA respectively. Derivation of Enterprise value 2020 (excluding intermediate FCF)
Rs mn Sales 2020E
EBIDTA 2020 (N)
EBIT 2020 (N)
PAT 2020 (N)
EV/Sales 2020
EV/EBIDA 2020
EV/EBIT 2020
P/E 2020
EV (2020)
Nestle India 245,607 58,423 51,355 35,895 2.8 11.7 13 19.0 682,001
Source: Company, PhillipCapital India Research Estimates
We have discounted the cash flows at 11%, considering a risk free rate of 8% and market risk premium of 6%, implying a beta of 0.5 Medium‐Term cash flow generation Rs mn CY2012 CY2013 CY2014 CY2015 CY2016 CY2017 CY2018 CY2019 CY2020
EBIT 16,046 18,503 21,527 25,198 29,177 33,784 39,905 46,703 54,336NOPLAT 10,675 12,033 14,107 16,428 19,051 22,205 26,338 30,840 35,895Depreciation 2,840 3,167 3,605 4,082 4,597 5,153 5,749 6,387 7,067Capex 18,754 6,000 6,500 7,000 7,500 8,000 8,500 9,000 9,500FCF (5,239) 9,200 11,213 13,509 16,148 19,358 23,587 28,227 33,462% conversion (33) 49.7 52.1 53.6 55.3 57.3 59.1 60.4 61.6Discount factor 1.0 0.9 0.8 0.7 0.7 0.6 0.5 0.5 0.4PV (5,239) 8,288 9,100 9,878 10,637 11,488 12,611 13,596 14,520NPV (5,239) 3,050 12,150 22,028 32,665 44,153 56,764 70,359 84,880
Source: Company, PhillipCapital India Research Estimates
On the basis of our DCF valuation, the fair value of the company is computed at Rs 4412, implying a 10%+ downside from current levels, thereby supporting our NEUTRAL rating on the stock.
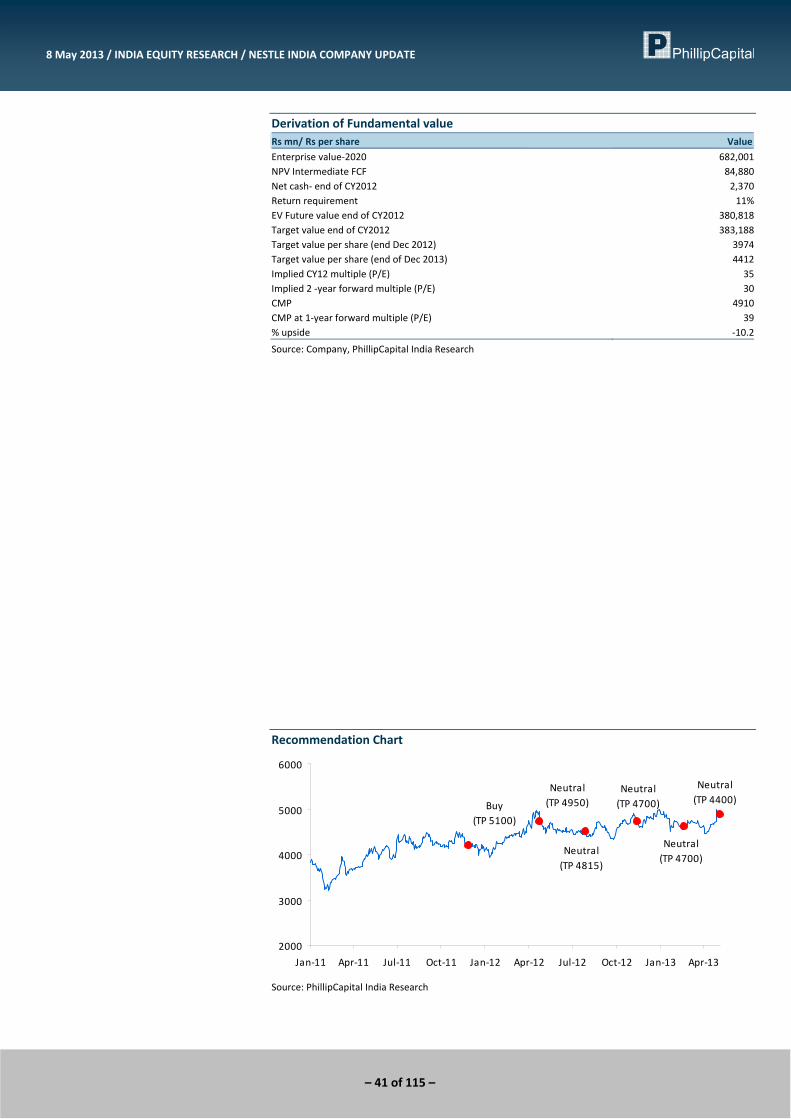
– 41 of 115 –
8 May 2013 / INDIA EQUITY RESEARCH / NESTLE INDIA COMPANY UPDATE
Derivation of Fundamental value Rs mn/ Rs per share Value
Enterprise value‐2020 682,001NPV Intermediate FCF 84,880Net cash‐ end of CY2012 2,370Return requirement 11%EV Future value end of CY2012 380,818Target value end of CY2012 383,188Target value per share (end Dec 2012) 3974Target value per share (end of Dec 2013) 4412Implied CY12 multiple (P/E) 35Implied 2 ‐year forward multiple (P/E) 30CMP 4910CMP at 1‐year forward multiple (P/E) 39% upside ‐10.2
Source: Company, PhillipCapital India Research
Recommendation Chart
Neutral(TP 4700)
Neutral (TP 4400)Buy
(TP 5100)
Neutral(TP 4950)
Neutral(TP 4815)
Neutral(TP 4700)
2000
3000
4000
5000
6000
Jan‐11 Apr‐11 Jul‐11 Oct‐11 Jan‐12 Apr‐12 Jul‐12 Oct‐12 Jan‐13 Apr‐13
Source: PhillipCapital India Research
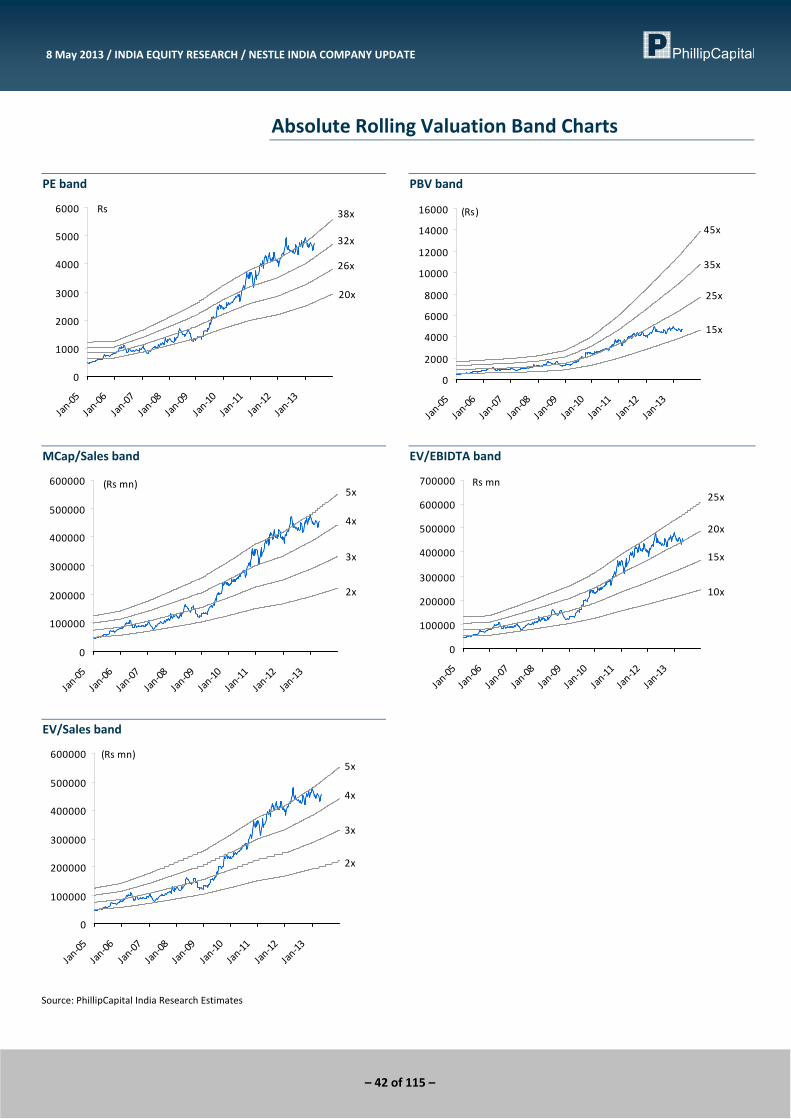
– 42 of 115 –
8 May 2013 / INDIA EQUITY RESEARCH / NESTLE INDIA COMPANY UPDATE
Absolute Rolling Valuation Band Charts
PE band
20x
26x
32x
38x
0
1000
2000
3000
4000
5000
6000
Jan‐05
Jan‐06
Jan‐07
Jan‐08
Jan‐09
Jan‐10
Jan‐11
Jan‐12
Jan‐13
Rs
PBV band
15x
25x
35x
45x
0
2000
4000
6000
8000
10000
12000
14000
16000
Jan‐05
Jan‐06
Jan‐07
Jan‐08
Jan‐09
Jan‐10
Jan‐11
Jan‐12
Jan‐13
(Rs)
MCap/Sales band
2x
3x
4x
5x
0
100000
200000
300000
400000
500000
600000
Jan‐05
Jan‐06
Jan‐07
Jan‐08
Jan‐09
Jan‐10
Jan‐11
Jan‐12
Jan‐13
(Rs mn)
EV/EBIDTA band
10x
15x
20x
25x
0
100000
200000
300000
400000
500000
600000
700000
Jan‐05
Jan‐06
Jan‐07
Jan‐08
Jan‐09
Jan‐10
Jan‐11
Jan‐12
Jan‐13
Rs mn
EV/Sales band
2x
3x
4x
5x
0
100000
200000
300000
400000
500000
600000
Jan‐05
Jan‐06
Jan‐07
Jan‐08
Jan‐09
Jan‐10
Jan‐11
Jan‐12
Jan‐13
(Rs mn)
Source: PhillipCapital India Research Estimates
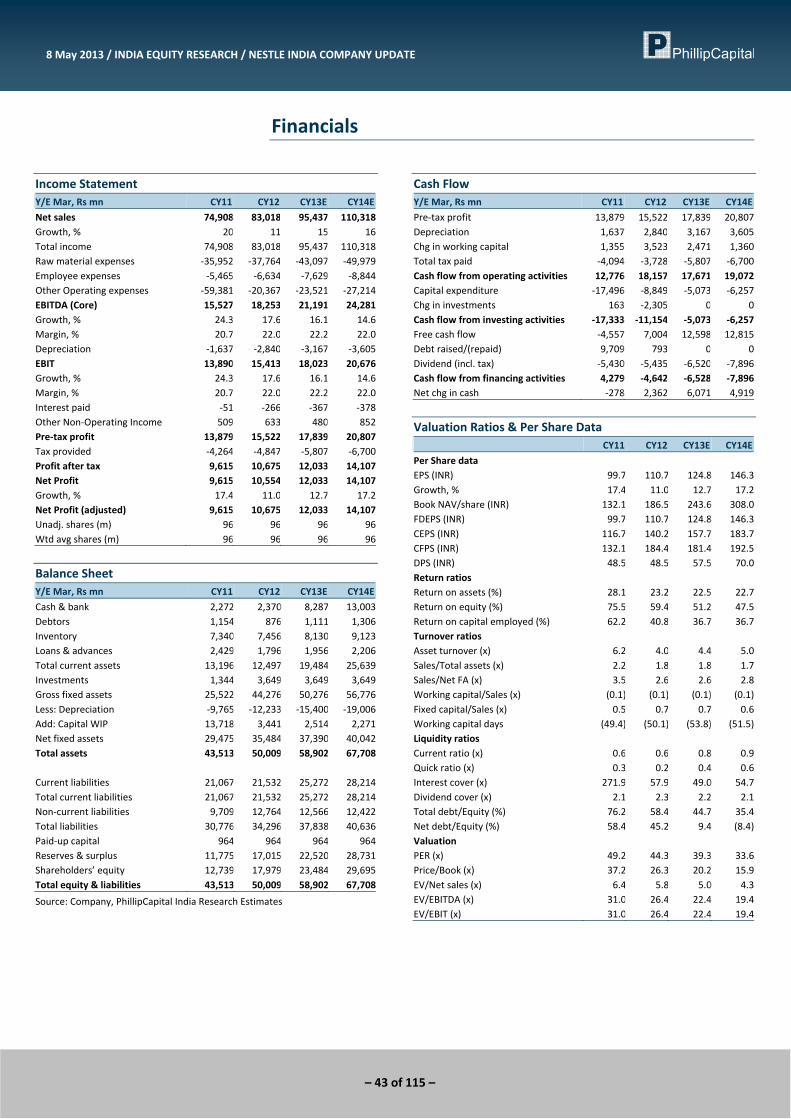
– 43 of 115 –
8 May 2013 / INDIA EQUITY RESEARCH / NESTLE INDIA COMPANY UPDATE
Financials
Income Statement Y/E Mar, Rs mn CY11 CY12 CY13E CY14E
Net sales 74,908 83,018 95,437 110,318Growth, % 20 11 15 16Total income 74,908 83,018 95,437 110,318Raw material expenses ‐35,952 ‐37,764 ‐43,097 ‐49,979Employee expenses ‐5,465 ‐6,634 ‐7,629 ‐8,844Other Operating expenses ‐59,381 ‐20,367 ‐23,521 ‐27,214EBITDA (Core) 15,527 18,253 21,191 24,281Growth, % 24.3 17.6 16.1 14.6Margin, % 20.7 22.0 22.2 22.0Depreciation ‐1,637 ‐2,840 ‐3,167 ‐3,605EBIT 13,890 15,413 18,023 20,676Growth, % 24.3 17.6 16.1 14.6Margin, % 20.7 22.0 22.2 22.0Interest paid ‐51 ‐266 ‐367 ‐378Other Non‐Operating Income 509 633 480 852Pre‐tax profit 13,879 15,522 17,839 20,807Tax provided ‐4,264 ‐4,847 ‐5,807 ‐6,700Profit after tax 9,615 10,675 12,033 14,107Net Profit 9,615 10,554 12,033 14,107Growth, % 17.4 11.0 12.7 17.2Net Profit (adjusted) 9,615 10,675 12,033 14,107Unadj. shares (m) 96 96 96 96Wtd avg shares (m) 96 96 96 96
Balance Sheet Y/E Mar, Rs mn CY11 CY12 CY13E CY14E
Cash & bank 2,272 2,370 8,287 13,003Debtors 1,154 876 1,111 1,306Inventory 7,340 7,456 8,130 9,123Loans & advances 2,429 1,796 1,956 2,206Total current assets 13,196 12,497 19,484 25,639Investments 1,344 3,649 3,649 3,649Gross fixed assets 25,522 44,276 50,276 56,776Less: Depreciation ‐9,765 ‐12,233 ‐15,400 ‐19,006Add: Capital WIP 13,718 3,441 2,514 2,271Net fixed assets 29,475 35,484 37,390 40,042Total assets 43,513 50,009 58,902 67,708 Current liabilities 21,067 21,532 25,272 28,214Total current liabilities 21,067 21,532 25,272 28,214Non‐current liabilities 9,709 12,764 12,566 12,422Total liabilities 30,776 34,296 37,838 40,636Paid‐up capital 964 964 964 964Reserves & surplus 11,775 17,015 22,520 28,731Shareholders’ equity 12,739 17,979 23,484 29,695Total equity & liabilities 43,513 50,009 58,902 67,708
Source: Company, PhillipCapital India Research Estimates
Cash Flow Y/E Mar, Rs mn CY11 CY12 CY13E CY14E
Pre‐tax profit 13,879 15,522 17,839 20,807Depreciation 1,637 2,840 3,167 3,605Chg in working capital 1,355 3,523 2,471 1,360Total tax paid ‐4,094 ‐3,728 ‐5,807 ‐6,700Cash flow from operating activities 12,776 18,157 17,671 19,072Capital expenditure ‐17,496 ‐8,849 ‐5,073 ‐6,257Chg in investments 163 ‐2,305 0 0Cash flow from investing activities ‐17,333 ‐11,154 ‐5,073 ‐6,257Free cash flow ‐4,557 7,004 12,598 12,815Debt raised/(repaid) 9,709 793 0 0Dividend (incl. tax) ‐5,430 ‐5,435 ‐6,520 ‐7,896Cash flow from financing activities 4,279 ‐4,642 ‐6,528 ‐7,896Net chg in cash ‐278 2,362 6,071 4,919
Valuation Ratios & Per Share Data CY11 CY12 CY13E CY14E
Per Share data EPS (INR) 99.7 110.7 124.8 146.3Growth, % 17.4 11.0 12.7 17.2Book NAV/share (INR) 132.1 186.5 243.6 308.0FDEPS (INR) 99.7 110.7 124.8 146.3CEPS (INR) 116.7 140.2 157.7 183.7CFPS (INR) 132.1 184.4 181.4 192.5DPS (INR) 48.5 48.5 57.5 70.0Return ratios Return on assets (%) 28.1 23.2 22.5 22.7Return on equity (%) 75.5 59.4 51.2 47.5Return on capital employed (%) 62.2 40.8 36.7 36.7Turnover ratios Asset turnover (x) 6.2 4.0 4.4 5.0Sales/Total assets (x) 2.2 1.8 1.8 1.7Sales/Net FA (x) 3.5 2.6 2.6 2.8Working capital/Sales (x) (0.1) (0.1) (0.1) (0.1)Fixed capital/Sales (x) 0.5 0.7 0.7 0.6Working capital days (49.4) (50.1) (53.8) (51.5)Liquidity ratios Current ratio (x) 0.6 0.6 0.8 0.9Quick ratio (x) 0.3 0.2 0.4 0.6Interest cover (x) 271.9 57.9 49.0 54.7Dividend cover (x) 2.1 2.3 2.2 2.1Total debt/Equity (%) 76.2 58.4 44.7 35.4Net debt/Equity (%) 58.4 45.2 9.4 (8.4)Valuation PER (x) 49.2 44.3 39.3 33.6Price/Book (x) 37.2 26.3 20.2 15.9EV/Net sales (x) 6.4 5.8 5.0 4.3EV/EBITDA (x) 31.0 26.4 22.4 19.4EV/EBIT (x) 31.0 26.4 22.4 19.4
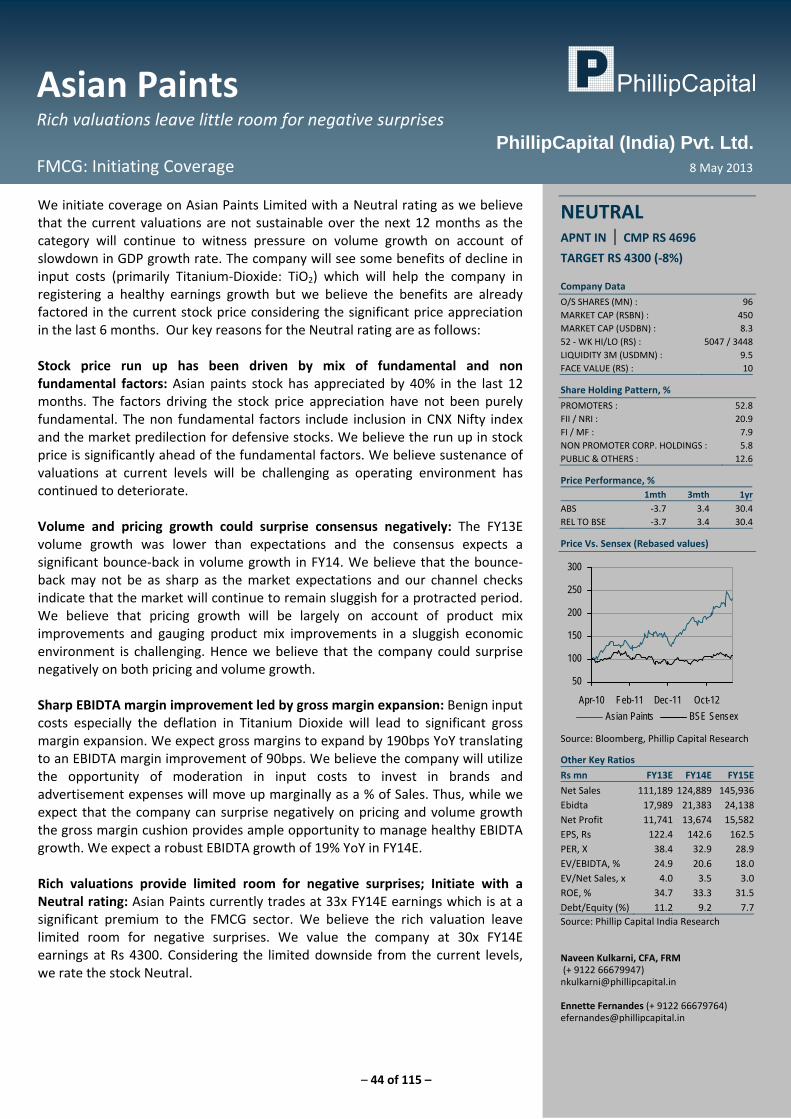
– 44 of 115 –
Asian Paints Rich valuations leave little room for negative surprises
FMCG: Initiating Coverage 8 May 2013
PhillipCapital (India) Pvt. Ltd.
We initiate coverage on Asian Paints Limited with a Neutral rating as we believe that the current valuations are not sustainable over the next 12 months as the category will continue to witness pressure on volume growth on account of slowdown in GDP growth rate. The company will see some benefits of decline in input costs (primarily Titanium‐Dioxide: TiO2) which will help the company in registering a healthy earnings growth but we believe the benefits are already factored in the current stock price considering the significant price appreciation in the last 6 months. Our key reasons for the Neutral rating are as follows: Stock price run up has been driven by mix of fundamental and non fundamental factors: Asian paints stock has appreciated by 40% in the last 12 months. The factors driving the stock price appreciation have not been purely fundamental. The non fundamental factors include inclusion in CNX Nifty index and the market predilection for defensive stocks. We believe the run up in stock price is significantly ahead of the fundamental factors. We believe sustenance of valuations at current levels will be challenging as operating environment has continued to deteriorate. Volume and pricing growth could surprise consensus negatively: The FY13E volume growth was lower than expectations and the consensus expects a significant bounce‐back in volume growth in FY14. We believe that the bounce‐back may not be as sharp as the market expectations and our channel checks indicate that the market will continue to remain sluggish for a protracted period. We believe that pricing growth will be largely on account of product mix improvements and gauging product mix improvements in a sluggish economic environment is challenging. Hence we believe that the company could surprise negatively on both pricing and volume growth. Sharp EBIDTA margin improvement led by gross margin expansion: Benign input costs especially the deflation in Titanium Dioxide will lead to significant gross margin expansion. We expect gross margins to expand by 190bps YoY translating to an EBIDTA margin improvement of 90bps. We believe the company will utilize the opportunity of moderation in input costs to invest in brands and advertisement expenses will move up marginally as a % of Sales. Thus, while we expect that the company can surprise negatively on pricing and volume growth the gross margin cushion provides ample opportunity to manage healthy EBIDTA growth. We expect a robust EBIDTA growth of 19% YoY in FY14E. Rich valuations provide limited room for negative surprises; Initiate with a Neutral rating: Asian Paints currently trades at 33x FY14E earnings which is at a significant premium to the FMCG sector. We believe the rich valuation leave limited room for negative surprises. We value the company at 30x FY14E earnings at Rs 4300. Considering the limited downside from the current levels, we rate the stock Neutral.
NEUTRAL APNT IN | CMP RS 4696
TARGET RS 4300 (‐8%) Company Data
O/S SHARES (MN) : 96MARKET CAP (RSBN) : 450MARKET CAP (USDBN) : 8.352 ‐ WK HI/LO (RS) : 5047 / 3448LIQUIDITY 3M (USDMN) : 9.5FACE VALUE (RS) : 10
Share Holding Pattern, %
PROMOTERS : 52.8FII / NRI : 20.9FI / MF : 7.9NON PROMOTER CORP. HOLDINGS : 5.8PUBLIC & OTHERS : 12.6
Price Performance, % 1mth 3mth 1yr
ABS ‐3.7 3.4 30.4REL TO BSE ‐3.7 3.4 30.4
Price Vs. Sensex (Rebased values)
50
100
150
200
250
300
Apr-10 Feb-11 Dec-11 Oct-12Asian Paints BSE Sensex
Source: Bloomberg, Phillip Capital Research
Other Key Ratios
Rs mn FY13E FY14E FY15E
Net Sales 111,189 124,889 145,936Ebidta 17,989 21,383 24,138Net Profit 11,741 13,674 15,582EPS, Rs 122.4 142.6 162.5PER, X 38.4 32.9 28.9EV/EBIDTA, % 24.9 20.6 18.0EV/Net Sales, x 4.0 3.5 3.0ROE, % 34.7 33.3 31.5Debt/Equity (%) 11.2 9.2 7.7Source: Phillip Capital India Research Naveen Kulkarni, CFA, FRM (+ 9122 66679947) [email protected] Ennette Fernandes (+ 9122 66679764) [email protected]

– 45 of 115 –
8 May 2013 / INDIA EQUITY RESEARCH / ASIAN PAINTS INITIATING COVERAGE
About the company Asian Paints is the largest paints company in India and Asia’s third largest paints company with a market share of 54% in the organized paints sector of India. The company was founded in 1942 and has been the market leader since 1968. Asian Paints manufactures a wide range of paints for decorative and industrial use. In Decorative paints, Asian Paints is present in all the four segments v.i.z Interior Wall Finishes, Exterior Wall Finishes, Enamels and Wood Finishes. It also introduced many innovative concepts in the Indian paint industry like Colour Worlds (Dealer Tinting Systems), Home Solutions (painting solutions Service), Kids World (painting solutions for kid’s room), Colour Next (Prediction of Colour Trends through in‐depth research) and Royale Play Special Effect Paints. The company has more than 5000 employees across 17 countries. Asian Paints group operates in 17 countries across the world and is the largest paint company in eleven countries. The group operates in five regions across the world viz. South Asia, South East Asia, South Pacific, Middle East and Caribbean region through the five corporate brands viz. Asian Paints, Berger International, SCIB Paints, Apco Coatings and Taubmans. The company has 24 paint manufacturing facilities, servicing consumers in 65 countries through Berger International, SCIB Paints‐Egypt, Asian Paints, Apco Coatings and Taubmans. Asian Paints operates in 5 regions across the world viz. South Asia, South East Asia, South Pacific, Middle East and Caribbean region through the five corporate brands viz. Asian Paints, Berger International, SCIB Paints, Apco Coatings and Taubmans. In 7 markets, it operates through its subsidiary, Berger International Limited; in Egypt through SCIB Paints; in 5 markets in the South Pacific it operates through Apco Coatings and in Fiji and Samoa it also operates through Taubmans.
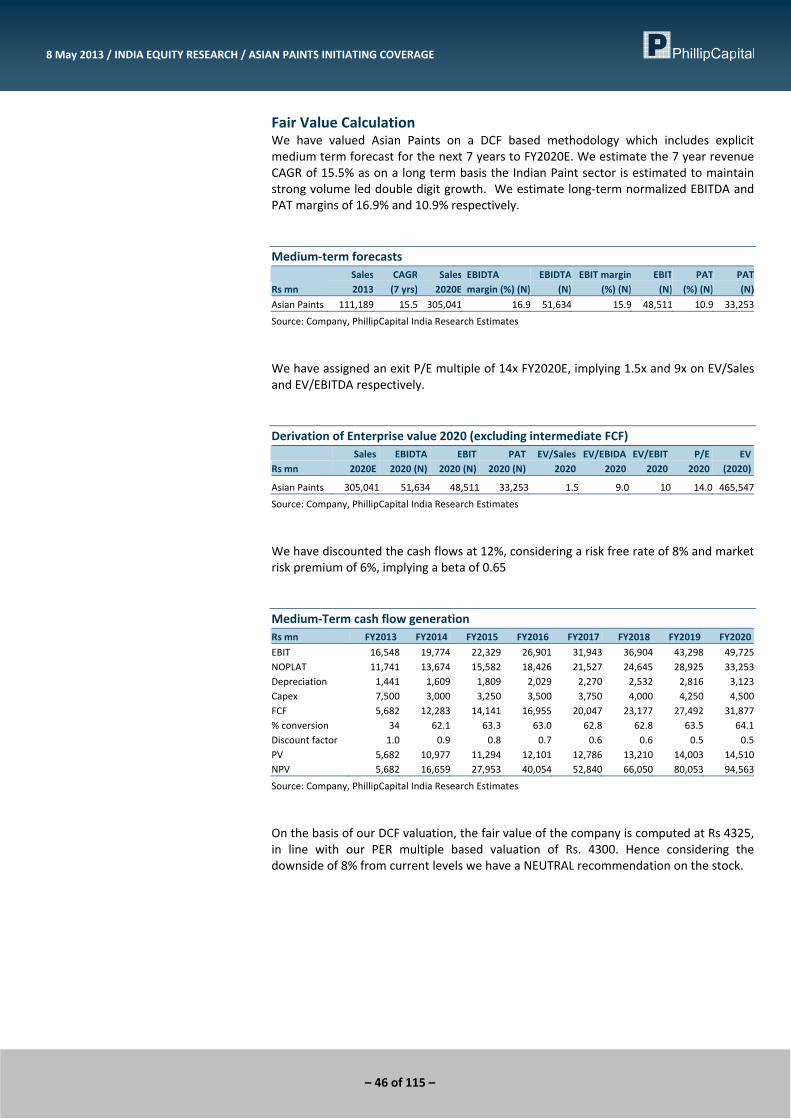
– 46 of 115 –
8 May 2013 / INDIA EQUITY RESEARCH / ASIAN PAINTS INITIATING COVERAGE
Fair Value Calculation We have valued Asian Paints on a DCF based methodology which includes explicit medium term forecast for the next 7 years to FY2020E. We estimate the 7 year revenue CAGR of 15.5% as on a long term basis the Indian Paint sector is estimated to maintain strong volume led double digit growth. We estimate long‐term normalized EBITDA and PAT margins of 16.9% and 10.9% respectively. Medium‐term forecasts
Rs mn Sales 2013
CAGR (7 yrs)
Sales 2020E
EBIDTA margin (%) (N)
EBIDTA (N)
EBIT margin (%) (N)
EBIT(N)
PAT (%) (N)
PAT (N)
Asian Paints 111,189 15.5 305,041 16.9 51,634 15.9 48,511 10.9 33,253
Source: Company, PhillipCapital India Research Estimates
We have assigned an exit P/E multiple of 14x FY2020E, implying 1.5x and 9x on EV/Sales and EV/EBITDA respectively. Derivation of Enterprise value 2020 (excluding intermediate FCF)
Rs mn Sales 2020E
EBIDTA 2020 (N)
EBIT 2020 (N)
PAT 2020 (N)
EV/Sales 2020
EV/EBIDA 2020
EV/EBIT 2020
P/E 2020
EV (2020)
Asian Paints 305,041 51,634 48,511 33,253 1.5 9.0 10 14.0 465,547
Source: Company, PhillipCapital India Research Estimates
We have discounted the cash flows at 12%, considering a risk free rate of 8% and market risk premium of 6%, implying a beta of 0.65 Medium‐Term cash flow generation Rs mn FY2013 FY2014 FY2015 FY2016 FY2017 FY2018 FY2019 FY2020
EBIT 16,548 19,774 22,329 26,901 31,943 36,904 43,298 49,725NOPLAT 11,741 13,674 15,582 18,426 21,527 24,645 28,925 33,253Depreciation 1,441 1,609 1,809 2,029 2,270 2,532 2,816 3,123Capex 7,500 3,000 3,250 3,500 3,750 4,000 4,250 4,500FCF 5,682 12,283 14,141 16,955 20,047 23,177 27,492 31,877% conversion 34 62.1 63.3 63.0 62.8 62.8 63.5 64.1Discount factor 1.0 0.9 0.8 0.7 0.6 0.6 0.5 0.5PV 5,682 10,977 11,294 12,101 12,786 13,210 14,003 14,510NPV 5,682 16,659 27,953 40,054 52,840 66,050 80,053 94,563
Source: Company, PhillipCapital India Research Estimates
On the basis of our DCF valuation, the fair value of the company is computed at Rs 4325, in line with our PER multiple based valuation of Rs. 4300. Hence considering the downside of 8% from current levels we have a NEUTRAL recommendation on the stock.
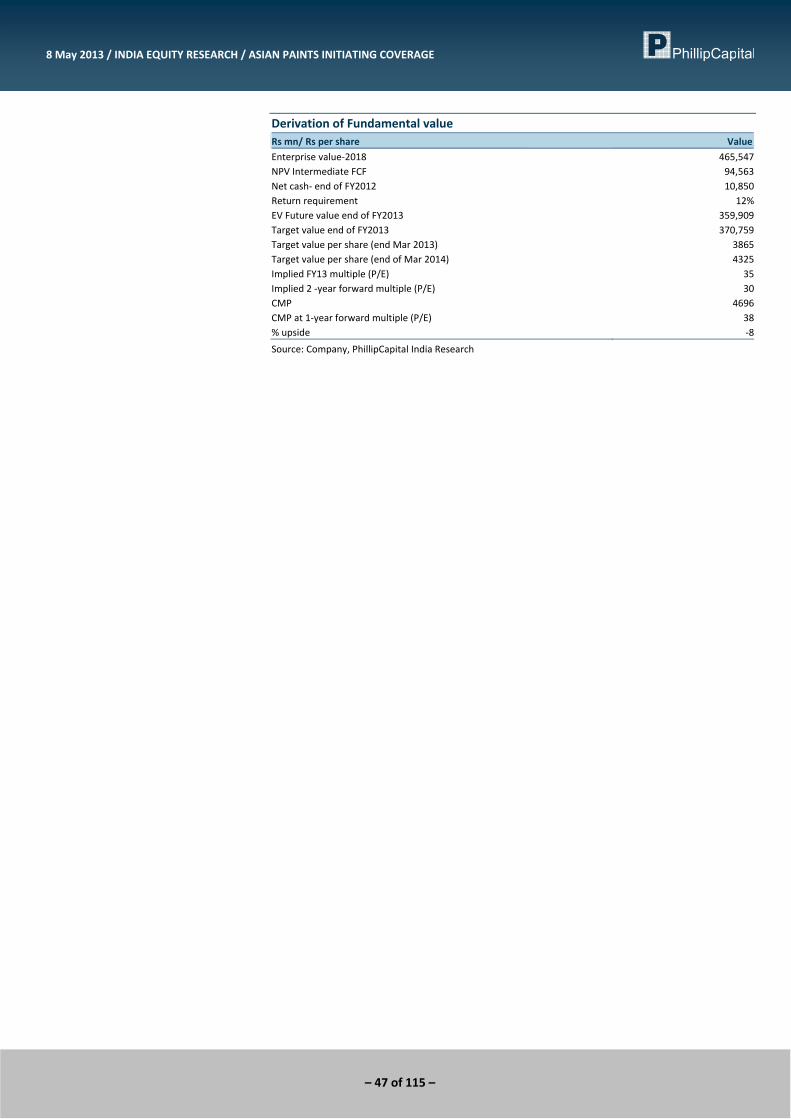
– 47 of 115 –
8 May 2013 / INDIA EQUITY RESEARCH / ASIAN PAINTS INITIATING COVERAGE
Derivation of Fundamental value Rs mn/ Rs per share Value
Enterprise value‐2018 465,547 NPV Intermediate FCF 94,563 Net cash‐ end of FY2012 10,850 Return requirement 12%EV Future value end of FY2013 359,909 Target value end of FY2013 370,759 Target value per share (end Mar 2013) 3865Target value per share (end of Mar 2014) 4325Implied FY13 multiple (P/E) 35Implied 2 ‐year forward multiple (P/E) 30CMP 4696CMP at 1‐year forward multiple (P/E) 38% upside ‐8
Source: Company, PhillipCapital India Research
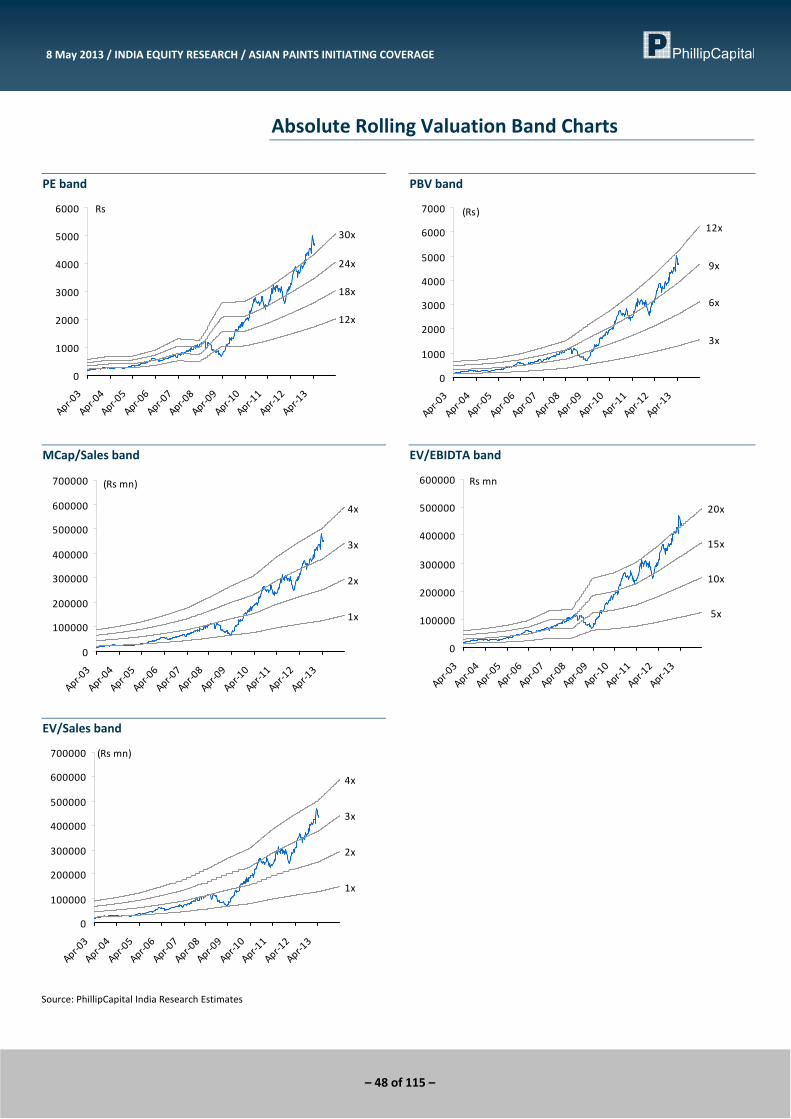
– 48 of 115 –
8 May 2013 / INDIA EQUITY RESEARCH / ASIAN PAINTS INITIATING COVERAGE
Absolute Rolling Valuation Band Charts
PE band
12x
18x
24x
30x
0
1000
2000
3000
4000
5000
6000
Apr‐03
Apr‐04
Apr‐05
Apr‐06
Apr‐07
Apr‐08
Apr‐09
Apr‐10
Apr‐11
Apr‐12
Apr‐13
Rs
PBV band
3x
6x
9x
12x
0
1000
2000
3000
4000
5000
6000
7000
Apr‐03
Apr‐04
Apr‐05
Apr‐06
Apr‐07
Apr‐08
Apr‐09
Apr‐10
Apr‐11
Apr‐12
Apr‐13
(Rs)
MCap/Sales band
1x
2x
3x
4x
0
100000
200000
300000
400000
500000
600000
700000
Apr‐03
Apr‐04
Apr‐05
Apr‐06
Apr‐07
Apr‐08
Apr‐09
Apr‐10
Apr‐11
Apr‐12
Apr‐13
(Rs mn)
EV/EBIDTA band
5x
10x
15x
20x
0
100000
200000
300000
400000
500000
600000
Apr‐03
Apr‐04
Apr‐05
Apr‐06
Apr‐07
Apr‐08
Apr‐09
Apr‐10
Apr‐11
Apr‐12
Apr‐13
Rs mn
EV/Sales band
1x
2x
3x
4x
0
100000
200000
300000
400000
500000
600000
700000
Apr‐03
Apr‐04
Apr‐05
Apr‐06
Apr‐07
Apr‐08
Apr‐09
Apr‐10
Apr‐11
Apr‐12
Apr‐13
(Rs mn)
Source: PhillipCapital India Research Estimates

– 49 of 115 –
8 May 2013 / INDIA EQUITY RESEARCH / ASIAN PAINTS INITIATING COVERAGE
Financials
Income Statement Y/E Mar, Rs mn FY12 FY13E FY14E FY15E
Net sales 95,983 111,189 124,889 145,936Growth, % 25 16 12 17Other income 339 560 638 721Total income 96,322 111,748 125,527 146,657Raw material expenses ‐57,770 ‐65,865 ‐72,148 ‐85,235Employee expenses ‐5,260 ‐6,212 ‐7,057 ‐8,244Other Operating expenses ‐18,205 ‐21,682 ‐24,939 ‐29,040EBITDA (Core) 15,088 17,989 21,383 24,138Growth, % 13.6 19.2 18.9 12.9Margin, % 15.7 16.2 17.1 16.5Depreciation ‐1,211 ‐1,441 ‐1,609 ‐1,809EBIT 13,877 16,548 19,774 22,329Growth, % 13.6 19.2 18.9 12.9Margin, % 15.7 16.2 17.1 16.5Interest paid ‐410 ‐389 ‐427 ‐433Other Non‐Operating Income 1,074 1,201 1,583 1,839Pre‐tax profit 14,541 17,360 20,930 23,735Tax provided ‐4,335 ‐5,130 ‐6,561 ‐7,239Profit after tax 10,206 12,230 14,368 16,496Others (Minorities, Associates) ‐319 ‐489 ‐694 ‐914Net Profit 9,888 11,741 13,674 15,582Growth, % 17.4 18.7 16.5 14.0Net Profit (adjusted) 9,888 11,741 13,674 15,582Unadj. shares (m) 96 96 96 96Wtd avg shares (m) 96 96 96 96
Balance Sheet Y/E Mar, Rs mn FY12 FY13E FY14E FY15E
Cash & bank 2,283 7,139 13,594 20,779Debtors 7,828 9,231 9,930 11,661Inventory 15,989 18,297 18,469 24,032Loans & advances 5,337 4,448 4,996 5,692Other current assets 842 842 842 842Total current assets 32,279 39,957 47,831 63,005Investments 7,507 7,507 7,507 7,507Gross fixed assets 21,042 28,542 31,542 34,792Less: Depreciation ‐8,453 ‐9,779 ‐11,388 ‐13,197Add: Capital WIP 6,171 714 789 870Net fixed assets 18,760 19,476 20,943 22,465Non‐current assets 415 430 415 415Total assets 58,033 67,371 76,695 93,392 Current liabilities 25,378 28,384 29,680 37,042Total current liabilities 25,378 28,384 29,680 37,042Non‐current liabilities 3,797 3,797 4,550 5,544Total liabilities 29,174 32,181 34,229 42,586Paid‐up capital 959 959 959 959Reserves & surplus 26,526 32,863 40,138 48,477Shareholders’ equity 28,852 35,190 42,466 50,806Total equity & liabilities 58,026 67,371 76,695 93,392
Source: Company, PhillipCapital India Research Estimates
Cash Flow Y/E Mar, Rs mn FY12 FY13E FY14E FY15E
Pre‐tax profit 14,541 17,360 20,930 23,735Depreciation 1,211 1,441 1,609 1,809Chg in working capital ‐2,347 162 645 367Total tax paid ‐4,259 ‐6,058 ‐6,561 ‐7,239Other operating activities 2,773 0 0 0Cash flow from operating activities 11,920 12,905 16,622 18,672Capital expenditure ‐6,811 ‐2,157 ‐3,075 ‐3,331Chg in investments 1,713 0 0 0Cash flow from investing activities ‐5,099 ‐2,157 ‐3,075 ‐3,331Free cash flow 6,821 10,748 13,547 15,341Equity raised/(repaid) ‐1,389 ‐2,442 ‐3,779 ‐5,553Debt raised/(repaid) 1,224 0 0 0Dividend (incl. tax) ‐4,459 ‐5,457 ‐6,400 ‐7,243Cash flow from financing activities ‐4,675 ‐8,387 ‐10,871 ‐13,708Net chg in cash 2,147 2,361 2,676 1,632
Valuation Ratios & Per Share Data FY12 FY13E FY14E FY15E
Per Share data EPS (INR) 103.1 122.4 142.6 162.5Growth, % 17.4 18.7 16.5 14.0Book NAV/share (INR) 286.5 352.6 428.4 515.4FDEPS (INR) 103.1 122.4 142.6 162.5CEPS (INR) 115.7 137.4 159.3 181.3CFPS (INR) 84.6 122.2 148.8 165.1DPS (INR) 40.0 49.0 57.0 65.0Return ratios Return on assets (%) 20.3 19.9 20.3 19.7Return on equity (%) 36.0 34.7 33.3 31.5Return on capital employed (%) 36.0 34.8 34.3 33.3Turnover ratios Asset turnover (x) 4.9 4.7 5.1 5.8Sales/Total assets (x) 1.9 1.8 1.7 1.7Sales/Net FA (x) 6.0 5.8 6.2 6.7Working capital/Sales (x) 0.0 0.0 0.0 0.0Working capital days 17.6 14.6 13.3 13.0Liquidity ratios Current ratio (x) 1.3 1.4 1.6 1.7Quick ratio (x) 0.6 0.8 1.0 1.1Interest cover (x) 33.9 42.5 46.3 51.6Dividend cover (x) 2.6 2.5 2.5 2.5Total debt/Equity (%) 13.8 11.2 9.2 7.7Net debt/Equity (%) 5.5 (9.9) (23.8) (34.4)Valuation PER (x) 45.6 38.4 32.9 28.9Price/Book (x) 16.4 13.3 11.0 9.1Yield (%) 0.9 1.0 1.2 1.4EV/Net sales (x) 4.7 4.0 3.5 3.0EV/EBITDA (x) 30.0 24.9 20.6 18.0EV/EBIT (x) 30.0 24.9 20.6 18.0
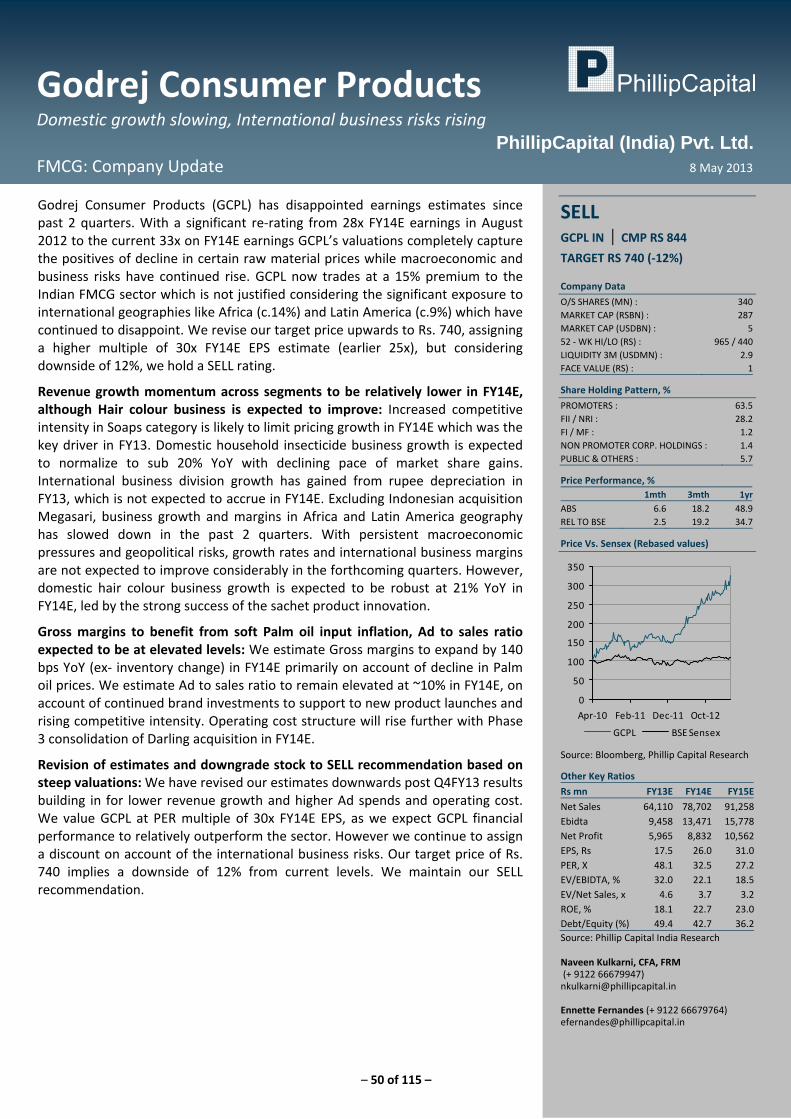
– 50 of 115 –
Godrej Consumer Products Domestic growth slowing, International business risks rising
FMCG: Company Update 8 May 2013
PhillipCapital (India) Pvt. Ltd.
Godrej Consumer Products (GCPL) has disappointed earnings estimates since past 2 quarters. With a significant re‐rating from 28x FY14E earnings in August 2012 to the current 33x on FY14E earnings GCPL’s valuations completely capture the positives of decline in certain raw material prices while macroeconomic and business risks have continued rise. GCPL now trades at a 15% premium to the Indian FMCG sector which is not justified considering the significant exposure to international geographies like Africa (c.14%) and Latin America (c.9%) which have continued to disappoint. We revise our target price upwards to Rs. 740, assigning a higher multiple of 30x FY14E EPS estimate (earlier 25x), but considering downside of 12%, we hold a SELL rating.
Revenue growth momentum across segments to be relatively lower in FY14E, although Hair colour business is expected to improve: Increased competitive intensity in Soaps category is likely to limit pricing growth in FY14E which was the key driver in FY13. Domestic household insecticide business growth is expected to normalize to sub 20% YoY with declining pace of market share gains. International business division growth has gained from rupee depreciation in FY13, which is not expected to accrue in FY14E. Excluding Indonesian acquisition Megasari, business growth and margins in Africa and Latin America geography has slowed down in the past 2 quarters. With persistent macroeconomic pressures and geopolitical risks, growth rates and international business margins are not expected to improve considerably in the forthcoming quarters. However, domestic hair colour business growth is expected to be robust at 21% YoY in FY14E, led by the strong success of the sachet product innovation.
Gross margins to benefit from soft Palm oil input inflation, Ad to sales ratio expected to be at elevated levels: We estimate Gross margins to expand by 140 bps YoY (ex‐ inventory change) in FY14E primarily on account of decline in Palm oil prices. We estimate Ad to sales ratio to remain elevated at ~10% in FY14E, on account of continued brand investments to support to new product launches and rising competitive intensity. Operating cost structure will rise further with Phase 3 consolidation of Darling acquisition in FY14E.
Revision of estimates and downgrade stock to SELL recommendation based on steep valuations: We have revised our estimates downwards post Q4FY13 results building in for lower revenue growth and higher Ad spends and operating cost. We value GCPL at PER multiple of 30x FY14E EPS, as we expect GCPL financial performance to relatively outperform the sector. However we continue to assign a discount on account of the international business risks. Our target price of Rs. 740 implies a downside of 12% from current levels. We maintain our SELL recommendation.
SELL GCPL IN | CMP RS 844
TARGET RS 740 (‐12%) Company Data
O/S SHARES (MN) : 340MARKET CAP (RSBN) : 287MARKET CAP (USDBN) : 552 ‐ WK HI/LO (RS) : 965 / 440LIQUIDITY 3M (USDMN) : 2.9FACE VALUE (RS) : 1
Share Holding Pattern, %
PROMOTERS : 63.5FII / NRI : 28.2FI / MF : 1.2NON PROMOTER CORP. HOLDINGS : 1.4PUBLIC & OTHERS : 5.7
Price Performance, % 1mth 3mth 1yr
ABS 6.6 18.2 48.9REL TO BSE 2.5 19.2 34.7
Price Vs. Sensex (Rebased values)
0
50
100
150
200
250
300
350
Apr‐10 Feb‐11 Dec‐11 Oct‐12
GCPL BSE Sensex
Source: Bloomberg, Phillip Capital Research
Other Key Ratios
Rs mn FY13E FY14E FY15E
Net Sales 64,110 78,702 91,258Ebidta 9,458 13,471 15,778Net Profit 5,965 8,832 10,562EPS, Rs 17.5 26.0 31.0PER, X 48.1 32.5 27.2EV/EBIDTA, % 32.0 22.1 18.5EV/Net Sales, x 4.6 3.7 3.2ROE, % 18.1 22.7 23.0Debt/Equity (%) 49.4 42.7 36.2Source: Phillip Capital India Research Naveen Kulkarni, CFA, FRM (+ 9122 66679947) [email protected] Ennette Fernandes (+ 9122 66679764) [email protected]
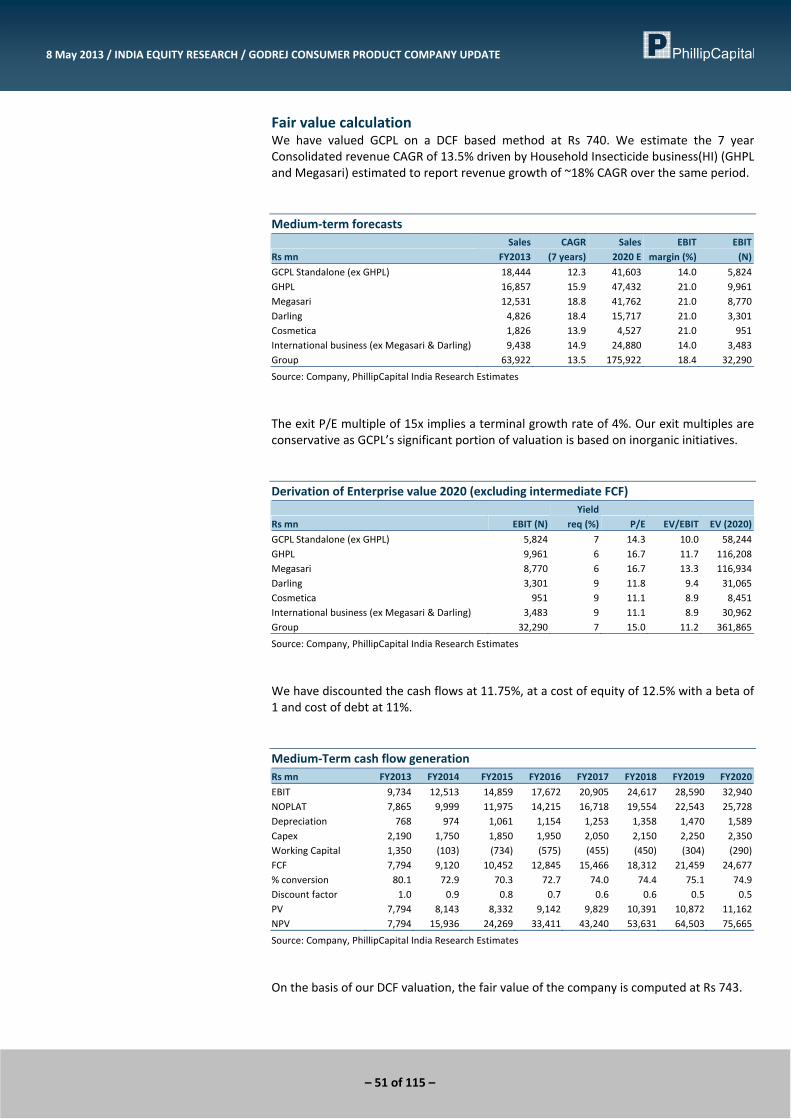
– 51 of 115 –
8 May 2013 / INDIA EQUITY RESEARCH / GODREJ CONSUMER PRODUCT COMPANY UPDATE
Fair value calculation We have valued GCPL on a DCF based method at Rs 740. We estimate the 7 year Consolidated revenue CAGR of 13.5% driven by Household Insecticide business(HI) (GHPL and Megasari) estimated to report revenue growth of ~18% CAGR over the same period. Medium‐term forecasts
Rs mn Sales
FY2013CAGR
(7 years) Sales
2020 E EBIT
margin (%)EBIT (N)
GCPL Standalone (ex GHPL) 18,444 12.3 41,603 14.0 5,824GHPL 16,857 15.9 47,432 21.0 9,961Megasari 12,531 18.8 41,762 21.0 8,770Darling 4,826 18.4 15,717 21.0 3,301Cosmetica 1,826 13.9 4,527 21.0 951International business (ex Megasari & Darling) 9,438 14.9 24,880 14.0 3,483Group 63,922 13.5 175,922 18.4 32,290
Source: Company, PhillipCapital India Research Estimates
The exit P/E multiple of 15x implies a terminal growth rate of 4%. Our exit multiples are conservative as GCPL’s significant portion of valuation is based on inorganic initiatives. Derivation of Enterprise value 2020 (excluding intermediate FCF)
Rs mn EBIT (N)Yield
req (%) P/E EV/EBIT EV (2020)
GCPL Standalone (ex GHPL) 5,824 7 14.3 10.0 58,244GHPL 9,961 6 16.7 11.7 116,208Megasari 8,770 6 16.7 13.3 116,934Darling 3,301 9 11.8 9.4 31,065Cosmetica 951 9 11.1 8.9 8,451International business (ex Megasari & Darling) 3,483 9 11.1 8.9 30,962Group 32,290 7 15.0 11.2 361,865
Source: Company, PhillipCapital India Research Estimates
We have discounted the cash flows at 11.75%, at a cost of equity of 12.5% with a beta of 1 and cost of debt at 11%. Medium‐Term cash flow generation Rs mn FY2013 FY2014 FY2015 FY2016 FY2017 FY2018 FY2019 FY2020
EBIT 9,734 12,513 14,859 17,672 20,905 24,617 28,590 32,940NOPLAT 7,865 9,999 11,975 14,215 16,718 19,554 22,543 25,728Depreciation 768 974 1,061 1,154 1,253 1,358 1,470 1,589Capex 2,190 1,750 1,850 1,950 2,050 2,150 2,250 2,350Working Capital 1,350 (103) (734) (575) (455) (450) (304) (290)FCF 7,794 9,120 10,452 12,845 15,466 18,312 21,459 24,677% conversion 80.1 72.9 70.3 72.7 74.0 74.4 75.1 74.9Discount factor 1.0 0.9 0.8 0.7 0.6 0.6 0.5 0.5PV 7,794 8,143 8,332 9,142 9,829 10,391 10,872 11,162NPV 7,794 15,936 24,269 33,411 43,240 53,631 64,503 75,665
Source: Company, PhillipCapital India Research Estimates
On the basis of our DCF valuation, the fair value of the company is computed at Rs 743.

– 52 of 115 –
8 May 2013 / INDIA EQUITY RESEARCH / GODREJ CONSUMER PRODUCT COMPANY UPDATE
Derivation of Fundamental value Rs mn/ Rs per share Value
Enterprise value‐2020 361,865NPV Intermediate FCF 75,665Net cash‐ end of FY2013 (13,185)Return requirement 12%EV Future value end of FY2013 239,355Target value end of FY2013 226,170Target value per share (end Mar 2013) 665Target value per share (end of Mar 2014) 743Implied FY13 multiple (P/E) 38Implied 2 ‐year forward multiple (P/E) 30CMP 840CMP at 1‐year forward multiple (P/E) 43% upside ‐12
Source: Company, PhillipCapital India Research
Recommendation Chart
Sell(TP 740)
Buy(TP 425)
Buy(TP 440)
Neutral(TP 450)
Buy(TP 485)
Neutral(TP 580)
Neutral(TP 625)
Neutral(TP 655)
Neutral(TP 670)
200
300
400
500
600
700
800
900
1000
Jan‐11 Apr‐11 Jul‐11 Oct‐11 Jan‐12 Apr‐12 Jul‐12 Oct‐12 Jan‐13 Apr‐13
Source: PhillipCapital India Research
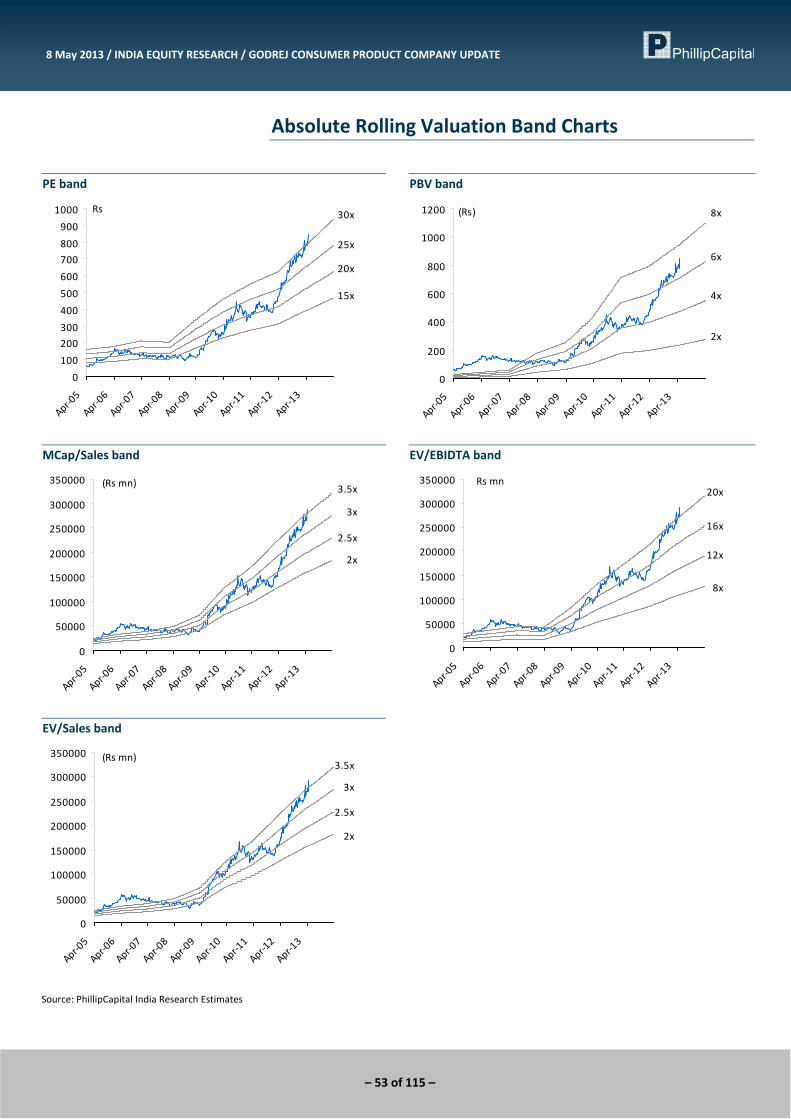
– 53 of 115 –
8 May 2013 / INDIA EQUITY RESEARCH / GODREJ CONSUMER PRODUCT COMPANY UPDATE
Absolute Rolling Valuation Band Charts
PE band
15x
20x
25x
30x
0
100
200
300
400
500
600
700
800
900
1000
Apr‐05
Apr‐06
Apr‐07
Apr‐08
Apr‐09
Apr‐10
Apr‐11
Apr‐12
Apr‐13
Rs
PBV band
2x
4x
6x
8x
0
200
400
600
800
1000
1200
Apr‐05
Apr‐06
Apr‐07
Apr‐08
Apr‐09
Apr‐10
Apr‐11
Apr‐12
Apr‐13
(Rs)
MCap/Sales band
2x
2.5x
3x
3.5x
0
50000
100000
150000
200000
250000
300000
350000
Apr‐05
Apr‐06
Apr‐07
Apr‐08
Apr‐09
Apr‐10
Apr‐11
Apr‐12
Apr‐13
(Rs mn)
EV/EBIDTA band
8x
12x
16x
20x
0
50000
100000
150000
200000
250000
300000
350000
Apr‐05
Apr‐06
Apr‐07
Apr‐08
Apr‐09
Apr‐10
Apr‐11
Apr‐12
Apr‐13
Rs mn
EV/Sales band
2x
2.5x
3x
3.5x
0
50000
100000
150000
200000
250000
300000
350000
Apr‐05
Apr‐06
Apr‐07
Apr‐08
Apr‐09
Apr‐10
Apr‐11
Apr‐12
Apr‐13
(Rs mn)
Source: PhillipCapital India Research Estimates
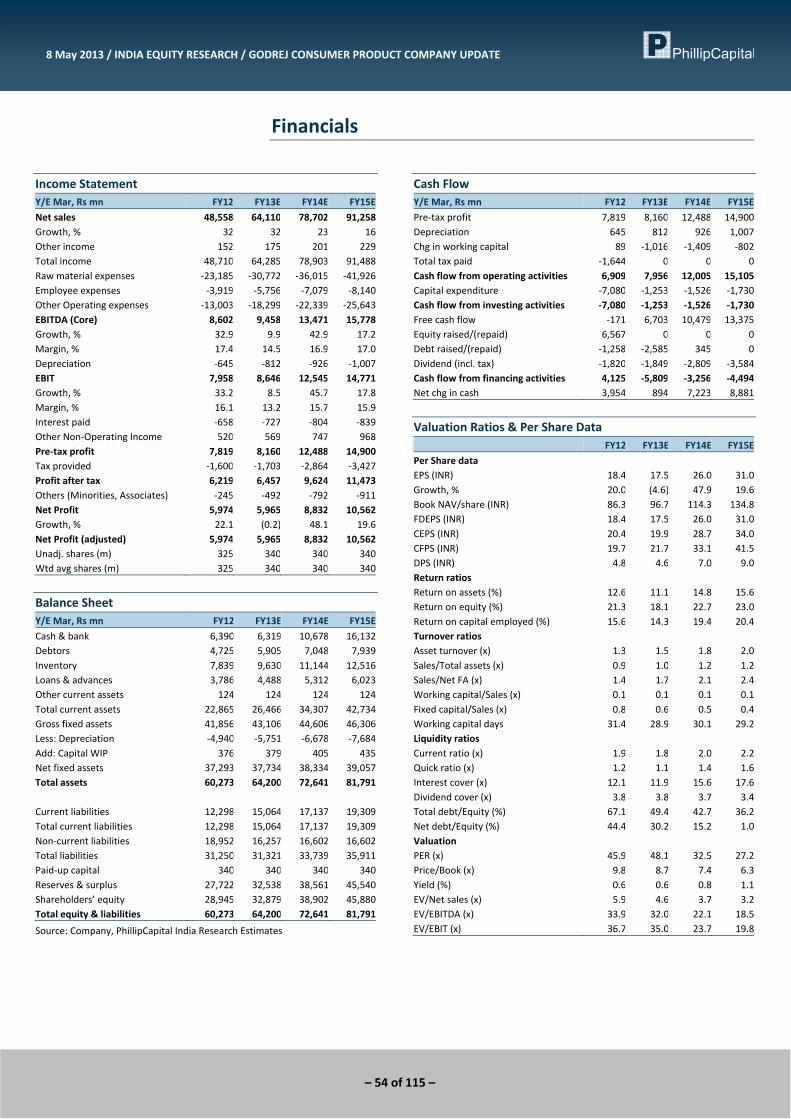
– 54 of 115 –
8 May 2013 / INDIA EQUITY RESEARCH / GODREJ CONSUMER PRODUCT COMPANY UPDATE
Financials
Income Statement Y/E Mar, Rs mn FY12 FY13E FY14E FY15E
Net sales 48,558 64,110 78,702 91,258Growth, % 32 32 23 16Other income 152 175 201 229Total income 48,710 64,285 78,903 91,488Raw material expenses ‐23,185 ‐30,772 ‐36,015 ‐41,926Employee expenses ‐3,919 ‐5,756 ‐7,079 ‐8,140Other Operating expenses ‐13,003 ‐18,299 ‐22,339 ‐25,643EBITDA (Core) 8,602 9,458 13,471 15,778Growth, % 32.9 9.9 42.9 17.2Margin, % 17.4 14.5 16.9 17.0Depreciation ‐645 ‐812 ‐926 ‐1,007EBIT 7,958 8,646 12,545 14,771Growth, % 33.2 8.5 45.7 17.8Margin, % 16.1 13.2 15.7 15.9Interest paid ‐658 ‐727 ‐804 ‐839Other Non‐Operating Income 520 569 747 968Pre‐tax profit 7,819 8,160 12,488 14,900Tax provided ‐1,600 ‐1,703 ‐2,864 ‐3,427Profit after tax 6,219 6,457 9,624 11,473Others (Minorities, Associates) ‐245 ‐492 ‐792 ‐911Net Profit 5,974 5,965 8,832 10,562Growth, % 22.1 (0.2) 48.1 19.6Net Profit (adjusted) 5,974 5,965 8,832 10,562Unadj. shares (m) 325 340 340 340Wtd avg shares (m) 325 340 340 340
Balance Sheet Y/E Mar, Rs mn FY12 FY13E FY14E FY15E
Cash & bank 6,390 6,319 10,678 16,132Debtors 4,725 5,905 7,048 7,939Inventory 7,839 9,630 11,144 12,516Loans & advances 3,786 4,488 5,312 6,023Other current assets 124 124 124 124Total current assets 22,865 26,466 34,307 42,734Gross fixed assets 41,856 43,106 44,606 46,306Less: Depreciation ‐4,940 ‐5,751 ‐6,678 ‐7,684Add: Capital WIP 376 379 405 435Net fixed assets 37,293 37,734 38,334 39,057Total assets 60,273 64,200 72,641 81,791 Current liabilities 12,298 15,064 17,137 19,309Total current liabilities 12,298 15,064 17,137 19,309Non‐current liabilities 18,952 16,257 16,602 16,602Total liabilities 31,250 31,321 33,739 35,911Paid‐up capital 340 340 340 340Reserves & surplus 27,722 32,538 38,561 45,540Shareholders’ equity 28,945 32,879 38,902 45,880Total equity & liabilities 60,273 64,200 72,641 81,791
Source: Company, PhillipCapital India Research Estimates
Cash Flow Y/E Mar, Rs mn FY12 FY13E FY14E FY15E
Pre‐tax profit 7,819 8,160 12,488 14,900Depreciation 645 812 926 1,007Chg in working capital 89 ‐1,016 ‐1,409 ‐802Total tax paid ‐1,644 0 0 0Cash flow from operating activities 6,909 7,956 12,005 15,105Capital expenditure ‐7,080 ‐1,253 ‐1,526 ‐1,730Cash flow from investing activities ‐7,080 ‐1,253 ‐1,526 ‐1,730Free cash flow ‐171 6,703 10,479 13,375Equity raised/(repaid) 6,567 0 0 0Debt raised/(repaid) ‐1,258 ‐2,585 345 0Dividend (incl. tax) ‐1,820 ‐1,849 ‐2,809 ‐3,584Cash flow from financing activities 4,125 ‐5,809 ‐3,256 ‐4,494Net chg in cash 3,954 894 7,223 8,881
Valuation Ratios & Per Share Data FY12 FY13E FY14E FY15E
Per Share data EPS (INR) 18.4 17.5 26.0 31.0Growth, % 20.0 (4.6) 47.9 19.6Book NAV/share (INR) 86.3 96.7 114.3 134.8FDEPS (INR) 18.4 17.5 26.0 31.0CEPS (INR) 20.4 19.9 28.7 34.0CFPS (INR) 19.7 21.7 33.1 41.5DPS (INR) 4.8 4.6 7.0 9.0Return ratios Return on assets (%) 12.6 11.1 14.8 15.6Return on equity (%) 21.3 18.1 22.7 23.0Return on capital employed (%) 15.6 14.3 19.4 20.4Turnover ratios Asset turnover (x) 1.3 1.5 1.8 2.0Sales/Total assets (x) 0.9 1.0 1.2 1.2Sales/Net FA (x) 1.4 1.7 2.1 2.4Working capital/Sales (x) 0.1 0.1 0.1 0.1Fixed capital/Sales (x) 0.8 0.6 0.5 0.4Working capital days 31.4 28.9 30.1 29.2Liquidity ratios Current ratio (x) 1.9 1.8 2.0 2.2Quick ratio (x) 1.2 1.1 1.4 1.6Interest cover (x) 12.1 11.9 15.6 17.6Dividend cover (x) 3.8 3.8 3.7 3.4Total debt/Equity (%) 67.1 49.4 42.7 36.2Net debt/Equity (%) 44.4 30.2 15.2 1.0Valuation PER (x) 45.9 48.1 32.5 27.2Price/Book (x) 9.8 8.7 7.4 6.3Yield (%) 0.6 0.6 0.8 1.1EV/Net sales (x) 5.9 4.6 3.7 3.2EV/EBITDA (x) 33.9 32.0 22.1 18.5EV/EBIT (x) 36.7 35.0 23.7 19.8
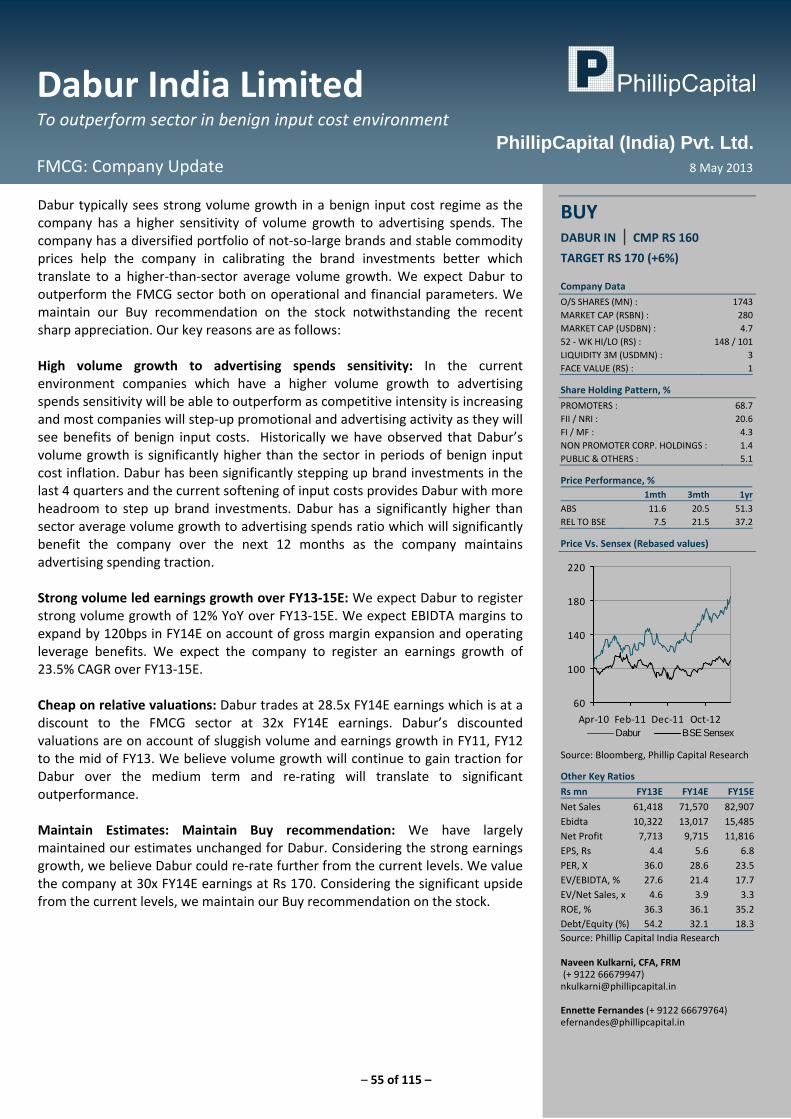
– 55 of 115 –
Dabur India Limited To outperform sector in benign input cost environment
FMCG: Company Update 8 May 2013
PhillipCapital (India) Pvt. Ltd.
Dabur typically sees strong volume growth in a benign input cost regime as the company has a higher sensitivity of volume growth to advertising spends. The company has a diversified portfolio of not‐so‐large brands and stable commodity prices help the company in calibrating the brand investments better which translate to a higher‐than‐sector average volume growth. We expect Dabur to outperform the FMCG sector both on operational and financial parameters. We maintain our Buy recommendation on the stock notwithstanding the recent sharp appreciation. Our key reasons are as follows: High volume growth to advertising spends sensitivity: In the current environment companies which have a higher volume growth to advertising spends sensitivity will be able to outperform as competitive intensity is increasing and most companies will step‐up promotional and advertising activity as they will see benefits of benign input costs. Historically we have observed that Dabur’s volume growth is significantly higher than the sector in periods of benign input cost inflation. Dabur has been significantly stepping up brand investments in the last 4 quarters and the current softening of input costs provides Dabur with more headroom to step up brand investments. Dabur has a significantly higher than sector average volume growth to advertising spends ratio which will significantly benefit the company over the next 12 months as the company maintains advertising spending traction. Strong volume led earnings growth over FY13‐15E: We expect Dabur to register strong volume growth of 12% YoY over FY13‐15E. We expect EBIDTA margins to expand by 120bps in FY14E on account of gross margin expansion and operating leverage benefits. We expect the company to register an earnings growth of 23.5% CAGR over FY13‐15E. Cheap on relative valuations: Dabur trades at 28.5x FY14E earnings which is at a discount to the FMCG sector at 32x FY14E earnings. Dabur’s discounted valuations are on account of sluggish volume and earnings growth in FY11, FY12 to the mid of FY13. We believe volume growth will continue to gain traction for Dabur over the medium term and re‐rating will translate to significant outperformance. Maintain Estimates: Maintain Buy recommendation: We have largely maintained our estimates unchanged for Dabur. Considering the strong earnings growth, we believe Dabur could re‐rate further from the current levels. We value the company at 30x FY14E earnings at Rs 170. Considering the significant upside from the current levels, we maintain our Buy recommendation on the stock.
BUY DABUR IN | CMP RS 160
TARGET RS 170 (+6%) Company Data
O/S SHARES (MN) : 1743MARKET CAP (RSBN) : 280MARKET CAP (USDBN) : 4.752 ‐ WK HI/LO (RS) : 148 / 101LIQUIDITY 3M (USDMN) : 3FACE VALUE (RS) : 1
Share Holding Pattern, %
PROMOTERS : 68.7FII / NRI : 20.6FI / MF : 4.3NON PROMOTER CORP. HOLDINGS : 1.4PUBLIC & OTHERS : 5.1
Price Performance, % 1mth 3mth 1yr
ABS 11.6 20.5 51.3REL TO BSE 7.5 21.5 37.2
Price Vs. Sensex (Rebased values)
60
100
140
180
220
Apr‐10 Feb‐11 Dec‐11 Oct‐12Dabur BSE Sensex
Source: Bloomberg, Phillip Capital Research
Other Key Ratios
Rs mn FY13E FY14E FY15E
Net Sales 61,418 71,570 82,907Ebidta 10,322 13,017 15,485Net Profit 7,713 9,715 11,816EPS, Rs 4.4 5.6 6.8PER, X 36.0 28.6 23.5EV/EBIDTA, % 27.6 21.4 17.7EV/Net Sales, x 4.6 3.9 3.3ROE, % 36.3 36.1 35.2Debt/Equity (%) 54.2 32.1 18.3Source: Phillip Capital India Research Naveen Kulkarni, CFA, FRM (+ 9122 66679947) [email protected] Ennette Fernandes (+ 9122 66679764) [email protected]
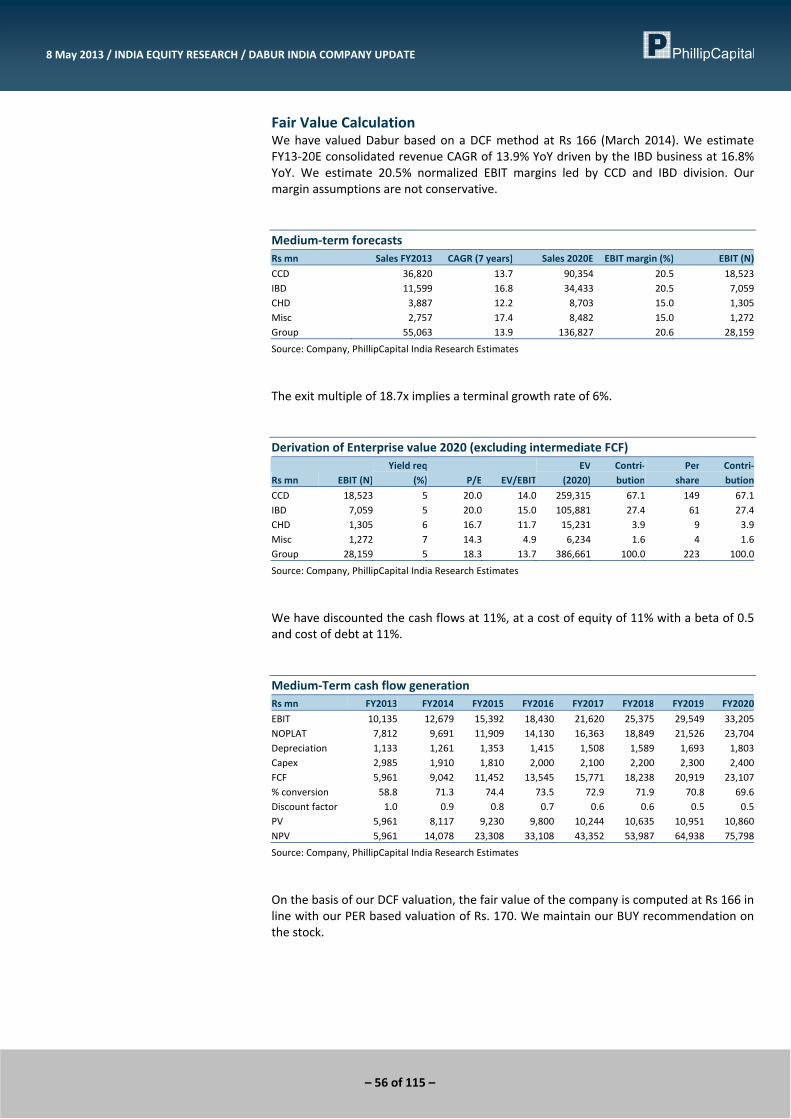
– 56 of 115 –
8 May 2013 / INDIA EQUITY RESEARCH / DABUR INDIA COMPANY UPDATE
Fair Value Calculation We have valued Dabur based on a DCF method at Rs 166 (March 2014). We estimate FY13‐20E consolidated revenue CAGR of 13.9% YoY driven by the IBD business at 16.8% YoY. We estimate 20.5% normalized EBIT margins led by CCD and IBD division. Our margin assumptions are not conservative. Medium‐term forecasts Rs mn Sales FY2013 CAGR (7 years) Sales 2020E EBIT margin (%) EBIT (N)
CCD 36,820 13.7 90,354 20.5 18,523IBD 11,599 16.8 34,433 20.5 7,059CHD 3,887 12.2 8,703 15.0 1,305Misc 2,757 17.4 8,482 15.0 1,272Group 55,063 13.9 136,827 20.6 28,159
Source: Company, PhillipCapital India Research Estimates
The exit multiple of 18.7x implies a terminal growth rate of 6%. Derivation of Enterprise value 2020 (excluding intermediate FCF)
Rs mn EBIT (N)Yield req
(%) P/E EV/EBITEV
(2020)Contri‐bution
Per share
Contri‐bution
CCD 18,523 5 20.0 14.0 259,315 67.1 149 67.1IBD 7,059 5 20.0 15.0 105,881 27.4 61 27.4CHD 1,305 6 16.7 11.7 15,231 3.9 9 3.9Misc 1,272 7 14.3 4.9 6,234 1.6 4 1.6Group 28,159 5 18.3 13.7 386,661 100.0 223 100.0
Source: Company, PhillipCapital India Research Estimates
We have discounted the cash flows at 11%, at a cost of equity of 11% with a beta of 0.5 and cost of debt at 11%. Medium‐Term cash flow generation Rs mn FY2013 FY2014 FY2015 FY2016 FY2017 FY2018 FY2019 FY2020
EBIT 10,135 12,679 15,392 18,430 21,620 25,375 29,549 33,205NOPLAT 7,812 9,691 11,909 14,130 16,363 18,849 21,526 23,704Depreciation 1,133 1,261 1,353 1,415 1,508 1,589 1,693 1,803Capex 2,985 1,910 1,810 2,000 2,100 2,200 2,300 2,400FCF 5,961 9,042 11,452 13,545 15,771 18,238 20,919 23,107% conversion 58.8 71.3 74.4 73.5 72.9 71.9 70.8 69.6Discount factor 1.0 0.9 0.8 0.7 0.6 0.6 0.5 0.5PV 5,961 8,117 9,230 9,800 10,244 10,635 10,951 10,860NPV 5,961 14,078 23,308 33,108 43,352 53,987 64,938 75,798
Source: Company, PhillipCapital India Research Estimates
On the basis of our DCF valuation, the fair value of the company is computed at Rs 166 in line with our PER based valuation of Rs. 170. We maintain our BUY recommendation on the stock.
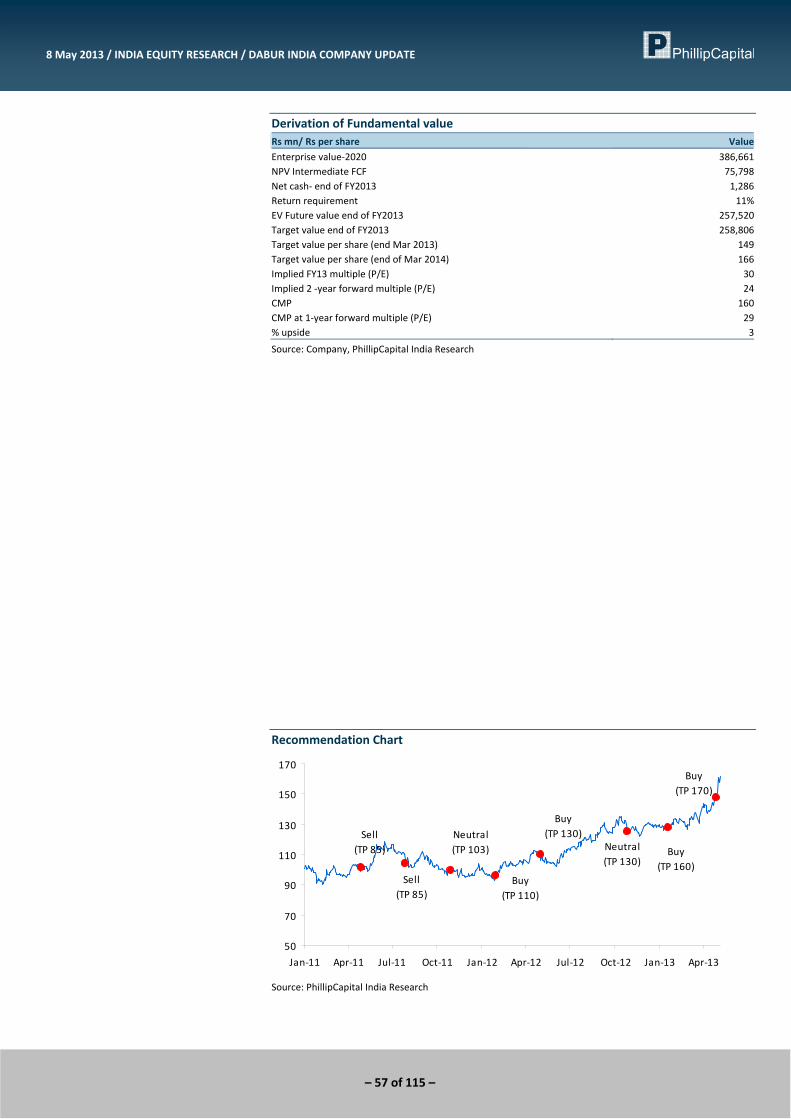
– 57 of 115 –
8 May 2013 / INDIA EQUITY RESEARCH / DABUR INDIA COMPANY UPDATE
Derivation of Fundamental value Rs mn/ Rs per share Value
Enterprise value‐2020 386,661 NPV Intermediate FCF 75,798 Net cash‐ end of FY2013 1,286 Return requirement 11%EV Future value end of FY2013 257,520 Target value end of FY2013 258,806 Target value per share (end Mar 2013) 149Target value per share (end of Mar 2014) 166Implied FY13 multiple (P/E) 30Implied 2 ‐year forward multiple (P/E) 24CMP 160CMP at 1‐year forward multiple (P/E) 29% upside 3
Source: Company, PhillipCapital India Research
Recommendation Chart
Sell(TP 85)
Sell(TP 85)
Neutral(TP 103)
Buy(TP 110)
Buy(TP 130)
Neutral(TP 130)
Buy(TP 160)
Buy(TP 170)
50
70
90
110
130
150
170
Jan‐11 Apr‐11 Jul‐11 Oct‐11 Jan‐12 Apr‐12 Jul‐12 Oct‐12 Jan‐13 Apr‐13
Source: PhillipCapital India Research
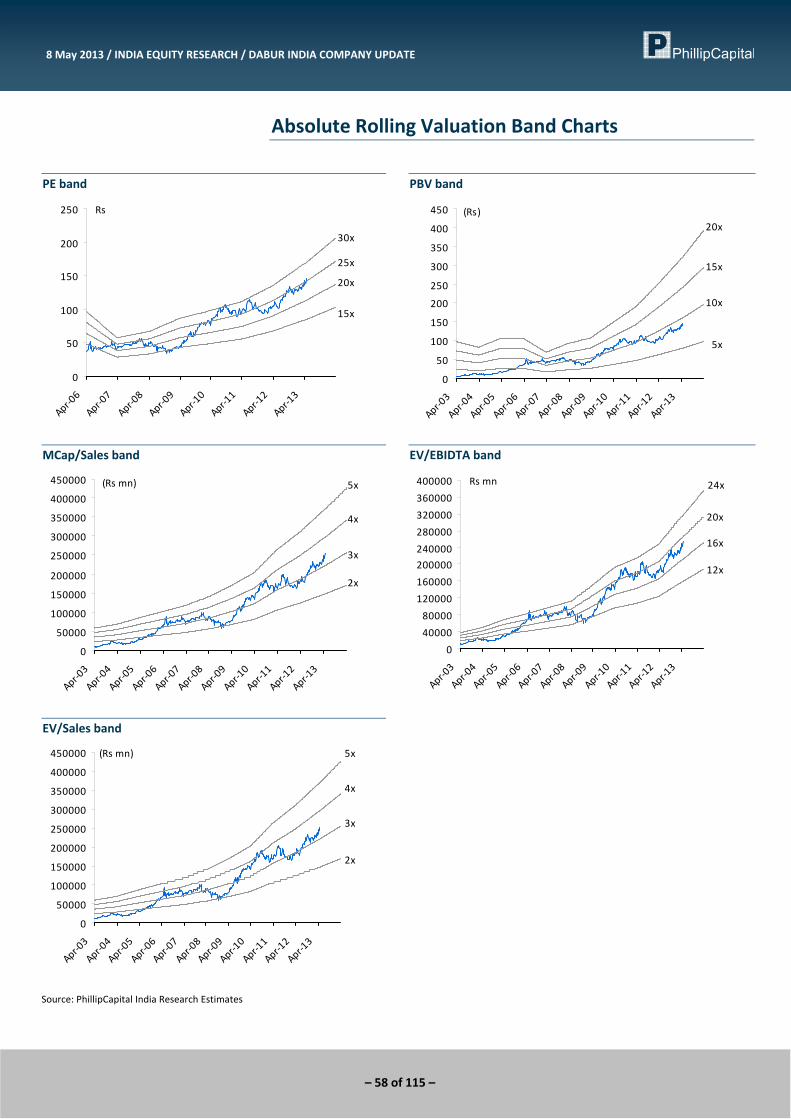
– 58 of 115 –
8 May 2013 / INDIA EQUITY RESEARCH / DABUR INDIA COMPANY UPDATE
Absolute Rolling Valuation Band Charts
PE band
15x
20x
25x
30x
0
50
100
150
200
250
Apr‐06
Apr‐07
Apr‐08
Apr‐09
Apr‐10
Apr‐11
Apr‐12
Apr‐13
Rs
PBV band
5x
10x
15x
20x
0
50
100
150
200
250
300
350
400
450
Apr‐03
Apr‐04
Apr‐05
Apr‐06
Apr‐07
Apr‐08
Apr‐09
Apr‐10
Apr‐11
Apr‐12
Apr‐13
(Rs)
MCap/Sales band
2x
3x
4x
5x
0
50000
100000
150000
200000
250000
300000
350000
400000
450000
Apr‐03
Apr‐04
Apr‐05
Apr‐06
Apr‐07
Apr‐08
Apr‐09
Apr‐10
Apr‐11
Apr‐12
Apr‐13
(Rs mn)
EV/EBIDTA band
12x
16x
20x
24x
0
40000
80000
120000
160000
200000
240000
280000
320000
360000
400000
Apr‐03
Apr‐04
Apr‐05
Apr‐06
Apr‐07
Apr‐08
Apr‐09
Apr‐10
Apr‐11
Apr‐12
Apr‐13
Rs mn
EV/Sales band
2x
3x
4x
5x
0
50000
100000
150000
200000
250000
300000
350000
400000
450000
Apr‐03
Apr‐04
Apr‐05
Apr‐06
Apr‐07
Apr‐08
Apr‐09
Apr‐10
Apr‐11
Apr‐12
Apr‐13
(Rs mn)
Source: PhillipCapital India Research Estimates
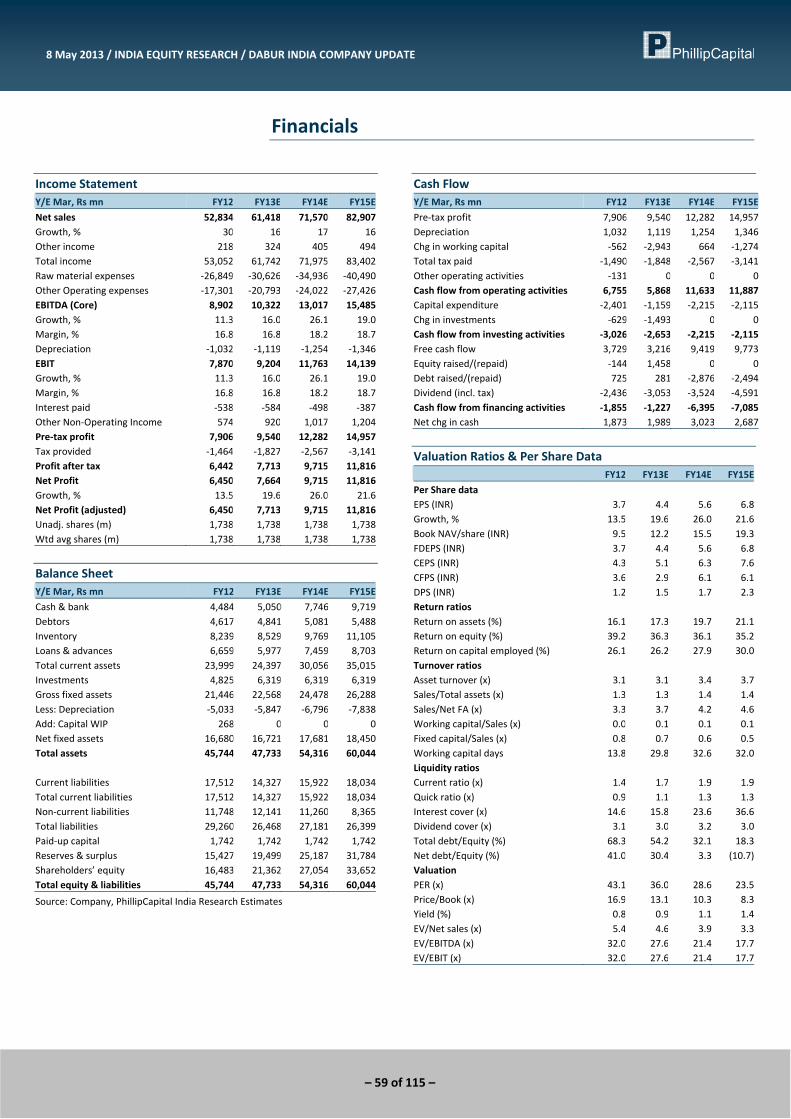
– 59 of 115 –
8 May 2013 / INDIA EQUITY RESEARCH / DABUR INDIA COMPANY UPDATE
Financials
Income Statement Y/E Mar, Rs mn FY12 FY13E FY14E FY15E
Net sales 52,834 61,418 71,570 82,907Growth, % 30 16 17 16Other income 218 324 405 494Total income 53,052 61,742 71,975 83,402Raw material expenses ‐26,849 ‐30,626 ‐34,936 ‐40,490Other Operating expenses ‐17,301 ‐20,793 ‐24,022 ‐27,426EBITDA (Core) 8,902 10,322 13,017 15,485Growth, % 11.3 16.0 26.1 19.0Margin, % 16.8 16.8 18.2 18.7Depreciation ‐1,032 ‐1,119 ‐1,254 ‐1,346EBIT 7,870 9,204 11,763 14,139Growth, % 11.3 16.0 26.1 19.0Margin, % 16.8 16.8 18.2 18.7Interest paid ‐538 ‐584 ‐498 ‐387Other Non‐Operating Income 574 920 1,017 1,204Pre‐tax profit 7,906 9,540 12,282 14,957Tax provided ‐1,464 ‐1,827 ‐2,567 ‐3,141Profit after tax 6,442 7,713 9,715 11,816Net Profit 6,450 7,664 9,715 11,816Growth, % 13.5 19.6 26.0 21.6Net Profit (adjusted) 6,450 7,713 9,715 11,816Unadj. shares (m) 1,738 1,738 1,738 1,738Wtd avg shares (m) 1,738 1,738 1,738 1,738
Balance Sheet Y/E Mar, Rs mn FY12 FY13E FY14E FY15E
Cash & bank 4,484 5,050 7,746 9,719Debtors 4,617 4,841 5,081 5,488Inventory 8,239 8,529 9,769 11,105Loans & advances 6,659 5,977 7,459 8,703Total current assets 23,999 24,397 30,056 35,015Investments 4,825 6,319 6,319 6,319Gross fixed assets 21,446 22,568 24,478 26,288Less: Depreciation ‐5,033 ‐5,847 ‐6,796 ‐7,838Add: Capital WIP 268 0 0 0Net fixed assets 16,680 16,721 17,681 18,450Total assets 45,744 47,733 54,316 60,044 Current liabilities 17,512 14,327 15,922 18,034Total current liabilities 17,512 14,327 15,922 18,034Non‐current liabilities 11,748 12,141 11,260 8,365Total liabilities 29,260 26,468 27,181 26,399Paid‐up capital 1,742 1,742 1,742 1,742Reserves & surplus 15,427 19,499 25,187 31,784Shareholders’ equity 16,483 21,362 27,054 33,652Total equity & liabilities 45,744 47,733 54,316 60,044
Source: Company, PhillipCapital India Research Estimates
Cash Flow Y/E Mar, Rs mn FY12 FY13E FY14E FY15E
Pre‐tax profit 7,906 9,540 12,282 14,957Depreciation 1,032 1,119 1,254 1,346Chg in working capital ‐562 ‐2,943 664 ‐1,274Total tax paid ‐1,490 ‐1,848 ‐2,567 ‐3,141Other operating activities ‐131 0 0 0Cash flow from operating activities 6,755 5,868 11,633 11,887Capital expenditure ‐2,401 ‐1,159 ‐2,215 ‐2,115Chg in investments ‐629 ‐1,493 0 0Cash flow from investing activities ‐3,026 ‐2,653 ‐2,215 ‐2,115Free cash flow 3,729 3,216 9,419 9,773Equity raised/(repaid) ‐144 1,458 0 0Debt raised/(repaid) 725 281 ‐2,876 ‐2,494Dividend (incl. tax) ‐2,436 ‐3,053 ‐3,524 ‐4,591Cash flow from financing activities ‐1,855 ‐1,227 ‐6,395 ‐7,085Net chg in cash 1,873 1,989 3,023 2,687
Valuation Ratios & Per Share Data FY12 FY13E FY14E FY15E
Per Share data EPS (INR) 3.7 4.4 5.6 6.8Growth, % 13.5 19.6 26.0 21.6Book NAV/share (INR) 9.5 12.2 15.5 19.3FDEPS (INR) 3.7 4.4 5.6 6.8CEPS (INR) 4.3 5.1 6.3 7.6CFPS (INR) 3.6 2.9 6.1 6.1DPS (INR) 1.2 1.5 1.7 2.3Return ratios Return on assets (%) 16.1 17.3 19.7 21.1Return on equity (%) 39.2 36.3 36.1 35.2Return on capital employed (%) 26.1 26.2 27.9 30.0Turnover ratios Asset turnover (x) 3.1 3.1 3.4 3.7Sales/Total assets (x) 1.3 1.3 1.4 1.4Sales/Net FA (x) 3.3 3.7 4.2 4.6Working capital/Sales (x) 0.0 0.1 0.1 0.1Fixed capital/Sales (x) 0.8 0.7 0.6 0.5Working capital days 13.8 29.8 32.6 32.0Liquidity ratios Current ratio (x) 1.4 1.7 1.9 1.9Quick ratio (x) 0.9 1.1 1.3 1.3Interest cover (x) 14.6 15.8 23.6 36.6Dividend cover (x) 3.1 3.0 3.2 3.0Total debt/Equity (%) 68.3 54.2 32.1 18.3Net debt/Equity (%) 41.0 30.4 3.3 (10.7)Valuation PER (x) 43.1 36.0 28.6 23.5Price/Book (x) 16.9 13.1 10.3 8.3Yield (%) 0.8 0.9 1.1 1.4EV/Net sales (x) 5.4 4.6 3.9 3.3EV/EBITDA (x) 32.0 27.6 21.4 17.7EV/EBIT (x) 32.0 27.6 21.4 17.7
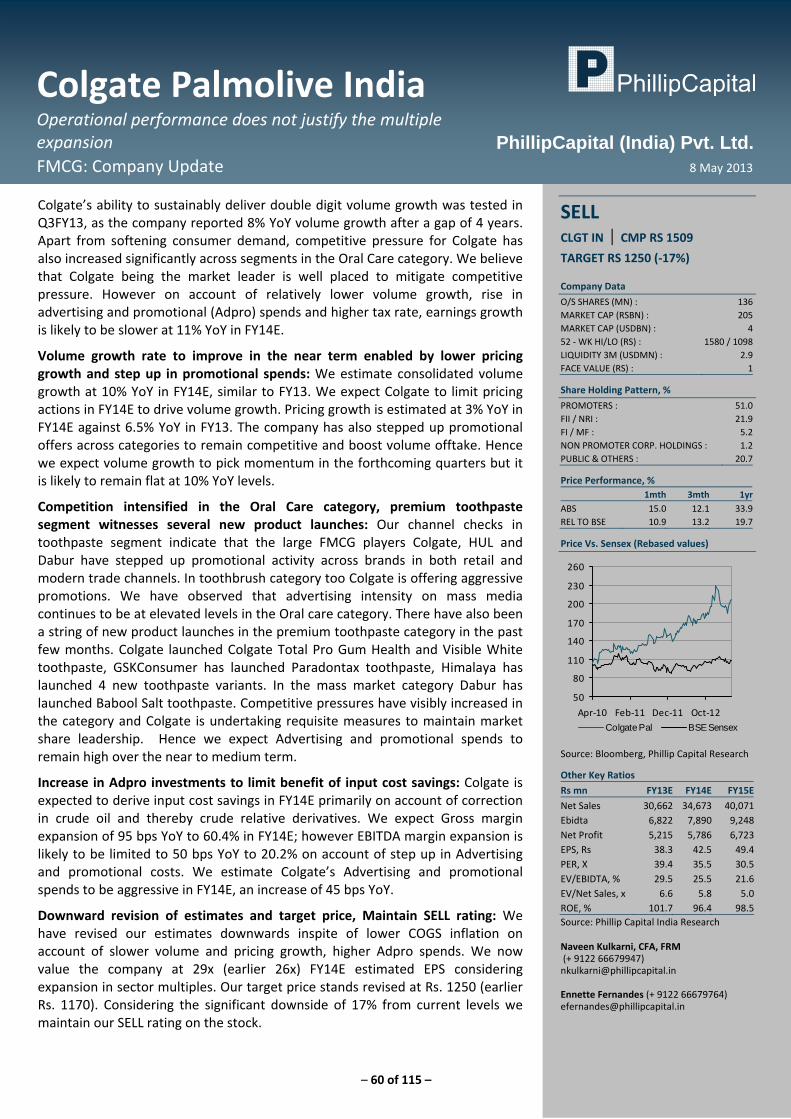
– 60 of 115 –
Colgate Palmolive India Operational performance does not justify the multiple expansion FMCG: Company Update 8 May 2013
PhillipCapital (India) Pvt. Ltd.
Colgate’s ability to sustainably deliver double digit volume growth was tested in Q3FY13, as the company reported 8% YoY volume growth after a gap of 4 years. Apart from softening consumer demand, competitive pressure for Colgate has also increased significantly across segments in the Oral Care category. We believe that Colgate being the market leader is well placed to mitigate competitive pressure. However on account of relatively lower volume growth, rise in advertising and promotional (Adpro) spends and higher tax rate, earnings growth is likely to be slower at 11% YoY in FY14E.
Volume growth rate to improve in the near term enabled by lower pricing growth and step up in promotional spends: We estimate consolidated volume growth at 10% YoY in FY14E, similar to FY13. We expect Colgate to limit pricing actions in FY14E to drive volume growth. Pricing growth is estimated at 3% YoY in FY14E against 6.5% YoY in FY13. The company has also stepped up promotional offers across categories to remain competitive and boost volume offtake. Hence we expect volume growth to pick momentum in the forthcoming quarters but it is likely to remain flat at 10% YoY levels.
Competition intensified in the Oral Care category, premium toothpaste segment witnesses several new product launches: Our channel checks in toothpaste segment indicate that the large FMCG players Colgate, HUL and Dabur have stepped up promotional activity across brands in both retail and modern trade channels. In toothbrush category too Colgate is offering aggressive promotions. We have observed that advertising intensity on mass media continues to be at elevated levels in the Oral care category. There have also been a string of new product launches in the premium toothpaste category in the past few months. Colgate launched Colgate Total Pro Gum Health and Visible White toothpaste, GSKConsumer has launched Paradontax toothpaste, Himalaya has launched 4 new toothpaste variants. In the mass market category Dabur has launched Babool Salt toothpaste. Competitive pressures have visibly increased in the category and Colgate is undertaking requisite measures to maintain market share leadership. Hence we expect Advertising and promotional spends to remain high over the near to medium term.
Increase in Adpro investments to limit benefit of input cost savings: Colgate is expected to derive input cost savings in FY14E primarily on account of correction in crude oil and thereby crude relative derivatives. We expect Gross margin expansion of 95 bps YoY to 60.4% in FY14E; however EBITDA margin expansion is likely to be limited to 50 bps YoY to 20.2% on account of step up in Advertising and promotional costs. We estimate Colgate’s Advertising and promotional spends to be aggressive in FY14E, an increase of 45 bps YoY.
Downward revision of estimates and target price, Maintain SELL rating: We have revised our estimates downwards inspite of lower COGS inflation on account of slower volume and pricing growth, higher Adpro spends. We now value the company at 29x (earlier 26x) FY14E estimated EPS considering expansion in sector multiples. Our target price stands revised at Rs. 1250 (earlier Rs. 1170). Considering the significant downside of 17% from current levels we maintain our SELL rating on the stock.
SELL CLGT IN | CMP RS 1509
TARGET RS 1250 (‐17%) Company Data
O/S SHARES (MN) : 136MARKET CAP (RSBN) : 205MARKET CAP (USDBN) : 452 ‐ WK HI/LO (RS) : 1580 / 1098LIQUIDITY 3M (USDMN) : 2.9FACE VALUE (RS) : 1
Share Holding Pattern, %
PROMOTERS : 51.0FII / NRI : 21.9FI / MF : 5.2NON PROMOTER CORP. HOLDINGS : 1.2PUBLIC & OTHERS : 20.7
Price Performance, % 1mth 3mth 1yr
ABS 15.0 12.1 33.9REL TO BSE 10.9 13.2 19.7
Price Vs. Sensex (Rebased values)
50
80
110
140
170
200
230
260
Apr‐10 Feb‐11 Dec‐11 Oct‐12Colgate Pal BSE Sensex
Source: Bloomberg, Phillip Capital Research
Other Key Ratios
Rs mn FY13E FY14E FY15E
Net Sales 30,662 34,673 40,071Ebidta 6,822 7,890 9,248Net Profit 5,215 5,786 6,723EPS, Rs 38.3 42.5 49.4PER, X 39.4 35.5 30.5EV/EBIDTA, % 29.5 25.5 21.6EV/Net Sales, x 6.6 5.8 5.0ROE, % 101.7 96.4 98.5Source: Phillip Capital India Research Naveen Kulkarni, CFA, FRM (+ 9122 66679947) [email protected] Ennette Fernandes (+ 9122 66679764) [email protected]
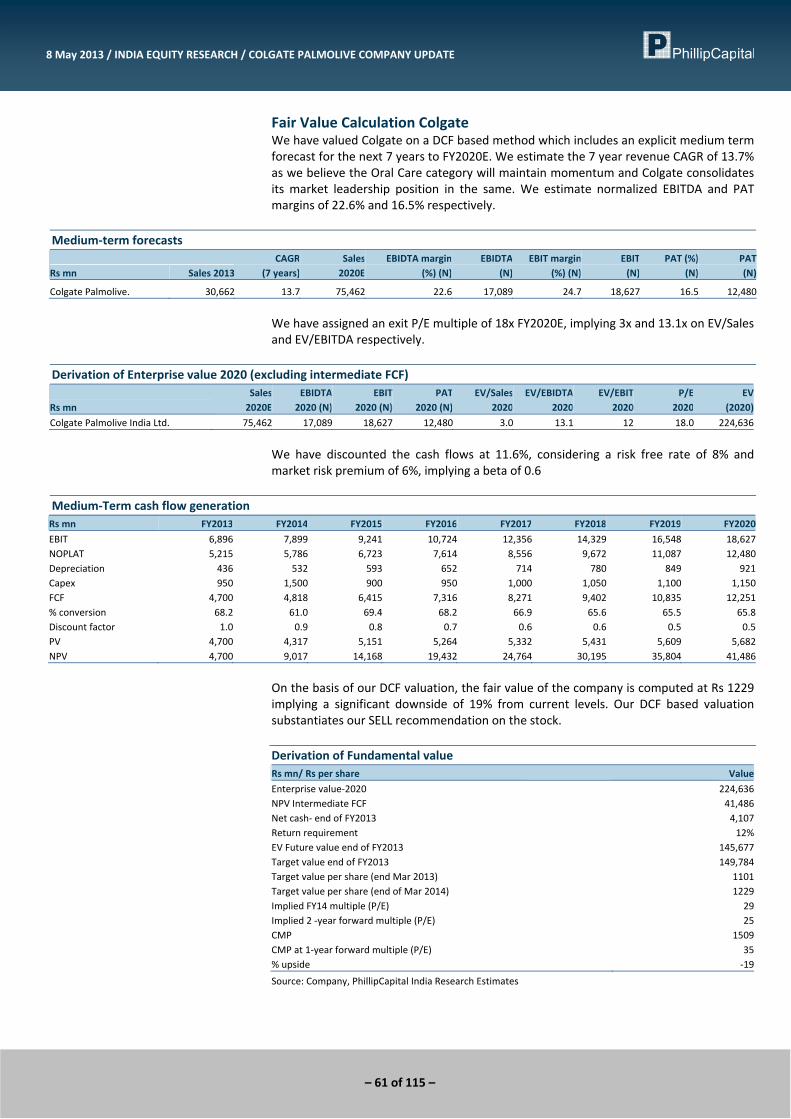
– 61 of 115 –
8 May 2013 / INDIA EQUITY RESEARCH / COLGATE PALMOLIVE COMPANY UPDATE
Fair Value Calculation Colgate We have valued Colgate on a DCF based method which includes an explicit medium term forecast for the next 7 years to FY2020E. We estimate the 7 year revenue CAGR of 13.7% as we believe the Oral Care category will maintain momentum and Colgate consolidates its market leadership position in the same. We estimate normalized EBITDA and PAT margins of 22.6% and 16.5% respectively.
Medium‐term forecasts
Rs mn Sales 2013CAGR
(7 years)Sales 2020E
EBIDTA margin (%) (N)
EBIDTA (N)
EBIT margin (%) (N)
EBIT (N)
PAT (%) (N)
PAT (N)
Colgate Palmolive. 30,662 13.7 75,462 22.6 17,089 24.7 18,627 16.5 12,480
We have assigned an exit P/E multiple of 18x FY2020E, implying 3x and 13.1x on EV/Sales and EV/EBITDA respectively.
Derivation of Enterprise value 2020 (excluding intermediate FCF)
Rs mn Sales 2020E
EBIDTA 2020 (N)
EBIT 2020 (N)
PAT 2020 (N)
EV/Sales 2020
EV/EBIDTA 2020
EV/EBIT 2020
P/E2020
EV (2020)
Colgate Palmolive India Ltd. 75,462 17,089 18,627 12,480 3.0 13.1 12 18.0 224,636
We have discounted the cash flows at 11.6%, considering a risk free rate of 8% and market risk premium of 6%, implying a beta of 0.6
Medium‐Term cash flow generation Rs mn FY2013 FY2014 FY2015 FY2016 FY2017 FY2018 FY2019 FY2020
EBIT 6,896 7,899 9,241 10,724 12,356 14,329 16,548 18,627NOPLAT 5,215 5,786 6,723 7,614 8,556 9,672 11,087 12,480Depreciation 436 532 593 652 714 780 849 921Capex 950 1,500 900 950 1,000 1,050 1,100 1,150FCF 4,700 4,818 6,415 7,316 8,271 9,402 10,835 12,251% conversion 68.2 61.0 69.4 68.2 66.9 65.6 65.5 65.8Discount factor 1.0 0.9 0.8 0.7 0.6 0.6 0.5 0.5PV 4,700 4,317 5,151 5,264 5,332 5,431 5,609 5,682NPV 4,700 9,017 14,168 19,432 24,764 30,195 35,804 41,486
On the basis of our DCF valuation, the fair value of the company is computed at Rs 1229 implying a significant downside of 19% from current levels. Our DCF based valuation substantiates our SELL recommendation on the stock. Derivation of Fundamental value Rs mn/ Rs per share Value
Enterprise value‐2020 224,636NPV Intermediate FCF 41,486Net cash‐ end of FY2013 4,107Return requirement 12%EV Future value end of FY2013 145,677Target value end of FY2013 149,784Target value per share (end Mar 2013) 1101Target value per share (end of Mar 2014) 1229Implied FY14 multiple (P/E) 29Implied 2 ‐year forward multiple (P/E) 25CMP 1509CMP at 1‐year forward multiple (P/E) 35% upside ‐19
Source: Company, PhillipCapital India Research Estimates
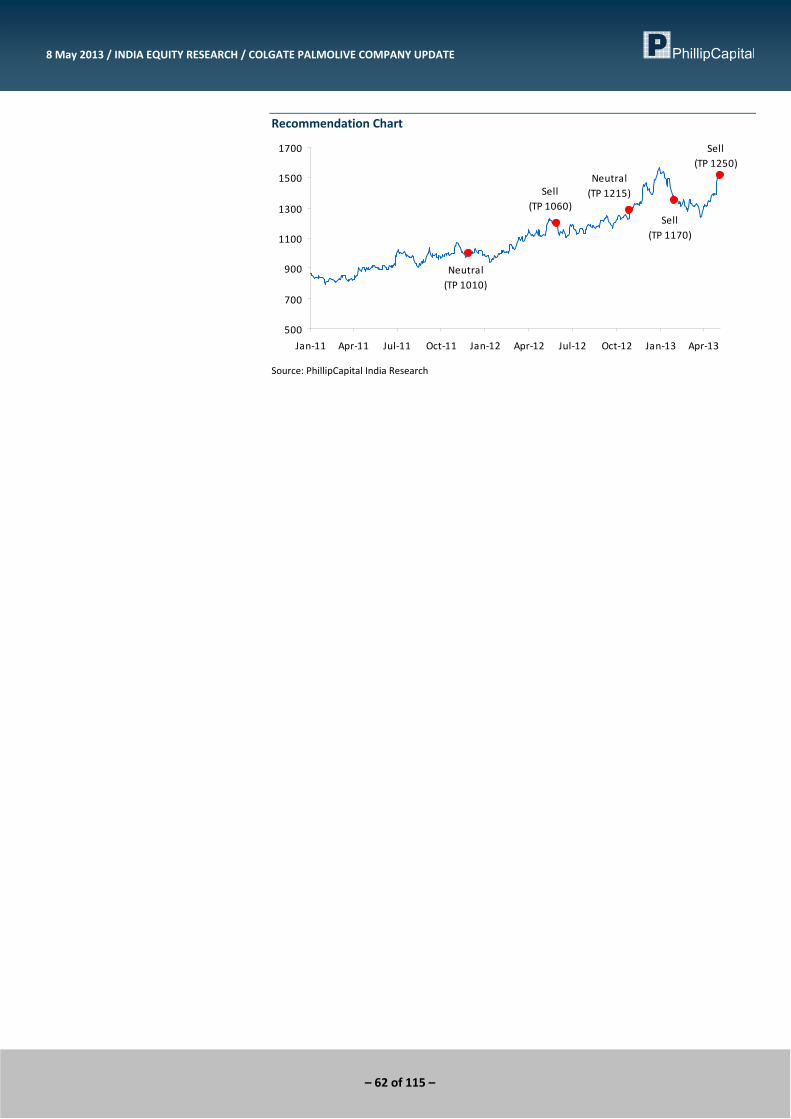
– 62 of 115 –
8 May 2013 / INDIA EQUITY RESEARCH / COLGATE PALMOLIVE COMPANY UPDATE
Recommendation Chart
Sell(TP 1250)
Neutral(TP 1010)
Sell(TP 1060)
Neutral(TP 1215)
Sell(TP 1170)
500
700
900
1100
1300
1500
1700
Jan‐11 Apr‐11 Jul‐11 Oct‐11 Jan‐12 Apr‐12 Jul‐12 Oct‐12 Jan‐13 Apr‐13
Source: PhillipCapital India Research
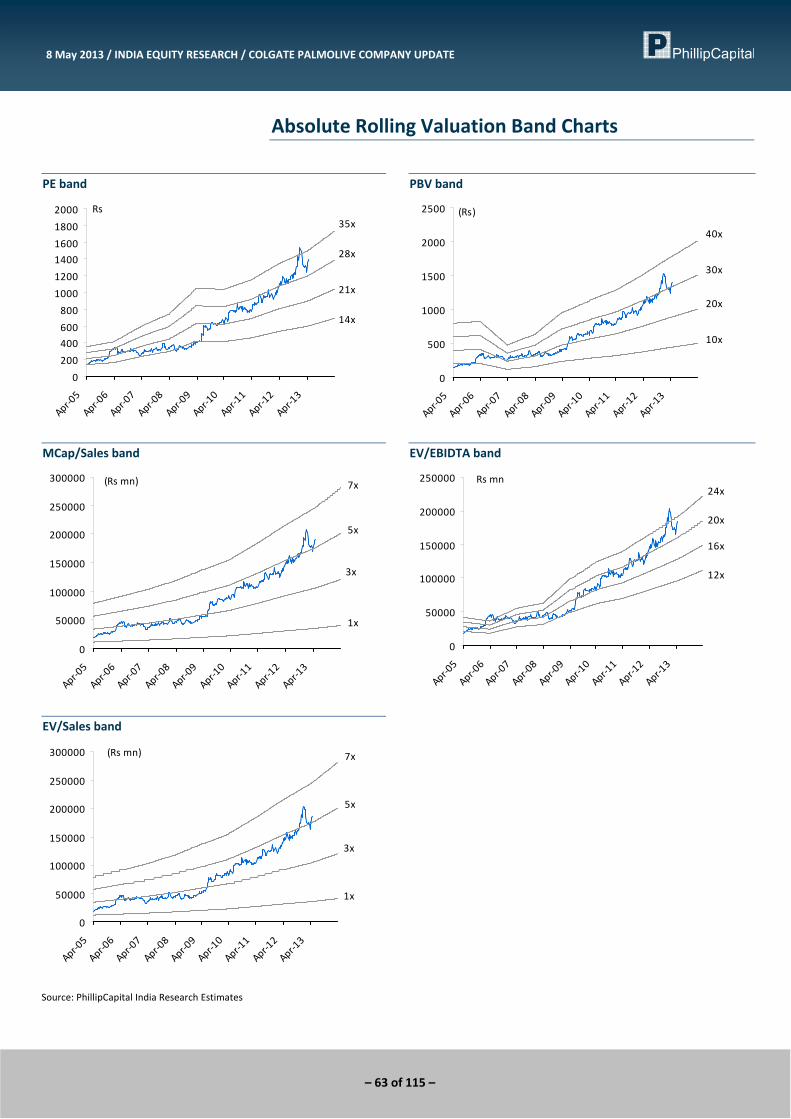
– 63 of 115 –
8 May 2013 / INDIA EQUITY RESEARCH / COLGATE PALMOLIVE COMPANY UPDATE
Absolute Rolling Valuation Band Charts
PE band
14x
21x
28x
35x
0
200
400
600
800
1000
1200
1400
1600
1800
2000
Apr‐05
Apr‐06
Apr‐07
Apr‐08
Apr‐09
Apr‐10
Apr‐11
Apr‐12
Apr‐13
Rs
PBV band
10x
20x
30x
40x
0
500
1000
1500
2000
2500
Apr‐05
Apr‐06
Apr‐07
Apr‐08
Apr‐09
Apr‐10
Apr‐11
Apr‐12
Apr‐13
(Rs)
MCap/Sales band
1x
3x
5x
7x
0
50000
100000
150000
200000
250000
300000
Apr‐05
Apr‐06
Apr‐07
Apr‐08
Apr‐09
Apr‐10
Apr‐11
Apr‐12
Apr‐13
(Rs mn)
EV/EBIDTA band
12x
16x
20x
24x
0
50000
100000
150000
200000
250000
Apr‐05
Apr‐06
Apr‐07
Apr‐08
Apr‐09
Apr‐10
Apr‐11
Apr‐12
Apr‐13
Rs mn
EV/Sales band
1x
3x
5x
7x
0
50000
100000
150000
200000
250000
300000
Apr‐05
Apr‐06
Apr‐07
Apr‐08
Apr‐09
Apr‐10
Apr‐11
Apr‐12
Apr‐13
(Rs mn)
Source: PhillipCapital India Research Estimates
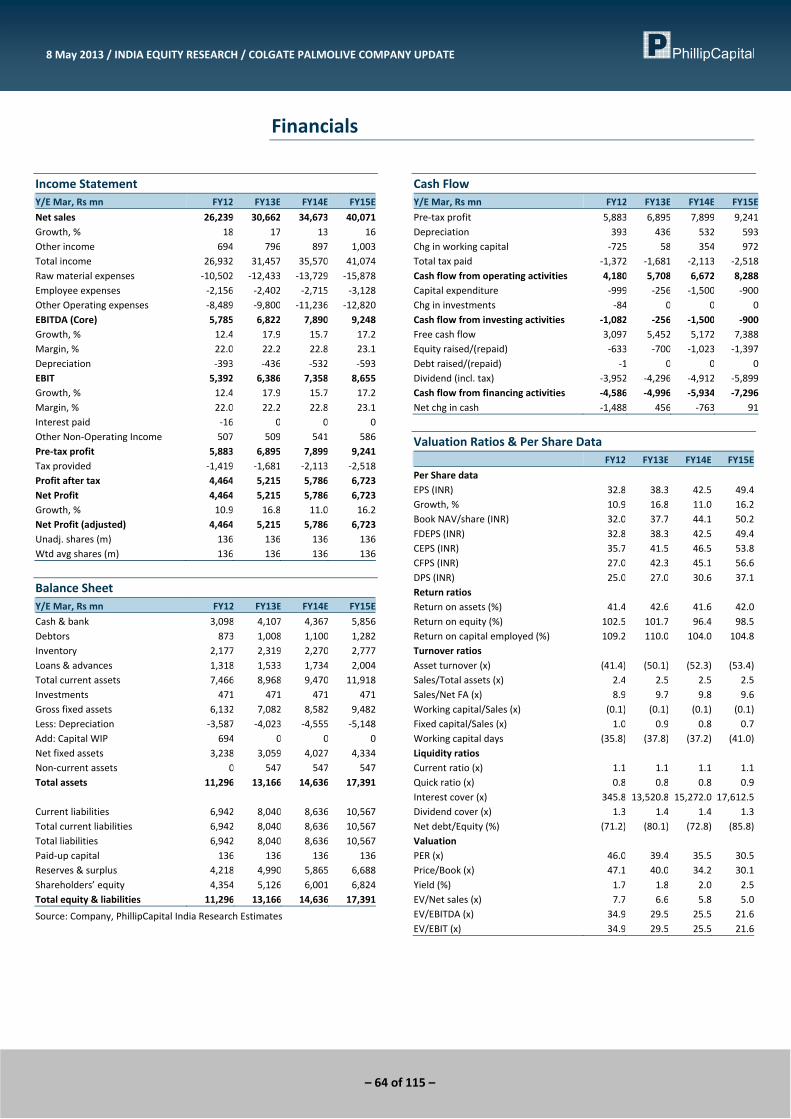
– 64 of 115 –
8 May 2013 / INDIA EQUITY RESEARCH / COLGATE PALMOLIVE COMPANY UPDATE
Financials
Income Statement Y/E Mar, Rs mn FY12 FY13E FY14E FY15E
Net sales 26,239 30,662 34,673 40,071Growth, % 18 17 13 16Other income 694 796 897 1,003Total income 26,932 31,457 35,570 41,074Raw material expenses ‐10,502 ‐12,433 ‐13,729 ‐15,878Employee expenses ‐2,156 ‐2,402 ‐2,715 ‐3,128Other Operating expenses ‐8,489 ‐9,800 ‐11,236 ‐12,820EBITDA (Core) 5,785 6,822 7,890 9,248Growth, % 12.4 17.9 15.7 17.2Margin, % 22.0 22.2 22.8 23.1Depreciation ‐393 ‐436 ‐532 ‐593EBIT 5,392 6,386 7,358 8,655Growth, % 12.4 17.9 15.7 17.2Margin, % 22.0 22.2 22.8 23.1Interest paid ‐16 0 0 0Other Non‐Operating Income 507 509 541 586Pre‐tax profit 5,883 6,895 7,899 9,241Tax provided ‐1,419 ‐1,681 ‐2,113 ‐2,518Profit after tax 4,464 5,215 5,786 6,723Net Profit 4,464 5,215 5,786 6,723Growth, % 10.9 16.8 11.0 16.2Net Profit (adjusted) 4,464 5,215 5,786 6,723Unadj. shares (m) 136 136 136 136Wtd avg shares (m) 136 136 136 136
Balance Sheet Y/E Mar, Rs mn FY12 FY13E FY14E FY15E
Cash & bank 3,098 4,107 4,367 5,856Debtors 873 1,008 1,100 1,282Inventory 2,177 2,319 2,270 2,777Loans & advances 1,318 1,533 1,734 2,004Total current assets 7,466 8,968 9,470 11,918Investments 471 471 471 471Gross fixed assets 6,132 7,082 8,582 9,482Less: Depreciation ‐3,587 ‐4,023 ‐4,555 ‐5,148Add: Capital WIP 694 0 0 0Net fixed assets 3,238 3,059 4,027 4,334Non‐current assets 0 547 547 547Total assets 11,296 13,166 14,636 17,391 Current liabilities 6,942 8,040 8,636 10,567Total current liabilities 6,942 8,040 8,636 10,567Total liabilities 6,942 8,040 8,636 10,567Paid‐up capital 136 136 136 136Reserves & surplus 4,218 4,990 5,865 6,688Shareholders’ equity 4,354 5,126 6,001 6,824Total equity & liabilities 11,296 13,166 14,636 17,391
Source: Company, PhillipCapital India Research Estimates
Cash Flow Y/E Mar, Rs mn FY12 FY13E FY14E FY15E
Pre‐tax profit 5,883 6,895 7,899 9,241Depreciation 393 436 532 593Chg in working capital ‐725 58 354 972Total tax paid ‐1,372 ‐1,681 ‐2,113 ‐2,518Cash flow from operating activities 4,180 5,708 6,672 8,288Capital expenditure ‐999 ‐256 ‐1,500 ‐900Chg in investments ‐84 0 0 0Cash flow from investing activities ‐1,082 ‐256 ‐1,500 ‐900Free cash flow 3,097 5,452 5,172 7,388Equity raised/(repaid) ‐633 ‐700 ‐1,023 ‐1,397Debt raised/(repaid) ‐1 0 0 0Dividend (incl. tax) ‐3,952 ‐4,296 ‐4,912 ‐5,899Cash flow from financing activities ‐4,586 ‐4,996 ‐5,934 ‐7,296Net chg in cash ‐1,488 456 ‐763 91
Valuation Ratios & Per Share Data FY12 FY13E FY14E FY15E
Per Share data EPS (INR) 32.8 38.3 42.5 49.4Growth, % 10.9 16.8 11.0 16.2Book NAV/share (INR) 32.0 37.7 44.1 50.2FDEPS (INR) 32.8 38.3 42.5 49.4CEPS (INR) 35.7 41.5 46.5 53.8CFPS (INR) 27.0 42.3 45.1 56.6DPS (INR) 25.0 27.0 30.6 37.1Return ratios Return on assets (%) 41.4 42.6 41.6 42.0Return on equity (%) 102.5 101.7 96.4 98.5Return on capital employed (%) 109.2 110.0 104.0 104.8Turnover ratios Asset turnover (x) (41.4) (50.1) (52.3) (53.4)Sales/Total assets (x) 2.4 2.5 2.5 2.5Sales/Net FA (x) 8.9 9.7 9.8 9.6Working capital/Sales (x) (0.1) (0.1) (0.1) (0.1)Fixed capital/Sales (x) 1.0 0.9 0.8 0.7Working capital days (35.8) (37.8) (37.2) (41.0)Liquidity ratios Current ratio (x) 1.1 1.1 1.1 1.1Quick ratio (x) 0.8 0.8 0.8 0.9Interest cover (x) 345.8 13,520.8 15,272.0 17,612.5Dividend cover (x) 1.3 1.4 1.4 1.3Net debt/Equity (%) (71.2) (80.1) (72.8) (85.8)Valuation PER (x) 46.0 39.4 35.5 30.5Price/Book (x) 47.1 40.0 34.2 30.1Yield (%) 1.7 1.8 2.0 2.5EV/Net sales (x) 7.7 6.6 5.8 5.0EV/EBITDA (x) 34.9 29.5 25.5 21.6EV/EBIT (x) 34.9 29.5 25.5 21.6
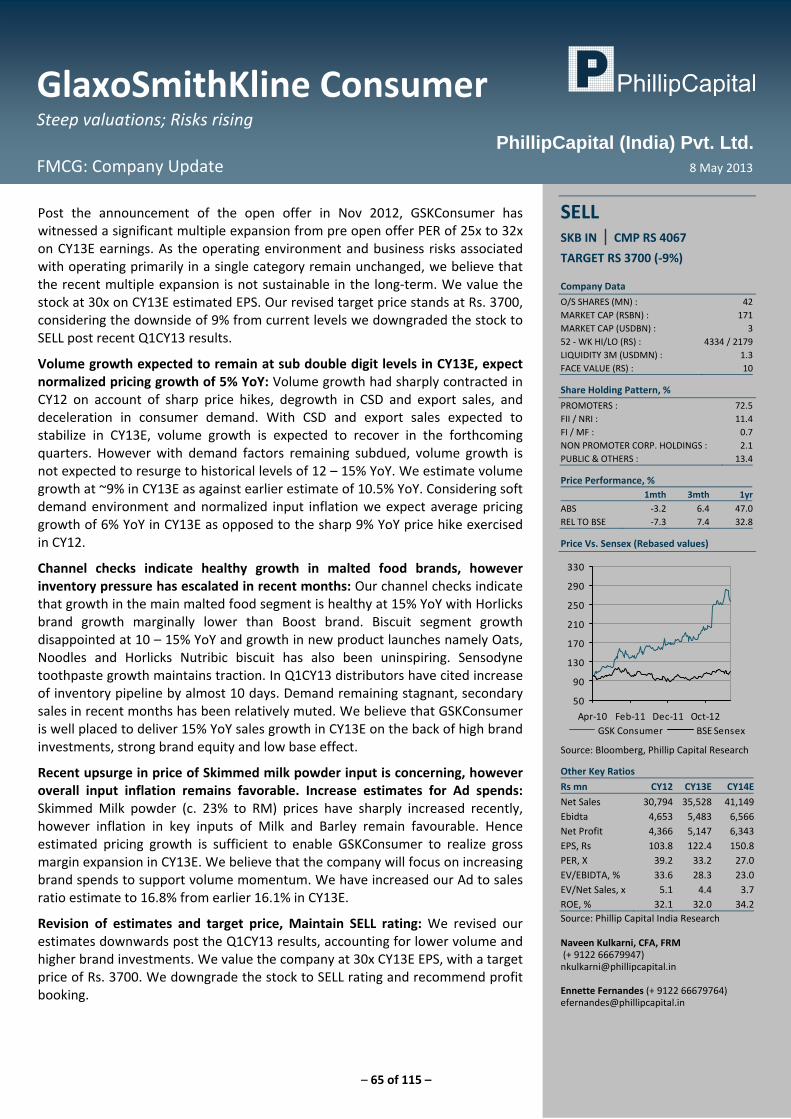
– 65 of 115 –
GlaxoSmithKline ConsumerSteep valuations; Risks rising
FMCG: Company Update 8 May 2013
PhillipCapital (India) Pvt. Ltd.
Post the announcement of the open offer in Nov 2012, GSKConsumer has witnessed a significant multiple expansion from pre open offer PER of 25x to 32x on CY13E earnings. As the operating environment and business risks associated with operating primarily in a single category remain unchanged, we believe that the recent multiple expansion is not sustainable in the long‐term. We value the stock at 30x on CY13E estimated EPS. Our revised target price stands at Rs. 3700, considering the downside of 9% from current levels we downgraded the stock to SELL post recent Q1CY13 results.
Volume growth expected to remain at sub double digit levels in CY13E, expect normalized pricing growth of 5% YoY: Volume growth had sharply contracted in CY12 on account of sharp price hikes, degrowth in CSD and export sales, and deceleration in consumer demand. With CSD and export sales expected to stabilize in CY13E, volume growth is expected to recover in the forthcoming quarters. However with demand factors remaining subdued, volume growth is not expected to resurge to historical levels of 12 – 15% YoY. We estimate volume growth at ~9% in CY13E as against earlier estimate of 10.5% YoY. Considering soft demand environment and normalized input inflation we expect average pricing growth of 6% YoY in CY13E as opposed to the sharp 9% YoY price hike exercised in CY12.
Channel checks indicate healthy growth in malted food brands, however inventory pressure has escalated in recent months: Our channel checks indicate that growth in the main malted food segment is healthy at 15% YoY with Horlicks brand growth marginally lower than Boost brand. Biscuit segment growth disappointed at 10 – 15% YoY and growth in new product launches namely Oats, Noodles and Horlicks Nutribic biscuit has also been uninspiring. Sensodyne toothpaste growth maintains traction. In Q1CY13 distributors have cited increase of inventory pipeline by almost 10 days. Demand remaining stagnant, secondary sales in recent months has been relatively muted. We believe that GSKConsumer is well placed to deliver 15% YoY sales growth in CY13E on the back of high brand investments, strong brand equity and low base effect.
Recent upsurge in price of Skimmed milk powder input is concerning, however overall input inflation remains favorable. Increase estimates for Ad spends: Skimmed Milk powder (c. 23% to RM) prices have sharply increased recently, however inflation in key inputs of Milk and Barley remain favourable. Hence estimated pricing growth is sufficient to enable GSKConsumer to realize gross margin expansion in CY13E. We believe that the company will focus on increasing brand spends to support volume momentum. We have increased our Ad to sales ratio estimate to 16.8% from earlier 16.1% in CY13E.
Revision of estimates and target price, Maintain SELL rating: We revised our estimates downwards post the Q1CY13 results, accounting for lower volume and higher brand investments. We value the company at 30x CY13E EPS, with a target price of Rs. 3700. We downgrade the stock to SELL rating and recommend profit booking.
SELL SKB IN | CMP RS 4067
TARGET RS 3700 (‐9%) Company Data
O/S SHARES (MN) : 42MARKET CAP (RSBN) : 171MARKET CAP (USDBN) : 352 ‐ WK HI/LO (RS) : 4334 / 2179LIQUIDITY 3M (USDMN) : 1.3FACE VALUE (RS) : 10
Share Holding Pattern, %
PROMOTERS : 72.5FII / NRI : 11.4FI / MF : 0.7NON PROMOTER CORP. HOLDINGS : 2.1PUBLIC & OTHERS : 13.4
Price Performance, % 1mth 3mth 1yr
ABS ‐3.2 6.4 47.0REL TO BSE ‐7.3 7.4 32.8
Price Vs. Sensex (Rebased values)
50
90
130
170
210
250
290
330
Apr‐10 Feb‐11 Dec‐11 Oct‐12GSK Consumer BSE Sensex
Source: Bloomberg, Phillip Capital Research
Other Key Ratios
Rs mn CY12 CY13E CY14E
Net Sales 30,794 35,528 41,149Ebidta 4,653 5,483 6,566Net Profit 4,366 5,147 6,343EPS, Rs 103.8 122.4 150.8PER, X 39.2 33.2 27.0EV/EBIDTA, % 33.6 28.3 23.0EV/Net Sales, x 5.1 4.4 3.7ROE, % 32.1 32.0 34.2Source: Phillip Capital India Research Naveen Kulkarni, CFA, FRM (+ 9122 66679947) [email protected] Ennette Fernandes (+ 9122 66679764) [email protected]
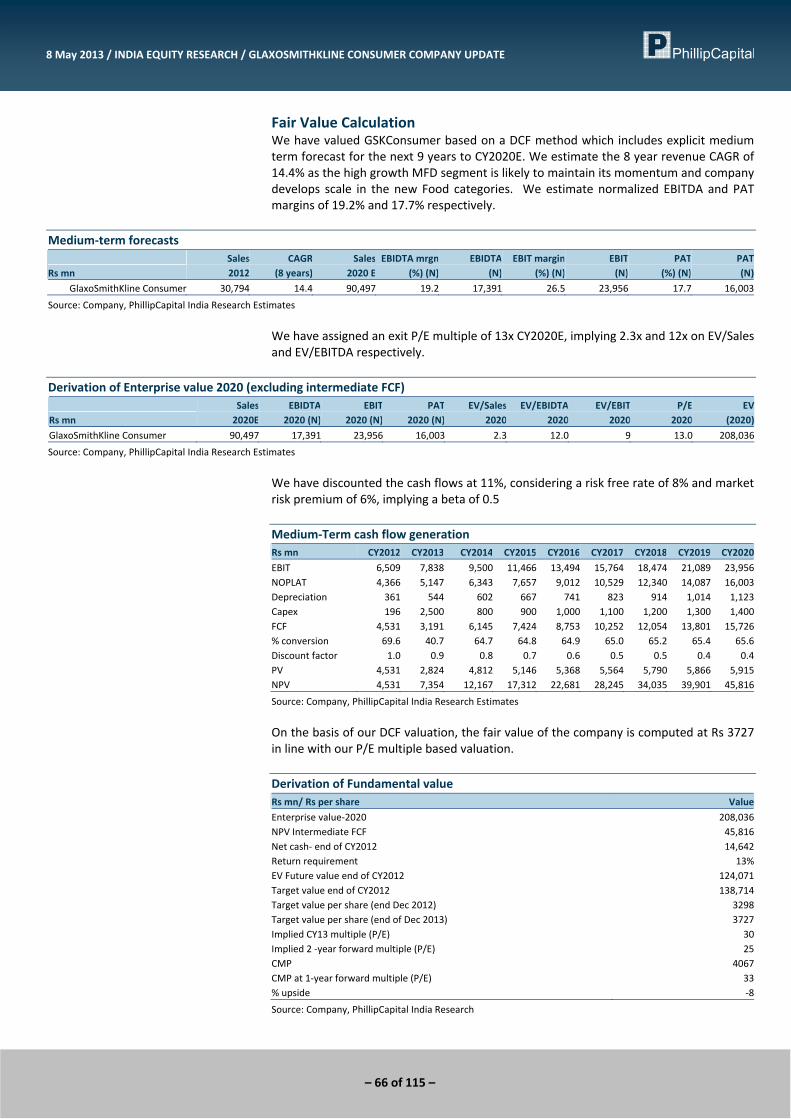
– 66 of 115 –
8 May 2013 / INDIA EQUITY RESEARCH / GLAXOSMITHKLINE CONSUMER COMPANY UPDATE
Fair Value Calculation We have valued GSKConsumer based on a DCF method which includes explicit medium term forecast for the next 9 years to CY2020E. We estimate the 8 year revenue CAGR of 14.4% as the high growth MFD segment is likely to maintain its momentum and company develops scale in the new Food categories. We estimate normalized EBITDA and PAT margins of 19.2% and 17.7% respectively.
Medium‐term forecasts
Rs mn Sales2012
CAGR (8 years)
Sales 2020 E
EBIDTA mrgn (%) (N)
EBIDTA (N)
EBIT margin (%) (N)
EBIT (N)
PAT(%) (N)
PAT (N)
GlaxoSmithKline Consumer 30,794 14.4 90,497 19.2 17,391 26.5 23,956 17.7 16,003
Source: Company, PhillipCapital India Research Estimates
We have assigned an exit P/E multiple of 13x CY2020E, implying 2.3x and 12x on EV/Sales and EV/EBITDA respectively.
Derivation of Enterprise value 2020 (excluding intermediate FCF)
Rs mn Sales
2020EEBIDTA 2020 (N)
EBIT 2020 (N)
PAT2020 (N)
EV/Sales 2020
EV/EBIDTA 2020
EV/EBIT 2020
P/E 2020
EV (2020)
GlaxoSmithKline Consumer 90,497 17,391 23,956 16,003 2.3 12.0 9 13.0 208,036
Source: Company, PhillipCapital India Research Estimates
We have discounted the cash flows at 11%, considering a risk free rate of 8% and market risk premium of 6%, implying a beta of 0.5 Medium‐Term cash flow generation Rs mn CY2012 CY2013 CY2014 CY2015 CY2016 CY2017 CY2018 CY2019 CY2020
EBIT 6,509 7,838 9,500 11,466 13,494 15,764 18,474 21,089 23,956NOPLAT 4,366 5,147 6,343 7,657 9,012 10,529 12,340 14,087 16,003Depreciation 361 544 602 667 741 823 914 1,014 1,123Capex 196 2,500 800 900 1,000 1,100 1,200 1,300 1,400FCF 4,531 3,191 6,145 7,424 8,753 10,252 12,054 13,801 15,726% conversion 69.6 40.7 64.7 64.8 64.9 65.0 65.2 65.4 65.6Discount factor 1.0 0.9 0.8 0.7 0.6 0.5 0.5 0.4 0.4PV 4,531 2,824 4,812 5,146 5,368 5,564 5,790 5,866 5,915NPV 4,531 7,354 12,167 17,312 22,681 28,245 34,035 39,901 45,816
Source: Company, PhillipCapital India Research Estimates
On the basis of our DCF valuation, the fair value of the company is computed at Rs 3727 in line with our P/E multiple based valuation. Derivation of Fundamental value Rs mn/ Rs per share Value
Enterprise value‐2020 208,036NPV Intermediate FCF 45,816Net cash‐ end of CY2012 14,642Return requirement 13%EV Future value end of CY2012 124,071Target value end of CY2012 138,714Target value per share (end Dec 2012) 3298Target value per share (end of Dec 2013) 3727Implied CY13 multiple (P/E) 30Implied 2 ‐year forward multiple (P/E) 25CMP 4067CMP at 1‐year forward multiple (P/E) 33% upside ‐8
Source: Company, PhillipCapital India Research
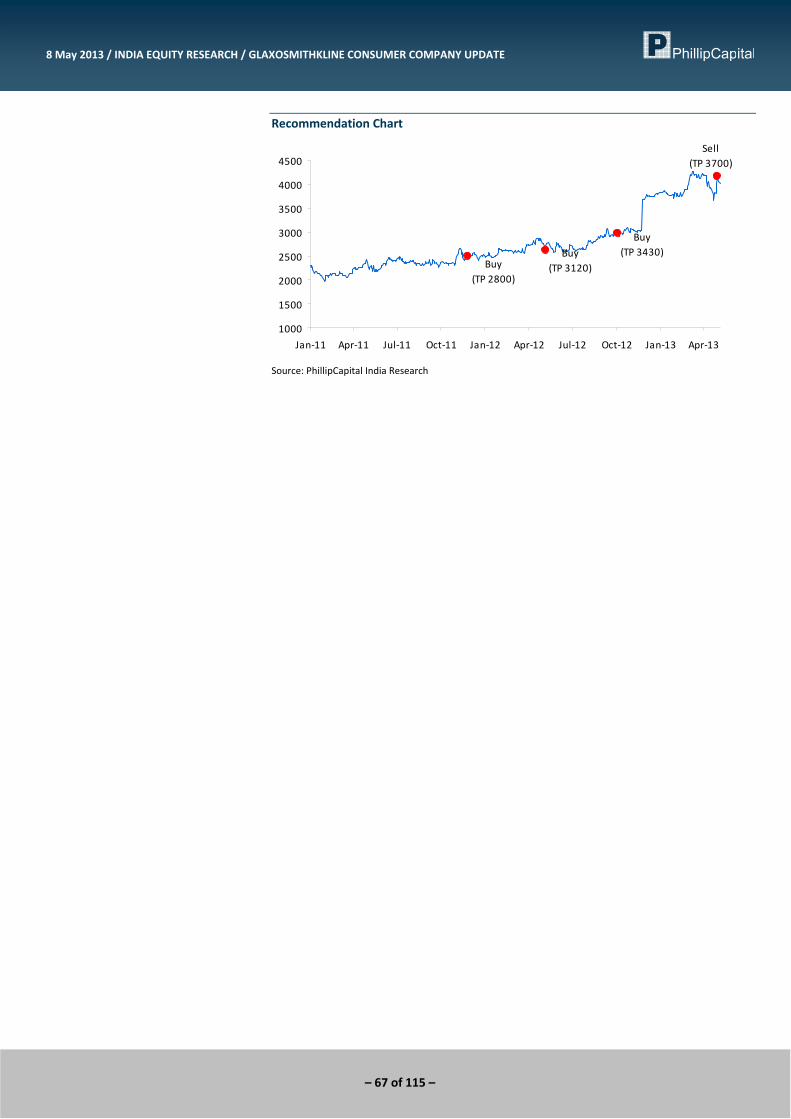
– 67 of 115 –
8 May 2013 / INDIA EQUITY RESEARCH / GLAXOSMITHKLINE CONSUMER COMPANY UPDATE
Recommendation Chart
Buy(TP 2800)
Buy(TP 3120)
Buy(TP 3430)
Sell(TP 3700)
1000
1500
2000
2500
3000
3500
4000
4500
Jan‐11 Apr‐11 Jul‐11 Oct‐11 Jan‐12 Apr‐12 Jul‐12 Oct‐12 Jan‐13 Apr‐13
Source: PhillipCapital India Research
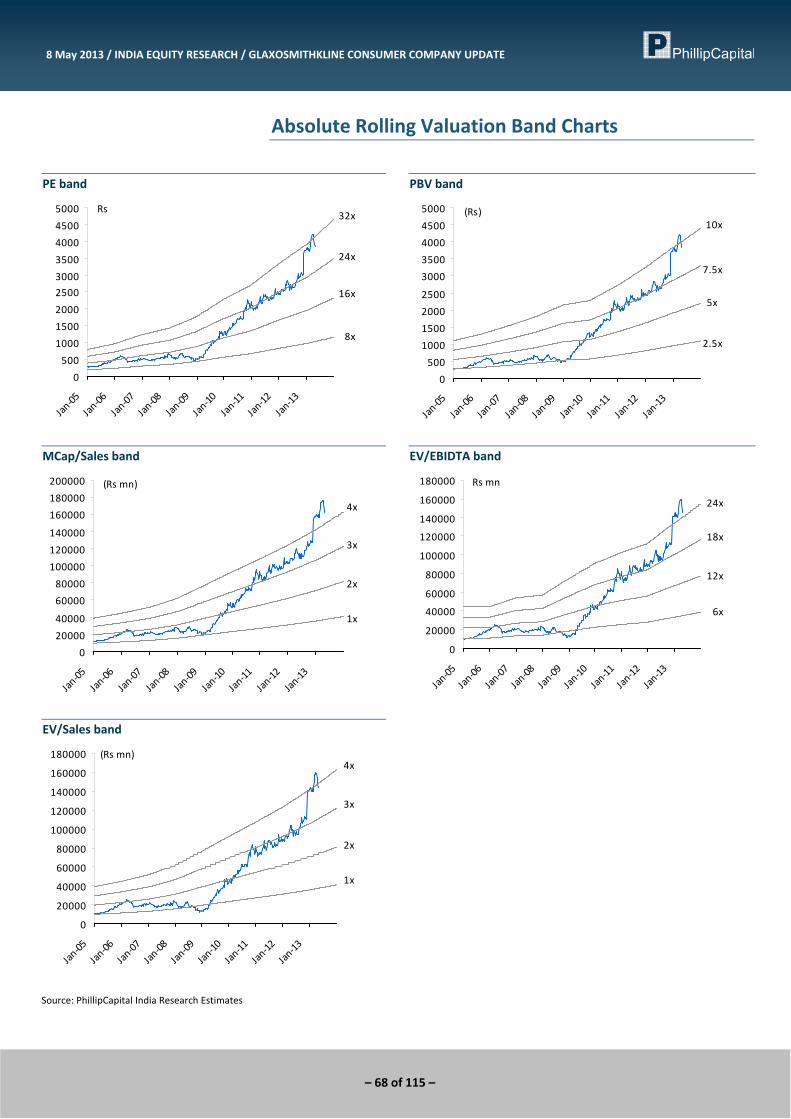
– 68 of 115 –
8 May 2013 / INDIA EQUITY RESEARCH / GLAXOSMITHKLINE CONSUMER COMPANY UPDATE
Absolute Rolling Valuation Band Charts
PE band
8x
16x
24x
32x
0
500
1000
1500
2000
2500
3000
3500
4000
4500
5000
Jan‐05
Jan‐06
Jan‐07
Jan‐08
Jan‐09
Jan‐10
Jan‐11
Jan‐12
Jan‐13
Rs
PBV band
2.5x
5x
7.5x
10x
0
500
1000
1500
2000
2500
3000
3500
4000
4500
5000
Jan‐05
Jan‐06
Jan‐07
Jan‐08
Jan‐09
Jan‐10
Jan‐11
Jan‐12
Jan‐13
(Rs)
MCap/Sales band
1x
2x
3x
4x
0
20000
40000
60000
80000
100000
120000
140000
160000
180000
200000
Jan‐05
Jan‐06
Jan‐07
Jan‐08
Jan‐09
Jan‐10
Jan‐11
Jan‐12
Jan‐13
(Rs mn)
EV/EBIDTA band
6x
12x
18x
24x
0
20000
40000
60000
80000
100000
120000
140000
160000
180000
Jan‐05
Jan‐06
Jan‐07
Jan‐08
Jan‐09
Jan‐10
Jan‐11
Jan‐12
Jan‐13
Rs mn
EV/Sales band
1x
2x
3x
4x
0
20000
40000
60000
80000
100000
120000
140000
160000
180000
Jan‐05
Jan‐06
Jan‐07
Jan‐08
Jan‐09
Jan‐10
Jan‐11
Jan‐12
Jan‐13
(Rs mn)
Source: PhillipCapital India Research Estimates
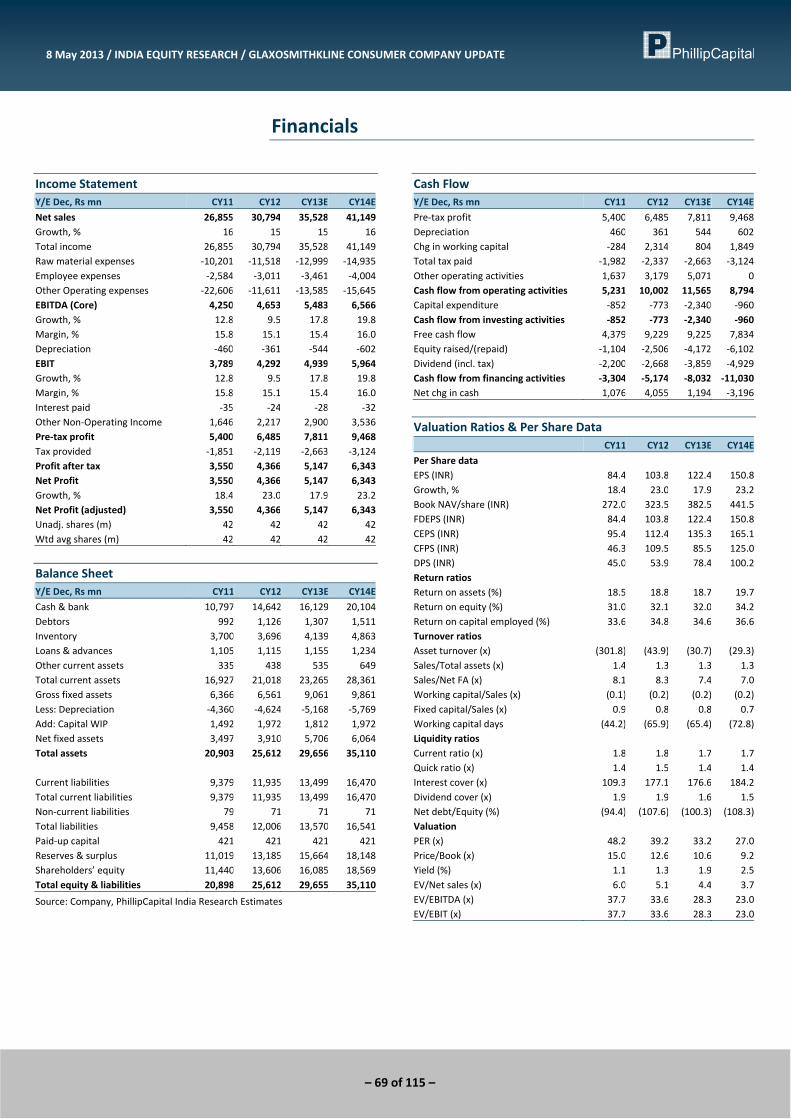
– 69 of 115 –
8 May 2013 / INDIA EQUITY RESEARCH / GLAXOSMITHKLINE CONSUMER COMPANY UPDATE
Financials
Income Statement Y/E Dec, Rs mn CY11 CY12 CY13E CY14E
Net sales 26,855 30,794 35,528 41,149Growth, % 16 15 15 16Total income 26,855 30,794 35,528 41,149Raw material expenses ‐10,201 ‐11,518 ‐12,999 ‐14,935Employee expenses ‐2,584 ‐3,011 ‐3,461 ‐4,004Other Operating expenses ‐22,606 ‐11,611 ‐13,585 ‐15,645EBITDA (Core) 4,250 4,653 5,483 6,566Growth, % 12.8 9.5 17.8 19.8Margin, % 15.8 15.1 15.4 16.0Depreciation ‐460 ‐361 ‐544 ‐602EBIT 3,789 4,292 4,939 5,964Growth, % 12.8 9.5 17.8 19.8Margin, % 15.8 15.1 15.4 16.0Interest paid ‐35 ‐24 ‐28 ‐32Other Non‐Operating Income 1,646 2,217 2,900 3,536Pre‐tax profit 5,400 6,485 7,811 9,468Tax provided ‐1,851 ‐2,119 ‐2,663 ‐3,124Profit after tax 3,550 4,366 5,147 6,343Net Profit 3,550 4,366 5,147 6,343Growth, % 18.4 23.0 17.9 23.2Net Profit (adjusted) 3,550 4,366 5,147 6,343Unadj. shares (m) 42 42 42 42Wtd avg shares (m) 42 42 42 42
Balance Sheet Y/E Dec, Rs mn CY11 CY12 CY13E CY14E
Cash & bank 10,797 14,642 16,129 20,104Debtors 992 1,126 1,307 1,511Inventory 3,700 3,696 4,139 4,863Loans & advances 1,105 1,115 1,155 1,234Other current assets 335 438 535 649Total current assets 16,927 21,018 23,265 28,361Gross fixed assets 6,366 6,561 9,061 9,861Less: Depreciation ‐4,360 ‐4,624 ‐5,168 ‐5,769Add: Capital WIP 1,492 1,972 1,812 1,972Net fixed assets 3,497 3,910 5,706 6,064Total assets 20,903 25,612 29,656 35,110 Current liabilities 9,379 11,935 13,499 16,470Total current liabilities 9,379 11,935 13,499 16,470Non‐current liabilities 79 71 71 71Total liabilities 9,458 12,006 13,570 16,541Paid‐up capital 421 421 421 421Reserves & surplus 11,019 13,185 15,664 18,148Shareholders’ equity 11,440 13,606 16,085 18,569Total equity & liabilities 20,898 25,612 29,655 35,110
Source: Company, PhillipCapital India Research Estimates
Cash Flow Y/E Dec, Rs mn CY11 CY12 CY13E CY14E
Pre‐tax profit 5,400 6,485 7,811 9,468Depreciation 460 361 544 602Chg in working capital ‐284 2,314 804 1,849Total tax paid ‐1,982 ‐2,337 ‐2,663 ‐3,124Other operating activities 1,637 3,179 5,071 0Cash flow from operating activities 5,231 10,002 11,565 8,794Capital expenditure ‐852 ‐773 ‐2,340 ‐960Cash flow from investing activities ‐852 ‐773 ‐2,340 ‐960Free cash flow 4,379 9,229 9,225 7,834Equity raised/(repaid) ‐1,104 ‐2,506 ‐4,172 ‐6,102Dividend (incl. tax) ‐2,200 ‐2,668 ‐3,859 ‐4,929Cash flow from financing activities ‐3,304 ‐5,174 ‐8,032 ‐11,030Net chg in cash 1,076 4,055 1,194 ‐3,196
Valuation Ratios & Per Share Data CY11 CY12 CY13E CY14E
Per Share data EPS (INR) 84.4 103.8 122.4 150.8Growth, % 18.4 23.0 17.9 23.2Book NAV/share (INR) 272.0 323.5 382.5 441.5FDEPS (INR) 84.4 103.8 122.4 150.8CEPS (INR) 95.4 112.4 135.3 165.1CFPS (INR) 46.3 109.5 85.5 125.0DPS (INR) 45.0 53.9 78.4 100.2Return ratios Return on assets (%) 18.5 18.8 18.7 19.7Return on equity (%) 31.0 32.1 32.0 34.2Return on capital employed (%) 33.6 34.8 34.6 36.6Turnover ratios Asset turnover (x) (301.8) (43.9) (30.7) (29.3)Sales/Total assets (x) 1.4 1.3 1.3 1.3Sales/Net FA (x) 8.1 8.3 7.4 7.0Working capital/Sales (x) (0.1) (0.2) (0.2) (0.2)Fixed capital/Sales (x) 0.9 0.8 0.8 0.7Working capital days (44.2) (65.9) (65.4) (72.8)Liquidity ratios Current ratio (x) 1.8 1.8 1.7 1.7Quick ratio (x) 1.4 1.5 1.4 1.4Interest cover (x) 109.3 177.1 176.6 184.2Dividend cover (x) 1.9 1.9 1.6 1.5Net debt/Equity (%) (94.4) (107.6) (100.3) (108.3)Valuation PER (x) 48.2 39.2 33.2 27.0Price/Book (x) 15.0 12.6 10.6 9.2Yield (%) 1.1 1.3 1.9 2.5EV/Net sales (x) 6.0 5.1 4.4 3.7EV/EBITDA (x) 37.7 33.6 28.3 23.0EV/EBIT (x) 37.7 33.6 28.3 23.0
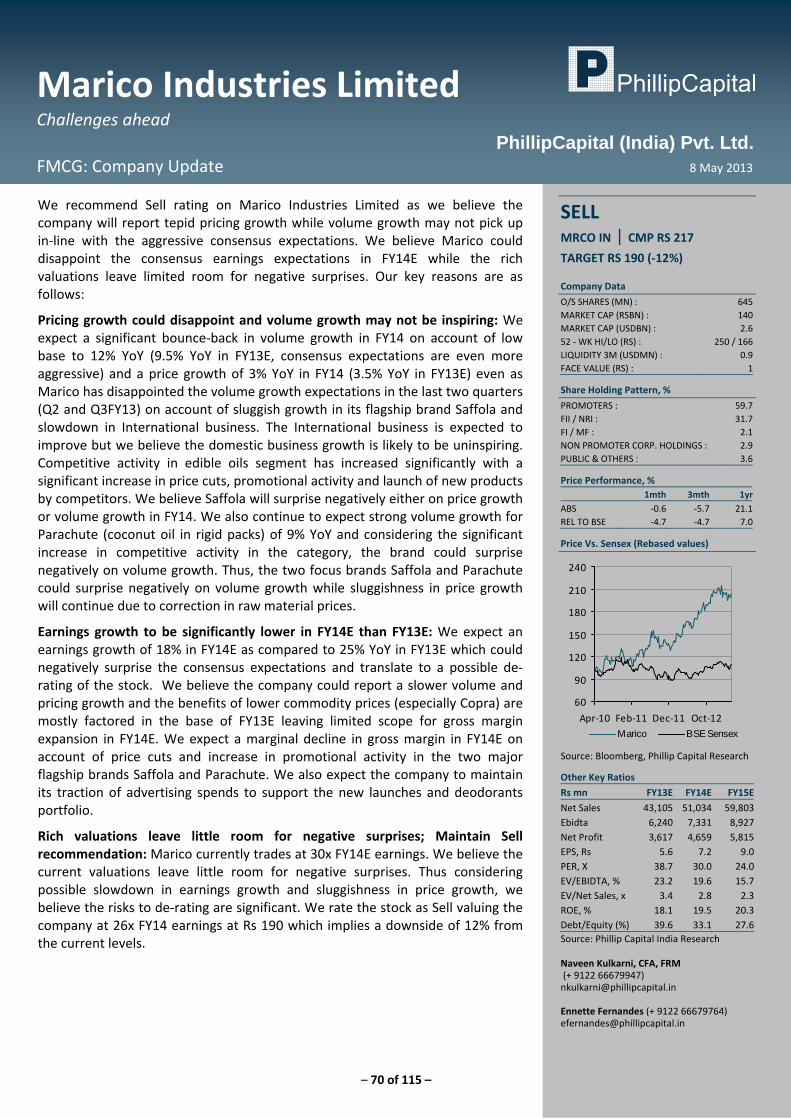
– 70 of 115 –
Marico Industries Limited Challenges ahead
FMCG: Company Update 8 May 2013
PhillipCapital (India) Pvt. Ltd.
We recommend Sell rating on Marico Industries Limited as we believe the company will report tepid pricing growth while volume growth may not pick up in‐line with the aggressive consensus expectations. We believe Marico could disappoint the consensus earnings expectations in FY14E while the rich valuations leave limited room for negative surprises. Our key reasons are as follows:
Pricing growth could disappoint and volume growth may not be inspiring: We expect a significant bounce‐back in volume growth in FY14 on account of low base to 12% YoY (9.5% YoY in FY13E, consensus expectations are even more aggressive) and a price growth of 3% YoY in FY14 (3.5% YoY in FY13E) even as Marico has disappointed the volume growth expectations in the last two quarters (Q2 and Q3FY13) on account of sluggish growth in its flagship brand Saffola and slowdown in International business. The International business is expected to improve but we believe the domestic business growth is likely to be uninspiring. Competitive activity in edible oils segment has increased significantly with a significant increase in price cuts, promotional activity and launch of new products by competitors. We believe Saffola will surprise negatively either on price growth or volume growth in FY14. We also continue to expect strong volume growth for Parachute (coconut oil in rigid packs) of 9% YoY and considering the significant increase in competitive activity in the category, the brand could surprise negatively on volume growth. Thus, the two focus brands Saffola and Parachute could surprise negatively on volume growth while sluggishness in price growth will continue due to correction in raw material prices.
Earnings growth to be significantly lower in FY14E than FY13E: We expect an earnings growth of 18% in FY14E as compared to 25% YoY in FY13E which could negatively surprise the consensus expectations and translate to a possible de‐rating of the stock. We believe the company could report a slower volume and pricing growth and the benefits of lower commodity prices (especially Copra) are mostly factored in the base of FY13E leaving limited scope for gross margin expansion in FY14E. We expect a marginal decline in gross margin in FY14E on account of price cuts and increase in promotional activity in the two major flagship brands Saffola and Parachute. We also expect the company to maintain its traction of advertising spends to support the new launches and deodorants portfolio.
Rich valuations leave little room for negative surprises; Maintain Sell recommendation: Marico currently trades at 30x FY14E earnings. We believe the current valuations leave little room for negative surprises. Thus considering possible slowdown in earnings growth and sluggishness in price growth, we believe the risks to de‐rating are significant. We rate the stock as Sell valuing the company at 26x FY14 earnings at Rs 190 which implies a downside of 12% from the current levels.
SELL MRCO IN | CMP RS 217
TARGET RS 190 (‐12%) Company Data
O/S SHARES (MN) : 645MARKET CAP (RSBN) : 140MARKET CAP (USDBN) : 2.652 ‐ WK HI/LO (RS) : 250 / 166LIQUIDITY 3M (USDMN) : 0.9FACE VALUE (RS) : 1
Share Holding Pattern, %
PROMOTERS : 59.7FII / NRI : 31.7FI / MF : 2.1NON PROMOTER CORP. HOLDINGS : 2.9PUBLIC & OTHERS : 3.6
Price Performance, % 1mth 3mth 1yr
ABS ‐0.6 ‐5.7 21.1REL TO BSE ‐4.7 ‐4.7 7.0
Price Vs. Sensex (Rebased values)
60
90
120
150
180
210
240
Apr‐10 Feb‐11 Dec‐11 Oct‐12Marico BSE Sensex
Source: Bloomberg, Phillip Capital Research
Other Key Ratios
Rs mn FY13E FY14E FY15E
Net Sales 43,105 51,034 59,803Ebidta 6,240 7,331 8,927Net Profit 3,617 4,659 5,815EPS, Rs 5.6 7.2 9.0PER, X 38.7 30.0 24.0EV/EBIDTA, % 23.2 19.6 15.7EV/Net Sales, x 3.4 2.8 2.3ROE, % 18.1 19.5 20.3Debt/Equity (%) 39.6 33.1 27.6Source: Phillip Capital India Research Naveen Kulkarni, CFA, FRM (+ 9122 66679947) [email protected] Ennette Fernandes (+ 9122 66679764) [email protected]
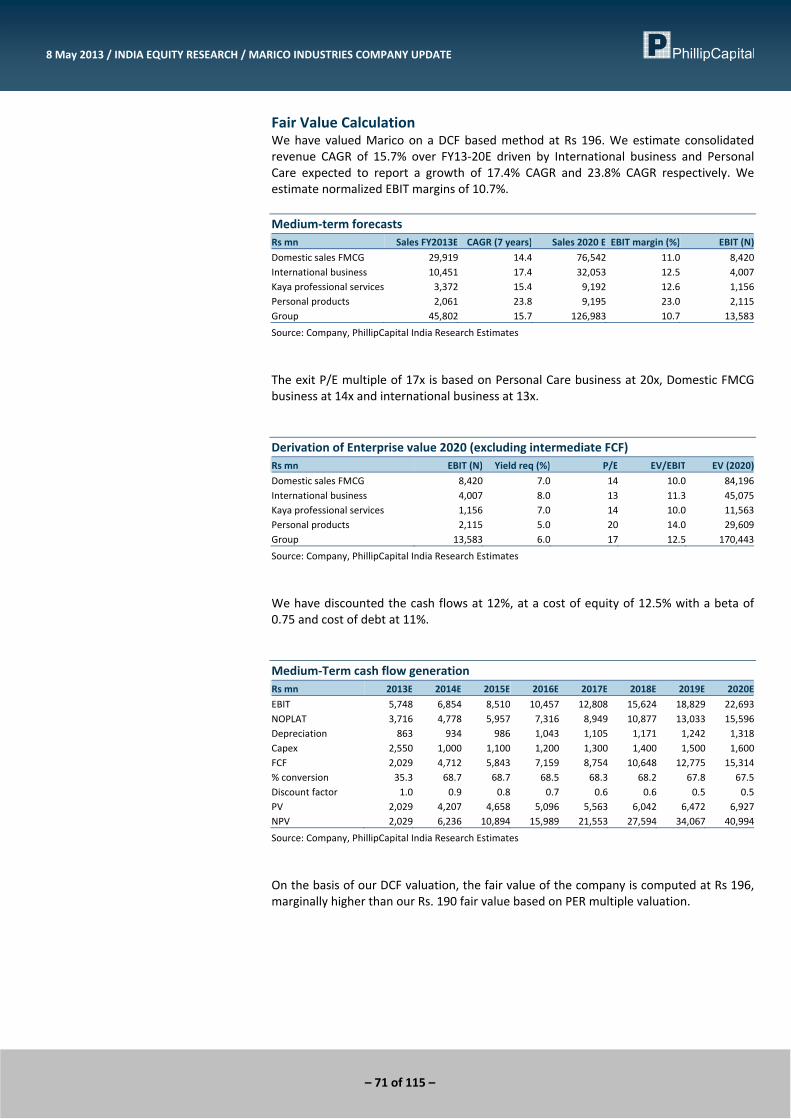
– 71 of 115 –
8 May 2013 / INDIA EQUITY RESEARCH / MARICO INDUSTRIES COMPANY UPDATE
Fair Value Calculation We have valued Marico on a DCF based method at Rs 196. We estimate consolidated revenue CAGR of 15.7% over FY13‐20E driven by International business and Personal Care expected to report a growth of 17.4% CAGR and 23.8% CAGR respectively. We estimate normalized EBIT margins of 10.7%. Medium‐term forecasts Rs mn Sales FY2013E CAGR (7 years) Sales 2020 E EBIT margin (%) EBIT (N)
Domestic sales FMCG 29,919 14.4 76,542 11.0 8,420International business 10,451 17.4 32,053 12.5 4,007Kaya professional services 3,372 15.4 9,192 12.6 1,156Personal products 2,061 23.8 9,195 23.0 2,115Group 45,802 15.7 126,983 10.7 13,583
Source: Company, PhillipCapital India Research Estimates
The exit P/E multiple of 17x is based on Personal Care business at 20x, Domestic FMCG business at 14x and international business at 13x. Derivation of Enterprise value 2020 (excluding intermediate FCF) Rs mn EBIT (N) Yield req (%) P/E EV/EBIT EV (2020)
Domestic sales FMCG 8,420 7.0 14 10.0 84,196 International business 4,007 8.0 13 11.3 45,075 Kaya professional services 1,156 7.0 14 10.0 11,563 Personal products 2,115 5.0 20 14.0 29,609 Group 13,583 6.0 17 12.5 170,443
Source: Company, PhillipCapital India Research Estimates
We have discounted the cash flows at 12%, at a cost of equity of 12.5% with a beta of 0.75 and cost of debt at 11%. Medium‐Term cash flow generation Rs mn 2013E 2014E 2015E 2016E 2017E 2018E 2019E 2020E
EBIT 5,748 6,854 8,510 10,457 12,808 15,624 18,829 22,693NOPLAT 3,716 4,778 5,957 7,316 8,949 10,877 13,033 15,596Depreciation 863 934 986 1,043 1,105 1,171 1,242 1,318Capex 2,550 1,000 1,100 1,200 1,300 1,400 1,500 1,600FCF 2,029 4,712 5,843 7,159 8,754 10,648 12,775 15,314% conversion 35.3 68.7 68.7 68.5 68.3 68.2 67.8 67.5Discount factor 1.0 0.9 0.8 0.7 0.6 0.6 0.5 0.5PV 2,029 4,207 4,658 5,096 5,563 6,042 6,472 6,927NPV 2,029 6,236 10,894 15,989 21,553 27,594 34,067 40,994
Source: Company, PhillipCapital India Research Estimates
On the basis of our DCF valuation, the fair value of the company is computed at Rs 196, marginally higher than our Rs. 190 fair value based on PER multiple valuation.
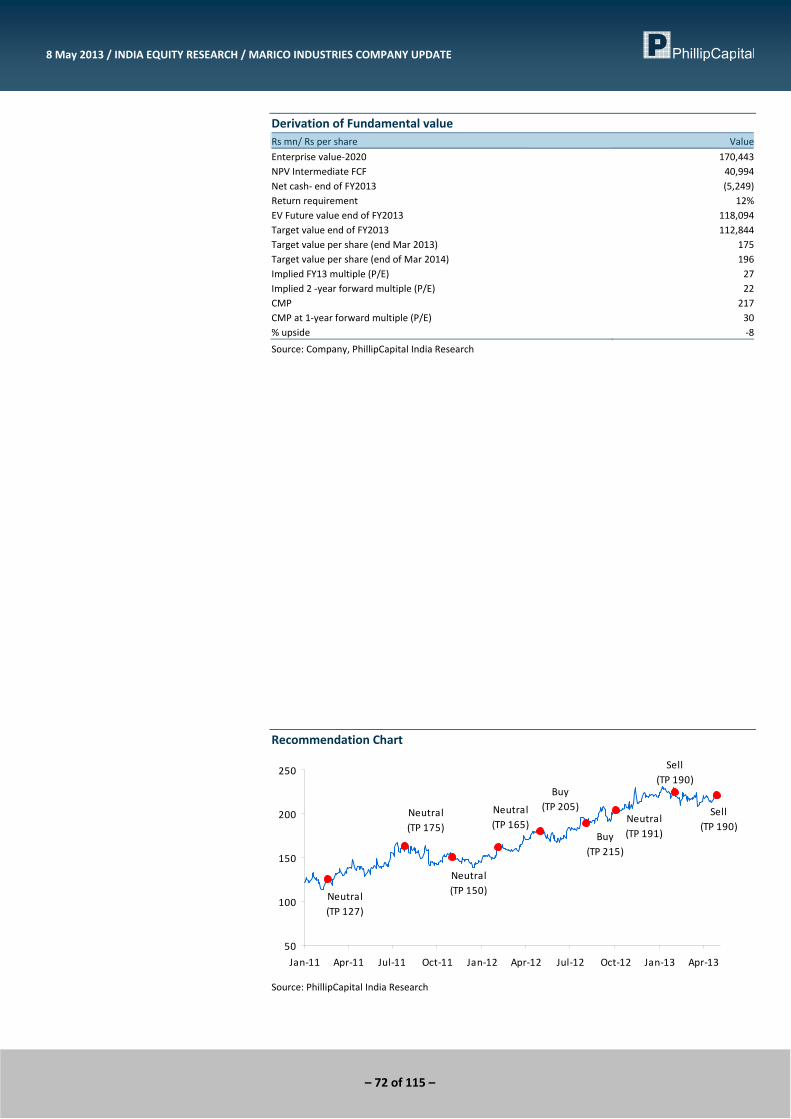
– 72 of 115 –
8 May 2013 / INDIA EQUITY RESEARCH / MARICO INDUSTRIES COMPANY UPDATE
Derivation of Fundamental value Rs mn/ Rs per share Value
Enterprise value‐2020 170,443NPV Intermediate FCF 40,994Net cash‐ end of FY2013 (5,249)Return requirement 12%EV Future value end of FY2013 118,094Target value end of FY2013 112,844Target value per share (end Mar 2013) 175Target value per share (end of Mar 2014) 196Implied FY13 multiple (P/E) 27Implied 2 ‐year forward multiple (P/E) 22CMP 217CMP at 1‐year forward multiple (P/E) 30% upside ‐8
Source: Company, PhillipCapital India Research
Recommendation Chart
Sell(TP 190)
Neutral(TP 127)
Neutral(TP 175)
Neutral(TP 150)
Neutral(TP 165)
Buy(TP 205)
Buy(TP 215)
Neutral(TP 191)
Sell(TP 190)
50
100
150
200
250
Jan‐11 Apr‐11 Jul‐11 Oct‐11 Jan‐12 Apr‐12 Jul‐12 Oct‐12 Jan‐13 Apr‐13
Source: PhillipCapital India Research
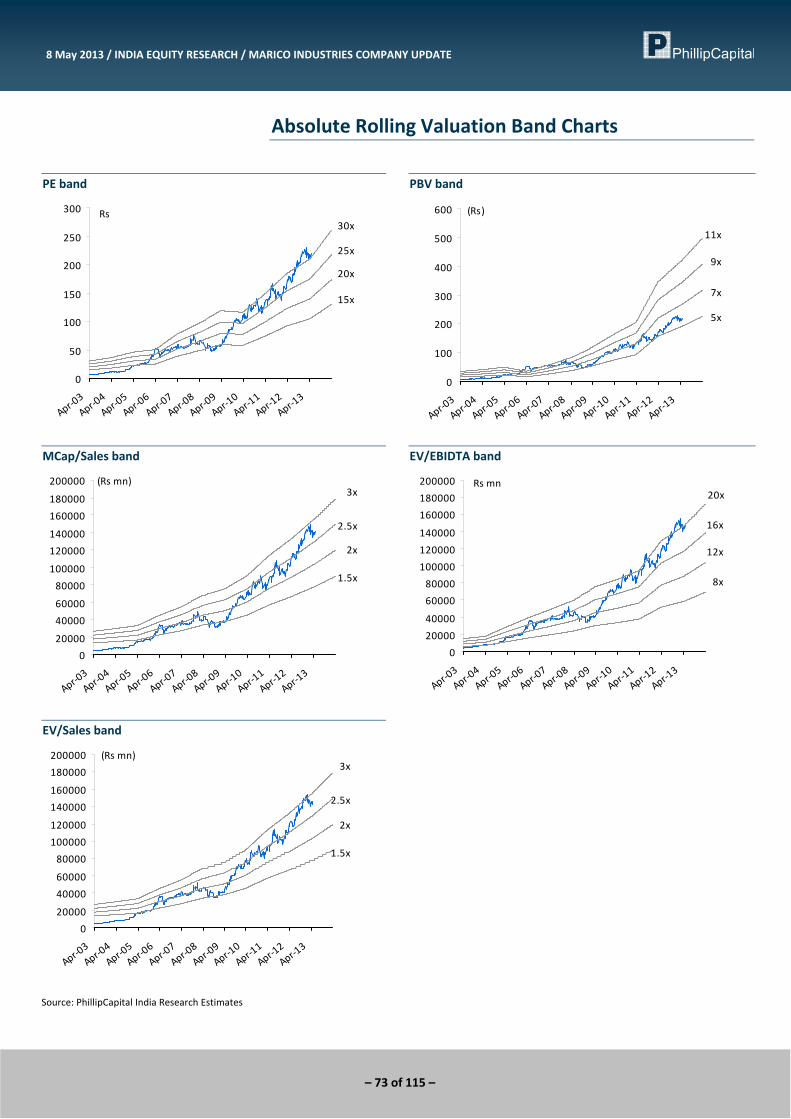
– 73 of 115 –
8 May 2013 / INDIA EQUITY RESEARCH / MARICO INDUSTRIES COMPANY UPDATE
Absolute Rolling Valuation Band Charts
PE band
15x
20x
25x
30x
0
50
100
150
200
250
300
Apr‐03Apr‐04Apr‐05Apr‐06Apr‐07Apr‐08Apr‐09Apr‐10Apr‐11Apr‐12Apr‐13
Rs
PBV band
5x
7x
9x
11x
0
100
200
300
400
500
600
Apr‐03Apr‐04Apr‐05Apr‐06Apr‐07Apr‐08Apr‐09Apr‐10Apr‐11Apr‐12Apr‐13
(Rs)
MCap/Sales band
1.5x
2x
2.5x
3x
0
20000
40000
60000
80000
100000
120000
140000
160000
180000
200000
Apr‐03Apr‐04Apr‐05Apr‐06Apr‐07Apr‐08Apr‐09Apr‐10Apr‐11Apr‐12Apr‐13
(Rs mn)
EV/EBIDTA band
8x
12x
16x
20x
0
20000
40000
60000
80000
100000
120000
140000
160000
180000
200000
Apr‐03Apr‐04Apr‐05Apr‐06Apr‐07Apr‐08Apr‐09Apr‐10Apr‐11Apr‐12Apr‐13
Rs mn
EV/Sales band
1.5x
2x
2.5x
3x
0
20000
40000
60000
80000
100000
120000
140000
160000
180000
200000
Apr‐03Apr‐04Apr‐05Apr‐06Apr‐07Apr‐08Apr‐09Apr‐10Apr‐11Apr‐12Apr‐13
(Rs mn)
Source: PhillipCapital India Research Estimates
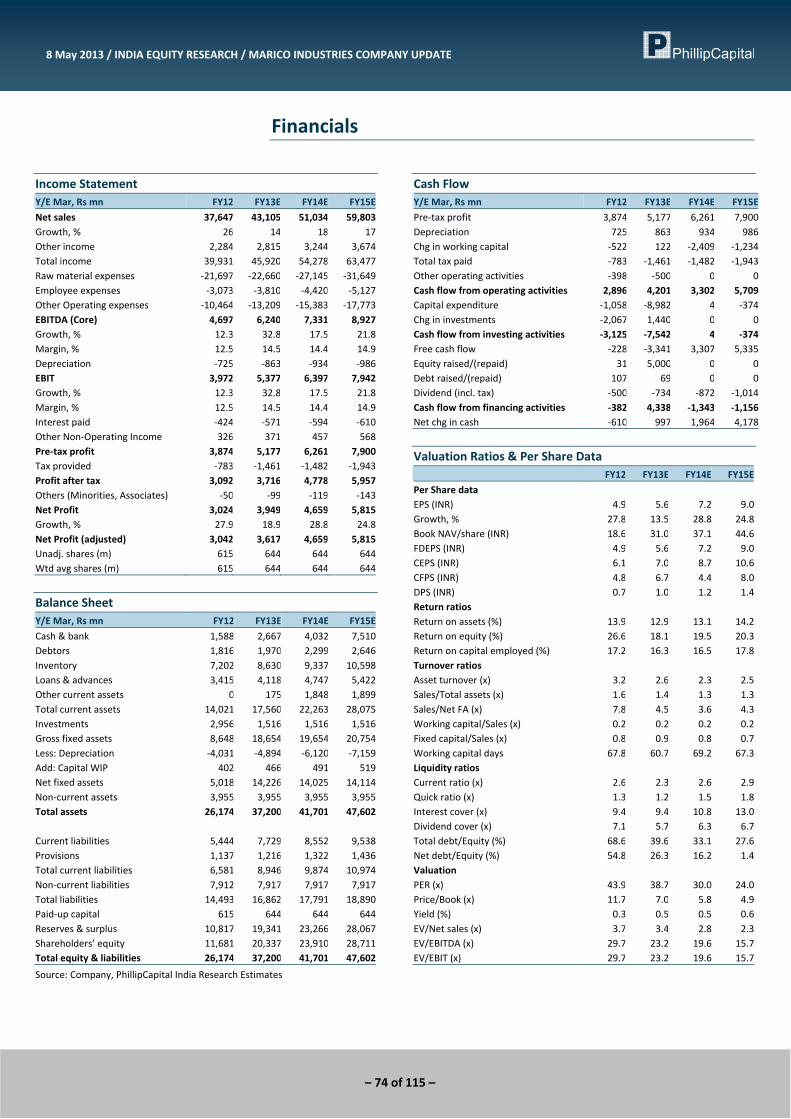
– 74 of 115 –
8 May 2013 / INDIA EQUITY RESEARCH / MARICO INDUSTRIES COMPANY UPDATE
Financials
Income Statement Y/E Mar, Rs mn FY12 FY13E FY14E FY15E
Net sales 37,647 43,105 51,034 59,803Growth, % 26 14 18 17Other income 2,284 2,815 3,244 3,674Total income 39,931 45,920 54,278 63,477Raw material expenses ‐21,697 ‐22,660 ‐27,145 ‐31,649Employee expenses ‐3,073 ‐3,810 ‐4,420 ‐5,127Other Operating expenses ‐10,464 ‐13,209 ‐15,383 ‐17,773EBITDA (Core) 4,697 6,240 7,331 8,927Growth, % 12.3 32.8 17.5 21.8Margin, % 12.5 14.5 14.4 14.9Depreciation ‐725 ‐863 ‐934 ‐986EBIT 3,972 5,377 6,397 7,942Growth, % 12.3 32.8 17.5 21.8Margin, % 12.5 14.5 14.4 14.9Interest paid ‐424 ‐571 ‐594 ‐610Other Non‐Operating Income 326 371 457 568Pre‐tax profit 3,874 5,177 6,261 7,900Tax provided ‐783 ‐1,461 ‐1,482 ‐1,943Profit after tax 3,092 3,716 4,778 5,957Others (Minorities, Associates) ‐50 ‐99 ‐119 ‐143Net Profit 3,024 3,949 4,659 5,815Growth, % 27.9 18.9 28.8 24.8Net Profit (adjusted) 3,042 3,617 4,659 5,815Unadj. shares (m) 615 644 644 644Wtd avg shares (m) 615 644 644 644
Balance Sheet Y/E Mar, Rs mn FY12 FY13E FY14E FY15E
Cash & bank 1,588 2,667 4,032 7,510Debtors 1,816 1,970 2,299 2,646Inventory 7,202 8,630 9,337 10,598Loans & advances 3,415 4,118 4,747 5,422Other current assets 0 175 1,848 1,899Total current assets 14,021 17,560 22,263 28,075Investments 2,956 1,516 1,516 1,516Gross fixed assets 8,648 18,654 19,654 20,754Less: Depreciation ‐4,031 ‐4,894 ‐6,120 ‐7,159Add: Capital WIP 402 466 491 519Net fixed assets 5,018 14,226 14,025 14,114Non‐current assets 3,955 3,955 3,955 3,955Total assets 26,174 37,200 41,701 47,602 Current liabilities 5,444 7,729 8,552 9,538Provisions 1,137 1,216 1,322 1,436Total current liabilities 6,581 8,946 9,874 10,974Non‐current liabilities 7,912 7,917 7,917 7,917Total liabilities 14,493 16,862 17,791 18,890Paid‐up capital 615 644 644 644Reserves & surplus 10,817 19,341 23,266 28,067Shareholders’ equity 11,681 20,337 23,910 28,711Total equity & liabilities 26,174 37,200 41,701 47,602
Source: Company, PhillipCapital India Research Estimates
Cash Flow Y/E Mar, Rs mn FY12 FY13E FY14E FY15E
Pre‐tax profit 3,874 5,177 6,261 7,900Depreciation 725 863 934 986Chg in working capital ‐522 122 ‐2,409 ‐1,234Total tax paid ‐783 ‐1,461 ‐1,482 ‐1,943Other operating activities ‐398 ‐500 0 0Cash flow from operating activities 2,896 4,201 3,302 5,709Capital expenditure ‐1,058 ‐8,982 4 ‐374Chg in investments ‐2,067 1,440 0 0Cash flow from investing activities ‐3,125 ‐7,542 4 ‐374Free cash flow ‐228 ‐3,341 3,307 5,335Equity raised/(repaid) 31 5,000 0 0Debt raised/(repaid) 107 69 0 0Dividend (incl. tax) ‐500 ‐734 ‐872 ‐1,014Cash flow from financing activities ‐382 4,338 ‐1,343 ‐1,156Net chg in cash ‐610 997 1,964 4,178
Valuation Ratios & Per Share Data FY12 FY13E FY14E FY15E
Per Share data EPS (INR) 4.9 5.6 7.2 9.0Growth, % 27.8 13.5 28.8 24.8Book NAV/share (INR) 18.6 31.0 37.1 44.6FDEPS (INR) 4.9 5.6 7.2 9.0CEPS (INR) 6.1 7.0 8.7 10.6CFPS (INR) 4.8 6.7 4.4 8.0DPS (INR) 0.7 1.0 1.2 1.4Return ratios Return on assets (%) 13.9 12.9 13.1 14.2Return on equity (%) 26.6 18.1 19.5 20.3Return on capital employed (%) 17.2 16.3 16.5 17.8Turnover ratios Asset turnover (x) 3.2 2.6 2.3 2.5Sales/Total assets (x) 1.6 1.4 1.3 1.3Sales/Net FA (x) 7.8 4.5 3.6 4.3Working capital/Sales (x) 0.2 0.2 0.2 0.2Fixed capital/Sales (x) 0.8 0.9 0.8 0.7Working capital days 67.8 60.7 69.2 67.3Liquidity ratios Current ratio (x) 2.6 2.3 2.6 2.9Quick ratio (x) 1.3 1.2 1.5 1.8Interest cover (x) 9.4 9.4 10.8 13.0Dividend cover (x) 7.1 5.7 6.3 6.7Total debt/Equity (%) 68.6 39.6 33.1 27.6Net debt/Equity (%) 54.8 26.3 16.2 1.4Valuation PER (x) 43.9 38.7 30.0 24.0Price/Book (x) 11.7 7.0 5.8 4.9Yield (%) 0.3 0.5 0.5 0.6EV/Net sales (x) 3.7 3.4 2.8 2.3EV/EBITDA (x) 29.7 23.2 19.6 15.7EV/EBIT (x) 29.7 23.2 19.6 15.7
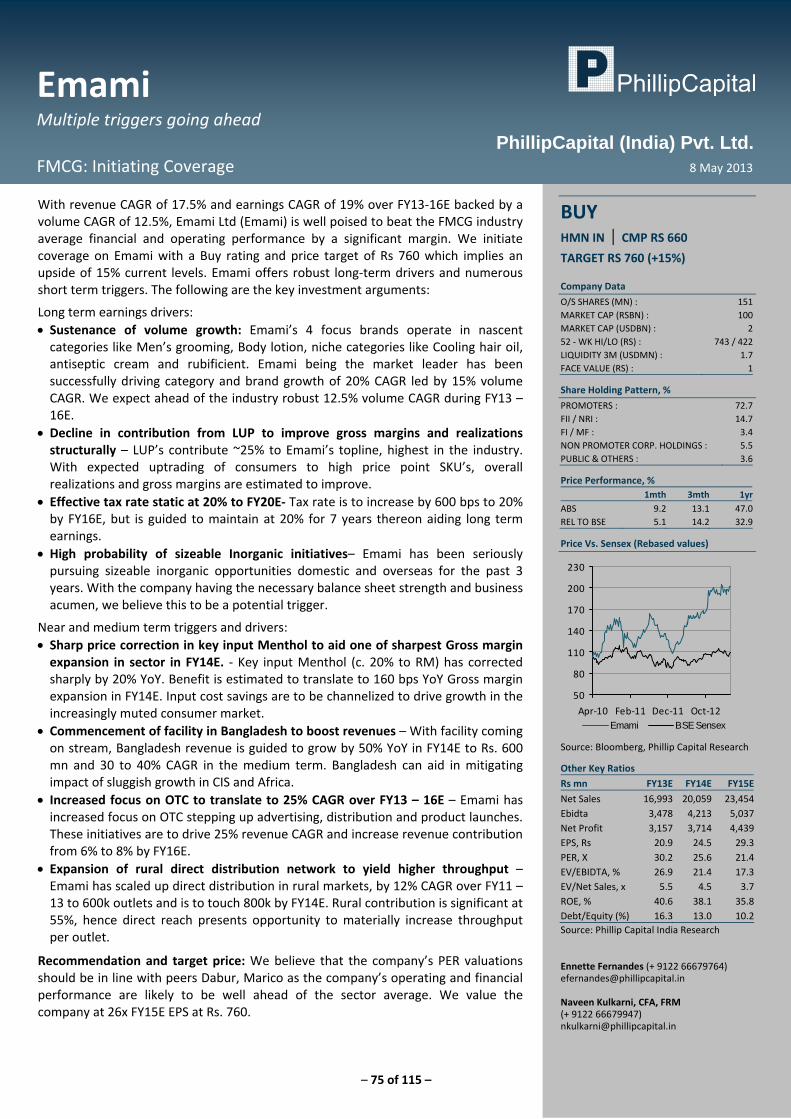
– 75 of 115 –
Emami Multiple triggers going ahead
FMCG: Initiating Coverage 8 May 2013
PhillipCapital (India) Pvt. Ltd.
With revenue CAGR of 17.5% and earnings CAGR of 19% over FY13‐16E backed by a volume CAGR of 12.5%, Emami Ltd (Emami) is well poised to beat the FMCG industry average financial and operating performance by a significant margin. We initiate coverage on Emami with a Buy rating and price target of Rs 760 which implies an upside of 15% current levels. Emami offers robust long‐term drivers and numerous short term triggers. The following are the key investment arguments:
Long term earnings drivers: • Sustenance of volume growth: Emami’s 4 focus brands operate in nascent categories like Men’s grooming, Body lotion, niche categories like Cooling hair oil, antiseptic cream and rubificient. Emami being the market leader has been successfully driving category and brand growth of 20% CAGR led by 15% volume CAGR. We expect ahead of the industry robust 12.5% volume CAGR during FY13 – 16E.
• Decline in contribution from LUP to improve gross margins and realizations structurally – LUP’s contribute ~25% to Emami’s topline, highest in the industry. With expected uptrading of consumers to high price point SKU’s, overall realizations and gross margins are estimated to improve.
• Effective tax rate static at 20% to FY20E‐ Tax rate is to increase by 600 bps to 20% by FY16E, but is guided to maintain at 20% for 7 years thereon aiding long term earnings.
• High probability of sizeable Inorganic initiatives– Emami has been seriously pursuing sizeable inorganic opportunities domestic and overseas for the past 3 years. With the company having the necessary balance sheet strength and business acumen, we believe this to be a potential trigger.
Near and medium term triggers and drivers: • Sharp price correction in key input Menthol to aid one of sharpest Gross margin expansion in sector in FY14E. ‐ Key input Menthol (c. 20% to RM) has corrected sharply by 20% YoY. Benefit is estimated to translate to 160 bps YoY Gross margin expansion in FY14E. Input cost savings are to be channelized to drive growth in the increasingly muted consumer market.
• Commencement of facility in Bangladesh to boost revenues – With facility coming on stream, Bangladesh revenue is guided to grow by 50% YoY in FY14E to Rs. 600 mn and 30 to 40% CAGR in the medium term. Bangladesh can aid in mitigating impact of sluggish growth in CIS and Africa.
• Increased focus on OTC to translate to 25% CAGR over FY13 – 16E – Emami has increased focus on OTC stepping up advertising, distribution and product launches. These initiatives are to drive 25% revenue CAGR and increase revenue contribution from 6% to 8% by FY16E.
• Expansion of rural direct distribution network to yield higher throughput – Emami has scaled up direct distribution in rural markets, by 12% CAGR over FY11 – 13 to 600k outlets and is to touch 800k by FY14E. Rural contribution is significant at 55%, hence direct reach presents opportunity to materially increase throughput per outlet.
Recommendation and target price: We believe that the company’s PER valuations should be in line with peers Dabur, Marico as the company’s operating and financial performance are likely to be well ahead of the sector average. We value the company at 26x FY15E EPS at Rs. 760.
BUY HMN IN | CMP RS 660
TARGET RS 760 (+15%) Company Data
O/S SHARES (MN) : 151MARKET CAP (RSBN) : 100MARKET CAP (USDBN) : 252 ‐ WK HI/LO (RS) : 743 / 422LIQUIDITY 3M (USDMN) : 1.7FACE VALUE (RS) : 1
Share Holding Pattern, %
PROMOTERS : 72.7FII / NRI : 14.7FI / MF : 3.4NON PROMOTER CORP. HOLDINGS : 5.5PUBLIC & OTHERS : 3.6
Price Performance, % 1mth 3mth 1yr
ABS 9.2 13.1 47.0REL TO BSE 5.1 14.2 32.9
Price Vs. Sensex (Rebased values)
50
80
110
140
170
200
230
Apr‐10 Feb‐11 Dec‐11 Oct‐12Emami BSE Sensex
Source: Bloomberg, Phillip Capital Research
Other Key Ratios
Rs mn FY13E FY14E FY15E
Net Sales 16,993 20,059 23,454Ebidta 3,478 4,213 5,037Net Profit 3,157 3,714 4,439EPS, Rs 20.9 24.5 29.3PER, X 30.2 25.6 21.4EV/EBIDTA, % 26.9 21.4 17.3EV/Net Sales, x 5.5 4.5 3.7ROE, % 40.6 38.1 35.8Debt/Equity (%) 16.3 13.0 10.2Source: Phillip Capital India Research Ennette Fernandes (+ 9122 66679764) [email protected] Naveen Kulkarni, CFA, FRM (+ 9122 66679947) [email protected]
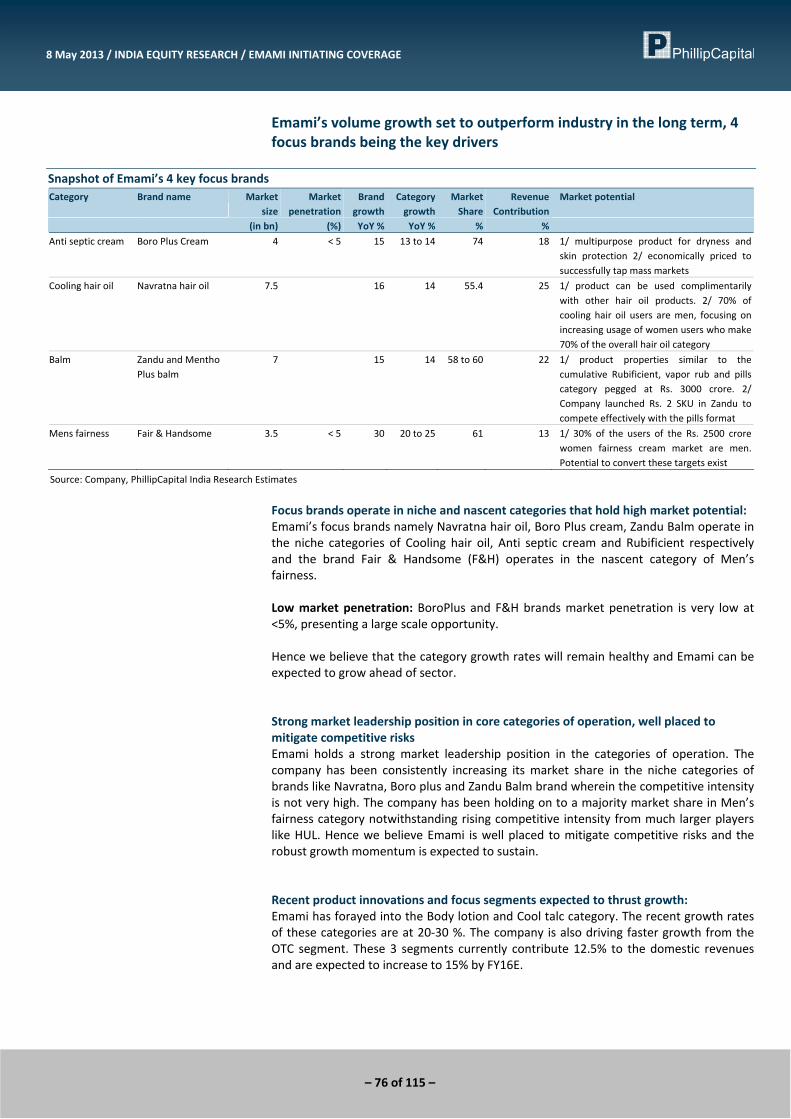
– 76 of 115 –
8 May 2013 / INDIA EQUITY RESEARCH / EMAMI INITIATING COVERAGE
Emami’s volume growth set to outperform industry in the long term, 4 focus brands being the key drivers
Snapshot of Emami’s 4 key focus brands Category Brand name Market
size Market
penetrationBrand
growthCategory growth
Market Share
Revenue Contribution
Market potential
(in bn) (%) YoY % YoY % % %
Anti septic cream Boro Plus Cream 4 < 5 15 13 to 14 74 18 1/ multipurpose product for dryness and skin protection 2/ economically priced to successfully tap mass markets
Cooling hair oil Navratna hair oil 7.5 16 14 55.4 25 1/ product can be used complimentarily with other hair oil products. 2/ 70% of cooling hair oil users are men, focusing on increasing usage of women users who make 70% of the overall hair oil category
Balm Zandu and Mentho Plus balm
7 15 14 58 to 60 22 1/ product properties similar to the cumulative Rubificient, vapor rub and pills category pegged at Rs. 3000 crore. 2/ Company launched Rs. 2 SKU in Zandu to compete effectively with the pills format
Mens fairness Fair & Handsome 3.5 < 5 30 20 to 25 61 13 1/ 30% of the users of the Rs. 2500 crore women fairness cream market are men. Potential to convert these targets exist
Source: Company, PhillipCapital India Research Estimates
Focus brands operate in niche and nascent categories that hold high market potential: Emami’s focus brands namely Navratna hair oil, Boro Plus cream, Zandu Balm operate in the niche categories of Cooling hair oil, Anti septic cream and Rubificient respectively and the brand Fair & Handsome (F&H) operates in the nascent category of Men’s fairness. Low market penetration: BoroPlus and F&H brands market penetration is very low at <5%, presenting a large scale opportunity. Hence we believe that the category growth rates will remain healthy and Emami can be expected to grow ahead of sector. Strong market leadership position in core categories of operation, well placed to mitigate competitive risks Emami holds a strong market leadership position in the categories of operation. The company has been consistently increasing its market share in the niche categories of brands like Navratna, Boro plus and Zandu Balm brand wherein the competitive intensity is not very high. The company has been holding on to a majority market share in Men’s fairness category notwithstanding rising competitive intensity from much larger players like HUL. Hence we believe Emami is well placed to mitigate competitive risks and the robust growth momentum is expected to sustain. Recent product innovations and focus segments expected to thrust growth: Emami has forayed into the Body lotion and Cool talc category. The recent growth rates of these categories are at 20‐30 %. The company is also driving faster growth from the OTC segment. These 3 segments currently contribute 12.5% to the domestic revenues and are expected to increase to 15% by FY16E.
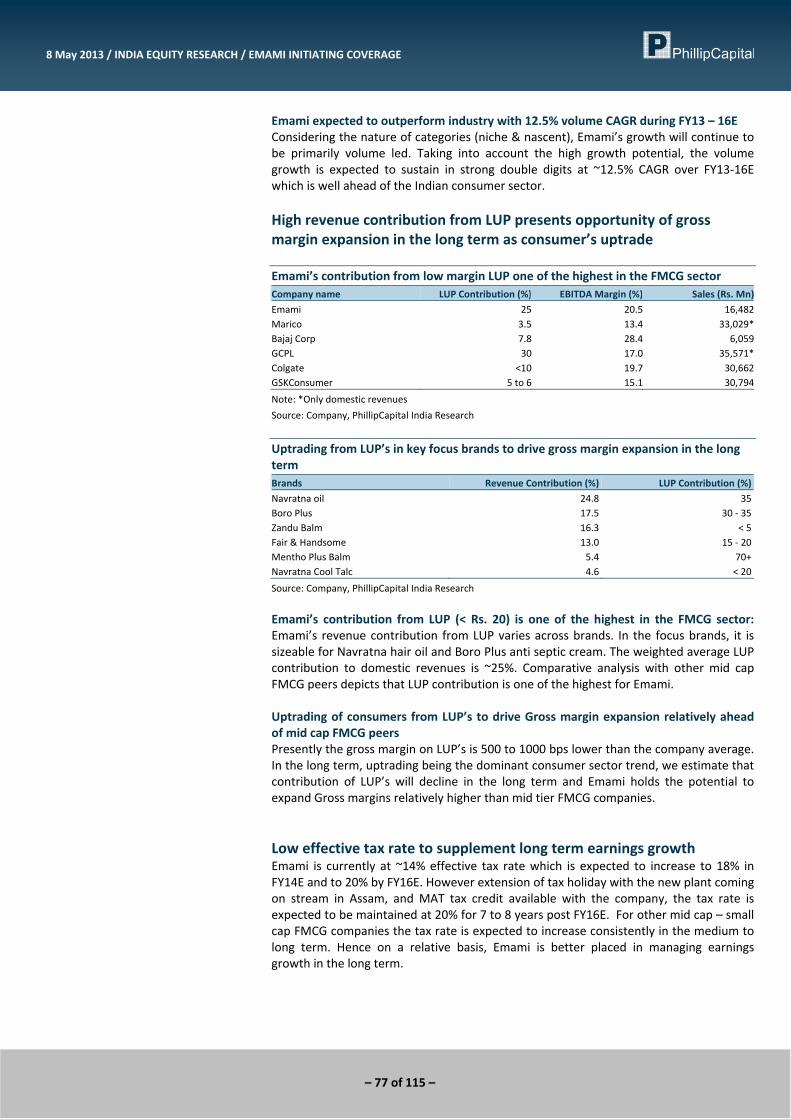
– 77 of 115 –
8 May 2013 / INDIA EQUITY RESEARCH / EMAMI INITIATING COVERAGE
Emami expected to outperform industry with 12.5% volume CAGR during FY13 – 16E Considering the nature of categories (niche & nascent), Emami’s growth will continue to be primarily volume led. Taking into account the high growth potential, the volume growth is expected to sustain in strong double digits at ~12.5% CAGR over FY13‐16E which is well ahead of the Indian consumer sector. High revenue contribution from LUP presents opportunity of gross margin expansion in the long term as consumer’s uptrade Emami’s contribution from low margin LUP one of the highest in the FMCG sector Company name LUP Contribution (%) EBITDA Margin (%) Sales (Rs. Mn)
Emami 25 20.5 16,482 Marico 3.5 13.4 33,029*Bajaj Corp 7.8 28.4 6,059 GCPL 30 17.0 35,571*Colgate <10 19.7 30,662 GSKConsumer 5 to 6 15.1 30,794
Note: *Only domestic revenues
Source: Company, PhillipCapital India Research
Uptrading from LUP’s in key focus brands to drive gross margin expansion in the long term Brands Revenue Contribution (%) LUP Contribution (%)
Navratna oil 24.8 35Boro Plus 17.5 30 ‐ 35Zandu Balm 16.3 < 5Fair & Handsome 13.0 15 ‐ 20Mentho Plus Balm 5.4 70+Navratna Cool Talc 4.6 < 20
Source: Company, PhillipCapital India Research
Emami’s contribution from LUP (< Rs. 20) is one of the highest in the FMCG sector: Emami’s revenue contribution from LUP varies across brands. In the focus brands, it is sizeable for Navratna hair oil and Boro Plus anti septic cream. The weighted average LUP contribution to domestic revenues is ~25%. Comparative analysis with other mid cap FMCG peers depicts that LUP contribution is one of the highest for Emami. Uptrading of consumers from LUP’s to drive Gross margin expansion relatively ahead of mid cap FMCG peers Presently the gross margin on LUP’s is 500 to 1000 bps lower than the company average. In the long term, uptrading being the dominant consumer sector trend, we estimate that contribution of LUP’s will decline in the long term and Emami holds the potential to expand Gross margins relatively higher than mid tier FMCG companies. Low effective tax rate to supplement long term earnings growth Emami is currently at ~14% effective tax rate which is expected to increase to 18% in FY14E and to 20% by FY16E. However extension of tax holiday with the new plant coming on stream in Assam, and MAT tax credit available with the company, the tax rate is expected to be maintained at 20% for 7 to 8 years post FY16E. For other mid cap – small cap FMCG companies the tax rate is expected to increase consistently in the medium to long term. Hence on a relative basis, Emami is better placed in managing earnings growth in the long term.
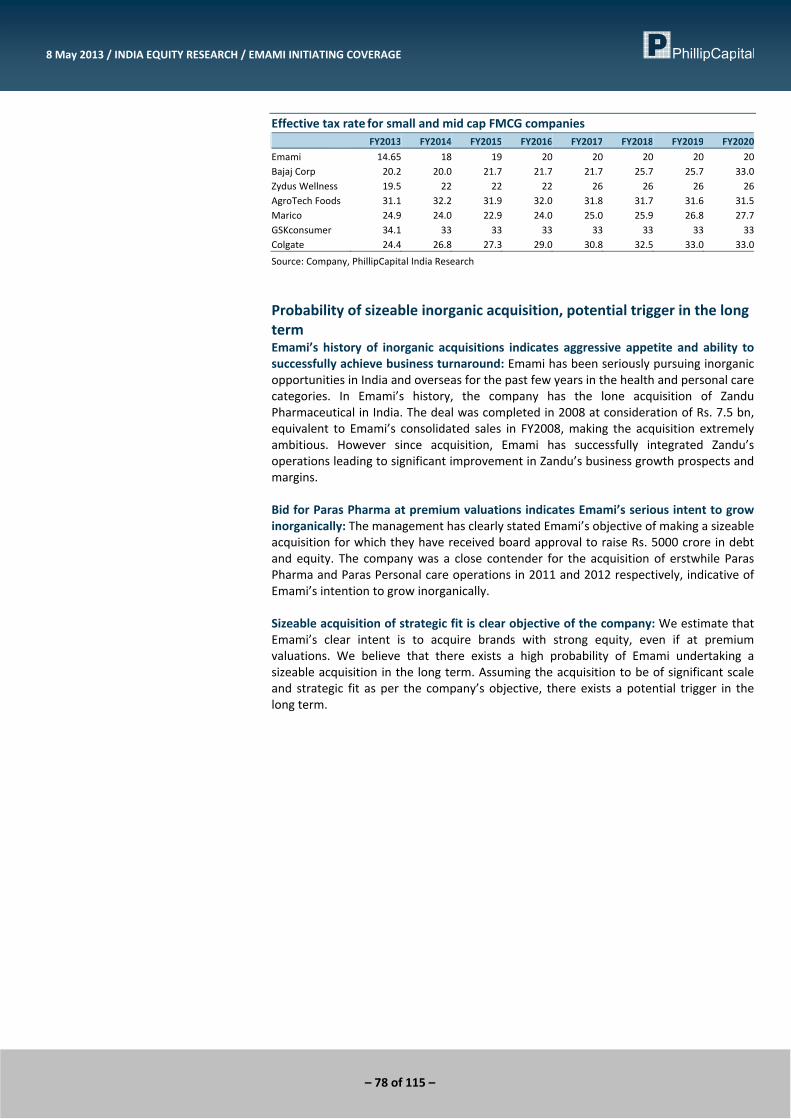
– 78 of 115 –
8 May 2013 / INDIA EQUITY RESEARCH / EMAMI INITIATING COVERAGE
Effective tax rate for small and mid cap FMCG companies FY2013 FY2014 FY2015 FY2016 FY2017 FY2018 FY2019 FY2020
Emami 14.65 18 19 20 20 20 20 20Bajaj Corp 20.2 20.0 21.7 21.7 21.7 25.7 25.7 33.0Zydus Wellness 19.5 22 22 22 26 26 26 26AgroTech Foods 31.1 32.2 31.9 32.0 31.8 31.7 31.6 31.5Marico 24.9 24.0 22.9 24.0 25.0 25.9 26.8 27.7GSKconsumer 34.1 33 33 33 33 33 33 33Colgate 24.4 26.8 27.3 29.0 30.8 32.5 33.0 33.0
Source: Company, PhillipCapital India Research
Probability of sizeable inorganic acquisition, potential trigger in the long term Emami’s history of inorganic acquisitions indicates aggressive appetite and ability to successfully achieve business turnaround: Emami has been seriously pursuing inorganic opportunities in India and overseas for the past few years in the health and personal care categories. In Emami’s history, the company has the lone acquisition of Zandu Pharmaceutical in India. The deal was completed in 2008 at consideration of Rs. 7.5 bn, equivalent to Emami’s consolidated sales in FY2008, making the acquisition extremely ambitious. However since acquisition, Emami has successfully integrated Zandu’s operations leading to significant improvement in Zandu’s business growth prospects and margins. Bid for Paras Pharma at premium valuations indicates Emami’s serious intent to grow inorganically: The management has clearly stated Emami’s objective of making a sizeable acquisition for which they have received board approval to raise Rs. 5000 crore in debt and equity. The company was a close contender for the acquisition of erstwhile Paras Pharma and Paras Personal care operations in 2011 and 2012 respectively, indicative of Emami’s intention to grow inorganically. Sizeable acquisition of strategic fit is clear objective of the company: We estimate that Emami’s clear intent is to acquire brands with strong equity, even if at premium valuations. We believe that there exists a high probability of Emami undertaking a sizeable acquisition in the long term. Assuming the acquisition to be of significant scale and strategic fit as per the company’s objective, there exists a potential trigger in the long term.
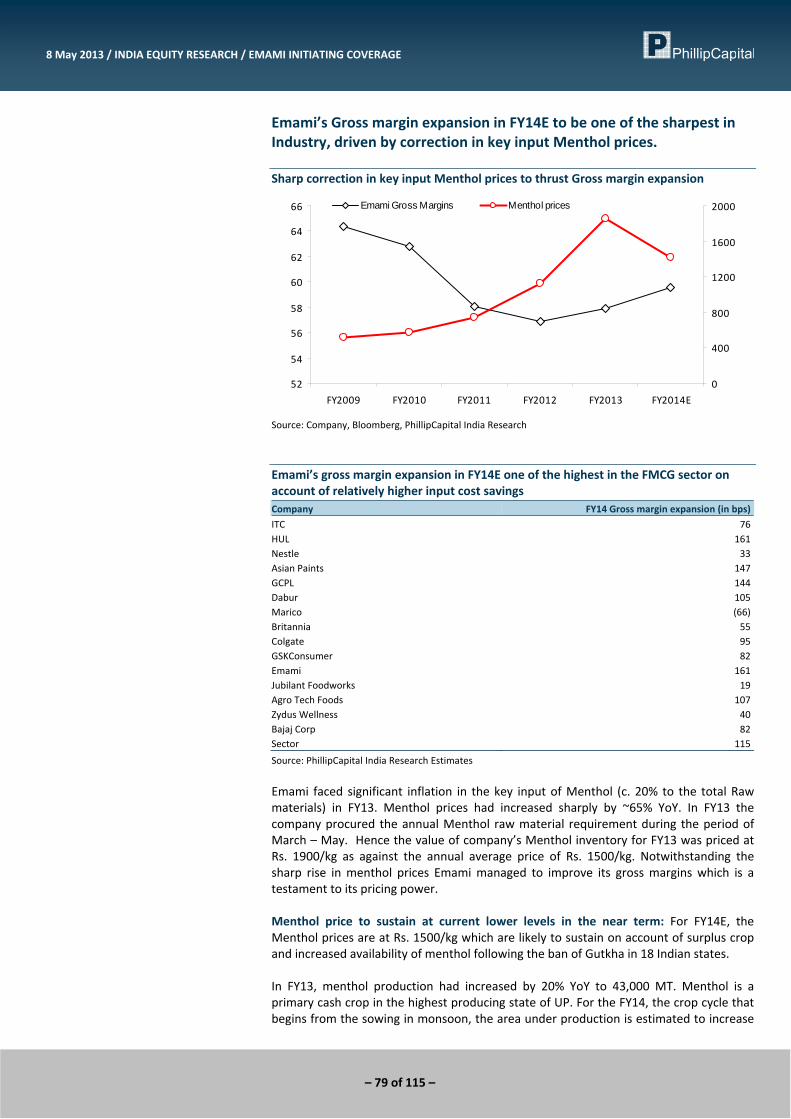
– 79 of 115 –
8 May 2013 / INDIA EQUITY RESEARCH / EMAMI INITIATING COVERAGE
Emami’s Gross margin expansion in FY14E to be one of the sharpest in Industry, driven by correction in key input Menthol prices. Sharp correction in key input Menthol prices to thrust Gross margin expansion
52
54
56
58
60
62
64
66
FY2009 FY2010 FY2011 FY2012 FY2013 FY2014E
0
400
800
1200
1600
2000Emami Gross Margins Menthol prices
Source: Company, Bloomberg, PhillipCapital India Research
Emami’s gross margin expansion in FY14E one of the highest in the FMCG sector on account of relatively higher input cost savings Company FY14 Gross margin expansion (in bps)
ITC 76 HUL 161 Nestle 33 Asian Paints 147 GCPL 144 Dabur 105 Marico (66)Britannia 55 Colgate 95 GSKConsumer 82 Emami 161 Jubilant Foodworks 19 Agro Tech Foods 107 Zydus Wellness 40 Bajaj Corp 82 Sector 115
Source: PhillipCapital India Research Estimates
Emami faced significant inflation in the key input of Menthol (c. 20% to the total Raw materials) in FY13. Menthol prices had increased sharply by ~65% YoY. In FY13 the company procured the annual Menthol raw material requirement during the period of March – May. Hence the value of company’s Menthol inventory for FY13 was priced at Rs. 1900/kg as against the annual average price of Rs. 1500/kg. Notwithstanding the sharp rise in menthol prices Emami managed to improve its gross margins which is a testament to its pricing power. Menthol price to sustain at current lower levels in the near term: For FY14E, the Menthol prices are at Rs. 1500/kg which are likely to sustain on account of surplus crop and increased availability of menthol following the ban of Gutkha in 18 Indian states. In FY13, menthol production had increased by 20% YoY to 43,000 MT. Menthol is a primary cash crop in the highest producing state of UP. For the FY14, the crop cycle that begins from the sowing in monsoon, the area under production is estimated to increase
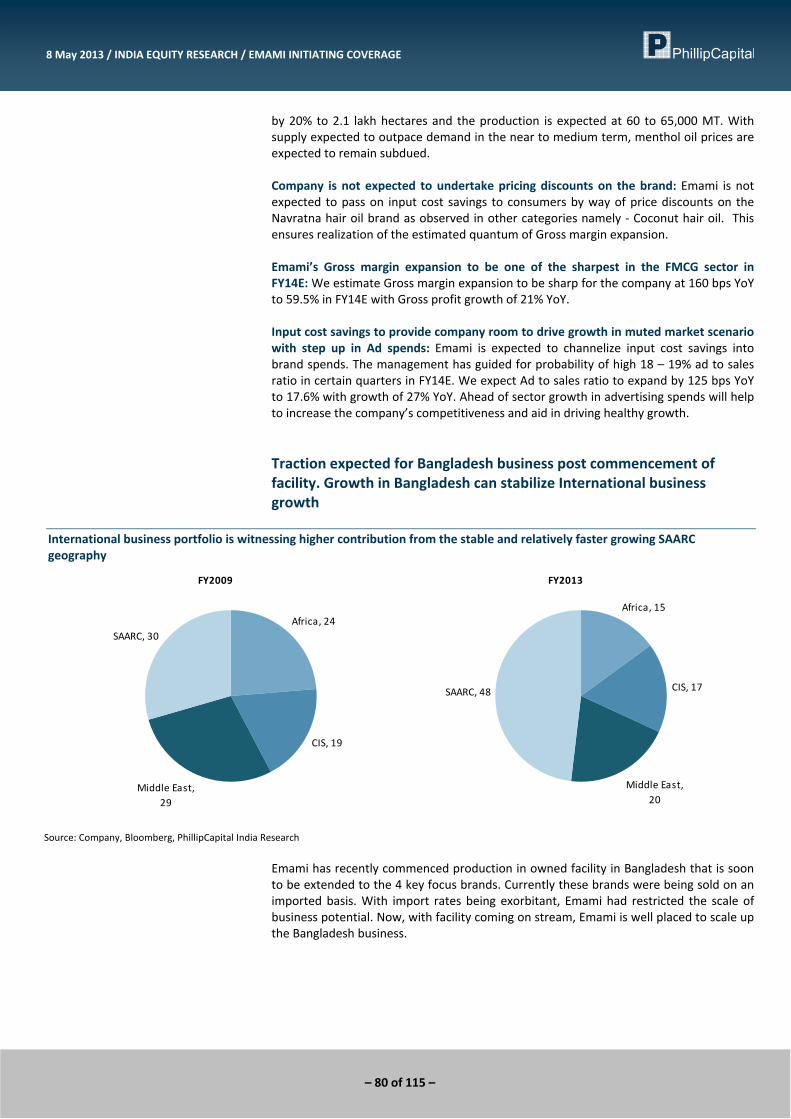
– 80 of 115 –
8 May 2013 / INDIA EQUITY RESEARCH / EMAMI INITIATING COVERAGE
by 20% to 2.1 lakh hectares and the production is expected at 60 to 65,000 MT. With supply expected to outpace demand in the near to medium term, menthol oil prices are expected to remain subdued. Company is not expected to undertake pricing discounts on the brand: Emami is not expected to pass on input cost savings to consumers by way of price discounts on the Navratna hair oil brand as observed in other categories namely ‐ Coconut hair oil. This ensures realization of the estimated quantum of Gross margin expansion. Emami’s Gross margin expansion to be one of the sharpest in the FMCG sector in FY14E: We estimate Gross margin expansion to be sharp for the company at 160 bps YoY to 59.5% in FY14E with Gross profit growth of 21% YoY. Input cost savings to provide company room to drive growth in muted market scenario with step up in Ad spends: Emami is expected to channelize input cost savings into brand spends. The management has guided for probability of high 18 – 19% ad to sales ratio in certain quarters in FY14E. We expect Ad to sales ratio to expand by 125 bps YoY to 17.6% with growth of 27% YoY. Ahead of sector growth in advertising spends will help to increase the company’s competitiveness and aid in driving healthy growth. Traction expected for Bangladesh business post commencement of facility. Growth in Bangladesh can stabilize International business growth
International business portfolio is witnessing higher contribution from the stable and relatively faster growing SAARC geography
FY2009
Africa, 24
CIS, 19
Middle East, 29
SAARC, 30
FY2013
Africa, 15
CIS, 17
Middle East, 20
SAARC, 48
Source: Company, Bloomberg, PhillipCapital India Research
Emami has recently commenced production in owned facility in Bangladesh that is soon to be extended to the 4 key focus brands. Currently these brands were being sold on an imported basis. With import rates being exorbitant, Emami had restricted the scale of business potential. Now, with facility coming on stream, Emami is well placed to scale up the Bangladesh business.
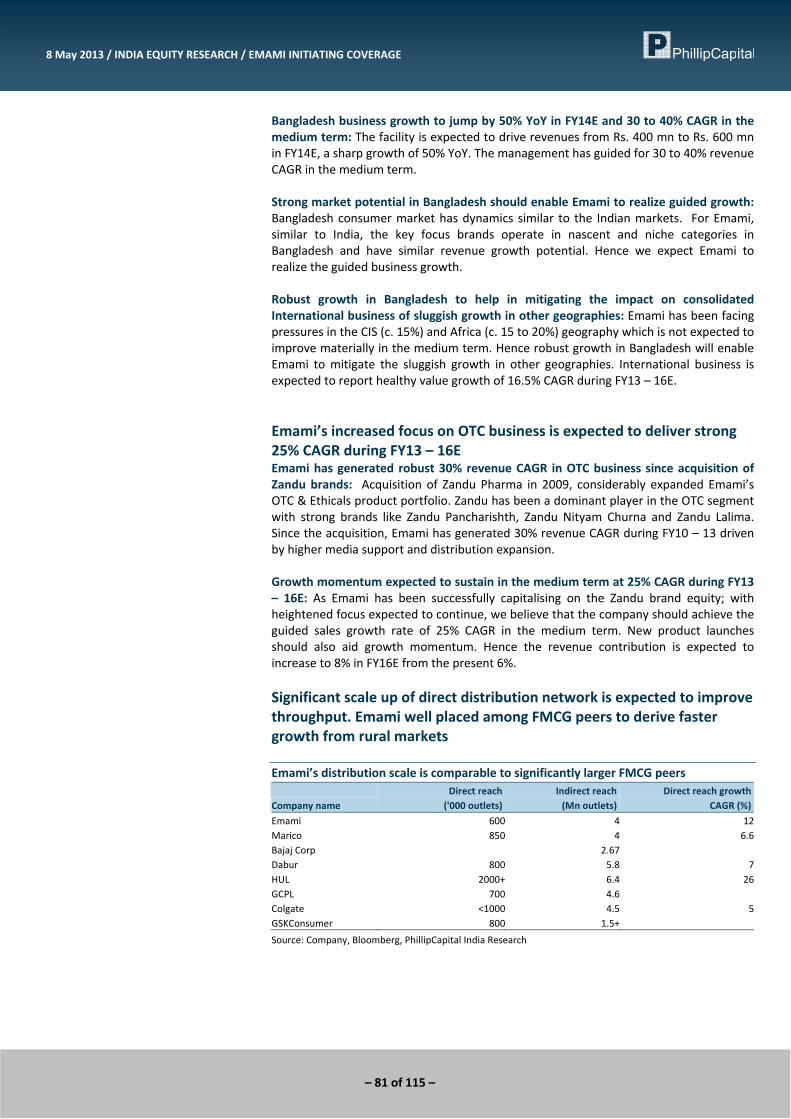
– 81 of 115 –
8 May 2013 / INDIA EQUITY RESEARCH / EMAMI INITIATING COVERAGE
Bangladesh business growth to jump by 50% YoY in FY14E and 30 to 40% CAGR in the medium term: The facility is expected to drive revenues from Rs. 400 mn to Rs. 600 mn in FY14E, a sharp growth of 50% YoY. The management has guided for 30 to 40% revenue CAGR in the medium term. Strong market potential in Bangladesh should enable Emami to realize guided growth: Bangladesh consumer market has dynamics similar to the Indian markets. For Emami, similar to India, the key focus brands operate in nascent and niche categories in Bangladesh and have similar revenue growth potential. Hence we expect Emami to realize the guided business growth. Robust growth in Bangladesh to help in mitigating the impact on consolidated International business of sluggish growth in other geographies: Emami has been facing pressures in the CIS (c. 15%) and Africa (c. 15 to 20%) geography which is not expected to improve materially in the medium term. Hence robust growth in Bangladesh will enable Emami to mitigate the sluggish growth in other geographies. International business is expected to report healthy value growth of 16.5% CAGR during FY13 – 16E. Emami’s increased focus on OTC business is expected to deliver strong 25% CAGR during FY13 – 16E Emami has generated robust 30% revenue CAGR in OTC business since acquisition of Zandu brands: Acquisition of Zandu Pharma in 2009, considerably expanded Emami’s OTC & Ethicals product portfolio. Zandu has been a dominant player in the OTC segment with strong brands like Zandu Pancharishth, Zandu Nityam Churna and Zandu Lalima. Since the acquisition, Emami has generated 30% revenue CAGR during FY10 – 13 driven by higher media support and distribution expansion. Growth momentum expected to sustain in the medium term at 25% CAGR during FY13 – 16E: As Emami has been successfully capitalising on the Zandu brand equity; with heightened focus expected to continue, we believe that the company should achieve the guided sales growth rate of 25% CAGR in the medium term. New product launches should also aid growth momentum. Hence the revenue contribution is expected to increase to 8% in FY16E from the present 6%. Significant scale up of direct distribution network is expected to improve throughput. Emami well placed among FMCG peers to derive faster growth from rural markets Emami’s distribution scale is comparable to significantly larger FMCG peers
Company name Direct reach ('000 outlets)
Indirect reach (Mn outlets)
Direct reach growth CAGR (%)
Emami 600 4 12Marico 850 4 6.6Bajaj Corp 2.67Dabur 800 5.8 7HUL 2000+ 6.4 26GCPL 700 4.6Colgate <1000 4.5 5GSKConsumer 800 1.5+
Source: Company, Bloomberg, PhillipCapital India Research
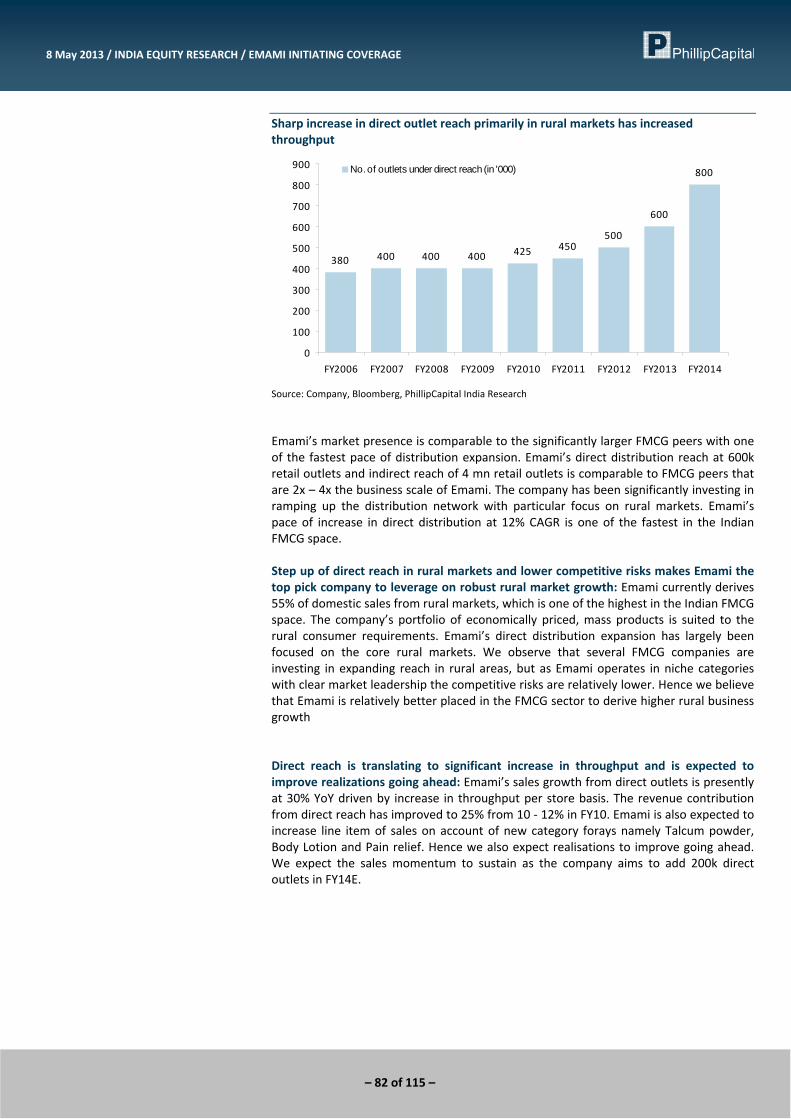
– 82 of 115 –
8 May 2013 / INDIA EQUITY RESEARCH / EMAMI INITIATING COVERAGE
Sharp increase in direct outlet reach primarily in rural markets has increased throughput
380 400 400 400 425 450500
600
800
0
100
200
300
400
500
600
700
800
900
FY2006 FY2007 FY2008 FY2009 FY2010 FY2011 FY2012 FY2013 FY2014
No. of outlets under direct reach (in '000)
Source: Company, Bloomberg, PhillipCapital India Research
Emami’s market presence is comparable to the significantly larger FMCG peers with one of the fastest pace of distribution expansion. Emami’s direct distribution reach at 600k retail outlets and indirect reach of 4 mn retail outlets is comparable to FMCG peers that are 2x – 4x the business scale of Emami. The company has been significantly investing in ramping up the distribution network with particular focus on rural markets. Emami’s pace of increase in direct distribution at 12% CAGR is one of the fastest in the Indian FMCG space. Step up of direct reach in rural markets and lower competitive risks makes Emami the top pick company to leverage on robust rural market growth: Emami currently derives 55% of domestic sales from rural markets, which is one of the highest in the Indian FMCG space. The company’s portfolio of economically priced, mass products is suited to the rural consumer requirements. Emami’s direct distribution expansion has largely been focused on the core rural markets. We observe that several FMCG companies are investing in expanding reach in rural areas, but as Emami operates in niche categories with clear market leadership the competitive risks are relatively lower. Hence we believe that Emami is relatively better placed in the FMCG sector to derive higher rural business growth Direct reach is translating to significant increase in throughput and is expected to improve realizations going ahead: Emami’s sales growth from direct outlets is presently at 30% YoY driven by increase in throughput per store basis. The revenue contribution from direct reach has improved to 25% from 10 ‐ 12% in FY10. Emami is also expected to increase line item of sales on account of new category forays namely Talcum powder, Body Lotion and Pain relief. Hence we also expect realisations to improve going ahead. We expect the sales momentum to sustain as the company aims to add 200k direct outlets in FY14E.
– 83 of 115 –
8 May 2013 / INDIA EQUITY RESEARCH / EMAMI INITIATING COVERAGE
About the company Emami is one of the leading players in the Indian personal and healthcare space. The company was incorporated in 1974 and operates in niche categories and differentiated products based on ayurvedic formulations. Emami has a portfolio of 4 focus brands namely Navratna, Zandu, Himani and Fair & Handsome that hold strong market leadership positions. Overall product portfolio comprises of 300 products which are primarily positioned as ‘value for money”. Emami has extensive distribution presence in India with indirect reach of 4 mn retail outlets and is focusing on expanding direct reach particularly in rural markets. The company also has sizeable presence in international geographies with operations in 50 odd countries. Emami has to its credit the development of the cooling hair oil and Men’s fairness cream category in India. The business focus will be on driving growth through innovation and being a leading player in every category the company ventures into. Emami’s strategy for growth is through organic and inorganic acquisition. The company had acquired Zandu Pharma in 2008 and has been on the lookout of a sizeable acquisition for the past 3 years. The management is confident of delivering robust revenue growth and is targeting to drive PAT growth with operating leverage benefits in the medium term.
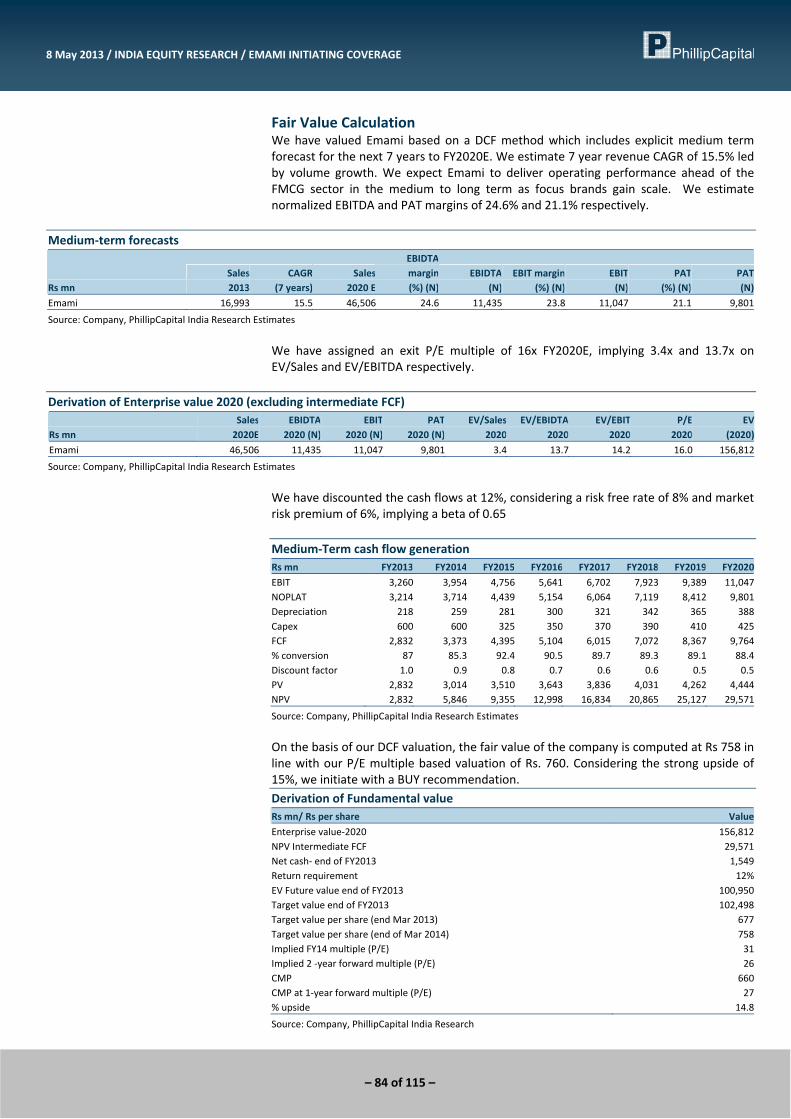
– 84 of 115 –
8 May 2013 / INDIA EQUITY RESEARCH / EMAMI INITIATING COVERAGE
Fair Value Calculation We have valued Emami based on a DCF method which includes explicit medium term forecast for the next 7 years to FY2020E. We estimate 7 year revenue CAGR of 15.5% led by volume growth. We expect Emami to deliver operating performance ahead of the FMCG sector in the medium to long term as focus brands gain scale. We estimate normalized EBITDA and PAT margins of 24.6% and 21.1% respectively.
Medium‐term forecasts
Rs mn Sales2013
CAGR (7 years)
Sales 2020 E
EBIDTA margin (%) (N)
EBIDTA (N)
EBIT margin (%) (N)
EBIT (N)
PAT(%) (N)
PAT (N)
Emami 16,993 15.5 46,506 24.6 11,435 23.8 11,047 21.1 9,801
Source: Company, PhillipCapital India Research Estimates
We have assigned an exit P/E multiple of 16x FY2020E, implying 3.4x and 13.7x on EV/Sales and EV/EBITDA respectively.
Derivation of Enterprise value 2020 (excluding intermediate FCF)
Rs mn Sales
2020EEBIDTA 2020 (N)
EBIT 2020 (N)
PAT2020 (N)
EV/Sales 2020
EV/EBIDTA 2020
EV/EBIT 2020
P/E 2020
EV (2020)
Emami 46,506 11,435 11,047 9,801 3.4 13.7 14.2 16.0 156,812
Source: Company, PhillipCapital India Research Estimates
We have discounted the cash flows at 12%, considering a risk free rate of 8% and market risk premium of 6%, implying a beta of 0.65 Medium‐Term cash flow generation Rs mn FY2013 FY2014 FY2015 FY2016 FY2017 FY2018 FY2019 FY2020
EBIT 3,260 3,954 4,756 5,641 6,702 7,923 9,389 11,047NOPLAT 3,214 3,714 4,439 5,154 6,064 7,119 8,412 9,801Depreciation 218 259 281 300 321 342 365 388Capex 600 600 325 350 370 390 410 425FCF 2,832 3,373 4,395 5,104 6,015 7,072 8,367 9,764% conversion 87 85.3 92.4 90.5 89.7 89.3 89.1 88.4Discount factor 1.0 0.9 0.8 0.7 0.6 0.6 0.5 0.5PV 2,832 3,014 3,510 3,643 3,836 4,031 4,262 4,444NPV 2,832 5,846 9,355 12,998 16,834 20,865 25,127 29,571
Source: Company, PhillipCapital India Research Estimates
On the basis of our DCF valuation, the fair value of the company is computed at Rs 758 in line with our P/E multiple based valuation of Rs. 760. Considering the strong upside of 15%, we initiate with a BUY recommendation. Derivation of Fundamental value Rs mn/ Rs per share Value
Enterprise value‐2020 156,812 NPV Intermediate FCF 29,571 Net cash‐ end of FY2013 1,549 Return requirement 12%EV Future value end of FY2013 100,950 Target value end of FY2013 102,498 Target value per share (end Mar 2013) 677Target value per share (end of Mar 2014) 758Implied FY14 multiple (P/E) 31Implied 2 ‐year forward multiple (P/E) 26CMP 660CMP at 1‐year forward multiple (P/E) 27% upside 14.8
Source: Company, PhillipCapital India Research
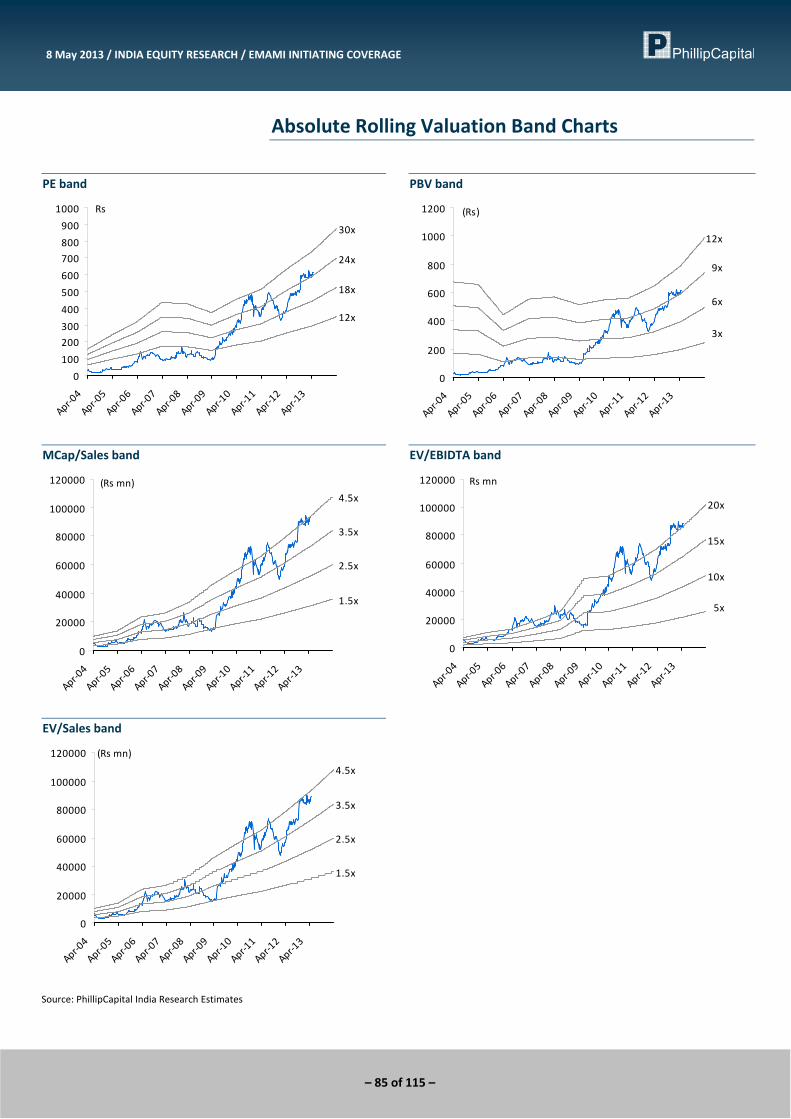
– 85 of 115 –
8 May 2013 / INDIA EQUITY RESEARCH / EMAMI INITIATING COVERAGE
Absolute Rolling Valuation Band Charts
PE band
12x
18x
24x
30x
0
100
200
300
400
500
600
700
800
900
1000
Apr‐04
Apr‐05
Apr‐06
Apr‐07
Apr‐08
Apr‐09
Apr‐10
Apr‐11
Apr‐12
Apr‐13
Rs
PBV band
3x
6x
9x
12x
0
200
400
600
800
1000
1200
Apr‐04
Apr‐05
Apr‐06
Apr‐07
Apr‐08
Apr‐09
Apr‐10
Apr‐11
Apr‐12
Apr‐13
(Rs)
MCap/Sales band
1.5x
2.5x
3.5x
4.5x
0
20000
40000
60000
80000
100000
120000
Apr‐04
Apr‐05
Apr‐06
Apr‐07
Apr‐08
Apr‐09
Apr‐10
Apr‐11
Apr‐12
Apr‐13
(Rs mn)
EV/EBIDTA band
5x
10x
15x
20x
0
20000
40000
60000
80000
100000
120000
Apr‐04
Apr‐05
Apr‐06
Apr‐07
Apr‐08
Apr‐09
Apr‐10
Apr‐11
Apr‐12
Apr‐13
Rs mn
EV/Sales band
1.5x
2.5x
3.5x
4.5x
0
20000
40000
60000
80000
100000
120000
Apr‐04
Apr‐05
Apr‐06
Apr‐07
Apr‐08
Apr‐09
Apr‐10
Apr‐11
Apr‐12
Apr‐13
(Rs mn)
Source: PhillipCapital India Research Estimates
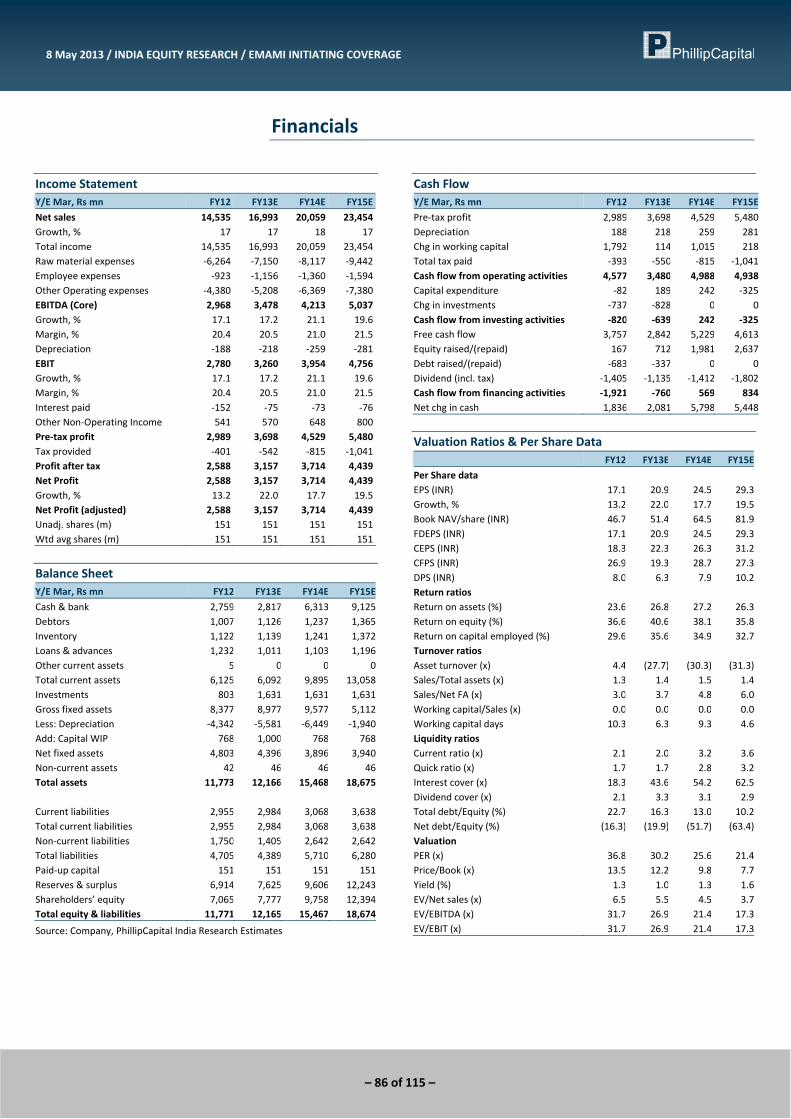
– 86 of 115 –
8 May 2013 / INDIA EQUITY RESEARCH / EMAMI INITIATING COVERAGE
Financials
Income Statement Y/E Mar, Rs mn FY12 FY13E FY14E FY15E
Net sales 14,535 16,993 20,059 23,454Growth, % 17 17 18 17Total income 14,535 16,993 20,059 23,454Raw material expenses ‐6,264 ‐7,150 ‐8,117 ‐9,442Employee expenses ‐923 ‐1,156 ‐1,360 ‐1,594Other Operating expenses ‐4,380 ‐5,208 ‐6,369 ‐7,380EBITDA (Core) 2,968 3,478 4,213 5,037Growth, % 17.1 17.2 21.1 19.6Margin, % 20.4 20.5 21.0 21.5Depreciation ‐188 ‐218 ‐259 ‐281EBIT 2,780 3,260 3,954 4,756Growth, % 17.1 17.2 21.1 19.6Margin, % 20.4 20.5 21.0 21.5Interest paid ‐152 ‐75 ‐73 ‐76Other Non‐Operating Income 541 570 648 800Pre‐tax profit 2,989 3,698 4,529 5,480Tax provided ‐401 ‐542 ‐815 ‐1,041Profit after tax 2,588 3,157 3,714 4,439Net Profit 2,588 3,157 3,714 4,439Growth, % 13.2 22.0 17.7 19.5Net Profit (adjusted) 2,588 3,157 3,714 4,439Unadj. shares (m) 151 151 151 151Wtd avg shares (m) 151 151 151 151
Balance Sheet Y/E Mar, Rs mn FY12 FY13E FY14E FY15E
Cash & bank 2,759 2,817 6,313 9,125Debtors 1,007 1,126 1,237 1,365Inventory 1,122 1,139 1,241 1,372Loans & advances 1,232 1,011 1,103 1,196Other current assets 5 0 0 0Total current assets 6,125 6,092 9,895 13,058Investments 803 1,631 1,631 1,631Gross fixed assets 8,377 8,977 9,577 5,112Less: Depreciation ‐4,342 ‐5,581 ‐6,449 ‐1,940Add: Capital WIP 768 1,000 768 768Net fixed assets 4,803 4,396 3,896 3,940Non‐current assets 42 46 46 46Total assets 11,773 12,166 15,468 18,675 Current liabilities 2,955 2,984 3,068 3,638Total current liabilities 2,955 2,984 3,068 3,638Non‐current liabilities 1,750 1,405 2,642 2,642Total liabilities 4,705 4,389 5,710 6,280Paid‐up capital 151 151 151 151Reserves & surplus 6,914 7,625 9,606 12,243Shareholders’ equity 7,065 7,777 9,758 12,394Total equity & liabilities 11,771 12,165 15,467 18,674
Source: Company, PhillipCapital India Research Estimates
Cash Flow Y/E Mar, Rs mn FY12 FY13E FY14E FY15E
Pre‐tax profit 2,989 3,698 4,529 5,480Depreciation 188 218 259 281Chg in working capital 1,792 114 1,015 218Total tax paid ‐393 ‐550 ‐815 ‐1,041Cash flow from operating activities 4,577 3,480 4,988 4,938Capital expenditure ‐82 189 242 ‐325Chg in investments ‐737 ‐828 0 0Cash flow from investing activities ‐820 ‐639 242 ‐325Free cash flow 3,757 2,842 5,229 4,613Equity raised/(repaid) 167 712 1,981 2,637Debt raised/(repaid) ‐683 ‐337 0 0Dividend (incl. tax) ‐1,405 ‐1,135 ‐1,412 ‐1,802Cash flow from financing activities ‐1,921 ‐760 569 834Net chg in cash 1,836 2,081 5,798 5,448
Valuation Ratios & Per Share Data FY12 FY13E FY14E FY15E
Per Share data EPS (INR) 17.1 20.9 24.5 29.3Growth, % 13.2 22.0 17.7 19.5Book NAV/share (INR) 46.7 51.4 64.5 81.9FDEPS (INR) 17.1 20.9 24.5 29.3CEPS (INR) 18.3 22.3 26.3 31.2CFPS (INR) 26.9 19.3 28.7 27.3DPS (INR) 8.0 6.3 7.9 10.2Return ratios Return on assets (%) 23.6 26.8 27.2 26.3Return on equity (%) 36.6 40.6 38.1 35.8Return on capital employed (%) 29.6 35.6 34.9 32.7Turnover ratios Asset turnover (x) 4.4 (27.7) (30.3) (31.3)Sales/Total assets (x) 1.3 1.4 1.5 1.4Sales/Net FA (x) 3.0 3.7 4.8 6.0Working capital/Sales (x) 0.0 0.0 0.0 0.0Working capital days 10.3 6.3 9.3 4.6Liquidity ratios Current ratio (x) 2.1 2.0 3.2 3.6Quick ratio (x) 1.7 1.7 2.8 3.2Interest cover (x) 18.3 43.6 54.2 62.5Dividend cover (x) 2.1 3.3 3.1 2.9Total debt/Equity (%) 22.7 16.3 13.0 10.2Net debt/Equity (%) (16.3) (19.9) (51.7) (63.4)Valuation PER (x) 36.8 30.2 25.6 21.4Price/Book (x) 13.5 12.2 9.8 7.7Yield (%) 1.3 1.0 1.3 1.6EV/Net sales (x) 6.5 5.5 4.5 3.7EV/EBITDA (x) 31.7 26.9 21.4 17.3EV/EBIT (x) 31.7 26.9 21.4 17.3
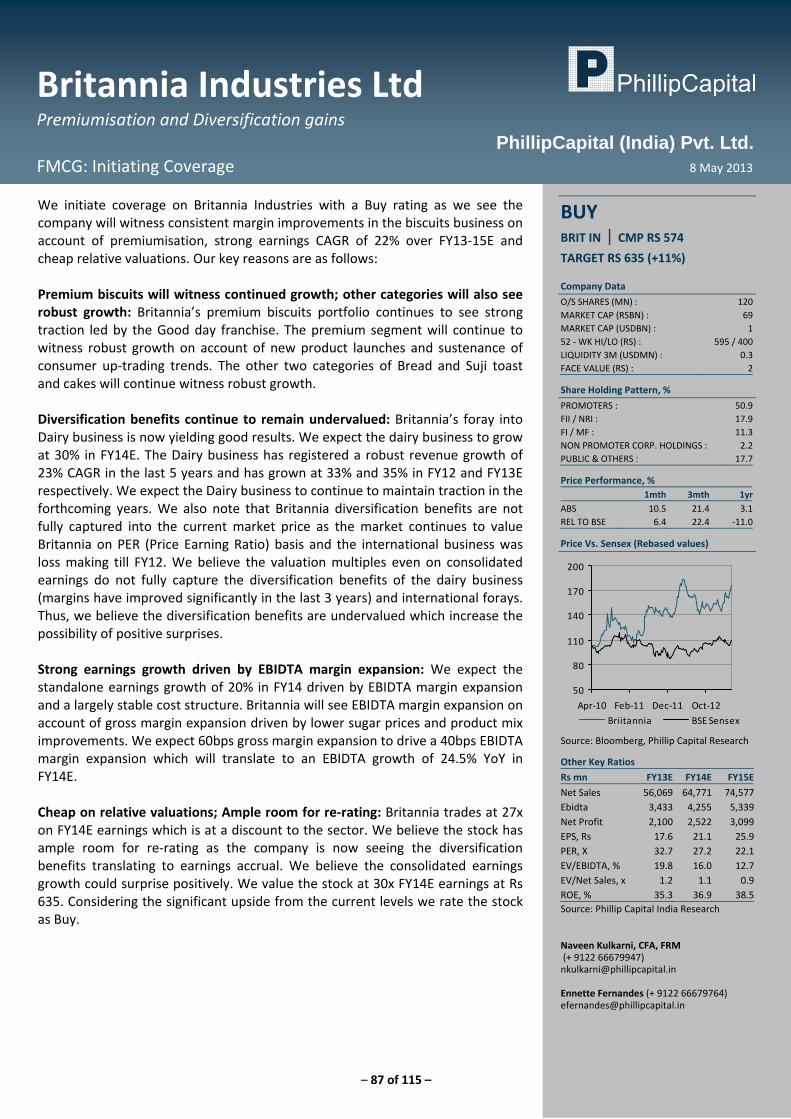
– 87 of 115 –
Britannia Industries Ltd Premiumisation and Diversification gains
FMCG: Initiating Coverage 8 May 2013
PhillipCapital (India) Pvt. Ltd.
We initiate coverage on Britannia Industries with a Buy rating as we see the company will witness consistent margin improvements in the biscuits business on account of premiumisation, strong earnings CAGR of 22% over FY13‐15E and cheap relative valuations. Our key reasons are as follows: Premium biscuits will witness continued growth; other categories will also see robust growth: Britannia’s premium biscuits portfolio continues to see strong traction led by the Good day franchise. The premium segment will continue to witness robust growth on account of new product launches and sustenance of consumer up‐trading trends. The other two categories of Bread and Suji toast and cakes will continue witness robust growth. Diversification benefits continue to remain undervalued: Britannia’s foray into Dairy business is now yielding good results. We expect the dairy business to grow at 30% in FY14E. The Dairy business has registered a robust revenue growth of 23% CAGR in the last 5 years and has grown at 33% and 35% in FY12 and FY13E respectively. We expect the Dairy business to continue to maintain traction in the forthcoming years. We also note that Britannia diversification benefits are not fully captured into the current market price as the market continues to value Britannia on PER (Price Earning Ratio) basis and the international business was loss making till FY12. We believe the valuation multiples even on consolidated earnings do not fully capture the diversification benefits of the dairy business (margins have improved significantly in the last 3 years) and international forays. Thus, we believe the diversification benefits are undervalued which increase the possibility of positive surprises. Strong earnings growth driven by EBIDTA margin expansion: We expect the standalone earnings growth of 20% in FY14 driven by EBIDTA margin expansion and a largely stable cost structure. Britannia will see EBIDTA margin expansion on account of gross margin expansion driven by lower sugar prices and product mix improvements. We expect 60bps gross margin expansion to drive a 40bps EBIDTA margin expansion which will translate to an EBIDTA growth of 24.5% YoY in FY14E. Cheap on relative valuations; Ample room for re‐rating: Britannia trades at 27x on FY14E earnings which is at a discount to the sector. We believe the stock has ample room for re‐rating as the company is now seeing the diversification benefits translating to earnings accrual. We believe the consolidated earnings growth could surprise positively. We value the stock at 30x FY14E earnings at Rs 635. Considering the significant upside from the current levels we rate the stock as Buy.
BUY BRIT IN | CMP RS 574
TARGET RS 635 (+11%) Company Data
O/S SHARES (MN) : 120MARKET CAP (RSBN) : 69MARKET CAP (USDBN) : 152 ‐ WK HI/LO (RS) : 595 / 400LIQUIDITY 3M (USDMN) : 0.3FACE VALUE (RS) : 2
Share Holding Pattern, %
PROMOTERS : 50.9FII / NRI : 17.9FI / MF : 11.3NON PROMOTER CORP. HOLDINGS : 2.2PUBLIC & OTHERS : 17.7
Price Performance, % 1mth 3mth 1yr
ABS 10.5 21.4 3.1REL TO BSE 6.4 22.4 ‐11.0
Price Vs. Sensex (Rebased values)
50
80
110
140
170
200
Apr‐10 Feb‐11 Dec‐11 Oct‐12
Briitannia BSE Sensex
Source: Bloomberg, Phillip Capital Research
Other Key Ratios
Rs mn FY13E FY14E FY15E
Net Sales 56,069 64,771 74,577Ebidta 3,433 4,255 5,339Net Profit 2,100 2,522 3,099EPS, Rs 17.6 21.1 25.9PER, X 32.7 27.2 22.1EV/EBIDTA, % 19.8 16.0 12.7EV/Net Sales, x 1.2 1.1 0.9ROE, % 35.3 36.9 38.5Source: Phillip Capital India Research Naveen Kulkarni, CFA, FRM (+ 9122 66679947) [email protected] Ennette Fernandes (+ 9122 66679764) [email protected]
– 88 of 115 –
8 May 2013 / INDIA EQUITY RESEARCH / BRITANNIA INDUSTRIES INITIATING COVERAGE
About the company Established in 1892, Britannia Industries is one of the oldest biscuits company in India. Britannia is the market leader in organized biscuits markets with a market share of 33%. The Company operates in two business segments: bakery products, including biscuits, bread, cakes and rusk, and dairy products, including milk, butter, cheese, ghee, dahi, milk‐based ready to drink beverages and dairy whitener. In March 2007, Britannia Industries Limited formed a Joint Venture with the Khimji Ramdas Group, one of the largest business conglomerates in the Middle East. Britannia and its Associates have acquired a significant stake in Dubai based Strategic Food International Co. LLC and Oman based Al Sallan Food Industries Co SAOG. The two companies are key regional players in the biscuits, wafers and cookies segment in the GCC markets and export their products across the world. Strategic Food International Co. LLC (SFIC) is one of the largest biscuit and wafer manufacturing companies in the Middle East. An ISO and HACCP certified company; SFIC is also a proud winner of the Dubai Quality Appreciation Certificate. It offers a wide spectrum of products under the brand Nutro, which is a leading biscuit brand in the Middle East. The Company’s subsidiary, Daily Bread Gourmet Foods (India) Private Limited, is a manufacturer of premium gourmet bakery products, including specialty breads, cakes, pastries and cookies, which it sells through its own retail stores directly to consumers. The company makes and sells a select range of Britannia products at its facilities in Sohar, Sultanate of Oman, primarily for Middle Eastern markets. Its subsidiaries include Manna Foods Private Limited, J B Mangharam Foods Private Limited, Sunrise Biscuit Company Private Limited, Sunrise Biscuit Company Private Limited, Britannia and Associates (Mauritius) Private Limited and Klassik Foods Private Limited.
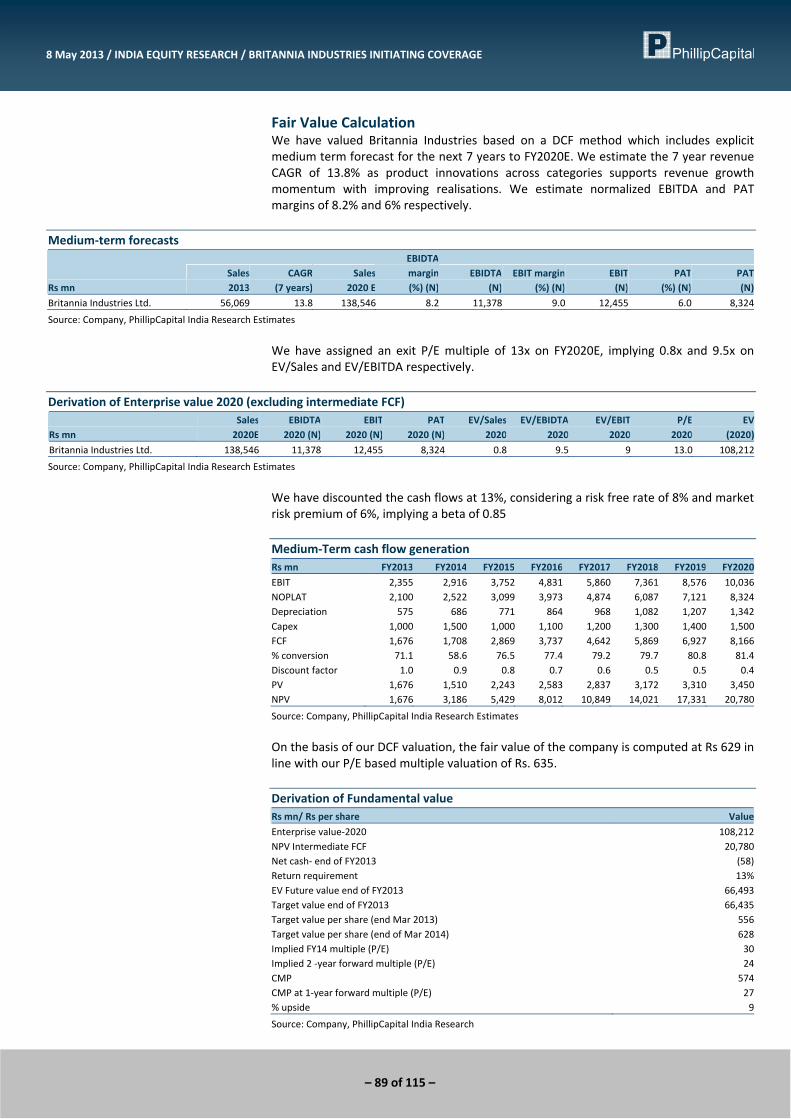
– 89 of 115 –
8 May 2013 / INDIA EQUITY RESEARCH / BRITANNIA INDUSTRIES INITIATING COVERAGE
Fair Value Calculation We have valued Britannia Industries based on a DCF method which includes explicit medium term forecast for the next 7 years to FY2020E. We estimate the 7 year revenue CAGR of 13.8% as product innovations across categories supports revenue growth momentum with improving realisations. We estimate normalized EBITDA and PAT margins of 8.2% and 6% respectively.
Medium‐term forecasts
Rs mn Sales2013
CAGR (7 years)
Sales 2020 E
EBIDTA margin (%) (N)
EBIDTA (N)
EBIT margin (%) (N)
EBIT (N)
PAT(%) (N)
PAT (N)
Britannia Industries Ltd. 56,069 13.8 138,546 8.2 11,378 9.0 12,455 6.0 8,324
Source: Company, PhillipCapital India Research Estimates
We have assigned an exit P/E multiple of 13x on FY2020E, implying 0.8x and 9.5x on EV/Sales and EV/EBITDA respectively.
Derivation of Enterprise value 2020 (excluding intermediate FCF)
Rs mn Sales
2020EEBIDTA 2020 (N)
EBIT 2020 (N)
PAT2020 (N)
EV/Sales 2020
EV/EBIDTA 2020
EV/EBIT 2020
P/E 2020
EV (2020)
Britannia Industries Ltd. 138,546 11,378 12,455 8,324 0.8 9.5 9 13.0 108,212
Source: Company, PhillipCapital India Research Estimates
We have discounted the cash flows at 13%, considering a risk free rate of 8% and market risk premium of 6%, implying a beta of 0.85 Medium‐Term cash flow generation Rs mn FY2013 FY2014 FY2015 FY2016 FY2017 FY2018 FY2019 FY2020
EBIT 2,355 2,916 3,752 4,831 5,860 7,361 8,576 10,036NOPLAT 2,100 2,522 3,099 3,973 4,874 6,087 7,121 8,324Depreciation 575 686 771 864 968 1,082 1,207 1,342Capex 1,000 1,500 1,000 1,100 1,200 1,300 1,400 1,500FCF 1,676 1,708 2,869 3,737 4,642 5,869 6,927 8,166% conversion 71.1 58.6 76.5 77.4 79.2 79.7 80.8 81.4Discount factor 1.0 0.9 0.8 0.7 0.6 0.5 0.5 0.4PV 1,676 1,510 2,243 2,583 2,837 3,172 3,310 3,450NPV 1,676 3,186 5,429 8,012 10,849 14,021 17,331 20,780
Source: Company, PhillipCapital India Research Estimates
On the basis of our DCF valuation, the fair value of the company is computed at Rs 629 in line with our P/E based multiple valuation of Rs. 635. Derivation of Fundamental value Rs mn/ Rs per share Value
Enterprise value‐2020 108,212NPV Intermediate FCF 20,780Net cash‐ end of FY2013 (58)Return requirement 13%EV Future value end of FY2013 66,493Target value end of FY2013 66,435Target value per share (end Mar 2013) 556Target value per share (end of Mar 2014) 628Implied FY14 multiple (P/E) 30Implied 2 ‐year forward multiple (P/E) 24CMP 574CMP at 1‐year forward multiple (P/E) 27% upside 9
Source: Company, PhillipCapital India Research
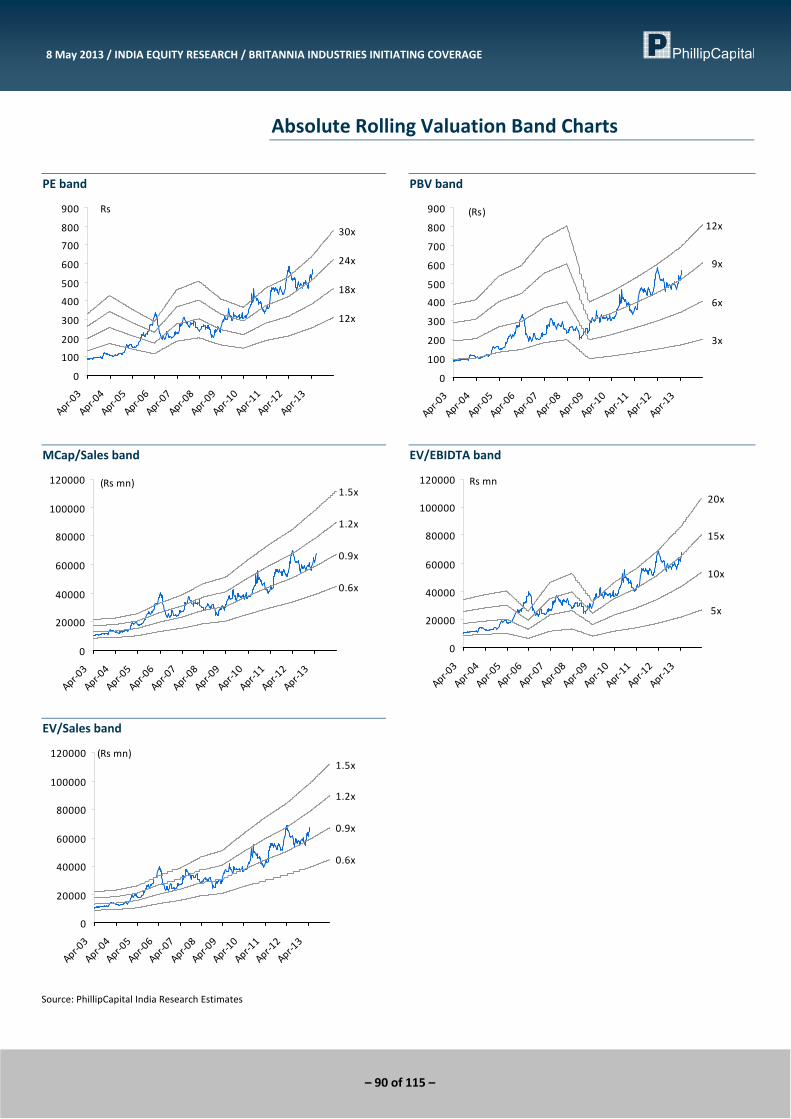
– 90 of 115 –
8 May 2013 / INDIA EQUITY RESEARCH / BRITANNIA INDUSTRIES INITIATING COVERAGE
Absolute Rolling Valuation Band Charts
PE band
12x
18x
24x
30x
0
100
200
300
400
500
600
700
800
900
Apr‐03
Apr‐04
Apr‐05
Apr‐06
Apr‐07
Apr‐08
Apr‐09
Apr‐10
Apr‐11
Apr‐12
Apr‐13
Rs
PBV band
3x
6x
9x
12x
0
100
200
300
400
500
600
700
800
900
Apr‐03
Apr‐04
Apr‐05
Apr‐06
Apr‐07
Apr‐08
Apr‐09
Apr‐10
Apr‐11
Apr‐12
Apr‐13
(Rs)
MCap/Sales band
0.6x
0.9x
1.2x
1.5x
0
20000
40000
60000
80000
100000
120000
Apr‐03
Apr‐04
Apr‐05
Apr‐06
Apr‐07
Apr‐08
Apr‐09
Apr‐10
Apr‐11
Apr‐12
Apr‐13
(Rs mn)
EV/EBIDTA band
5x
10x
15x
20x
0
20000
40000
60000
80000
100000
120000
Apr‐03
Apr‐04
Apr‐05
Apr‐06
Apr‐07
Apr‐08
Apr‐09
Apr‐10
Apr‐11
Apr‐12
Apr‐13
Rs mn
EV/Sales band
0.6x
0.9x
1.2x
1.5x
0
20000
40000
60000
80000
100000
120000
Apr‐03
Apr‐04
Apr‐05
Apr‐06
Apr‐07
Apr‐08
Apr‐09
Apr‐10
Apr‐11
Apr‐12
Apr‐13
(Rs mn)
Source: PhillipCapital India Research Estimates
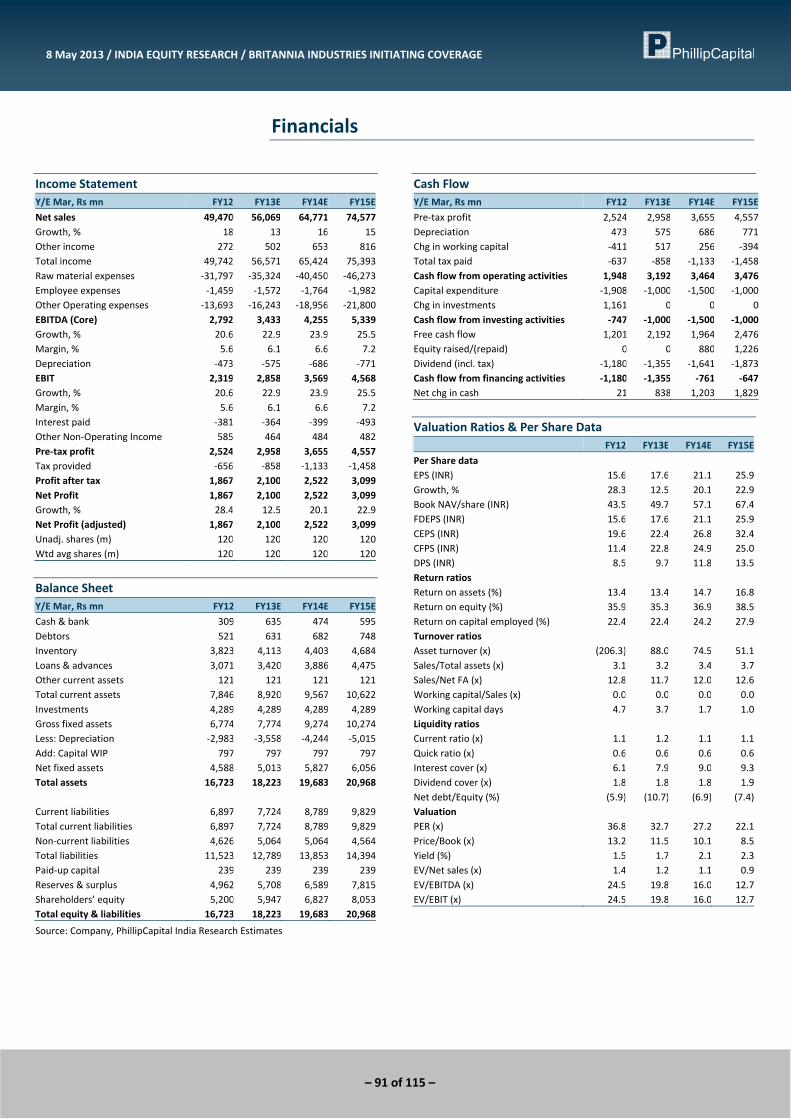
– 91 of 115 –
8 May 2013 / INDIA EQUITY RESEARCH / BRITANNIA INDUSTRIES INITIATING COVERAGE
Financials
Income Statement Y/E Mar, Rs mn FY12 FY13E FY14E FY15E
Net sales 49,470 56,069 64,771 74,577Growth, % 18 13 16 15Other income 272 502 653 816Total income 49,742 56,571 65,424 75,393Raw material expenses ‐31,797 ‐35,324 ‐40,450 ‐46,273Employee expenses ‐1,459 ‐1,572 ‐1,764 ‐1,982Other Operating expenses ‐13,693 ‐16,243 ‐18,956 ‐21,800EBITDA (Core) 2,792 3,433 4,255 5,339Growth, % 20.6 22.9 23.9 25.5Margin, % 5.6 6.1 6.6 7.2Depreciation ‐473 ‐575 ‐686 ‐771EBIT 2,319 2,858 3,569 4,568Growth, % 20.6 22.9 23.9 25.5Margin, % 5.6 6.1 6.6 7.2Interest paid ‐381 ‐364 ‐399 ‐493Other Non‐Operating Income 585 464 484 482Pre‐tax profit 2,524 2,958 3,655 4,557Tax provided ‐656 ‐858 ‐1,133 ‐1,458Profit after tax 1,867 2,100 2,522 3,099Net Profit 1,867 2,100 2,522 3,099Growth, % 28.4 12.5 20.1 22.9Net Profit (adjusted) 1,867 2,100 2,522 3,099Unadj. shares (m) 120 120 120 120Wtd avg shares (m) 120 120 120 120
Balance Sheet Y/E Mar, Rs mn FY12 FY13E FY14E FY15E
Cash & bank 309 635 474 595Debtors 521 631 682 748Inventory 3,823 4,113 4,403 4,684Loans & advances 3,071 3,420 3,886 4,475Other current assets 121 121 121 121Total current assets 7,846 8,920 9,567 10,622Investments 4,289 4,289 4,289 4,289Gross fixed assets 6,774 7,774 9,274 10,274Less: Depreciation ‐2,983 ‐3,558 ‐4,244 ‐5,015Add: Capital WIP 797 797 797 797Net fixed assets 4,588 5,013 5,827 6,056Total assets 16,723 18,223 19,683 20,968 Current liabilities 6,897 7,724 8,789 9,829Total current liabilities 6,897 7,724 8,789 9,829Non‐current liabilities 4,626 5,064 5,064 4,564Total liabilities 11,523 12,789 13,853 14,394Paid‐up capital 239 239 239 239Reserves & surplus 4,962 5,708 6,589 7,815Shareholders’ equity 5,200 5,947 6,827 8,053Total equity & liabilities 16,723 18,223 19,683 20,968
Source: Company, PhillipCapital India Research Estimates
Cash Flow Y/E Mar, Rs mn FY12 FY13E FY14E FY15E
Pre‐tax profit 2,524 2,958 3,655 4,557Depreciation 473 575 686 771Chg in working capital ‐411 517 256 ‐394Total tax paid ‐637 ‐858 ‐1,133 ‐1,458Cash flow from operating activities 1,948 3,192 3,464 3,476Capital expenditure ‐1,908 ‐1,000 ‐1,500 ‐1,000Chg in investments 1,161 0 0 0Cash flow from investing activities ‐747 ‐1,000 ‐1,500 ‐1,000Free cash flow 1,201 2,192 1,964 2,476Equity raised/(repaid) 0 0 880 1,226Dividend (incl. tax) ‐1,180 ‐1,355 ‐1,641 ‐1,873Cash flow from financing activities ‐1,180 ‐1,355 ‐761 ‐647Net chg in cash 21 838 1,203 1,829
Valuation Ratios & Per Share Data FY12 FY13E FY14E FY15E
Per Share data EPS (INR) 15.6 17.6 21.1 25.9Growth, % 28.3 12.5 20.1 22.9Book NAV/share (INR) 43.5 49.7 57.1 67.4FDEPS (INR) 15.6 17.6 21.1 25.9CEPS (INR) 19.6 22.4 26.8 32.4CFPS (INR) 11.4 22.8 24.9 25.0DPS (INR) 8.5 9.7 11.8 13.5Return ratios Return on assets (%) 13.4 13.4 14.7 16.8Return on equity (%) 35.9 35.3 36.9 38.5Return on capital employed (%) 22.4 22.4 24.2 27.9Turnover ratios Asset turnover (x) (206.3) 88.0 74.5 51.1Sales/Total assets (x) 3.1 3.2 3.4 3.7Sales/Net FA (x) 12.8 11.7 12.0 12.6Working capital/Sales (x) 0.0 0.0 0.0 0.0Working capital days 4.7 3.7 1.7 1.0Liquidity ratios Current ratio (x) 1.1 1.2 1.1 1.1Quick ratio (x) 0.6 0.6 0.6 0.6Interest cover (x) 6.1 7.9 9.0 9.3Dividend cover (x) 1.8 1.8 1.8 1.9Net debt/Equity (%) (5.9) (10.7) (6.9) (7.4)Valuation PER (x) 36.8 32.7 27.2 22.1Price/Book (x) 13.2 11.5 10.1 8.5Yield (%) 1.5 1.7 2.1 2.3EV/Net sales (x) 1.4 1.2 1.1 0.9EV/EBITDA (x) 24.5 19.8 16.0 12.7EV/EBIT (x) 24.5 19.8 16.0 12.7
– 92 of 115 –
Bajaj Corp Robust growth prospects, Attractive valuations
FMCG: Initiating Coverage 8 May 2013
PhillipCapital (India) Pvt. Ltd.
Bajaj Corp (BJCORP) is an attractive play in the Rs. 110 bn light hair oil industry and the company’s key brand Bajaj Almond Drops (c. 94%) is the primary category growth driver. The brand (market leader) has significantly expanded its market share by 940 bps during FY09 – 13 to 55% in the almond hair oil category driven by robust volume growth of ~27% CAGR during FY07 – 12. Over FY13 – 16E, we believe that sustenance of high volume growth, driven by focus on gaining market share (target to reach 65% share), and operating margin expansion is to drive robust 24% CAGR revenue and 26% CAGR EBITDA growth.
Light hair oil segment to maintain traction at 23% CAGR, driven by BJCorp’s focus to expand category and market leadership: Light hair oil category clocked robust growth of 25% CAGR (FY07 – 13) with rising consumer awareness fuelling demand, greater market presence, consumer conversion and retention of alternate hair oil users. BJCorp has been instrumental in driving this category development by undertaking sufficient investment in media (30% CAGR Ad pro spends FY10 – 13) and distribution. Light hair oil has significant scope to grow indicated by the Rs. 320 bn (3x of light hair oil) market size of the larger coconut hair oil category. With BJCorp maintaining focus on category and market share expansion, light hair oil category traction is to persist.
Competitive intensity in light hair expected to support category growth. Bajaj Almond drops estimated to be key beneficiary: Recent foray of larger players namely Dabur, Marico and HUL in light hair oil segment is expected to provide support to category growth momentum and dynamics. We believe that Bajaj Almond drops being the market leader, with well entrenched market presence (2.7mn outlets, 16% CAGR growth in distribution) and capability to mitigate competitive risks is well placed to leverage traction in the light hair oil category.
Robust volume growth at 16% CAGR expected during FY13 – 16E aided by requisite level of Ad spends. Pricing ability and soft inflation to drive margin expansion: BJCorp has sufficient balance sheet strength to foray into new categories (entered cooling hair oil segment with Kailash Parbat (KPCO)) to establish new levers of growth. We estimate Adpro sales ratio to be marginally higher at 14.8% in the medium term and expect it to be adequate for BJCorp to sustain robust volume growth, remain competitive and drive KPCO brand growth. We estimate volume CAGR of 17% in Bajaj Almond drops and 22% revenue CAGR in KPCO over FY13 – 16E. Bajaj Almond holds ability to mitigate input cost pressure on account of strong pricing power. With current inflationary scenario being benign we estimate average pricing growth of 6% CAGR over FY13 – 16E. Hence with stability in Ad pro sales ratio and limited input inflation concerns, we expect EBITDA margin expansion of ~100 bps to 29.3% during FY13 – 16E.
Recommendation and Target price: BJCorp is a cash rich company with Rs. 4.34bn and ROE of ~37% is in line with larger FMCG companies. However being primarily a single product company, BJCORP trades at 17x FY14E, a significant discount to the FMCG sector trading at 32x FY14E. We expect the strong operating performance to provide scope of multiple re – rerating. We value the company at 24x (assigning discount of 25% relative to the sector on account of single product company risk) FY14E, with target price of Rs. 335. With a significant upside of 34%, we initiate coverage with a BUY rating.
BUY BJCOR IN | CMP RS 253
TARGET RS 335 (+34%) Company Data
O/S SHARES (MN) : 148MARKET CAP (RSBN) : 37MARKET CAP (USDBN) : 152 ‐ WK HI/LO (RS) : 264 / 114LIQUIDITY 3M (USDMN) : 0.1FACE VALUE (RS) : 1
Share Holding Pattern, %
PROMOTERS : 84.8FII / NRI : 10.1FI / MF : 0.2NON PROMOTER CORP. HOLDINGS : 1.3PUBLIC & OTHERS : 3.7
Price Performance, % 1mth 3mth 1yr
ABS 4.1 4.3 107.0REL TO BSE 0.0 5.3 92.9
Price Vs. Sensex (Rebased values)
0
50
100
150
200
Sep‐10 Jul‐11 May‐12 Mar‐13
Bajaj Corp BSE Sensex
Source: Bloomberg, Phillip Capital Research
Other Key Ratios
Rs mn FY13E FY14E FY15E
Net Sales 6,059 7,520 9,181Ebidta 1,718 2,171 2,672Net Profit 1,673 2,057 2,436EPS, Rs 11.3 13.9 16.5PER, X 22.3 18.1 15.3EV/EBIDTA, % 20.6 15.9 12.7EV/Net Sales, x 5.8 4.6 3.7ROE, % 34.6 36.7 37.0Source: Phillip Capital India Research Ennette Fernandes (+ 9122 66679764) [email protected] Naveen Kulkarni, CFA, FRM (+ 9122 66679947) [email protected]
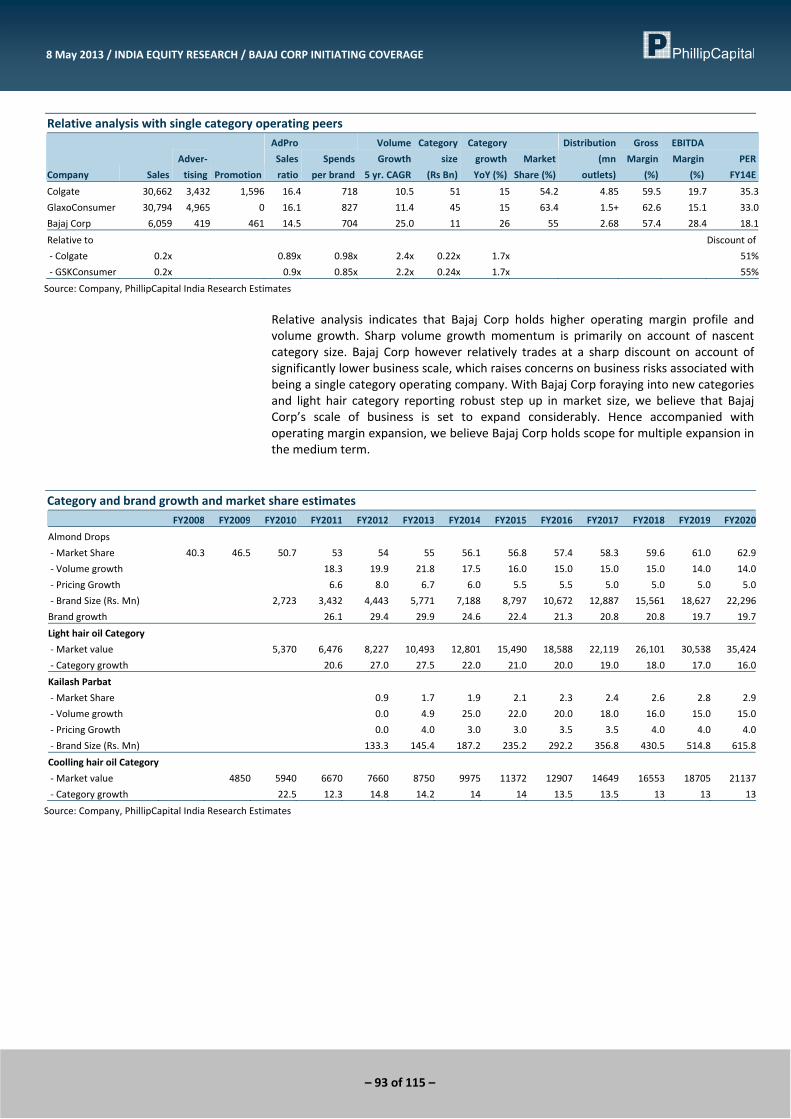
– 93 of 115 –
8 May 2013 / INDIA EQUITY RESEARCH / BAJAJ CORP INITIATING COVERAGE
Relative analysis with single category operating peers
Company Sales
Adver‐
tising Promotion
AdPro
Sales
ratio
Spends
per brand
Volume
Growth
5 yr. CAGR
Category
size
(Rs Bn)
Category
growth
YoY (%)
Market
Share (%)
Distribution
(mn
outlets)
Gross
Margin
(%)
EBITDA
Margin
(%)
PER
FY14E
Colgate 30,662 3,432 1,596 16.4 718 10.5 51 15 54.2 4.85 59.5 19.7 35.3
GlaxoConsumer 30,794 4,965 0 16.1 827 11.4 45 15 63.4 1.5+ 62.6 15.1 33.0
Bajaj Corp 6,059 419 461 14.5 704 25.0 11 26 55 2.68 57.4 28.4 18.1
Relative to Discount of
‐ Colgate 0.2x 0.89x 0.98x 2.4x 0.22x 1.7x 51%
‐ GSKConsumer 0.2x 0.9x 0.85x 2.2x 0.24x 1.7x 55%
Source: Company, PhillipCapital India Research Estimates
Relative analysis indicates that Bajaj Corp holds higher operating margin profile and volume growth. Sharp volume growth momentum is primarily on account of nascent category size. Bajaj Corp however relatively trades at a sharp discount on account of significantly lower business scale, which raises concerns on business risks associated with being a single category operating company. With Bajaj Corp foraying into new categories and light hair category reporting robust step up in market size, we believe that Bajaj Corp’s scale of business is set to expand considerably. Hence accompanied with operating margin expansion, we believe Bajaj Corp holds scope for multiple expansion in the medium term.
Category and brand growth and market share estimates FY2008 FY2009 FY2010 FY2011 FY2012 FY2013 FY2014 FY2015 FY2016 FY2017 FY2018 FY2019 FY2020
Almond Drops
‐ Market Share 40.3 46.5 50.7 53 54 55 56.1 56.8 57.4 58.3 59.6 61.0 62.9
‐ Volume growth 18.3 19.9 21.8 17.5 16.0 15.0 15.0 15.0 14.0 14.0
‐ Pricing Growth 6.6 8.0 6.7 6.0 5.5 5.5 5.0 5.0 5.0 5.0
‐ Brand Size (Rs. Mn) 2,723 3,432 4,443 5,771 7,188 8,797 10,672 12,887 15,561 18,627 22,296
Brand growth 26.1 29.4 29.9 24.6 22.4 21.3 20.8 20.8 19.7 19.7
Light hair oil Category
‐ Market value 5,370 6,476 8,227 10,493 12,801 15,490 18,588 22,119 26,101 30,538 35,424
‐ Category growth 20.6 27.0 27.5 22.0 21.0 20.0 19.0 18.0 17.0 16.0
Kailash Parbat
‐ Market Share 0.9 1.7 1.9 2.1 2.3 2.4 2.6 2.8 2.9
‐ Volume growth 0.0 4.9 25.0 22.0 20.0 18.0 16.0 15.0 15.0
‐ Pricing Growth 0.0 4.0 3.0 3.0 3.5 3.5 4.0 4.0 4.0
‐ Brand Size (Rs. Mn) 133.3 145.4 187.2 235.2 292.2 356.8 430.5 514.8 615.8
Coolling hair oil Category
‐ Market value 4850 5940 6670 7660 8750 9975 11372 12907 14649 16553 18705 21137
‐ Category growth 22.5 12.3 14.8 14.2 14 14 13.5 13.5 13 13 13
Source: Company, PhillipCapital India Research Estimates
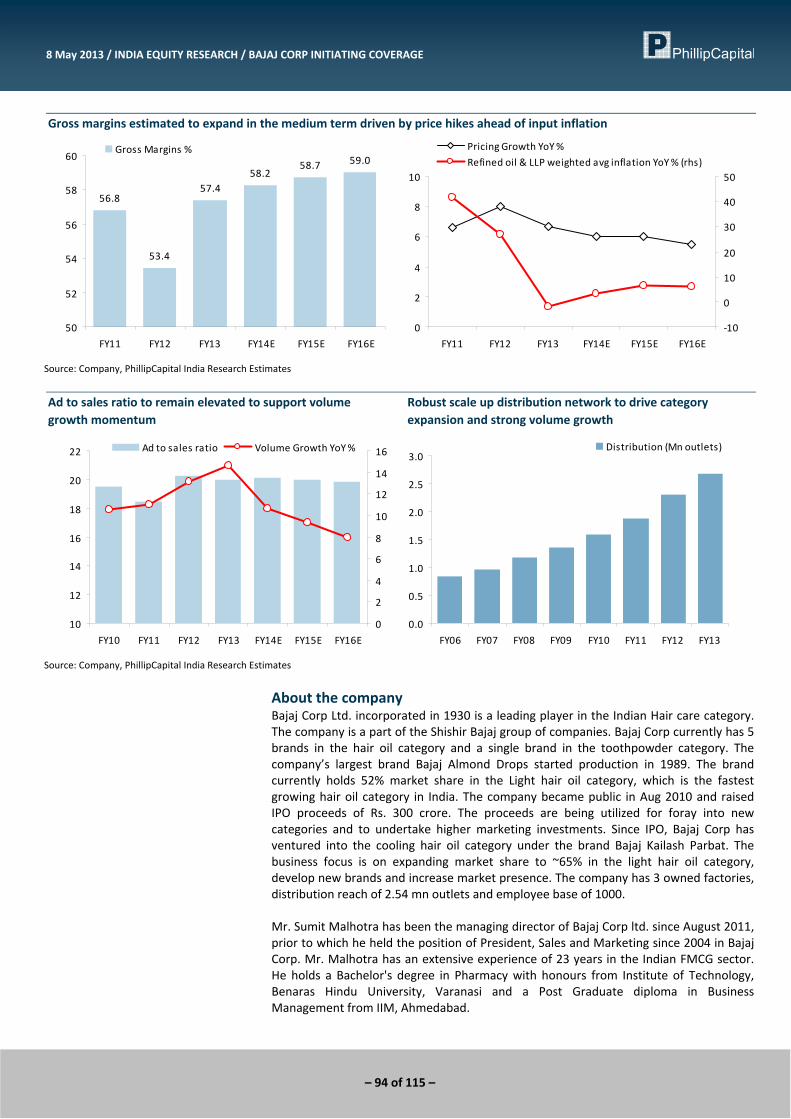
– 94 of 115 –
8 May 2013 / INDIA EQUITY RESEARCH / BAJAJ CORP INITIATING COVERAGE
Gross margins estimated to expand in the medium term driven by price hikes ahead of input inflation
56.8
53.4
57.458.2
58.7 59.0
50
52
54
56
58
60
FY11 FY12 FY13 FY14E FY15E FY16E
Gross Margins %
0
2
4
6
8
10
FY11 FY12 FY13 FY14E FY15E FY16E
‐10
0
10
20
30
40
50
Pricing Growth YoY %
Refined oil & LLP weighted avg inflation YoY % (rhs)
Source: Company, PhillipCapital India Research Estimates
Ad to sales ratio to remain elevated to support volume Robust scale up distribution network to drive category growth momentum expansion and strong volume growth
10
12
14
16
18
20
22
FY10 FY11 FY12 FY13 FY14E FY15E FY16E
0
2
4
6
8
10
12
14
16Ad to sales ratio Volume Growth YoY %
0.0
0.5
1.0
1.5
2.0
2.5
3.0
FY06 FY07 FY08 FY09 FY10 FY11 FY12 FY13
Distribution (Mn outlets)
Source: Company, PhillipCapital India Research Estimates
About the company Bajaj Corp Ltd. incorporated in 1930 is a leading player in the Indian Hair care category. The company is a part of the Shishir Bajaj group of companies. Bajaj Corp currently has 5 brands in the hair oil category and a single brand in the toothpowder category. The company’s largest brand Bajaj Almond Drops started production in 1989. The brand currently holds 52% market share in the Light hair oil category, which is the fastest growing hair oil category in India. The company became public in Aug 2010 and raised IPO proceeds of Rs. 300 crore. The proceeds are being utilized for foray into new categories and to undertake higher marketing investments. Since IPO, Bajaj Corp has ventured into the cooling hair oil category under the brand Bajaj Kailash Parbat. The business focus is on expanding market share to ~65% in the light hair oil category, develop new brands and increase market presence. The company has 3 owned factories, distribution reach of 2.54 mn outlets and employee base of 1000. Mr. Sumit Malhotra has been the managing director of Bajaj Corp ltd. since August 2011, prior to which he held the position of President, Sales and Marketing since 2004 in Bajaj Corp. Mr. Malhotra has an extensive experience of 23 years in the Indian FMCG sector. He holds a Bachelor's degree in Pharmacy with honours from Institute of Technology, Benaras Hindu University, Varanasi and a Post Graduate diploma in Business Management from IIM, Ahmedabad.

– 95 of 115 –
8 May 2013 / INDIA EQUITY RESEARCH / BAJAJ CORP INITIATING COVERAGE
Fair Value Calculation We have valued Bajaj Corp based on a DCF methodology which includes explicit medium term forecast for the next 7 years to FY2020E. We estimate the 7 year revenue CAGR of 21.2% led by volume growth as key brand Bajaj Almond Drops maintains traction with significant market share gains. We estimate normalized EBITDA and PAT margins of 31.1% and 22.8% respectively.
Medium‐term forecasts
Rs mn Sales 2013
CAGR (7 years)
Sales 2020 E
EBIDTA margin (%) (N)
EBIDTA (N)
EBIT margin (%) (N)
EBIT (N)
PAT (%) (N)
PAT (N)
Bajaj Corp 6,059 21.1 23,104 31.1 7,177 30.7 7,089 22.8 5,275
Source: Company, PhillipCapital India Research Estimates
We have assigned an exit P/E multiple of 12x FY2020E, implying 2.7x and 8.8x on EV/Sales and EV/EBITDA respectively. The implied terminal growth rate is 6%.
Derivation of Enterprise value 2020 (excluding intermediate FCF)
Rs mn Sales
2020EEBIDTA 2020 (N)
EBIT 2020 (N)
PAT2020 (N)
EV/Sales 2020
EV/EBIDTA 2020
EV/EBIT 2020
P/E 2020
EV (2020)
Bajaj Corp 23,104 7,177 7,089 5,275 2.7 8.8 9 12.0 63,303
Source: Company, PhillipCapital India Research Estimates
We have discounted the cash flows at 14%, considering a risk free rate of 8% and market risk premium of 6%, implying a beta of 1 Medium‐Term cash flow generation Rs mn FY2013 FY2014 FY2015 FY2016 FY2017 FY2018 FY2019 FY2020
EBIT 1,686 2,130 2,621 3,199 3,882 4,765 5,801 7,089NOPLAT 1,662 2,046 2,425 2,916 3,485 4,007 4,828 5,262Depreciation 33 42 51 60 66 73 80 88Capex 100 150 150 150 110 115 120 125FCF 1,595 1,938 2,325 2,826 3,441 3,965 4,788 5,225% conversion 95 91.0 88.7 88.4 88.6 83.2 82.5 73.7Discount factor 1.0 0.9 0.8 0.7 0.6 0.5 0.5 0.4PV 1,595 1,700 1,789 1,908 2,037 2,060 2,181 2,088NPV 1,595 3,295 5,084 6,992 9,029 11,089 13,270 15,358
Source: Company, PhillipCapital India Research Estimates
On the basis of our DCF valuation, the fair value of the company is computed at Rs 329 in line with our PER base multiple valuation of Rs. 335. Derivation of Fundamental value Rs mn/ Rs per share Value
Enterprise value‐2020 63,303 NPV Intermediate FCF 15,358 Net cash‐ end of FY2013 1,890 Return requirement 14%EV Future value end of FY2013 40,656 Target value end of FY2013 42,546 Target value per share (end Mar 2013) 288Target value per share (end of Mar 2014) 329Implied FY14 multiple (P/E) 23.6Implied 2 ‐year forward multiple (P/E) 19.9CMP 253CMP at 1‐year forward multiple (P/E) 18.1% upside 30.0
Source: Company, PhillipCapital India Research
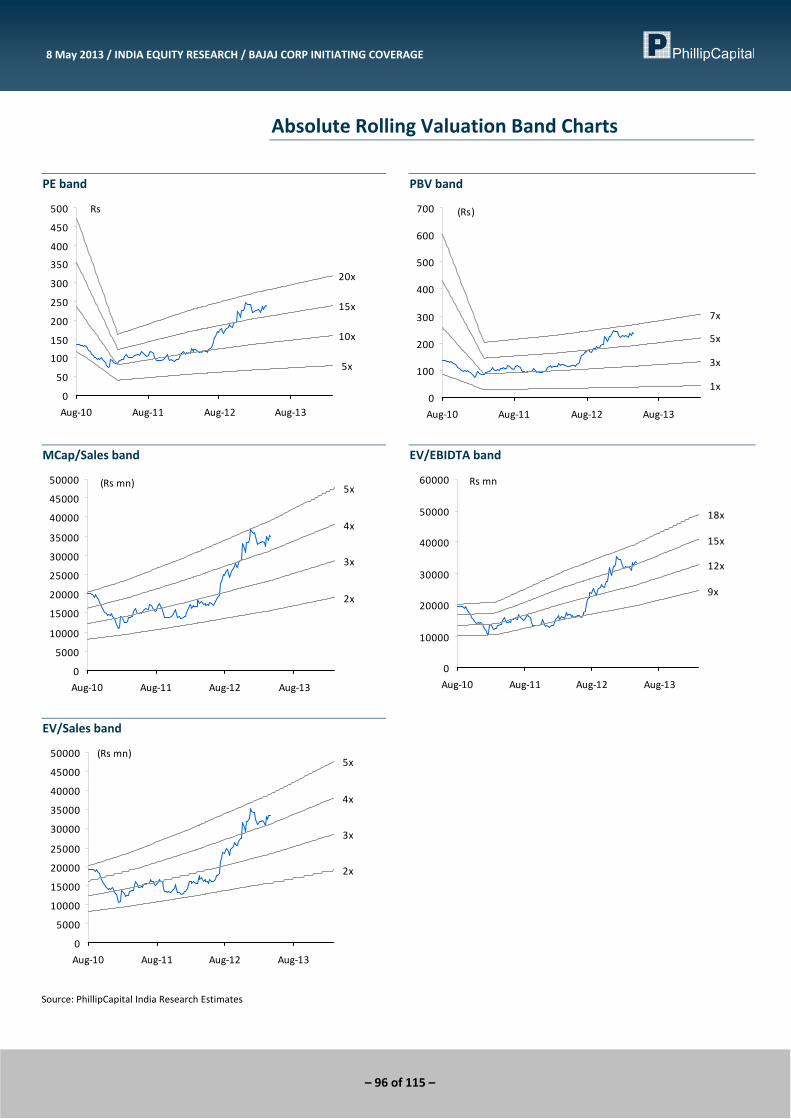
– 96 of 115 –
8 May 2013 / INDIA EQUITY RESEARCH / BAJAJ CORP INITIATING COVERAGE
Absolute Rolling Valuation Band Charts
PE band
5x
10x
15x
20x
0
50
100
150
200
250
300
350
400
450
500
Aug‐10 Aug‐11 Aug‐12 Aug‐13
Rs
PBV band
1x
3x
5x
7x
0
100
200
300
400
500
600
700
Aug‐10 Aug‐11 Aug‐12 Aug‐13
(Rs)
MCap/Sales band
2x
3x
4x
5x
0
5000
10000
15000
20000
25000
30000
35000
40000
45000
50000
Aug‐10 Aug‐11 Aug‐12 Aug‐13
(Rs mn)
EV/EBIDTA band
9x
12x
15x
18x
0
10000
20000
30000
40000
50000
60000
Aug‐10 Aug‐11 Aug‐12 Aug‐13
Rs mn
EV/Sales band
2x
3x
4x
5x
0
5000
10000
15000
20000
25000
30000
35000
40000
45000
50000
Aug‐10 Aug‐11 Aug‐12 Aug‐13
(Rs mn)
Source: PhillipCapital India Research Estimates
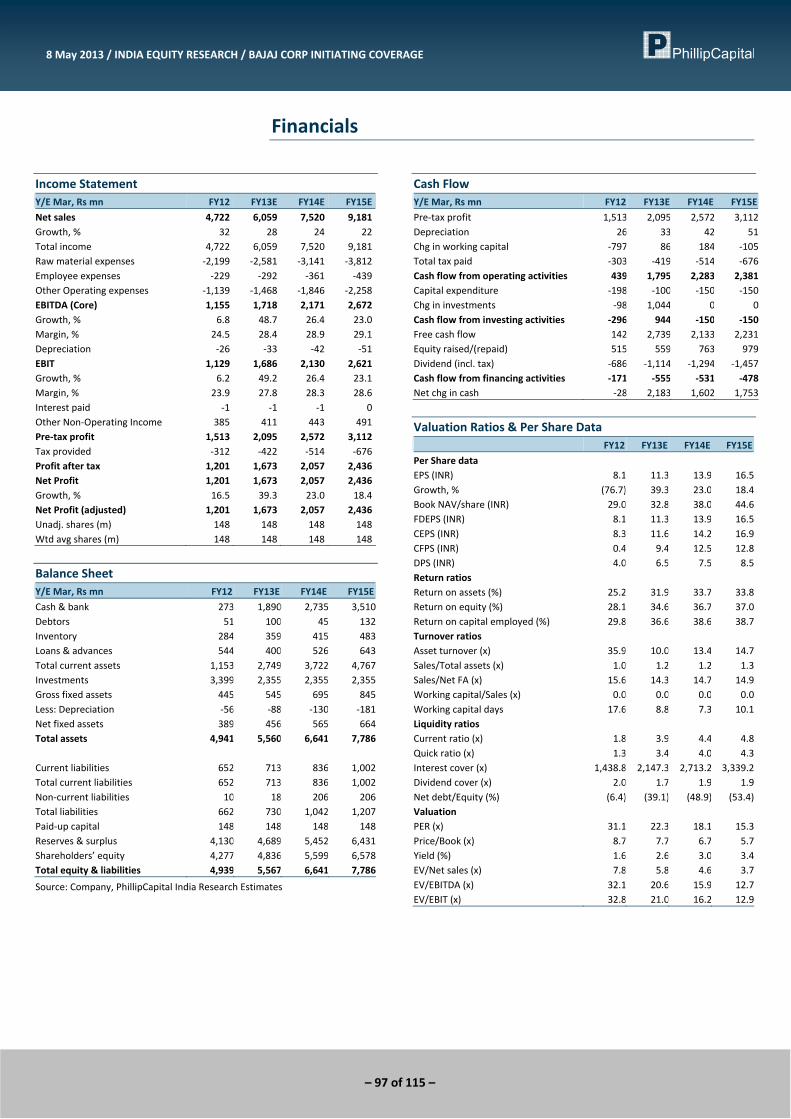
– 97 of 115 –
8 May 2013 / INDIA EQUITY RESEARCH / BAJAJ CORP INITIATING COVERAGE
Financials
Income Statement Y/E Mar, Rs mn FY12 FY13E FY14E FY15E
Net sales 4,722 6,059 7,520 9,181Growth, % 32 28 24 22Total income 4,722 6,059 7,520 9,181Raw material expenses ‐2,199 ‐2,581 ‐3,141 ‐3,812Employee expenses ‐229 ‐292 ‐361 ‐439Other Operating expenses ‐1,139 ‐1,468 ‐1,846 ‐2,258EBITDA (Core) 1,155 1,718 2,171 2,672Growth, % 6.8 48.7 26.4 23.0Margin, % 24.5 28.4 28.9 29.1Depreciation ‐26 ‐33 ‐42 ‐51EBIT 1,129 1,686 2,130 2,621Growth, % 6.2 49.2 26.4 23.1Margin, % 23.9 27.8 28.3 28.6Interest paid ‐1 ‐1 ‐1 0Other Non‐Operating Income 385 411 443 491Pre‐tax profit 1,513 2,095 2,572 3,112Tax provided ‐312 ‐422 ‐514 ‐676Profit after tax 1,201 1,673 2,057 2,436Net Profit 1,201 1,673 2,057 2,436Growth, % 16.5 39.3 23.0 18.4Net Profit (adjusted) 1,201 1,673 2,057 2,436Unadj. shares (m) 148 148 148 148Wtd avg shares (m) 148 148 148 148
Balance Sheet Y/E Mar, Rs mn FY12 FY13E FY14E FY15E
Cash & bank 273 1,890 2,735 3,510Debtors 51 100 45 132Inventory 284 359 415 483Loans & advances 544 400 526 643Total current assets 1,153 2,749 3,722 4,767Investments 3,399 2,355 2,355 2,355Gross fixed assets 445 545 695 845Less: Depreciation ‐56 ‐88 ‐130 ‐181Net fixed assets 389 456 565 664Total assets 4,941 5,560 6,641 7,786 Current liabilities 652 713 836 1,002Total current liabilities 652 713 836 1,002Non‐current liabilities 10 18 206 206Total liabilities 662 730 1,042 1,207Paid‐up capital 148 148 148 148Reserves & surplus 4,130 4,689 5,452 6,431Shareholders’ equity 4,277 4,836 5,599 6,578Total equity & liabilities 4,939 5,567 6,641 7,786
Source: Company, PhillipCapital India Research Estimates
Cash Flow Y/E Mar, Rs mn FY12 FY13E FY14E FY15E
Pre‐tax profit 1,513 2,095 2,572 3,112Depreciation 26 33 42 51Chg in working capital ‐797 86 184 ‐105Total tax paid ‐303 ‐419 ‐514 ‐676Cash flow from operating activities 439 1,795 2,283 2,381Capital expenditure ‐198 ‐100 ‐150 ‐150Chg in investments ‐98 1,044 0 0Cash flow from investing activities ‐296 944 ‐150 ‐150Free cash flow 142 2,739 2,133 2,231Equity raised/(repaid) 515 559 763 979Dividend (incl. tax) ‐686 ‐1,114 ‐1,294 ‐1,457Cash flow from financing activities ‐171 ‐555 ‐531 ‐478Net chg in cash ‐28 2,183 1,602 1,753
Valuation Ratios & Per Share Data FY12 FY13E FY14E FY15E
Per Share data EPS (INR) 8.1 11.3 13.9 16.5Growth, % (76.7) 39.3 23.0 18.4Book NAV/share (INR) 29.0 32.8 38.0 44.6FDEPS (INR) 8.1 11.3 13.9 16.5CEPS (INR) 8.3 11.6 14.2 16.9CFPS (INR) 0.4 9.4 12.5 12.8DPS (INR) 4.0 6.5 7.5 8.5Return ratios Return on assets (%) 25.2 31.9 33.7 33.8Return on equity (%) 28.1 34.6 36.7 37.0Return on capital employed (%) 29.8 36.6 38.6 38.7Turnover ratios Asset turnover (x) 35.9 10.0 13.4 14.7Sales/Total assets (x) 1.0 1.2 1.2 1.3Sales/Net FA (x) 15.6 14.3 14.7 14.9Working capital/Sales (x) 0.0 0.0 0.0 0.0Working capital days 17.6 8.8 7.3 10.1Liquidity ratios Current ratio (x) 1.8 3.9 4.4 4.8Quick ratio (x) 1.3 3.4 4.0 4.3Interest cover (x) 1,438.8 2,147.3 2,713.2 3,339.2Dividend cover (x) 2.0 1.7 1.9 1.9Net debt/Equity (%) (6.4) (39.1) (48.9) (53.4)Valuation PER (x) 31.1 22.3 18.1 15.3Price/Book (x) 8.7 7.7 6.7 5.7Yield (%) 1.6 2.6 3.0 3.4EV/Net sales (x) 7.8 5.8 4.6 3.7EV/EBITDA (x) 32.1 20.6 15.9 12.7EV/EBIT (x) 32.8 21.0 16.2 12.9
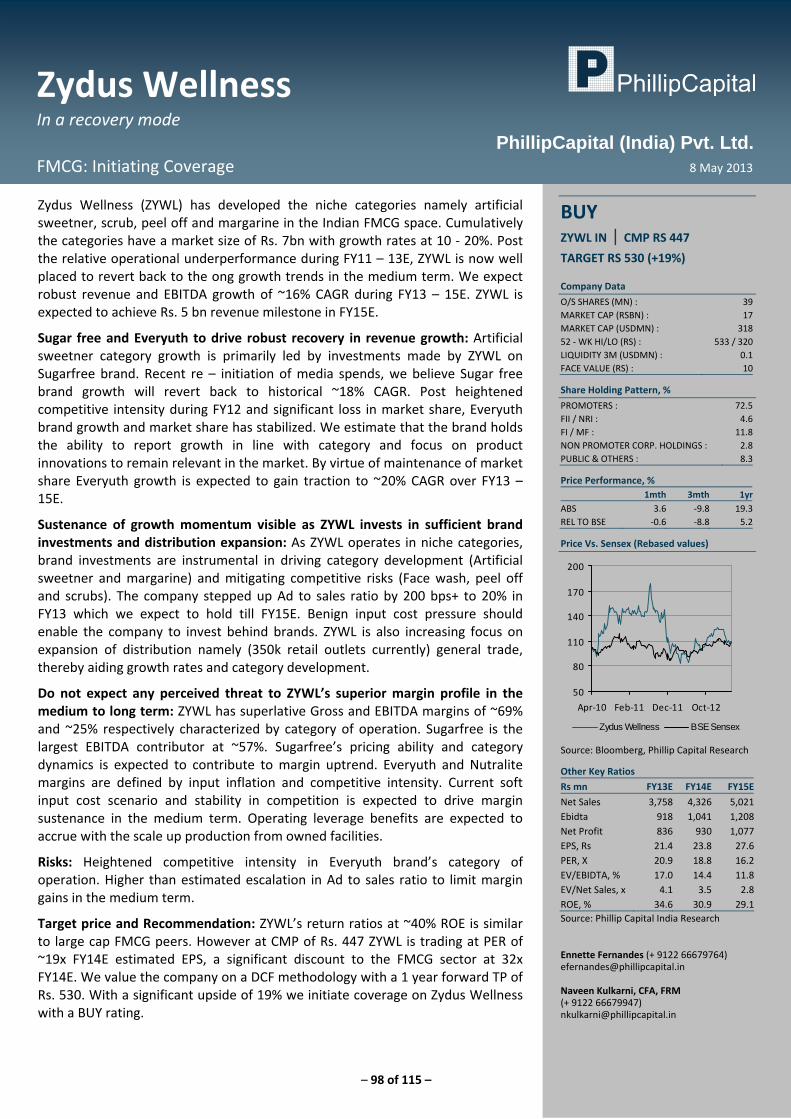
– 98 of 115 –
Zydus Wellness In a recovery mode
FMCG: Initiating Coverage 8 May 2013
PhillipCapital (India) Pvt. Ltd.
Zydus Wellness (ZYWL) has developed the niche categories namely artificial sweetner, scrub, peel off and margarine in the Indian FMCG space. Cumulatively the categories have a market size of Rs. 7bn with growth rates at 10 ‐ 20%. Post the relative operational underperformance during FY11 – 13E, ZYWL is now well placed to revert back to the ong growth trends in the medium term. We expect robust revenue and EBITDA growth of ~16% CAGR during FY13 – 15E. ZYWL is expected to achieve Rs. 5 bn revenue milestone in FY15E.
Sugar free and Everyuth to drive robust recovery in revenue growth: Artificial sweetner category growth is primarily led by investments made by ZYWL on Sugarfree brand. Recent re – initiation of media spends, we believe Sugar free brand growth will revert back to historical ~18% CAGR. Post heightened competitive intensity during FY12 and significant loss in market share, Everyuth brand growth and market share has stabilized. We estimate that the brand holds the ability to report growth in line with category and focus on product innovations to remain relevant in the market. By virtue of maintenance of market share Everyuth growth is expected to gain traction to ~20% CAGR over FY13 – 15E.
Sustenance of growth momentum visible as ZYWL invests in sufficient brand investments and distribution expansion: As ZYWL operates in niche categories, brand investments are instrumental in driving category development (Artificial sweetner and margarine) and mitigating competitive risks (Face wash, peel off and scrubs). The company stepped up Ad to sales ratio by 200 bps+ to 20% in FY13 which we expect to hold till FY15E. Benign input cost pressure should enable the company to invest behind brands. ZYWL is also increasing focus on expansion of distribution namely (350k retail outlets currently) general trade, thereby aiding growth rates and category development.
Do not expect any perceived threat to ZYWL’s superior margin profile in the medium to long term: ZYWL has superlative Gross and EBITDA margins of ~69% and ~25% respectively characterized by category of operation. Sugarfree is the largest EBITDA contributor at ~57%. Sugarfree’s pricing ability and category dynamics is expected to contribute to margin uptrend. Everyuth and Nutralite margins are defined by input inflation and competitive intensity. Current soft input cost scenario and stability in competition is expected to drive margin sustenance in the medium term. Operating leverage benefits are expected to accrue with the scale up production from owned facilities.
Risks: Heightened competitive intensity in Everyuth brand’s category of operation. Higher than estimated escalation in Ad to sales ratio to limit margin gains in the medium term.
Target price and Recommendation: ZYWL’s return ratios at ~40% ROE is similar to large cap FMCG peers. However at CMP of Rs. 447 ZYWL is trading at PER of ~19x FY14E estimated EPS, a significant discount to the FMCG sector at 32x FY14E. We value the company on a DCF methodology with a 1 year forward TP of Rs. 530. With a significant upside of 19% we initiate coverage on Zydus Wellness with a BUY rating.
BUY ZYWL IN | CMP RS 447
TARGET RS 530 (+19%) Company Data
O/S SHARES (MN) : 39MARKET CAP (RSBN) : 17MARKET CAP (USDMN) : 31852 ‐ WK HI/LO (RS) : 533 / 320LIQUIDITY 3M (USDMN) : 0.1FACE VALUE (RS) : 10
Share Holding Pattern, %
PROMOTERS : 72.5FII / NRI : 4.6FI / MF : 11.8NON PROMOTER CORP. HOLDINGS : 2.8PUBLIC & OTHERS : 8.3
Price Performance, % 1mth 3mth 1yr
ABS 3.6 ‐9.8 19.3REL TO BSE ‐0.6 ‐8.8 5.2
Price Vs. Sensex (Rebased values)
50
80
110
140
170
200
Apr‐10 Feb‐11 Dec‐11 Oct‐12
Zydus Wellness BSE Sensex
Source: Bloomberg, Phillip Capital Research
Other Key Ratios
Rs mn FY13E FY14E FY15E
Net Sales 3,758 4,326 5,021Ebidta 918 1,041 1,208Net Profit 836 930 1,077EPS, Rs 21.4 23.8 27.6PER, X 20.9 18.8 16.2EV/EBIDTA, % 17.0 14.4 11.8EV/Net Sales, x 4.1 3.5 2.8ROE, % 34.6 30.9 29.1Source: Phillip Capital India Research Ennette Fernandes (+ 9122 66679764) [email protected] Naveen Kulkarni, CFA, FRM (+ 9122 66679947) [email protected]
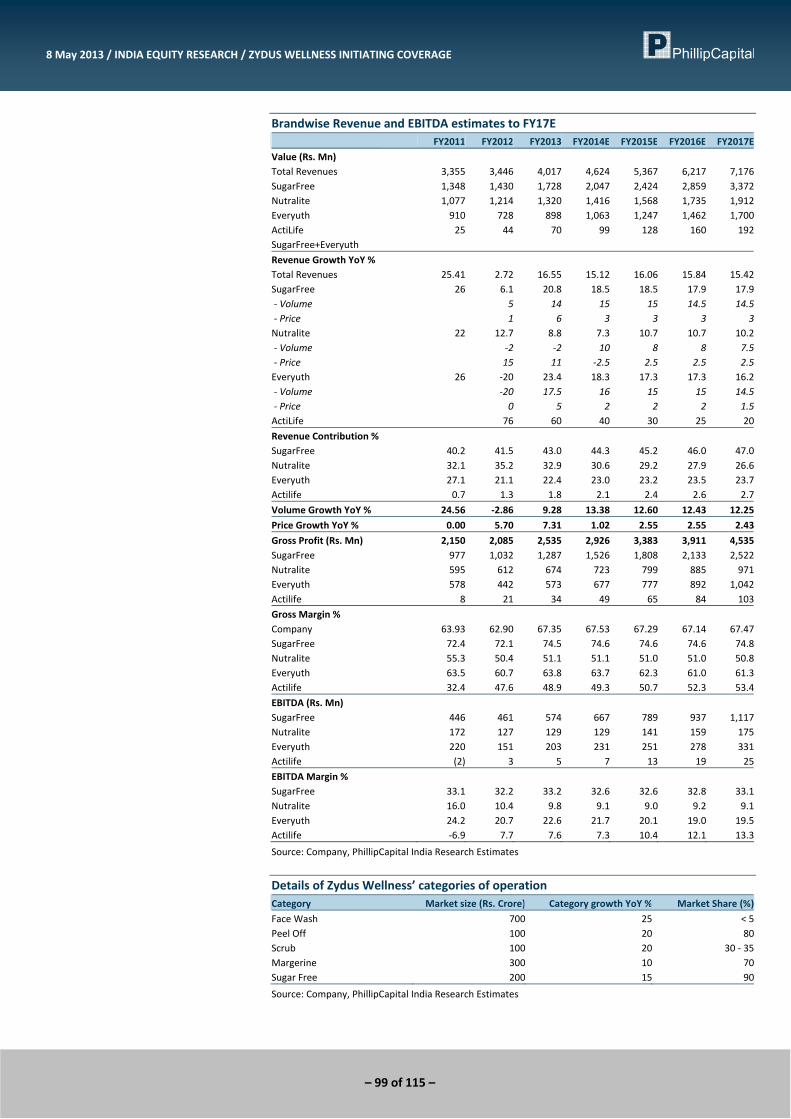
– 99 of 115 –
8 May 2013 / INDIA EQUITY RESEARCH / ZYDUS WELLNESS INITIATING COVERAGE
Brandwise Revenue and EBITDA estimates to FY17E FY2011 FY2012 FY2013 FY2014E FY2015E FY2016E FY2017E
Value (Rs. Mn) Total Revenues 3,355 3,446 4,017 4,624 5,367 6,217 7,176 SugarFree 1,348 1,430 1,728 2,047 2,424 2,859 3,372 Nutralite 1,077 1,214 1,320 1,416 1,568 1,735 1,912 Everyuth 910 728 898 1,063 1,247 1,462 1,700 ActiLife 25 44 70 99 128 160 192 SugarFree+Everyuth
Revenue Growth YoY % Total Revenues 25.41 2.72 16.55 15.12 16.06 15.84 15.42SugarFree 26 6.1 20.8 18.5 18.5 17.9 17.9 ‐ Volume 5 14 15 15 14.5 14.5 ‐ Price 1 6 3 3 3 3Nutralite 22 12.7 8.8 7.3 10.7 10.7 10.2 ‐ Volume ‐2 ‐2 10 8 8 7.5 ‐ Price 15 11 ‐2.5 2.5 2.5 2.5Everyuth 26 ‐20 23.4 18.3 17.3 17.3 16.2 ‐ Volume ‐20 17.5 16 15 15 14.5 ‐ Price 0 5 2 2 2 1.5ActiLife 76 60 40 30 25 20
Revenue Contribution % SugarFree 40.2 41.5 43.0 44.3 45.2 46.0 47.0Nutralite 32.1 35.2 32.9 30.6 29.2 27.9 26.6Everyuth 27.1 21.1 22.4 23.0 23.2 23.5 23.7Actilife 0.7 1.3 1.8 2.1 2.4 2.6 2.7
Volume Growth YoY % 24.56 ‐2.86 9.28 13.38 12.60 12.43 12.25
Price Growth YoY % 0.00 5.70 7.31 1.02 2.55 2.55 2.43
Gross Profit (Rs. Mn) 2,150 2,085 2,535 2,926 3,383 3,911 4,535 SugarFree 977 1,032 1,287 1,526 1,808 2,133 2,522 Nutralite 595 612 674 723 799 885 971 Everyuth 578 442 573 677 777 892 1,042 Actilife 8 21 34 49 65 84 103
Gross Margin % Company 63.93 62.90 67.35 67.53 67.29 67.14 67.47SugarFree 72.4 72.1 74.5 74.6 74.6 74.6 74.8Nutralite 55.3 50.4 51.1 51.1 51.0 51.0 50.8Everyuth 63.5 60.7 63.8 63.7 62.3 61.0 61.3Actilife 32.4 47.6 48.9 49.3 50.7 52.3 53.4
EBITDA (Rs. Mn) SugarFree 446 461 574 667 789 937 1,117 Nutralite 172 127 129 129 141 159 175 Everyuth 220 151 203 231 251 278 331 Actilife (2) 3 5 7 13 19 25
EBITDA Margin % SugarFree 33.1 32.2 33.2 32.6 32.6 32.8 33.1Nutralite 16.0 10.4 9.8 9.1 9.0 9.2 9.1Everyuth 24.2 20.7 22.6 21.7 20.1 19.0 19.5Actilife ‐6.9 7.7 7.6 7.3 10.4 12.1 13.3
Source: Company, PhillipCapital India Research Estimates
Details of Zydus Wellness’ categories of operation Category Market size (Rs. Crore) Category growth YoY % Market Share (%)
Face Wash 700 25 < 5Peel Off 100 20 80Scrub 100 20 30 ‐ 35Margerine 300 10 70Sugar Free 200 15 90
Source: Company, PhillipCapital India Research Estimates

– 100 of 115 –
8 May 2013 / INDIA EQUITY RESEARCH / ZYDUS WELLNESS INITIATING COVERAGE
Everyuth face wash products relaunched in February 2013
Everyuth scrub and peel off products relaunched in February 2013
Everyuth brand forays into the gylcerine soap category Everyuth Menz brand relaunched in February 2013
– 101 of 115 –
8 May 2013 / INDIA EQUITY RESEARCH / ZYDUS WELLNESS INITIATING COVERAGE
About the company Zydus Wellness Ltd. is the consumer and wellness arm of the pharmaceutical company Zydus Cadila Healthcare, which was demerged in 2008. The arm comprising of the brands Sugar Free and Everyuth was merged with Carnation Nutra Analogue Foods Ltd., wherein the latter company owned the brand Nutralite, in 2008. The main 3 brands Sugar Free, Everyuth and Nutralite operate in niche health and consumer care categories of artificial sweetner, face care and margarine respectively. These categories are gaining relevance in India as the consumers get increasingly health conscious. The company continues to pursue new opportunities led by product innovations marked by the recent launch of the adult health drink brand Acti Life. The company’s target is to generate Rs. 500 crore turnover by 2014, which the management is fairly confident of achieving. Mr. Elkana Nissim Ezekiel has been the Chief Executive Officer and Managing Director of Zydus Wellness Limited since Feb 14, 2012. Prior to his appointment he was the Chief Marketing Officer of Samsung India Electronics Private Ltd. from March 2011 to February 2012. Mr. Ezekiel longest stint has been with Johnson & Johnson comprising of more than 16 years. He has also worked with Colgate Palmolive and Geoffrey Manners. He holds BA in Economics from Bombay University and MBA in marketing from XLRI‐Jamshedpur.
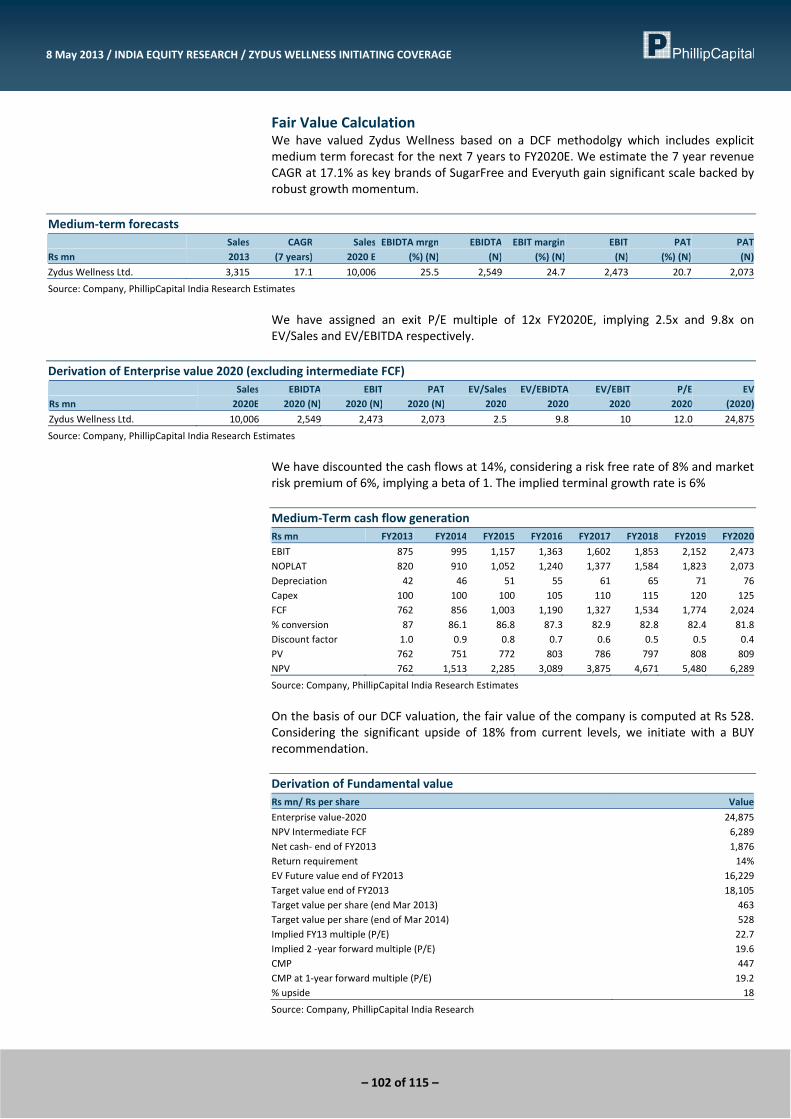
– 102 of 115 –
8 May 2013 / INDIA EQUITY RESEARCH / ZYDUS WELLNESS INITIATING COVERAGE
Fair Value Calculation We have valued Zydus Wellness based on a DCF methodolgy which includes explicit medium term forecast for the next 7 years to FY2020E. We estimate the 7 year revenue CAGR at 17.1% as key brands of SugarFree and Everyuth gain significant scale backed by robust growth momentum.
Medium‐term forecasts
Rs mn Sales2013
CAGR (7 years)
Sales 2020 E
EBIDTA mrgn (%) (N)
EBIDTA (N)
EBIT margin (%) (N)
EBIT (N)
PAT(%) (N)
PAT (N)
Zydus Wellness Ltd. 3,315 17.1 10,006 25.5 2,549 24.7 2,473 20.7 2,073
Source: Company, PhillipCapital India Research Estimates
We have assigned an exit P/E multiple of 12x FY2020E, implying 2.5x and 9.8x on EV/Sales and EV/EBITDA respectively.
Derivation of Enterprise value 2020 (excluding intermediate FCF)
Rs mn Sales
2020EEBIDTA 2020 (N)
EBIT 2020 (N)
PAT2020 (N)
EV/Sales 2020
EV/EBIDTA 2020
EV/EBIT 2020
P/E 2020
EV (2020)
Zydus Wellness Ltd. 10,006 2,549 2,473 2,073 2.5 9.8 10 12.0 24,875
Source: Company, PhillipCapital India Research Estimates
We have discounted the cash flows at 14%, considering a risk free rate of 8% and market risk premium of 6%, implying a beta of 1. The implied terminal growth rate is 6% Medium‐Term cash flow generation Rs mn FY2013 FY2014 FY2015 FY2016 FY2017 FY2018 FY2019 FY2020
EBIT 875 995 1,157 1,363 1,602 1,853 2,152 2,473NOPLAT 820 910 1,052 1,240 1,377 1,584 1,823 2,073Depreciation 42 46 51 55 61 65 71 76Capex 100 100 100 105 110 115 120 125FCF 762 856 1,003 1,190 1,327 1,534 1,774 2,024% conversion 87 86.1 86.8 87.3 82.9 82.8 82.4 81.8Discount factor 1.0 0.9 0.8 0.7 0.6 0.5 0.5 0.4PV 762 751 772 803 786 797 808 809NPV 762 1,513 2,285 3,089 3,875 4,671 5,480 6,289
Source: Company, PhillipCapital India Research Estimates
On the basis of our DCF valuation, the fair value of the company is computed at Rs 528. Considering the significant upside of 18% from current levels, we initiate with a BUY recommendation. Derivation of Fundamental value Rs mn/ Rs per share Value
Enterprise value‐2020 24,875NPV Intermediate FCF 6,289Net cash‐ end of FY2013 1,876Return requirement 14%EV Future value end of FY2013 16,229Target value end of FY2013 18,105Target value per share (end Mar 2013) 463Target value per share (end of Mar 2014) 528Implied FY13 multiple (P/E) 22.7Implied 2 ‐year forward multiple (P/E) 19.6CMP 447CMP at 1‐year forward multiple (P/E) 19.2% upside 18
Source: Company, PhillipCapital India Research
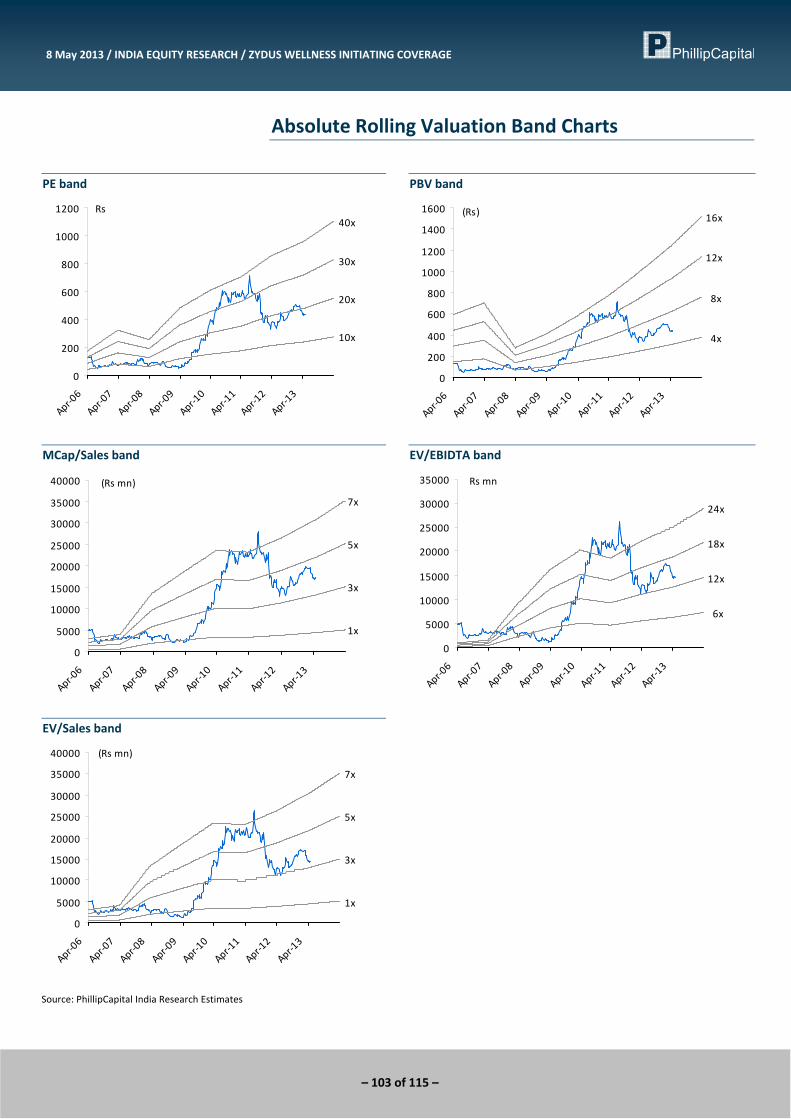
– 103 of 115 –
8 May 2013 / INDIA EQUITY RESEARCH / ZYDUS WELLNESS INITIATING COVERAGE
Absolute Rolling Valuation Band Charts
PE band
10x
20x
30x
40x
0
200
400
600
800
1000
1200
Apr‐06
Apr‐07
Apr‐08
Apr‐09
Apr‐10
Apr‐11
Apr‐12
Apr‐13
Rs
PBV band
4x
8x
12x
16x
0
200
400
600
800
1000
1200
1400
1600
Apr‐06
Apr‐07
Apr‐08
Apr‐09
Apr‐10
Apr‐11
Apr‐12
Apr‐13
(Rs)
MCap/Sales band
1x
3x
5x
7x
0
5000
10000
15000
20000
25000
30000
35000
40000
Apr‐06
Apr‐07
Apr‐08
Apr‐09
Apr‐10
Apr‐11
Apr‐12
Apr‐13
(Rs mn)
EV/EBIDTA band
6x
12x
18x
24x
0
5000
10000
15000
20000
25000
30000
35000
Apr‐06
Apr‐07
Apr‐08
Apr‐09
Apr‐10
Apr‐11
Apr‐12
Apr‐13
Rs mn
EV/Sales band
1x
3x
5x
7x
0
5000
10000
15000
20000
25000
30000
35000
40000
Apr‐06
Apr‐07
Apr‐08
Apr‐09
Apr‐10
Apr‐11
Apr‐12
Apr‐13
(Rs mn)
Source: PhillipCapital India Research Estimates
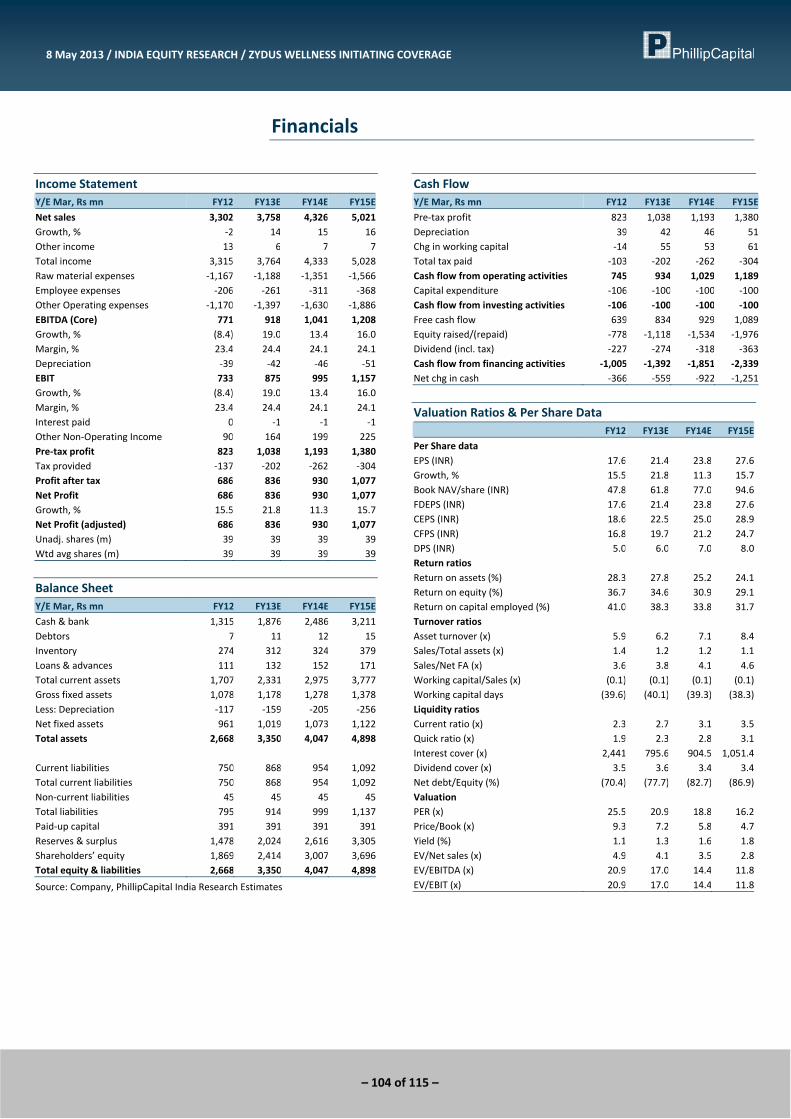
– 104 of 115 –
8 May 2013 / INDIA EQUITY RESEARCH / ZYDUS WELLNESS INITIATING COVERAGE
Financials
Income Statement Y/E Mar, Rs mn FY12 FY13E FY14E FY15E
Net sales 3,302 3,758 4,326 5,021Growth, % ‐2 14 15 16Other income 13 6 7 7Total income 3,315 3,764 4,333 5,028Raw material expenses ‐1,167 ‐1,188 ‐1,351 ‐1,566Employee expenses ‐206 ‐261 ‐311 ‐368Other Operating expenses ‐1,170 ‐1,397 ‐1,630 ‐1,886EBITDA (Core) 771 918 1,041 1,208Growth, % (8.4) 19.0 13.4 16.0Margin, % 23.4 24.4 24.1 24.1Depreciation ‐39 ‐42 ‐46 ‐51EBIT 733 875 995 1,157Growth, % (8.4) 19.0 13.4 16.0Margin, % 23.4 24.4 24.1 24.1Interest paid 0 ‐1 ‐1 ‐1Other Non‐Operating Income 90 164 199 225Pre‐tax profit 823 1,038 1,193 1,380Tax provided ‐137 ‐202 ‐262 ‐304Profit after tax 686 836 930 1,077Net Profit 686 836 930 1,077Growth, % 15.5 21.8 11.3 15.7Net Profit (adjusted) 686 836 930 1,077Unadj. shares (m) 39 39 39 39Wtd avg shares (m) 39 39 39 39
Balance Sheet Y/E Mar, Rs mn FY12 FY13E FY14E FY15E
Cash & bank 1,315 1,876 2,486 3,211Debtors 7 11 12 15Inventory 274 312 324 379Loans & advances 111 132 152 171Total current assets 1,707 2,331 2,975 3,777Gross fixed assets 1,078 1,178 1,278 1,378Less: Depreciation ‐117 ‐159 ‐205 ‐256Net fixed assets 961 1,019 1,073 1,122Total assets 2,668 3,350 4,047 4,898 Current liabilities 750 868 954 1,092Total current liabilities 750 868 954 1,092Non‐current liabilities 45 45 45 45Total liabilities 795 914 999 1,137Paid‐up capital 391 391 391 391Reserves & surplus 1,478 2,024 2,616 3,305Shareholders’ equity 1,869 2,414 3,007 3,696Total equity & liabilities 2,668 3,350 4,047 4,898
Source: Company, PhillipCapital India Research Estimates
Cash Flow Y/E Mar, Rs mn FY12 FY13E FY14E FY15E
Pre‐tax profit 823 1,038 1,193 1,380Depreciation 39 42 46 51Chg in working capital ‐14 55 53 61Total tax paid ‐103 ‐202 ‐262 ‐304Cash flow from operating activities 745 934 1,029 1,189Capital expenditure ‐106 ‐100 ‐100 ‐100Cash flow from investing activities ‐106 ‐100 ‐100 ‐100Free cash flow 639 834 929 1,089Equity raised/(repaid) ‐778 ‐1,118 ‐1,534 ‐1,976Dividend (incl. tax) ‐227 ‐274 ‐318 ‐363Cash flow from financing activities ‐1,005 ‐1,392 ‐1,851 ‐2,339Net chg in cash ‐366 ‐559 ‐922 ‐1,251
Valuation Ratios & Per Share Data FY12 FY13E FY14E FY15E
Per Share data EPS (INR) 17.6 21.4 23.8 27.6Growth, % 15.5 21.8 11.3 15.7Book NAV/share (INR) 47.8 61.8 77.0 94.6FDEPS (INR) 17.6 21.4 23.8 27.6CEPS (INR) 18.6 22.5 25.0 28.9CFPS (INR) 16.8 19.7 21.2 24.7DPS (INR) 5.0 6.0 7.0 8.0Return ratios Return on assets (%) 28.3 27.8 25.2 24.1Return on equity (%) 36.7 34.6 30.9 29.1Return on capital employed (%) 41.0 38.3 33.8 31.7Turnover ratios Asset turnover (x) 5.9 6.2 7.1 8.4Sales/Total assets (x) 1.4 1.2 1.2 1.1Sales/Net FA (x) 3.6 3.8 4.1 4.6Working capital/Sales (x) (0.1) (0.1) (0.1) (0.1)Working capital days (39.6) (40.1) (39.3) (38.3)Liquidity ratios Current ratio (x) 2.3 2.7 3.1 3.5Quick ratio (x) 1.9 2.3 2.8 3.1Interest cover (x) 2,441 795.6 904.5 1,051.4Dividend cover (x) 3.5 3.6 3.4 3.4Net debt/Equity (%) (70.4) (77.7) (82.7) (86.9)Valuation PER (x) 25.5 20.9 18.8 16.2Price/Book (x) 9.3 7.2 5.8 4.7Yield (%) 1.1 1.3 1.6 1.8EV/Net sales (x) 4.9 4.1 3.5 2.8EV/EBITDA (x) 20.9 17.0 14.4 11.8EV/EBIT (x) 20.9 17.0 14.4 11.8
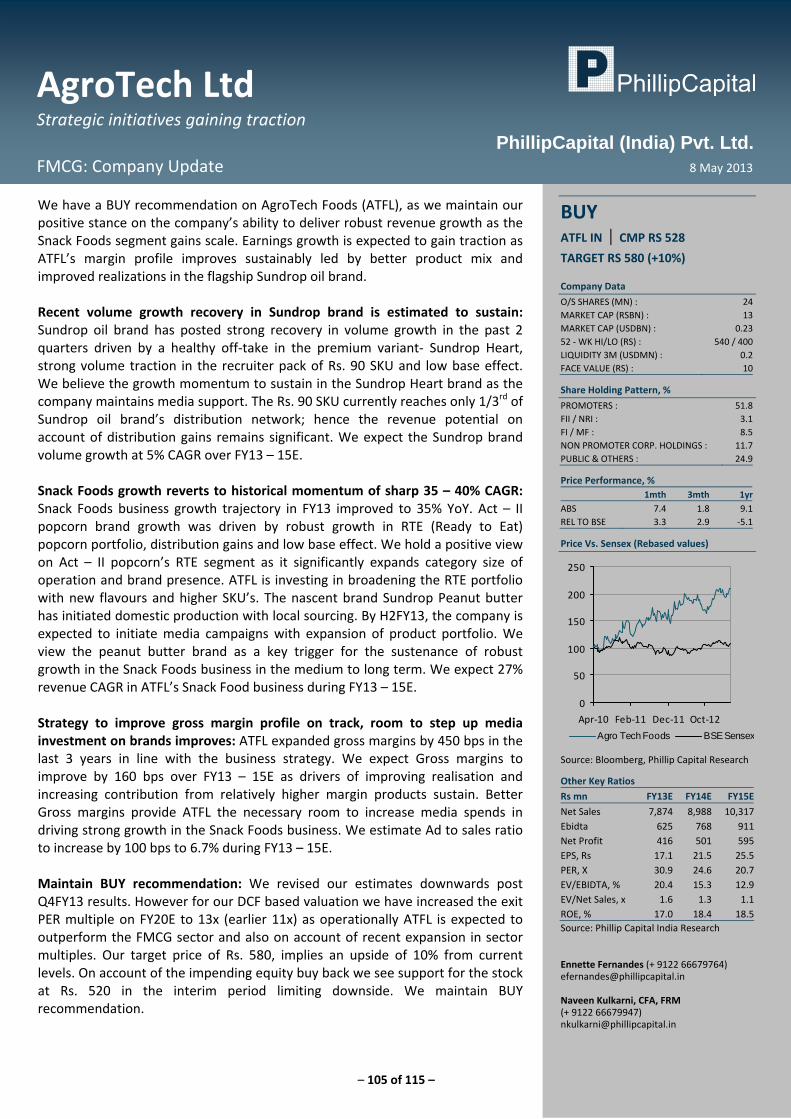
– 105 of 115 –
AgroTech Ltd Strategic initiatives gaining traction
FMCG: Company Update 8 May 2013
PhillipCapital (India) Pvt. Ltd.
We have a BUY recommendation on AgroTech Foods (ATFL), as we maintain our positive stance on the company’s ability to deliver robust revenue growth as the Snack Foods segment gains scale. Earnings growth is expected to gain traction as ATFL’s margin profile improves sustainably led by better product mix and improved realizations in the flagship Sundrop oil brand. Recent volume growth recovery in Sundrop brand is estimated to sustain: Sundrop oil brand has posted strong recovery in volume growth in the past 2 quarters driven by a healthy off‐take in the premium variant‐ Sundrop Heart, strong volume traction in the recruiter pack of Rs. 90 SKU and low base effect. We believe the growth momentum to sustain in the Sundrop Heart brand as the company maintains media support. The Rs. 90 SKU currently reaches only 1/3rd of Sundrop oil brand’s distribution network; hence the revenue potential on account of distribution gains remains significant. We expect the Sundrop brand volume growth at 5% CAGR over FY13 – 15E. Snack Foods growth reverts to historical momentum of sharp 35 – 40% CAGR: Snack Foods business growth trajectory in FY13 improved to 35% YoY. Act – II popcorn brand growth was driven by robust growth in RTE (Ready to Eat) popcorn portfolio, distribution gains and low base effect. We hold a positive view on Act – II popcorn’s RTE segment as it significantly expands category size of operation and brand presence. ATFL is investing in broadening the RTE portfolio with new flavours and higher SKU’s. The nascent brand Sundrop Peanut butter has initiated domestic production with local sourcing. By H2FY13, the company is expected to initiate media campaigns with expansion of product portfolio. We view the peanut butter brand as a key trigger for the sustenance of robust growth in the Snack Foods business in the medium to long term. We expect 27% revenue CAGR in ATFL’s Snack Food business during FY13 – 15E. Strategy to improve gross margin profile on track, room to step up media investment on brands improves: ATFL expanded gross margins by 450 bps in the last 3 years in line with the business strategy. We expect Gross margins to improve by 160 bps over FY13 – 15E as drivers of improving realisation and increasing contribution from relatively higher margin products sustain. Better Gross margins provide ATFL the necessary room to increase media spends in driving strong growth in the Snack Foods business. We estimate Ad to sales ratio to increase by 100 bps to 6.7% during FY13 – 15E. Maintain BUY recommendation: We revised our estimates downwards post Q4FY13 results. However for our DCF based valuation we have increased the exit PER multiple on FY20E to 13x (earlier 11x) as operationally ATFL is expected to outperform the FMCG sector and also on account of recent expansion in sector multiples. Our target price of Rs. 580, implies an upside of 10% from current levels. On account of the impending equity buy back we see support for the stock at Rs. 520 in the interim period limiting downside. We maintain BUY recommendation.
BUY ATFL IN | CMP RS 528
TARGET RS 580 (+10%) Company Data
O/S SHARES (MN) : 24MARKET CAP (RSBN) : 13MARKET CAP (USDBN) : 0.2352 ‐ WK HI/LO (RS) : 540 / 400LIQUIDITY 3M (USDMN) : 0.2FACE VALUE (RS) : 10
Share Holding Pattern, %
PROMOTERS : 51.8FII / NRI : 3.1FI / MF : 8.5NON PROMOTER CORP. HOLDINGS : 11.7PUBLIC & OTHERS : 24.9
Price Performance, % 1mth 3mth 1yr
ABS 7.4 1.8 9.1REL TO BSE 3.3 2.9 ‐5.1
Price Vs. Sensex (Rebased values)
0
50
100
150
200
250
Apr‐10 Feb‐11 Dec‐11 Oct‐12
Agro Tech Foods BSE Sensex
Source: Bloomberg, Phillip Capital Research
Other Key Ratios
Rs mn FY13E FY14E FY15E
Net Sales 7,874 8,988 10,317Ebidta 625 768 911Net Profit 416 501 595EPS, Rs 17.1 21.5 25.5PER, X 30.9 24.6 20.7EV/EBIDTA, % 20.4 15.3 12.9EV/Net Sales, x 1.6 1.3 1.1ROE, % 17.0 18.4 18.5Source: Phillip Capital India Research Ennette Fernandes (+ 9122 66679764) [email protected] Naveen Kulkarni, CFA, FRM (+ 9122 66679947) [email protected]
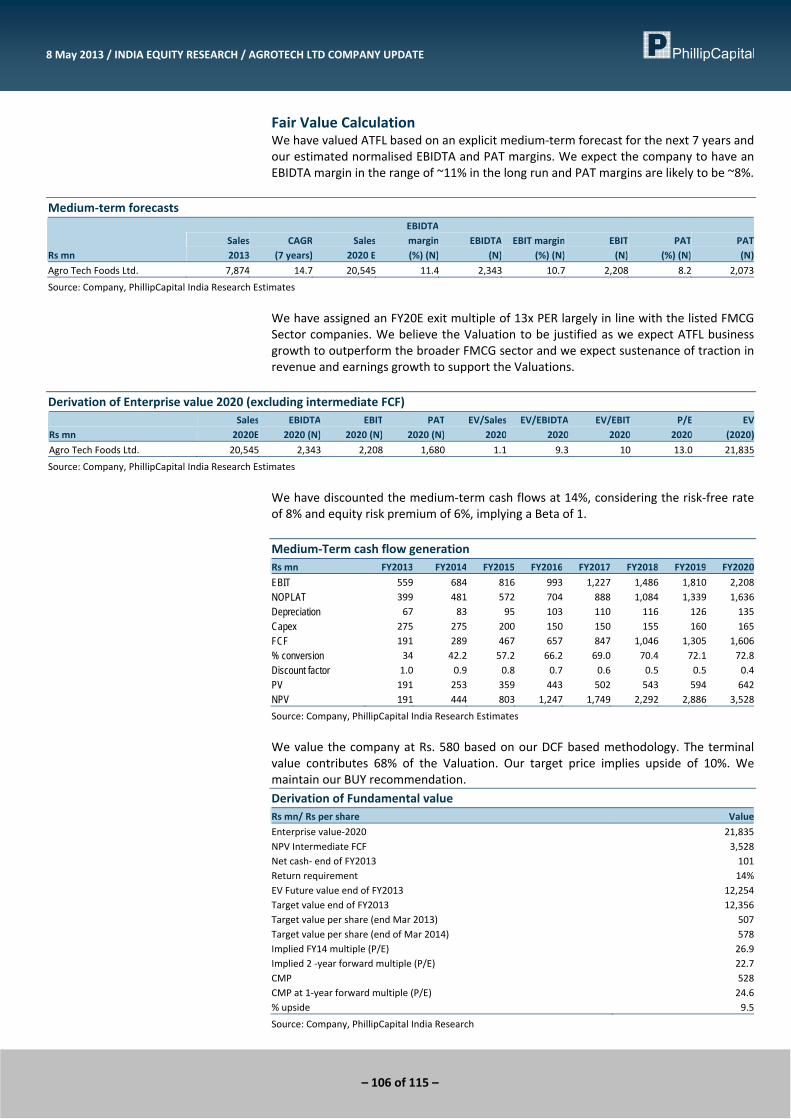
– 106 of 115 –
8 May 2013 / INDIA EQUITY RESEARCH / AGROTECH LTD COMPANY UPDATE
Fair Value Calculation We have valued ATFL based on an explicit medium‐term forecast for the next 7 years and our estimated normalised EBIDTA and PAT margins. We expect the company to have an EBIDTA margin in the range of ~11% in the long run and PAT margins are likely to be ~8%.
Medium‐term forecasts
Rs mn Sales2013
CAGR (7 years)
Sales 2020 E
EBIDTA margin (%) (N)
EBIDTA (N)
EBIT margin (%) (N)
EBIT (N)
PAT(%) (N)
PAT (N)
Agro Tech Foods Ltd. 7,874 14.7 20,545 11.4 2,343 10.7 2,208 8.2 2,073
Source: Company, PhillipCapital India Research Estimates
We have assigned an FY20E exit multiple of 13x PER largely in line with the listed FMCG Sector companies. We believe the Valuation to be justified as we expect ATFL business growth to outperform the broader FMCG sector and we expect sustenance of traction in revenue and earnings growth to support the Valuations.
Derivation of Enterprise value 2020 (excluding intermediate FCF)
Rs mn Sales
2020EEBIDTA 2020 (N)
EBIT 2020 (N)
PAT2020 (N)
EV/Sales 2020
EV/EBIDTA 2020
EV/EBIT 2020
P/E 2020
EV (2020)
Agro Tech Foods Ltd. 20,545 2,343 2,208 1,680 1.1 9.3 10 13.0 21,835
Source: Company, PhillipCapital India Research Estimates
We have discounted the medium‐term cash flows at 14%, considering the risk‐free rate of 8% and equity risk premium of 6%, implying a Beta of 1. Medium‐Term cash flow generation Rs mn FY2013 FY2014 FY2015 FY2016 FY2017 FY2018 FY2019 FY2020
EBIT 559 684 816 993 1,227 1,486 1,810 2,208NOPLAT 399 481 572 704 888 1,084 1,339 1,636Depreciation 67 83 95 103 110 116 126 135Capex 275 275 200 150 150 155 160 165FCF 191 289 467 657 847 1,046 1,305 1,606% conversion 34 42.2 57.2 66.2 69.0 70.4 72.1 72.8Discount factor 1.0 0.9 0.8 0.7 0.6 0.5 0.5 0.4PV 191 253 359 443 502 543 594 642NPV 191 444 803 1,247 1,749 2,292 2,886 3,528
Source: Company, PhillipCapital India Research Estimates
We value the company at Rs. 580 based on our DCF based methodology. The terminal value contributes 68% of the Valuation. Our target price implies upside of 10%. We maintain our BUY recommendation. Derivation of Fundamental value Rs mn/ Rs per share Value
Enterprise value‐2020 21,835 NPV Intermediate FCF 3,528 Net cash‐ end of FY2013 101 Return requirement 14%EV Future value end of FY2013 12,254 Target value end of FY2013 12,356 Target value per share (end Mar 2013) 507Target value per share (end of Mar 2014) 578Implied FY14 multiple (P/E) 26.9Implied 2 ‐year forward multiple (P/E) 22.7CMP 528CMP at 1‐year forward multiple (P/E) 24.6% upside 9.5
Source: Company, PhillipCapital India Research
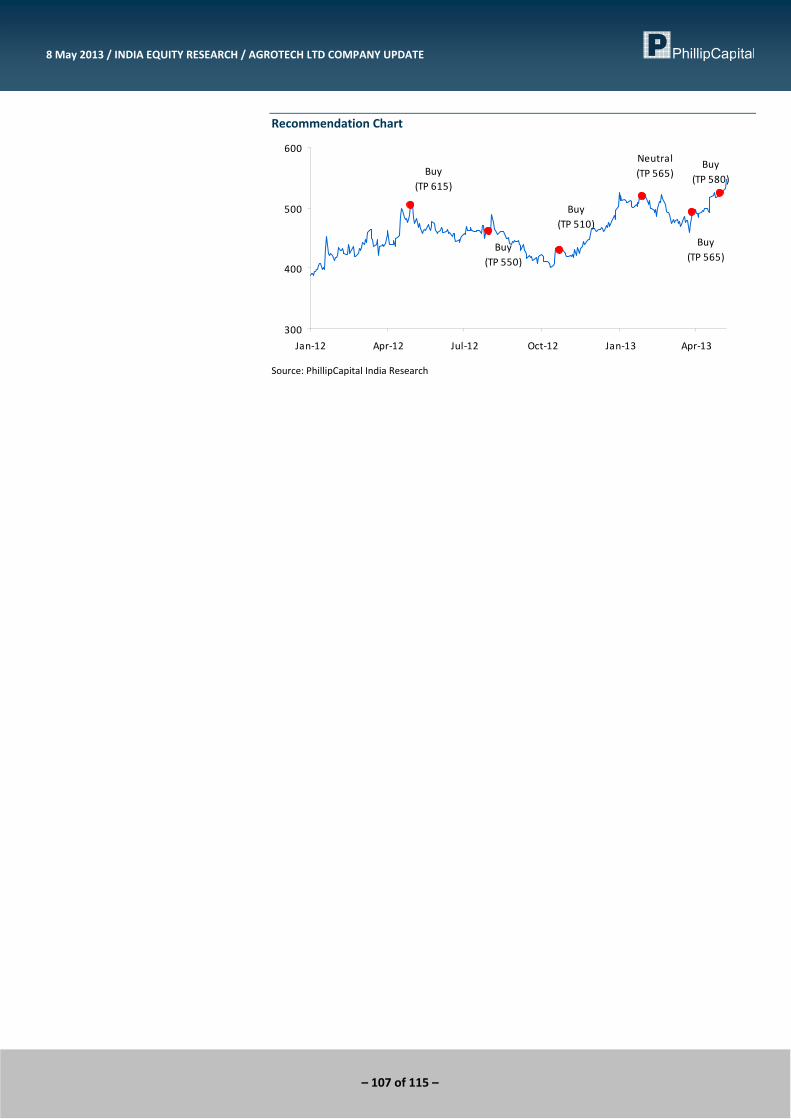
– 107 of 115 –
8 May 2013 / INDIA EQUITY RESEARCH / AGROTECH LTD COMPANY UPDATE
Recommendation Chart
Buy(TP 580)
Buy(TP 615)
Buy(TP 550)
Buy(TP 510)
Neutral(TP 565)
Buy(TP 565)
300
400
500
600
Jan‐12 Apr‐12 Jul‐12 Oct‐12 Jan‐13 Apr‐13
Source: PhillipCapital India Research
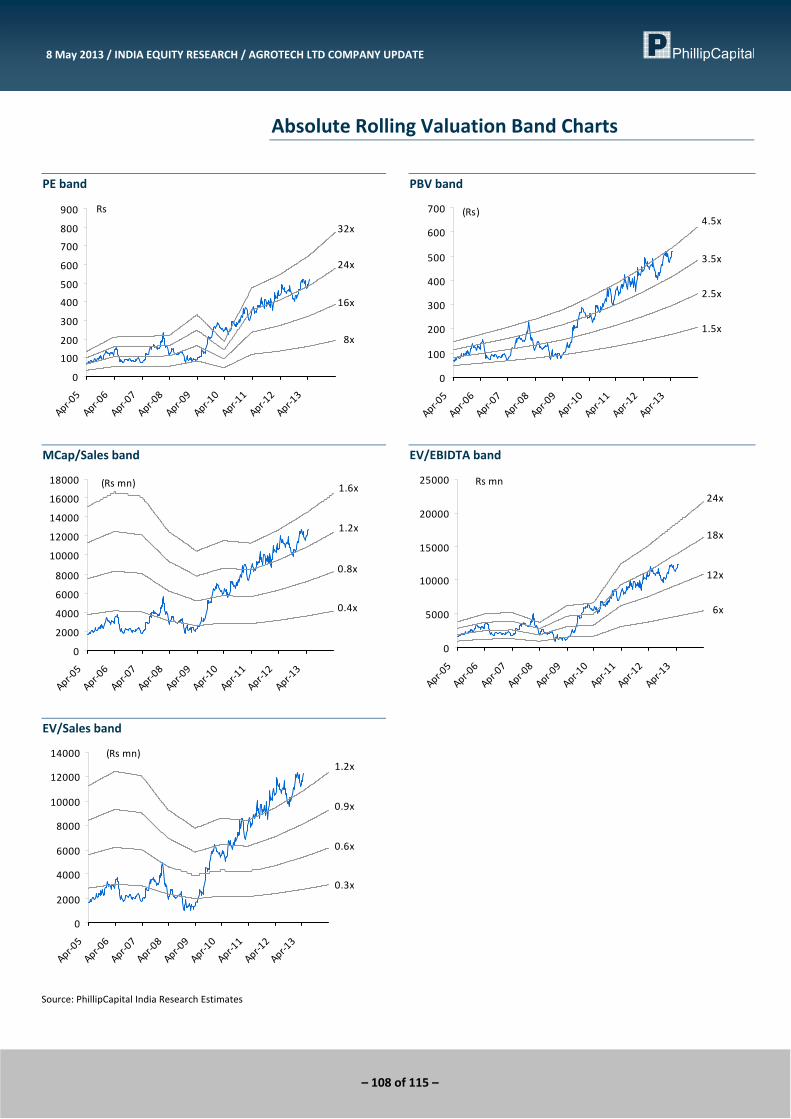
– 108 of 115 –
8 May 2013 / INDIA EQUITY RESEARCH / AGROTECH LTD COMPANY UPDATE
Absolute Rolling Valuation Band Charts
PE band
8x
16x
24x
32x
0
100
200
300
400
500
600
700
800
900
Apr‐05
Apr‐06
Apr‐07
Apr‐08
Apr‐09
Apr‐10
Apr‐11
Apr‐12
Apr‐13
Rs
PBV band
1.5x
2.5x
3.5x
4.5x
0
100
200
300
400
500
600
700
Apr‐05
Apr‐06
Apr‐07
Apr‐08
Apr‐09
Apr‐10
Apr‐11
Apr‐12
Apr‐13
(Rs)
MCap/Sales band
0.4x
0.8x
1.2x
1.6x
0
2000
4000
6000
8000
10000
12000
14000
16000
18000
Apr‐05
Apr‐06
Apr‐07
Apr‐08
Apr‐09
Apr‐10
Apr‐11
Apr‐12
Apr‐13
(Rs mn)
EV/EBIDTA band
6x
12x
18x
24x
0
5000
10000
15000
20000
25000
Apr‐05
Apr‐06
Apr‐07
Apr‐08
Apr‐09
Apr‐10
Apr‐11
Apr‐12
Apr‐13
Rs mn
EV/Sales band
0.3x
0.6x
0.9x
1.2x
0
2000
4000
6000
8000
10000
12000
14000
Apr‐05
Apr‐06
Apr‐07
Apr‐08
Apr‐09
Apr‐10
Apr‐11
Apr‐12
Apr‐13
(Rs mn)
Source: PhillipCapital India Research Estimates
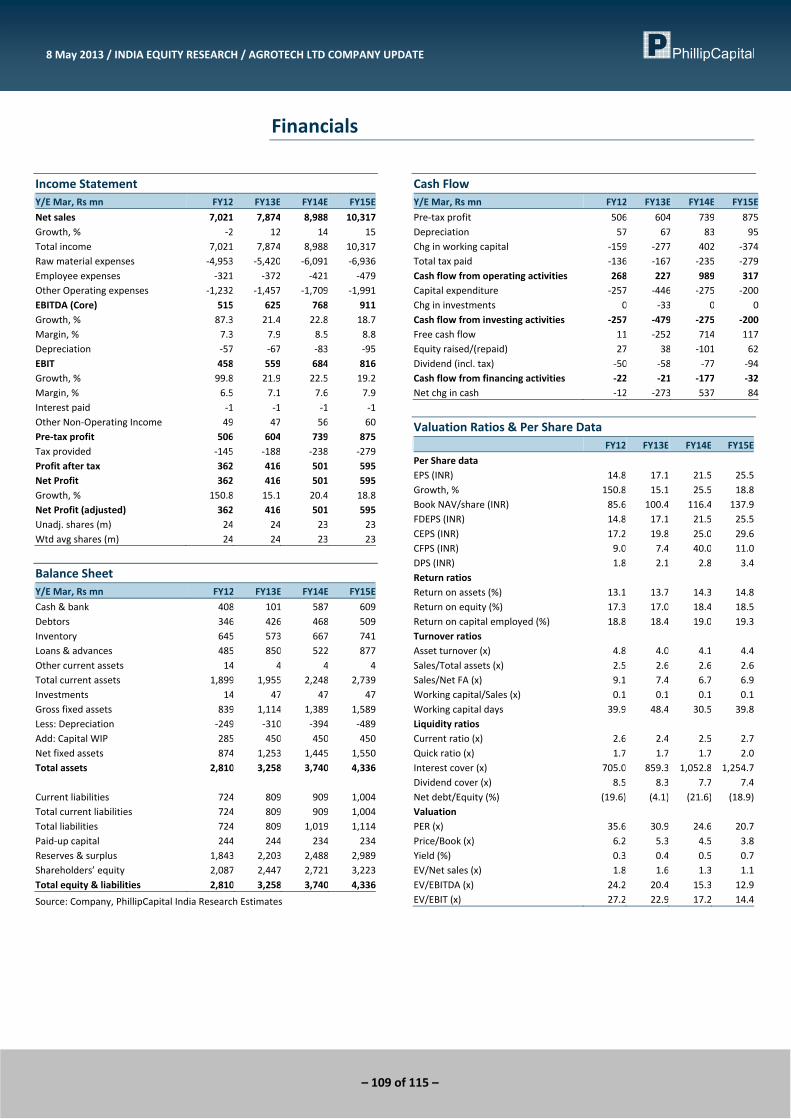
– 109 of 115 –
8 May 2013 / INDIA EQUITY RESEARCH / AGROTECH LTD COMPANY UPDATE
Financials
Income Statement Y/E Mar, Rs mn FY12 FY13E FY14E FY15E
Net sales 7,021 7,874 8,988 10,317Growth, % ‐2 12 14 15Total income 7,021 7,874 8,988 10,317Raw material expenses ‐4,953 ‐5,420 ‐6,091 ‐6,936Employee expenses ‐321 ‐372 ‐421 ‐479Other Operating expenses ‐1,232 ‐1,457 ‐1,709 ‐1,991EBITDA (Core) 515 625 768 911Growth, % 87.3 21.4 22.8 18.7Margin, % 7.3 7.9 8.5 8.8Depreciation ‐57 ‐67 ‐83 ‐95EBIT 458 559 684 816Growth, % 99.8 21.9 22.5 19.2Margin, % 6.5 7.1 7.6 7.9Interest paid ‐1 ‐1 ‐1 ‐1Other Non‐Operating Income 49 47 56 60Pre‐tax profit 506 604 739 875Tax provided ‐145 ‐188 ‐238 ‐279Profit after tax 362 416 501 595Net Profit 362 416 501 595Growth, % 150.8 15.1 20.4 18.8Net Profit (adjusted) 362 416 501 595Unadj. shares (m) 24 24 23 23Wtd avg shares (m) 24 24 23 23
Balance Sheet Y/E Mar, Rs mn FY12 FY13E FY14E FY15E
Cash & bank 408 101 587 609Debtors 346 426 468 509Inventory 645 573 667 741Loans & advances 485 850 522 877Other current assets 14 4 4 4Total current assets 1,899 1,955 2,248 2,739Investments 14 47 47 47Gross fixed assets 839 1,114 1,389 1,589Less: Depreciation ‐249 ‐310 ‐394 ‐489Add: Capital WIP 285 450 450 450Net fixed assets 874 1,253 1,445 1,550Total assets 2,810 3,258 3,740 4,336 Current liabilities 724 809 909 1,004Total current liabilities 724 809 909 1,004Total liabilities 724 809 1,019 1,114Paid‐up capital 244 244 234 234Reserves & surplus 1,843 2,203 2,488 2,989Shareholders’ equity 2,087 2,447 2,721 3,223Total equity & liabilities 2,810 3,258 3,740 4,336
Source: Company, PhillipCapital India Research Estimates
Cash Flow Y/E Mar, Rs mn FY12 FY13E FY14E FY15E
Pre‐tax profit 506 604 739 875Depreciation 57 67 83 95Chg in working capital ‐159 ‐277 402 ‐374Total tax paid ‐136 ‐167 ‐235 ‐279Cash flow from operating activities 268 227 989 317Capital expenditure ‐257 ‐446 ‐275 ‐200Chg in investments 0 ‐33 0 0Cash flow from investing activities ‐257 ‐479 ‐275 ‐200Free cash flow 11 ‐252 714 117Equity raised/(repaid) 27 38 ‐101 62Dividend (incl. tax) ‐50 ‐58 ‐77 ‐94Cash flow from financing activities ‐22 ‐21 ‐177 ‐32Net chg in cash ‐12 ‐273 537 84
Valuation Ratios & Per Share Data FY12 FY13E FY14E FY15E
Per Share data EPS (INR) 14.8 17.1 21.5 25.5Growth, % 150.8 15.1 25.5 18.8Book NAV/share (INR) 85.6 100.4 116.4 137.9FDEPS (INR) 14.8 17.1 21.5 25.5CEPS (INR) 17.2 19.8 25.0 29.6CFPS (INR) 9.0 7.4 40.0 11.0DPS (INR) 1.8 2.1 2.8 3.4Return ratios Return on assets (%) 13.1 13.7 14.3 14.8Return on equity (%) 17.3 17.0 18.4 18.5Return on capital employed (%) 18.8 18.4 19.0 19.3Turnover ratios Asset turnover (x) 4.8 4.0 4.1 4.4Sales/Total assets (x) 2.5 2.6 2.6 2.6Sales/Net FA (x) 9.1 7.4 6.7 6.9Working capital/Sales (x) 0.1 0.1 0.1 0.1Working capital days 39.9 48.4 30.5 39.8Liquidity ratios Current ratio (x) 2.6 2.4 2.5 2.7Quick ratio (x) 1.7 1.7 1.7 2.0Interest cover (x) 705.0 859.3 1,052.8 1,254.7Dividend cover (x) 8.5 8.3 7.7 7.4Net debt/Equity (%) (19.6) (4.1) (21.6) (18.9)Valuation PER (x) 35.6 30.9 24.6 20.7Price/Book (x) 6.2 5.3 4.5 3.8Yield (%) 0.3 0.4 0.5 0.7EV/Net sales (x) 1.8 1.6 1.3 1.1EV/EBITDA (x) 24.2 20.4 15.3 12.9EV/EBIT (x) 27.2 22.9 17.2 14.4
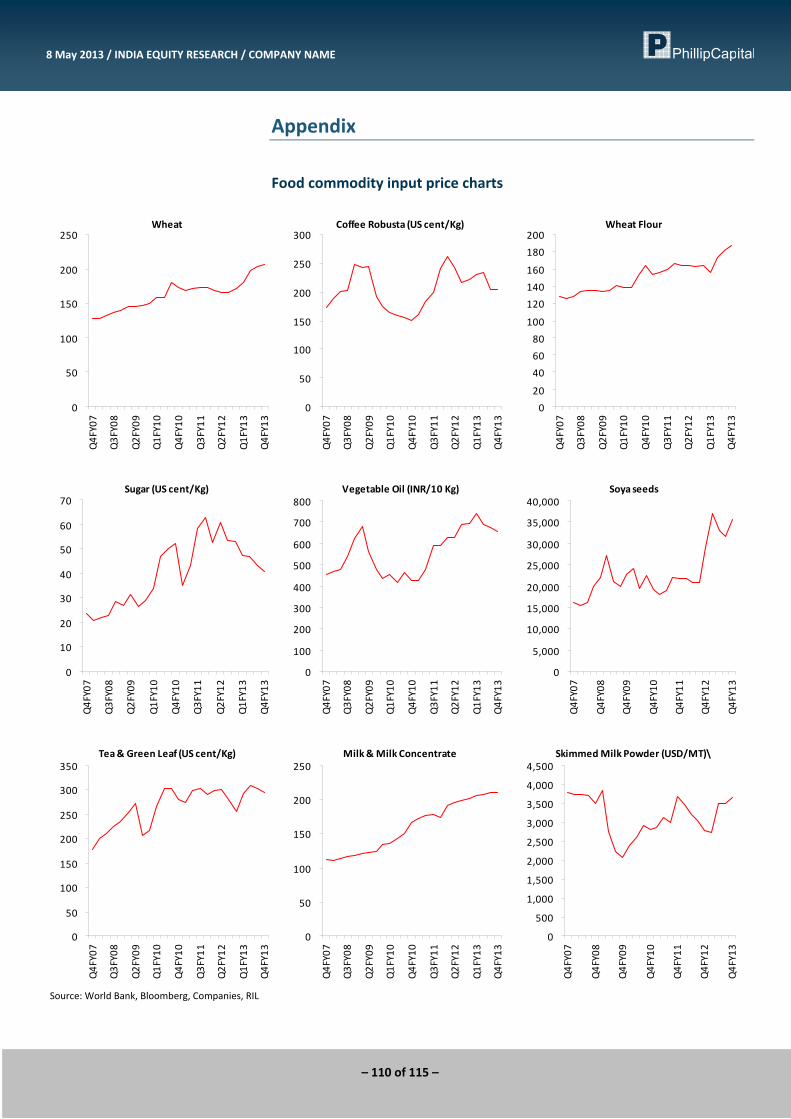
– 110 of 115 –
8 May 2013 / INDIA EQUITY RESEARCH / COMPANY NAME
Appendix Food commodity input price charts
Wheat
0
50
100
150
200
250
Q4FY07
Q3FY08
Q2FY09
Q1FY10
Q4FY10
Q3FY11
Q2FY12
Q1FY13
Q4FY13
Coffee Robusta (US cent/Kg)
0
50
100
150
200
250
300
Q4FY07
Q3FY08
Q2FY09
Q1FY10
Q4FY10
Q3FY11
Q2FY12
Q1FY13
Q4FY13
Wheat Flour
0
20
40
60
80
100
120
140
160
180
200
Q4FY07
Q3FY08
Q2FY09
Q1FY10
Q4FY10
Q3FY11
Q2FY12
Q1FY13
Q4FY13
Sugar (US cent/Kg)
0
10
20
30
40
50
60
70
Q4FY07
Q3FY08
Q2FY09
Q1FY10
Q4FY10
Q3FY11
Q2FY12
Q1FY13
Q4FY13
Vegetable Oil (INR/10 Kg)
0
100
200
300
400
500
600
700
800
Q4FY07
Q3FY08
Q2FY09
Q1FY10
Q4FY10
Q3FY11
Q2FY12
Q1FY13
Q4FY13
Soya seeds
0
5,000
10,000
15,000
20,000
25,000
30,000
35,000
40,000
Q4FY07
Q4FY08
Q4FY09
Q4FY10
Q4FY11
Q4FY12
Q4FY13
Tea & Green Leaf (US cent/Kg)
0
50
100
150
200
250
300
350
Q4FY07
Q3FY08
Q2FY09
Q1FY10
Q4FY10
Q3FY11
Q2FY12
Q1FY13
Q4FY13
Milk & Milk Concentrate
0
50
100
150
200
250
Q4FY07
Q3FY08
Q2FY09
Q1FY10
Q4FY10
Q3FY11
Q2FY12
Q1FY13
Q4FY13
Skimmed Milk Powder (USD/MT)\
0
500
1,000
1,500
2,000
2,500
3,000
3,500
4,000
4,500
Q4FY07
Q4FY08
Q4FY09
Q4FY10
Q4FY11
Q4FY12
Q4FY13
Source: World Bank, Bloomberg, Companies, RIL
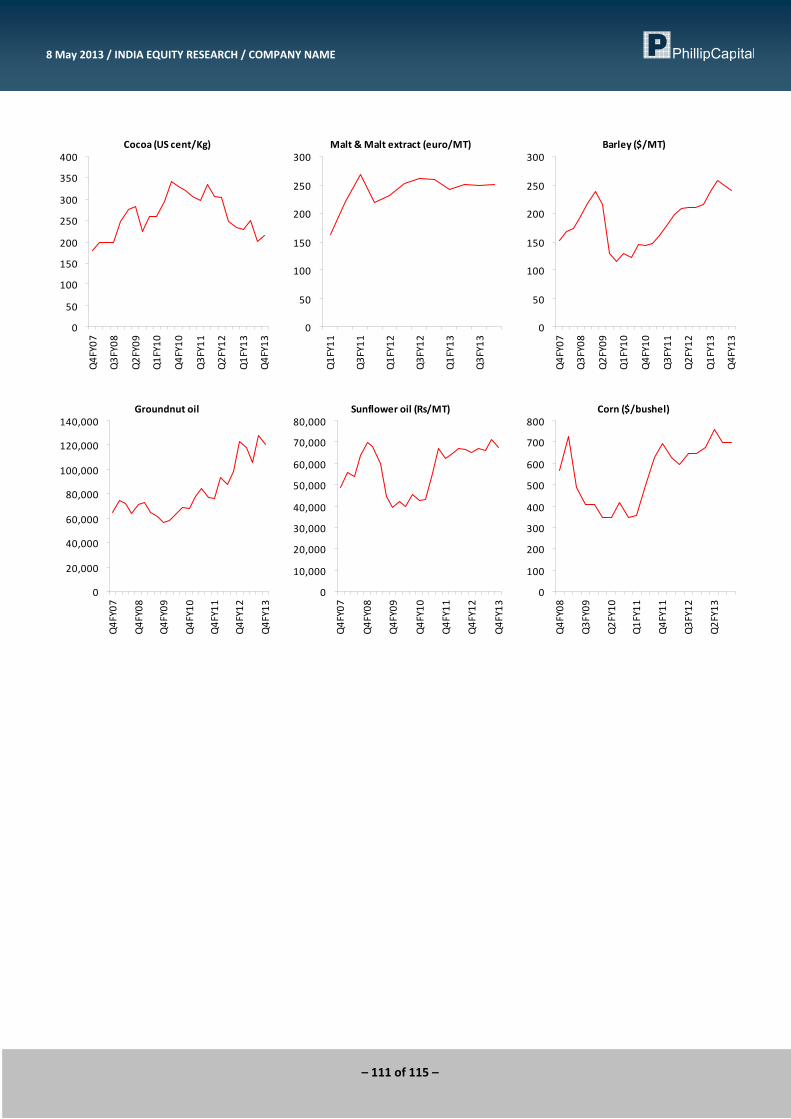
– 111 of 115 –
8 May 2013 / INDIA EQUITY RESEARCH / COMPANY NAME
Cocoa (US cent/Kg)
0
50
100
150
200
250
300
350
400
Q4FY07
Q3FY08
Q2FY09
Q1FY10
Q4FY10
Q3FY11
Q2FY12
Q1FY13
Q4FY13
Malt & Malt extract (euro/MT)
0
50
100
150
200
250
300
Q1FY11
Q3FY11
Q1FY12
Q3FY12
Q1FY13
Q3FY13
Barley ($/MT)
0
50
100
150
200
250
300
Q4FY07
Q3FY08
Q2FY09
Q1FY10
Q4FY10
Q3FY11
Q2FY12
Q1FY13
Q4FY13
Groundnut oil
0
20,000
40,000
60,000
80,000
100,000
120,000
140,000
Q4FY07
Q4FY08
Q4FY09
Q4FY10
Q4FY11
Q4FY12
Q4FY13
Sunflower oil (Rs/MT)
0
10,000
20,000
30,000
40,000
50,000
60,000
70,000
80,000
Q4FY07
Q4FY08
Q4FY09
Q4FY10
Q4FY11
Q4FY12
Q4FY13
Corn ($/bushel)
0
100
200
300
400
500
600
700
800
Q4FY08
Q3FY09
Q2FY10
Q1FY11
Q4FY11
Q3FY12
Q2FY13
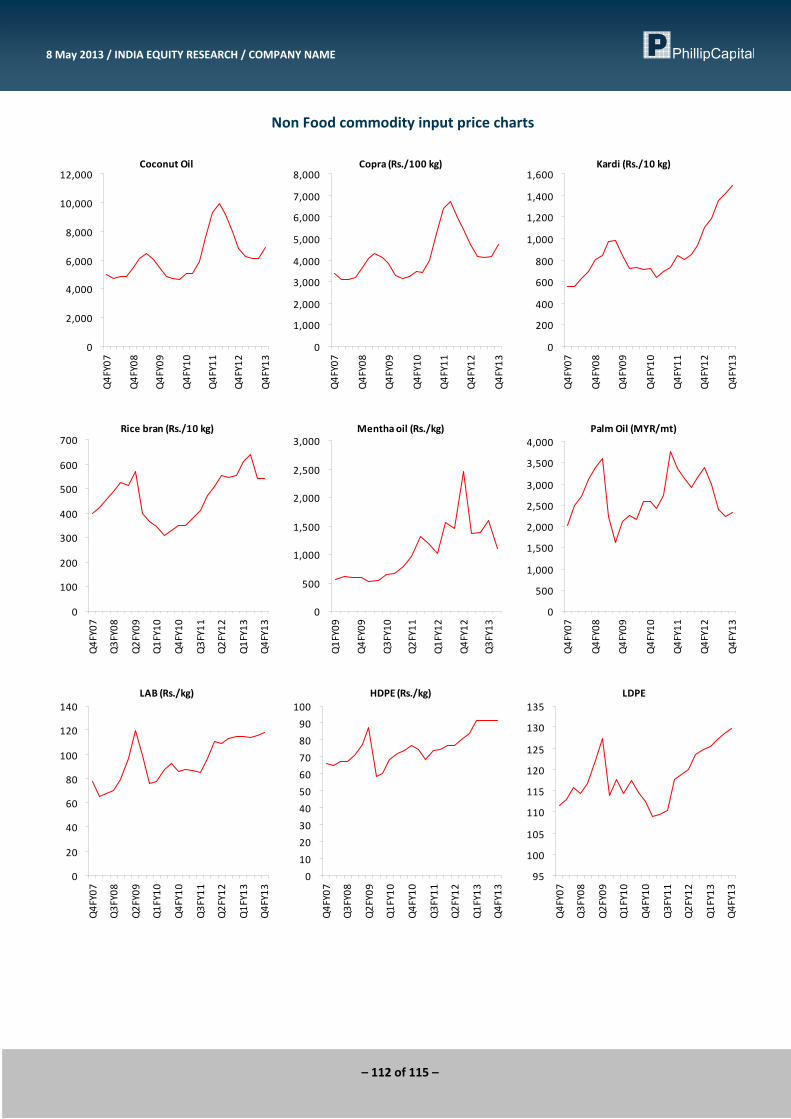
– 112 of 115 –
8 May 2013 / INDIA EQUITY RESEARCH / COMPANY NAME
Non Food commodity input price charts
Coconut Oil
0
2,000
4,000
6,000
8,000
10,000
12,000
Q4FY07
Q4FY08
Q4FY09
Q4FY10
Q4FY11
Q4FY12
Q4FY13
Copra (Rs./100 kg)
0
1,000
2,000
3,000
4,000
5,000
6,000
7,000
8,000
Q4FY07
Q4FY08
Q4FY09
Q4FY10
Q4FY11
Q4FY12
Q4FY13
Kardi (Rs./10 kg)
0
200
400
600
800
1,000
1,200
1,400
1,600
Q4FY07
Q4FY08
Q4FY09
Q4FY10
Q4FY11
Q4FY12
Q4FY13
Rice bran (Rs./10 kg)
0
100
200
300
400
500
600
700
Q4FY07
Q3FY08
Q2FY09
Q1FY10
Q4FY10
Q3FY11
Q2FY12
Q1FY13
Q4FY13
Mentha oil (Rs./kg)
0
500
1,000
1,500
2,000
2,500
3,000
Q1FY09
Q4FY09
Q3FY10
Q2FY11
Q1FY12
Q4FY12
Q3FY13
Palm Oil (MYR/mt)
0
500
1,000
1,500
2,000
2,500
3,000
3,500
4,000
Q4FY07
Q4FY08
Q4FY09
Q4FY10
Q4FY11
Q4FY12
Q4FY13
LAB (Rs./kg)
0
20
40
60
80
100
120
140
Q4FY07
Q3FY08
Q2FY09
Q1FY10
Q4FY10
Q3FY11
Q2FY12
Q1FY13
Q4FY13
HDPE (Rs./kg)
0
10
20
30
40
50
60
70
80
90
100
Q4FY07
Q3FY08
Q2FY09
Q1FY10
Q4FY10
Q3FY11
Q2FY12
Q1FY13
Q4FY13
LDPE
95
100
105
110
115
120
125
130
135
Q4FY07
Q3FY08
Q2FY09
Q1FY10
Q4FY10
Q3FY11
Q2FY12
Q1FY13
Q4FY13
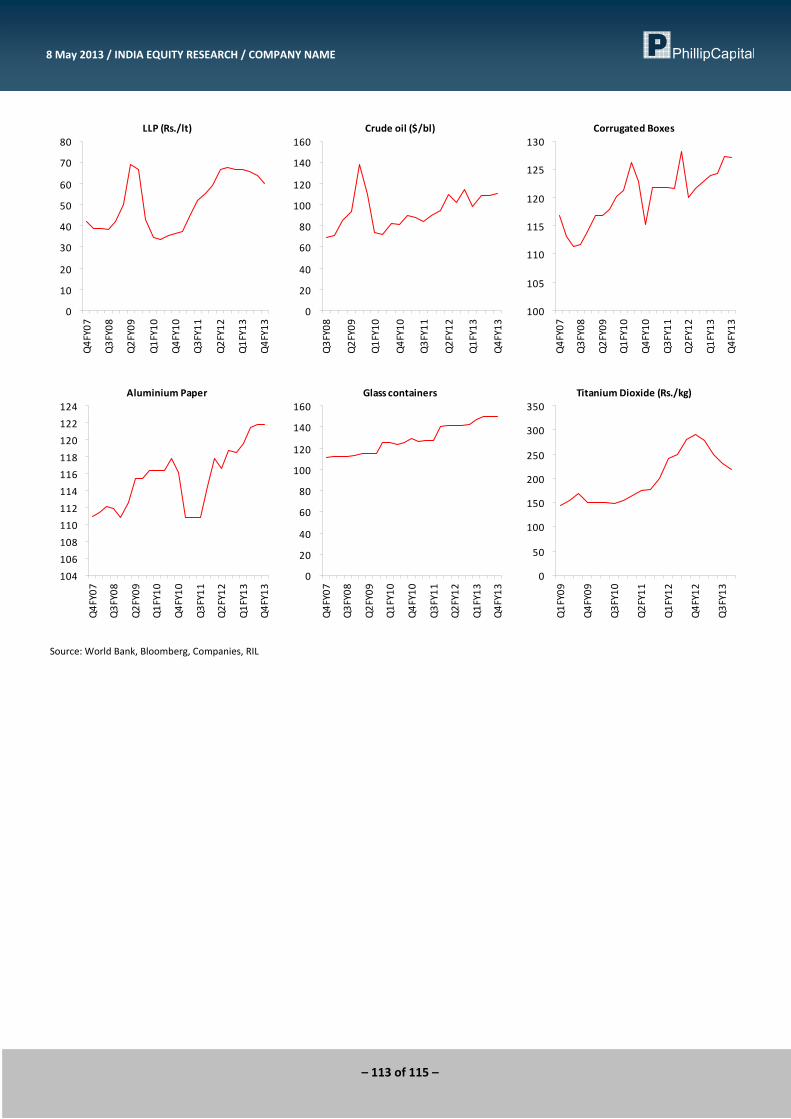
– 113 of 115 –
8 May 2013 / INDIA EQUITY RESEARCH / COMPANY NAME
LLP (Rs./lt)
0
10
20
30
40
50
60
70
80
Q4FY07
Q3FY08
Q2FY09
Q1FY10
Q4FY10
Q3FY11
Q2FY12
Q1FY13
Q4FY13
Crude oil ($/bl)
0
20
40
60
80
100
120
140
160
Q3FY08
Q2FY09
Q1FY10
Q4FY10
Q3FY11
Q2FY12
Q1FY13
Q4FY13
Corrugated Boxes
100
105
110
115
120
125
130
Q4FY07
Q3FY08
Q2FY09
Q1FY10
Q4FY10
Q3FY11
Q2FY12
Q1FY13
Q4FY13
Aluminium Paper
104
106
108
110
112
114
116
118
120
122
124
Q4FY07
Q3FY08
Q2FY09
Q1FY10
Q4FY10
Q3FY11
Q2FY12
Q1FY13
Q4FY13
Glass containers
0
20
40
60
80
100
120
140
160
Q4FY07
Q3FY08
Q2FY09
Q1FY10
Q4FY10
Q3FY11
Q2FY12
Q1FY13
Q4FY13
Titanium Dioxide (Rs./kg)
0
50
100
150
200
250
300
350
Q1FY09
Q4FY09
Q3FY10
Q2FY11
Q1FY12
Q4FY12
Q3FY13
Source: World Bank, Bloomberg, Companies, RIL
– 114 of 115 –
8 May 2013 / INDIA EQUITY RESEARCH / COMPANY NAME
Management Vineet Bhatnagar (Managing Director) (91 22) 2300 2999 Sajid Khalid (Head – Institutional Equities) (91 22) 6667 9972 Jignesh Shah (Head – Equity Derivatives) (91 22) 6667 9735
Research Automobiles, IT Services Deepak Jain (9122) 6667 9758 Neha Garg (9122) 6667 9996 Varun Vijayan (9122) 6667 9992 Banking, NBFCs Manish Agarwalla (9122) 6667 9962 Sachit Motwani, FRM (9122) 6667 9953 Consumer, Media, Telecom Naveen Kulkarni, CFA, FRM (9122) 6667 9947 Ennette Fernandes (9122) 6667 9764 Vivekanand Subbaraman (9122) 6667 9766 Cement Vaibhav Agarwal (9122) 6667 9967
Economics Anjali Verma (9122) 6667 9969 Engineering, Capital Goods Ankur Sharma (9122) 6667 9759 Jishar Thoombath (9122) 6667 9986 Metals Dhawal Doshi (9122) 6667 9769 Dharmesh Shah (9122) 6667 9974 Infrastructure Vibhor Singhal (9122) 6667 9949 Raheel Arathodi (9122) 6667 9768 Oil&Gas, Agri Inputs Gauri Anand (9122) 6667 9943 Saurabh Rathi (9122) 6667 9951
Retail, Real Estate Abhishek Ranganathan, CFA (9122) 6667 9952 Neha Garg (9122) 6667 9996 Mid‐caps Kapil Bagaria (9122) 6667 9965 Raheel Arathodi (9122) 6667 9768 Technicals & Quant Neppolian Pillai (9122) 6667 9989 Shikha Khurana (9122) 6667 9948 Sr. Manager – Equities Support Rosie Ferns (9122) 6667 9971
Sales & Distribution Kinshuk Tiwari (9122) 6667 9946 Pawan Kakumanu (9122) 6667 9934 Shubhangi Agrawal (9122) 6667 9964 Dipesh Sohani (9122) 6667 9756
Sunil Kamath (Sales Trader) (9122) 6667 9747 Rajesh Ashar (Sales Trader) (9122) 6667 9746
Mayur Shah (Execution) (9122) 6667 9945 Gurudatt Uchil (Execution) (9122) 6667 9750
Contact Information (Regional Member Companies)
SINGAPORE
Phillip Securities Pte Ltd 250 North Bridge Road, #06‐00 Raffles City Tower,
Singapore 179101 Tel : (65) 6533 6001 Fax: (65) 6535 3834
www.phillip.com.sg
MALAYSIA Phillip Capital Management Sdn Bhd B‐3‐6 Block B Level 3, Megan Avenue II,
No. 12, Jalan Yap Kwan Seng, 50450 Kuala Lumpur Tel (60) 3 2162 8841 Fax (60) 3 2166 5099
www.poems.com.my
HONG KONG Phillip Securities (HK) Ltd
11/F United Centre 95 Queensway Hong Kong Tel (852) 2277 6600 Fax: (852) 2868 5307
www.phillip.com.hk
JAPAN Phillip Securities Japan, Ltd
4‐2 Nihonbashi Kabutocho, Chuo‐ku Tokyo 103‐0026
Tel: (81) 3 3666 2101 Fax: (81) 3 3664 0141 www.phillip.co.jp
INDONESIA PT Phillip Securities Indonesia
ANZ Tower Level 23B, Jl Jend Sudirman Kav 33A, Jakarta 10220, Indonesia
Tel (62) 21 5790 0800 Fax: (62) 21 5790 0809 www.phillip.co.id
CHINA Phillip Financial Advisory (Shanghai) Co. Ltd.
No 550 Yan An East Road, Ocean Tower Unit 2318 Shanghai 200 001
Tel (86) 21 5169 9200 Fax: (86) 21 6351 2940 www.phillip.com.cn
THAILAND Phillip Securities (Thailand) Public Co. Ltd.
15th Floor, Vorawat Building, 849 Silom Road, Silom, Bangrak, Bangkok 10500 Thailand
Tel (66) 2 2268 0999 Fax: (66) 2 2268 0921 www.phillip.co.th
FRANCE King & Shaxson Capital Ltd.
3rd Floor, 35 Rue de la Bienfaisance 75008 Paris France
Tel (33) 1 4563 3100 Fax : (33) 1 4563 6017 www.kingandshaxson.com
UNITED KINGDOM King & Shaxson Ltd.
6th Floor, Candlewick House, 120 Cannon Street London, EC4N 6AS
Tel (44) 20 7929 5300 Fax: (44) 20 7283 6835 www.kingandshaxson.com
UNITED STATES Phillip Futures Inc.
141 W Jackson Blvd Ste 3050 The Chicago Board of Trade Building
Chicago, IL 60604 USA Tel (1) 312 356 9000 Fax: (1) 312 356 9005
AUSTRALIA PhillipCapital Australia
Level 37, 530 Collins Street Melbourne, Victoria 3000, Australia
Tel: (61) 3 9629 8380 Fax: (61) 3 9614 8309 www.phillipcapital.com.au
SRI LANKA Asha Phillip Securities Limited
Level 4, Millennium House, 46/58 Navam Mawatha, Colombo 2, Sri Lanka
Tel: (94) 11 2429 100 Fax: (94) 11 2429 199 www.ashaphillip.net/home.htm
INDIA PhillipCapital (India) Private Limited
No. 1, C‐Block, 2nd Floor, Modern Center , Jacob Circle, K. K. Marg, Mahalaxmi Mumbai 400011 Tel: (9122) 2300 2999 Fax: (9122) 6667 9955 www.phillipcapital.in
– 115 of 115 –
8 May 2013 / INDIA EQUITY RESEARCH / COMPANY NAME
Disclosures and Disclaimers PhillipCapital (India) Pvt. Ltd. has three independent equity research groups: Institutional Equities, Institutional Equity Derivatives and Private Client Group. This report has been prepared by Institutional Equities Group. The views and opinions expressed in this document may or may not match or may be contrary at times with the views, estimates, rating, target price of the other equity research groups of PhillipCapital (India) Pvt. Ltd. This report is issued by PhillipCapital (India) Pvt. Ltd. which is regulated by SEBI. PhillipCapital (India) Pvt. Ltd. is a subsidiary of Phillip (Mauritius) Pvt. Ltd. References to "PCIPL" in this report shall mean PhillipCapital (India) Pvt. Ltd unless otherwise stated. This report is prepared and distributed by PCIPL for information purposes only and neither the information contained herein nor any opinion expressed should be construed or deemed to be construed as solicitation or as offering advice for the purposes of the purchase or sale of any security, investment or derivatives. The information and opinions contained in the Report were considered by PCIPL to be valid when published. The report also contains information provided to PCIPL by third parties. The source of such information will usually be disclosed in the report. Whilst PCIPL has taken all reasonable steps to ensure that this information is correct, PCIPL does not offer any warranty as to the accuracy or completeness of such information. Any person placing reliance on the report to undertake trading does so entirely at his or her own risk and PCIPL does not accept any liability as a result. Securities and Derivatives markets may be subject to rapid and unexpected price movements and past performance is not necessarily an indication to future performance. This report does not have regard to the specific investment objectives, financial situation and the particular needs of any specific person who may receive this report. Investors must undertake independent analysis with their own legal, tax and financial advisors and reach their own regarding the appropriateness of investing in any securities or investment strategies discussed or recommended in this report and should understand that statements regarding future prospects may not be realized. In no circumstances it be used or considered as an offer to sell or a solicitation of any offer to buy or sell the Securities mentioned in it. The information contained in the research reports may have been taken from trade and statistical services and other sources, which we believe are reliable. PhillipCapital (India) Pvt. Ltd. or any of its group/associate/affiliate companies do not guarantee that such information is accurate or complete and it should not be relied upon as such. Any opinions expressed reflect judgments at this date and are subject to change without notice Important: These disclosures and disclaimers must be read in conjunction with the research report of which it forms part. Receipt and use of the research report is subject to all aspects of these disclosures and disclaimers. Additional information about the issuers and securities discussed in this research report is available on request. Certifications: The research analyst(s) who prepared this research report hereby certifies that the views expressed in this research report accurately reflect the research analyst’s personal views about all of the subject issuers and/or securities, that the analyst have no known conflict of interest and no part of the research analyst’s compensation was, is or will be, directly or indirectly, related to the specific views or recommendations contained in this research report. The Research Analyst certifies that he /she or his / her family members does not own the stock(s) covered in this research report. Independence: PhillipCapital (India) Pvt. Ltd. has not had an investment banking relationship with, and has not received any compensation for investment banking services from, the subject issuers in the past twelve (12) months, and PhillipCapital (India) Pvt. Ltd does not anticipate receiving or intend to seek compensation for investment banking services from the subject issuers in the next three (3) months. PhillipCapital (India) Pvt. Ltd is not a market maker in the securities mentioned in this research report, although it or its affiliates may hold either long or short positions in such securities. PhillipCapital (India) Pvt. Ltd does not hold more than 1% of the shares of the company(ies) covered in this report. Suitability and Risks: This research report is for informational purposes only and is not tailored to the specific investment objectives, financial situation or particular requirements of any individual recipient hereof. Certain securities may give rise to substantial risks and may not be suitable for certain investors. Each investor must make its own determination as to the appropriateness of any securities referred to in this research report based upon the legal, tax and accounting considerations applicable to such investor and its own investment objectives or strategy, its financial situation and its investing experience. The value of any security may be positively or adversely affected by changes in foreign exchange or interest rates, as well as by other financial, economic or political factors. Past performance is not necessarily indicative of future performance or results. Sources, Completeness and Accuracy: The material herein is based upon information obtained from sources that PCIPL and the research analyst believe to be reliable, but neither PCIPL nor the research analyst represents or guarantees that the information contained herein is accurate or complete and it should not be relied upon as such. Opinions expressed herein are current opinions as of the date appearing on this material and are subject to change without notice.Furthermore, PCIPL is under no obligation to update or keep the information current. Copyright: The copyright in this research report belongs exclusively to PCIPL. All rights are reserved. Any unauthorized use or disclosure is prohibited. No reprinting or reproduction, in whole or in part, is permitted without the PCIPL’s prior consent, except that a recipient may reprint it for internal circulation only and only if it is reprinted in its entirety. Caution: Risk of loss in trading in can be substantial. You should carefully consider whether trading is appropriate for you in light of your experience, objectives, financial resources and other relevant circumstances. PhillipCapital (India) Pvt. Ltd. 2nd Floor, C‐Block, Modern Centre, Mahalaxmi, Mumbai ‐ 400011