Embed Size (px)
Citation preview
Alan Stein & Suzan HeatlyOphir Energy Company Limited
Independents in Deepwater Africa
APPEX ConferenceLondon, 20 – 22 March 2007
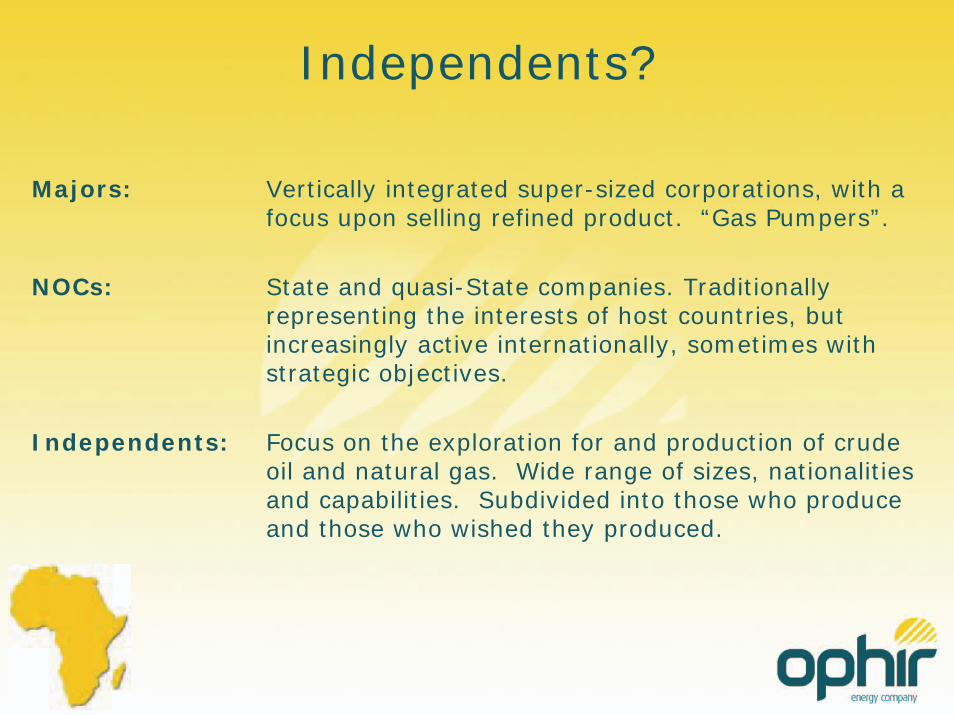
Independents?
Majors: Vertically integrated super-sized corporations, with a focus upon selling refined product. “Gas Pumpers”.
NOCs: State and quasi-State companies. Traditionally representing the interests of host countries, but increasingly active internationally, sometimes with strategic objectives.
Independents: Focus on the exploration for and production of crude oil and natural gas. Wide range of sizes, nationalities and capabilities. Subdivided into those who produce and those who wished they produced.
Why Africa?
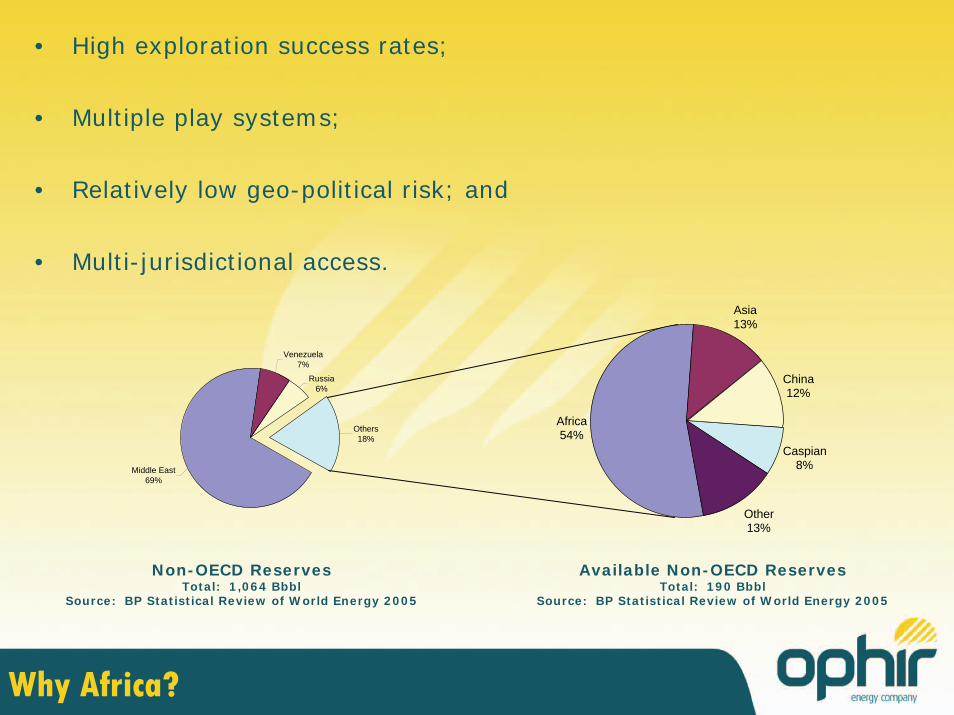
• High exploration success rates;
• Multiple play systems;
• Relatively low geo-political risk; and
• Multi-jurisdictional access.
Why Africa?
Non-OECD ReservesTotal: 1,064 Bbbl
Source: BP Statistical Review of World Energy 2005
Available Non-OECD ReservesTotal: 190 Bbbl
Source: BP Statistical Review of World Energy 2005
Venezuela7%
Russia6%
Middle East69%
Others18%
Africa54%
Asia13%
China12%
Caspian8%
Other13%
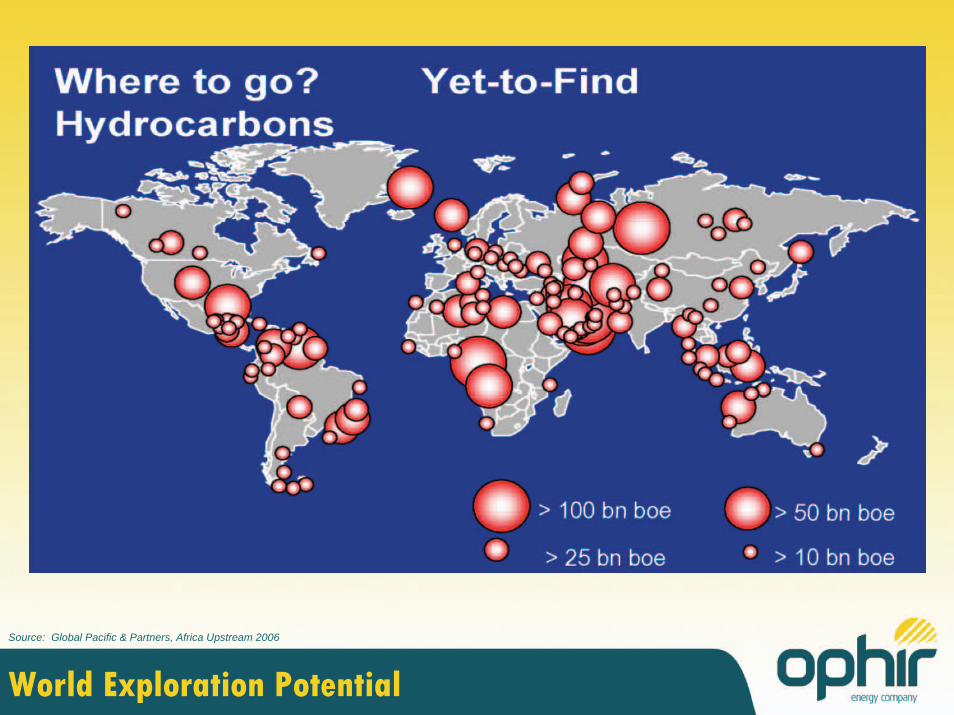
World Exploration Potential
Source: Global Pacific & Partners, Africa Upstream 2006
Why Deepwater Africa?
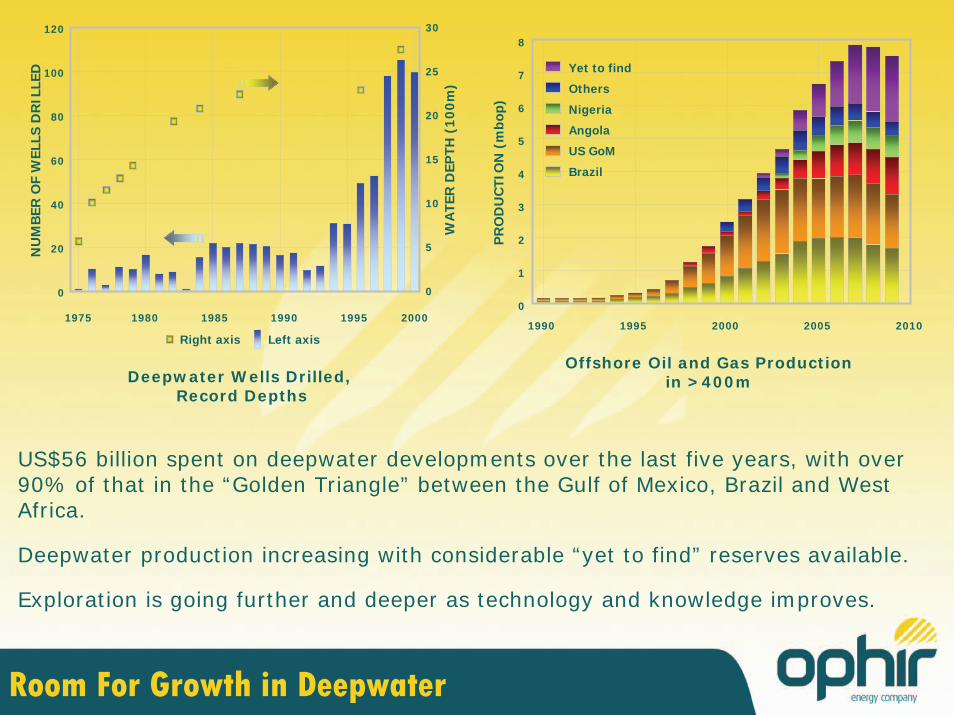
US$56 billion spent on deepwater developments over the last five years, with over 90% of that in the “Golden Triangle” between the Gulf of Mexico, Brazil and West Africa.
Deepwater production increasing with considerable “yet to find” reserves available.
Exploration is going further and deeper as technology and knowledge improves.
NU
MB
ER O
F W
ELLS
DR
ILLE
D
1975 200019851980 19951990
WA
TER
DEP
TH (
100m
)
Right axis Left axis
120
20
100
80
60
40
0
30
5
25
20
15
10
0
PR
OD
UC
TIO
N (
mbo
p)
Deepwater Wells Drilled, Record Depths
Offshore Oil and Gas Productionin >400m
2010200019951990 2005
Yet to find
Others
Nigeria
Angola
US GoM
Brazil
8
7
1
6
5
4
3
2
0
Room For Growth in Deepwater
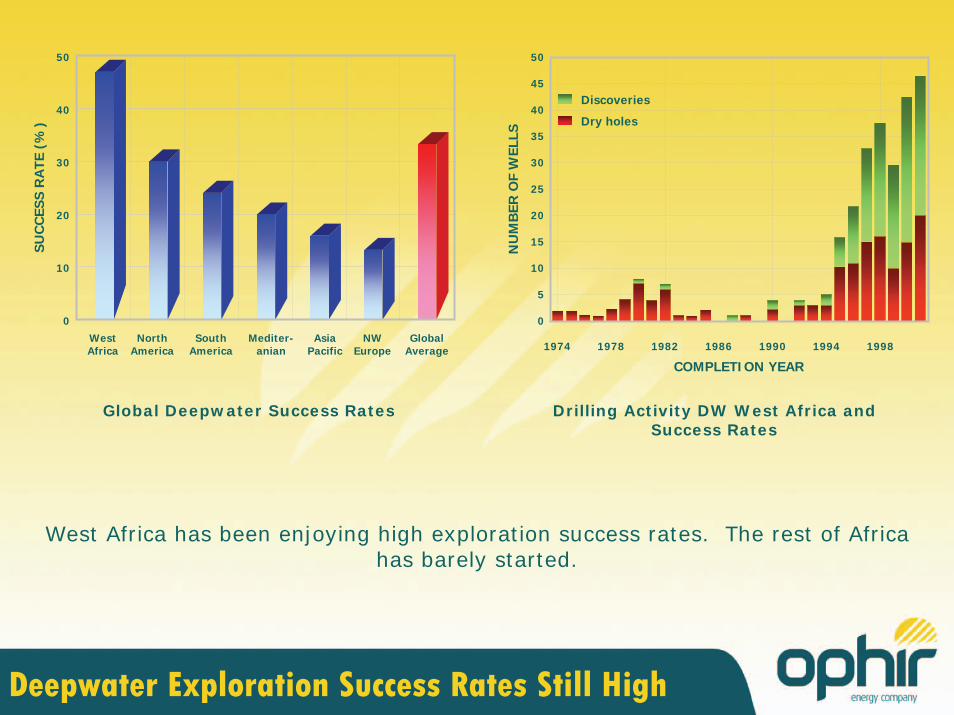
Deepwater Exploration Success Rates Still High
West Africa has been enjoying high exploration success rates. The rest of Africa has barely started.
Global Deepwater Success Rates Drilling Activity DW West Africa andSuccess Rates
NU
MB
ER O
F W
ELLS
1982 1990 19981994198619781974
COMPLETION YEAR
Discoveries
Dry holes
50
45
15
40
35
30
25
20
0
10
5
WestAfrica
SUC
CES
S R
ATE
(%
)
Global Average
SouthAmerica
NorthAmerica
AsiaPacific
Mediter-anian
NWEurope
50
40
30
20
10
0
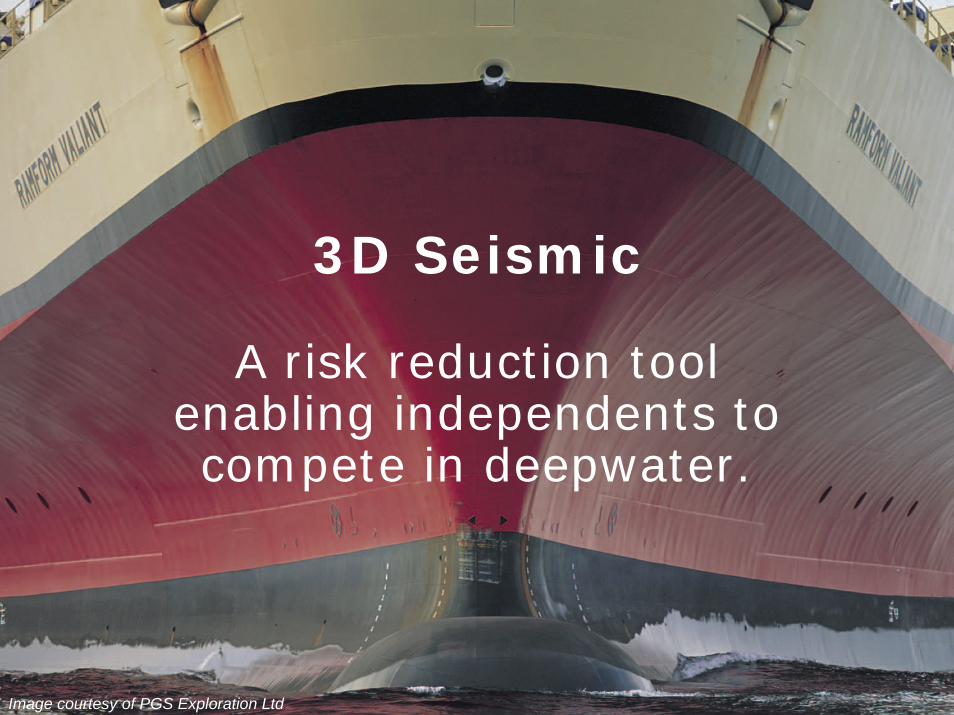
3D Seismic
A risk reduction toolenabling independents to compete in deepwater.
Image courtesy of PGS Exploration Ltd
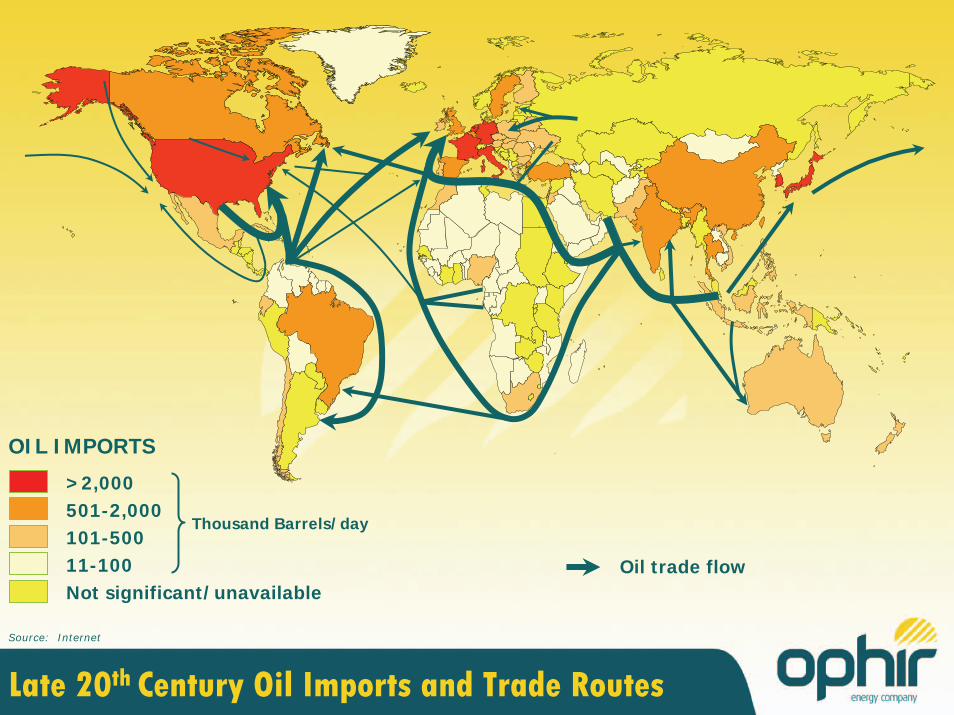
Source: Internet
Thousand Barrels/day
>2,000501-2,000101-50011-100Not significant/unavailable
OIL IMPORTS
Oil trade flow
Late 20th Century Oil Imports and Trade Routes
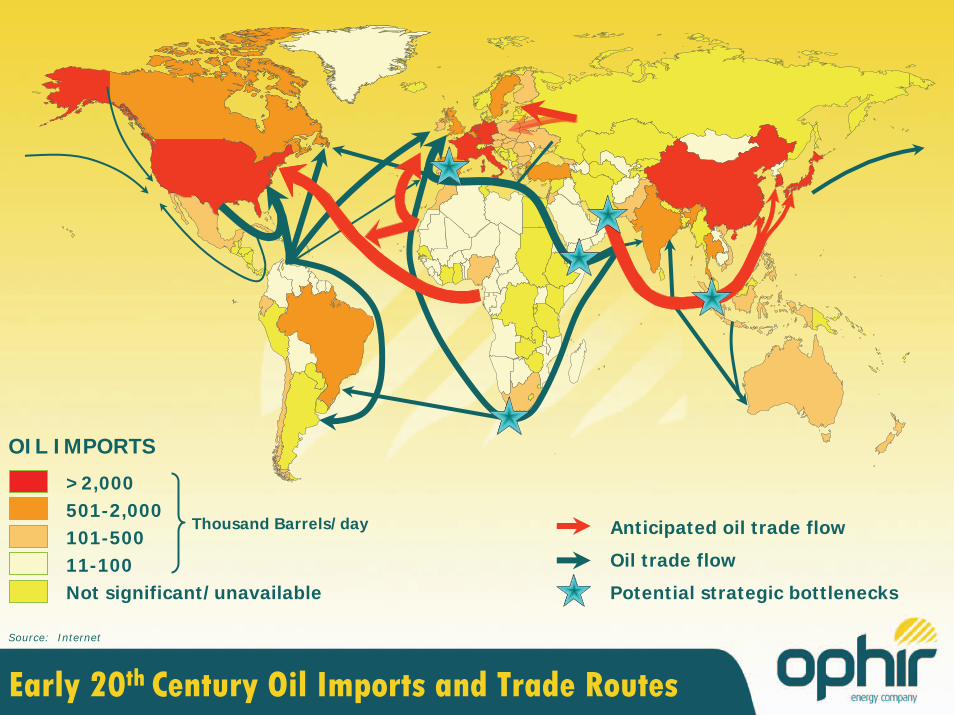
Potential strategic bottlenecks
Oil trade flow
Anticipated oil trade flow
Early 20th Century Oil Imports and Trade Routes
Source: Internet
Thousand Barrels/day
>2,000501-2,000101-50011-100Not significant/unavailable
OIL IMPORTS
The role of Independents
Leaders or Followers?
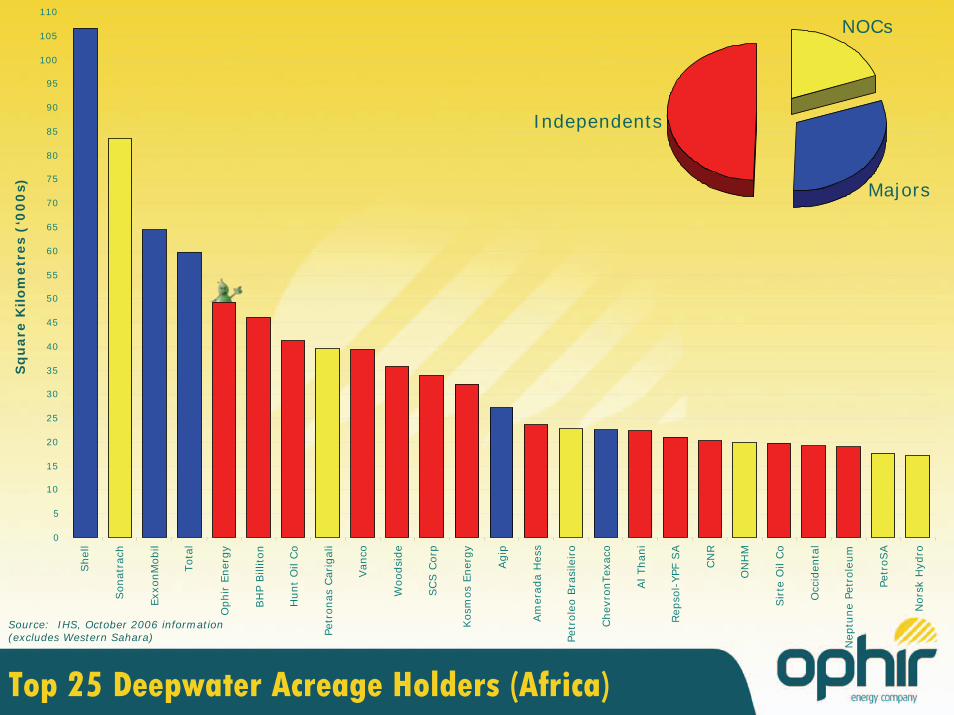
Top 25 Deepwater Acreage Holders (Africa)
Source: IHS, October 2006 information(excludes Western Sahara)
Sq
uare
Kilo
metr
es
(‘0
00
s)
Shel
l
Sonat
rach
Exx
onM
obil
Tota
l
Ophir
Ener
gy
BH
P B
illiton
Hunt
Oil
Co
Petr
onas
Car
igal
i
Van
co
Woodsi
de
SC
S C
orp
Kosm
os
Ener
gy
Agip
Am
erad
a H
ess
Petr
ole
o B
rasi
leiro
Chev
ronTex
aco
Al Than
i
Rep
sol-
YPF
SA
CN
R
ON
HM
Sirte
Oil
Co
Occ
iden
tal
Nep
tune
Petr
ole
um
Petr
oSA
Nors
k H
ydro
0
5
10
15
20
25
30
35
40
45
50
55
60
65
70
75
80
85
90
95
100
105
110
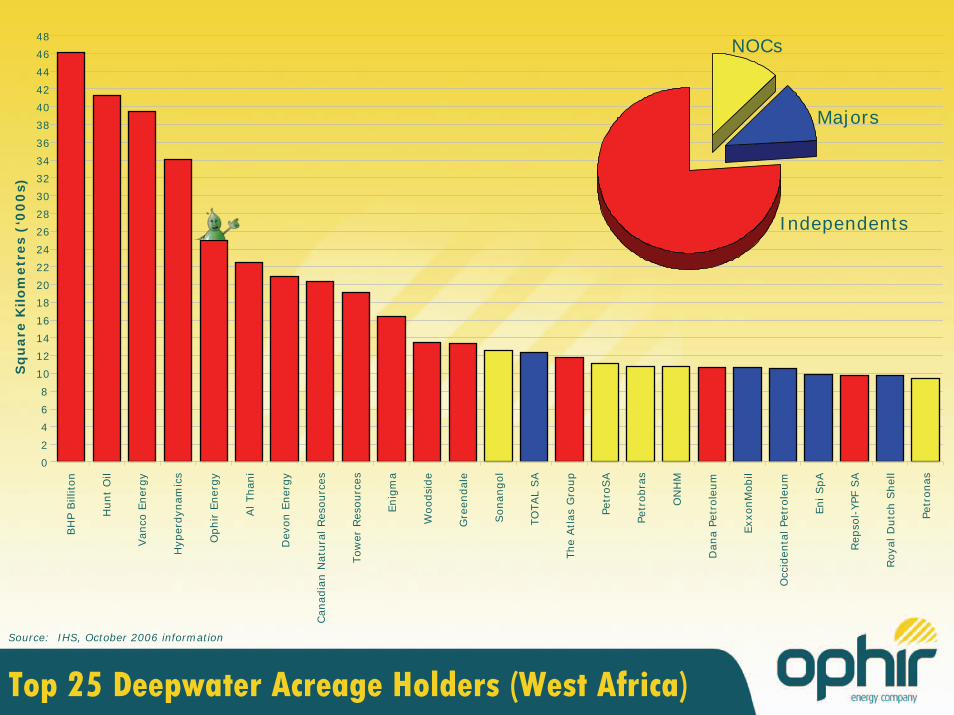
NOCs
Majors
Independents
0
2
4
6
8
10
12
14
16
18
20
22
24
26
28
30
32
34
36
38
40
42
44
46
48
BH
P B
illiton
Hunt
Oil
Van
co E
ner
gy
Hyp
erdyn
amic
s
Ophir
Ener
gy
Al Than
i
Dev
on E
ner
gy
Can
adia
n N
atura
l Res
ourc
es
Tow
er R
esourc
es
Enig
ma
Woodsi
de
Gre
endal
e
Sonangol
TO
TAL
SA
The
Atlas
Gro
up
Petr
oSA
Petr
obra
s
ON
HM
Dan
a Pe
trole
um
Exx
onM
obil
Occ
iden
tal Pe
trole
um
Eni SpA
Rep
sol-
YPF
SA
Roya
l D
utc
h S
hel
l
Petr
onas
Sq
uare
Kilo
metr
es
(‘0
00
s)
Top 25 Deepwater Acreage Holders (West Africa)Source: IHS, October 2006 information
NOCs
Majors
Independents
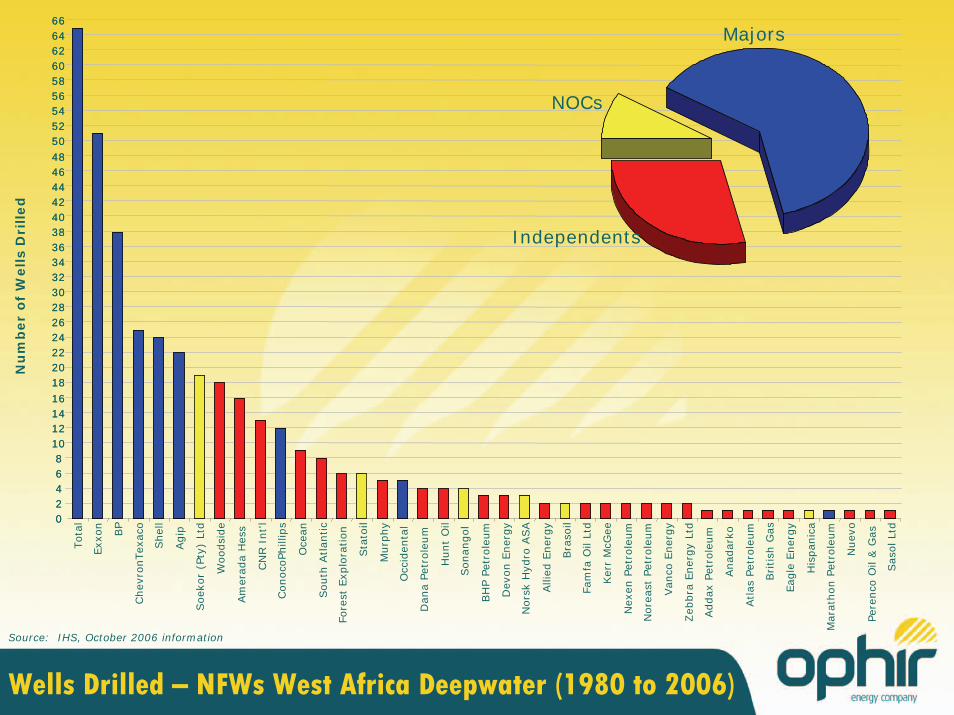
Wells Drilled – NFWs West Africa Deepwater (1980 to 2006)
Source: IHS, October 2006 information
02468
1012141618202224262830323436384042444648505254565860626466
Ker
r M
cGee
02468
1012141618202224262830323436384042444648505254565860626466
Tota
l
Exx
on
BP
Chev
ronTex
aco
Shel
l
Agip
Soek
or
(Pty
) Lt
d
Woodsi
de
Am
erad
a H
ess
CN
R I
nt'l
Conoco
Phill
ips
Oce
an
South
Atlantic
Fore
st E
xplo
ration
Sta
toil
Murp
hy
Occ
iden
tal
Dan
a Pe
trole
um
Hunt
Oil
Sonangol
BH
P P
etro
leum
Dev
on E
ner
gy
Nors
k H
ydro
ASA
Alli
ed E
ner
gy
Bra
soil
Fam
fa O
il Lt
d
Nex
en P
etro
leum
Nore
ast
Petr
ole
um
Van
co E
ner
gy
Zeb
bra
Ener
gy
Ltd
Addax
Pet
role
um
Anad
arko
Atlas
Pet
role
um
British
Gas
Eag
le E
ner
gy
His
pan
ica
Mar
athon P
etro
leum
Nuev
o
Pere
nco
Oil
& G
as
Sas
ol Lt
d
NOCs
Majors
Independents
Nu
mb
er
of
Wells
Dri
lled
0
2
4
6
8
10
12
14
16
18
20
22
24
26
28
30
32
34
36
38
40
1980
1981
1982
1983
1984
1985
1986
1987
1988
1989
1990
1991
1992
1993
1994
1995
1996
1997
1998
1999
2000
2001
2002
2003
2004
2005
2006
Nu
mb
er
of
Wells
Dri
lled
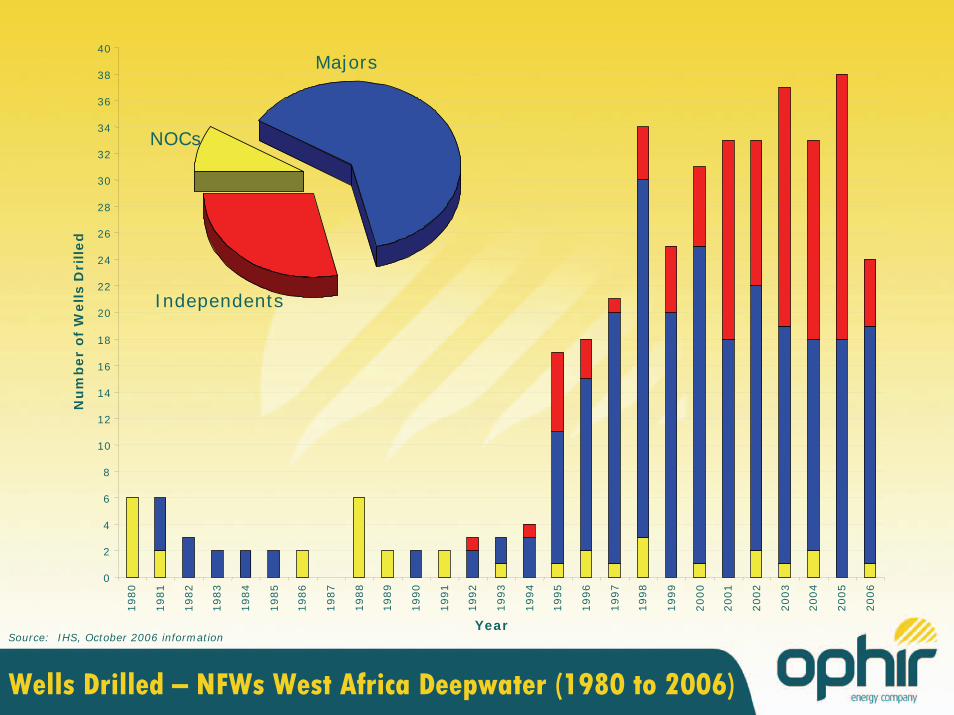
YearSource: IHS, October 2006 information
NOCs
Majors
Independents
Wells Drilled – NFWs West Africa Deepwater (1980 to 2006)
0
20,000,00040,000,00060,000,00080,000,000
100,000,000120,000,000140,000,000160,000,000180,000,000200,000,000220,000,000240,000,000260,000,000280,000,000300,000,000320,000,000340,000,000360,000,000380,000,000400,000,000420,000,000440,000,000460,000,000480,000,000500,000,000520,000,000540,000,000560,000,000
Exx
onM
obil
TO
TAL
SA
BP p
lc
Dev
on E
ner
gy
Eni SpA
Chev
ron
Sta
toil
Hes
s
Nors
k H
ydro
SN
PC
GEPe
trol
Sonangol
Roya
l D
utc
h S
hel
l
Tullo
w
Woodsi
de
Gove
rnm
ent
of
Port
ugal
Cort
icei
ra A
morim
GALP
Har
dm
an
Soc
Mauri
tanie
nne
des
Hyd
roca
rbure
s
BG
Gro
up
Pre
mie
r O
il
Gru
po I
ber
dro
la
Roc
Oil
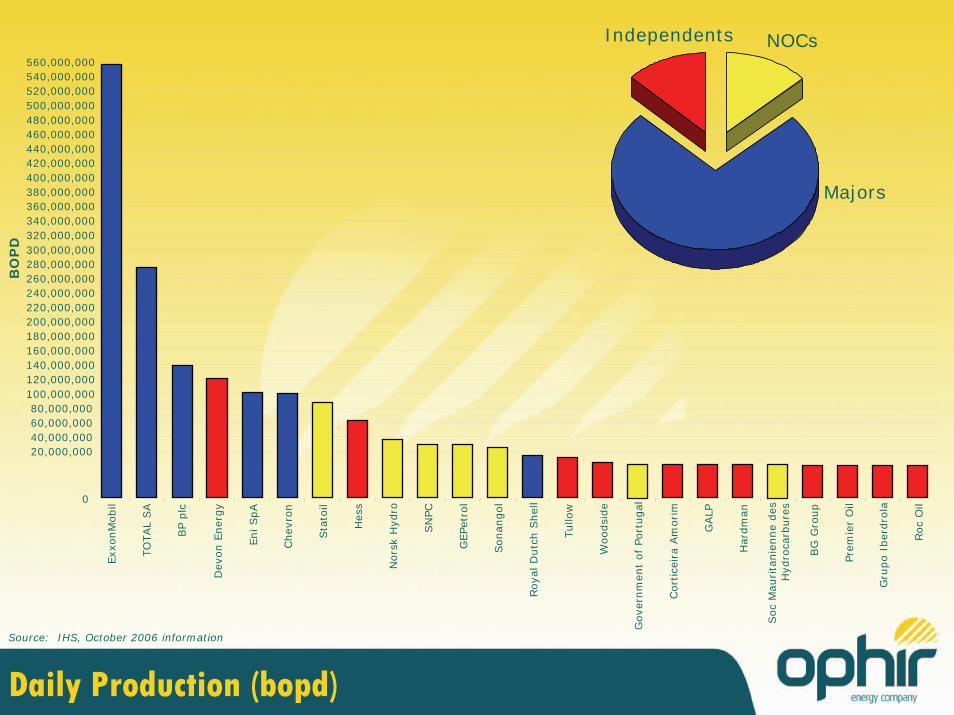
Daily Production (bopd)
NOCs
Majors
Independents
Source: IHS, October 2006 information
BO
PD
Where have all the
explorers gone?
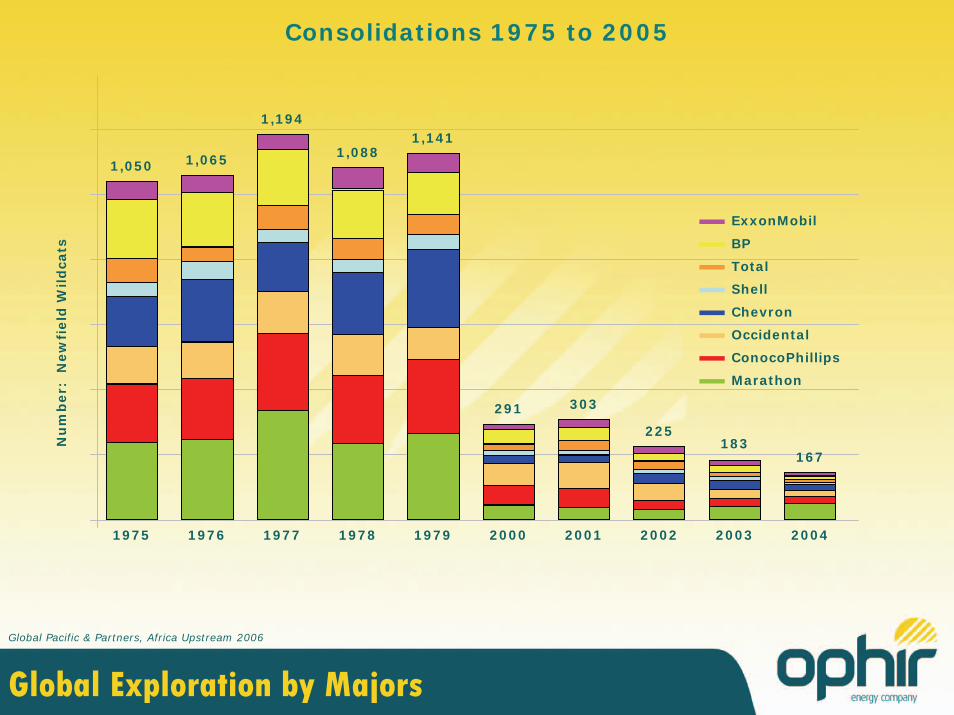
Global Exploration by Majors
Consolidations 1975 to 2005
ExxonMobil
BP
Total
Shell
Chevron
Occidental
ConocoPhillips
Marathon
1975 1976 1977 1978 1979
1,050 1,065
1,194
1,0881,141
Nu
mb
er:
N
ew
field
Wild
cats
Global Pacific & Partners, Africa Upstream 2006
2000
291
2001
303
2002
225
2003
183
2004
167
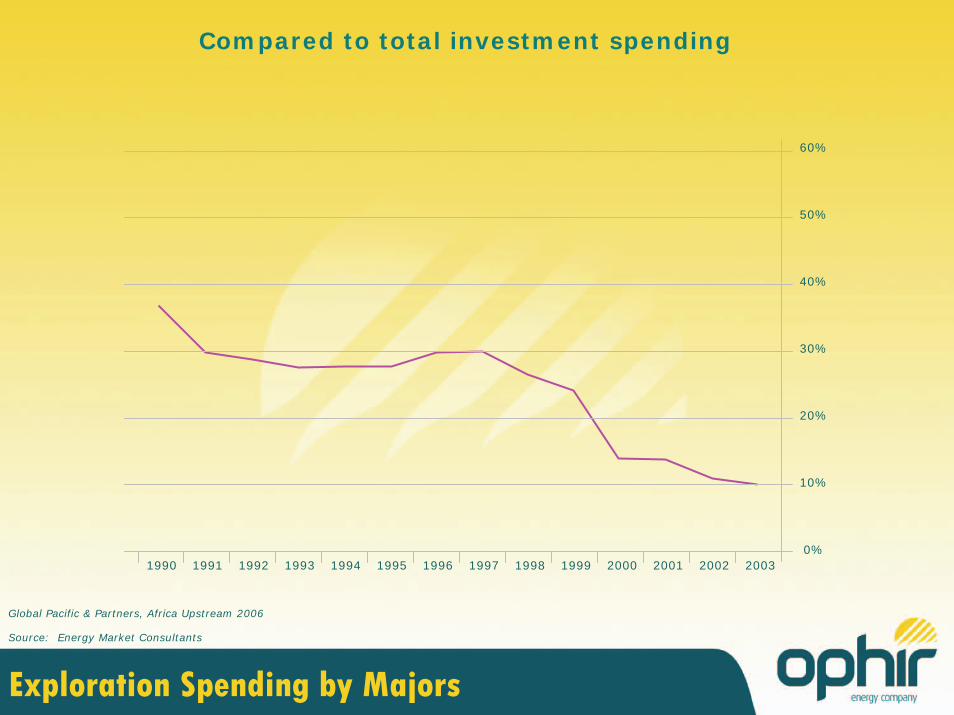
Exploration Spending by Majors
1990 1991 1992 1993 1994 1995 1996 1997 1998 1999 2000 2001 2002 2003
60%
50%
40%
30%
20%
10%
0%
Compared to total investment spending
Source: Energy Market Consultants
Global Pacific & Partners, Africa Upstream 2006
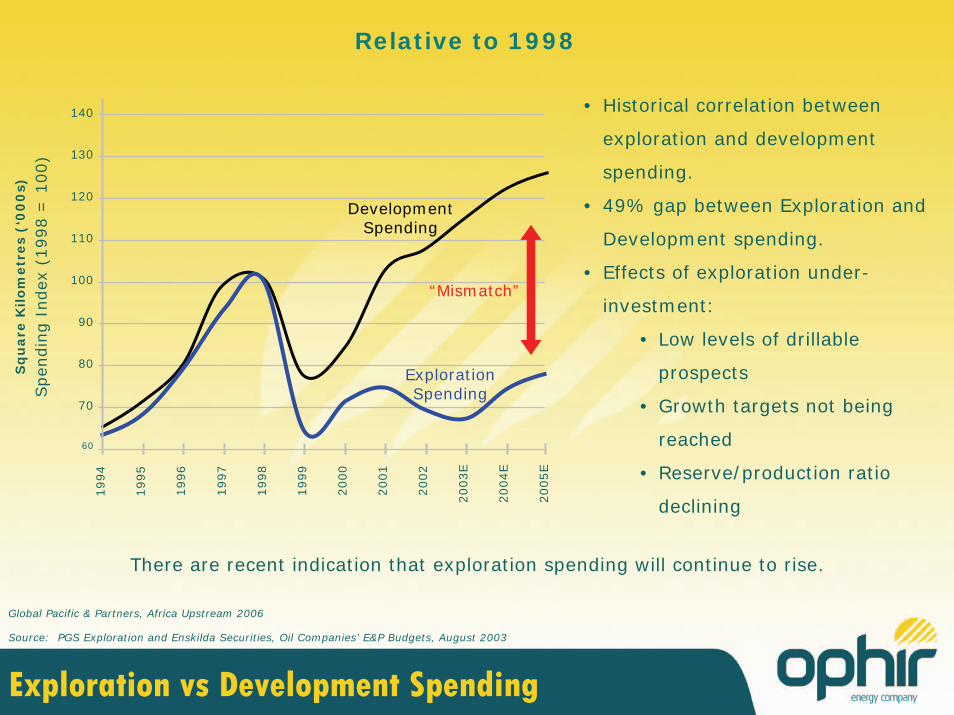
Exploration vs Development SpendingSource: PGS Exploration and Enskilda Securities, Oil Companies’ E&P Budgets, August 2003
1994
1995
1996
1997
1998
1999
2000
2001
2002
2003E
2004E
2005E
140
130
120
100
80
70
60
110
90
Development Spending
Exploration Spending
“Mismatch”
Spen
din
g I
ndex
(1998 =
100)
• Historical correlation between
exploration and development
spending.
• 49% gap between Exploration and
Development spending.
• Effects of exploration under-
investment:
• Low levels of drillable
prospects
• Growth targets not being
reached
• Reserve/production ratio
declining
Sq
uare
Kilo
metr
es
(‘0
00
s)
There are recent indication that exploration spending will continue to rise.
Relative to 1998
Global Pacific & Partners, Africa Upstream 2006
Oil price is up
Investors are back
but……………
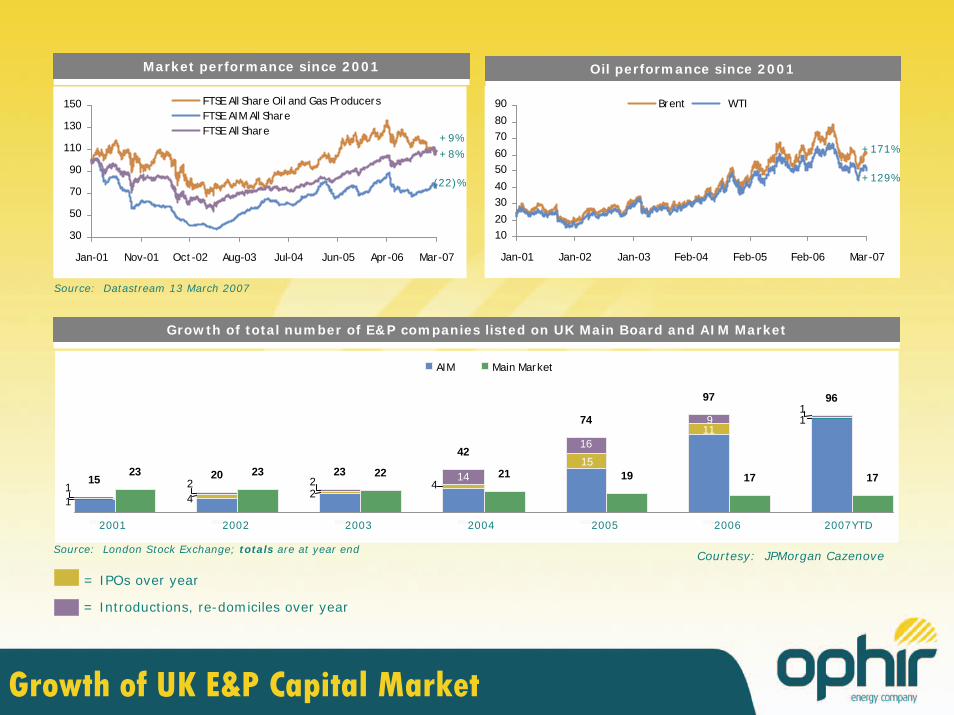
Growth of UK E&P Capital Market
Source: Datastream 13 March 2007
Market performance since 2001Market performance since 2001
1523 20 23 23 22
42
21
74
19
97
17
96
17
111
15
421
4
9
16
1
1422
1
2001 2002 2003 2004 2005 2006 2007YT D
AIM Main Market
Growth of total number of E&P companies listed on UK Main Board and AIM MarketGrowth of total number of E&P companies listed on UK Main Board and AIM Market
Source: London Stock Exchange; totals are at year end
30
50
70
90
110
130
150
Jan-01 Nov-01 Oct-02 Aug-03 Jul-04 Jun-05 Apr-06 Mar-07
FTSE All Share Oil and Gas Producers FTSE AIM All Share FTSE All Share
1020
3040
5060
7080
90
Jan-01 Jan-02 Jan-03 Feb-04 Feb-05 Feb-06 Mar-07
Brent WTI
Oil performance since 2001Oil performance since 2001
+8%
+9%
(22)%
+171%
+129%
2001 2002 2003 2004 2005 2006 2007YTD
= IPOs over year
= Introductions, re-domiciles over year
Courtesy: JPMorgan Cazenove
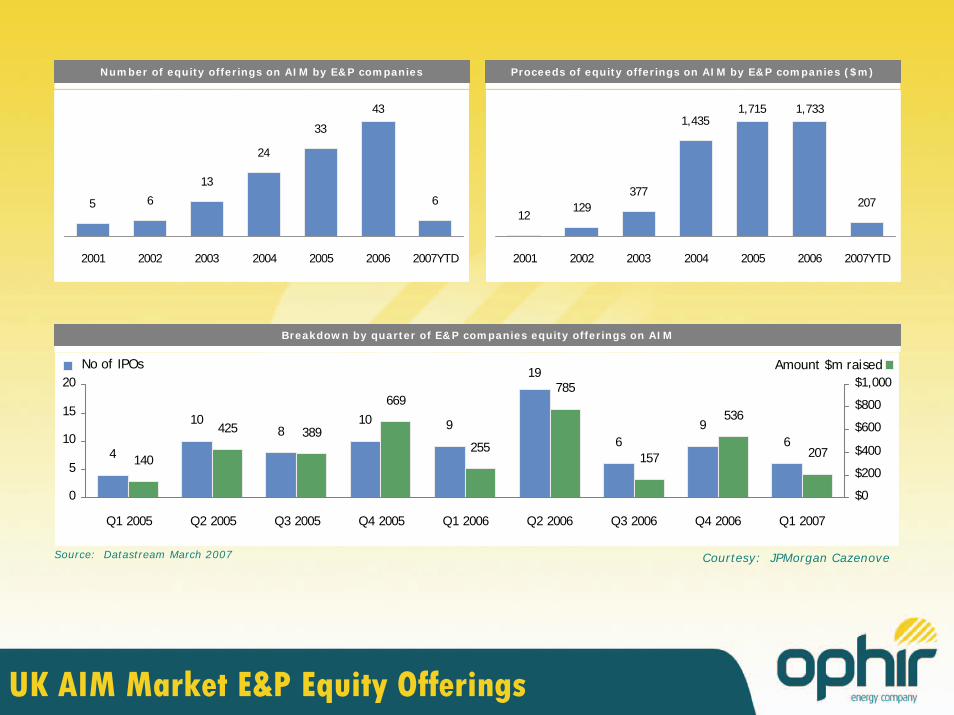
UK AIM Market E&P Equity Offerings
5 6
13
24
33
43
6
2001 2002 2003 2004 2005 2006 2007YTD
Number of equity offerings on AIM by E&P companiesNumber of equity offerings on AIM by E&P companies
Proceeds of equity offerings on AIM by E&P companies ($m)Proceeds of equity offerings on AIM by E&P companies ($m)
12129
377
1,4351,715 1,733
207
2001 2002 2003 2004 2005 2006 2007YTD
Breakdown by quarter of E&P companies equity offerings on AIMBreakdown by quarter of E&P companies equity offerings on AIM
Source: Datastream March 2007
4
108
10 9
19
69
6140
425 389
669
255
785
157
536
207
0
5
10
15
20
Q1 2005 Q2 2005 Q3 2005 Q4 2005 Q1 2006 Q2 2006 Q3 2006 Q4 2006 Q1 2007
$0
$200
$400
$600
$800
$1,000No of IPOs Amount $m raised
Courtesy: JPMorgan Cazenove
• Africa is in a state of Ultra Competition.
Capital to Spend But………
• Resource war between conventional and emerging consumers.
• Asian Tigers and NOCs making a big impact.
• Resource nationalisation.
• Speculators are back (telcos and biotechs can breathe a sigh of relief).
• Is there any room left for those of us that do this for a living?
• And if that were all not bad enough………………………………
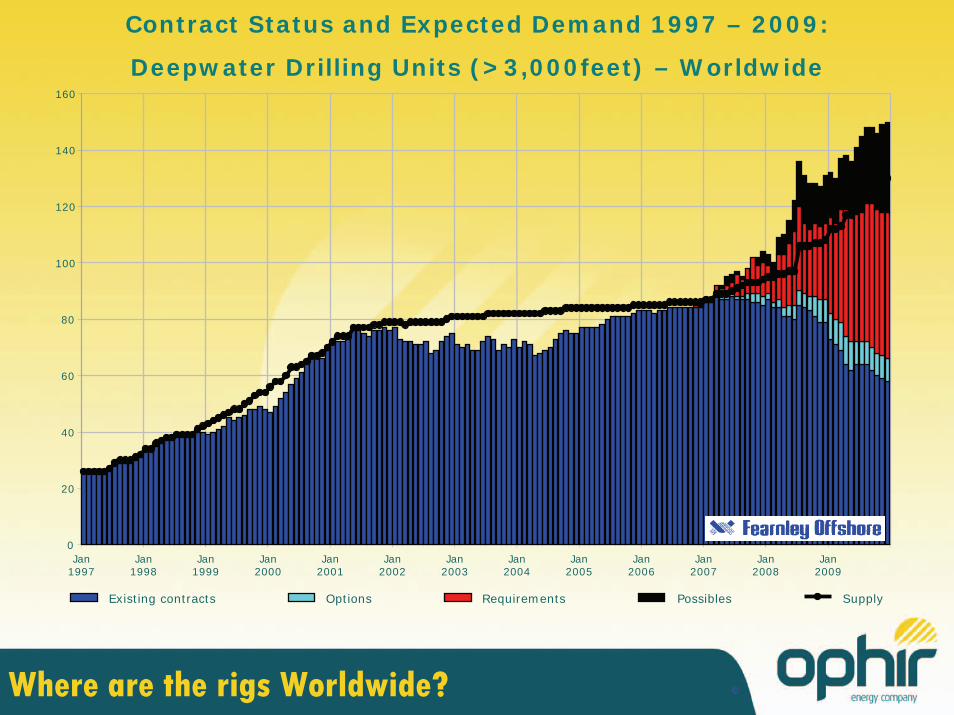
Where are the rigs Worldwide?
Contract Status and Expected Demand 1997 – 2009:
Deepwater Drilling Units (>3,000feet) – Worldwide
Existing contracts Options Requirements Possibles Supply
©
0
20
40
60
80
100
120
140
160
Jan1997
Jan1998
Jan1999
Jan2000
Jan2001
Jan2002
Jan2003
Jan2004
Jan2005
Jan2006
Jan2007
Jan2008
Jan2009
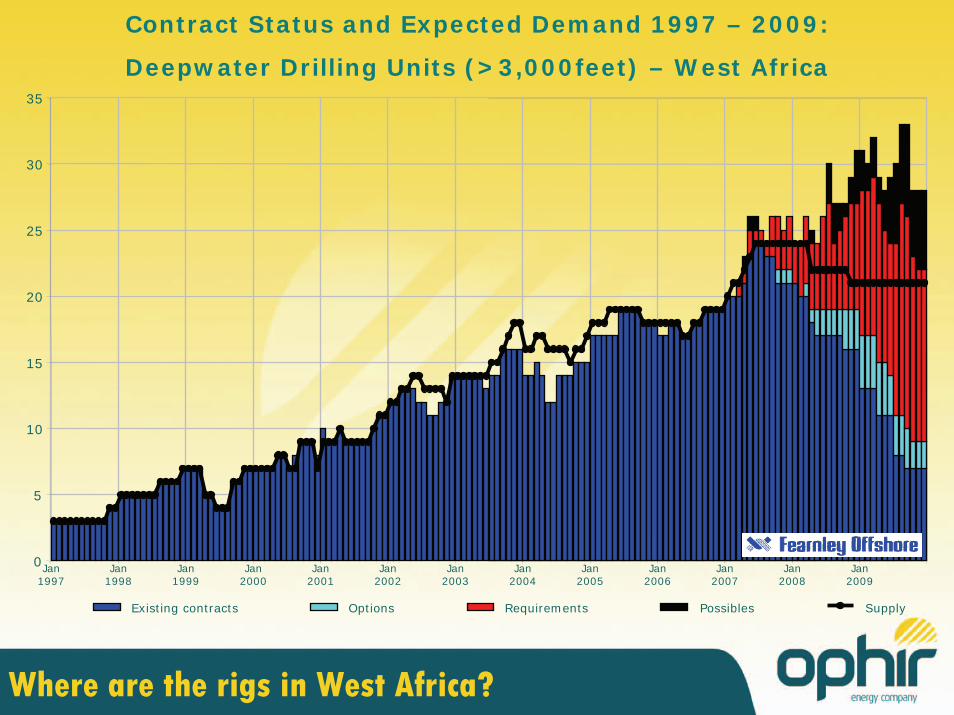
Where are the rigs in West Africa?
Contract Status and Expected Demand 1997 – 2009:
Deepwater Drilling Units (>3,000feet) – West Africa
0
5
10
15
20
25
30
35
Existing contracts Options Requirements Possibles Supply
Jan1997
Jan1998
Jan1999
Jan2000
Jan2001
Jan2002
Jan2003
Jan2004
Jan2005
Jan2006
Jan2007
Jan2008
Jan2009
0
2
4
6
8
10
12
14
16
18
20
22
24
26
28
30
32
34
36
38
40
42
44
46
48
BH
P B
illiton
Hunt
Oil
Van
co E
ner
gy
Hyp
erdyn
amic
s
Ophir
Ener
gy
Al Than
i
Dev
on E
ner
gy
Can
adia
n N
atura
l Res
ourc
es
Tow
er R
esourc
es
Enig
ma
Woodsi
de
Gre
endal
e
Sonangol
TO
TAL
SA
The
Atlas
Gro
up
Petr
oSA
Petr
obra
s
ON
HM
Dan
a Pe
trole
um
Exx
onM
obil
Occ
iden
tal Pe
trole
um
Eni SpA
Rep
sol-
YPF
SA
Roya
l D
utc
h S
hel
l
Petr
onas
Sq
uare
Kilo
metr
es
(‘0
00
s)
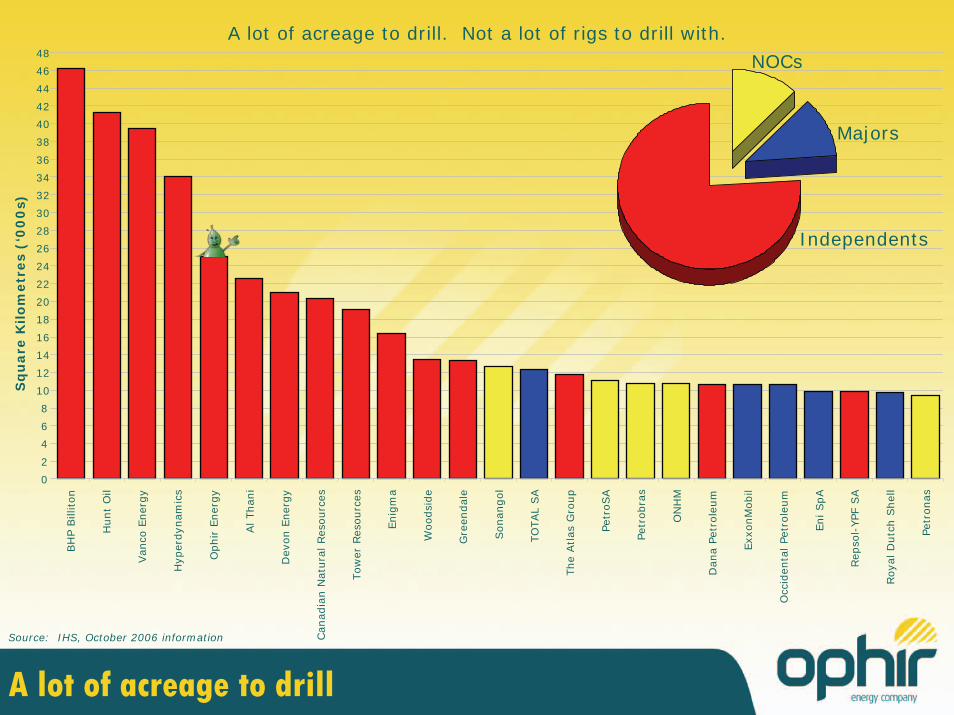
NOCs
Majors
Independents
A lot of acreage to drillSource: IHS, October 2006 information
A lot of acreage to drill. Not a lot of rigs to drill with.
So how are the
Independents going to drill
all that acreage?
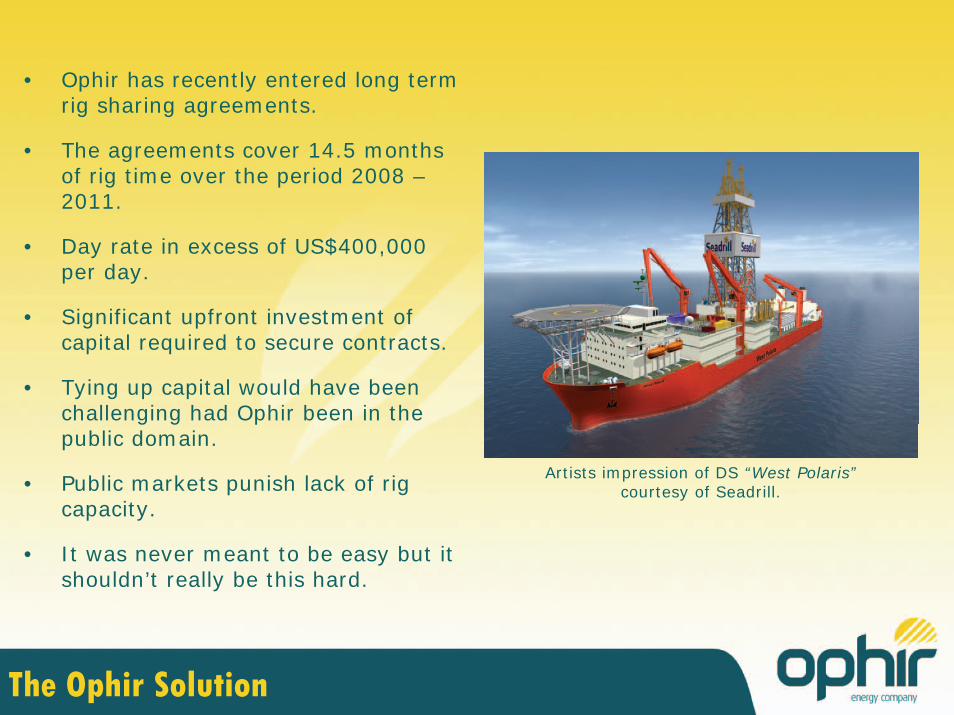
The Ophir Solution
• Ophir has recently entered long term rig sharing agreements.
• The agreements cover 14.5 months of rig time over the period 2008 –2011.
• Day rate in excess of US$400,000 per day.
• Significant upfront investment of capital required to secure contracts.
• Tying up capital would have been challenging had Ophir been in the public domain.
• Public markets punish lack of rig capacity.
• It was never meant to be easy but it shouldn’t really be this hard.
Artists impression of DS “West Polaris”courtesy of Seadrill.
Independents have the acreage.
Role of Independents in Deepwater Africa?
Majors have the production.
Asian Tigers are on the prowl.
NOCs are taking a bigger share.
We all need to drill more exploration wells.
Somebody else has all the rigs!
It’s all about to get very interesting.