Embed Size (px)
Citation preview
INDEPENDENT TECHNOLOGY REVIEW OF A PV MODULE MANUFACTURER IN JORDAN
Bankability Report Philadelphia Solar
Document No.: 20-0092-ME-R-01-D Issue: D, Status: Final Issue Date: 24/09/2020
DNV GL Entity Page ii
IMPORTANT NOTICE AND DISCLAIMER
1. This document is intended for the sole use of the Customer as detailed on the front page of this document to whom the document is addressed and who has entered into a written agreement with the DNV GL entity issuing this document (“DNV GL”). To the extent permitted by law, neither DNV GL nor any group company (the "Group") assumes any responsibility whether in contract, tort including without limitation negligence, or otherwise howsoever, to third parties (being persons other than the Customer), and no company in the Group other than DNV GL shall be liable for any loss or damage whatsoever suffered by virtue of any act, omission or default (whether arising by negligence or otherwise) by DNV GL, the Group or any of its or their servants, subcontractors or agents. This document must be read in its entirety and is subject to any assumptions and qualifications expressed therein as well as in any other relevant communications in connection with it. This document may contain detailed technical data which is intended for use only by persons possessing requisite expertise in its subject matter.
2. This document is protected by copyright and may only be reproduced and circulated in accordance with the
Document Classification and associated conditions stipulated or referred to in this document and/or in DNV GL’s written agreement with the Customer. No part of this document may be disclosed in any public offering memorandum, prospectus or stock exchange listing, circular or announcement without the express and prior written consent of DNV GL. A Document Classification permitting the Customer to redistribute this document shall not thereby imply that DNV GL has any liability to any recipient other than the Customer.
3. This document has been produced from information relating to dates and periods referred to in this document.
This document does not imply that any information is not subject to change. Except and to the extent that checking or verification of information or data is expressly agreed within the written scope of its services, DNV GL shall not be responsible in any way in connection with erroneous information or data provided to it by the Customer or any third party, or for the effects of any such erroneous information or data whether or not contained or referred to in this document.
4. Any energy forecasts estimates or predictions are subject to factors not all of which are within the scope of the
probability and uncertainties contained or referred to in this document and nothing in this document guarantees any particular energy output, including factors such as wind speed or irradiance.
KEY TO DOCUMENT CLASSIFICATION
Strictly Confidential : For disclosure only to named individuals within the Customer’s organization.
Private and Confidential : For disclosure only to individuals directly concerned with the subject matter of the document within the Customer’s organization.
Commercial in Confidence : Not to be disclosed outside the Customer’s organization.
DNV GL only : Not to be disclosed to non-DNV GL staff
Customer’s Discretion :
Distribution for information only at the discretion of the Customer (subject to the above Important Notice and Disclaimer and the terms of DNV GL’s written agreement with the Customer).
Published : Available for information only to the general public (subject to the above Important Notice and Disclaimer).
DNV GL Entity Page iii
Project name: Independent Technology Review of a PV Module
Manufacturer in Jordan DNV GL AS – Energy (Dubai branch) Dubai, UAE Renewables Advisory Burjuman Business Tower, 14th Floor Sheikh Khalifah Bin Zayed St. P.O. Box 11539, Dubai, UAE +971 4 302 6300
Report title: Bankability Report Customer: Philadelphia Solar,
Al Qastal Industrial Area 2 Airfreight Road Amman, Jordan
Contact person: Aseel Alsadi Date of issue: 22/09/2020 Project No.: PP319492 Document No.: 20-0092-ME-R-01-D Issue/Status Final Issue
Task and objective: This report presents the results of analysis conducted by DNV GL on behalf of Philadelphia Solar. Prepared by: Verified by: Approved by:
Catherine Vadakkan Solar PV Engineer
Asal Ibrahim Solar PV Engineer
Elisa Cataldo Team Lead
Eduardo Marques Solar PV Engineer Rasha Shahib Solar PV Engineer ☐ Strictly Confidential Keywords:
Inspection Report, PV module manufacturer ☐ Private and Confidential ☐ Commercial in Confidence ☐ DNV GL only ☒ Customer’s Discretion ☐ Published
© 2016 DNV GL Entity. All rights reserved.
Reference to part of this report which may lead to misinterpretation is not permissible. Issue Date Reason for Issue Prepared by Verified by Approved by
A 27/02/2020 DRAFT Catherine V.
Eduardo M.
Rasha S.
Asal Ibrahim
Cesar Hidalgo
B 08/06/2020 DRAFT Catherine V.
Eduardo M.
Rasha S.
Asal Ibrahim
Cesar Hidalgo
DNV GL Entity Page iv
C 11/08/2020 DRAFT Catherine V.
Eduardo M.
Rasha S.
Asal Ibrahim
Cesar Hidalgo
D 24/09/2020 Final Issue Catherine V.
Eduardo M.
Asal Ibrahim
Elisa Cataldo
DNV GL Entity Page v
Table of contents
1 EXECUTIVE SUMMARY .......................................................................................................... 1
2 INTRODUCTION ................................................................................................................... 7
3 COMPANY EVALUATION ........................................................................................................ 8 3.1 Company Overview .............................................................................................................. 8 3.2 Organization chart ..............................................................................................................10 3.3 Company Financials and Sales Revenues ...............................................................................11 3.4 Product History ...................................................................................................................13 3.5 Intellectual Property ............................................................................................................15 3.6 Philadelphia solar in the market ............................................................................................16 3.7 Company Strategy ..............................................................................................................18
4 TECHNICAL EVALUATION .....................................................................................................20 4.1 Product Evaluation ..............................................................................................................20 4.2 Light Induced Degradation (LID) ..........................................................................................26 4.3 Passivated Emitter Rear Cell (PERC) ......................................................................................27 4.4 Bifacial Cells .......................................................................................................................29 4.5 Certificates ........................................................................................................................31 4.6 Independent Test Results ....................................................................................................34 4.7 Anti-Reflective (AR) Glass Performance .................................................................................34 4.8 Back sheet .........................................................................................................................35 4.9 Low Irradiance Performance .................................................................................................36 4.10 STC Rating .........................................................................................................................37
5 QUALITY AND RELIABILITY ..................................................................................................38 5.1 Production process ..............................................................................................................38 5.2 Quality assurance procedure ................................................................................................39 5.3 Facility environment control .................................................................................................42 5.4 Finished product durability checks.........................................................................................43 5.5 Potential Induced Degradation (PID) Testing ..........................................................................43
6 MANUFACTURING FACTORY VISIT ........................................................................................45 6.1 Material Storage .................................................................................................................45 6.2 Cell Sorting ........................................................................................................................46 6.3 Tabbing and Stringing .........................................................................................................46 6.4 Lay-up ..............................................................................................................................46 6.5 Lamination .........................................................................................................................47 6.6 Framing .............................................................................................................................47 6.7 Junction Box ......................................................................................................................47 6.8 Finishing Stage ...................................................................................................................48 6.9 Final Testing ......................................................................................................................48 6.10 Electroluminescence tests 2 and flash tests ............................................................................49 6.11 Packaging and dispatching ...................................................................................................49
DNV GL Entity Page vi
6.12 Training/Worker Attire .........................................................................................................49 6.13 Repairing Station ................................................................................................................50 6.14 Rework workshop ...............................................................................................................50 6.15 Quality Laboratory ..............................................................................................................50
7 PRODUCT SUPPORT ............................................................................................................51 7.1 Service Infrastructure Evaluation ..........................................................................................51 7.2 Warranty Evaluation ............................................................................................................52 7.3 Product Manuals .................................................................................................................53
8 REFERENCES ......................................................................................................................59
Appendices
APPENDIX A: PRODUCT DATASHEET
APPENDIX B: FRAME DRAWINGS
APPENDIX C: PERFORMANCE AT STC AND AT LOW IRRADIANCE TEST RESULTS
APPENDIX D: AR GLASS PROPERTIES
APPENDIX E: PHILADELPHIA QUALITY CHECK LIST
APPENDIX F: FACTORY INSPECTION PICTURES
APPENDIX G: STORAGE CONDITIONS
List of tables Table 1-1: Philadelphia Solar trends of sales, export and profits in the last three years* .............. 1 Table 1-2 Annual production .............................................................................................................. 4 Table 3-1: Philadelphia Solar’s production capacity*.............................................................................. 8 Table 3-2 Philadelphia Solar’s main market export ................................................................................ 9 Table 3-3 Managing staff educational records ..................................................................................... 11 Table 3-4: Philadelphia Solar trends of sales, export and profits in the last three years* .......................... 12 Table 3-5: Philadelphia Solar milestones ............................................................................................ 14 Table 3-6: Local Project References /1/ ............................................................................................. 14 Table 3-7:International Project References /1//2/ ............................................................................... 15 Table 3-8: Ranking of module suppliers worldwide for 2019 ................................................................. 17 Table 3-9: Sales forecast (MWp)* ..................................................................................................... 19 Table 4-1: Philadelphia PS-P60, PS-P72, PS-M60 and PS-M72 family of modules..................................... 20 Table 4-2: Comparison of Philadelphia PS-P72 to Competitor Products .................................................. 21 Table 4-3: Comparison of Philadelphia PS-M72 to Competitor Products .................................................. 21 Table 4-4: Comparison of Philadelphia PS-M72 (BF) to Competitor Products ........................................... 22 Table 4-5: Comparison of Philadelphia WARD PS-M72 (BF) to Competitor Products ................................. 23 Table 4-6: Components in the PS-P72 & PS-M72 modules /26/ Source: Philadelphia Solar. ...................... 23 Table 4-7: Components in the PS-M72 (BF) modules Source: Philadelphia Solar. .................................... 25 Table 4-8: LeTID testing conditions ................................................................................................... 27 Table 4-9: Key features of PERC modules .......................................................................................... 29 Table 4-10: Key features of bi-facial modules ..................................................................................... 31 Table 4-11 PV module certificates ..................................................................................................... 31 Table 4-12 PV modules Performance at low irradiance test at system voltage of 1000V – 2015 data /51/ .. 36
DNV GL Entity Page vii
Table 4-13 PV modules Performance at low irradiance test for modules at system voltage of 1500V – May 2018 data /52/ ............................................................................................................................... 36 Table 4-14 PV modules Performance at low irradiance test for modules at system voltage of 1500V – 2020 data /54//55/ ................................................................................................................................. 37 Table 5-1 Annual production ............................................................................................................ 39 Table 5-2 IEC 62804 PID testing methods .......................................................................................... 44 Table 7-1 Number of claims per year ................................................................................................. 51 Table 7-2 Detected problems in 2019 ................................................................................................ 51 Table 7-3: Comparison of Philadelphia PS-P72 to Competitor Products .................................................. 52 Table 7-4: Comparison of Philadelphia PS-M72 to Competitor Products .................................................. 52 Table 7-5: Comparison of Philadelphia PS-M72 (BF) to Competitor Products ........................................... 52
List of figures Figure 3-1 Philadelphia Solar organization chart /8/ ............................................................................ 10 Figure 3-2: Philadelphia Solar main export market 2019 Source: Philadelphia Solar ................................ 12 Figure 3-3 Philadelphia Solar's Sales growth from 2009 to 2019 ........................................................... 13 Figure 3-4 Production capacity evolution ............................................................................................ 13 Figure 3-5: PV cell technology shares 1980-2017 source: ISE Fraunhofer .............................................. 17 Figure 3-6: Complete silicon crystalline supply chain ........................................................................... 18 Figure 3-7 Global PV System Pricing 2019 source: Wood Mackenzie ...................................................... 18 Figure 4-1 Advantages/Disadvantages of PERC technology ................................................................... 28 Figure 4-2 Key features of Al-BSF and PERC modules .......................................................................... 28 Figure 4-3 The standard PERC cell (left) has a full layer of rear aluminum, while a bifacial PERC cell (right) has Al fingers aligned and printed over the dielectric openings /27/ ...................................................... 29 Figure 4-4: Illustration of the construction of the Cybrid backsheet /34/ ................................................ 35 Figure 5-1: Production follow chart. Source: Philadelphia Solar. ............................................................ 38 Figure 7-1: Albedo range of different site conditions and expected yield gain /5/ .................................... 55 Figure 7-2 Grounding method /5/ ..................................................................................................... 56 Figure 7-3: Mounting system using frame bolts holes /5/ ..................................................................... 57 Figure 7-4 Middle and End clamps /5/ ............................................................................................... 57
DNV GL Entity Page viii
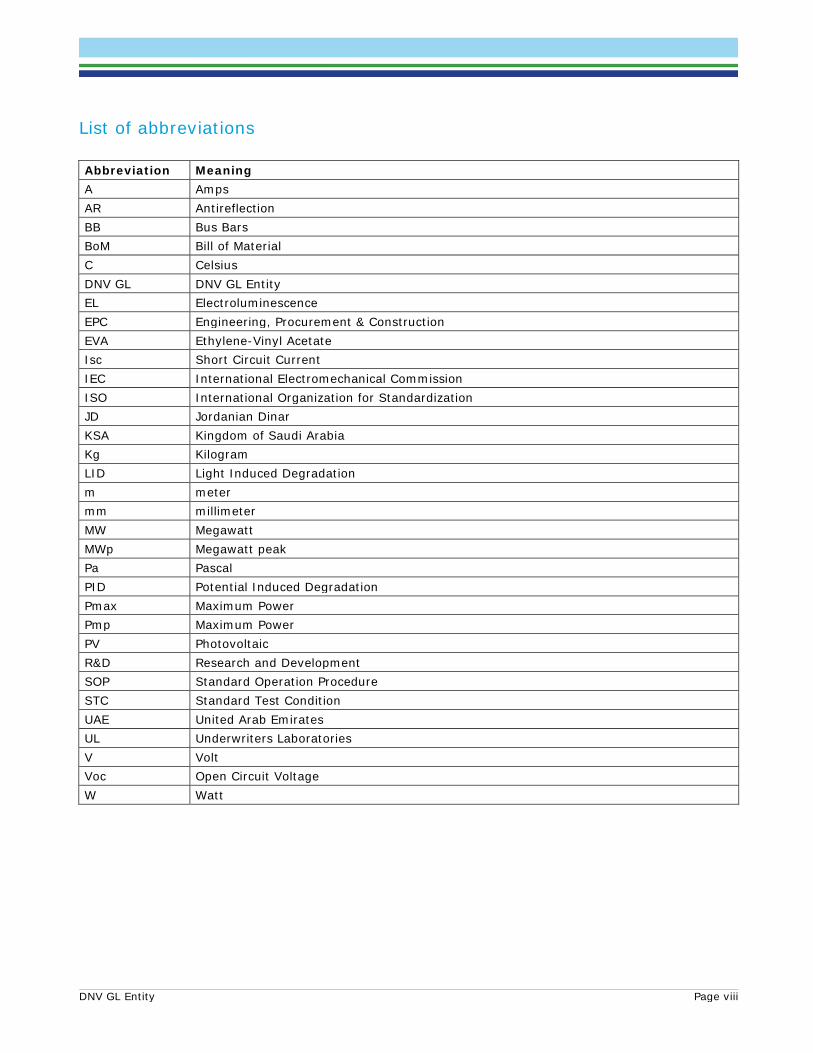
List of abbreviations Abbreviation Meaning A Amps AR Antireflection BB Bus Bars BoM Bill of Material C Celsius DNV GL DNV GL Entity EL Electroluminescence EPC Engineering, Procurement & Construction EVA Ethylene-Vinyl Acetate Isc Short Circuit Current IEC International Electromechanical Commission ISO International Organization for Standardization JD Jordanian Dinar KSA Kingdom of Saudi Arabia Kg Kilogram LID Light Induced Degradation m meter mm millimeter MW Megawatt MWp Megawatt peak Pa Pascal PID Potential Induced Degradation Pmax Maximum Power Pmp Maximum Power PV Photovoltaic R&D Research and Development SOP Standard Operation Procedure STC Standard Test Condition UAE United Arab Emirates UL Underwriters Laboratories V Volt Voc Open Circuit Voltage W Watt
DNV GL – Document No.: 20-0092-ME-R-01-A, Issue: B, Status: Final Page 1
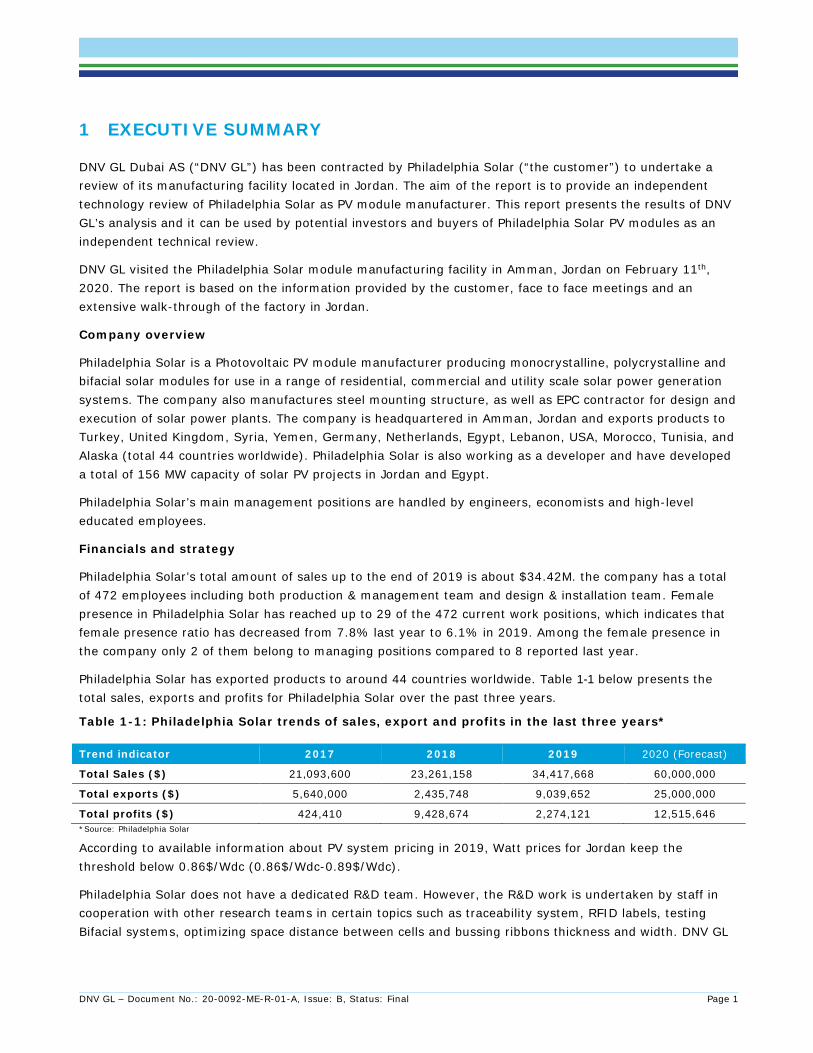
1 EXECUTIVE SUMMARY
DNV GL Dubai AS (“DNV GL”) has been contracted by Philadelphia Solar (“the customer”) to undertake a review of its manufacturing facility located in Jordan. The aim of the report is to provide an independent technology review of Philadelphia Solar as PV module manufacturer. This report presents the results of DNV GL’s analysis and it can be used by potential investors and buyers of Philadelphia Solar PV modules as an independent technical review.
DNV GL visited the Philadelphia Solar module manufacturing facility in Amman, Jordan on February 11th, 2020. The report is based on the information provided by the customer, face to face meetings and an extensive walk-through of the factory in Jordan.
Company overview
Philadelphia Solar is a Photovoltaic PV module manufacturer producing monocrystalline, polycrystalline and bifacial solar modules for use in a range of residential, commercial and utility scale solar power generation systems. The company also manufactures steel mounting structure, as well as EPC contractor for design and execution of solar power plants. The company is headquartered in Amman, Jordan and exports products to Turkey, United Kingdom, Syria, Yemen, Germany, Netherlands, Egypt, Lebanon, USA, Morocco, Tunisia, and Alaska (total 44 countries worldwide). Philadelphia Solar is also working as a developer and have developed a total of 156 MW capacity of solar PV projects in Jordan and Egypt.
Philadelphia Solar’s main management positions are handled by engineers, economists and high-level educated employees.
Financials and strategy
Philadelphia Solar’s total amount of sales up to the end of 2019 is about $34.42M. the company has a total of 472 employees including both production & management team and design & installation team. Female presence in Philadelphia Solar has reached up to 29 of the 472 current work positions, which indicates that female presence ratio has decreased from 7.8% last year to 6.1% in 2019. Among the female presence in the company only 2 of them belong to managing positions compared to 8 reported last year.
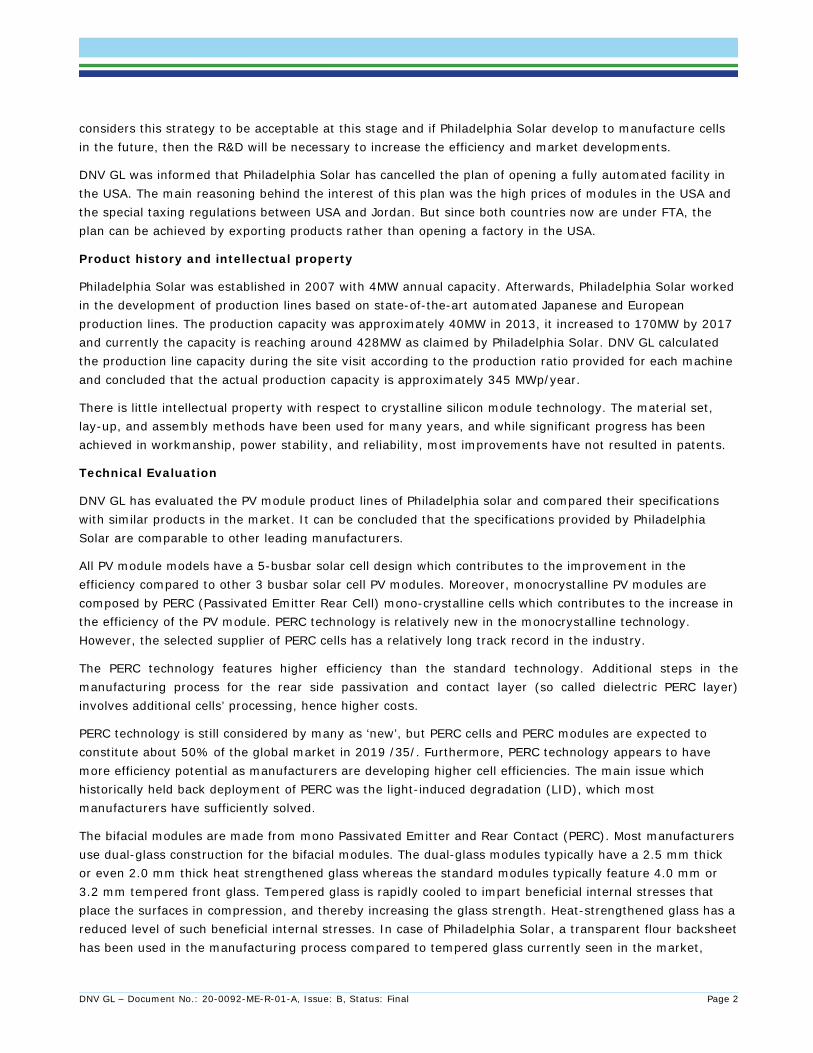
Philadelphia Solar has exported products to around 44 countries worldwide. Table 1-1 below presents the total sales, exports and profits for Philadelphia Solar over the past three years.
Table 1-1: Philadelphia Solar trends of sales, export and profits in the last three years*
Trend indicator 2017 2018 2019 2020 (Forecast)
Total Sales ($) 21,093,600 23,261,158 34,417,668 60,000,000
Total exports ($) 5,640,000 2,435,748 9,039,652 25,000,000
Total profits ($) 424,410 9,428,674 2,274,121 12,515,646 *Source: Philadelphia Solar
According to available information about PV system pricing in 2019, Watt prices for Jordan keep the threshold below 0.86$/Wdc (0.86$/Wdc-0.89$/Wdc).
Philadelphia Solar does not have a dedicated R&D team. However, the R&D work is undertaken by staff in cooperation with other research teams in certain topics such as traceability system, RFID labels, testing Bifacial systems, optimizing space distance between cells and bussing ribbons thickness and width. DNV GL
DNV GL – Document No.: 20-0092-ME-R-01-A, Issue: B, Status: Final Page 2
considers this strategy to be acceptable at this stage and if Philadelphia Solar develop to manufacture cells in the future, then the R&D will be necessary to increase the efficiency and market developments.
DNV GL was informed that Philadelphia Solar has cancelled the plan of opening a fully automated facility in the USA. The main reasoning behind the interest of this plan was the high prices of modules in the USA and the special taxing regulations between USA and Jordan. But since both countries now are under FTA, the plan can be achieved by exporting products rather than opening a factory in the USA.
Product history and intellectual property
Philadelphia Solar was established in 2007 with 4MW annual capacity. Afterwards, Philadelphia Solar worked in the development of production lines based on state-of-the-art automated Japanese and European production lines. The production capacity was approximately 40MW in 2013, it increased to 170MW by 2017 and currently the capacity is reaching around 428MW as claimed by Philadelphia Solar. DNV GL calculated the production line capacity during the site visit according to the production ratio provided for each machine and concluded that the actual production capacity is approximately 345 MWp/year.
There is little intellectual property with respect to crystalline silicon module technology. The material set, lay-up, and assembly methods have been used for many years, and while significant progress has been achieved in workmanship, power stability, and reliability, most improvements have not resulted in patents.
Technical Evaluation
DNV GL has evaluated the PV module product lines of Philadelphia solar and compared their specifications with similar products in the market. It can be concluded that the specifications provided by Philadelphia Solar are comparable to other leading manufacturers.
All PV module models have a 5-busbar solar cell design which contributes to the improvement in the efficiency compared to other 3 busbar solar cell PV modules. Moreover, monocrystalline PV modules are composed by PERC (Passivated Emitter Rear Cell) mono-crystalline cells which contributes to the increase in the efficiency of the PV module. PERC technology is relatively new in the monocrystalline technology. However, the selected supplier of PERC cells has a relatively long track record in the industry.
The PERC technology features higher efficiency than the standard technology. Additional steps in the manufacturing process for the rear side passivation and contact layer (so called dielectric PERC layer) involves additional cells’ processing, hence higher costs.
PERC technology is still considered by many as ‘new’, but PERC cells and PERC modules are expected to constitute about 50% of the global market in 2019 /35/. Furthermore, PERC technology appears to have more efficiency potential as manufacturers are developing higher cell efficiencies. The main issue which historically held back deployment of PERC was the light-induced degradation (LID), which most manufacturers have sufficiently solved.
The bifacial modules are made from mono Passivated Emitter and Rear Contact (PERC). Most manufacturers use dual-glass construction for the bifacial modules. The dual-glass modules typically have a 2.5 mm thick or even 2.0 mm thick heat strengthened glass whereas the standard modules typically feature 4.0 mm or 3.2 mm tempered front glass. Tempered glass is rapidly cooled to impart beneficial internal stresses that place the surfaces in compression, and thereby increasing the glass strength. Heat-strengthened glass has a reduced level of such beneficial internal stresses. In case of Philadelphia Solar, a transparent flour backsheet has been used in the manufacturing process compared to tempered glass currently seen in the market,
DNV GL – Document No.: 20-0092-ME-R-01-A, Issue: B, Status: Final Page 3
which makes the module lighter weight and some studies have considered that the backsheet has better insulation. DNV GL notes that the longest successful track record for backsheet construction involves a fluoropolymer on both the inner and outermost layers. DNV GL views Cybrid manufactured back sheets as positive with the use of at least an outer fluoropolymer layer for its Cynagard 465A(R) backsheet.
Independent test reports of specific modules were provided for DNV GL review and these were found to be acceptable. The system voltage allowable for analysed monocrystalline and poly crystalline PV modules (PS-P60, PS-P72, PS-M60 and PS-M72) is 1,000V. In addition, certification for IEC 61215 and IEC 61730 standard under 1,500V have been carried out for PS-P60, PS-P72, PS-M60 and PS-M72 modules. In case of bifacial modules, IEC Test reports and certificates have been provided for 1,500 V systems by Solar PTV Laboratory in Arizona, USA.
After analysis of main electrical parameters of the PV modules based on the data specified in the datasheets, module performance criteria such as temperature coefficient, voltage characteristics, current characteristics of the poly-crystalline, mono-crystalline and bifacial PV modules are comparable, and in some cases better, than other leading suppliers in the PV industry.
LID results document was provided. Tested PV modules belong to the analysed PV module family in the present report. LID results for monocrystalline PV modules present a maximum LID degradation of -2.2%, whereas polycrystalline PV modules manifest a LID degradation no higher than -1.06%. DNV GL finds these values within the standard range in the industry. The irradiation used in the tests is 5.85kWh/m2 which is considered rather low, since it is usually recommended to undertake the study after an irradiation of 60kWh/m2 with several intermediate measurements for confirming the stabilization of LID.
The LeTID test report as per MQT23.1 of draft IEC 61215-2:2019 provided included 2 samples of PS-M72 (BF) tested for 2 rounds each for at least 240 hours at STC. The conclusion stated is that the modules are not LeTID sensitive. DNV GL recommends that a minimum of 4 modules are tested following testing criteria as per Table 4-8.
A document with IAM measurements in three types of modules (m-Si, p-Si and bifacial) has been provided /50/. Based on independent research, DNV GL has found that there are multiple valid approaches to IAM testing employed by various labs and these approaches give different results. While reasonable levels of intra-lab repeatability may be achievable, the level of precision across labs is generally poor so the calculated uncertainty of IAM measurements is high. In this case, DNV GL finds that the IAM data confirms, within the margin of uncertainty, that the measurements are in line with DNV GL’s standard modeling assumptions for ARC.
The low light performance test released was performed between 2015 to 2020 as per data provided. DNV GL would recommend performing this type of test at least once per year. In that sense, additional measurements in m-Si, p-Si and bifacial modules have been provided /50/ showing typical level of efficiency loss at 200 W/m2 of -3.5% which is acceptable.
Tolerance range of the PV modules are within the range or even better than comparable modules.
Quality and reliability: Production line and quality checks to incoming materials
DNV GL – Document No.: 20-0092-ME-R-01-A, Issue: B, Status: Final Page 4
In general terms, the production line design is modern, professional, and it uses good quality production equipment. The lay-out of the production line is very similar to other manufacturers in the market, having double electroluminescence testing is the best practice in the industry.
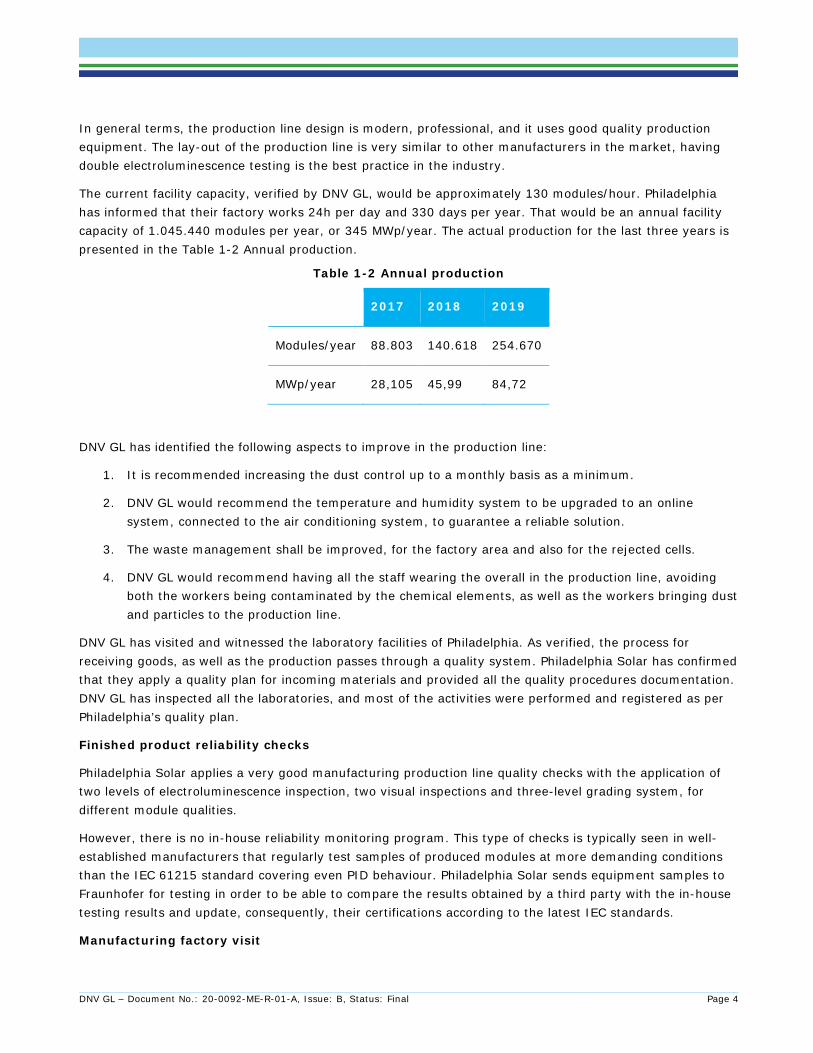
The current facility capacity, verified by DNV GL, would be approximately 130 modules/hour. Philadelphia has informed that their factory works 24h per day and 330 days per year. That would be an annual facility capacity of 1.045.440 modules per year, or 345 MWp/year. The actual production for the last three years is presented in the Table 1-2 Annual production.
Table 1-2 Annual production
2017 2018 2019
Modules/year 88.803 140.618 254.670
MWp/year 28,105 45,99 84,72
DNV GL has identified the following aspects to improve in the production line:
1. It is recommended increasing the dust control up to a monthly basis as a minimum.
2. DNV GL would recommend the temperature and humidity system to be upgraded to an online system, connected to the air conditioning system, to guarantee a reliable solution.
3. The waste management shall be improved, for the factory area and also for the rejected cells.
4. DNV GL would recommend having all the staff wearing the overall in the production line, avoiding both the workers being contaminated by the chemical elements, as well as the workers bringing dust and particles to the production line.
DNV GL has visited and witnessed the laboratory facilities of Philadelphia. As verified, the process for receiving goods, as well as the production passes through a quality system. Philadelphia Solar has confirmed that they apply a quality plan for incoming materials and provided all the quality procedures documentation. DNV GL has inspected all the laboratories, and most of the activities were performed and registered as per Philadelphia’s quality plan.
Finished product reliability checks
Philadelphia Solar applies a very good manufacturing production line quality checks with the application of two levels of electroluminescence inspection, two visual inspections and three-level grading system, for different module qualities.
However, there is no in-house reliability monitoring program. This type of checks is typically seen in well-established manufacturers that regularly test samples of produced modules at more demanding conditions than the IEC 61215 standard covering even PID behaviour. Philadelphia Solar sends equipment samples to Fraunhofer for testing in order to be able to compare the results obtained by a third party with the in-house testing results and update, consequently, their certifications according to the latest IEC standards.
Manufacturing factory visit
DNV GL – Document No.: 20-0092-ME-R-01-A, Issue: B, Status: Final Page 5
DNV GL visited the Philadelphia Solar module manufacturing facility in Amman, Jordan on Jordan on 11 February 2020.
The following areas were inspected during the site visit:
- Raw material reception area which is in line with industry standards. DNV GL has also verified that the production line has a tracking system, installed in the production engineers’ handhelds devices, that can extract from the serial numbers of the modules information about the BOM produced and the ambient conditions registered. This is an improvement for the production system and would be important to have it integrated to the storage system, so to be able to track down: module, BOM and conditions of production.
- Cell tabbing and stringing: There are two lines of tabbing operations with different machines, both automated. It can be concluded that the lay-up operation is consistent with industry standards in general.
- Lay-up area: The work areas were very clean, and standard operating procedures were posted at each working station writing in both Arabic and English language. The temperature of the soldering irons is checked visually 3 times per shift and monthly using the data logger.
- Electroluminescence tests 1: EL testing and image analyses is performed on all arrangements prior to lamination. Modules with defective cells, are moved to the Repairing Station. EL equipment is high quality and the procedures follow the industry practices.
- Lamination: There are six laminators in the production line. As stated in the Automatic Solar Laminator manual /56/ of Jinchen (Dated 04/28/2016) five (5) modules of 72 cells have a process time of 8 minutes with total capacity equal to 80MW per laminator therefore for 6 laminators the total maximum capacity is equal to 480 MW not considering the other external conditions that could affect the availability of the factory;
- Framing: There are two lines of productions to frame the modules, one is semi-automated process, with a support of one operator and another one line with an automatic framing machine. The manual line would be recommended to be replaced by an automatic process to give more reliability and safety to the production line. Semi-manual framing process has a capacity up to 60 modules/hour whereas the automatic framing process has a capacity up to 100 modules/hour.
- Junction box fitting: The crosstie ribbons are manually soldered onto the terminals of the junction box. Philadelphia Solar has commented, soldering temperature of the soldering iron is checked 3 times per shift. However, DNV GL has not seen this checking procedure to be performed during the site visit. DNV GL also recommends performing a mechanical pull test by the operator on each tab to ensure that a solid soldered connection has been achieved. A silicone bead is applied to the junction box at an automated station. Philadelphia Solar has confirmed there is a template to control the horizontal placement of the junction box on the back side of the module, in order to achieve proper placement. However, DNV GL has not seen this template usage during the site visit. Philadelphia Solar has confirmed that strain relief test on the cables is performed for a proper tightness on a sampling basis during incoming inspection. The strain relief test consists on hanging the PV module for one minute from cables letting it withstand its own weight (around 22kg) However, DNV GL did not see neither of the mentioned tests being implemented during the site visit.
- Curing area: For this area, DNV GL also recommends having an active measurement, controlled and connected to an on-line system that verifies the temperature and activates the air conditioning system. During DNV GL inspection visit it was observed that the modules stay in a controlled environment for 4 hours to cure the silicon from the junction box and frame.
DNV GL – Document No.: 20-0092-ME-R-01-A, Issue: B, Status: Final Page 6
- Finishing stage: all modules are inspected and cleaned at the end of the production line. - Final testing: The finished modules are then bar-code scanned and a testing device is connected to
its frame to perform the insulation tests. During the inspection, DNV GL requested Philadelphia to place a failed module into the line again and re-run the insulation tests. The test was not sufficiently consistent. DNV GL recommends verifying the testing machine.
- Electroluminescence tests 2 and flash tests: Once more, the module EL image is reviewed by an operator and graded as A, A2 or C grade, and the flash test result is logged to the system under the module barcode (process which DNV GL witnessed). During the inspection, Philadelphia placed a C grade module into the line and showed DNV GL the manufacture defects in the cells, and it was also showed that the module still has a production power curve;
- Labelling and packaging: After the EL test and the flash curves are logged into the system, the module is finally labelled and moved to the correct pallets, divided into the three-grading strategy. DNV GL recommends that the module packages, once finalized, are kept only inside the warehouses or areas where the pallets are sheltered and marked. It is important also to add a sign, so all staff take care of the fragile material stored.
DNV GL has been informed by Philadelphia Solar that used labels for binning the PV modules have been installed for the last 8 years without any claim.
Product support
Product support and complaints management is handled by a dedicated team of Philadelphia Solar. Customer satisfaction survey and customer claim forms can be downloaded from Philadelphia Solar’s website. DNV GL has been provided with an oversight of the mechanism involved. DNV GL highlights warranty claim procedures are defined and followed. No major recall issues for the supplied modules have been provided.
Nowadays, whereas Philadelphia Solar is offering a first-year power warranty of at least 97% and 97.5% and a degradation of 0.65%, 0.7% and 0.5% for monocrystalline, polycrystalline and Bifacial Mono-crystalline respectively, some PV manufacturers are offering first year warranty of at least 97.5% and a degradation of 0.5%. DNV GL recommends improving warranty terms to follow the best practice in the industry.
The twelve-year workmanship warranty is a standard trend in the PV market industry. Product manuals are reasonable well documented and established, highlighting risks and safe operating procedures. Additionally, DNV GL has made few recommendations on improvements, for instance the description of allowed automatic cleaning equipment for their modules or robots and this has not been improved since DNV GL’s visit in 2019.
DNV GL – Document No.: 20-0092-ME-R-01-A, Issue: B, Status: Final Page 7
2 INTRODUCTION
DNV GL Dubai AS (“DNV GL”) has been contracted by Philadelphia Solar (“the customer”) to undertake a review of its manufacturing facility located in Jordan. The intent of the report is to provide an independent technology review of a PV module manufacturer. This report presents the results of DNV GL’s analysis and it can be used by potential investors and buyers of Philadelphia Solar PV modules as an independent technical review.
DNV GL visited the Philadelphia Solar module manufacturing facility in Amman, Jordan on February, 11th 2020. The report is based on the information provided by the customer, face to face meetings and an extensive walk-through of the factory in Jordan.
Philadelphia Solar has been forthcoming in sharing the required information for the assessment as requested by DNV GL. DNV GL is relying on the accuracy of the information provided by Philadelphia solar for this report.
DNV GL – Document No.: 20-0092-ME-R-01-A, Issue: B, Status: Final Page 8
3 COMPANY EVALUATION
3.1 Company Overview
Philadelphia Solar is a Photovoltaic PV module Manufacturer. The company was first established in Jordan in 2007. The company is headquartered in Amman, Jordan and exports products to Turkey, United Kingdom, Syria, Yemen, Germany, Netherlands, Egypt, Lebanon, USA, Morocco, Tunisia, and Alaska (total 44 countries worldwide).The company’s products include a range of standard monocrystalline, polycrystalline and bifacial solar modules for use in a range of residential, commercial and utility scale solar power generation systems.
Philadelphia Solar is also a steel mounting structure manufacturer, as well as EPC contractor for design and execution of solar power plants. Philadelphia Solar is also working as a developer and has developed a total of 156 MW capacity of solar PV projects in Jordan and Egypt.
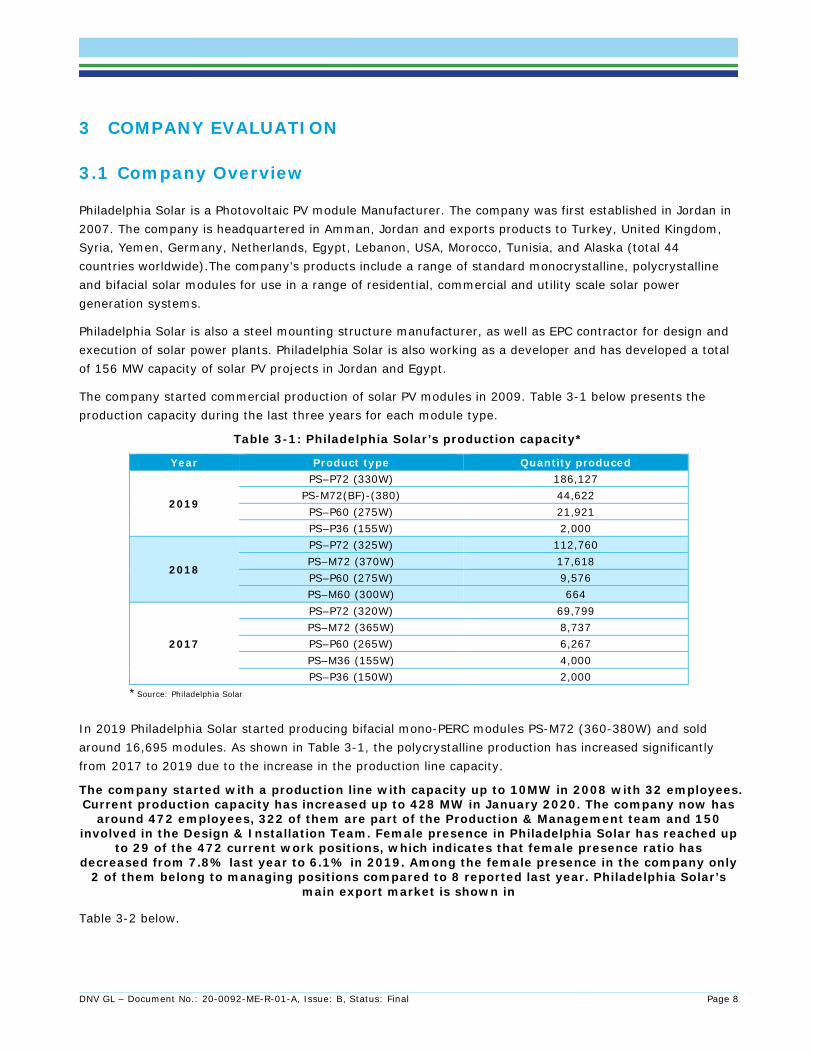
The company started commercial production of solar PV modules in 2009. Table 3-1 below presents the production capacity during the last three years for each module type.
Table 3-1: Philadelphia Solar’s production capacity*
Year Product type Quantity produced
2019
PS–P72 (330W) 186,127 PS-M72(BF)-(380) 44,622 PS–P60 (275W) 21,921 PS–P36 (155W) 2,000
2018
PS–P72 (325W) 112,760 PS–M72 (370W) 17,618 PS–P60 (275W) 9,576 PS–M60 (300W) 664
2017
PS–P72 (320W) 69,799 PS–M72 (365W) 8,737 PS–P60 (265W) 6,267 PS–M36 (155W) 4,000 PS–P36 (150W) 2,000
*Source: Philadelphia Solar
In 2019 Philadelphia Solar started producing bifacial mono-PERC modules PS-M72 (360-380W) and sold around 16,695 modules. As shown in Table 3-1, the polycrystalline production has increased significantly from 2017 to 2019 due to the increase in the production line capacity.
The company started with a production line with capacity up to 10MW in 2008 with 32 employees. Current production capacity has increased up to 428 MW in January 2020. The company now has
around 472 employees, 322 of them are part of the Production & Management team and 150 involved in the Design & Installation Team. Female presence in Philadelphia Solar has reached up
to 29 of the 472 current work positions, which indicates that female presence ratio has decreased from 7.8% last year to 6.1% in 2019. Among the female presence in the company only
2 of them belong to managing positions compared to 8 reported last year. Philadelphia Solar’s main export market is shown in
Table 3-2 below.
DNV GL – Document No.: 20-0092-ME-R-01-A, Issue: B, Status: Final Page 9
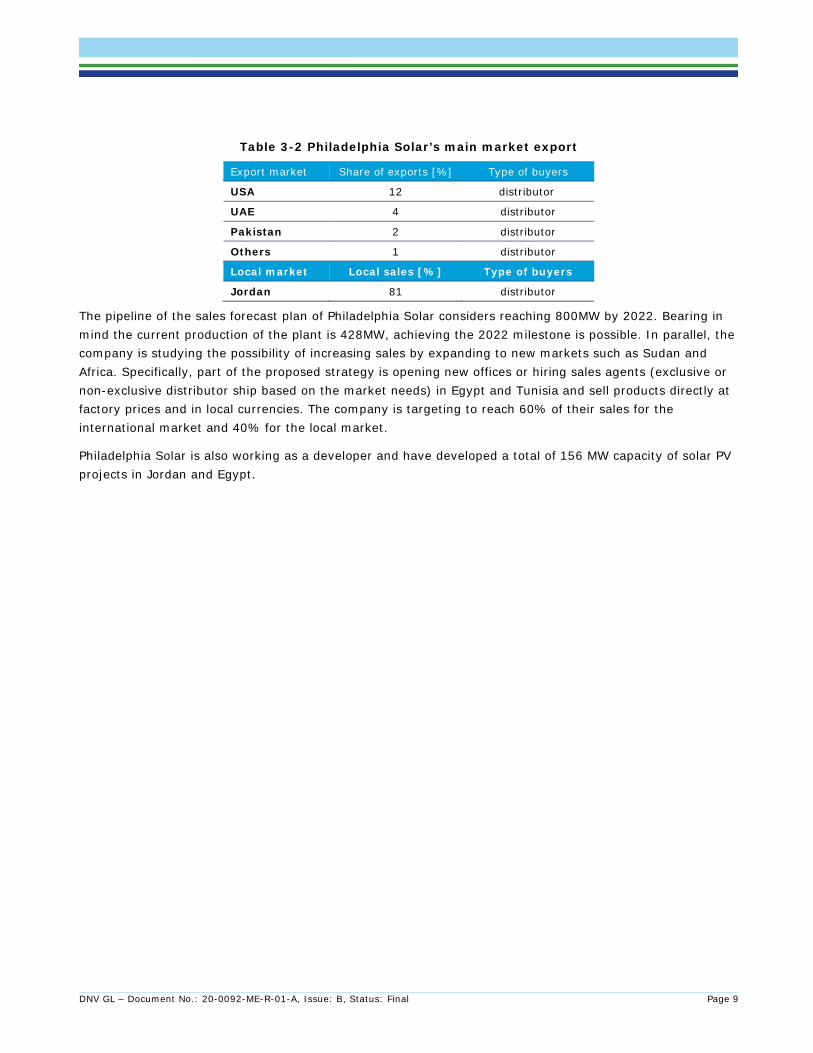
Table 3-2 Philadelphia Solar’s main market export
Export market Share of exports [%] Type of buyers
USA 12 distributor
UAE 4 distributor
Pakistan 2 distributor
Others 1 distributor
Local market Local sales [%] Type of buyers
Jordan 81 distributor
The pipeline of the sales forecast plan of Philadelphia Solar considers reaching 800MW by 2022. Bearing in mind the current production of the plant is 428MW, achieving the 2022 milestone is possible. In parallel, the company is studying the possibility of increasing sales by expanding to new markets such as Sudan and Africa. Specifically, part of the proposed strategy is opening new offices or hiring sales agents (exclusive or non-exclusive distributor ship based on the market needs) in Egypt and Tunisia and sell products directly at factory prices and in local currencies. The company is targeting to reach 60% of their sales for the international market and 40% for the local market.
Philadelphia Solar is also working as a developer and have developed a total of 156 MW capacity of solar PV projects in Jordan and Egypt.
DNV GL – Document No.: 20-0092-ME-R-01-A, Issue: B, Status: Final Page 10
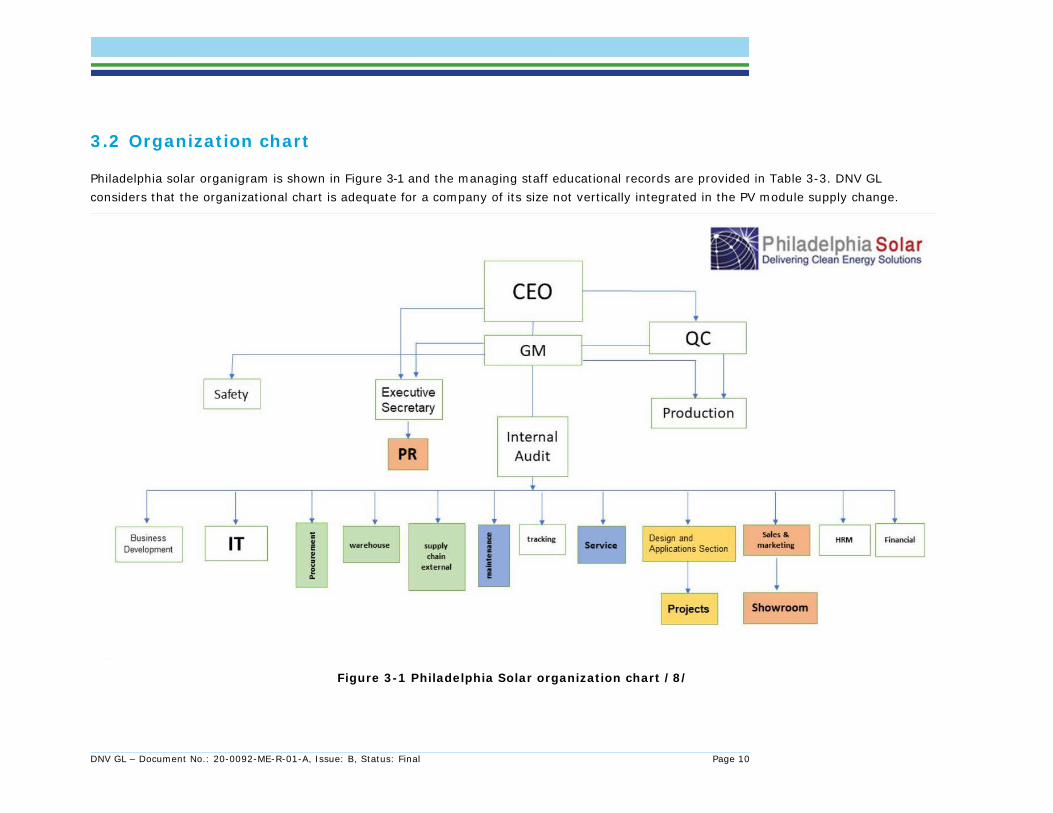
3.2 Organization chart
Philadelphia solar organigram is shown in Figure 3-1 and the managing staff educational records are provided in Table 3-3. DNV GL considers that the organizational chart is adequate for a company of its size not vertically integrated in the PV module supply change.
Figure 3-1 Philadelphia Solar organization chart /8/
DNV GL – Document No.: 20-0092-ME-R-01-A, Issue: B, Status: Final Page 11
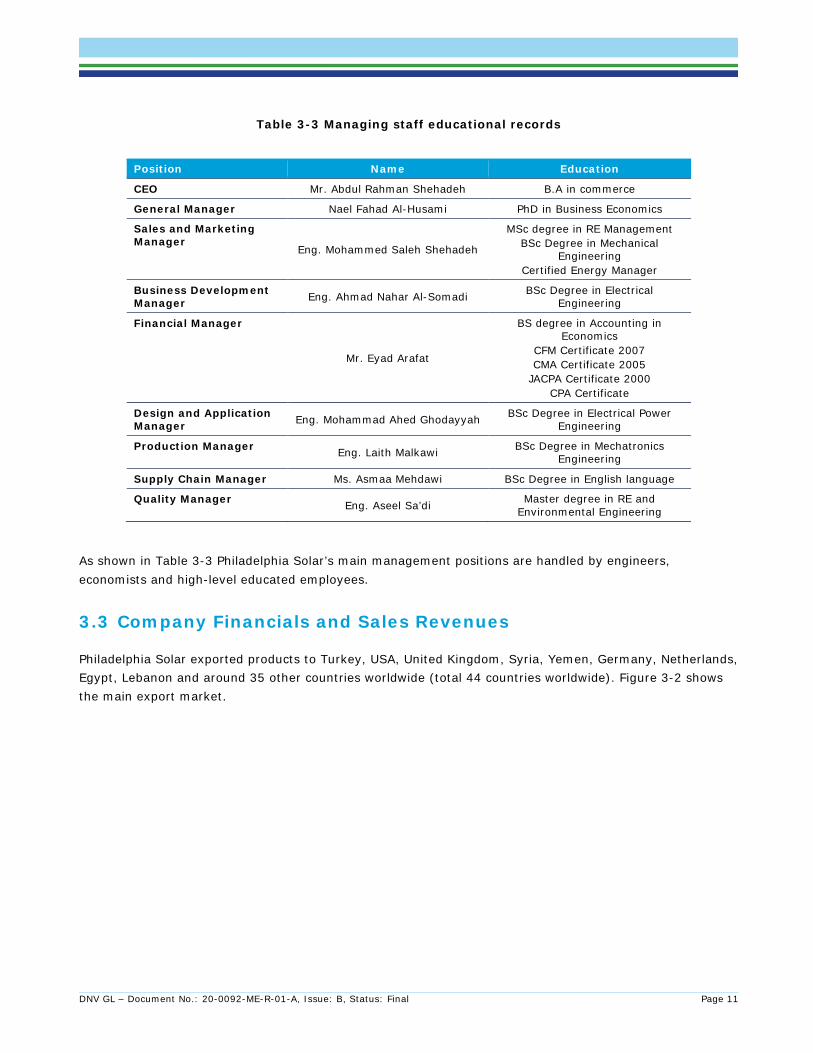
Table 3-3 Managing staff educational records
As shown in Table 3-3 Philadelphia Solar’s main management positions are handled by engineers, economists and high-level educated employees.
3.3 Company Financials and Sales Revenues
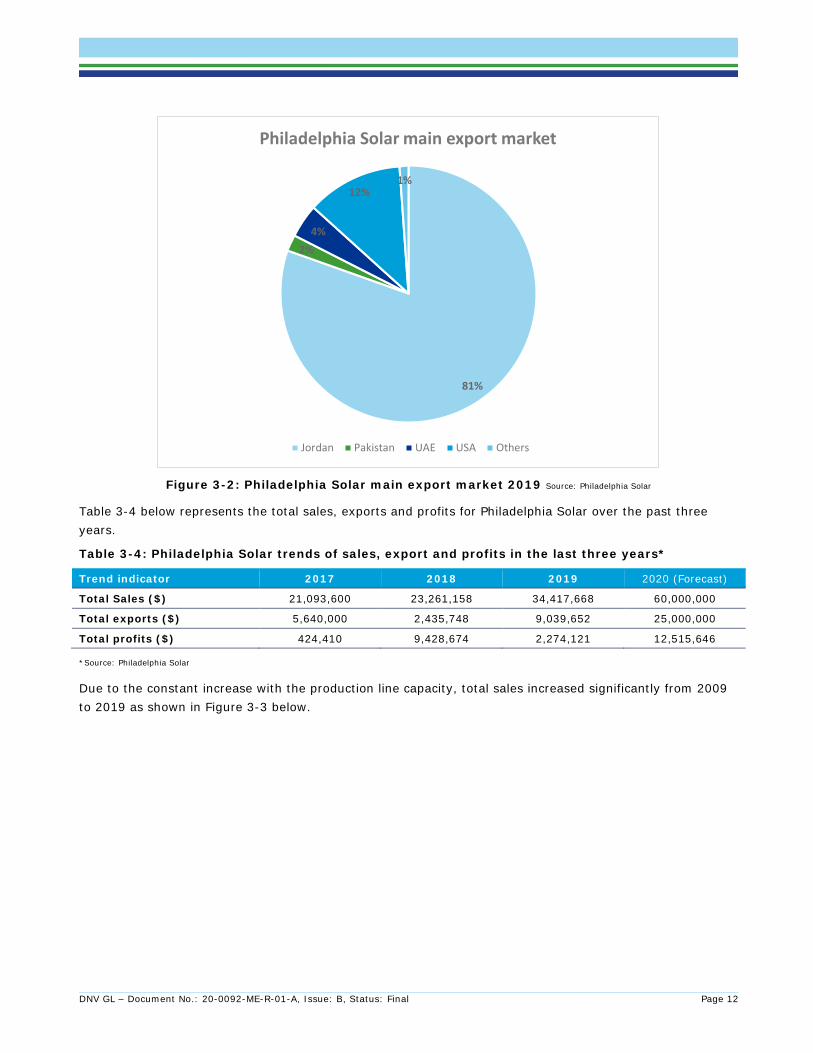
Philadelphia Solar exported products to Turkey, USA, United Kingdom, Syria, Yemen, Germany, Netherlands, Egypt, Lebanon and around 35 other countries worldwide (total 44 countries worldwide). Figure 3-2 shows the main export market.
Position Name Education
CEO Mr. Abdul Rahman Shehadeh B.A in commerce
General Manager Nael Fahad Al-Husami PhD in Business Economics
Sales and Marketing Manager
Eng. Mohammed Saleh Shehadeh
MSc degree in RE Management BSc Degree in Mechanical
Engineering Certified Energy Manager
Business Development Manager Eng. Ahmad Nahar Al-Somadi BSc Degree in Electrical
Engineering
Financial Manager
Mr. Eyad Arafat
BS degree in Accounting in Economics
CFM Certificate 2007 CMA Certificate 2005
JACPA Certificate 2000 CPA Certificate
Design and Application Manager Eng. Mohammad Ahed Ghodayyah BSc Degree in Electrical Power
Engineering
Production Manager Eng. Laith Malkawi BSc Degree in Mechatronics Engineering
Supply Chain Manager Ms. Asmaa Mehdawi BSc Degree in English language
Quality Manager Eng. Aseel Sa’di Master degree in RE and Environmental Engineering
DNV GL – Document No.: 20-0092-ME-R-01-A, Issue: B, Status: Final Page 12
Figure 3-2: Philadelphia Solar main export market 2019 Source: Philadelphia Solar
Table 3-4 below represents the total sales, exports and profits for Philadelphia Solar over the past three years.
Table 3-4: Philadelphia Solar trends of sales, export and profits in the last three years*
Trend indicator 2017 2018 2019 2020 (Forecast)
Total Sales ($) 21,093,600 23,261,158 34,417,668 60,000,000
Total exports ($) 5,640,000 2,435,748 9,039,652 25,000,000
Total profits ($) 424,410 9,428,674 2,274,121 12,515,646
*Source: Philadelphia Solar
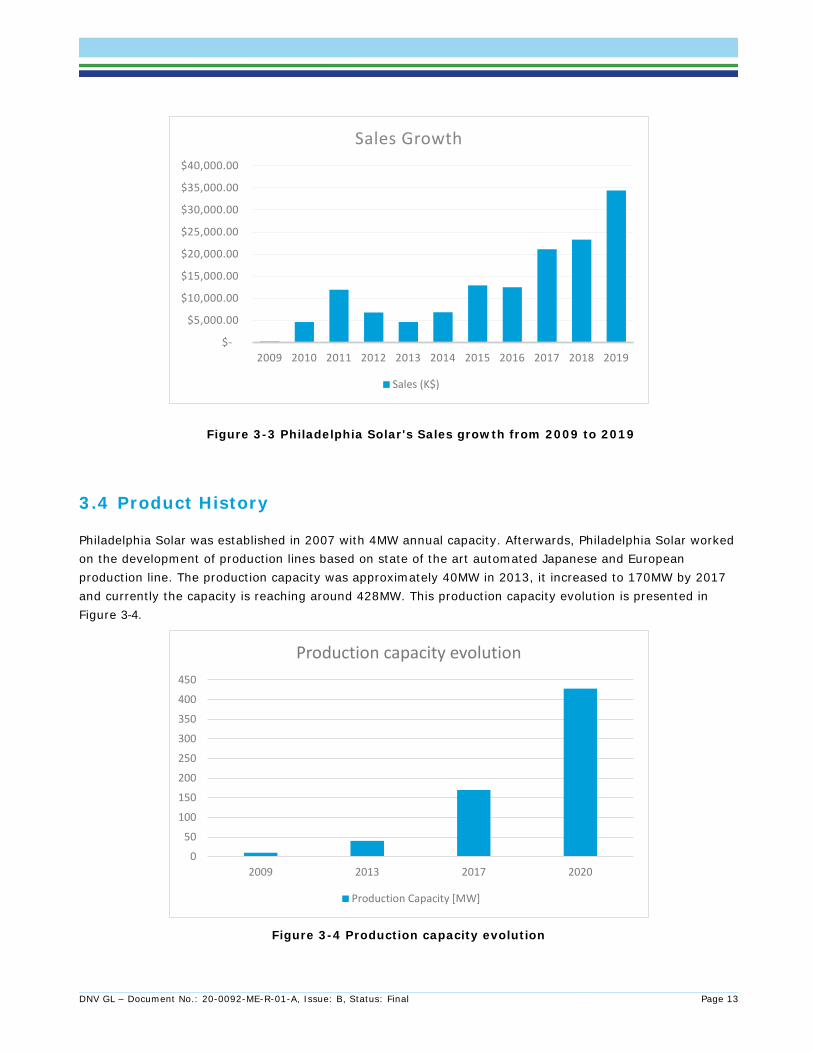
Due to the constant increase with the production line capacity, total sales increased significantly from 2009 to 2019 as shown in Figure 3-3 below.
81%
2%4%
12%1%
Philadelphia Solar main export market
Jordan Pakistan UAE USA Others
DNV GL – Document No.: 20-0092-ME-R-01-A, Issue: B, Status: Final Page 13
Figure 3-3 Philadelphia Solar's Sales growth from 2009 to 2019
3.4 Product History
Philadelphia Solar was established in 2007 with 4MW annual capacity. Afterwards, Philadelphia Solar worked on the development of production lines based on state of the art automated Japanese and European production line. The production capacity was approximately 40MW in 2013, it increased to 170MW by 2017 and currently the capacity is reaching around 428MW. This production capacity evolution is presented in Figure 3-4.
Figure 3-4 Production capacity evolution
$-
$5,000.00
$10,000.00
$15,000.00
$20,000.00
$25,000.00
$30,000.00
$35,000.00
$40,000.00
2009 2010 2011 2012 2013 2014 2015 2016 2017 2018 2019
Sales Growth
Sales (K$)
0
50
100
150
200
250
300
350
400
450
2009 2013 2017 2020
Production capacity evolution
Production Capacity [MW]
DNV GL – Document No.: 20-0092-ME-R-01-A, Issue: B, Status: Final Page 14
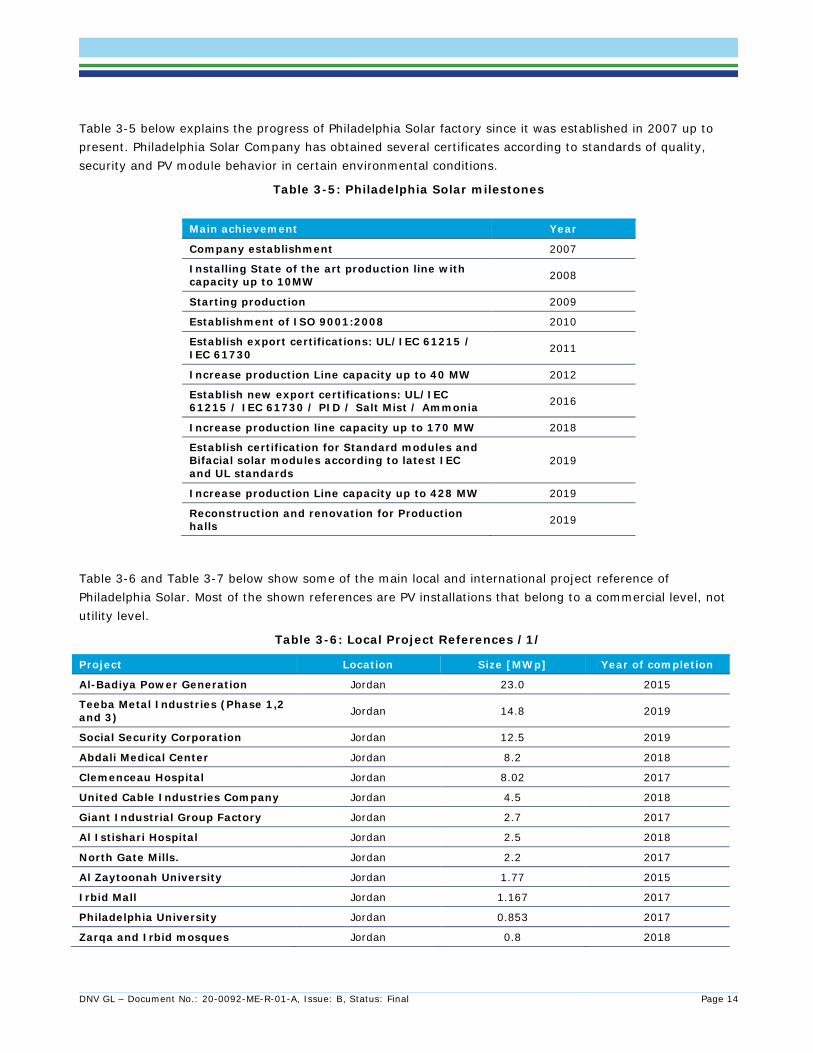
Table 3-5 below explains the progress of Philadelphia Solar factory since it was established in 2007 up to present. Philadelphia Solar Company has obtained several certificates according to standards of quality, security and PV module behavior in certain environmental conditions.
Table 3-5: Philadelphia Solar milestones
Main achievement Year
Company establishment 2007
Installing State of the art production line with capacity up to 10MW 2008
Starting production 2009
Establishment of ISO 9001:2008 2010
Establish export certifications: UL/IEC 61215 / IEC 61730 2011
Increase production Line capacity up to 40 MW 2012
Establish new export certifications: UL/IEC 61215 / IEC 61730 / PID / Salt Mist / Ammonia 2016
Increase production line capacity up to 170 MW 2018
Establish certification for Standard modules and Bifacial solar modules according to latest IEC and UL standards
2019
Increase production Line capacity up to 428 MW 2019
Reconstruction and renovation for Production halls 2019
Table 3-6 and Table 3-7 below show some of the main local and international project reference of Philadelphia Solar. Most of the shown references are PV installations that belong to a commercial level, not utility level.
Table 3-6: Local Project References /1/
Project Location Size [MWp] Year of completion
Al-Badiya Power Generation Jordan 23.0 2015
Teeba Metal Industries (Phase 1,2 and 3) Jordan 14.8 2019
Social Security Corporation Jordan 12.5 2019
Abdali Medical Center Jordan 8.2 2018
Clemenceau Hospital Jordan 8.02 2017
United Cable Industries Company Jordan 4.5 2018
Giant Industrial Group Factory Jordan 2.7 2017
Al Istishari Hospital Jordan 2.5 2018
North Gate Mills. Jordan 2.2 2017
Al Zaytoonah University Jordan 1.77 2015
Irbid Mall Jordan 1.167 2017
Philadelphia University Jordan 0.853 2017
Zarqa and Irbid mosques Jordan 0.8 2018
DNV GL – Document No.: 20-0092-ME-R-01-A, Issue: B, Status: Final Page 15
Children’s Museum Jordan 0.42 2014
Water authority Jordan 0.24 2014
TOTAL 116.64
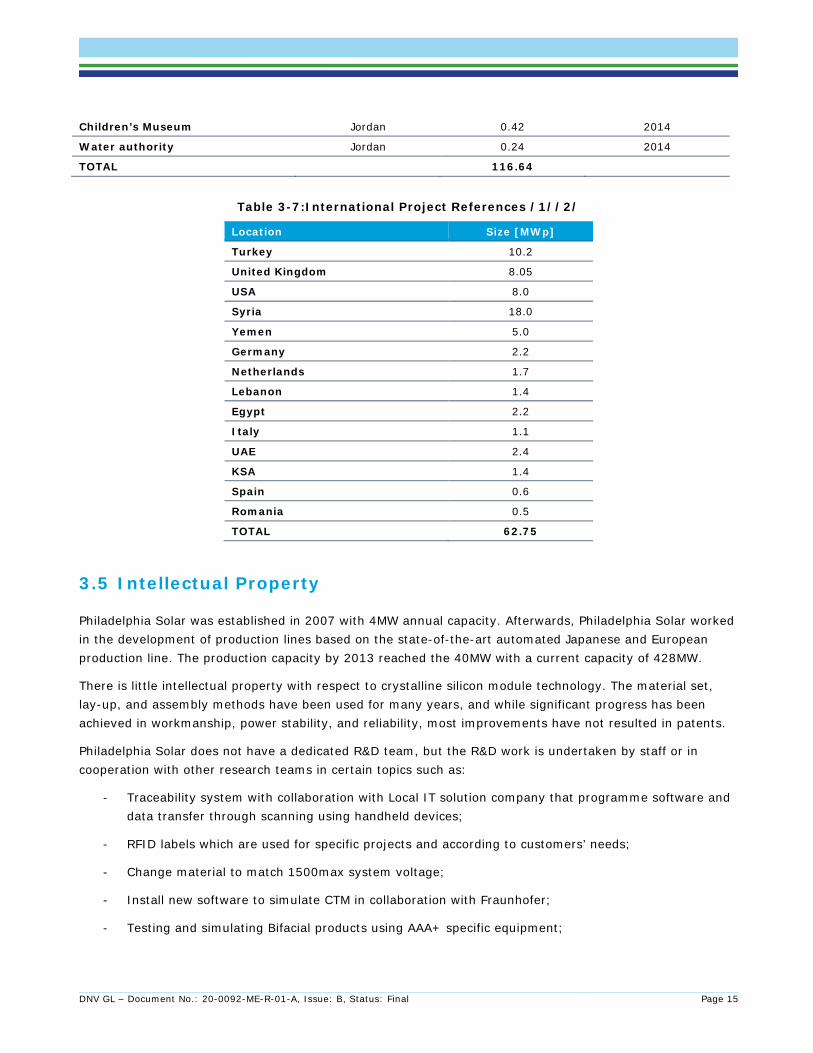
Table 3-7:International Project References /1//2/
Location Size [MWp]
Turkey 10.2
United Kingdom 8.05
USA 8.0
Syria 18.0
Yemen 5.0
Germany 2.2
Netherlands 1.7
Lebanon 1.4
Egypt 2.2
Italy 1.1
UAE 2.4
KSA 1.4
Spain 0.6
Romania 0.5
TOTAL 62.75
3.5 Intellectual Property
Philadelphia Solar was established in 2007 with 4MW annual capacity. Afterwards, Philadelphia Solar worked in the development of production lines based on the state-of-the-art automated Japanese and European production line. The production capacity by 2013 reached the 40MW with a current capacity of 428MW.
There is little intellectual property with respect to crystalline silicon module technology. The material set, lay-up, and assembly methods have been used for many years, and while significant progress has been achieved in workmanship, power stability, and reliability, most improvements have not resulted in patents.
Philadelphia Solar does not have a dedicated R&D team, but the R&D work is undertaken by staff or in cooperation with other research teams in certain topics such as:
- Traceability system with collaboration with Local IT solution company that programme software and data transfer through scanning using handheld devices;
- RFID labels which are used for specific projects and according to customers’ needs;
- Change material to match 1500max system voltage;
- Install new software to simulate CTM in collaboration with Fraunhofer;
- Testing and simulating Bifacial products using AAA+ specific equipment;
DNV GL – Document No.: 20-0092-ME-R-01-A, Issue: B, Status: Final Page 16
- Using highest technology cells larger than normal cells to increase overall efficiency (M3 size cells);
- Using White EVA after testing and finding power gain up to 3 Watt;
- Optimizing space distances between cells to reduce losses;
- Optimizing bussing ribbons thicknesses and width to reduce losses;
- Developing proper packaging and pallet dimensions; and
- Provide Testing services in Philadelphia Solar laboratories such as (visual inspection, EL Test, Wet Hipot and Flash testing).
This is not the best situation for R&D work, but it is considered acceptable for a non-vertical integrated PV module manufacturer. If Philadelphia Solar develops to manufacturer cells in the future, then the R&D will be necessary to increase the efficiency every year as per market demanding criteria.
DNV GL recommends implementing a program for R&D activities focused on quality control. DNV GL considers that the R&D activities of Philadelphia Solar would require an extra effort to keep their quality unaffected by future expansion.
3.6 Philadelphia solar in the market
Nowadays the main PV module technologies present in the market are Crystalline silicon, thin film and hybrid HIT cells.
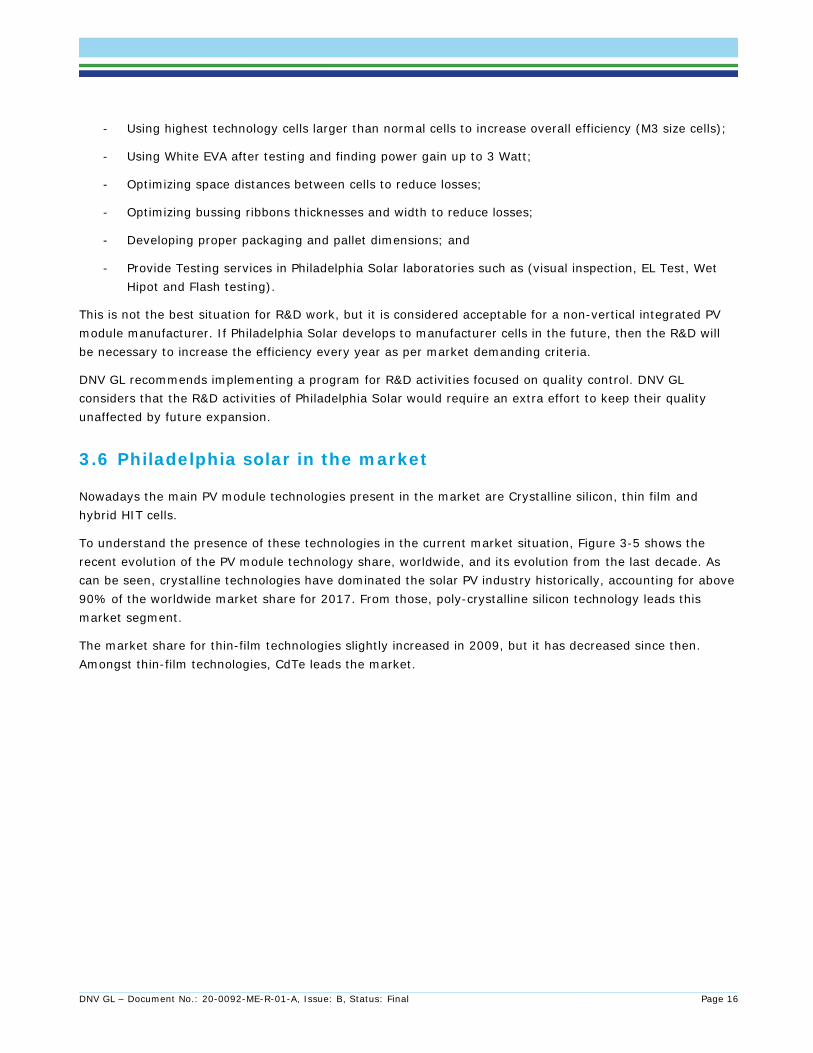
To understand the presence of these technologies in the current market situation, Figure 3-5 shows the recent evolution of the PV module technology share, worldwide, and its evolution from the last decade. As can be seen, crystalline technologies have dominated the solar PV industry historically, accounting for above 90% of the worldwide market share for 2017. From those, poly-crystalline silicon technology leads this market segment.
The market share for thin-film technologies slightly increased in 2009, but it has decreased since then. Amongst thin-film technologies, CdTe leads the market.
DNV GL – Document No.: 20-0092-ME-R-01-A, Issue: B, Status: Final Page 17
Figure 3-5: PV cell technology shares 1980-2017 source: ISE Fraunhofer
The above trend is expected to continue in the coming years, with the crystalline technologies clearly dominating the market. The production capacity of crystalline silicon PV modules is expected to continue growing steadily, whilst thin-film production is expected to remain stable.
Regarding the origin of the technology, most of the manufacturing capacity and production is concentrated in Asia, with a focus on China, for c-Si technologies especially. In the case of thin film, an important share of the production capacity remains in the Asia Pacific Region (APAC), where several Japanese manufacturers are based.
Table 3-8 shows the ranking of module manufacturers in 2019, regarding shipments. Most of the companies listed are Chinese c-Si manufacturers.
Table 3-8: Ranking of module suppliers worldwide for 2019
Rank Module supplier Change from 2018
1 Jinko Solar 1
2 JA Solar 3
3 Trina Solar 2
4 LONGi Solar 7
5 Canadian Solar 4
6 Hanwha Q Cells 5
7 Risen Energy 8
8 GCL 6
9 Talesum -
10 First Solar -
Source: DNV GL´s review of publicly available information
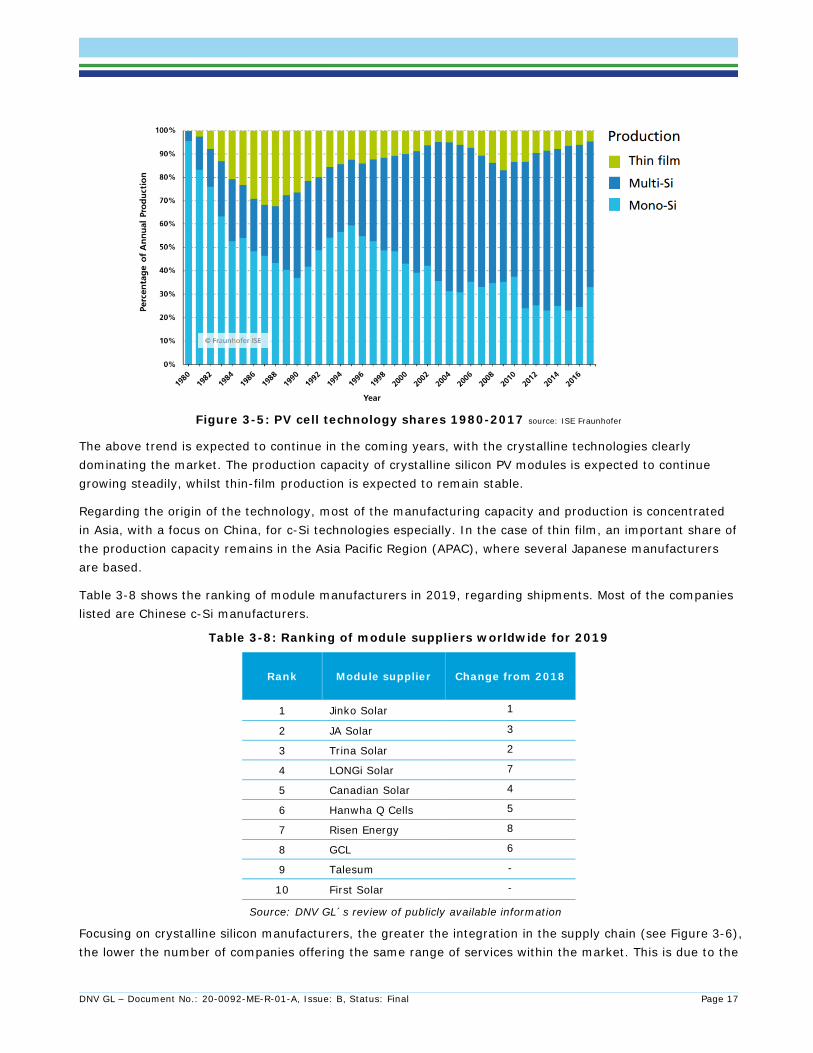
Focusing on crystalline silicon manufacturers, the greater the integration in the supply chain (see Figure 3-6), the lower the number of companies offering the same range of services within the market. This is due to the
DNV GL – Document No.: 20-0092-ME-R-01-A, Issue: B, Status: Final Page 18
high investment required, as well as to other technical, environmental and administrative issues that may arise in the execution of the entire infrastructure required for complete vertical integration of the company.
Figure 3-6: Complete silicon crystalline supply chain
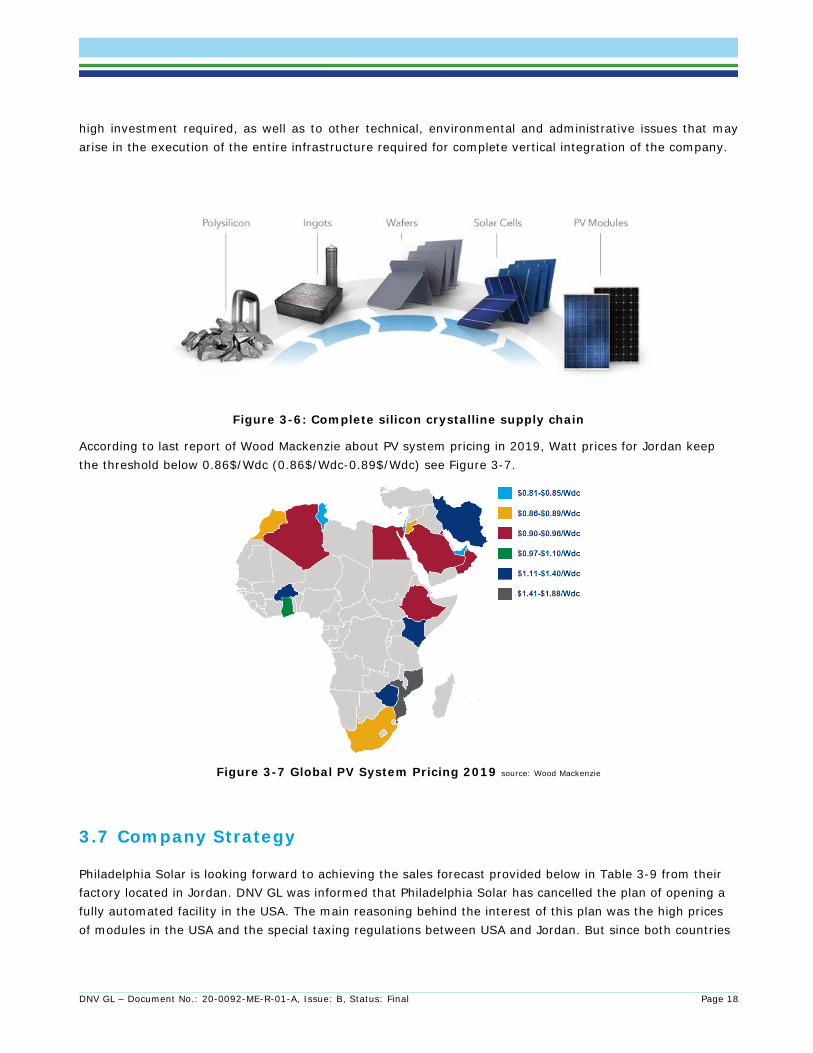
According to last report of Wood Mackenzie about PV system pricing in 2019, Watt prices for Jordan keep the threshold below 0.86$/Wdc (0.86$/Wdc-0.89$/Wdc) see Figure 3-7.
Figure 3-7 Global PV System Pricing 2019 source: Wood Mackenzie
3.7 Company Strategy
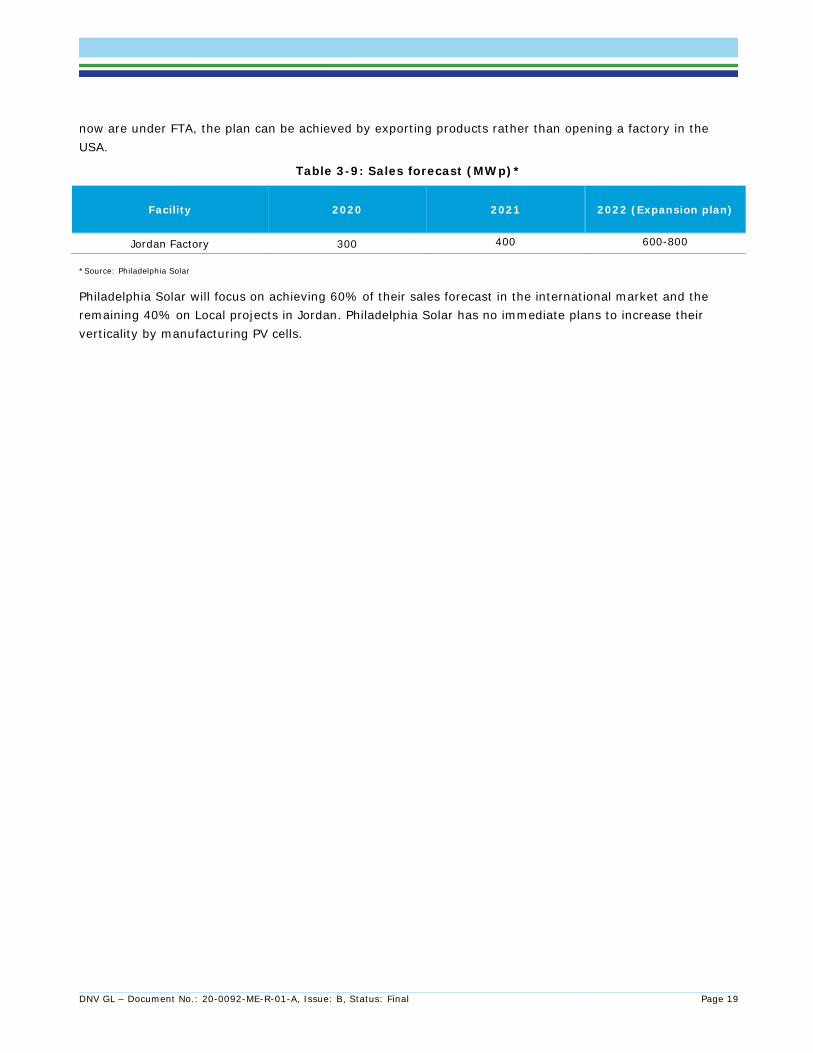
Philadelphia Solar is looking forward to achieving the sales forecast provided below in Table 3-9 from their factory located in Jordan. DNV GL was informed that Philadelphia Solar has cancelled the plan of opening a fully automated facility in the USA. The main reasoning behind the interest of this plan was the high prices of modules in the USA and the special taxing regulations between USA and Jordan. But since both countries
DNV GL – Document No.: 20-0092-ME-R-01-A, Issue: B, Status: Final Page 19
now are under FTA, the plan can be achieved by exporting products rather than opening a factory in the USA.
Table 3-9: Sales forecast (MWp)*
Facility 2020 2021 2022 (Expansion plan)
Jordan Factory 300 400 600-800
*Source: Philadelphia Solar
Philadelphia Solar will focus on achieving 60% of their sales forecast in the international market and the remaining 40% on Local projects in Jordan. Philadelphia Solar has no immediate plans to increase their verticality by manufacturing PV cells.
DNV GL – Document No.: 20-0092-ME-R-01-A, Issue: B, Status: Final Page 20
4 TECHNICAL EVALUATION
4.1 Product Evaluation
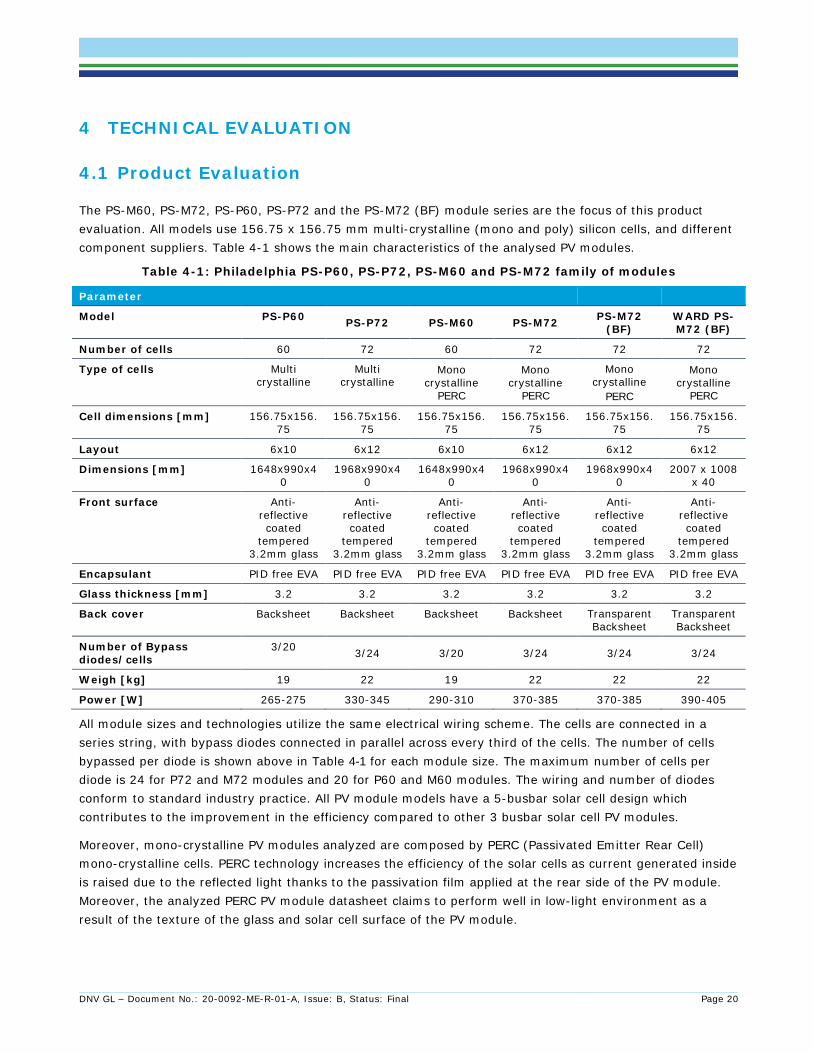
The PS-M60, PS-M72, PS-P60, PS-P72 and the PS-M72 (BF) module series are the focus of this product evaluation. All models use 156.75 x 156.75 mm multi-crystalline (mono and poly) silicon cells, and different component suppliers. Table 4-1 shows the main characteristics of the analysed PV modules.
Table 4-1: Philadelphia PS-P60, PS-P72, PS-M60 and PS-M72 family of modules
Parameter
Model PS-P60 PS-P72 PS-M60 PS-M72 PS-M72 (BF)
WARD PS-M72 (BF)
Number of cells 60 72 60 72 72 72
Type of cells Multi crystalline
Multi crystalline
Mono crystalline
PERC
Mono crystalline
PERC
Mono crystalline
PERC
Mono crystalline
PERC
Cell dimensions [mm] 156.75x156.75
156.75x156.75
156.75x156.75
156.75x156.75
156.75x156.75
156.75x156.75
Layout 6x10 6x12 6x10 6x12 6x12 6x12
Dimensions [mm] 1648x990x40
1968x990x40
1648x990x40
1968x990x40
1968x990x40
2007 x 1008 x 40
Front surface Anti-reflective coated
tempered 3.2mm glass
Anti-reflective coated
tempered 3.2mm glass
Anti-reflective coated
tempered 3.2mm glass
Anti-reflective coated
tempered 3.2mm glass
Anti-reflective coated
tempered 3.2mm glass
Anti-reflective coated
tempered 3.2mm glass
Encapsulant PID free EVA PID free EVA PID free EVA PID free EVA PID free EVA PID free EVA
Glass thickness [mm] 3.2 3.2 3.2 3.2 3.2 3.2
Back cover Backsheet Backsheet Backsheet Backsheet Transparent Backsheet
Transparent Backsheet
Number of Bypass diodes/cells
3/20 3/24 3/20 3/24 3/24 3/24
Weigh [kg] 19 22 19 22 22 22
Power [W] 265-275 330-345 290-310 370-385 370-385 390-405
All module sizes and technologies utilize the same electrical wiring scheme. The cells are connected in a series string, with bypass diodes connected in parallel across every third of the cells. The number of cells bypassed per diode is shown above in Table 4-1 for each module size. The maximum number of cells per diode is 24 for P72 and M72 modules and 20 for P60 and M60 modules. The wiring and number of diodes conform to standard industry practice. All PV module models have a 5-busbar solar cell design which contributes to the improvement in the efficiency compared to other 3 busbar solar cell PV modules.
Moreover, mono-crystalline PV modules analyzed are composed by PERC (Passivated Emitter Rear Cell) mono-crystalline cells. PERC technology increases the efficiency of the solar cells as current generated inside is raised due to the reflected light thanks to the passivation film applied at the rear side of the PV module. Moreover, the analyzed PERC PV module datasheet claims to perform well in low-light environment as a result of the texture of the glass and solar cell surface of the PV module.
DNV GL – Document No.: 20-0092-ME-R-01-A, Issue: B, Status: Final Page 21
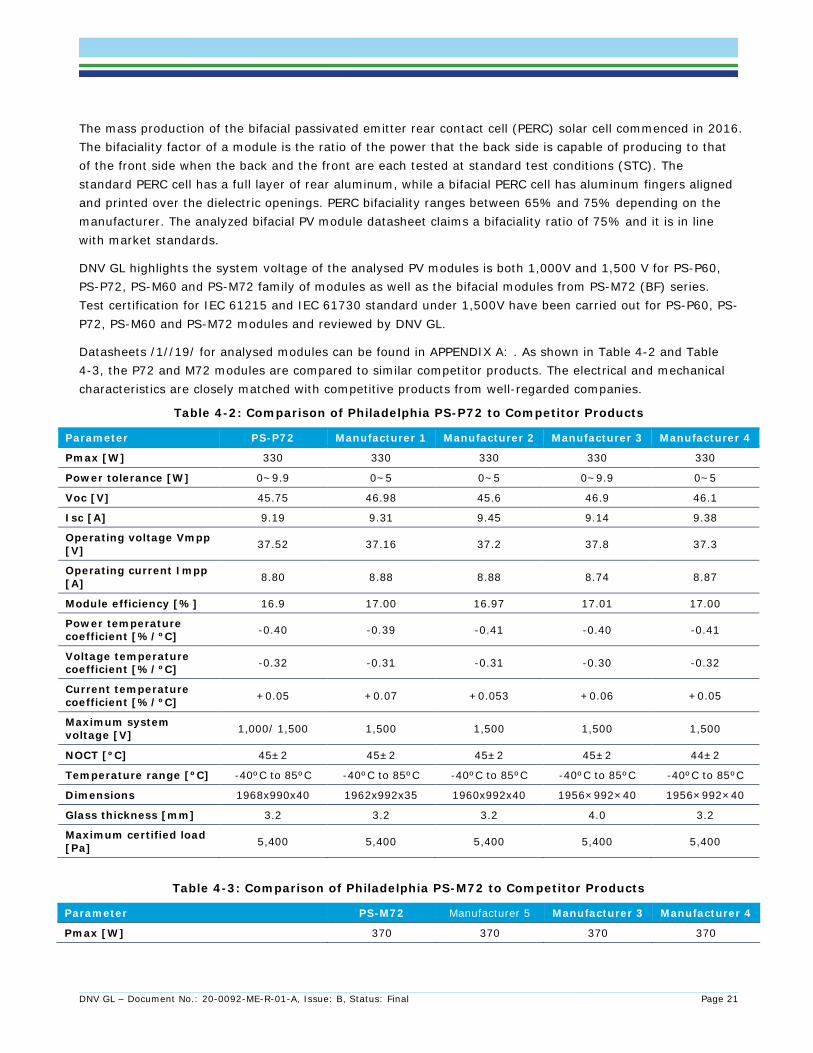
The mass production of the bifacial passivated emitter rear contact cell (PERC) solar cell commenced in 2016. The bifaciality factor of a module is the ratio of the power that the back side is capable of producing to that of the front side when the back and the front are each tested at standard test conditions (STC). The standard PERC cell has a full layer of rear aluminum, while a bifacial PERC cell has aluminum fingers aligned and printed over the dielectric openings. PERC bifaciality ranges between 65% and 75% depending on the manufacturer. The analyzed bifacial PV module datasheet claims a bifaciality ratio of 75% and it is in line with market standards.
DNV GL highlights the system voltage of the analysed PV modules is both 1,000V and 1,500 V for PS-P60, PS-P72, PS-M60 and PS-M72 family of modules as well as the bifacial modules from PS-M72 (BF) series. Test certification for IEC 61215 and IEC 61730 standard under 1,500V have been carried out for PS-P60, PS-P72, PS-M60 and PS-M72 modules and reviewed by DNV GL.
Datasheets /1//19/ for analysed modules can be found in APPENDIX A: . As shown in Table 4-2 and Table 4-3, the P72 and M72 modules are compared to similar competitor products. The electrical and mechanical characteristics are closely matched with competitive products from well-regarded companies.
Table 4-2: Comparison of Philadelphia PS-P72 to Competitor Products
Parameter PS-P72 Manufacturer 1 Manufacturer 2 Manufacturer 3 Manufacturer 4
Pmax [W] 330 330 330 330 330
Power tolerance [W] 0~9.9 0~5 0~5 0~9.9 0~5
Voc [V] 45.75 46.98 45.6 46.9 46.1
Isc [A] 9.19 9.31 9.45 9.14 9.38
Operating voltage Vmpp [V] 37.52 37.16 37.2 37.8 37.3
Operating current Impp [A] 8.80 8.88 8.88 8.74 8.87
Module efficiency [%] 16.9 17.00 16.97 17.01 17.00
Power temperature coefficient [%/ºC] -0.40 -0.39 -0.41 -0.40 -0.41
Voltage temperature coefficient [%/ºC] -0.32 -0.31 -0.31 -0.30 -0.32
Current temperature coefficient [%/ºC] +0.05 +0.07 +0.053 +0.06 +0.05
Maximum system voltage [V] 1,000/ 1,500 1,500 1,500 1,500 1,500
NOCT [ºC] 45±2 45±2 45±2 45±2 44±2
Temperature range [ºC] -40ºC to 85ºC -40ºC to 85ºC -40ºC to 85ºC -40ºC to 85ºC -40ºC to 85ºC
Dimensions 1968x990x40 1962x992x35 1960x992x40 1956×992×40 1956×992×40
Glass thickness [mm] 3.2 3.2 3.2 4.0 3.2
Maximum certified load [Pa] 5,400 5,400 5,400 5,400 5,400
Table 4-3: Comparison of Philadelphia PS-M72 to Competitor Products
Parameter PS-M72 Manufacturer 5 Manufacturer 3 Manufacturer 4
Pmax [W] 370 370 370 370
DNV GL – Document No.: 20-0092-ME-R-01-A, Issue: B, Status: Final Page 22
Parameter PS-M72 Manufacturer 5 Manufacturer 3 Manufacturer 4
Power tolerance [W] 0~11.1 0~5.0 0~11.1 0~5.0
Voc [V] 48.24 47.50 48.5 48.3
Isc [A] 9.82 9.97 9.61 9.83
Operating voltage Vmpp [V] 39.62 39.3 39.9 39.7
Operating current Impp [A] 9.34 9.44 9.28 9.33
Module efficiency [%] 19.00 19.10 18.66 19.00
Power temperature coefficient [%/ºC] -0.39 -0.39 -0.37 -0.39
Voltage temperature coefficient [%/ºC] -0.30 -0.29 -0.28 -0.29
Current temperature coefficient [%/ºC] +0.06 +0.05 +0.048 +0.05
Maximum system voltage [V] 1,000/ 1500 1,000 / 1,500 1,000 1,500
NOCT [ºC] 45±2 44±2 45±2 44±2
Temperature range [ºC] -40ºC to 85ºC -40ºC to 85ºC -40ºC to 85ºC -40ºC to 85ºC
Dimensions 1968x990x40 1956x992x40 1979×1002×40 1960×992×40
Glass thickness [mm] 3.2 3.2 3.2 3.2
Maximum certified load [Pa] 5,400 5,400 5,400 5,400
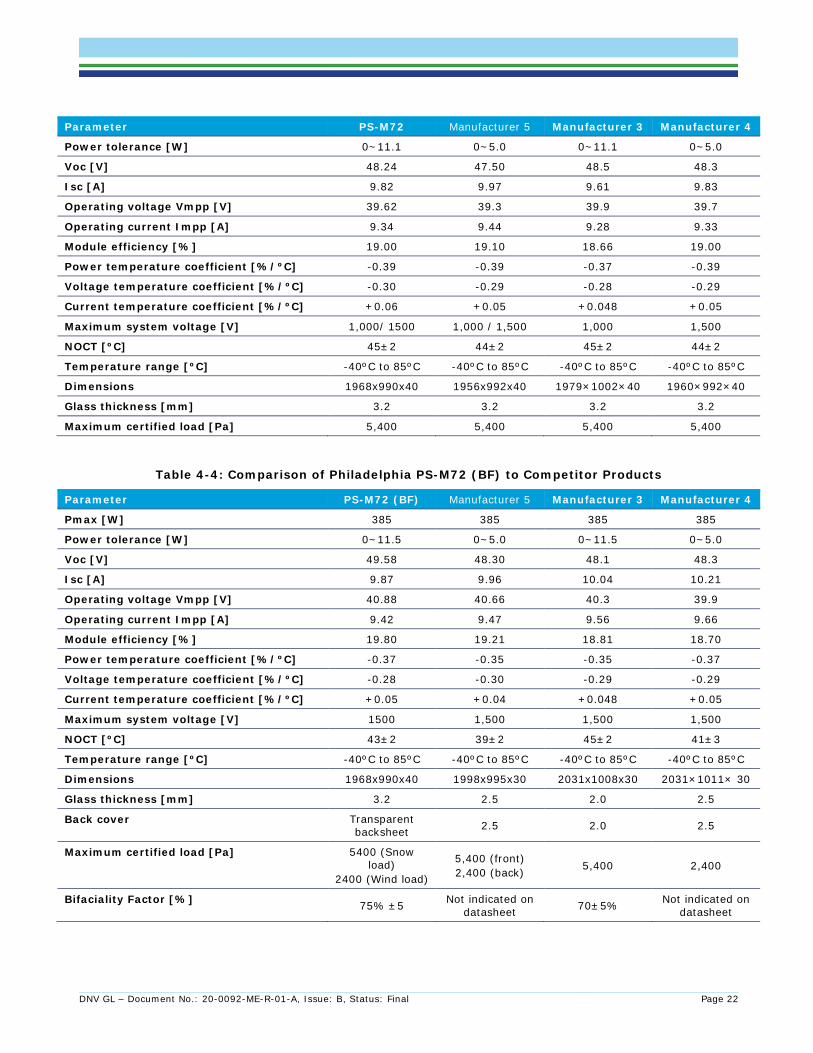
Table 4-4: Comparison of Philadelphia PS-M72 (BF) to Competitor Products
Parameter PS-M72 (BF) Manufacturer 5 Manufacturer 3 Manufacturer 4
Pmax [W] 385 385 385 385
Power tolerance [W] 0~11.5 0~5.0 0~11.5 0~5.0
Voc [V] 49.58 48.30 48.1 48.3
Isc [A] 9.87 9.96 10.04 10.21
Operating voltage Vmpp [V] 40.88 40.66 40.3 39.9
Operating current Impp [A] 9.42 9.47 9.56 9.66
Module efficiency [%] 19.80 19.21 18.81 18.70
Power temperature coefficient [%/ºC] -0.37 -0.35 -0.35 -0.37
Voltage temperature coefficient [%/ºC] -0.28 -0.30 -0.29 -0.29
Current temperature coefficient [%/ºC] +0.05 +0.04 +0.048 +0.05
Maximum system voltage [V] 1500 1,500 1,500 1,500
NOCT [ºC] 43±2 39±2 45±2 41±3
Temperature range [ºC] -40ºC to 85ºC -40ºC to 85ºC -40ºC to 85ºC -40ºC to 85ºC
Dimensions 1968x990x40 1998x995x30 2031x1008x30 2031×1011× 30
Glass thickness [mm] 3.2 2.5 2.0 2.5
Back cover Transparent backsheet 2.5 2.0 2.5
Maximum certified load [Pa] 5400 (Snow load)
2400 (Wind load)
5,400 (front) 2,400 (back) 5,400 2,400
Bifaciality Factor [%] 75% ±5 Not indicated on datasheet 70±5% Not indicated on
datasheet
DNV GL – Document No.: 20-0092-ME-R-01-A, Issue: B, Status: Final Page 23
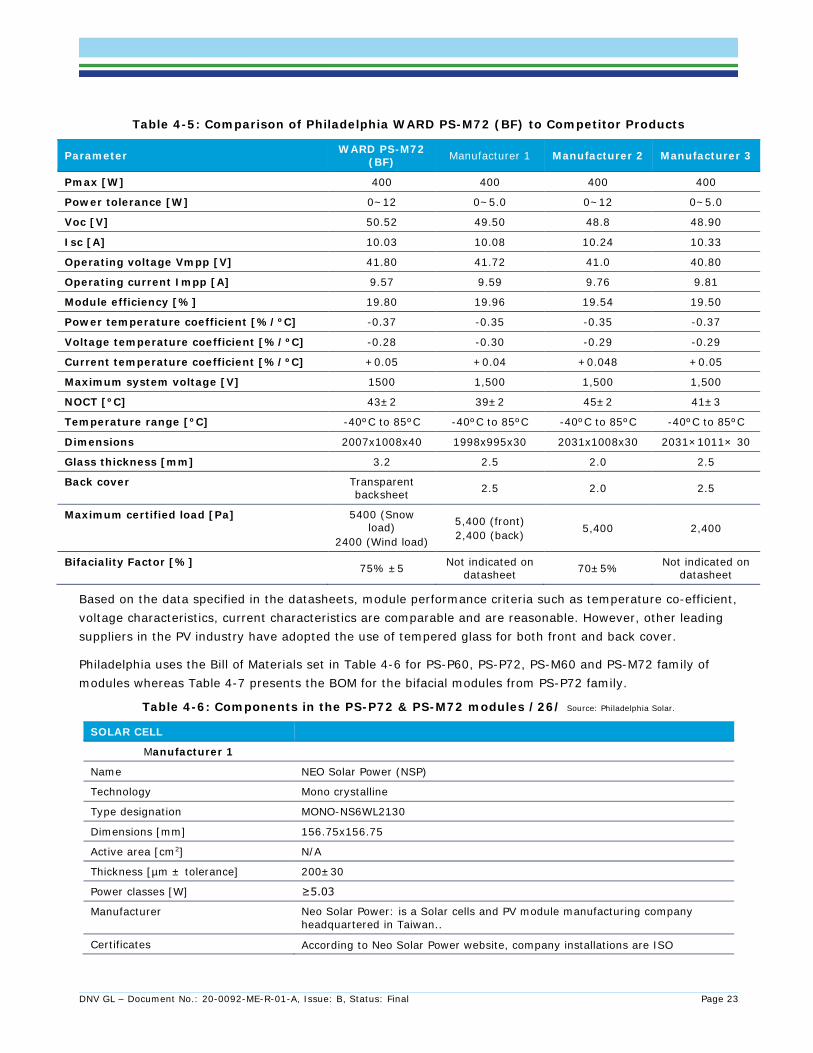
Table 4-5: Comparison of Philadelphia WARD PS-M72 (BF) to Competitor Products
Parameter WARD PS-M72 (BF) Manufacturer 1 Manufacturer 2 Manufacturer 3
Pmax [W] 400 400 400 400
Power tolerance [W] 0~12 0~5.0 0~12 0~5.0
Voc [V] 50.52 49.50 48.8 48.90
Isc [A] 10.03 10.08 10.24 10.33
Operating voltage Vmpp [V] 41.80 41.72 41.0 40.80
Operating current Impp [A] 9.57 9.59 9.76 9.81
Module efficiency [%] 19.80 19.96 19.54 19.50
Power temperature coefficient [%/ºC] -0.37 -0.35 -0.35 -0.37
Voltage temperature coefficient [%/ºC] -0.28 -0.30 -0.29 -0.29
Current temperature coefficient [%/ºC] +0.05 +0.04 +0.048 +0.05
Maximum system voltage [V] 1500 1,500 1,500 1,500
NOCT [ºC] 43±2 39±2 45±2 41±3
Temperature range [ºC] -40ºC to 85ºC -40ºC to 85ºC -40ºC to 85ºC -40ºC to 85ºC
Dimensions 2007x1008x40 1998x995x30 2031x1008x30 2031×1011× 30
Glass thickness [mm] 3.2 2.5 2.0 2.5
Back cover Transparent backsheet 2.5 2.0 2.5
Maximum certified load [Pa] 5400 (Snow load)
2400 (Wind load)
5,400 (front) 2,400 (back) 5,400 2,400
Bifaciality Factor [%] 75% ±5 Not indicated on datasheet 70±5% Not indicated on
datasheet
Based on the data specified in the datasheets, module performance criteria such as temperature co-efficient, voltage characteristics, current characteristics are comparable and are reasonable. However, other leading suppliers in the PV industry have adopted the use of tempered glass for both front and back cover.
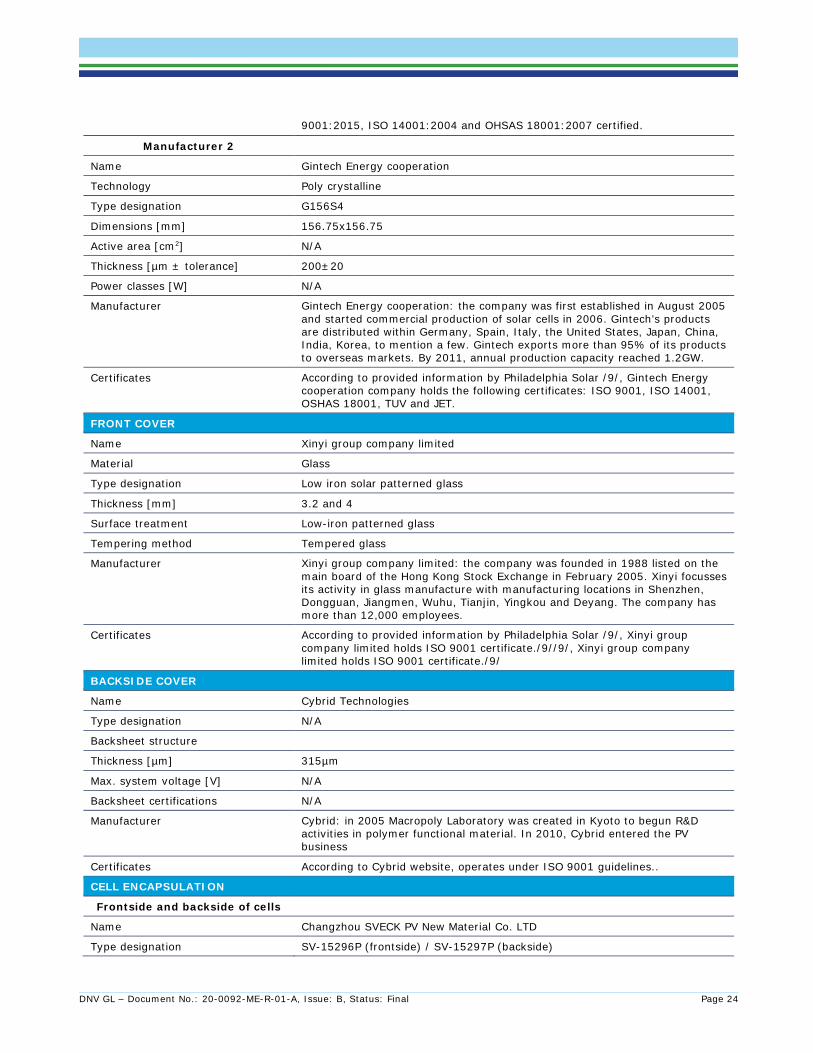
Philadelphia uses the Bill of Materials set in Table 4-6 for PS-P60, PS-P72, PS-M60 and PS-M72 family of modules whereas Table 4-7 presents the BOM for the bifacial modules from PS-P72 family.
Table 4-6: Components in the PS-P72 & PS-M72 modules /26/ Source: Philadelphia Solar.
SOLAR CELL
Manufacturer 1
Name NEO Solar Power (NSP)
Technology Mono crystalline
Type designation MONO-NS6WL2130
Dimensions [mm] 156.75x156.75
Active area [cm2] N/A
Thickness [µm ± tolerance] 200±30
Power classes [W] ≥5.03
Manufacturer Neo Solar Power: is a Solar cells and PV module manufacturing company headquartered in Taiwan..
Certificates According to Neo Solar Power website, company installations are ISO
DNV GL – Document No.: 20-0092-ME-R-01-A, Issue: B, Status: Final Page 24
9001:2015, ISO 14001:2004 and OHSAS 18001:2007 certified.
Manufacturer 2
Name Gintech Energy cooperation
Technology Poly crystalline
Type designation G156S4
Dimensions [mm] 156.75x156.75
Active area [cm2] N/A
Thickness [µm ± tolerance] 200±20
Power classes [W] N/A
Manufacturer Gintech Energy cooperation: the company was first established in August 2005 and started commercial production of solar cells in 2006. Gintech’s products are distributed within Germany, Spain, Italy, the United States, Japan, China, India, Korea, to mention a few. Gintech exports more than 95% of its products to overseas markets. By 2011, annual production capacity reached 1.2GW.
Certificates According to provided information by Philadelphia Solar /9/, Gintech Energy cooperation company holds the following certificates: ISO 9001, ISO 14001, OSHAS 18001, TUV and JET.
FRONT COVER
Name Xinyi group company limited
Material Glass
Type designation Low iron solar patterned glass
Thickness [mm] 3.2 and 4
Surface treatment Low-iron patterned glass
Tempering method Tempered glass
Manufacturer Xinyi group company limited: the company was founded in 1988 listed on the main board of the Hong Kong Stock Exchange in February 2005. Xinyi focusses its activity in glass manufacture with manufacturing locations in Shenzhen, Dongguan, Jiangmen, Wuhu, Tianjin, Yingkou and Deyang. The company has more than 12,000 employees.
Certificates According to provided information by Philadelphia Solar /9/, Xinyi group company limited holds ISO 9001 certificate./9//9/, Xinyi group company limited holds ISO 9001 certificate./9/
BACKSIDE COVER
Name Cybrid Technologies
Type designation N/A
Backsheet structure
Thickness [µm] 315µm
Max. system voltage [V] N/A
Backsheet certifications N/A
Manufacturer Cybrid: in 2005 Macropoly Laboratory was created in Kyoto to begun R&D activities in polymer functional material. In 2010, Cybrid entered the PV business
Certificates According to Cybrid website, operates under ISO 9001 guidelines..
CELL ENCAPSULATION
Frontside and backside of cells
Name Changzhou SVECK PV New Material Co. LTD
Type designation SV-15296P (frontside) / SV-15297P (backside)
DNV GL – Document No.: 20-0092-ME-R-01-A, Issue: B, Status: Final Page 25
Thickness [mm] 500
UL listed E334244
Manufacturer Changzhou SVECK PV New Material Co.LTD : the company was founded in 2005 and is focussed in the manufacture of ethylene vinyl acetat (EVA) films to be used for encapsulant in PV modules. The company is headquartered in Changzhou.
JUNCTION BOX
Name Zhejiang Jiaming Tianheyuan Photovoltaics Technology Co., Ltd.
Type designation JMB13-1
Nominal current [A] 13
Nominal voltage [V] N/A
Certificates IEC 62790:2014
Manufacturer Zhejiang Jiaming Tianheyuan Photovoltaics Technology Co., Ltd. : the company was established by Jiaming Group in 2005, specialized in solar battery, module junction boxes, connectors and cables.
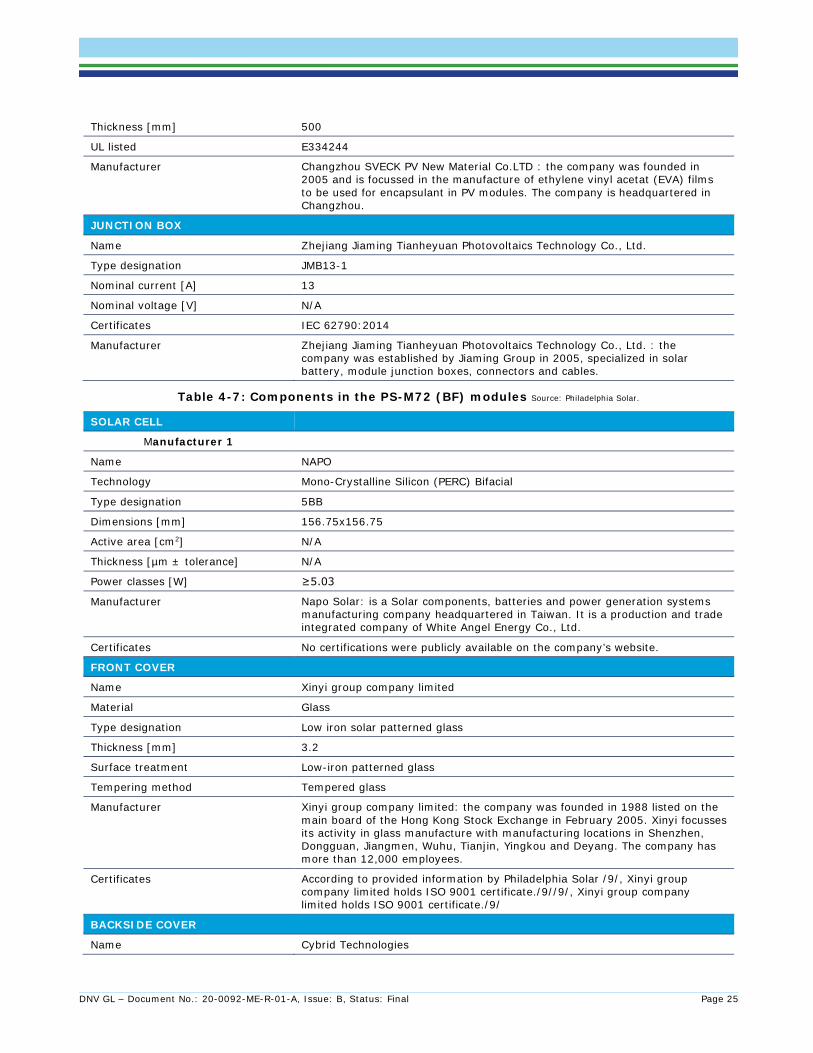
Table 4-7: Components in the PS-M72 (BF) modules Source: Philadelphia Solar.
SOLAR CELL
Manufacturer 1
Name NAPO
Technology Mono-Crystalline Silicon (PERC) Bifacial
Type designation 5BB
Dimensions [mm] 156.75x156.75
Active area [cm2] N/A
Thickness [µm ± tolerance] N/A
Power classes [W] ≥5.03
Manufacturer Napo Solar: is a Solar components, batteries and power generation systems manufacturing company headquartered in Taiwan. It is a production and trade integrated company of White Angel Energy Co., Ltd.
Certificates No certifications were publicly available on the company’s website.
FRONT COVER
Name Xinyi group company limited
Material Glass
Type designation Low iron solar patterned glass
Thickness [mm] 3.2
Surface treatment Low-iron patterned glass
Tempering method Tempered glass
Manufacturer Xinyi group company limited: the company was founded in 1988 listed on the main board of the Hong Kong Stock Exchange in February 2005. Xinyi focusses its activity in glass manufacture with manufacturing locations in Shenzhen, Dongguan, Jiangmen, Wuhu, Tianjin, Yingkou and Deyang. The company has more than 12,000 employees.
Certificates According to provided information by Philadelphia Solar /9/, Xinyi group company limited holds ISO 9001 certificate./9//9/, Xinyi group company limited holds ISO 9001 certificate./9/
BACKSIDE COVER
Name Cybrid Technologies
DNV GL – Document No.: 20-0092-ME-R-01-A, Issue: B, Status: Final Page 26
Type designation N/A
Backsheet structure PVDF/PET/Fluorine film (Colour: transparent)
Thickness [µm] 322µm
Max. system voltage [V] N/A
Backsheet certifications N/A
Manufacturer Cybrid: in 2005 Macropoly Laboratory was created in Kyoto to begun R&D activities in polymer functional material. In 2010, Cybrid entered the PV business
Certificates According to Cybrid website, operates under ISO 9001 guidelines..
CELL ENCAPSULATION
Frontside and backside of cells
Name Wahaj. LTD
Type designation RC03 (frontside) / RC-T3 (backside) - EVA Film sheet FC 985 mm x 150 LM
Thickness [mm] Front side Thickness (mm): 0.45 (+/- 0.05mm) Backside Thickness (mm): 0.45 (+/- 0.05mm)
UL listed NA
Manufacturer Wahaj an affiliate of Saudi International Petrochemical Company (SIPCHEM ) and co-owned by Hanwha Chemical Corporation of South Korea ( HCC). The company was founded in the year 2014 and is also AS9100 Certified for High-Precision, High Complexity Machined Components, Kits and Sub-Assemblies The company is headquartered in Saudi Arabia.
JUNCTION BOX
Name Zhejiang Jiaming Tianheyuan Photovoltaics Technology Co., Ltd.
Type designation JM07
Nominal current [A] 20
Nominal voltage [V] N/A
Certificates IEC 62790:2014, UL3730
Manufacturer Zhejiang Jiaming Tianheyuan Photovoltaics Technology Co., Ltd. : the company was established by Jiaming Group in 2005, specialized in solar battery, module junction boxes, connectors and cables.
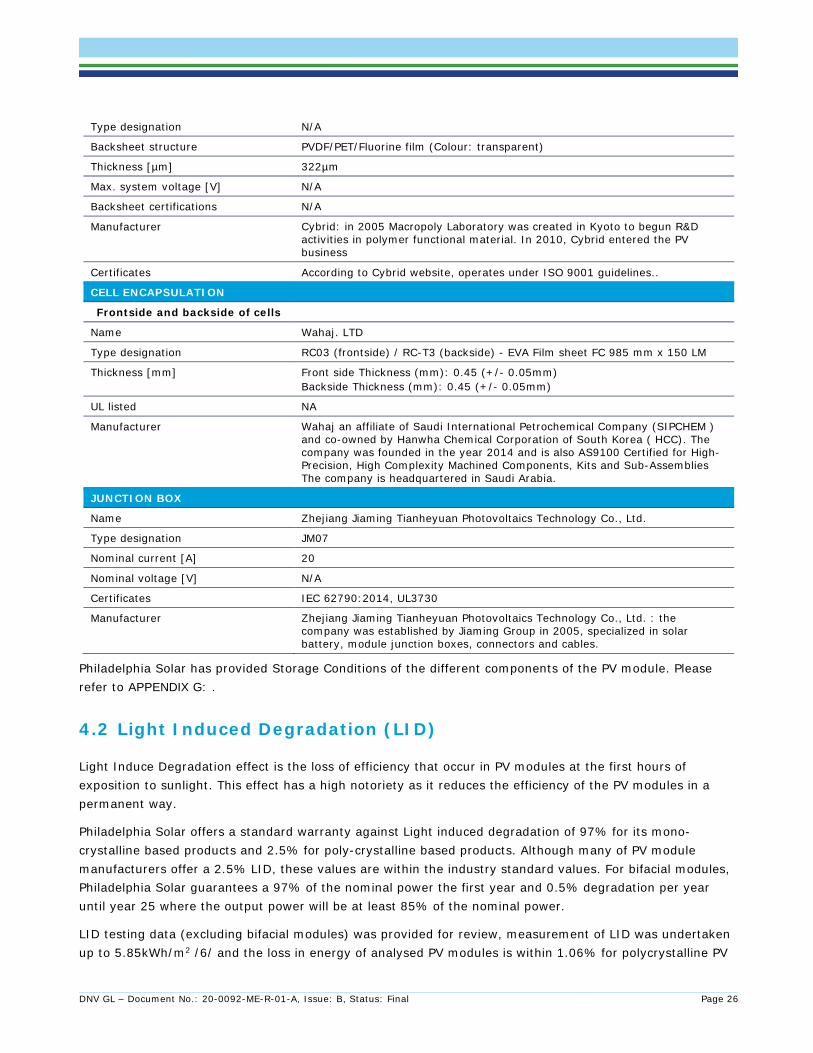
Philadelphia Solar has provided Storage Conditions of the different components of the PV module. Please refer to APPENDIX G: .
4.2 Light Induced Degradation (LID)
Light Induce Degradation effect is the loss of efficiency that occur in PV modules at the first hours of exposition to sunlight. This effect has a high notoriety as it reduces the efficiency of the PV modules in a permanent way.
Philadelphia Solar offers a standard warranty against Light induced degradation of 97% for its mono-crystalline based products and 2.5% for poly-crystalline based products. Although many of PV module manufacturers offer a 2.5% LID, these values are within the industry standard values. For bifacial modules, Philadelphia Solar guarantees a 97% of the nominal power the first year and 0.5% degradation per year until year 25 where the output power will be at least 85% of the nominal power.
LID testing data (excluding bifacial modules) was provided for review, measurement of LID was undertaken up to 5.85kWh/m2 /6/ and the loss in energy of analysed PV modules is within 1.06% for polycrystalline PV
DNV GL – Document No.: 20-0092-ME-R-01-A, Issue: B, Status: Final Page 27
modules and within 2.20% for monocrystalline PV modules, which are considered reasonable and comparable to other suppliers. However, DNV GL highlights to arrive at an accurate representation of LID, it is usually recommended to undertake the study for a minimum of 60kWh/m2 for the stabilization of LID.
DNV GL has observed that LeTID can be controlled to a range averaging 2% (max) degradation in tested modules based on industry literature and material from several manufacturers. The LeTID test report as per MQT23.1 of draft IEC 61215-2:2019 provided included 2 samples of PS-M72 (BF) tested for 2 rounds each for at least 240 hours at STC /49/. It is concluded that the module is deemed not LeTID sensitive /49/.
DNV GL recommends that LeTID test report includes 4 or more modules run at either of the test procedures in Table 4-8, with Pmax,STC values reported for each module at multiple intervals. Pmax measurements at low light measurements are desirable, but not required.
Table 4-8: LeTID testing conditions
IEC LeTID detection test conditions Other acceptable test conditions
Pmax testing STC + (optional) 200W/m2, 25° C Same
Temperature 75° C 85° C
Current Itest = Isc,stc – Imp,stc Same or ≥0.1 A is acceptable
Initial measurement No prior light exposure Same
2nd measurement At 162 hours At 96 or 192 hours
Increments 162 hours 96 or 192 hours
End condition 672 hours or indication of recovery ≥384 hours
Notes A recommended practice is to maintain the module in the dark without applied current for 5 hours (or overnight) before each measurement. This allows other metastable defects to reach an equilibrium state, thereby preventing confounding variables.
4.3 Passivated Emitter Rear Cell (PERC)
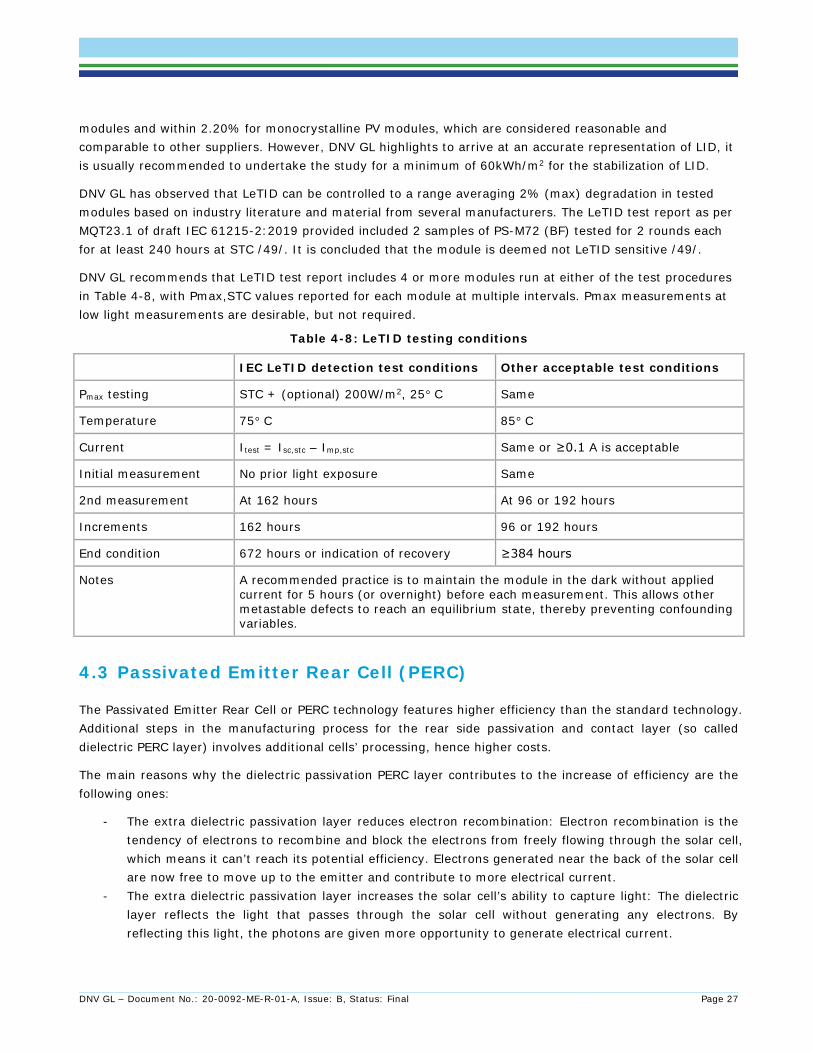
The Passivated Emitter Rear Cell or PERC technology features higher efficiency than the standard technology. Additional steps in the manufacturing process for the rear side passivation and contact layer (so called dielectric PERC layer) involves additional cells’ processing, hence higher costs.
The main reasons why the dielectric passivation PERC layer contributes to the increase of efficiency are the following ones:
- The extra dielectric passivation layer reduces electron recombination: Electron recombination is the tendency of electrons to recombine and block the electrons from freely flowing through the solar cell, which means it can’t reach its potential efficiency. Electrons generated near the back of the solar cell are now free to move up to the emitter and contribute to more electrical current.
- The extra dielectric passivation layer increases the solar cell’s ability to capture light: The dielectric layer reflects the light that passes through the solar cell without generating any electrons. By reflecting this light, the photons are given more opportunity to generate electrical current.
DNV GL – Document No.: 20-0092-ME-R-01-A, Issue: B, Status: Final Page 28
The PERC architecture can be implemented on both multi-crystalline and mono-crystalline wafers. Like the standard technology, the mono-PERC is more efficient than the multi-PERC. PERC modules have a higher energy density per square foot and perform well under low-light conditions and high temperatures resulting in greater energy yield. One of the issues with PERC technology (both multi and mono) has been the Light-Induced Degradation or LID. Multi-PERC exhibits a slightly different form of LID that occurs with elevated temperatures (Light and elevated Temperature Induced Degradation - LeTID). Some manufacturers of multi-PERC cells have shown data suggesting that this degradation has also been reduced and controlled. However, at this stage Poly-PERC has significant bankability challenges to be proven.
Figure 4-1 Advantages/Disadvantages of PERC technology
PERC technology is still considered by many as ‘new’, but PERC cells and PERC modules are expected to constitute about 50% of the global market in 2019 /35/. Furthermore, PERC technology appears to have more efficiency potential as manufacturers are developing higher cell efficiencies. The main issue which historically held back deployment of PERC was the light-induced degradation (LID) as indicated above, which most manufacturers have sufficiently solved. A summary of crystalline silicon technology is shown below. A summary on the key features of PERC modules is given in Table 4-9:
Better Low Irradiance performance than standard c-SiIncreased efficiency compared to standard c-Si modules
Scaling of production
LID Issues intrinsic to technology higher in PERC
Figure 4-2 Key features of Al-BSF and PERC modules
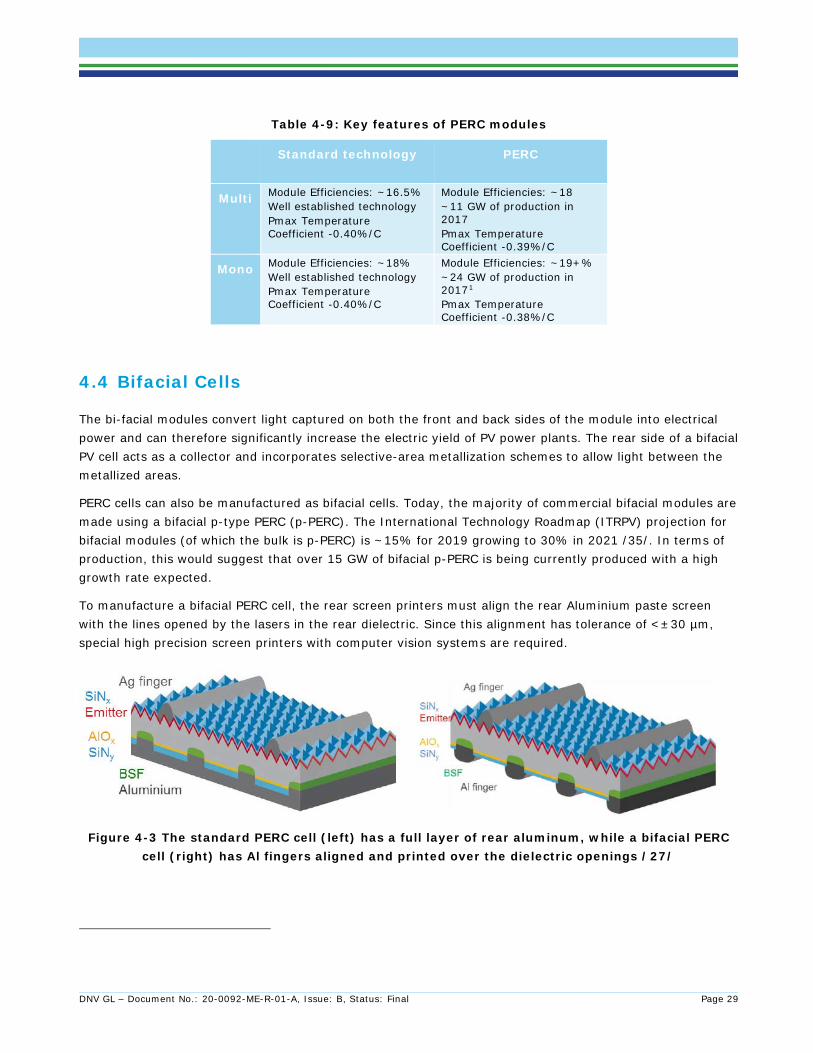
DNV GL – Document No.: 20-0092-ME-R-01-A, Issue: B, Status: Final Page 29
Table 4-9: Key features of PERC modules
Standard technology PERC
Multi Module Efficiencies: ~16.5% Well established technology Pmax Temperature Coefficient -0.40%/C
Module Efficiencies: ~18 ~11 GW of production in 2017 Pmax Temperature Coefficient -0.39%/C
Mono Module Efficiencies: ~18% Well established technology Pmax Temperature Coefficient -0.40%/C
Module Efficiencies: ~19+% ~24 GW of production in 20171 Pmax Temperature Coefficient -0.38%/C
4.4 Bifacial Cells
The bi-facial modules convert light captured on both the front and back sides of the module into electrical power and can therefore significantly increase the electric yield of PV power plants. The rear side of a bifacial PV cell acts as a collector and incorporates selective-area metallization schemes to allow light between the metallized areas.
PERC cells can also be manufactured as bifacial cells. Today, the majority of commercial bifacial modules are made using a bifacial p-type PERC (p-PERC). The International Technology Roadmap (ITRPV) projection for bifacial modules (of which the bulk is p-PERC) is ~15% for 2019 growing to 30% in 2021 /35/. In terms of production, this would suggest that over 15 GW of bifacial p-PERC is being currently produced with a high growth rate expected.
To manufacture a bifacial PERC cell, the rear screen printers must align the rear Aluminium paste screen with the lines opened by the lasers in the rear dielectric. Since this alignment has tolerance of <±30 µm, special high precision screen printers with computer vision systems are required.
Figure 4-3 The standard PERC cell (left) has a full layer of rear aluminum, while a bifacial PERC cell (right) has Al fingers aligned and printed over the dielectric openings /27/
DNV GL – Document No.: 20-0092-ME-R-01-A, Issue: B, Status: Final Page 30
The manufacturers typically use either a UV-resistant transparent backsheet material or an additional layer of glass for the rear side of the modules.
A dual-glass construction is the most common of today's bifacial modules. The modules may be framed or frameless. Dual-glass modules are not standard products. Some manufacturers do not offer a dual-glass module at all. Some disadvantages of dual-glass bifacial modules include a) a slight drop in efficiency, b) increased weight, and c) increased cost. The slight efficiency drop results from light passing between cells, that normally is reflected back by a white backsheet, now is exiting the rear glass. The operating efficiency can also be lower because the rear glass is more thermally insulating, causing the cells to operate a few degrees warmer than in a glass-polymer construction.
Because glass is heavier than the typical backsheet, most manufacturers use thinner glass for both the front and rear glass in their dual-glass modules. Standard modules typically have 4.0 mm or 3.2 mm tempered front glass while a number of dual-glass modules feature a 2.5 mm thick or even 2.0 mm thick heat strengthened glass. Tempered glass is rapidly cooled to impart beneficial internal stresses that place the surfaces in compression, and thereby increasing the glass strength. Heat-strengthened glass has a reduced level of such beneficial internal stresses.
Manufacturers may also offer a frameless version to further reduce weight. Frameless dual-glass modules are expected to increase in market share. Glass is highly resistant to corrosion and moisture ingress. This provides the dual-glass module superior performance in marine, salt, alkali, or acidic environments. Dual-glass modules have become more desired for desert applications where sand abrasion could be an issue for the rear polymer backsheet. The generally higher durability of dual-glass modules is reflected by the extended warranties the manufacturers offer on these products. Many performance warranties of dual-glass modules including bifacial are 30-year warranties with degradation rates of 0.5% per year or less.
The additional yield for bifacial power plants depends on the reflectivity of the surroundings: e.g. white foil, different soils or vegetation. The modules offer increased energy generation, improved durability, reduced BOS as well as lower LCOE. As per the ongoing research and testing carried out a bifacial PV system could in ideal conditions generate 5%–30% more energy than an equivalent mono-facial system due to the additional back-side production.
The performance gains of Bi-facial modules are dependent on the maintenance of the surroundings and the surface area. Areas surrounding low-albedo coefficients are likely to see lower benefits than other locations. Significant amount of effort is required to maintain a considered surface for the duration of the project.
Additionally, bi-facial module performance is also dependent on the kind of mounting structure considered for project. As the back surface of the module also acts as a generating source, efforts to maximize exposure area need to be considered /36/.
A summary on the key features of bi-facial modules is given in Table 4-10 below:

DNV GL – Document No.: 20-0092-ME-R-01-A, Issue: B, Status: Final Page 31
Table 4-10: Key features of bi-facial modules
4.5 Certificates
DNV GL has been provided with the following certifications applicable to the manufacturing process:
• ISO 14001:2015 Standard for Environmental Management System
• ISO 9001:2015 Standard for Quality Management System
• OHSAS 18001: 2007 Standard for Occupational Health & Safety Management System
• ETIMAD accreditation for PV systems larger than 2 MWp (awarded by CESA, The Coalition of Energy Services Associations)
Related to the certifications held by the PS-M72, PS-P72 PV and PS-M72 (BF) modules, certificates in the Table 4-11 are applicable.
Table 4-11 PV module certificates
Certificate
Certification Certificate Number PS-P60 PS-P72 PS-M60 PS-M72 PS-M72 (BF)
IEC 61701
PV 60110327 1000V: PS P72 -(300-
330W), PS P60 (250-275 W),
PS M72- (300-345 W) and PS M60 (250-290 W)
IEC 61215 PV 60109277
PV722040001 01
1500V: PS-M72(BF)-(345-405 W)
PV 722040005 01 1500V: PS-M72-(340-405
Higher efficiencyHigher Power density
Lower BOS cost Likely increase in yield in specific
conditions
Higher O&M costLikely variation of Yield based on
maintenanceBespoke structure requirements
Unproven long term reliability performance
Higher performance uncertainty
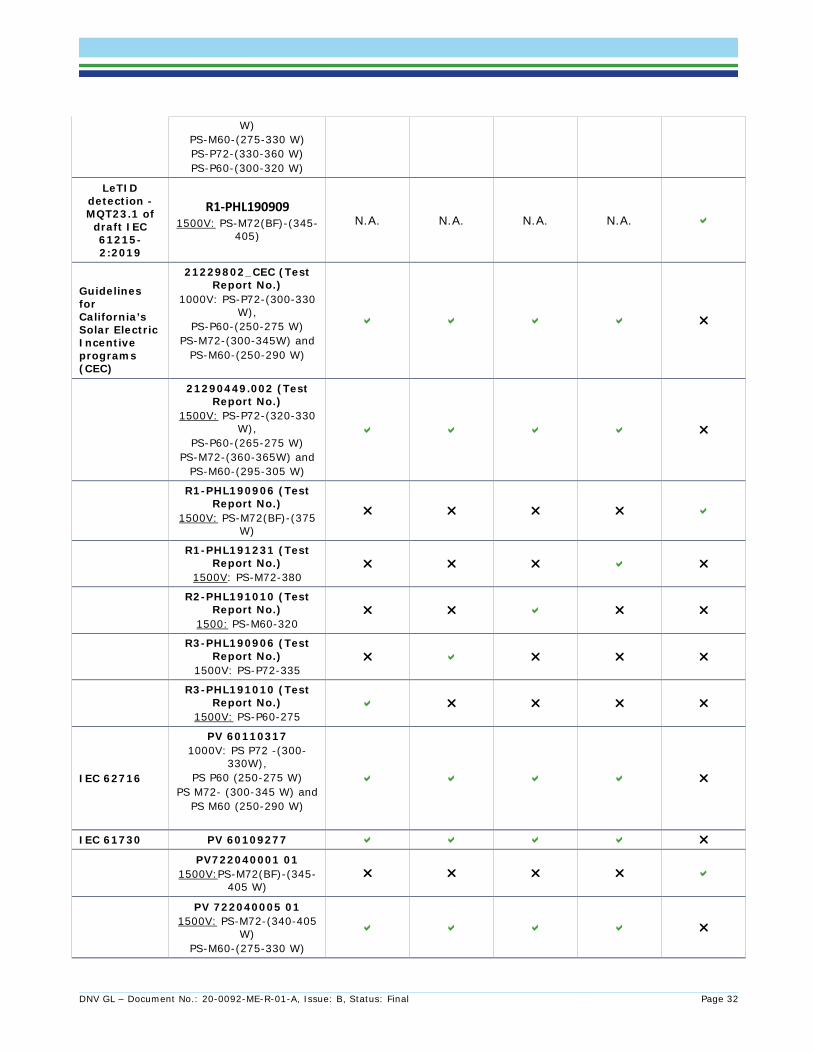
DNV GL – Document No.: 20-0092-ME-R-01-A, Issue: B, Status: Final Page 32
W) PS-M60-(275-330 W) PS-P72-(330-360 W) PS-P60-(300-320 W)
LeTID detection - MQT23.1 of
draft IEC 61215-2:2019
R1-PHL190909 1500V: PS-M72(BF)-(345-
405) N.A. N.A. N.A. N.A.
Guidelines for California’s Solar Electric Incentive programs (CEC)
21229802_CEC (Test Report No.)
1000V: PS-P72-(300-330 W),
PS-P60-(250-275 W) PS-M72-(300-345W) and
PS-M60-(250-290 W)
21290449.002 (Test Report No.)
1500V: PS-P72-(320-330 W),
PS-P60-(265-275 W) PS-M72-(360-365W) and
PS-M60-(295-305 W)
R1-PHL190906 (Test
Report No.) 1500V: PS-M72(BF)-(375
W)
R1-PHL191231 (Test
Report No.) 1500V: PS-M72-380
R2-PHL191010 (Test
Report No.) 1500: PS-M60-320
R3-PHL190906 (Test
Report No.) 1500V: PS-P72-335
R3-PHL191010 (Test
Report No.) 1500V: PS-P60-275
IEC 62716
PV 60110317 1000V: PS P72 -(300-
330W), PS P60 (250-275 W)
PS M72- (300-345 W) and PS M60 (250-290 W)
IEC 61730 PV 60109277
PV722040001 01
1500V:PS-M72(BF)-(345-405 W)
PV 722040005 01 1500V: PS-M72-(340-405
W) PS-M60-(275-330 W)
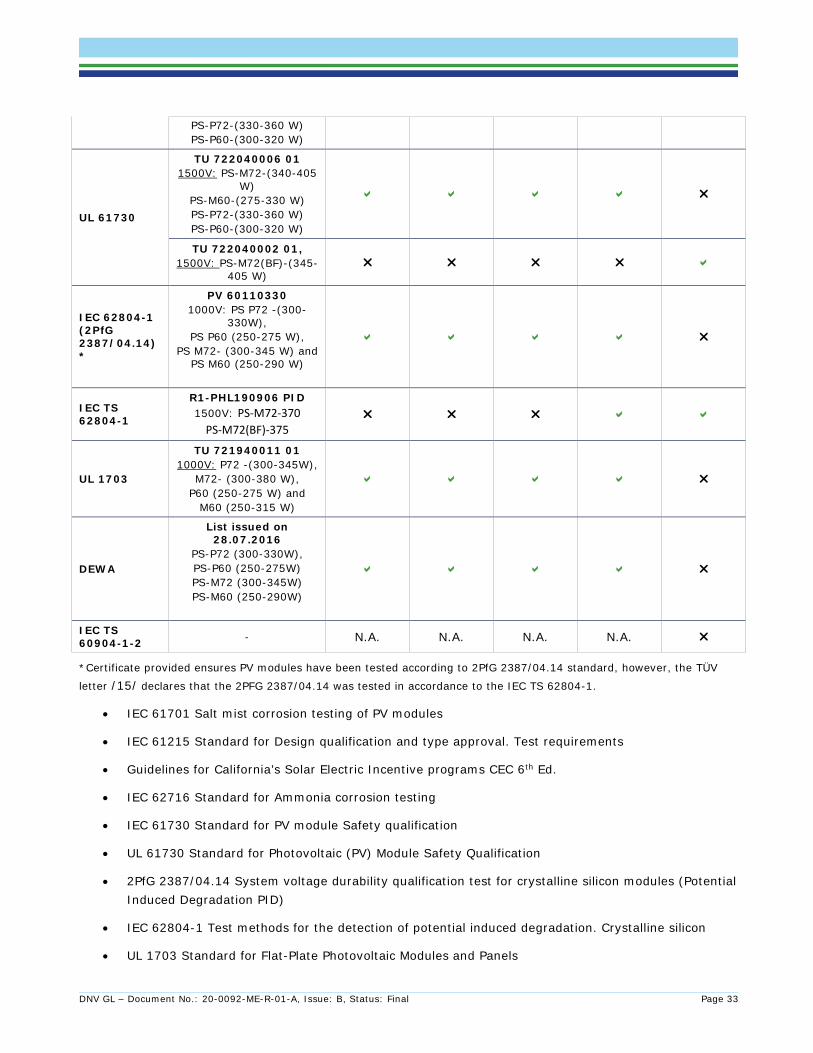
DNV GL – Document No.: 20-0092-ME-R-01-A, Issue: B, Status: Final Page 33
PS-P72-(330-360 W) PS-P60-(300-320 W)
UL 61730
TU 722040006 01 1500V: PS-M72-(340-405
W) PS-M60-(275-330 W) PS-P72-(330-360 W) PS-P60-(300-320 W)
TU 722040002 01, 1500V: PS-M72(BF)-(345-
405 W)
IEC 62804-1 (2PfG 2387/04.14)*
PV 60110330 1000V: PS P72 -(300-
330W), PS P60 (250-275 W),
PS M72- (300-345 W) and PS M60 (250-290 W)
IEC TS 62804-1
R1-PHL190906 PID 1500V: PS-M72-370
PS-M72(BF)-375
UL 1703
TU 721940011 01 1000V: P72 -(300-345W),
M72- (300-380 W), P60 (250-275 W) and
M60 (250-315 W)
DEWA
List issued on 28.07.2016
PS-P72 (300-330W), PS-P60 (250-275W) PS-M72 (300-345W) PS-M60 (250-290W)
IEC TS 60904-1-2 - N.A. N.A. N.A. N.A.
*Certificate provided ensures PV modules have been tested according to 2PfG 2387/04.14 standard, however, the TÜV
letter /15/ declares that the 2PFG 2387/04.14 was tested in accordance to the IEC TS 62804-1.
• IEC 61701 Salt mist corrosion testing of PV modules
• IEC 61215 Standard for Design qualification and type approval. Test requirements
• Guidelines for California’s Solar Electric Incentive programs CEC 6th Ed.
• IEC 62716 Standard for Ammonia corrosion testing
• IEC 61730 Standard for PV module Safety qualification
• UL 61730 Standard for Photovoltaic (PV) Module Safety Qualification
• 2PfG 2387/04.14 System voltage durability qualification test for crystalline silicon modules (Potential Induced Degradation PID)
• IEC 62804-1 Test methods for the detection of potential induced degradation. Crystalline silicon
• UL 1703 Standard for Flat-Plate Photovoltaic Modules and Panels
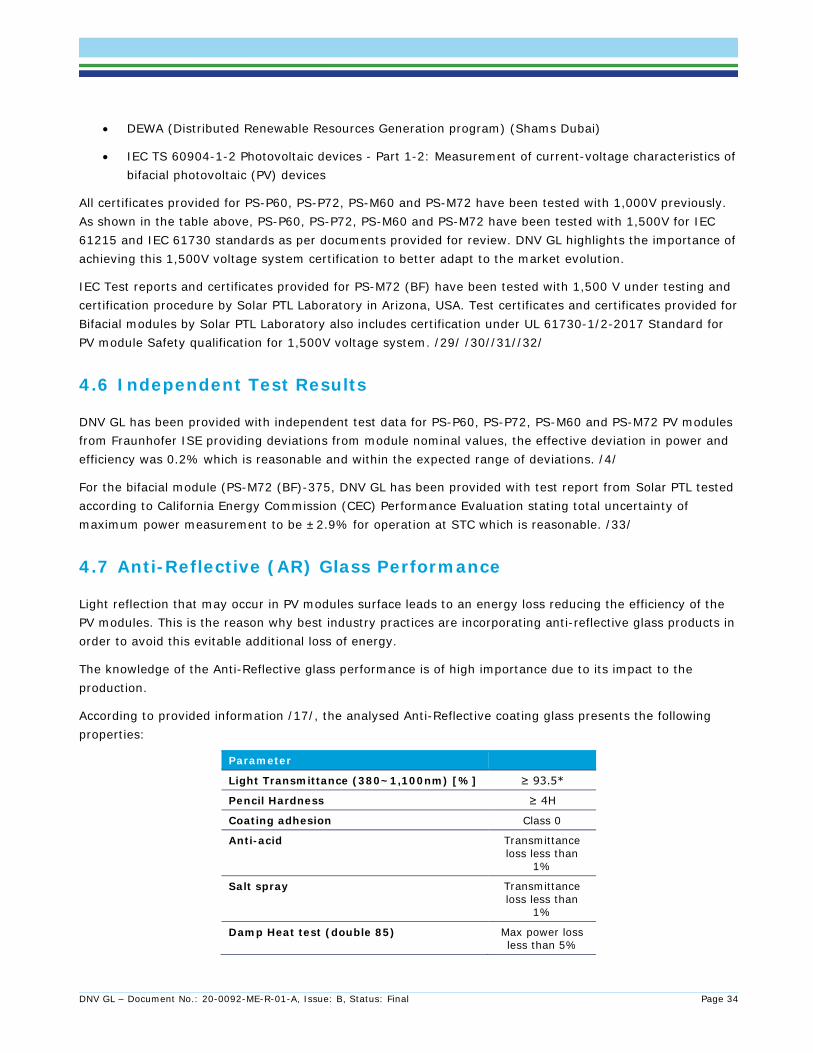
DNV GL – Document No.: 20-0092-ME-R-01-A, Issue: B, Status: Final Page 34
• DEWA (Distributed Renewable Resources Generation program) (Shams Dubai)
• IEC TS 60904-1-2 Photovoltaic devices - Part 1-2: Measurement of current-voltage characteristics of bifacial photovoltaic (PV) devices
All certificates provided for PS-P60, PS-P72, PS-M60 and PS-M72 have been tested with 1,000V previously. As shown in the table above, PS-P60, PS-P72, PS-M60 and PS-M72 have been tested with 1,500V for IEC 61215 and IEC 61730 standards as per documents provided for review. DNV GL highlights the importance of achieving this 1,500V voltage system certification to better adapt to the market evolution.
IEC Test reports and certificates provided for PS-M72 (BF) have been tested with 1,500 V under testing and certification procedure by Solar PTL Laboratory in Arizona, USA. Test certificates and certificates provided for Bifacial modules by Solar PTL Laboratory also includes certification under UL 61730-1/2-2017 Standard for PV module Safety qualification for 1,500V voltage system. /29/ /30//31//32/
4.6 Independent Test Results
DNV GL has been provided with independent test data for PS-P60, PS-P72, PS-M60 and PS-M72 PV modules from Fraunhofer ISE providing deviations from module nominal values, the effective deviation in power and efficiency was 0.2% which is reasonable and within the expected range of deviations. /4/
For the bifacial module (PS-M72 (BF)-375, DNV GL has been provided with test report from Solar PTL tested according to California Energy Commission (CEC) Performance Evaluation stating total uncertainty of maximum power measurement to be ±2.9% for operation at STC which is reasonable. /33/
4.7 Anti-Reflective (AR) Glass Performance
Light reflection that may occur in PV modules surface leads to an energy loss reducing the efficiency of the PV modules. This is the reason why best industry practices are incorporating anti-reflective glass products in order to avoid this evitable additional loss of energy.
The knowledge of the Anti-Reflective glass performance is of high importance due to its impact to the production.
According to provided information /17/, the analysed Anti-Reflective coating glass presents the following properties:
Parameter
Light Transmittance (380~1,100nm) [%] ≥ 93.5*
Pencil Hardness ≥ 4H
Coating adhesion Class 0
Anti-acid Transmittance loss less than
1%
Salt spray Transmittance loss less than
1%
Damp Heat test (double 85) Max power loss less than 5%
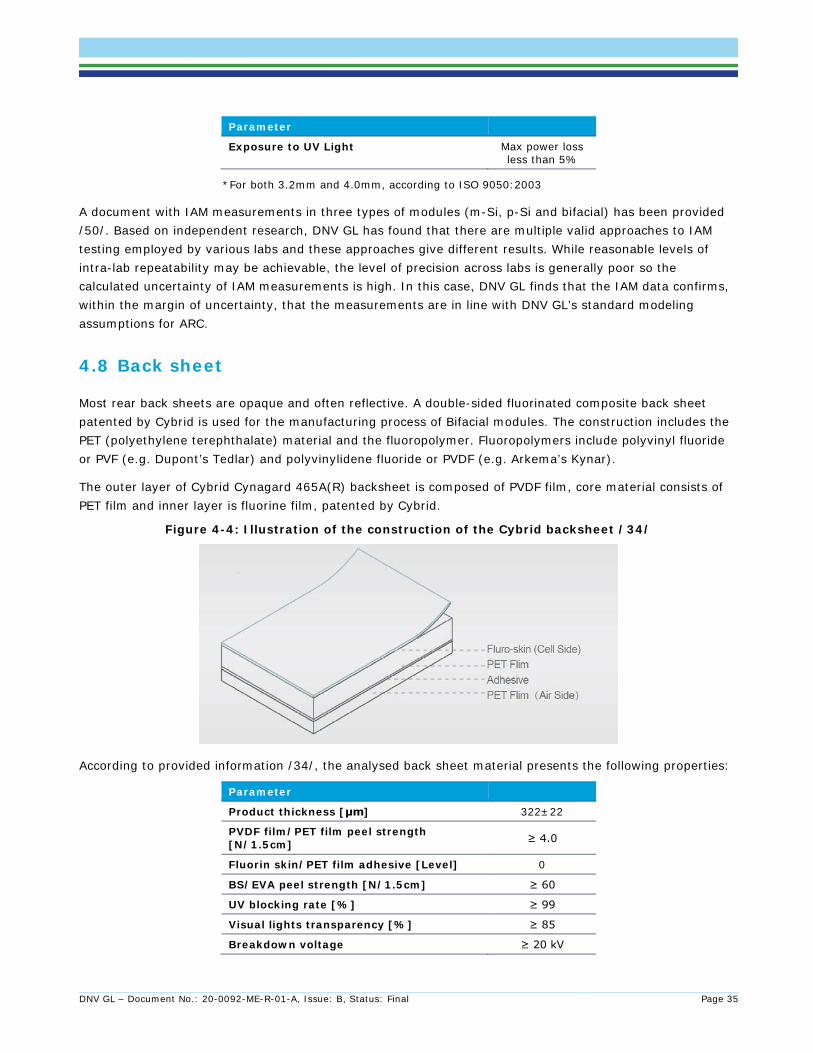
DNV GL – Document No.: 20-0092-ME-R-01-A, Issue: B, Status: Final Page 35
Parameter
Exposure to UV Light Max power loss less than 5%
*For both 3.2mm and 4.0mm, according to ISO 9050:2003
A document with IAM measurements in three types of modules (m-Si, p-Si and bifacial) has been provided /50/. Based on independent research, DNV GL has found that there are multiple valid approaches to IAM testing employed by various labs and these approaches give different results. While reasonable levels of intra-lab repeatability may be achievable, the level of precision across labs is generally poor so the calculated uncertainty of IAM measurements is high. In this case, DNV GL finds that the IAM data confirms, within the margin of uncertainty, that the measurements are in line with DNV GL’s standard modeling assumptions for ARC.
4.8 Back sheet
Most rear back sheets are opaque and often reflective. A double-sided fluorinated composite back sheet patented by Cybrid is used for the manufacturing process of Bifacial modules. The construction includes the PET (polyethylene terephthalate) material and the fluoropolymer. Fluoropolymers include polyvinyl fluoride or PVF (e.g. Dupont’s Tedlar) and polyvinylidene fluoride or PVDF (e.g. Arkema’s Kynar).
The outer layer of Cybrid Cynagard 465A(R) backsheet is composed of PVDF film, core material consists of PET film and inner layer is fluorine film, patented by Cybrid.
Figure 4-4: Illustration of the construction of the Cybrid backsheet /34/
According to provided information /34/, the analysed back sheet material presents the following properties:
Parameter
Product thickness [μm] 322±22
PVDF film/PET film peel strength [N/1.5cm] ≥ 4.0
Fluorin skin/PET film adhesive [Level] 0
BS/EVA peel strength [N/1.5cm] ≥ 60
UV blocking rate [%] ≥ 99
Visual lights transparency [%] ≥ 85
Breakdown voltage ≥ 20 kV
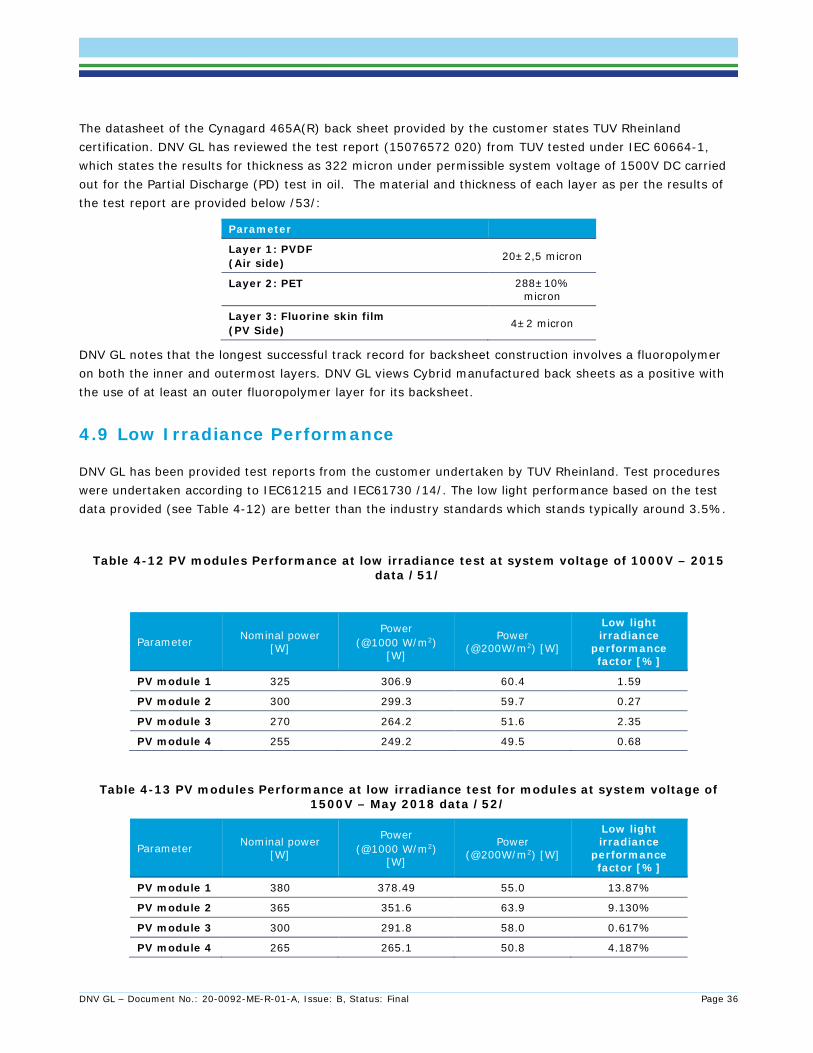
DNV GL – Document No.: 20-0092-ME-R-01-A, Issue: B, Status: Final Page 36
The datasheet of the Cynagard 465A(R) back sheet provided by the customer states TUV Rheinland certification. DNV GL has reviewed the test report (15076572 020) from TUV tested under IEC 60664-1, which states the results for thickness as 322 micron under permissible system voltage of 1500V DC carried out for the Partial Discharge (PD) test in oil. The material and thickness of each layer as per the results of the test report are provided below /53/:
Parameter
Layer 1: PVDF (Air side) 20±2,5 micron
Layer 2: PET 288±10% micron
Layer 3: Fluorine skin film (PV Side) 4±2 micron
DNV GL notes that the longest successful track record for backsheet construction involves a fluoropolymer on both the inner and outermost layers. DNV GL views Cybrid manufactured back sheets as a positive with the use of at least an outer fluoropolymer layer for its backsheet.
4.9 Low Irradiance Performance
DNV GL has been provided test reports from the customer undertaken by TUV Rheinland. Test procedures were undertaken according to IEC61215 and IEC61730 /14/. The low light performance based on the test data provided (see Table 4-12) are better than the industry standards which stands typically around 3.5%.
Table 4-12 PV modules Performance at low irradiance test at system voltage of 1000V – 2015 data /51/
Parameter Nominal power [W]
Power (@1000 W/m2)
[W]
Power (@200W/m2) [W]
Low light irradiance
performance factor [%]
PV module 1 325 306.9 60.4 1.59
PV module 2 300 299.3 59.7 0.27
PV module 3 270 264.2 51.6 2.35
PV module 4 255 249.2 49.5 0.68
Table 4-13 PV modules Performance at low irradiance test for modules at system voltage of 1500V – May 2018 data /52/
Parameter Nominal power [W]
Power (@1000 W/m2)
[W]
Power (@200W/m2) [W]
Low light irradiance
performance factor [%]
PV module 1 380 378.49 55.0 13.87%
PV module 2 365 351.6 63.9 9.130%
PV module 3 300 291.8 58.0 0.617%
PV module 4 265 265.1 50.8 4.187%
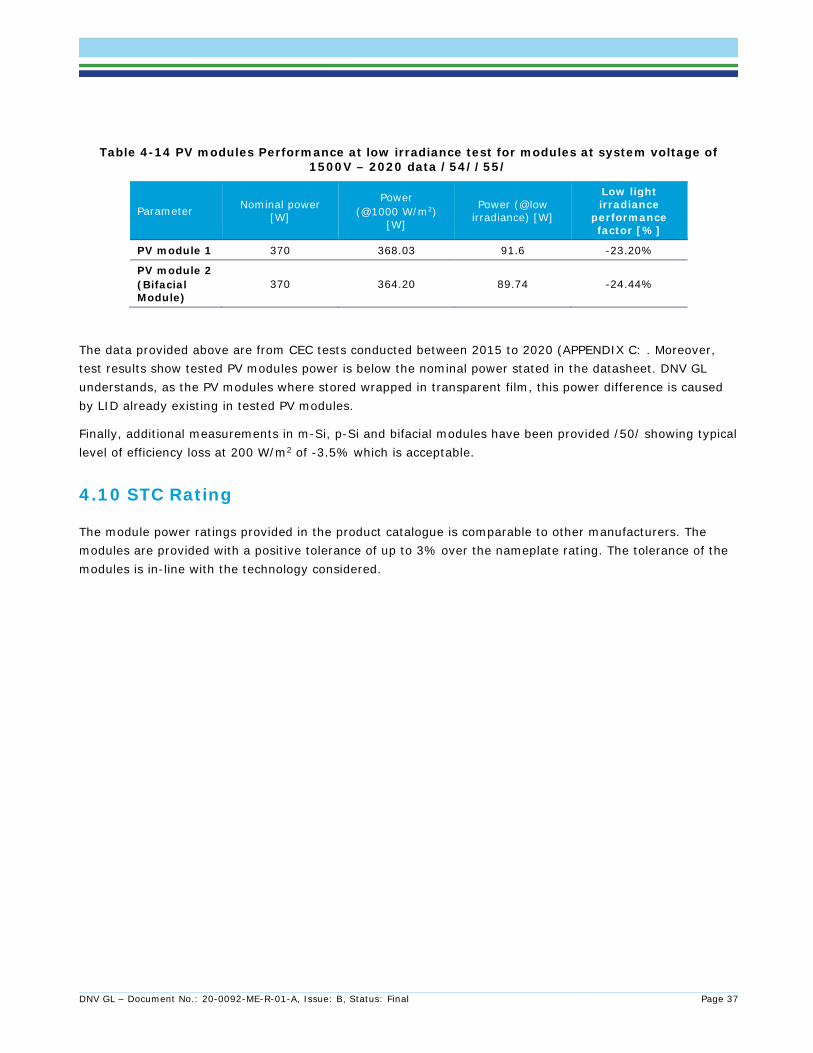
DNV GL – Document No.: 20-0092-ME-R-01-A, Issue: B, Status: Final Page 37
Table 4-14 PV modules Performance at low irradiance test for modules at system voltage of 1500V – 2020 data /54//55/
Parameter Nominal power [W]
Power (@1000 W/m2)
[W]
Power (@low irradiance) [W]
Low light irradiance
performance factor [%]
PV module 1 370 368.03 91.6 -23.20%
PV module 2 (Bifacial Module)
370 364.20 89.74 -24.44%
The data provided above are from CEC tests conducted between 2015 to 2020 (APPENDIX C: . Moreover, test results show tested PV modules power is below the nominal power stated in the datasheet. DNV GL understands, as the PV modules where stored wrapped in transparent film, this power difference is caused by LID already existing in tested PV modules.
Finally, additional measurements in m-Si, p-Si and bifacial modules have been provided /50/ showing typical level of efficiency loss at 200 W/m2 of -3.5% which is acceptable.
4.10 STC Rating
The module power ratings provided in the product catalogue is comparable to other manufacturers. The modules are provided with a positive tolerance of up to 3% over the nameplate rating. The tolerance of the modules is in-line with the technology considered.
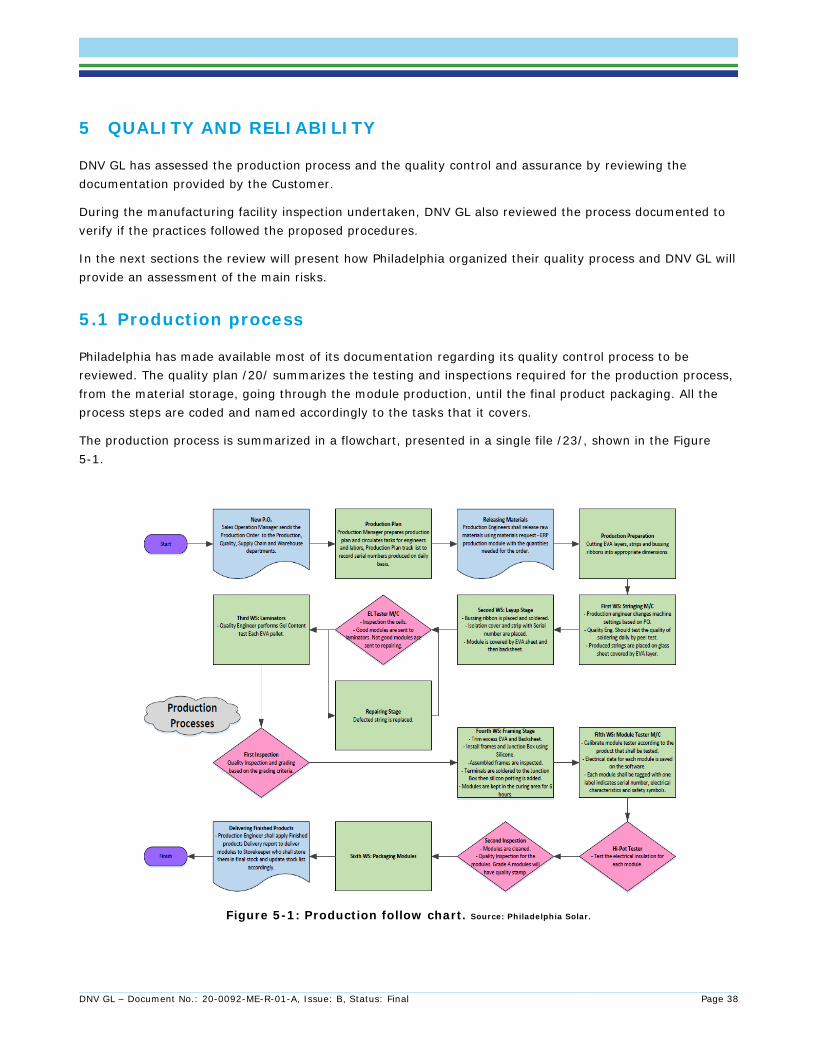
DNV GL – Document No.: 20-0092-ME-R-01-A, Issue: B, Status: Final Page 38
5 QUALITY AND RELIABILITY
DNV GL has assessed the production process and the quality control and assurance by reviewing the documentation provided by the Customer.
During the manufacturing facility inspection undertaken, DNV GL also reviewed the process documented to verify if the practices followed the proposed procedures.
In the next sections the review will present how Philadelphia organized their quality process and DNV GL will provide an assessment of the main risks.
5.1 Production process
Philadelphia has made available most of its documentation regarding its quality control process to be reviewed. The quality plan /20/ summarizes the testing and inspections required for the production process, from the material storage, going through the module production, until the final product packaging. All the process steps are coded and named accordingly to the tasks that it covers.
The production process is summarized in a flowchart, presented in a single file /23/, shown in the Figure 5-1.
Figure 5-1: Production follow chart. Source: Philadelphia Solar.
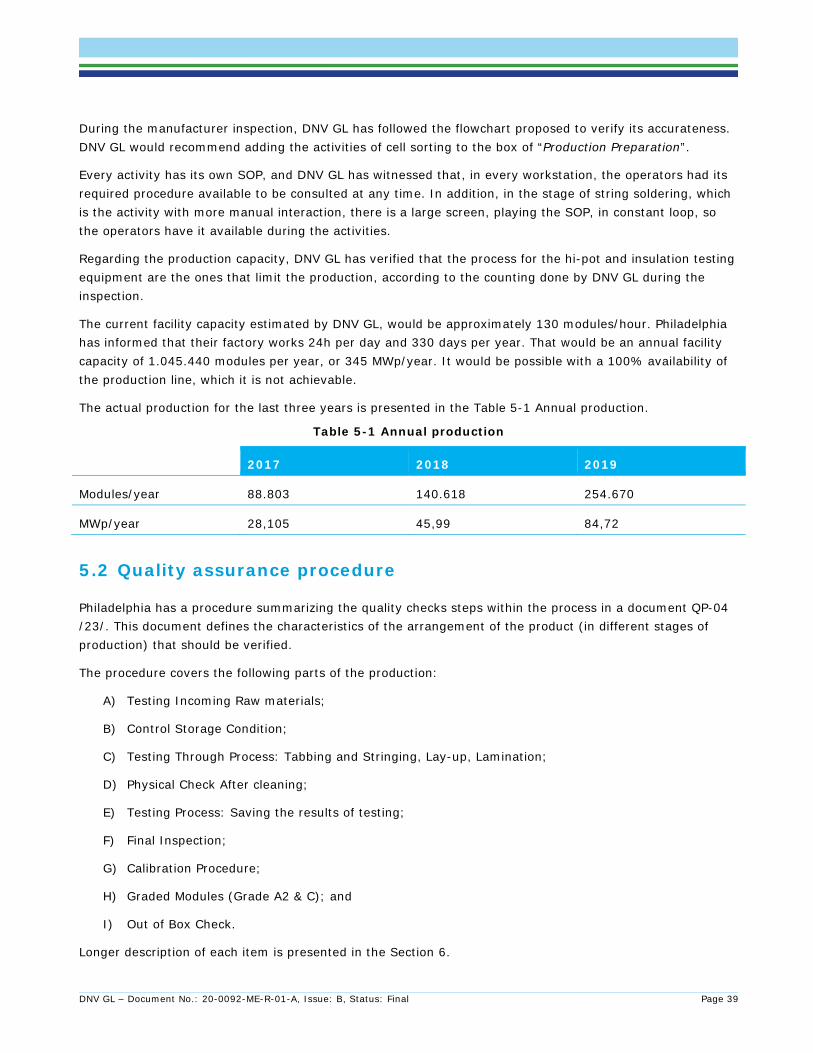
DNV GL – Document No.: 20-0092-ME-R-01-A, Issue: B, Status: Final Page 39
During the manufacturer inspection, DNV GL has followed the flowchart proposed to verify its accurateness. DNV GL would recommend adding the activities of cell sorting to the box of “Production Preparation”.
Every activity has its own SOP, and DNV GL has witnessed that, in every workstation, the operators had its required procedure available to be consulted at any time. In addition, in the stage of string soldering, which is the activity with more manual interaction, there is a large screen, playing the SOP, in constant loop, so the operators have it available during the activities.
Regarding the production capacity, DNV GL has verified that the process for the hi-pot and insulation testing equipment are the ones that limit the production, according to the counting done by DNV GL during the inspection.
The current facility capacity estimated by DNV GL, would be approximately 130 modules/hour. Philadelphia has informed that their factory works 24h per day and 330 days per year. That would be an annual facility capacity of 1.045.440 modules per year, or 345 MWp/year. It would be possible with a 100% availability of the production line, which it is not achievable.
The actual production for the last three years is presented in the Table 5-1 Annual production.
Table 5-1 Annual production
2017 2018 2019
Modules/year 88.803 140.618 254.670
MWp/year 28,105 45,99 84,72
5.2 Quality assurance procedure
Philadelphia has a procedure summarizing the quality checks steps within the process in a document QP-04 /23/. This document defines the characteristics of the arrangement of the product (in different stages of production) that should be verified.
The procedure covers the following parts of the production:
A) Testing Incoming Raw materials;
B) Control Storage Condition;
C) Testing Through Process: Tabbing and Stringing, Lay-up, Lamination;
D) Physical Check After cleaning;
E) Testing Process: Saving the results of testing;
F) Final Inspection;
G) Calibration Procedure;
H) Graded Modules (Grade A2 & C); and
I) Out of Box Check.
Longer description of each item is presented in the Section 6.
DNV GL – Document No.: 20-0092-ME-R-01-A, Issue: B, Status: Final Page 40
During the manufacturer inspection, DNV GL has gone through the process, and the only steps of the quality checks that have not been witnessed are the items (G) and (I), which shall get samples from the production and send to recognized laboratories and testing a pallet per delivery, respectively.
For a complete witness of the production process, including the described quality procedures, DNV GL has created a photolog in the APPENDIX E: .
Philadelphia has informed that the laboratory inspections for its production has already been performed and they are waiting for the results to add the certifications to its products. In addition to that, they have the intention to set up their own laboratory to inspect the production and perform PID and LID tests, as an improvement for their quality inspection.
5.2.1 Production testing machines In the production line, there are three testing steps:
- EL testing, before lamination;
- Insulation and hi-pot test, after the module final inspection; and
- EL and flash testing, at the end of the production line.
There are two EL testing equipment in the production. One is PI4, from Germany, which can handle 90 modules per hour. And the other one is a Jinchen, from China, which can provide EL and high-resolution image for quality inspection, with a pace of 130 modules per hour. Two EL tests in the production line is the standard practice in the market. Some manufacturers have already adopted the practices of having three EL processes.
A hi-pot and insulation test are performed on every module after the module final inspection, by two equipment, from Hope Tech, China, meeting the requirements of UL 1703 and IEC61730. Modules not sold with UL stamp are not grounded. DNV GL observed that the hi-pot test was run with an intentional faulty module to confirm that a failure was reported by the system at 3,600 V. DNV GL also observed the second test required under UL 1703 and IEC61730 regarding grounding continuity test.
At the end of the production line, there is a device supplied by Endeas, from Finland. The equipment is able to perform EL imaging, hi-pot, ground bond, automatic optical inspection, and bypass diode tests, is integrated into the system, and a throughput of 150 to 200 modules per hour, according to its specification. The tester is a AAA class equipment as per IEC 60904-9:2007 with latest issue of calibration in 20th September 2019 . The flash equipment is calibrated with a secondary calibrated module derived from a primary calibrated module by Fraunhofer (latest date of calibration: 19th November 2019)2. The calibrated module report presented also has the bifacial module tested (latest date of calibration: 19th October 2019)3.
DNV GL views the control and calibration of power testing to be aligned with industry standard practice.
2 There are 4 different test reports provided by Fraunhofer ISE, from October to November 2019. 3 There are 4 different test reports provided by Fraunhofer ISE, from September to October 2019.
DNV GL – Document No.: 20-0092-ME-R-01-A, Issue: B, Status: Final Page 41
5.2.2 Production inspection DNV GL has been provided with a list /23/ of all the quality checks for the production are summarized, added to the APPENDIX E: . These quality inspections are performed in different stages, that DNV GL would separate as the following:
- Raw material inspections: Cells’ color sorting, silicon content test, cracked cells, bus bars cutting, EVA gel tests.
- Production inspections: faulty soldering, misaligned strings, ribbon soldering, broken cells. - Out of line quality tests: EVA and backsheet peel tests, ribbon pullout tests.
Philadelphia also perform dimensional check for aluminum frames, check and cutting length for the back sheet, check (width and thickness) for the ribbon and silicone potting.
The part of the raw material inspections, that DNV GL has been able to inspect, solar cells received are pre-sorted by colors and efficiency according to the production batch. Philadelphia Solar has implemented a working procedure to avoid mixing different cell texture and/or color in each module.
After that, the string soldering machines have also an image control for the cell quality automatically, and at the end of the string soldering process, there is another visual inspection by a production operator.
During the string manual soldering process, there is another quality check, in which the faulty strings can be flagged and replaced within the production line.
Once the modules have passed through the lamination process, there is a visual inspection, in which the PV cells laminated onto the glass are inspected thoroughly and categorized in:
- A; - A2, when there are aesthetic issues, that will not affect production; - C, issues that will potentially decrease production but not module safety.
Next step of the quality inspection will be the final cleaning and packaging preparation, where a group of staff takes care of the final inspection and delivery to the testing stage.
DNV GL recommends avoiding light penetration through the small space between modules using a card box covering the entire pallets rather than transparent plastic film as Philadelphia Solar default packing system. Philadelphia Solar has confirmed that they have already implemented another packaging method using Cardboard boxes which will prevent light penetration. After the visits, DNV GL has already received pictures of the new carton box layout. The modules are packed with 25 units per pallet. To maximize container utilization, pallets are double stacked for shipping.
Three parallel laminators able to handle up to 48 modules per hour were used at the time of the visit. As commented by Philadelphia Solar, another laminator has been added on November, with a total of 6 laminators installed in the factory. The manufacturer of the three laminators existing at the time of the visit was NPC-Japan, whereas the supplier of the last laminator is Jinchen. Both manufacturers are well recognized in the industry.
DNV GL highlights the importance of implementing a day-to-day routine for the testing of incoming materials to avoid situations with inferior quality batches entering the PV module manufacturing process. The Customer has informed DNV GL that the quality control follows the AQL2.5 for sample size of income
DNV GL – Document No.: 20-0092-ME-R-01-A, Issue: B, Status: Final Page 42
raw materials to be tested by batch and the pass/no pass criteria before using any delivery from their sub-suppliers. Philadelphia Solar has confirmed they apply a rigid quality plan for incoming materials, but DNV GL did not witness its implementation during the visit to the factory premises, for timing purposes.
In parallel with the production, Philadelphia carries out laboratory tests, in which the gel content measurement is verified, EVA and back-sheet peel tests and silicon content.
However, records of the gel content measurements from January to October 2019 have been provided by Philadelphia Solar. The minimum and maximum gel content pass criteria are 76% and 94%, respectively. DNV GL notes that there are several gel-content results outside the limits above. It seems that re-testing was needed in most cases because of a laboratory false result. Philadelphia Solar has confirmed that as soon as a gel content failure may arise, the test was repeated.
In 2019, Philadelphia has developed production traceability system, where it is possible to verify from the module barcode, all the environment conditions and BOM of each module.
In general terms, it can be concluded that the procedures of quality tests are comprehensive.
In addition to the in-house quality tests, Philadelphia Solar regularly sends equipment samples to Fraunhofer for testing to compare the results obtained by a third party with the in-house testing results and update, their certifications according to the latest IEC standards.
During the factory inspection, Philadelphia has informed DNV GL that an expansion in the facility building is planned where an in house PID and LID measurement laboratory will be included.
5.3 Facility environment control
The facility is generally clean and organized. The floor is marked with the areas that the movement is allowed and the distance to keep from the machines, this is considered as good industrial practices.
As a module manufacturing facility, the temperature, humidity, as well as dust shall be controlled. The environment should be controlled and in some cases have a negative pressure. To this regard, the facility lacks control, since the accesses to the facility are unrestricted and made through common doors. After the visit, DNV GL has been informed that some improvements have been made, regarding the ceiling height a negative pressure in the environment, nevertheless the changes have not been verified during the visit.
The temperature and humidity are controlled by several devices placed throughout the facility, in different sections of the production line. DNV GL would recommend the system to be upgraded to an online system, connected to the air conditioning system, to guarantee a reliable solution for this control. Currently the temperature and humidity data are loaded every hour into the system, but it is not clear how the temperature is controlled. This could be an important issue, considering that in the Middle East, in the summer, temperatures can raise significantly.
Giving the location of the manufacturing facility in a hot climate, Philadelphia Solar is monitoring with dedicated sensors in the facility the temperature (between 20ºC and 30ºC) and the humidity (between 30% and 60%). The results for the last 104 days (summer) gave a couple of alarm triggered episodes in the first week of July with a recorded temperature of 28.4ºC. DNV GL understands that the works are stopped in the affected area with triggered alarm until the conditions are back to normality.
DNV GL – Document No.: 20-0092-ME-R-01-A, Issue: B, Status: Final Page 43
The waste management could be improved, since at the visit day, there were several empty boxes left at the factory entrance. It is not a critical issue for the production itself, it is just an improvement remark.
DNV GL highlights the importance to keep a daily cleaning routine process on every key element of the manufacturing process.
It was noted during the visit that operators were wearing full overall, caps, booties, gloves and masks. A dress code has been installed within Philadelphia Solar premises for various departments such as production technicians, maintenance technicians, quality technicians, engineers and cleaning personnel. DNV GL highlights the importance of having the entire staff wearing the overall at the production line, avoiding both the workers being contaminated by the chemical elements, as well as the workers bringing dust and particles to the production line.
The modules are stored at controlled ambient conditions for the drying of the silicone before entering the Flash Tester. During the site visit Philadelphia Solar informed that a drying period of 4 hours is applied.
5.4 Finished product durability checks
It is important to make the distinction between manufacturing production line quality checks and finished product durability checks. No in-house reliability monitoring program has been implemented yet by Philadelphia Solar. DNV GL considers that this would be required to follow the best practice in the industry where UV pre-conditioning chamber, thermal cycling chamber and thermal/humidity chamber may be installed in the module fab building. Typically, this testing may include extensions beyond the standard IEC 61215 durations together with Potential Induced Degradation (PID) tests.
DNV GL also recognizes that the above finished product reliability checks are typically seen in manufacturers with a capacity above 200 MWp to 500 MWp per year when the current capacity of Philadelphia solar is approximately 428 MWp4, as per manufacturer statement. Therefore, the size of Philadelphia Solar does not justify a dedicated finished product durability programme. For that reason, DNV GL considers that Philadelphia Solar may consider adopting third party reliability program, externalising these activities as a mitigant. As previously explained, Philadelphia Solar regularly sends equipment samples to Fraunhofer for testing in order to be able to compare the results obtained by a third party with the in-house testing results and update, consequently, their certifications according to the latest IEC standards.
5.5 Potential Induced Degradation (PID) Testing
Potential Induced Degradation (PID) is a largely reversible power loss in modules that may occur when the voltage of the array is such that the cells are at a negative voltage with respect to the frame. As a relatively recent issue facing the PV industry an IEC standard (IEC 62804) was developed. The standard considers two methods for applying the voltage stress, as presented in Table 5-2.
4 DNV GL has witnessed capacity for 130 modules per hour, that would be an annual facility capacity of 1.045.440 modules per year, or 345 MWp/year,
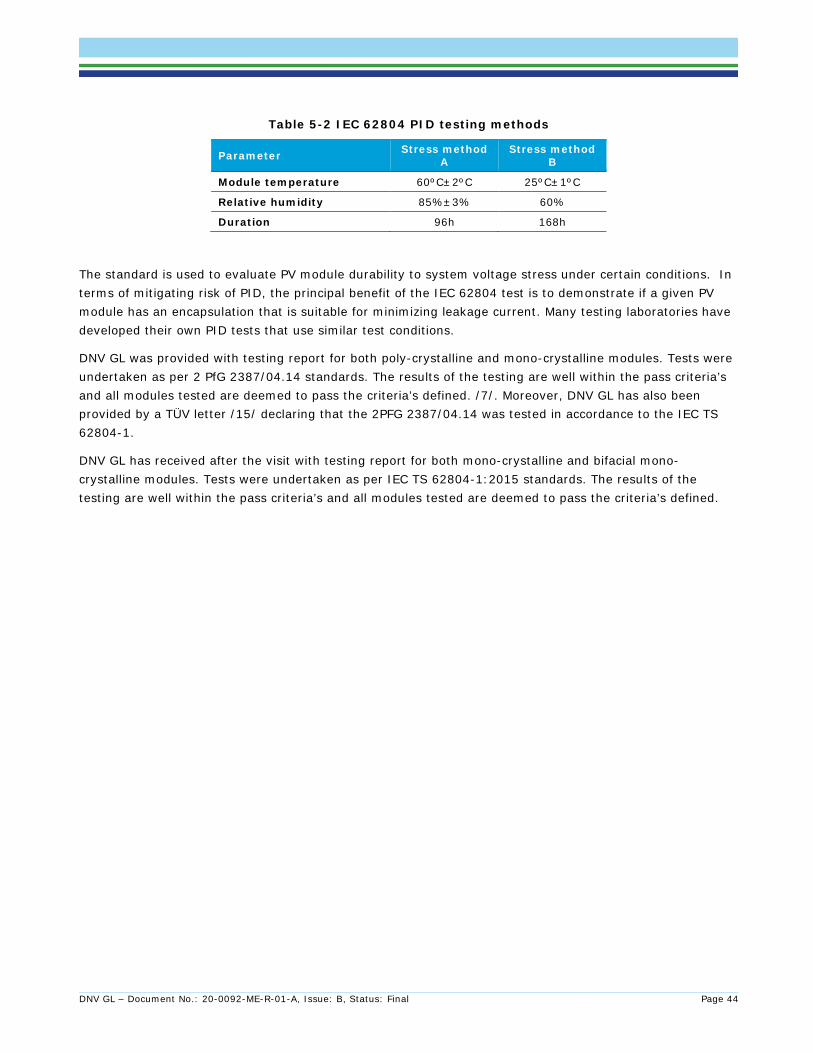
DNV GL – Document No.: 20-0092-ME-R-01-A, Issue: B, Status: Final Page 44
Table 5-2 IEC 62804 PID testing methods
Parameter Stress method A
Stress method B
Module temperature 60ºC±2ºC 25ºC±1ºC
Relative humidity 85%±3% 60%
Duration 96h 168h
The standard is used to evaluate PV module durability to system voltage stress under certain conditions. In terms of mitigating risk of PID, the principal benefit of the IEC 62804 test is to demonstrate if a given PV module has an encapsulation that is suitable for minimizing leakage current. Many testing laboratories have developed their own PID tests that use similar test conditions.
DNV GL was provided with testing report for both poly-crystalline and mono-crystalline modules. Tests were undertaken as per 2 PfG 2387/04.14 standards. The results of the testing are well within the pass criteria’s and all modules tested are deemed to pass the criteria’s defined. /7/. Moreover, DNV GL has also been provided by a TÜV letter /15/ declaring that the 2PFG 2387/04.14 was tested in accordance to the IEC TS 62804-1.
DNV GL has received after the visit with testing report for both mono-crystalline and bifacial mono-crystalline modules. Tests were undertaken as per IEC TS 62804-1:2015 standards. The results of the testing are well within the pass criteria’s and all modules tested are deemed to pass the criteria’s defined.
DNV GL – Document No.: 20-0092-ME-R-01-A, Issue: B, Status: Final Page 45
6 MANUFACTURING FACTORY VISIT
DNV GL visited the Philadelphia Solar module manufacturing facility in Amman, Jordan on 11 February 2020. A detailed review and inspection of the manufacturing facility is included in this section. A pictorial log is provided in Appendix F.
The production facility has a built-up area of approximately 12,000 m2 located near Amman city in Jordan.
There are more than 200 employers working at the moment in the production facility, within the different areas of the process.
The following areas were inspected during the site visit:
- Raw material reception area: glass, EVA, back sheet, cells and aluminium; - Cell tabbing and stringing; - Lay-up area; - Electroluminescence tests 1; - Lamination; - Framing; - Junction box fitting; - Curing area; - Finishing stage; - Final testing; - Electroluminescence tests 2 and flash tests; - Labeling and packaging. - Repair station and rework workshop; and - Quality laboratory.
The production line has been automated by the company Jinchen, from the glass placement until the module packaging, the production arrangement, runs through the system completely automatized. The manual activities within the process are:
- Feeding the machines with raw material; - Soldering strings to the busbars, after the lay-up; - Module framing, for half of the production line; - Junction box fitting and soldering.
6.1 Material Storage
DNV GL has inspected the storage area and discussed with the logistic manager, the main storage procedures. In the facility building visited, there are two warehouses to store both the raw material and the finished module pallets.
For the raw materials, Philadelphia organizes the material by “first-expired first-out” strategy for the sensitive goods and “first-in first-out” for the remaining materials.
All the goods in the storage warehouse were properly labeled and organized, which provided a good organization impression.
DNV GL – Document No.: 20-0092-ME-R-01-A, Issue: B, Status: Final Page 46
DNV GL has also verified the storage control system employed. It has been verified by examples provided in the running system, the company has control of the material leaving the warehouse to the production line, all movement controlled and logged. Through the control system, Philadelphia has showed that every order can be tracked down to the BOM used in the manufacture.
DNV GL visited the raw material storage area where materials such as EVA, require controlled temperature and humidity conditions, are stored. DNV GL observed that the area was monitored for temperature and humidity four times per day (every three hours) working on two shifts of 10 hour/shift and five days per week. These procedures are keeping with the industry standard practices.
DNV GL has also inspected that the production line has a system, installed in the production engineers’ handhelds devices, that can track through the serial numbers of the modules the BOM produced and the ambient conditions registered. This is an improvement for the production system and would be important to have it integrated to the storage system, so you would be able to track down: module, BOM and conditions of production.
DNV GL verified during the visit that the BOM /24/ of the current production were all controlled inspecting all the raw materials, labels, models and brands used, which proved an organized production procedure.
6.2 Cell Sorting
Cells arrive from a selected number of manufacturers. They arrive in boxes binned by efficiency and colour by the outside supplier. Predefined colour categories have been defined by Philadelphia Solar. Modules are only produced from cells of a single efficiency bin at any one time. The cell thickness used is 200 microns (+/-10%). The colour sorting is aligned with industry standards.
Once the cells are sorted, an operator fill them into the stringing machine where the cells are, and once more verified for any cracks or problems with dimensions, where in these cases they would be eliminated from the production line.
6.3 Tabbing and Stringing
There are two lines of tabbing operations with different machines, both automated. The soldering machines, from Somont (Germany) and ATW (China), have capacities of 2800 and 3600 cells per day, respectively.
The Customer indicated that a new ATW machine will be added to the production line and that the Somont would also be soon replaced.
DNV GL visited the in-house laboratory, where quality checks are performed on the tabbing ribbons, consisting of a daily pull test. The laboratory activities are described in the Section 6.15.
6.4 Lay-up
At the lay-up stage, the cell string arrangement is placed onto the glass and EVA set, to be soldered to the module busbar in the next stage.
DNV GL – Document No.: 20-0092-ME-R-01-A, Issue: B, Status: Final Page 47
The work areas were very clean, and standard operating procedures were posted at each working station written in both Arabic and English language. The temperature of the soldering irons is checked visually 3 times per shift and monthly using the data logger records.
After the lay-up and busbars soldering, the arrangement receives a second EVA layer and backsheet. This is the step where it is first labelled with a bar code and from this stage it is possible to track it in the system.
EL testing and image analyses is performed on all arrangements prior to lamination. Modules with defective cells, are moved to the repairing station, Section 6.13, where the damaged strings are replaced manually. Feedback to tabbing equipment staff allows to stop any of the four tabbing lines that may not be working well.
6.5 Lamination
There are six laminators in the production line. As stated in the automatic solar laminator manual /56/ of Jinchen (Dated 04/28/2016) five (5) modules of 72 cells have a process time of 8 minutes with total capacity equal to 80MW per laminator therefore for 6 laminators the total maximum capacity is equal to 480 MW not considering the other external conditions that could affect the availability of the factory.
The laminating temperature is monitored at 4 points across the laminator surface, this is considered below the best practice in the industry, which should be eight or more points.
After the lamination, the arrangement, glass+EVA+cells+backsheet, is inspected and gets its first grading for A, A2 or C category. The categorization is once more reviewed in the last part of the process after the final EL testing, Section 6.15..
6.6 Framing
There are two lines of productions to frame the modules, one is semi-automated process, with a support of one operator and another one with an automatic framing machine, from Jinchen (Cina). The manual line would be recommended to be replaced by an automatic process to give more reliability and safety to the production line.
After DNV GL visit, the customer indicated that another automated framing machine has been added to the manufacture line.
All the frames have the sealant applied into the frames’ grooves, using an equipment managed by an operator.
The frame design observed in production does not have screwed corner connections which provide extra robustness to the frame in difficult loading conditions. DNV GL considers that the framing process is in line with the standard practices in the industry.
6.7 Junction Box
The junction box is attached to the module by a procedure which is typical in the industry.
DNV GL – Document No.: 20-0092-ME-R-01-A, Issue: B, Status: Final Page 48
The junction box is purchased with the cables and diodes assembled. At the factory, it is just fixed, and the diodes soldered to the terminals of the module busbars, completing the module electric circuit.
The silicone bead is applied to the junction box at an automated station, which is critical in achieving a consistent and uniform bead.
The crosstie ribbons are manually soldered onto the terminals of the junction box. Philadelphia Solar has commented, soldering temperature of the soldering iron is checked 3 times per shift. However, DNV GL has not seen this checking procedure to be performed during the site visit. DNV GL has not seen any control or procedure for the junction box positioning in the back of the module. This could be a point of improvement for the process.
After the soldering, the box is potted and curing of the pottant is conducted in a separate room under controlled temperature and humidity conditions. The curing room is isolated from the rest of the production area and there are three devices measuring temperature and humidity. For this area, DNV GL also recommends having an active measurement, controlled and connected to an on-line system that verifies the temperature and activates the air conditioning system.
Philadelphia Solar has confirmed diode properties located in the junction boxes are evaluated by using diode mode and resistance mode testing. Nevertheless, during the inspection the diodes were not being tested in the production line, before the installation.
Philadelphia Solar has confirmed strain relief test on the cables is performed for a proper tightness on a sampling basis during incoming inspection. The strain relief test consists of hanging the PV module for one minute by cables letting it withstand its own weight (around 22kg). However, DNV GL did not see neither of the mentioned tests being implemented during the site visit.
6.8 Finishing Stage
After the curing stage, the modules follow up to the finishing part, where the aluminum frame corners are polished, and all the module is cleaned and preparing for packaging.
A team of around four people per line, cleans and verify any visual flaws in the final product.
6.9 Final Testing
The finished modules are then bar-code scanned and a testing device is connected to its frame to perform the insulation tests.
The insulation and the HI-Pot test are both performed by equipment supplied by Jinchen (China).
During the inspection, DNV GL requested Philadelphia to place a failed module into the line again and re-run the insulation tests. The test was not sufficiently consistent as the same module have passes and failed the test at different trials. The production manager informed that the test inconsistency was related to the scanning of the barcode, rather than the testing machine, however it could not be proved correct. DNV GL recommends verifying the testing machine and how the bar code could affect the test system.
The modules that have passed the test follow the production line to the final procedures.
DNV GL – Document No.: 20-0092-ME-R-01-A, Issue: B, Status: Final Page 49
6.10 Electroluminescence tests 2 and flash tests
The EL and the final flash test is performed by a single machine, a Quicksun600. Once more, the module EL image is reviewed by an operator and graded as A, A2 or C grade, and the flash test result is logged to the system under the module barcode (process which DNV GL witnessed).
During the inspection, Philadelphia placed a C grade module into the line and showed DNV GL the manufacture defects in the cells, and it was also shown that the module still has a production power curve.
Primary calibration modules are sent to Fraunhofer for measurements which is the standard in the industry. Secondary modules are made internally from the primaries and they are recalibrated monthly. DNV GL recommends the calibration of the tester every 250 modules approximately as per the best practice in the industry. Modules are binned using a power tolerance of 4 W bins.
Modules are automatically binned at flash testing and are traceable to the module serial number. Bill of Materials (BoM) is provided on demand. The serial number is scanned prior to flash testing when the nameplate label is printed and attached to the backsheet, ensuring it’s the proper nameplate.
DNV GL has been informed by Philadelphia Solar that used labels for binning the PV modules have been installed for the last 10 years without any claim.
6.11 Packaging and dispatching
After the EL test and the flash curves are logged into the system, the module is finally labelled and moved to the correct pallets, divided into the three-grading strategy.
The pallets are then wrapped, closed and then moved to the storage warehouses.
While walking around the facility, DNV GL noticed that several modules’ pallets are left outside the warehouses exposed to weather. Besides that, the constant movement of the personnel and vehicles pose risks to the integrity to the modules. Since it is not part of the normal procedure, DNV GL recommends that the modules are placed only inside the warehouses or that the areas where the modules are kept should be sheltered, marked and a procedure for keeping distance from the area defined and communicated to all staff.
6.12 Training/Worker Attire
All the working positions did have a clear instruction written in English and Arabic which is considered the best practice in the industry. Moreover, Philadelphia Solar confirmed that they have a training procedure for new employees using experienced workers. During the visit, the training capacity of the staff in the production line was discussed. The training plan is divided in three groups: lay-up area, framing section and cleaning process. For each group, all employees are trained and prepared to perform any task of its section. DNV GL has talked to some staff on the floor, about their tasks and training, and all the interviewed personnel appear to be well-informed of their tasks and its part on the quality process.
Regarding working attire, workers wear overalls, caps, booties, gloves and masks. Gloves were electrostatically discharged with a wiring system in the case of workers handling back sheet. This is the best practice of the market. A dress code has been installed within Philadelphia Solar premises:
DNV GL – Document No.: 20-0092-ME-R-01-A, Issue: B, Status: Final Page 50
• Production technicians: light blue sweater
• Maintenance technicians: black sweater
• Quality technicians: white sweater
• Engineers: lab coats and dark blue sweater.
• Cleaning: Green uniform.
6.13 Repairing Station
The repairing station is a part of the production line, where the modules rejected by the first EL testing shall go. In this station, the flawed strings arrive flagged by the production line team. Then those strings are removed and replaced by a new string, and the arrangement is put back in the line to be re-inspected and to go through the EL and image process, once more.
6.14 Rework workshop
All the strings that are removed from the module arrangement, for any non-conformity, during the production process, are sent to the rework workshop. Then, the defect is identified, and the flawed cells are removed, or the string repaired. Once the work is done, the strings go back to the production line and are used as replacement, mainly in the repairing station.
6.15 Quality Laboratory
In parallel with the production, Philadelphia carries out laboratory tests, in which the gel content measurement, EVA and back-sheet peel tests and silicon content are verified. DNV GL has visited its facilities and witnessed some of the tests that are performed, within Philadelphia premises.
Philadelphia tests the EVA gel content 3 times per week and keep the studies in available records. DNV GL recommends performing the EVA sampling every day. However, we were provided with the results of gel content since January to October 2018. The minimum and maximum gel content pass criteria are 76% and 94%, respectively. DNV GL notes that there are several gel contents results outside the limits above. It seems that re-testing was needed in most cases because of a laboratory false result. Philadelphia Solar has confirmed that as soon as a gel content failure may arise, the test was repeated.
In the lab DNV GL checked that results for the peel tests and the silicon content were also available in the laboratory, however the tests were not witnessed.
Every station in the lab had its procedure available to be consulted by the working staff.
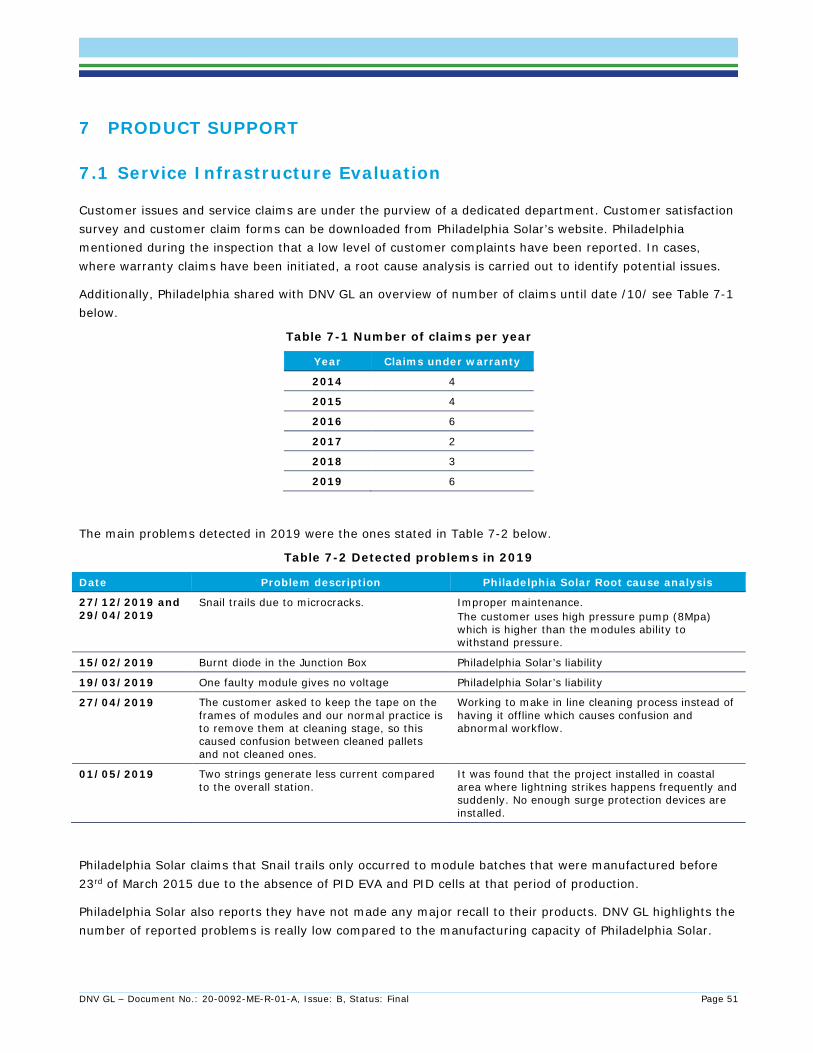
DNV GL – Document No.: 20-0092-ME-R-01-A, Issue: B, Status: Final Page 51
7 PRODUCT SUPPORT
7.1 Service Infrastructure Evaluation
Customer issues and service claims are under the purview of a dedicated department. Customer satisfaction survey and customer claim forms can be downloaded from Philadelphia Solar’s website. Philadelphia mentioned during the inspection that a low level of customer complaints have been reported. In cases, where warranty claims have been initiated, a root cause analysis is carried out to identify potential issues.
Additionally, Philadelphia shared with DNV GL an overview of number of claims until date /10/ see Table 7-1 below.
Table 7-1 Number of claims per year
Year Claims under warranty
2014 4
2015 4
2016 6
2017 2
2018 3
2019 6
The main problems detected in 2019 were the ones stated in Table 7-2 below.
Table 7-2 Detected problems in 2019
Date Problem description Philadelphia Solar Root cause analysis
27/12/2019 and 29/04/2019
Snail trails due to microcracks. Improper maintenance. The customer uses high pressure pump (8Mpa) which is higher than the modules ability to withstand pressure.
15/02/2019 Burnt diode in the Junction Box Philadelphia Solar’s liability
19/03/2019 One faulty module gives no voltage Philadelphia Solar’s liability
27/04/2019 The customer asked to keep the tape on the frames of modules and our normal practice is to remove them at cleaning stage, so this caused confusion between cleaned pallets and not cleaned ones.
Working to make in line cleaning process instead of having it offline which causes confusion and abnormal workflow.
01/05/2019 Two strings generate less current compared to the overall station.
It was found that the project installed in coastal area where lightning strikes happens frequently and suddenly. No enough surge protection devices are installed.
Philadelphia Solar claims that Snail trails only occurred to module batches that were manufactured before 23rd of March 2015 due to the absence of PID EVA and PID cells at that period of production.
Philadelphia Solar also reports they have not made any major recall to their products. DNV GL highlights the number of reported problems is really low compared to the manufacturing capacity of Philadelphia Solar.
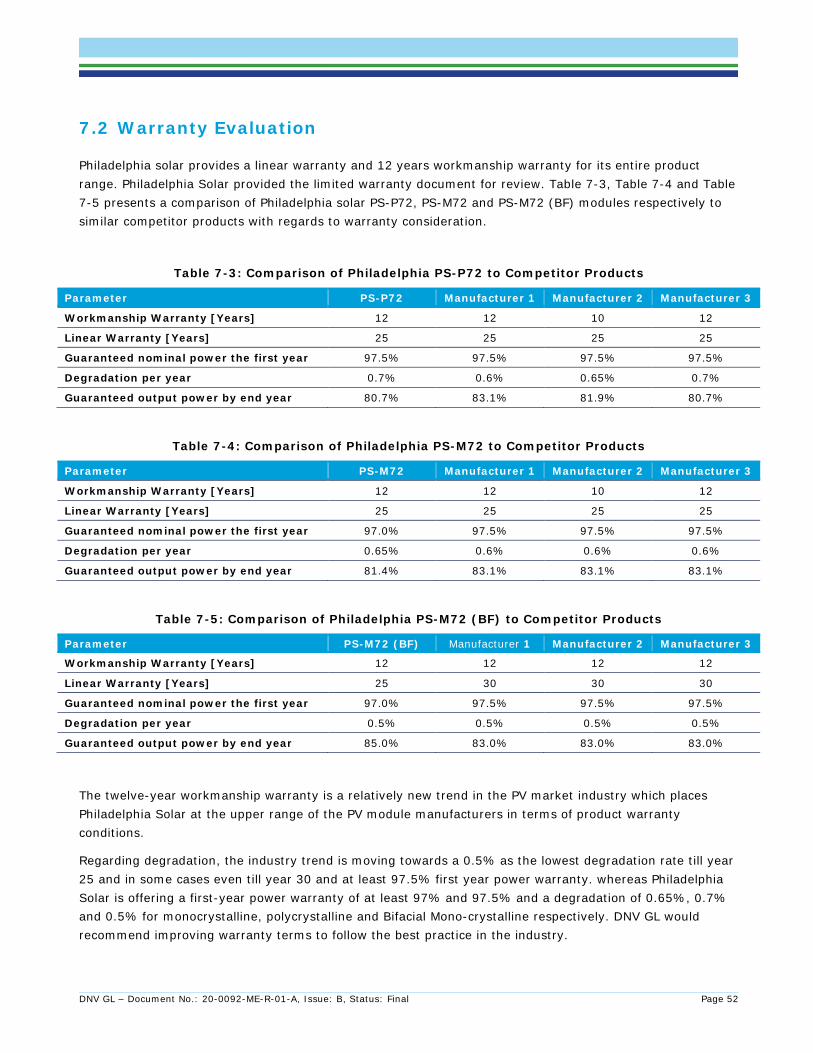
DNV GL – Document No.: 20-0092-ME-R-01-A, Issue: B, Status: Final Page 52
7.2 Warranty Evaluation
Philadelphia solar provides a linear warranty and 12 years workmanship warranty for its entire product range. Philadelphia Solar provided the limited warranty document for review. Table 7-3, Table 7-4 and Table 7-5 presents a comparison of Philadelphia solar PS-P72, PS-M72 and PS-M72 (BF) modules respectively to similar competitor products with regards to warranty consideration.
Table 7-3: Comparison of Philadelphia PS-P72 to Competitor Products
Parameter PS-P72 Manufacturer 1 Manufacturer 2 Manufacturer 3
Workmanship Warranty [Years] 12 12 10 12
Linear Warranty [Years] 25 25 25 25
Guaranteed nominal power the first year 97.5% 97.5% 97.5% 97.5%
Degradation per year 0.7% 0.6% 0.65% 0.7%
Guaranteed output power by end year 80.7% 83.1% 81.9% 80.7%
Table 7-4: Comparison of Philadelphia PS-M72 to Competitor Products
Parameter PS-M72 Manufacturer 1 Manufacturer 2 Manufacturer 3
Workmanship Warranty [Years] 12 12 10 12
Linear Warranty [Years] 25 25 25 25
Guaranteed nominal power the first year 97.0% 97.5% 97.5% 97.5%
Degradation per year 0.65% 0.6% 0.6% 0.6%
Guaranteed output power by end year 81.4% 83.1% 83.1% 83.1%
Table 7-5: Comparison of Philadelphia PS-M72 (BF) to Competitor Products
Parameter PS-M72 (BF) Manufacturer 1 Manufacturer 2 Manufacturer 3
Workmanship Warranty [Years] 12 12 12 12
Linear Warranty [Years] 25 30 30 30
Guaranteed nominal power the first year 97.0% 97.5% 97.5% 97.5%
Degradation per year 0.5% 0.5% 0.5% 0.5%
Guaranteed output power by end year 85.0% 83.0% 83.0% 83.0%
The twelve-year workmanship warranty is a relatively new trend in the PV market industry which places Philadelphia Solar at the upper range of the PV module manufacturers in terms of product warranty conditions.
Regarding degradation, the industry trend is moving towards a 0.5% as the lowest degradation rate till year 25 and in some cases even till year 30 and at least 97.5% first year power warranty. whereas Philadelphia Solar is offering a first-year power warranty of at least 97% and 97.5% and a degradation of 0.65%, 0.7% and 0.5% for monocrystalline, polycrystalline and Bifacial Mono-crystalline respectively. DNV GL would recommend improving warranty terms to follow the best practice in the industry.
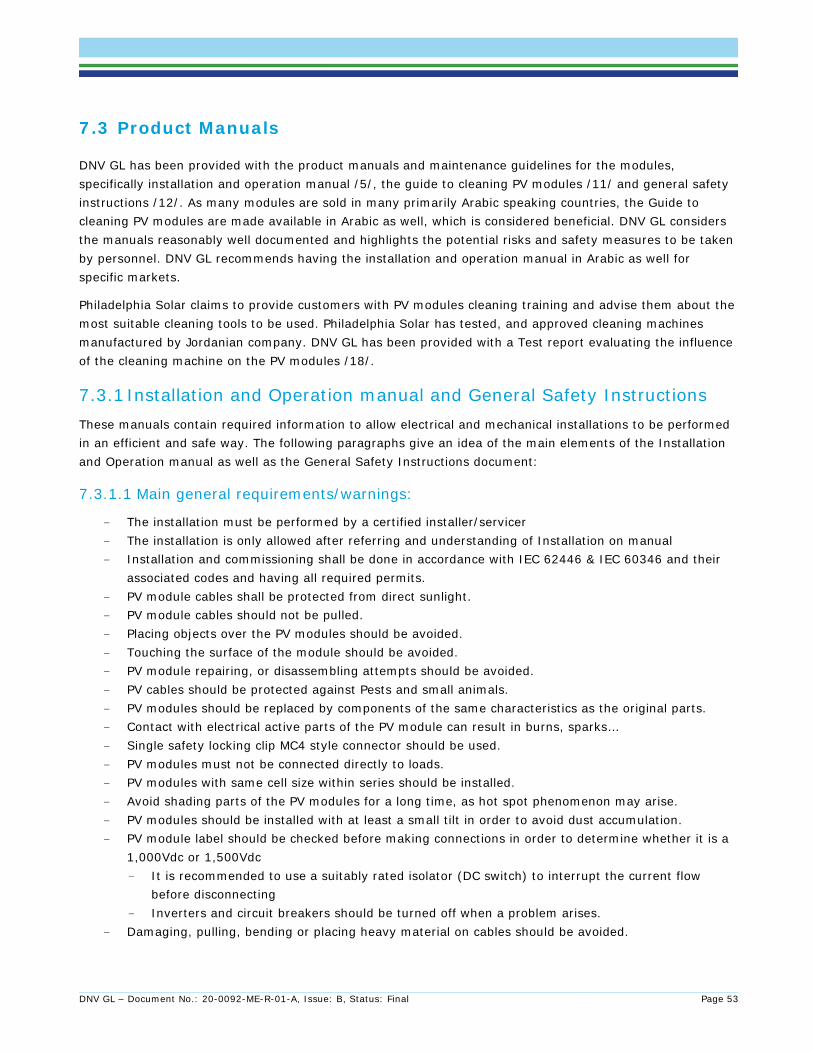
DNV GL – Document No.: 20-0092-ME-R-01-A, Issue: B, Status: Final Page 53
7.3 Product Manuals
DNV GL has been provided with the product manuals and maintenance guidelines for the modules, specifically installation and operation manual /5/, the guide to cleaning PV modules /11/ and general safety instructions /12/. As many modules are sold in many primarily Arabic speaking countries, the Guide to cleaning PV modules are made available in Arabic as well, which is considered beneficial. DNV GL considers the manuals reasonably well documented and highlights the potential risks and safety measures to be taken by personnel. DNV GL recommends having the installation and operation manual in Arabic as well for specific markets.
Philadelphia Solar claims to provide customers with PV modules cleaning training and advise them about the most suitable cleaning tools to be used. Philadelphia Solar has tested, and approved cleaning machines manufactured by Jordanian company. DNV GL has been provided with a Test report evaluating the influence of the cleaning machine on the PV modules /18/.
7.3.1 Installation and Operation manual and General Safety Instructions These manuals contain required information to allow electrical and mechanical installations to be performed in an efficient and safe way. The following paragraphs give an idea of the main elements of the Installation and Operation manual as well as the General Safety Instructions document:
7.3.1.1 Main general requirements/warnings:
- The installation must be performed by a certified installer/servicer - The installation is only allowed after referring and understanding of Installation on manual - Installation and commissioning shall be done in accordance with IEC 62446 & IEC 60346 and their
associated codes and having all required permits. - PV module cables shall be protected from direct sunlight. - PV module cables should not be pulled. - Placing objects over the PV modules should be avoided. - Touching the surface of the module should be avoided. - PV module repairing, or disassembling attempts should be avoided. - PV cables should be protected against Pests and small animals. - PV modules should be replaced by components of the same characteristics as the original parts. - Contact with electrical active parts of the PV module can result in burns, sparks… - Single safety locking clip MC4 style connector should be used. - PV modules must not be connected directly to loads. - PV modules with same cell size within series should be installed. - Avoid shading parts of the PV modules for a long time, as hot spot phenomenon may arise. - PV modules should be installed with at least a small tilt in order to avoid dust accumulation. - PV module label should be checked before making connections in order to determine whether it is a
1,000Vdc or 1,500Vdc - It is recommended to use a suitably rated isolator (DC switch) to interrupt the current flow
before disconnecting - Inverters and circuit breakers should be turned off when a problem arises.
- Damaging, pulling, bending or placing heavy material on cables should be avoided.
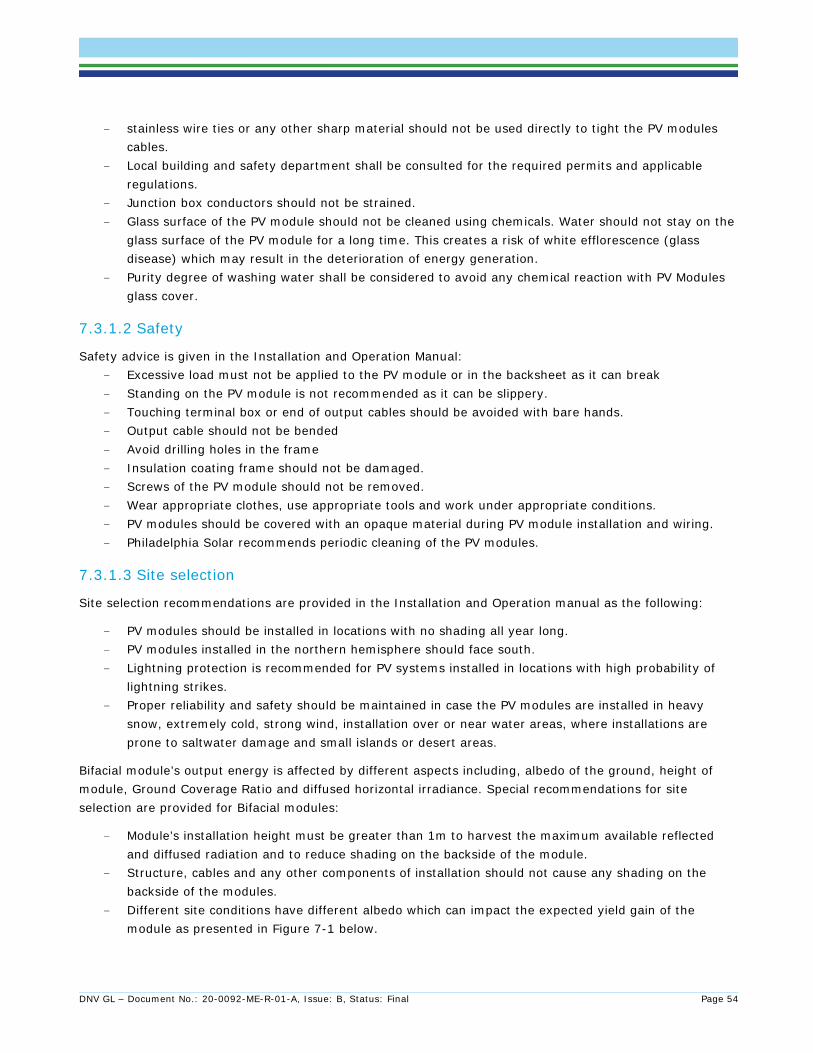
DNV GL – Document No.: 20-0092-ME-R-01-A, Issue: B, Status: Final Page 54
- stainless wire ties or any other sharp material should not be used directly to tight the PV modules cables.
- Local building and safety department shall be consulted for the required permits and applicable regulations.
- Junction box conductors should not be strained. - Glass surface of the PV module should not be cleaned using chemicals. Water should not stay on the
glass surface of the PV module for a long time. This creates a risk of white efflorescence (glass disease) which may result in the deterioration of energy generation.
- Purity degree of washing water shall be considered to avoid any chemical reaction with PV Modules glass cover.
7.3.1.2 Safety
Safety advice is given in the Installation and Operation Manual: - Excessive load must not be applied to the PV module or in the backsheet as it can break - Standing on the PV module is not recommended as it can be slippery. - Touching terminal box or end of output cables should be avoided with bare hands. - Output cable should not be bended - Avoid drilling holes in the frame - Insulation coating frame should not be damaged. - Screws of the PV module should not be removed. - Wear appropriate clothes, use appropriate tools and work under appropriate conditions. - PV modules should be covered with an opaque material during PV module installation and wiring. - Philadelphia Solar recommends periodic cleaning of the PV modules.
7.3.1.3 Site selection
Site selection recommendations are provided in the Installation and Operation manual as the following:
- PV modules should be installed in locations with no shading all year long. - PV modules installed in the northern hemisphere should face south. - Lightning protection is recommended for PV systems installed in locations with high probability of
lightning strikes. - Proper reliability and safety should be maintained in case the PV modules are installed in heavy
snow, extremely cold, strong wind, installation over or near water areas, where installations are prone to saltwater damage and small islands or desert areas.
Bifacial module’s output energy is affected by different aspects including, albedo of the ground, height of module, Ground Coverage Ratio and diffused horizontal irradiance. Special recommendations for site selection are provided for Bifacial modules:
- Module’s installation height must be greater than 1m to harvest the maximum available reflected and diffused radiation and to reduce shading on the backside of the module.
- Structure, cables and any other components of installation should not cause any shading on the backside of the modules.
- Different site conditions have different albedo which can impact the expected yield gain of the module as presented in Figure 7-1 below.
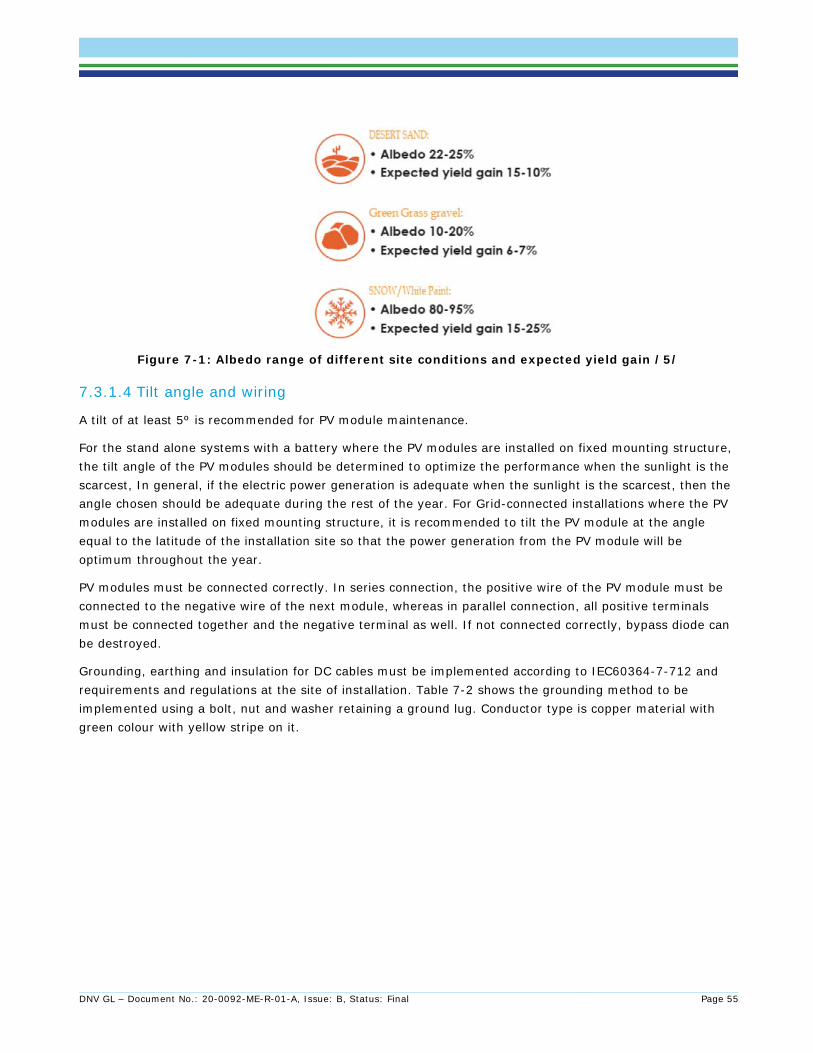
DNV GL – Document No.: 20-0092-ME-R-01-A, Issue: B, Status: Final Page 55
Figure 7-1: Albedo range of different site conditions and expected yield gain /5/
7.3.1.4 Tilt angle and wiring
A tilt of at least 5º is recommended for PV module maintenance.
For the stand alone systems with a battery where the PV modules are installed on fixed mounting structure, the tilt angle of the PV modules should be determined to optimize the performance when the sunlight is the scarcest, In general, if the electric power generation is adequate when the sunlight is the scarcest, then the angle chosen should be adequate during the rest of the year. For Grid-connected installations where the PV modules are installed on fixed mounting structure, it is recommended to tilt the PV module at the angle equal to the latitude of the installation site so that the power generation from the PV module will be optimum throughout the year.
PV modules must be connected correctly. In series connection, the positive wire of the PV module must be connected to the negative wire of the next module, whereas in parallel connection, all positive terminals must be connected together and the negative terminal as well. If not connected correctly, bypass diode can be destroyed.
Grounding, earthing and insulation for DC cables must be implemented according to IEC60364-7-712 and requirements and regulations at the site of installation. Table 7-2 shows the grounding method to be implemented using a bolt, nut and washer retaining a ground lug. Conductor type is copper material with green colour with yellow stripe on it.
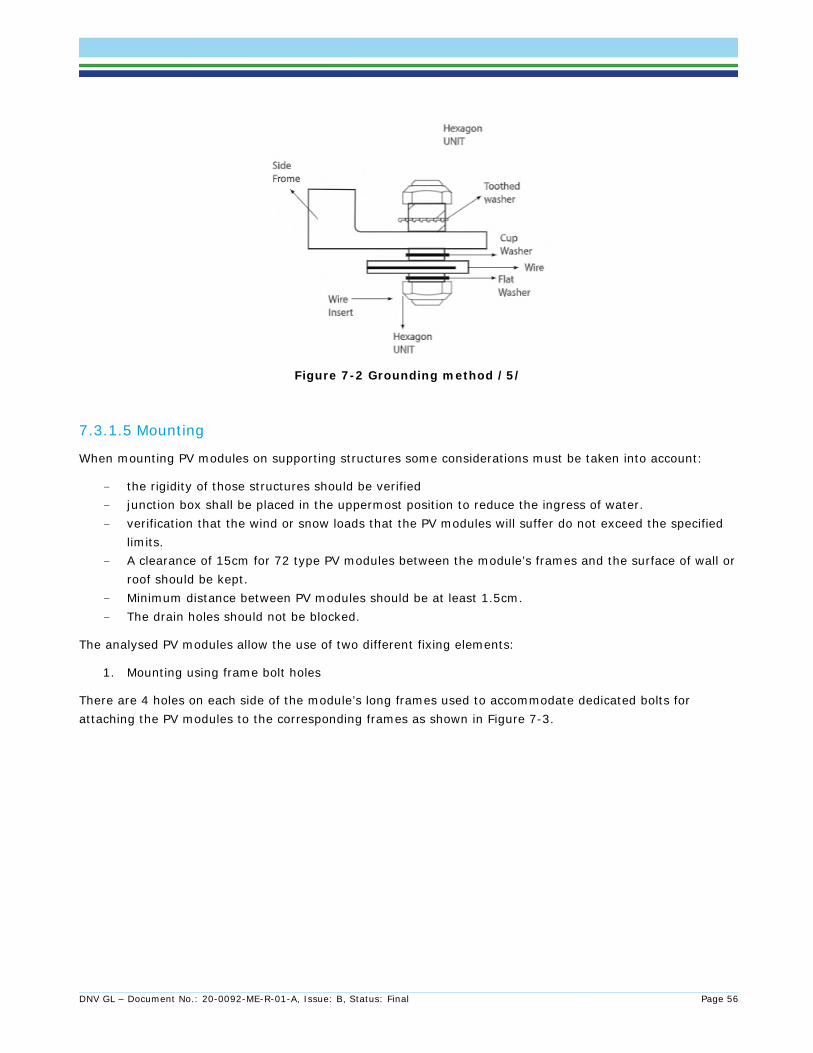
DNV GL – Document No.: 20-0092-ME-R-01-A, Issue: B, Status: Final Page 56
Figure 7-2 Grounding method /5/
7.3.1.5 Mounting
When mounting PV modules on supporting structures some considerations must be taken into account:
- the rigidity of those structures should be verified - junction box shall be placed in the uppermost position to reduce the ingress of water. - verification that the wind or snow loads that the PV modules will suffer do not exceed the specified
limits. - A clearance of 15cm for 72 type PV modules between the module’s frames and the surface of wall or
roof should be kept. - Minimum distance between PV modules should be at least 1.5cm. - The drain holes should not be blocked.
The analysed PV modules allow the use of two different fixing elements:
1. Mounting using frame bolt holes
There are 4 holes on each side of the module’s long frames used to accommodate dedicated bolts for attaching the PV modules to the corresponding frames as shown in Figure 7-3.
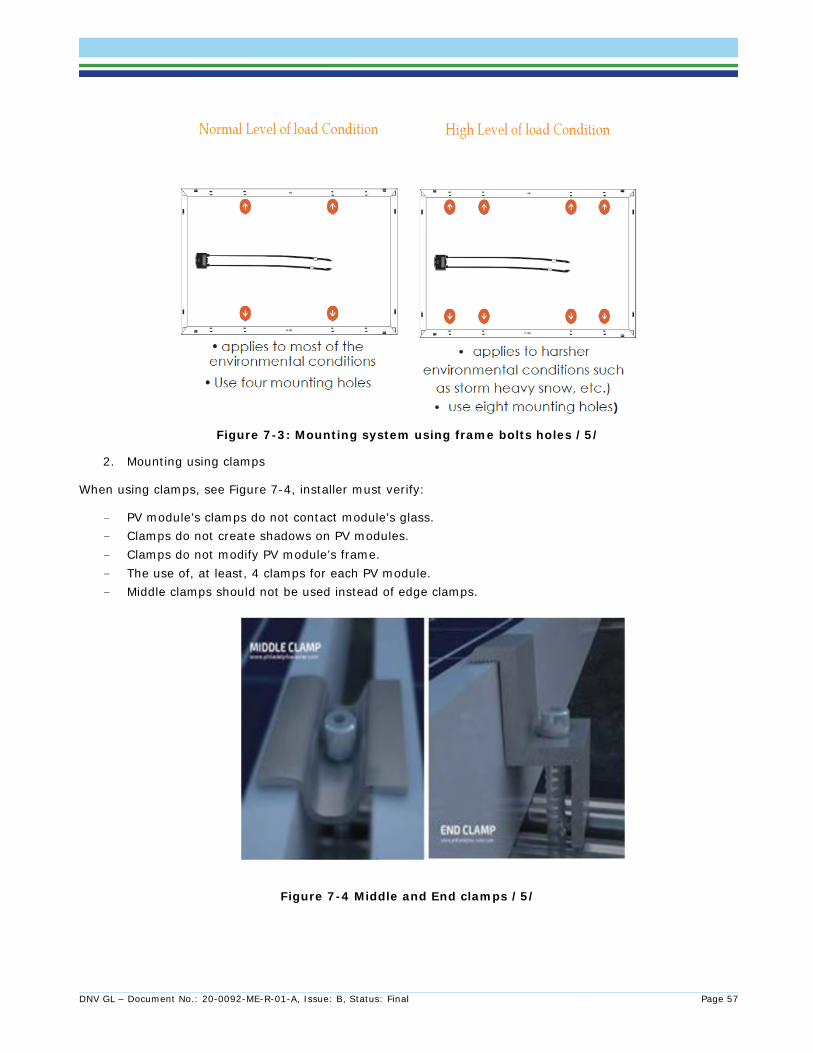
DNV GL – Document No.: 20-0092-ME-R-01-A, Issue: B, Status: Final Page 57
Figure 7-3: Mounting system using frame bolts holes /5/
2. Mounting using clamps
When using clamps, see Figure 7-4, installer must verify:
- PV module’s clamps do not contact module’s glass. - Clamps do not create shadows on PV modules. - Clamps do not modify PV module’s frame. - The use of, at least, 4 clamps for each PV module. - Middle clamps should not be used instead of edge clamps.
Figure 7-4 Middle and End clamps /5/
DNV GL – Document No.: 20-0092-ME-R-01-A, Issue: B, Status: Final Page 58
7.3.1.6 Unpacking and storage
Some recommendations are stated in /5/ regarding unpacking tasks and storage:
- PV modules must be left in their original box until installation and kept in clean and dry area - Respect the maximum allowable number of pallets to be piled up. - Electrical contacts with corrosion should not be installed. - PV modules should not be placed directly over others. - Wire cutting pliers are recommended to be used for removing plastic straps on pallets. - Two workers are required to unpack modules from packing pallet. - Module packages should be stored in a clean, dry area with relative humidity below %85 and
ambient temperatures between (-20 to 40) °C.
7.3.2 Guide to Cleaning PV modules Perform a proper cleaning of the PV modules is a task of high importance because, risk of shock is high when PV modules are wet, dirt and dust can be accumulated on PV modules and can reduce the module performance and can cause hot spot effect. Some recommendations have been provided in the Cleaning guide /11/:
- PV modules should not be cleaned when temperature difference between PV modules and the cleaning material is high.
- PV modules with broken glass or exposed wiring should not be cleaned as they may present shock hazard.
- PV modules surface should be cleaned with a soft brush with a recommended pressure less than 5.4kPa.
- Water with high mineral content is not recommended. Philadelphia Solar PV modules are supposed to contain a hydrophobic anti-reflective coating on the glass. Nonabrasive / non-caustic detergent should be used.
- The use of steam or corrosive chemicals are not recommended. DNV GL recommends including recommendations for the cleaning with robots or other automatic cleaning approaches. This recommendation has not been improved since DNV GL’s visit last year.
DNV GL – Document No.: 20-0092-ME-R-01-A, Issue: B, Status: Final Page 59
8 REFERENCES
/1/ company_profile_updated_feb_2020.pdf
/2/ PS_references_(international)JAN2020.pdf
/3/ Overview about Philadelphia Solar
/4/ Test sample by fraunhofer laboratory
/5/ Installation_Manual-_Standard_and_Bifacial_Module
/6/ No 3 LID degradation
/7/ 21243571.001_Report PID Philadelphia Solar_final.pdf
/8/ Philadelphia Solar_Organizational Structure-v1.pdf
/9/ Suppliers certificates.pdf
/10/ Warranty claims 2019 Log.xls
/11/ Philadelphia_Solar_-_Guide_to_cleaning.pdf
/12/ General_Safety_Instructions_-_English.pdf
/13/ PS History Presentation.pdf
/14/ No1_CEC_Report.pdf
/15/ 21229802_ Philadelphia Solar_PID_Declaration_2pfg 2387_04.14.pdf
/16/ FI 2017_21183161.006_Factory inspection report_Philadelphia Solar.pdf
/17/ No2 AR coated Glass Specification.pdf
/18/ No 30 Philadelphia Solar – Cleaning Machine – Test Report.pdf
/19/ No 10 M72 datasheet
/20/ PHS QUALITY CONTROL PLAN.pdf
/21/ Production flowchart rev1.pdf
/22/ Monitoring and Measurement of product.pdf
/23/ QP-04-03-F3/Rev0. File: In house Quality Tests.pdf
/24/ Production Order no: 62009022020. Issuing Date. 09/02/2020
/25/ Facility equipment list. File: Plant Equipment Survey 01_Philadelphia solar.xlsx
/26/ Bifacial BOM CDF 319440015.001 UL 1703 rev1.pdf
/27/ http://bifipv-workshop.com/fileadmin/layout/images/Konstanz-2017/2__T._Dullweber_ISFH_PERC_
/28/ ISO 18001_2007.pdf
/29/ IEC – Test report from Solar PTL: 319440014.001_PHL190703_IEC2016.pdf
/30/ IEC Certificate from Solar PTL: IEC certificate ( BF ) 405 W _ 335 W _ V 722040001.01 Certificate IEC.pdf
/31/ UL – Test report from Solar PTL: 319440015.001_PHL190703_UL61730 rev1.pdf
/32/ UL Certificate from Solar PTL: UL61730_M72(BF)_405 W _335 W.pdf
/33/ CEC Test report R1-PHL190906.pdf
/34/ Transparent bs - Cynagard 465A(R).pdf
/35/ International Technology Roadmap for Photovoltaics (ITRPV) 10th Edition March 2019, https://itrpv.vdma.org/
DNV GL – Document No.: 20-0092-ME-R-01-A, Issue: B, Status: Final Page 60
/36/ http://solarprofessional.com/articles/design-installation/bifacial-pv-systems?v=disable_pagination&nopaging=1#.WoqHXKiWaUk
/37/ R1-PHL190906 _CEC_BF.pdf /38/ R1-PHL191231 CEC_M72_380.pdf /39/ R2-PHL191010 CEC_ M60_320.pdf /40/ R3-PHL190906 CEC_P72_335.pdf /41/ R3-PHL191010 CEC_P60_275.pdf /42/ Datasheet : PS-M60-xxx.pdf /433/ Datasheet : PS-M72(BF)-xxx (WARD).pdf /44/ Datasheet : PS-M72(BF)-xxx.pdf /45/ Datasheet : PS-M72-xxx up to 405 W.pdf /46/ Datasheet : PS-M72-xxx.pdf /47/ Datasheet : PS-P60-xxx.pdf /48/ Datasheet : PS-P72-xxx.pdf /49/ R1-PHL190909-LeTID.pdf /50/ Attach 02-01_R2-PHL190909-PAN file.pdf /51/ 21229802_CEC_Philadelphia Solar.pdf /52/ 21290449.002_21243643_Philadelphia Solar_CEC_Report.pdf /53/ Attach 02-02_Transparent backsheet Cynagard 465A(R) test report.pdf /54/ 320440003.001_PHL190613_IEC2016.pdf /55/ 319440014.001_PHL190703_IEC2016 /56/ LaminatorIntro0419.pdf /57/ TA Laminator 25022018rev.1.pdf
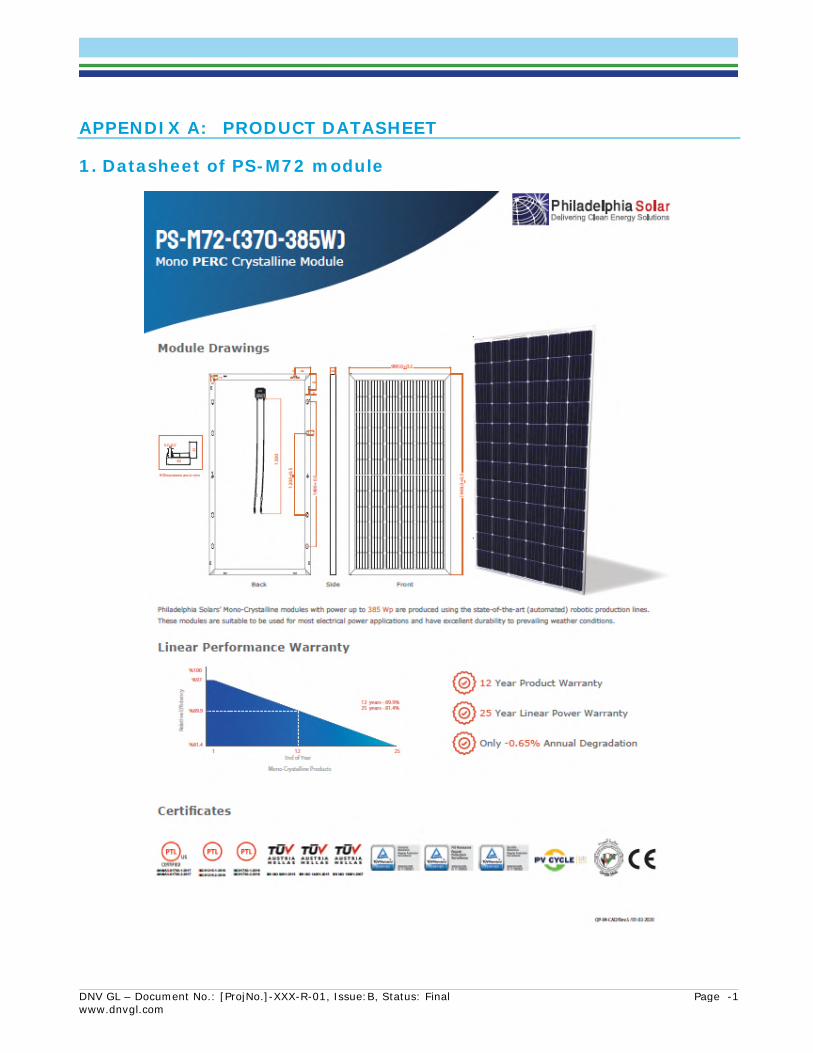
DNV GL – Document No.: [ProjNo.]-XXX-R-01, Issue:B, Status: Final Page -1 www.dnvgl.com
APPENDIX A: PRODUCT DATASHEET
1. Datasheet of PS-M72 module
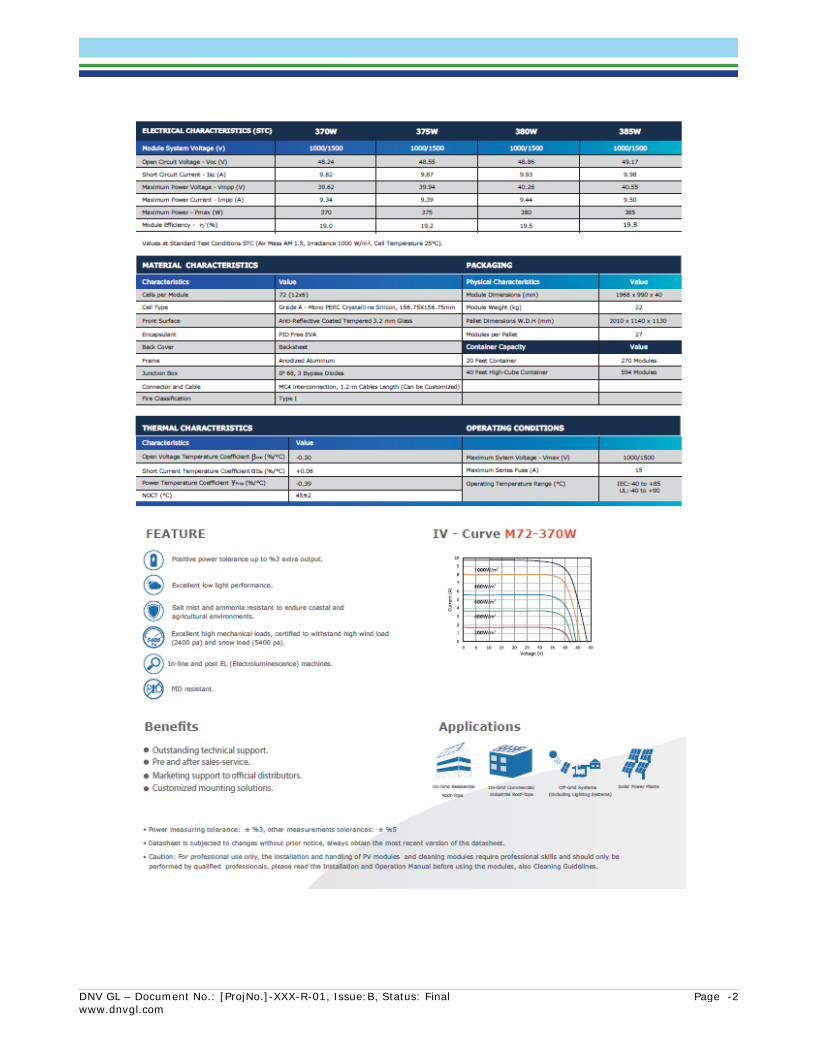
DNV GL – Document No.: [ProjNo.]-XXX-R-01, Issue:B, Status: Final Page -2 www.dnvgl.com
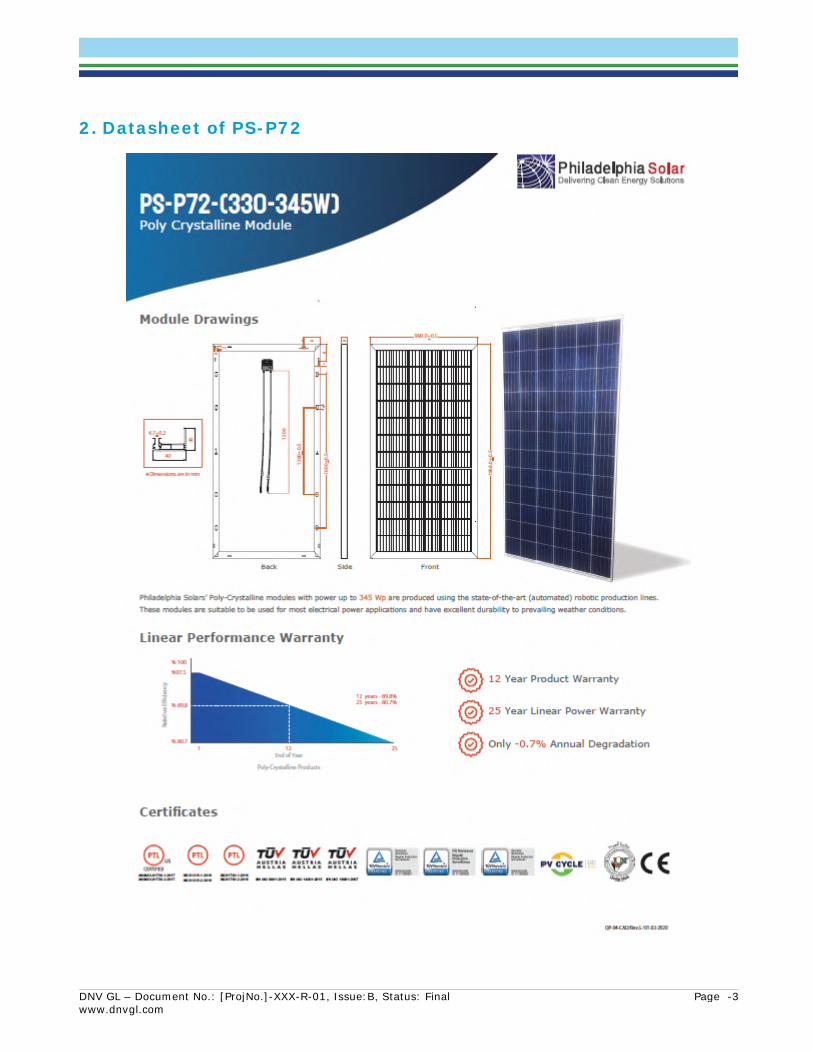
DNV GL – Document No.: [ProjNo.]-XXX-R-01, Issue:B, Status: Final Page -3 www.dnvgl.com
2. Datasheet of PS-P72
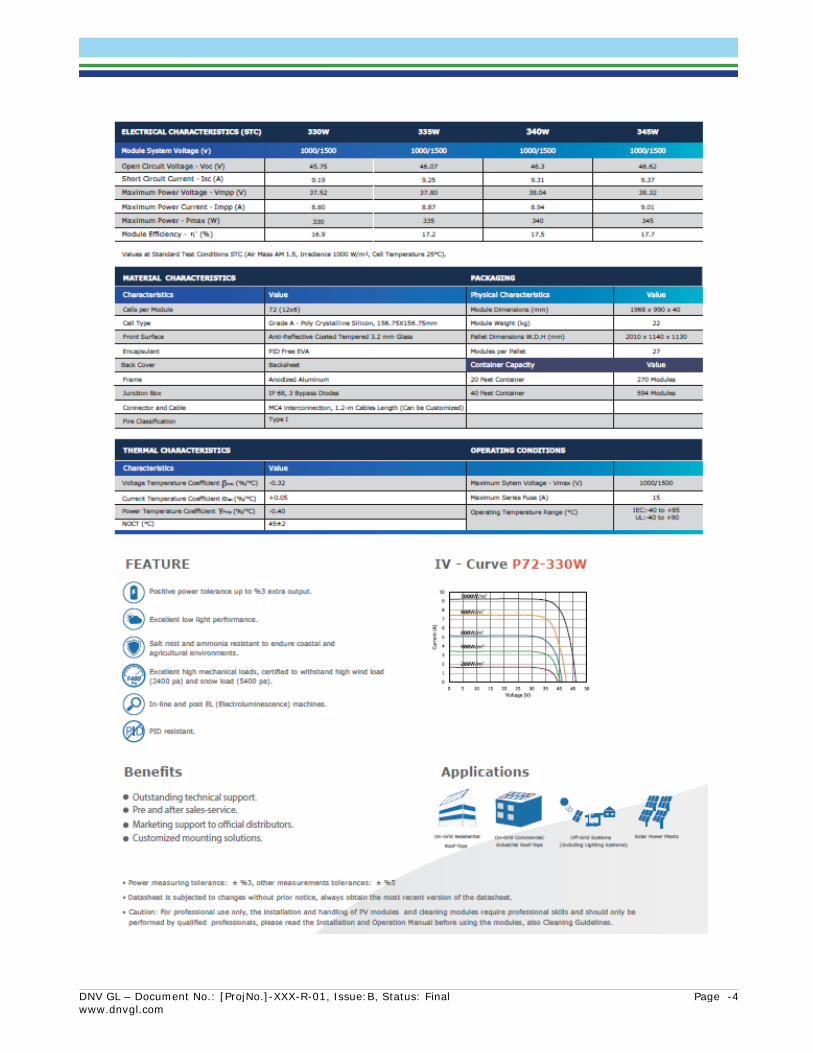
DNV GL – Document No.: [ProjNo.]-XXX-R-01, Issue:B, Status: Final Page -4 www.dnvgl.com
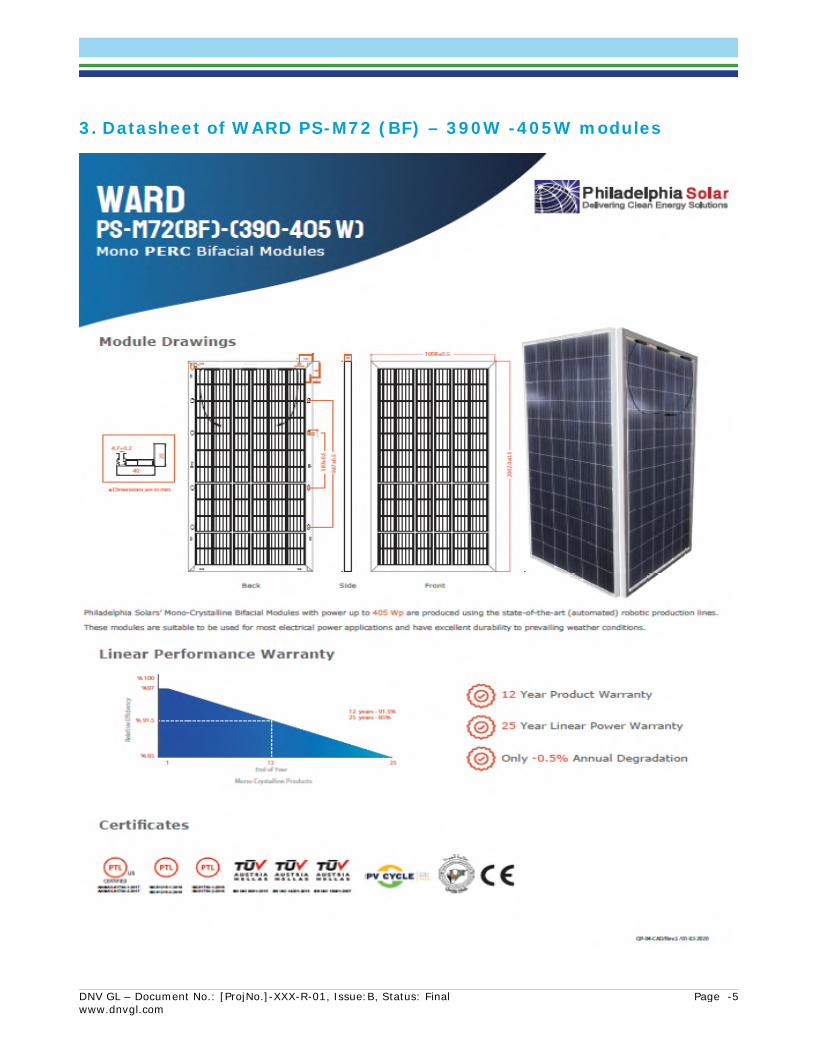
DNV GL – Document No.: [ProjNo.]-XXX-R-01, Issue:B, Status: Final Page -5 www.dnvgl.com
3. Datasheet of WARD PS-M72 (BF) – 390W -405W modules
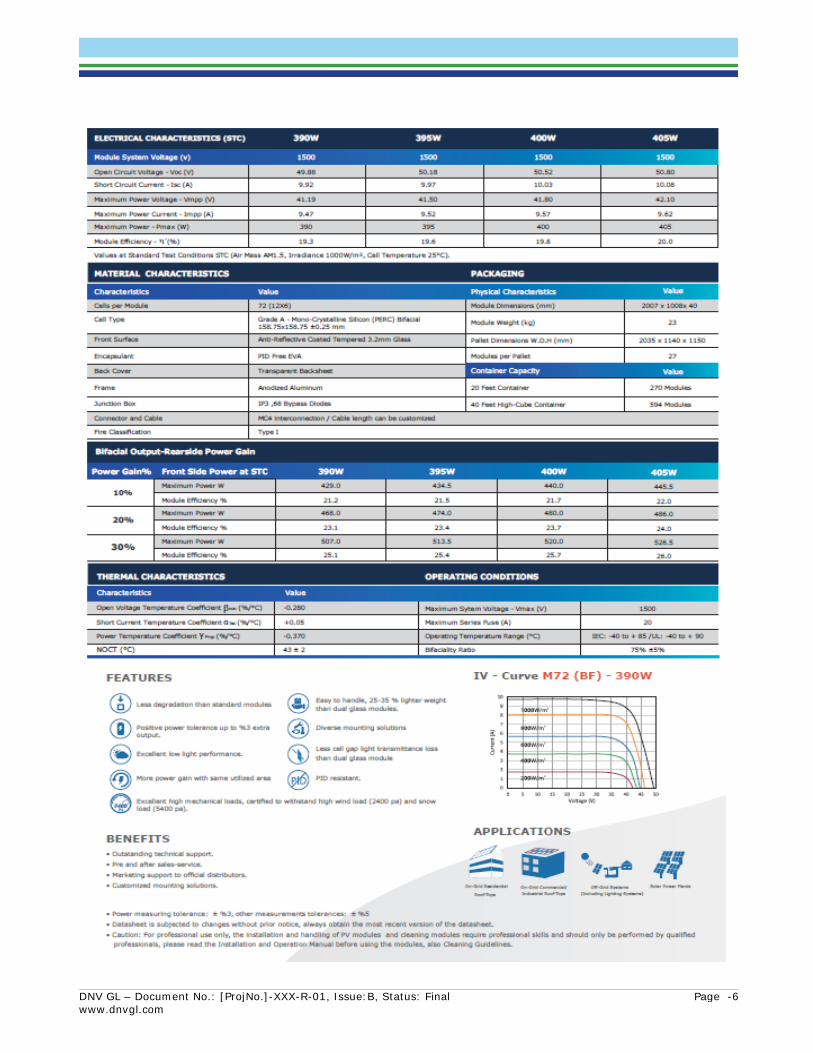
DNV GL – Document No.: [ProjNo.]-XXX-R-01, Issue:B, Status: Final Page -6 www.dnvgl.com
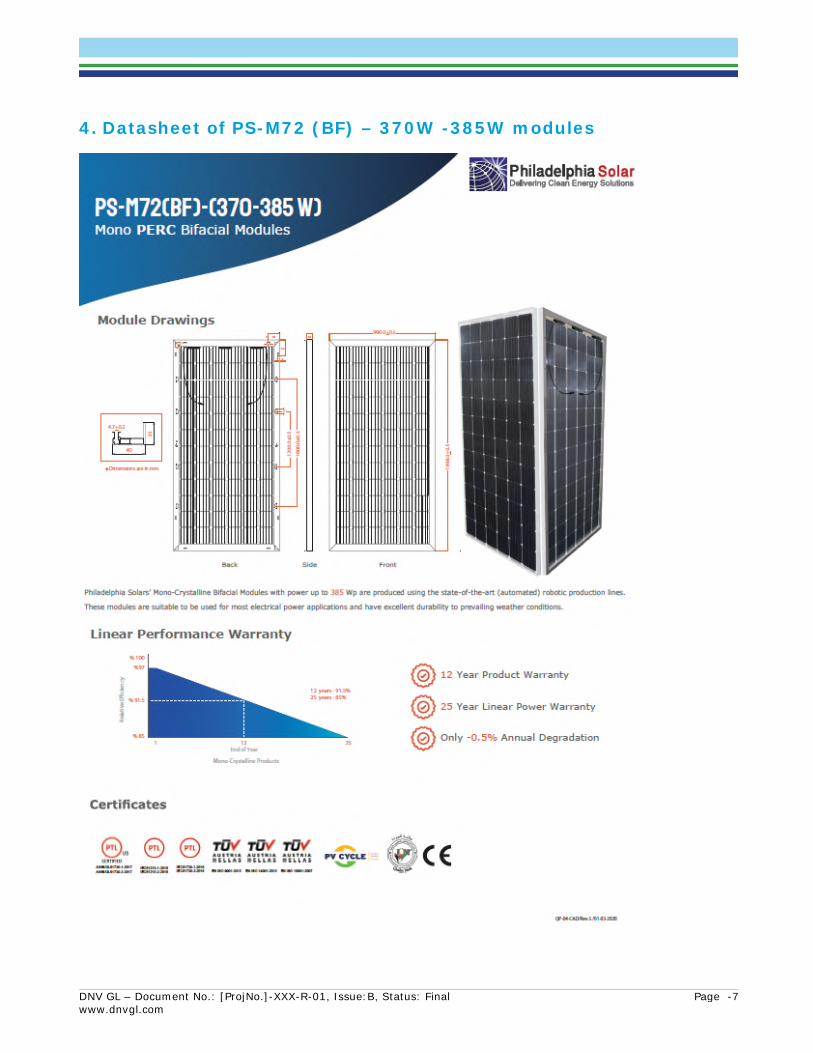
DNV GL – Document No.: [ProjNo.]-XXX-R-01, Issue:B, Status: Final Page -7 www.dnvgl.com
4. Datasheet of PS-M72 (BF) – 370W -385W modules
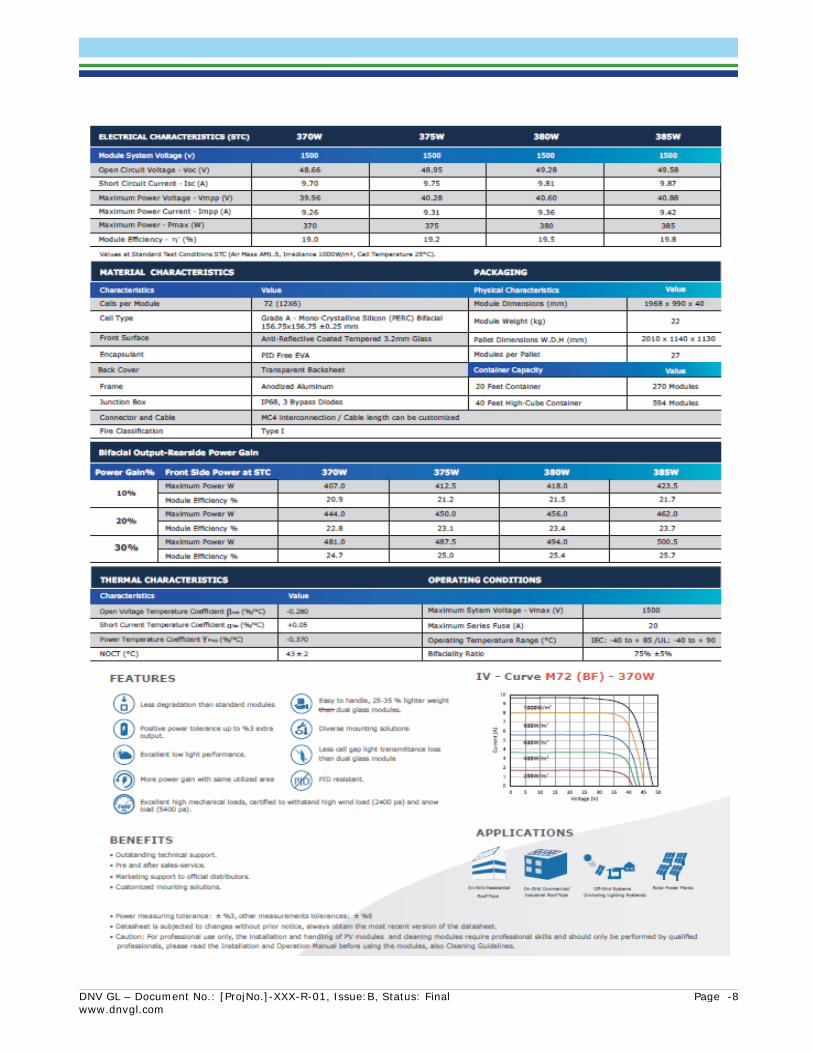
DNV GL – Document No.: [ProjNo.]-XXX-R-01, Issue:B, Status: Final Page -8 www.dnvgl.com
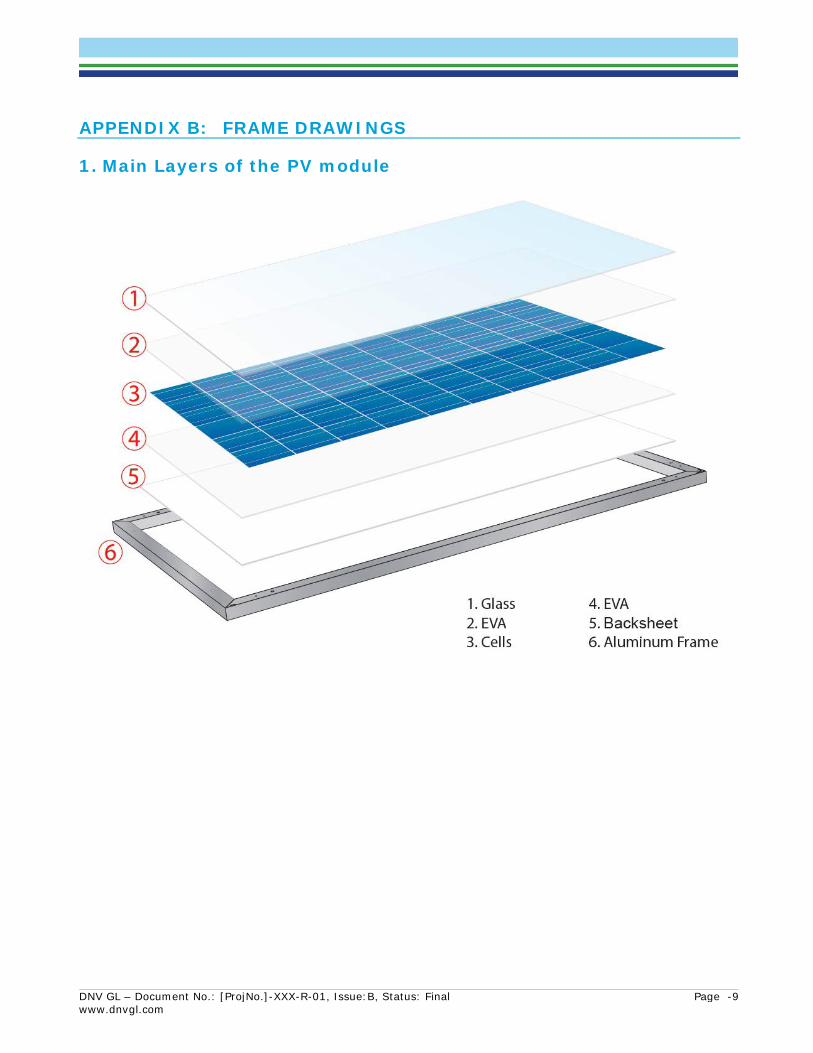
DNV GL – Document No.: [ProjNo.]-XXX-R-01, Issue:B, Status: Final Page -9 www.dnvgl.com
APPENDIX B: FRAME DRAWINGS
1. Main Layers of the PV module

DNV GL – Document No.: [ProjNo.]-XXX-R-01, Issue:B, Status: Final Page -10 www.dnvgl.com
2. Frame drawing of M60 – 5BB
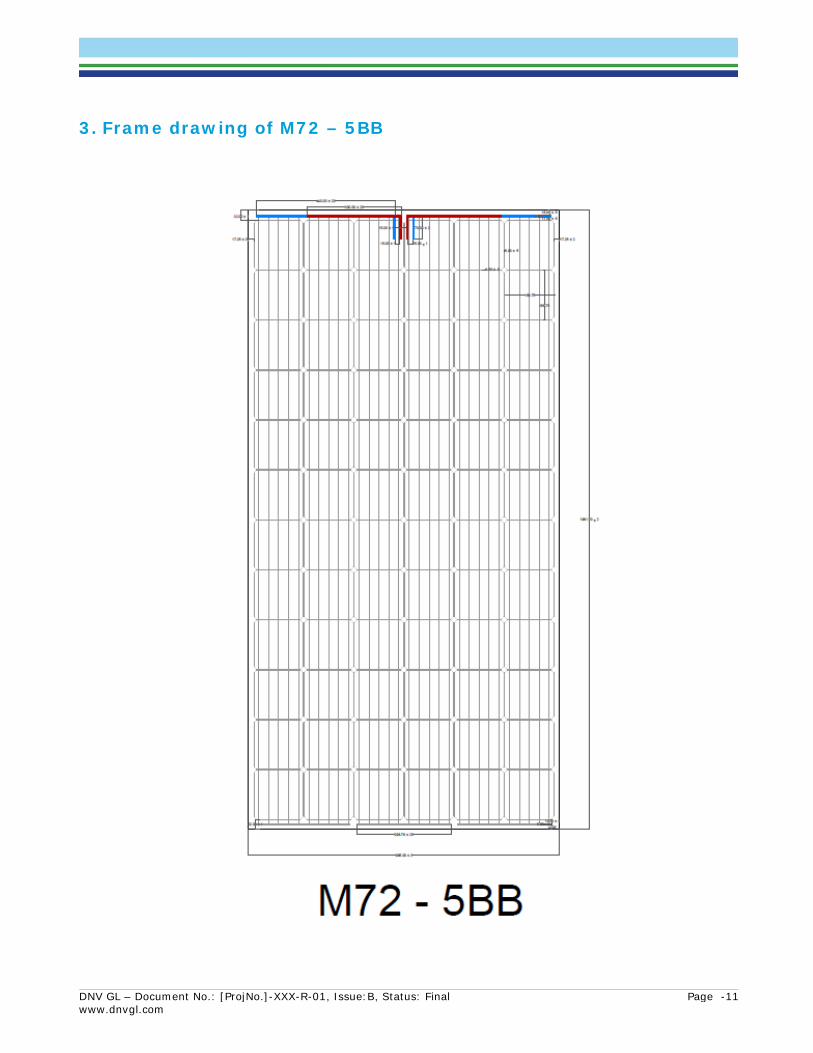
DNV GL – Document No.: [ProjNo.]-XXX-R-01, Issue:B, Status: Final Page -11 www.dnvgl.com
3. Frame drawing of M72 – 5BB
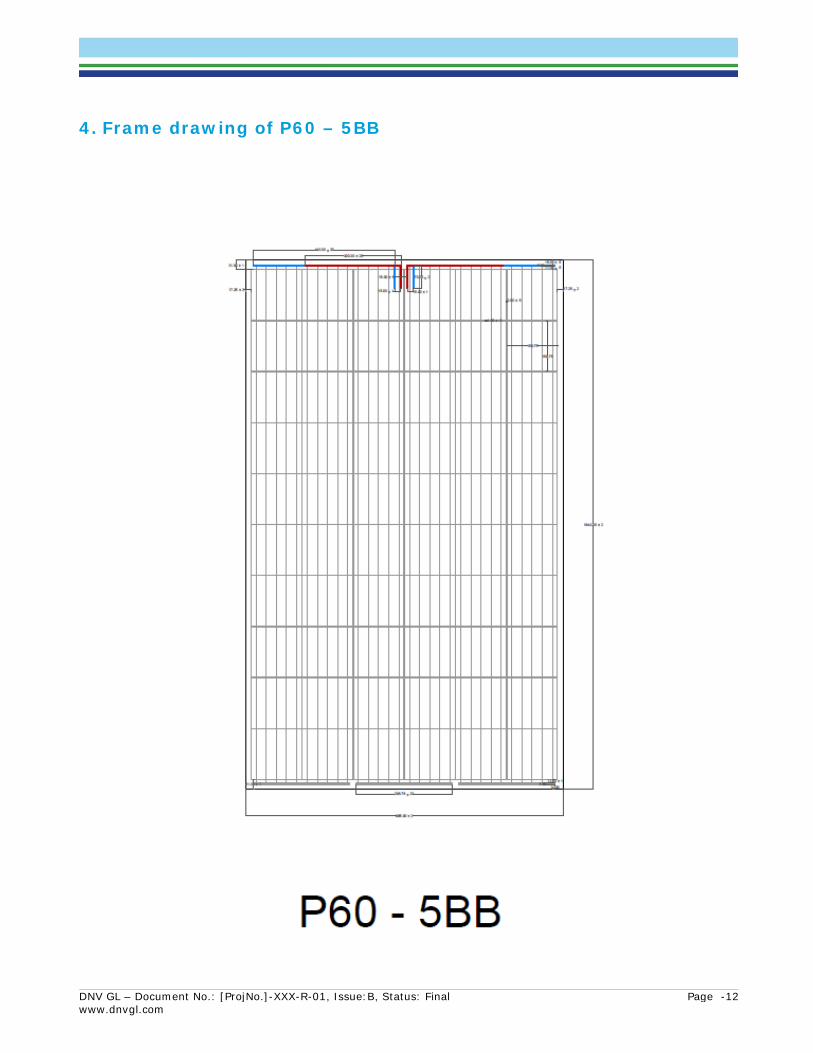
DNV GL – Document No.: [ProjNo.]-XXX-R-01, Issue:B, Status: Final Page -12 www.dnvgl.com
4. Frame drawing of P60 – 5BB
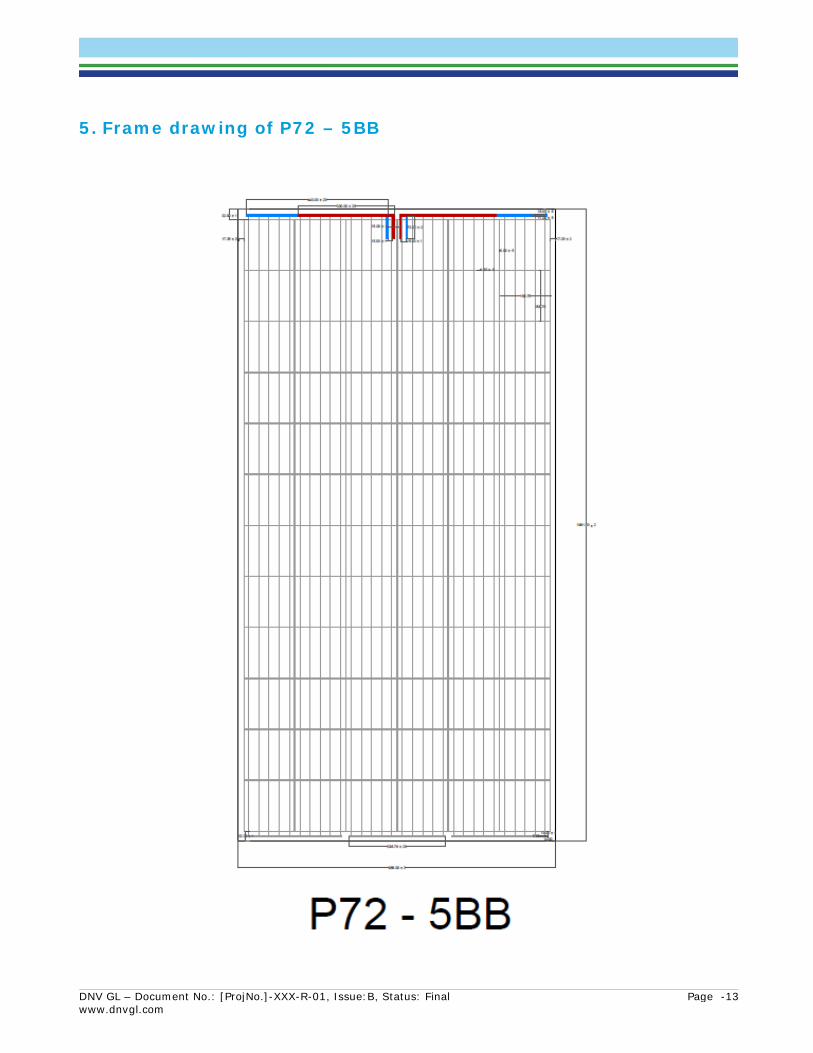
DNV GL – Document No.: [ProjNo.]-XXX-R-01, Issue:B, Status: Final Page -13 www.dnvgl.com
5. Frame drawing of P72 – 5BB
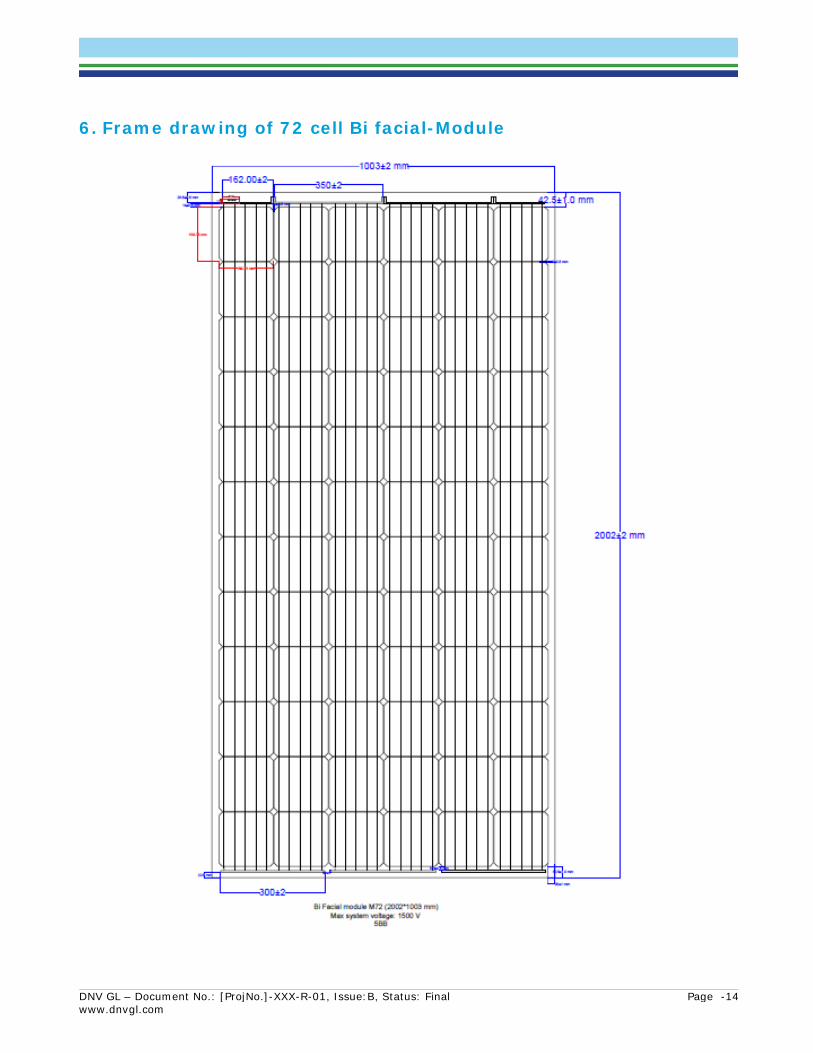
DNV GL – Document No.: [ProjNo.]-XXX-R-01, Issue:B, Status: Final Page -14 www.dnvgl.com
6. Frame drawing of 72 cell Bi facial-Module
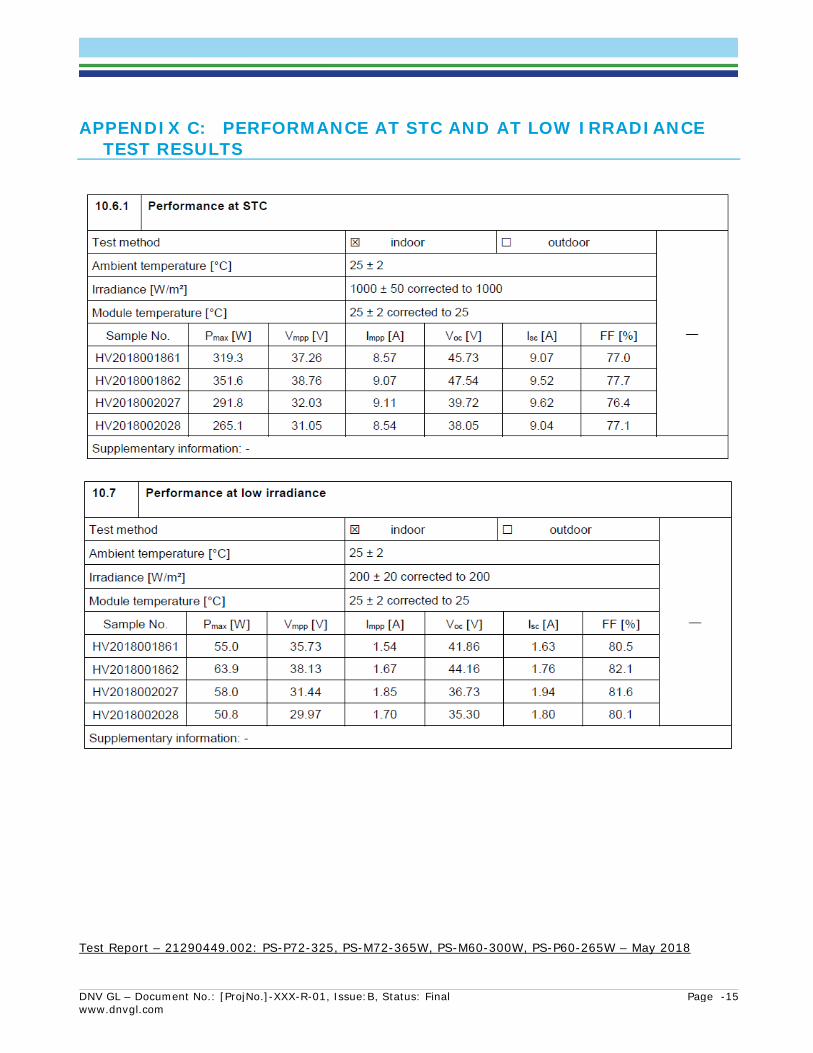
DNV GL – Document No.: [ProjNo.]-XXX-R-01, Issue:B, Status: Final Page -15 www.dnvgl.com
APPENDIX C: PERFORMANCE AT STC AND AT LOW IRRADIANCE TEST RESULTS
Test Report – 21290449.002: PS-P72-325, PS-M72-365W, PS-M60-300W, PS-P60-265W – May 2018
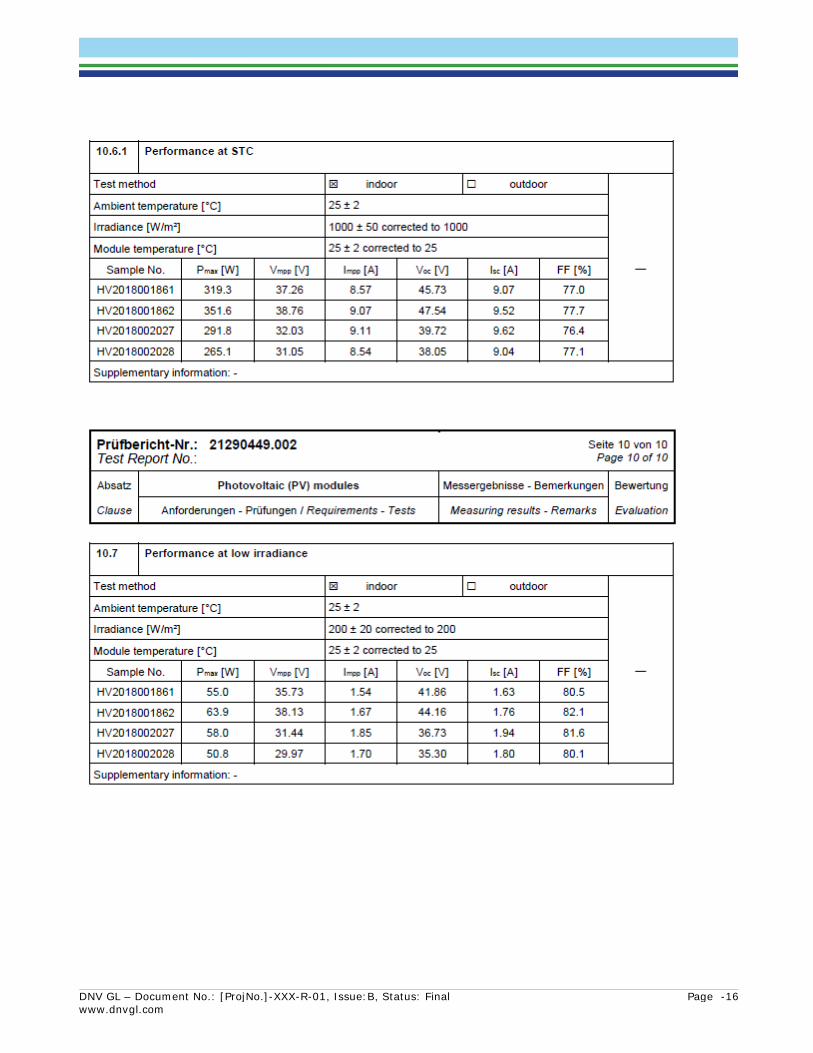
DNV GL – Document No.: [ProjNo.]-XXX-R-01, Issue:B, Status: Final Page -16 www.dnvgl.com
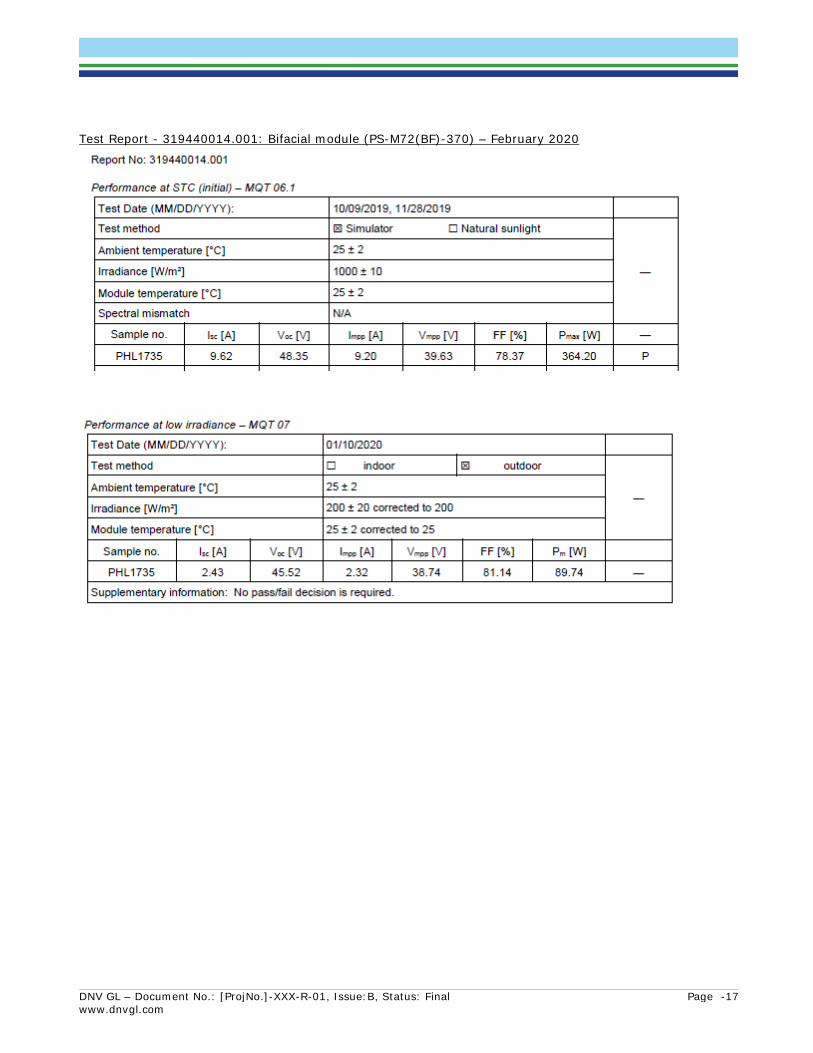
DNV GL – Document No.: [ProjNo.]-XXX-R-01, Issue:B, Status: Final Page -17 www.dnvgl.com
Test Report - 319440014.001: Bifacial module (PS-M72(BF)-370) – February 2020
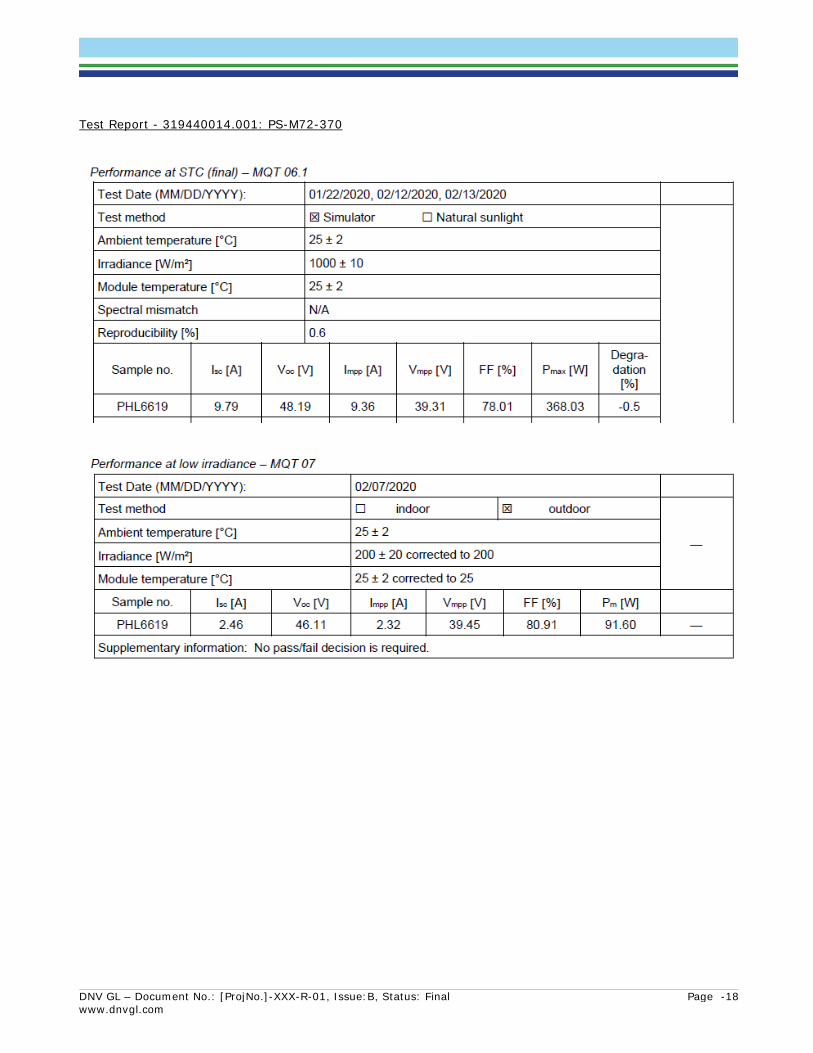
DNV GL – Document No.: [ProjNo.]-XXX-R-01, Issue:B, Status: Final Page -18 www.dnvgl.com
Test Report - 319440014.001: PS-M72-370
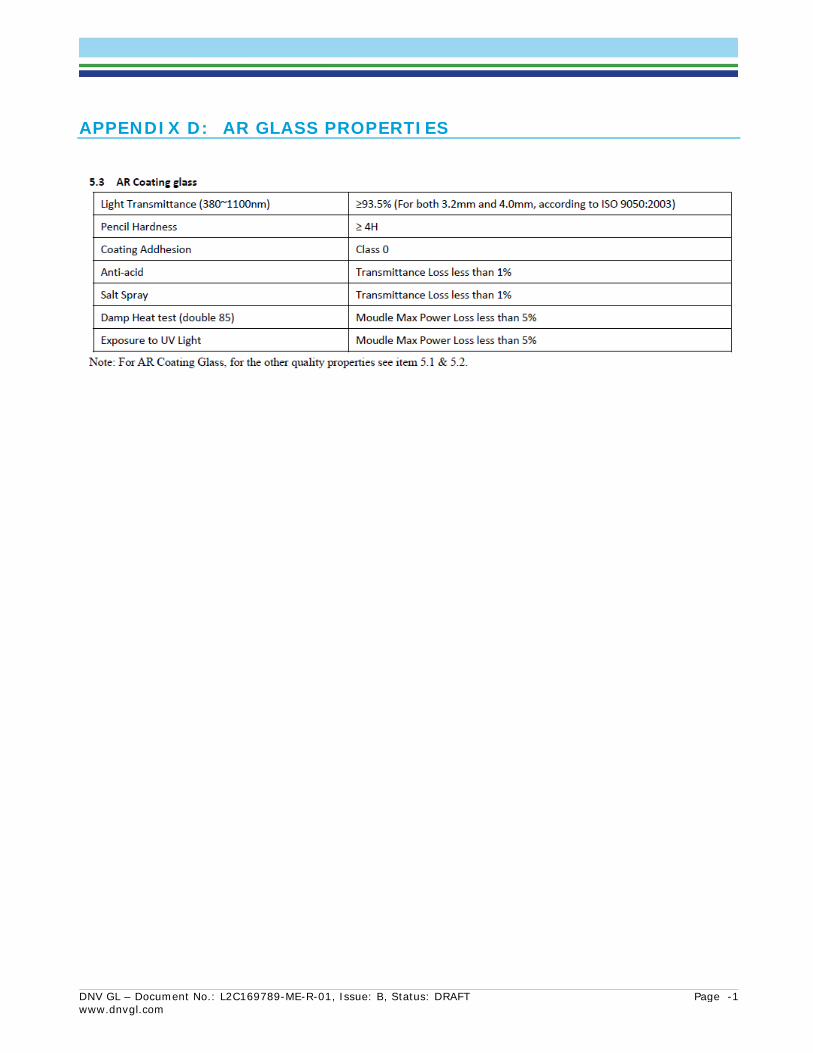
DNV GL – Document No.: L2C169789-ME-R-01, Issue: B, Status: DRAFT Page -1 www.dnvgl.com
APPENDIX D: AR GLASS PROPERTIES
DNV GL – Document No.: L2C169789-ME-R-01, Issue: B, Status: DRAFT Page -2 www.dnvgl.com
APPENDIX E: PHILADELPHIA QUALITY CHECK LIST
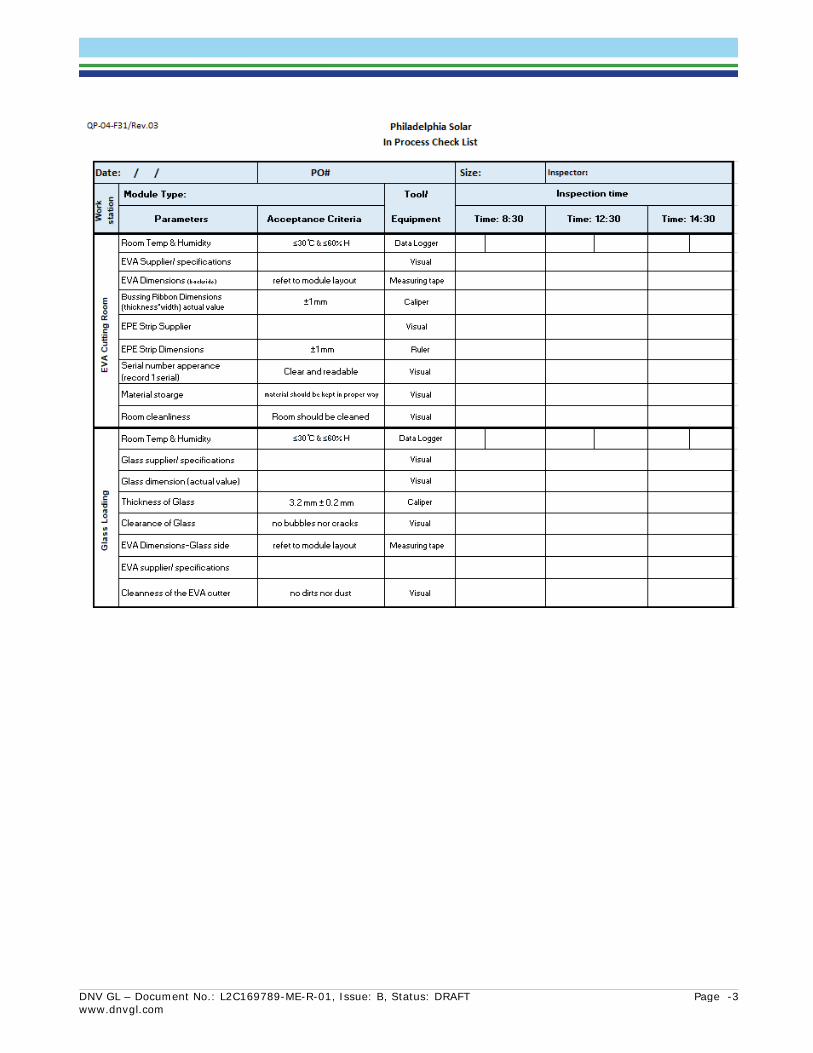
DNV GL – Document No.: L2C169789-ME-R-01, Issue: B, Status: DRAFT Page -3 www.dnvgl.com

DNV GL – Document No.: L2C169789-ME-R-01, Issue: B, Status: DRAFT Page -4 www.dnvgl.com
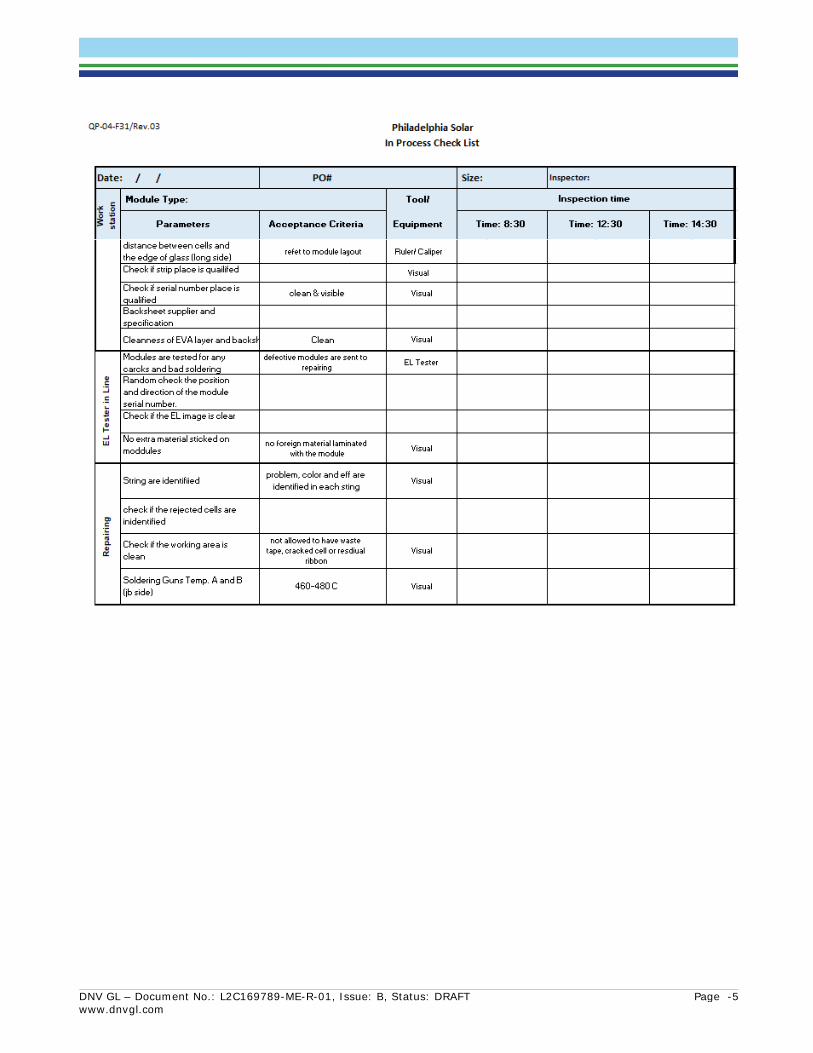
DNV GL – Document No.: L2C169789-ME-R-01, Issue: B, Status: DRAFT Page -5 www.dnvgl.com
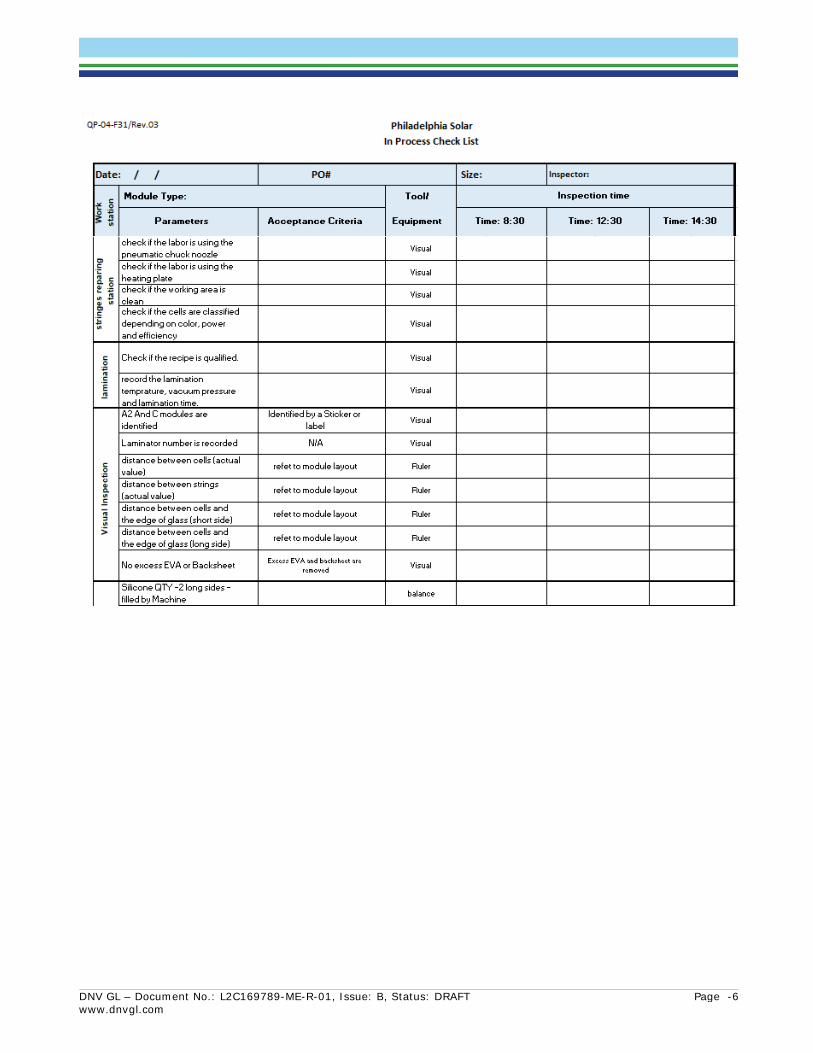
DNV GL – Document No.: L2C169789-ME-R-01, Issue: B, Status: DRAFT Page -6 www.dnvgl.com
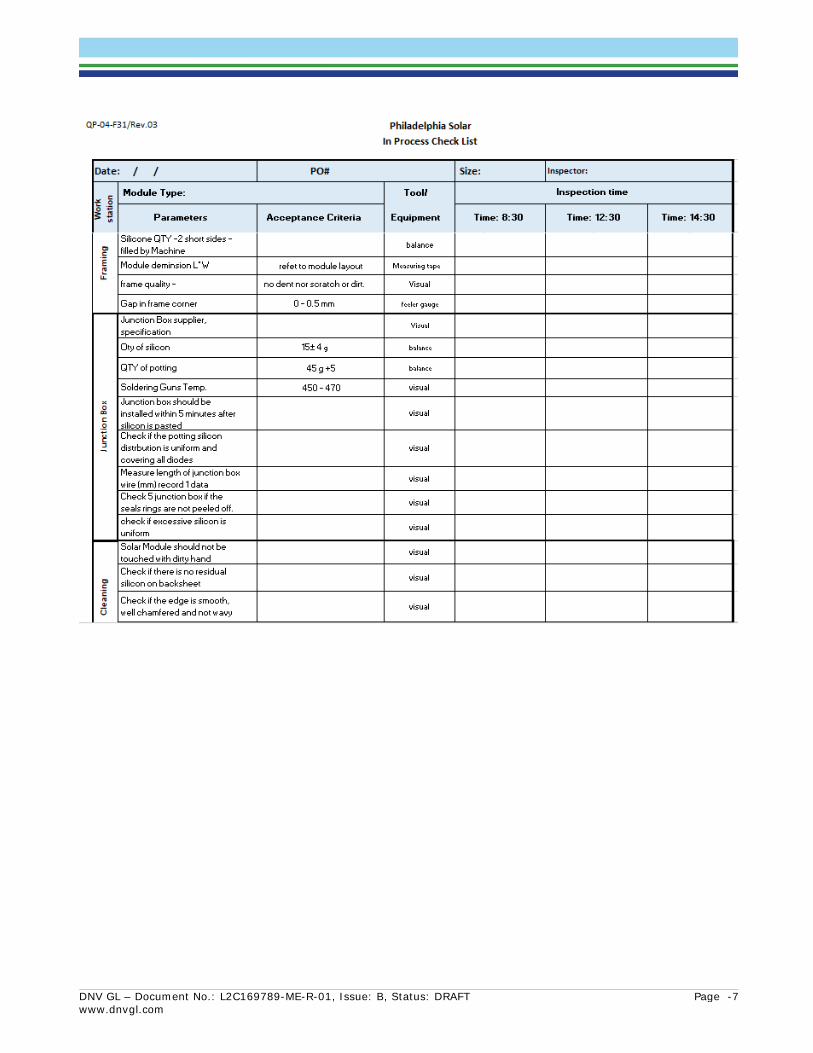
DNV GL – Document No.: L2C169789-ME-R-01, Issue: B, Status: DRAFT Page -7 www.dnvgl.com
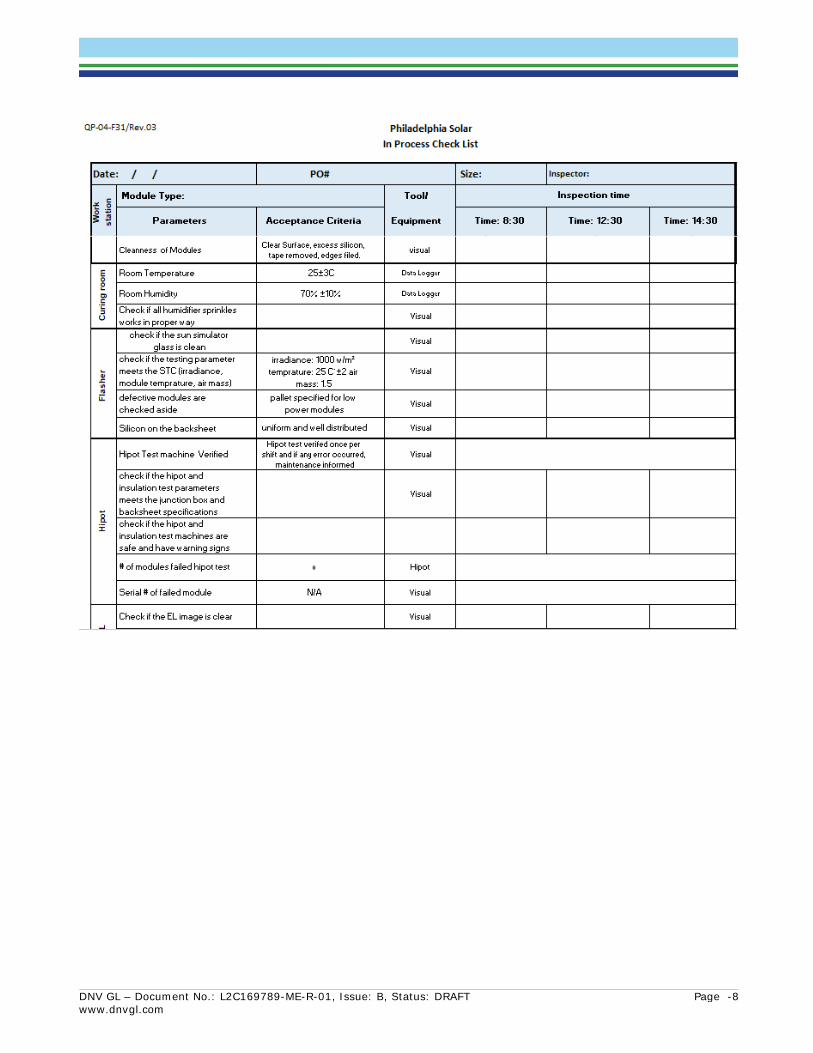
DNV GL – Document No.: L2C169789-ME-R-01, Issue: B, Status: DRAFT Page -8 www.dnvgl.com
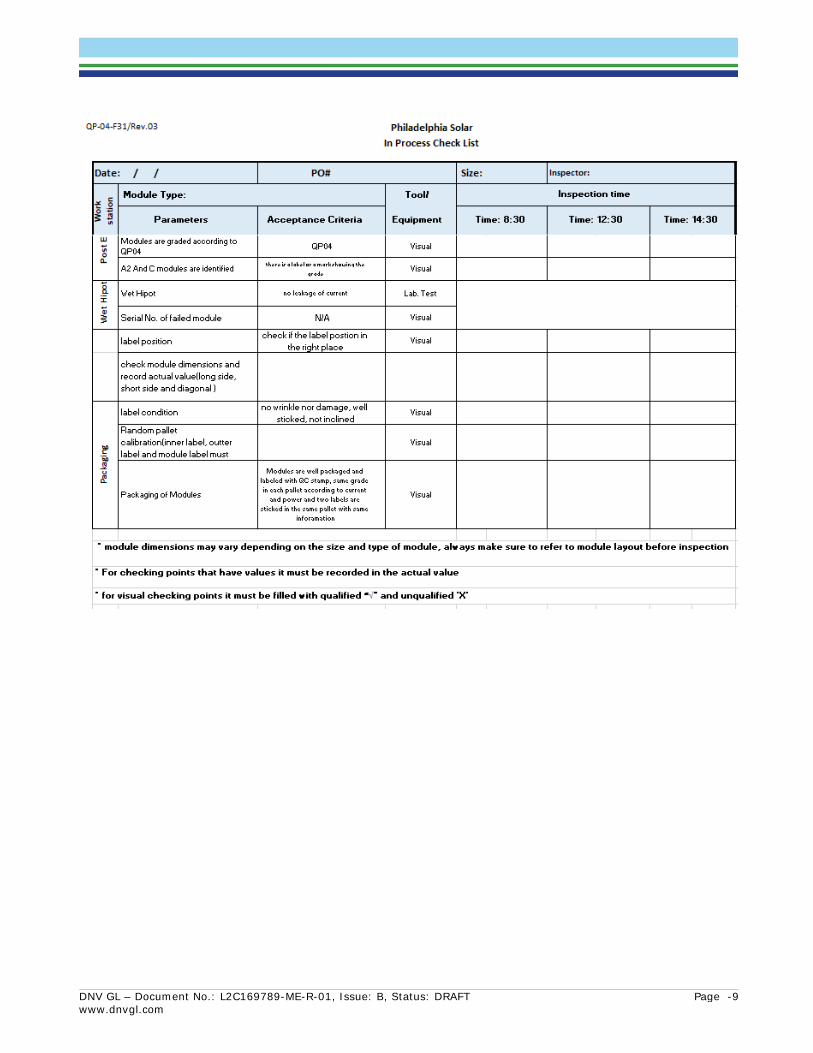
DNV GL – Document No.: L2C169789-ME-R-01, Issue: B, Status: DRAFT Page -9 www.dnvgl.com
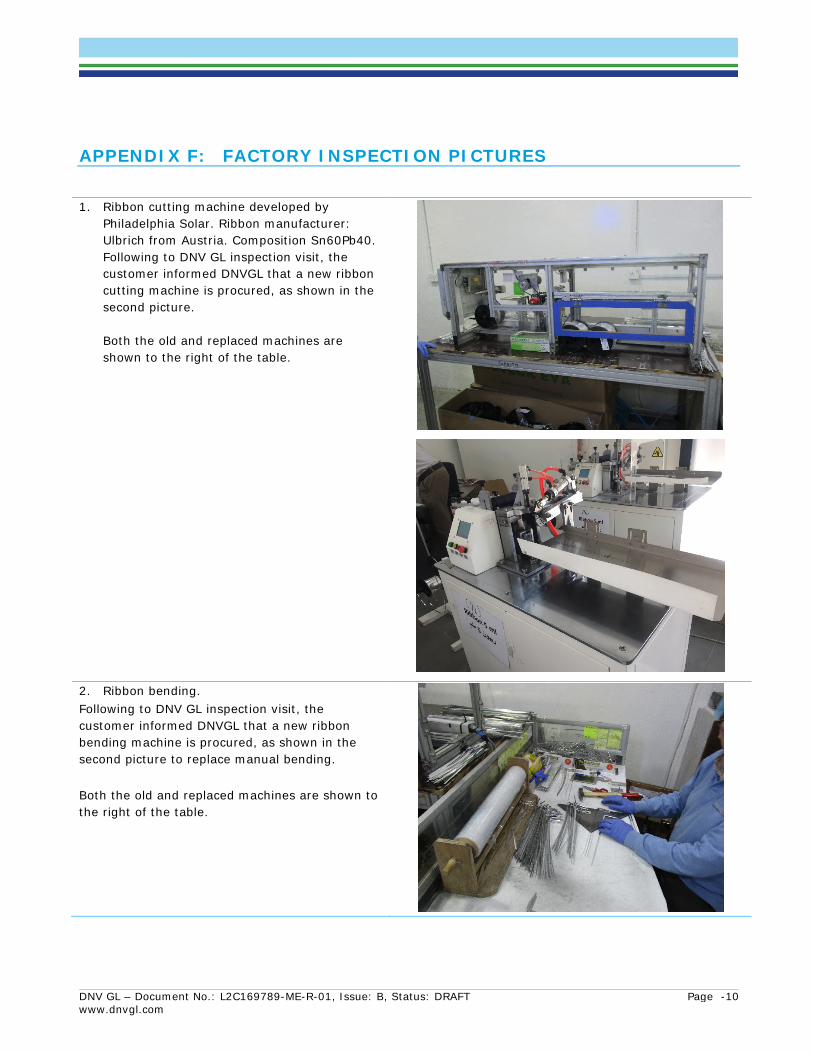
DNV GL – Document No.: L2C169789-ME-R-01, Issue: B, Status: DRAFT Page -10 www.dnvgl.com
APPENDIX F: FACTORY INSPECTION PICTURES
1. Ribbon cutting machine developed by Philadelphia Solar. Ribbon manufacturer: Ulbrich from Austria. Composition Sn60Pb40. Following to DNV GL inspection visit, the customer informed DNVGL that a new ribbon cutting machine is procured, as shown in the second picture. Both the old and replaced machines are shown to the right of the table.
2. Ribbon bending. Following to DNV GL inspection visit, the customer informed DNVGL that a new ribbon bending machine is procured, as shown in the second picture to replace manual bending. Both the old and replaced machines are shown to the right of the table.
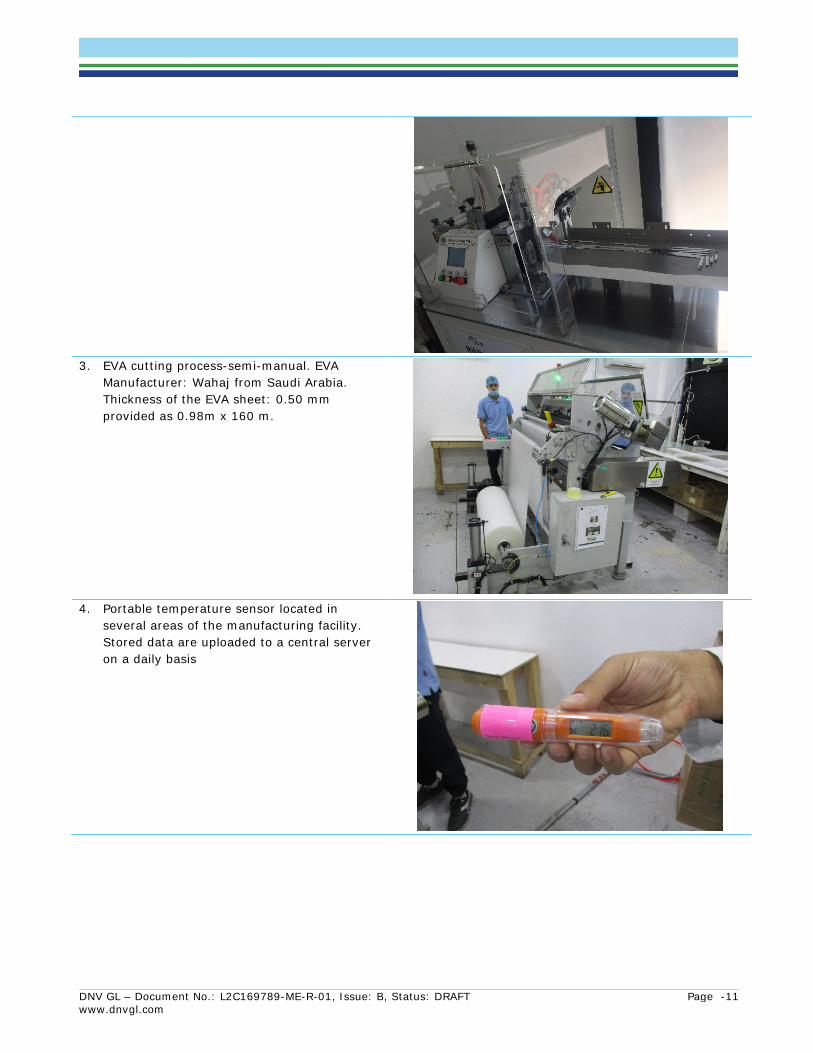
DNV GL – Document No.: L2C169789-ME-R-01, Issue: B, Status: DRAFT Page -11 www.dnvgl.com
3. EVA cutting process-semi-manual. EVA
Manufacturer: Wahaj from Saudi Arabia. Thickness of the EVA sheet: 0.50 mm provided as 0.98m x 160 m.
4. Portable temperature sensor located in
several areas of the manufacturing facility. Stored data are uploaded to a central server on a daily basis
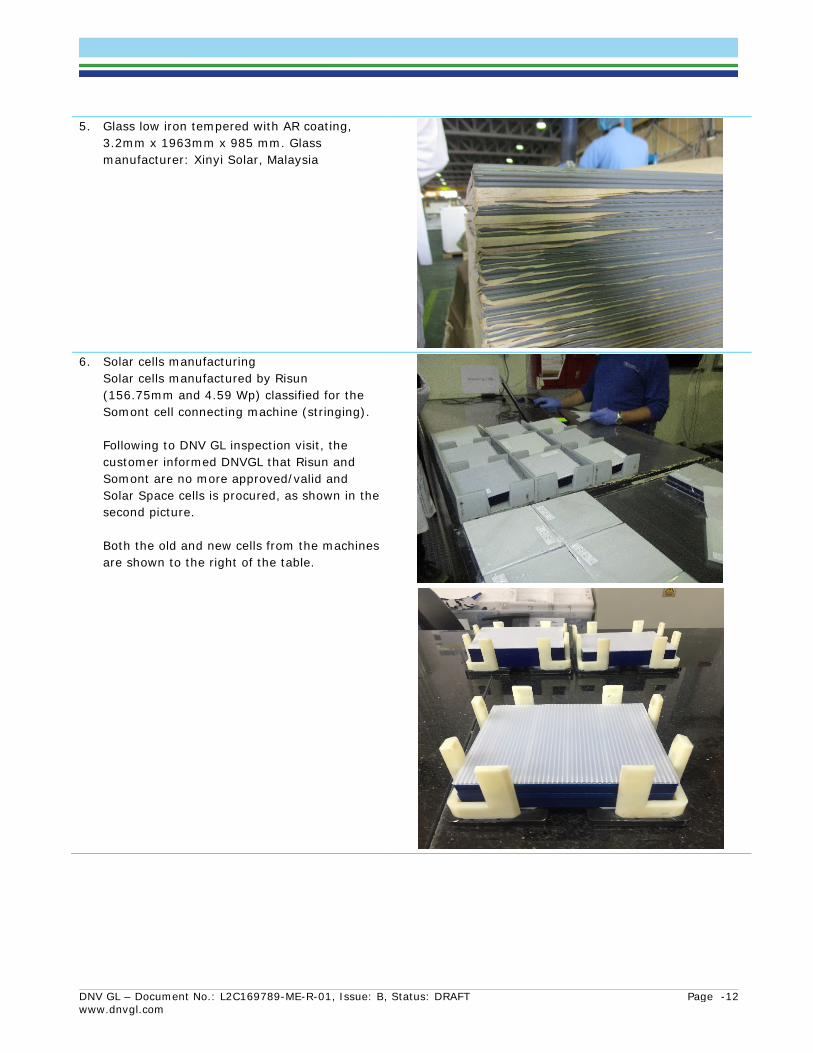
DNV GL – Document No.: L2C169789-ME-R-01, Issue: B, Status: DRAFT Page -12 www.dnvgl.com
5. Glass low iron tempered with AR coating, 3.2mm x 1963mm x 985 mm. Glass manufacturer: Xinyi Solar, Malaysia
6. Solar cells manufacturing
Solar cells manufactured by Risun (156.75mm and 4.59 Wp) classified for the Somont cell connecting machine (stringing). Following to DNV GL inspection visit, the customer informed DNVGL that Risun and Somont are no more approved/valid and Solar Space cells is procured, as shown in the second picture. Both the old and new cells from the machines are shown to the right of the table.
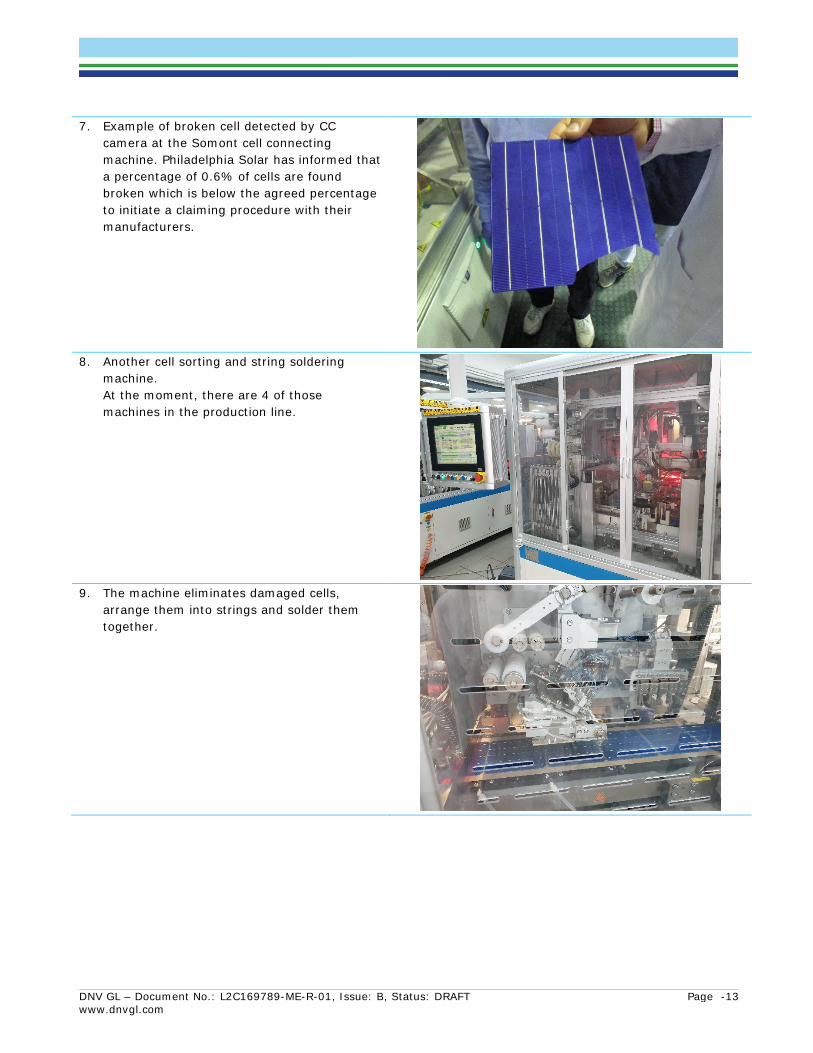
DNV GL – Document No.: L2C169789-ME-R-01, Issue: B, Status: DRAFT Page -13 www.dnvgl.com
7. Example of broken cell detected by CC camera at the Somont cell connecting machine. Philadelphia Solar has informed that a percentage of 0.6% of cells are found broken which is below the agreed percentage to initiate a claiming procedure with their manufacturers.
8. Another cell sorting and string soldering
machine. At the moment, there are 4 of those machines in the production line.
9. The machine eliminates damaged cells,
arrange them into strings and solder them together.
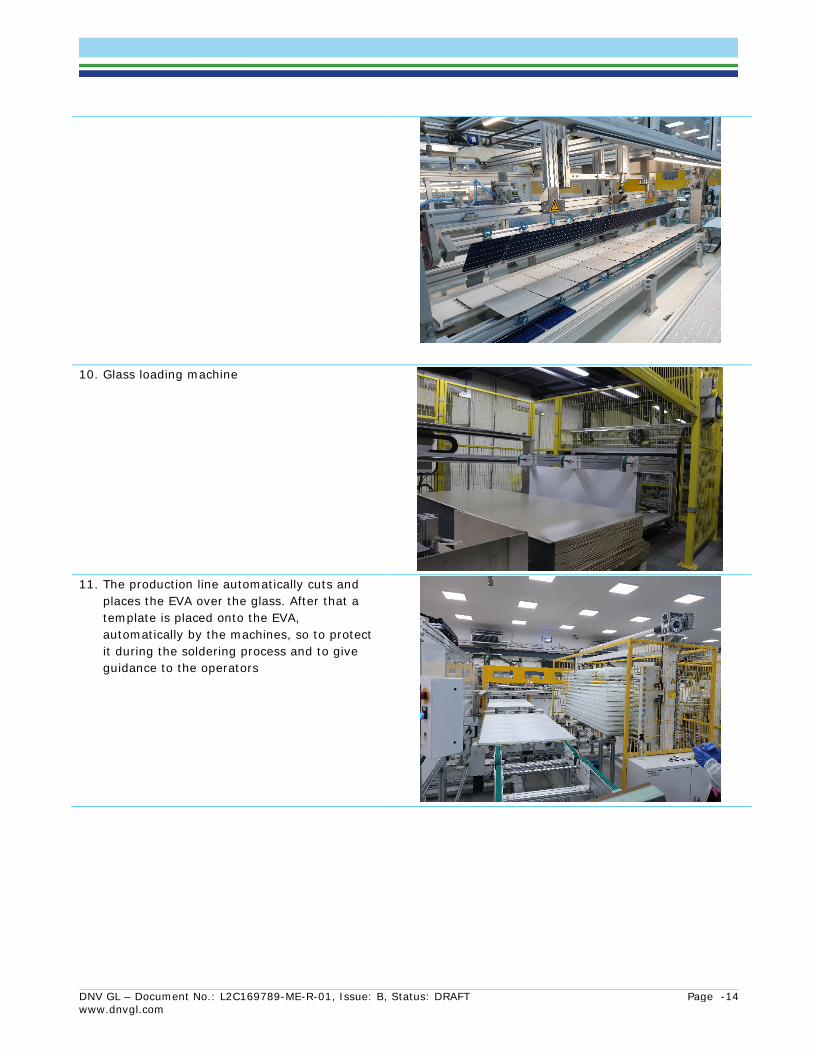
DNV GL – Document No.: L2C169789-ME-R-01, Issue: B, Status: DRAFT Page -14 www.dnvgl.com
10. Glass loading machine
11. The production line automatically cuts and
places the EVA over the glass. After that a template is placed onto the EVA, automatically by the machines, so to protect it during the soldering process and to give guidance to the operators
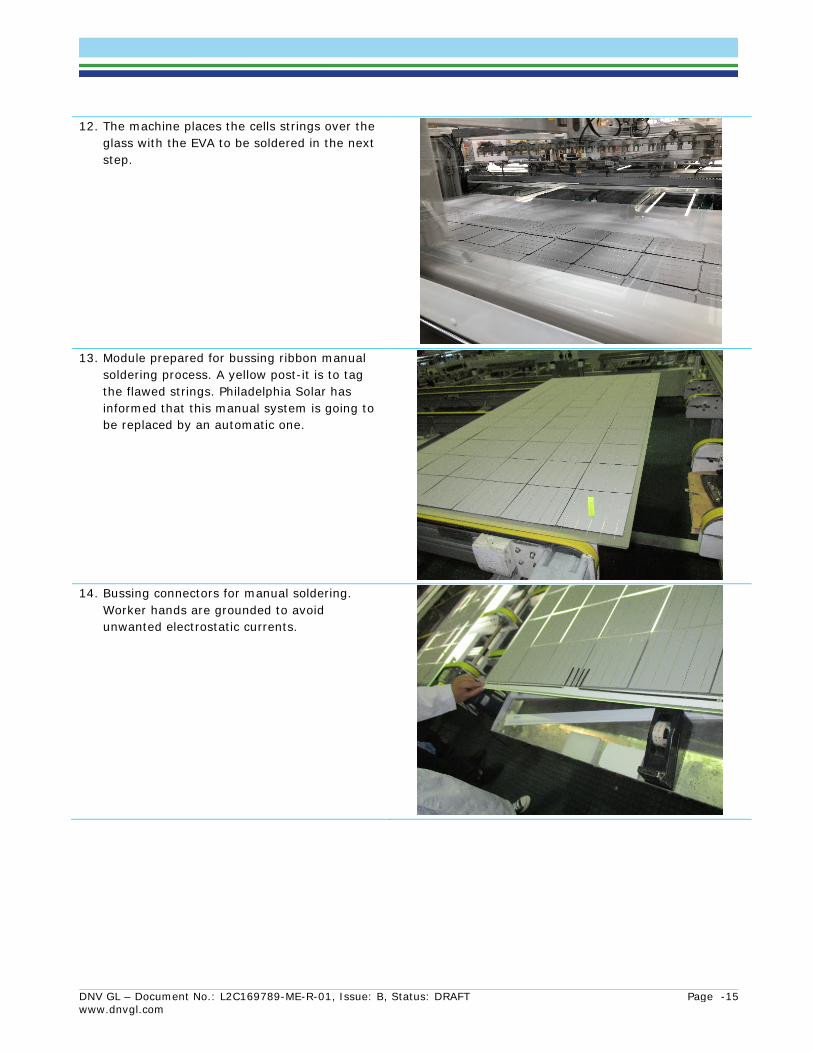
DNV GL – Document No.: L2C169789-ME-R-01, Issue: B, Status: DRAFT Page -15 www.dnvgl.com
12. The machine places the cells strings over the glass with the EVA to be soldered in the next step.
13. Module prepared for bussing ribbon manual
soldering process. A yellow post-it is to tag the flawed strings. Philadelphia Solar has informed that this manual system is going to be replaced by an automatic one.
14. Bussing connectors for manual soldering.
Worker hands are grounded to avoid unwanted electrostatic currents.
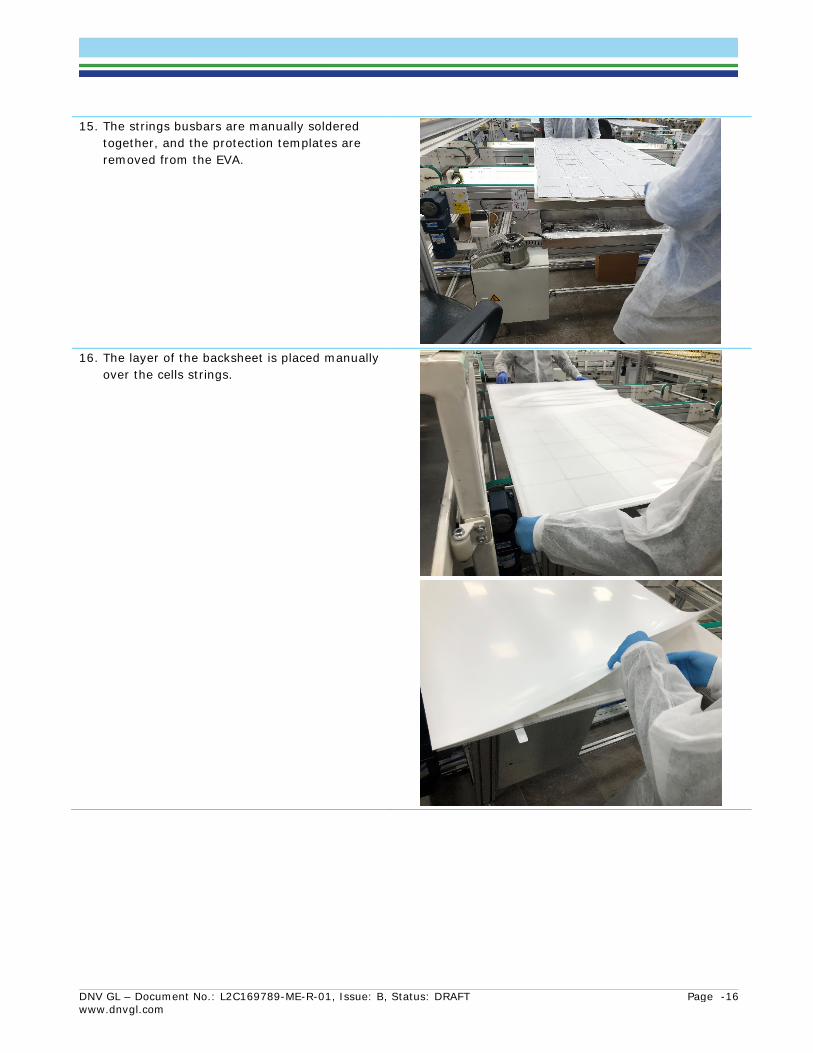
DNV GL – Document No.: L2C169789-ME-R-01, Issue: B, Status: DRAFT Page -16 www.dnvgl.com
15. The strings busbars are manually soldered together, and the protection templates are removed from the EVA.
16. The layer of the backsheet is placed manually
over the cells strings.
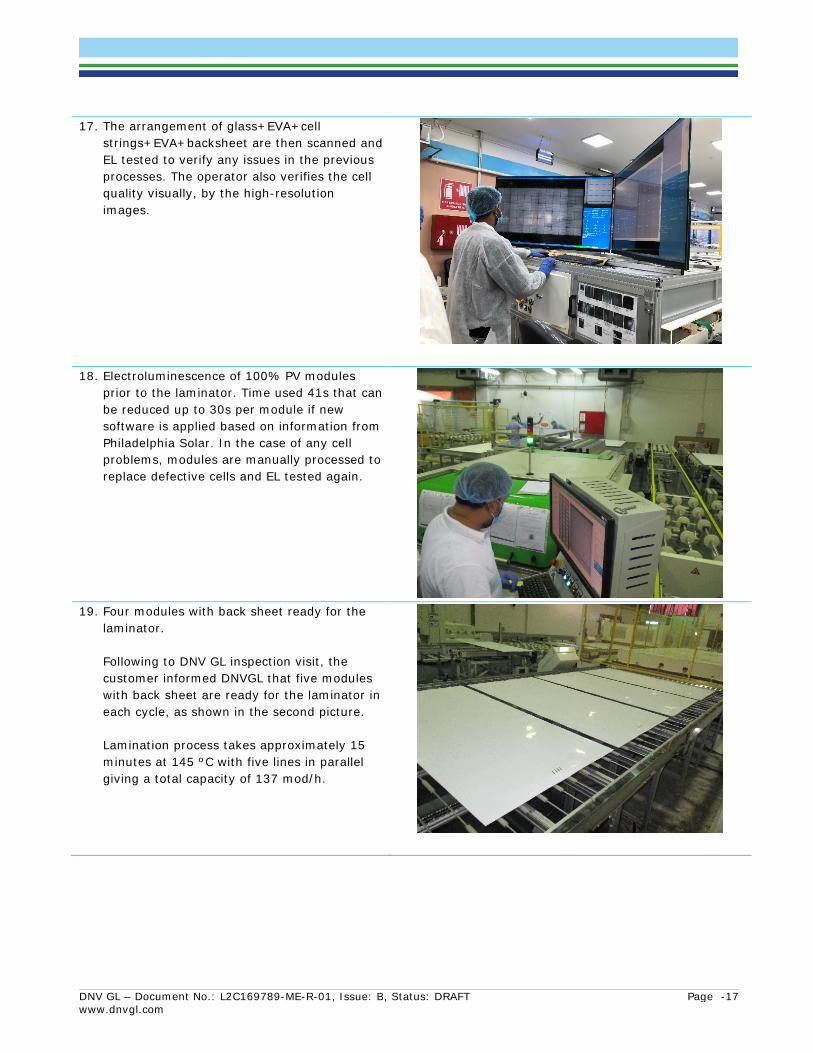
DNV GL – Document No.: L2C169789-ME-R-01, Issue: B, Status: DRAFT Page -17 www.dnvgl.com
17. The arrangement of glass+EVA+cell strings+EVA+backsheet are then scanned and EL tested to verify any issues in the previous processes. The operator also verifies the cell quality visually, by the high-resolution images.
18. Electroluminescence of 100% PV modules prior to the laminator. Time used 41s that can be reduced up to 30s per module if new software is applied based on information from Philadelphia Solar. In the case of any cell problems, modules are manually processed to replace defective cells and EL tested again.
19. Four modules with back sheet ready for the
laminator. Following to DNV GL inspection visit, the customer informed DNVGL that five modules with back sheet are ready for the laminator in each cycle, as shown in the second picture. Lamination process takes approximately 15 minutes at 145 ºC with five lines in parallel giving a total capacity of 137 mod/h.
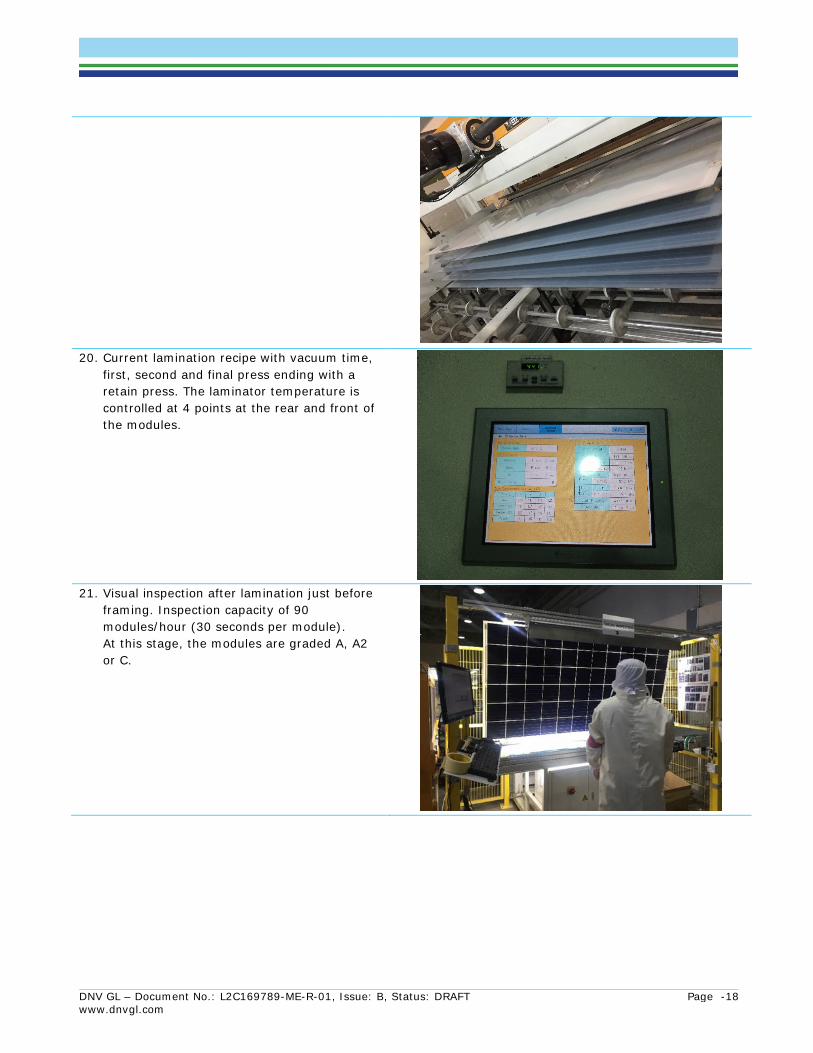
DNV GL – Document No.: L2C169789-ME-R-01, Issue: B, Status: DRAFT Page -18 www.dnvgl.com
20. Current lamination recipe with vacuum time,
first, second and final press ending with a retain press. The laminator temperature is controlled at 4 points at the rear and front of the modules.
21. Visual inspection after lamination just before
framing. Inspection capacity of 90 modules/hour (30 seconds per module). At this stage, the modules are graded A, A2 or C.
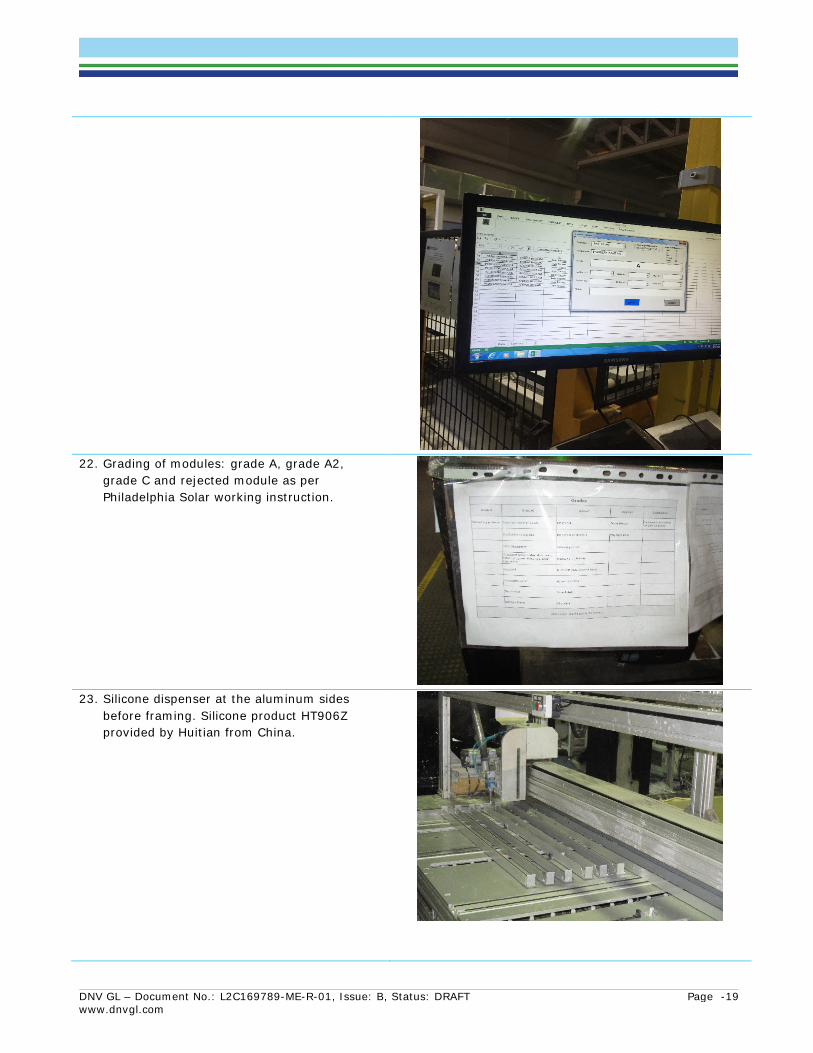
DNV GL – Document No.: L2C169789-ME-R-01, Issue: B, Status: DRAFT Page -19 www.dnvgl.com
22. Grading of modules: grade A, grade A2,
grade C and rejected module as per Philadelphia Solar working instruction.
23. Silicone dispenser at the aluminum sides
before framing. Silicone product HT906Z provided by Huitian from China.
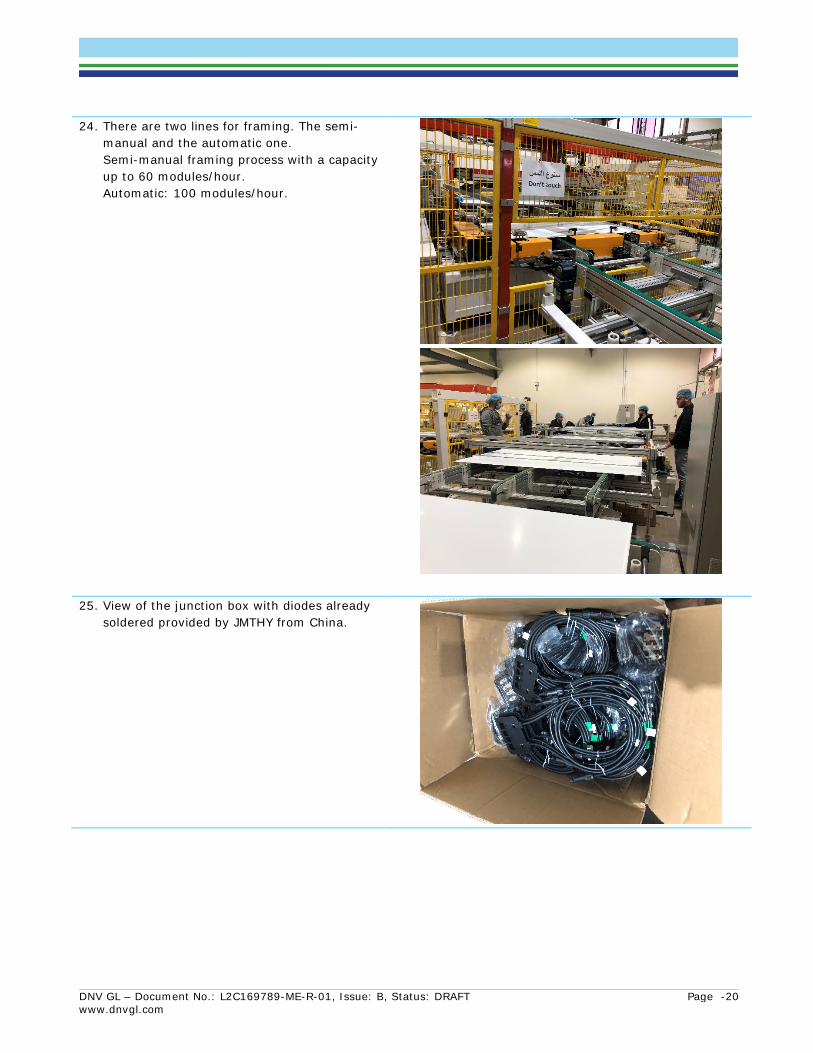
DNV GL – Document No.: L2C169789-ME-R-01, Issue: B, Status: DRAFT Page -20 www.dnvgl.com
24. There are two lines for framing. The semi-manual and the automatic one. Semi-manual framing process with a capacity up to 60 modules/hour. Automatic: 100 modules/hour.
25. View of the junction box with diodes already soldered provided by JMTHY from China.
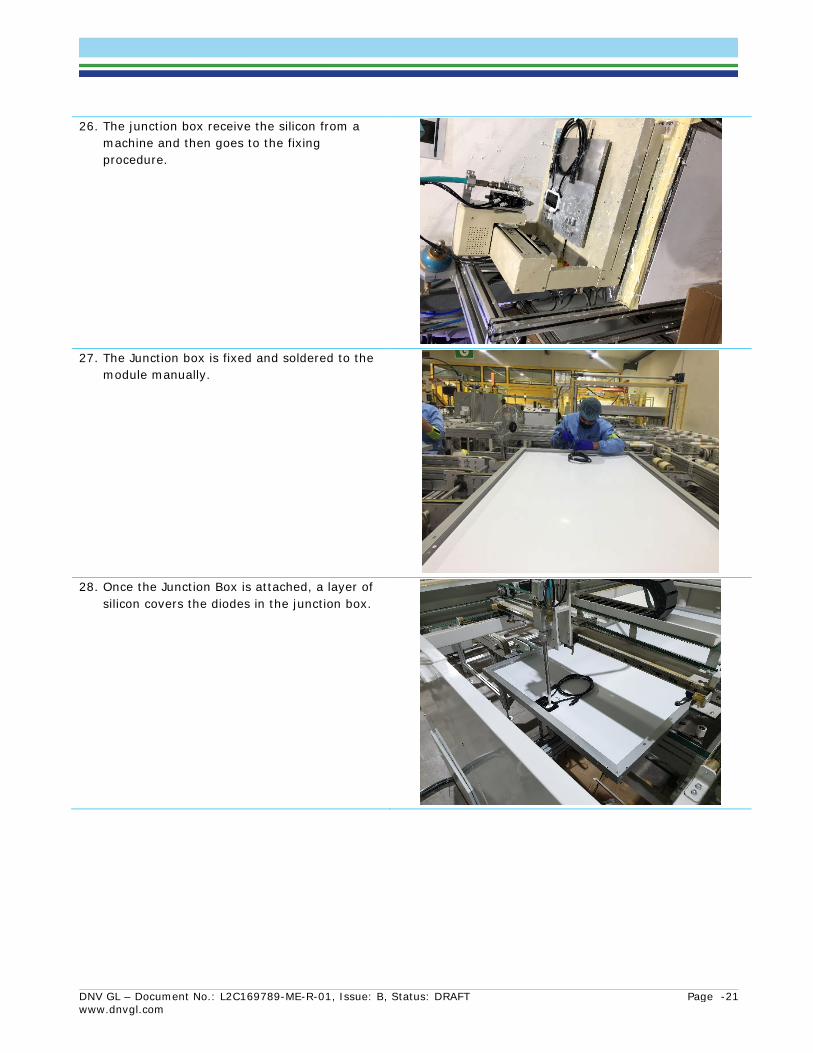
DNV GL – Document No.: L2C169789-ME-R-01, Issue: B, Status: DRAFT Page -21 www.dnvgl.com
26. The junction box receive the silicon from a machine and then goes to the fixing procedure.
27. The Junction box is fixed and soldered to the
module manually.
28. Once the Junction Box is attached, a layer of
silicon covers the diodes in the junction box.
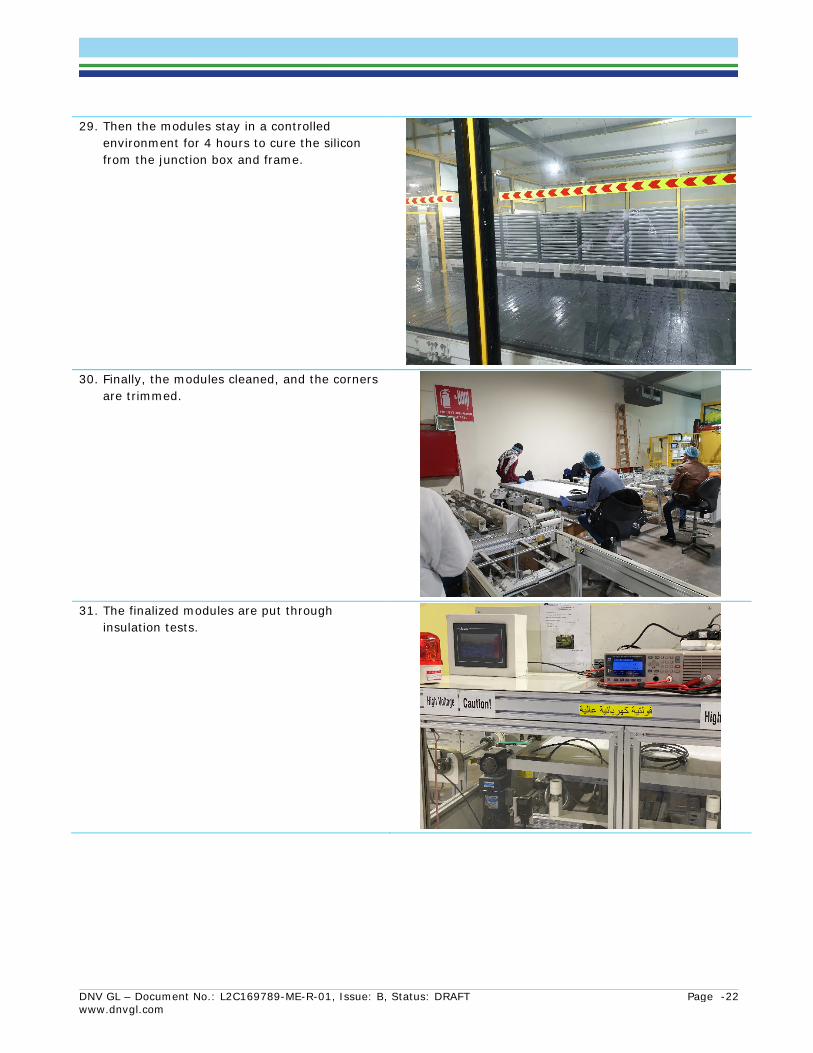
DNV GL – Document No.: L2C169789-ME-R-01, Issue: B, Status: DRAFT Page -22 www.dnvgl.com
29. Then the modules stay in a controlled environment for 4 hours to cure the silicon from the junction box and frame.
30. Finally, the modules cleaned, and the corners
are trimmed.
31. The finalized modules are put through
insulation tests.
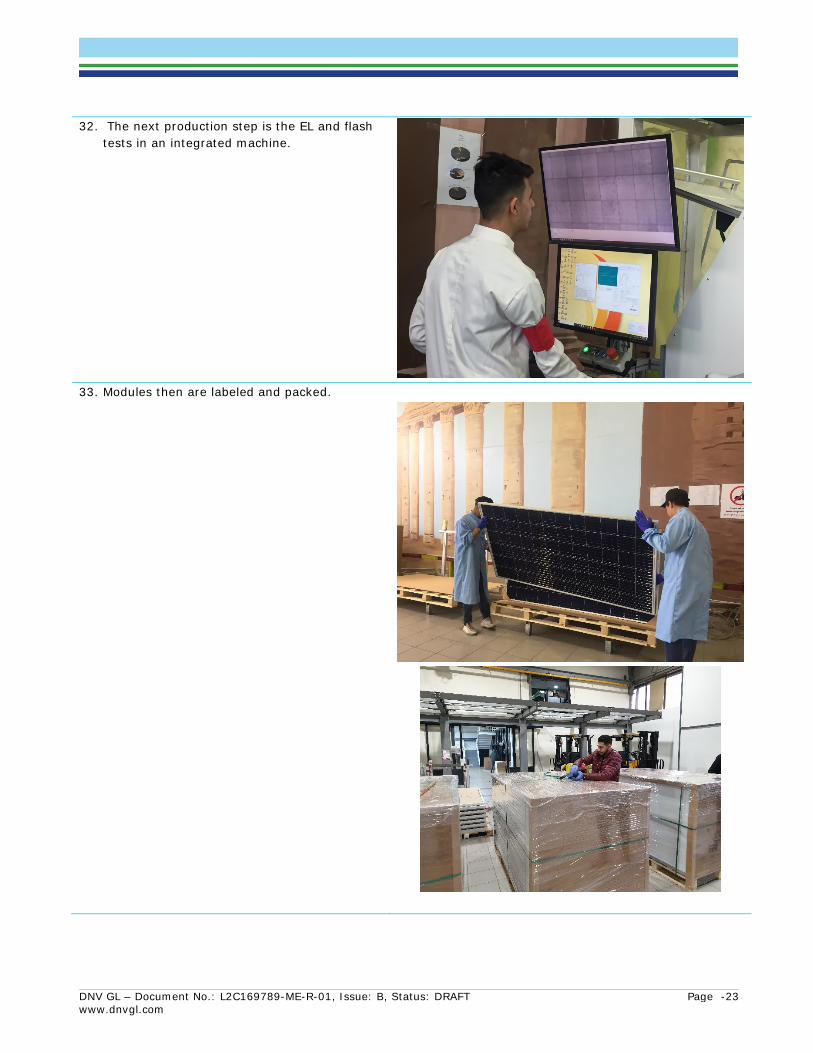
DNV GL – Document No.: L2C169789-ME-R-01, Issue: B, Status: DRAFT Page -23 www.dnvgl.com
32. The next production step is the EL and flash tests in an integrated machine.
33. Modules then are labeled and packed.
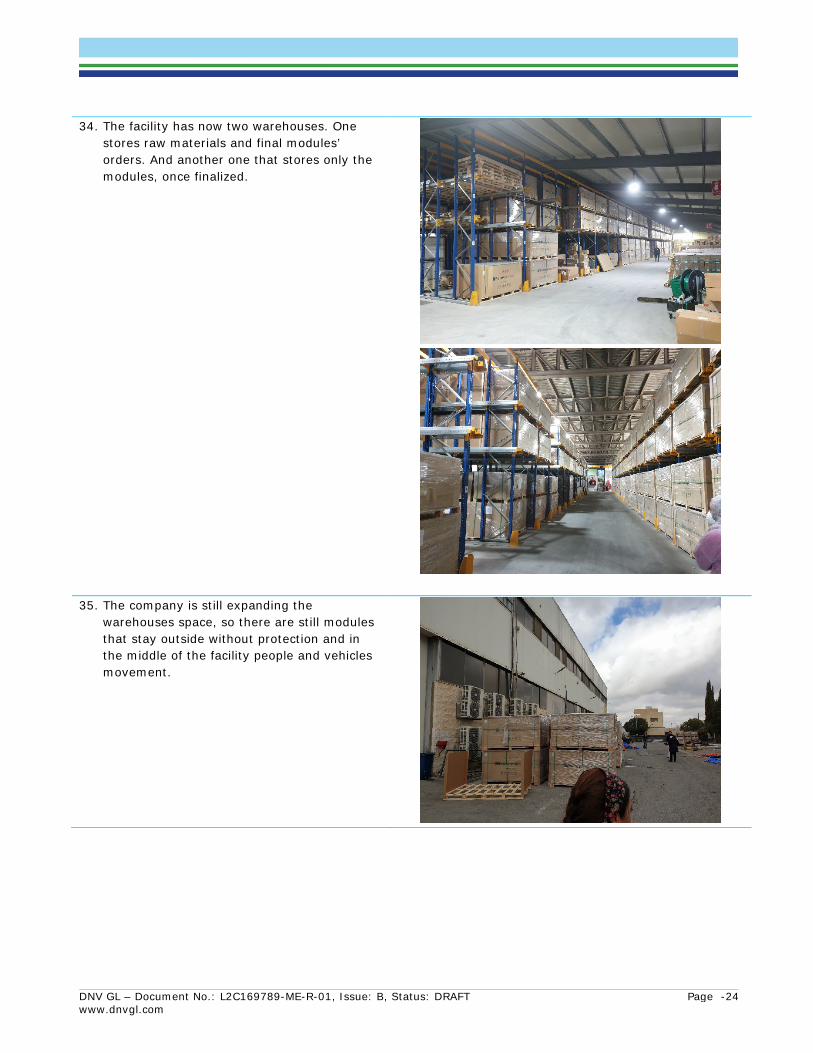
DNV GL – Document No.: L2C169789-ME-R-01, Issue: B, Status: DRAFT Page -24 www.dnvgl.com
34. The facility has now two warehouses. One stores raw materials and final modules’ orders. And another one that stores only the modules, once finalized.
35. The company is still expanding the warehouses space, so there are still modules that stay outside without protection and in the middle of the facility people and vehicles movement.
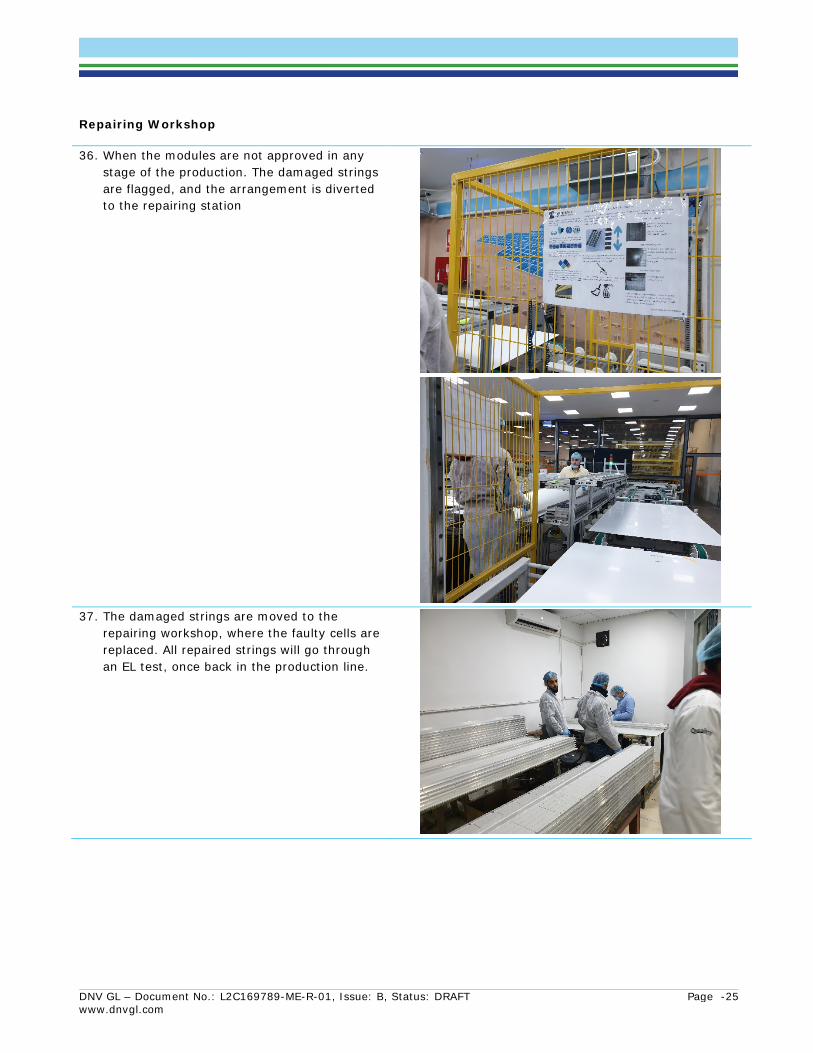
DNV GL – Document No.: L2C169789-ME-R-01, Issue: B, Status: DRAFT Page -25 www.dnvgl.com
Repairing Workshop 36. When the modules are not approved in any
stage of the production. The damaged strings are flagged, and the arrangement is diverted to the repairing station
37. The damaged strings are moved to the
repairing workshop, where the faulty cells are replaced. All repaired strings will go through an EL test, once back in the production line.
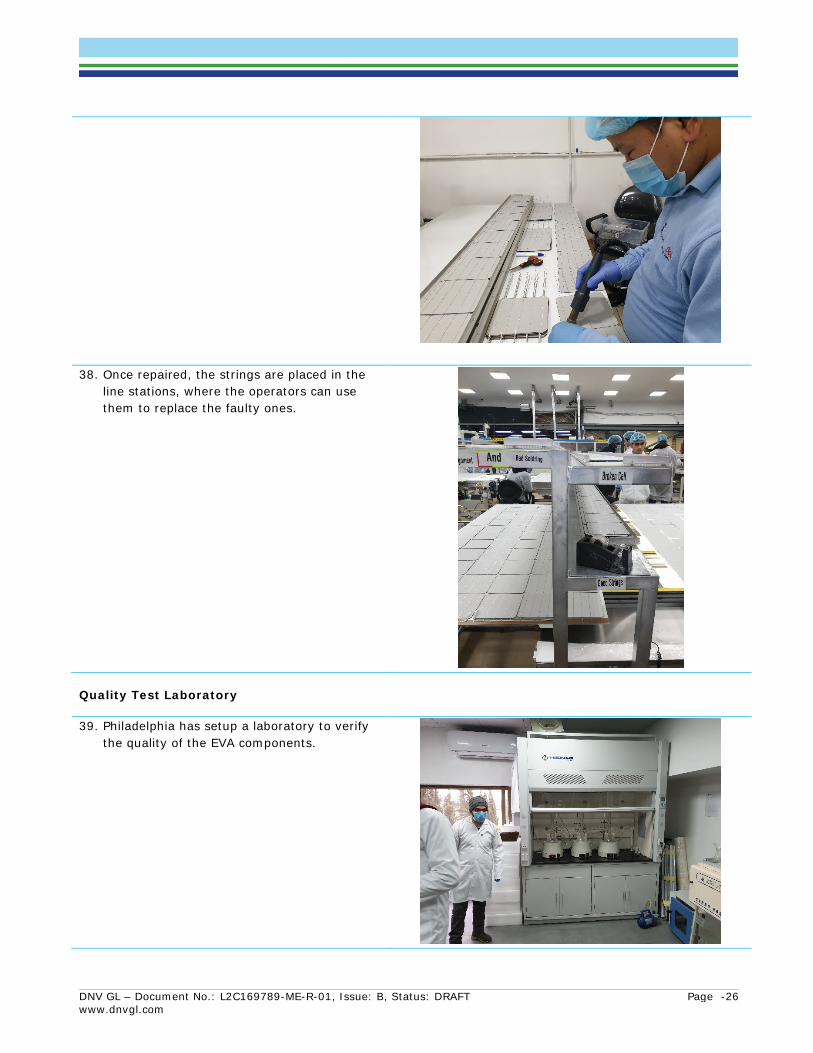
DNV GL – Document No.: L2C169789-ME-R-01, Issue: B, Status: DRAFT Page -26 www.dnvgl.com
38. Once repaired, the strings are placed in the line stations, where the operators can use them to replace the faulty ones.
Quality Test Laboratory 39. Philadelphia has setup a laboratory to verify
the quality of the EVA components.
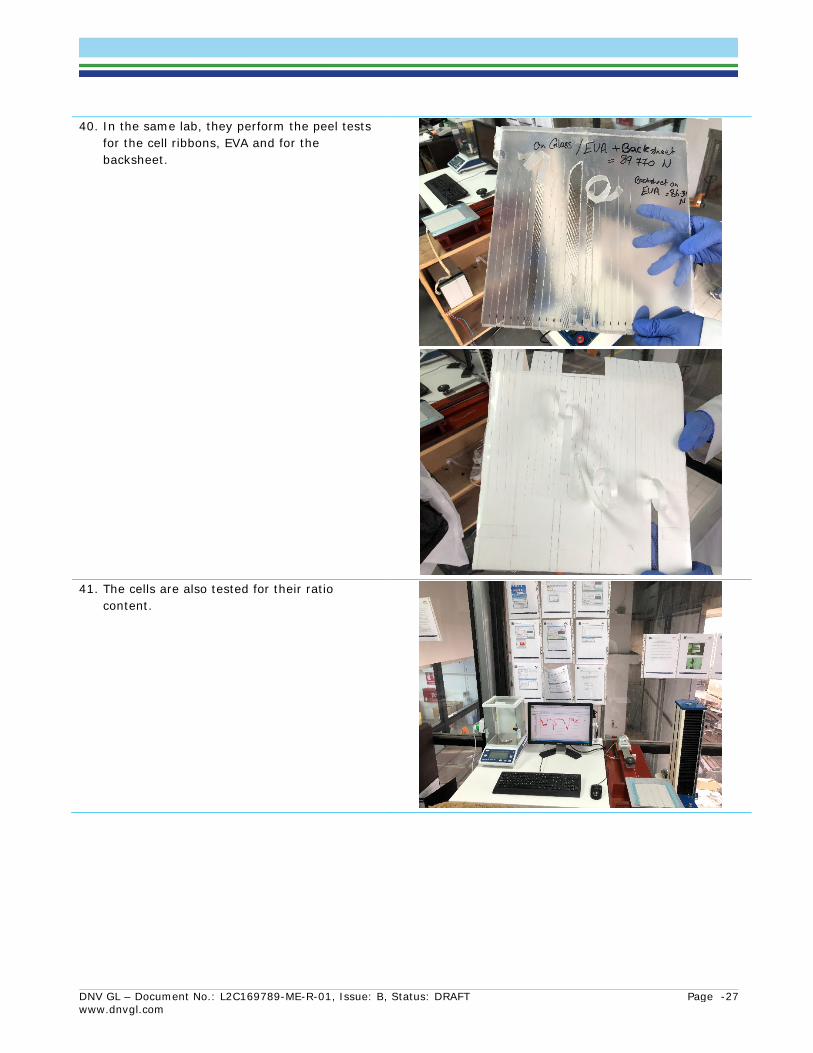
DNV GL – Document No.: L2C169789-ME-R-01, Issue: B, Status: DRAFT Page -27 www.dnvgl.com
40. In the same lab, they perform the peel tests for the cell ribbons, EVA and for the backsheet.
41. The cells are also tested for their ratio
content.
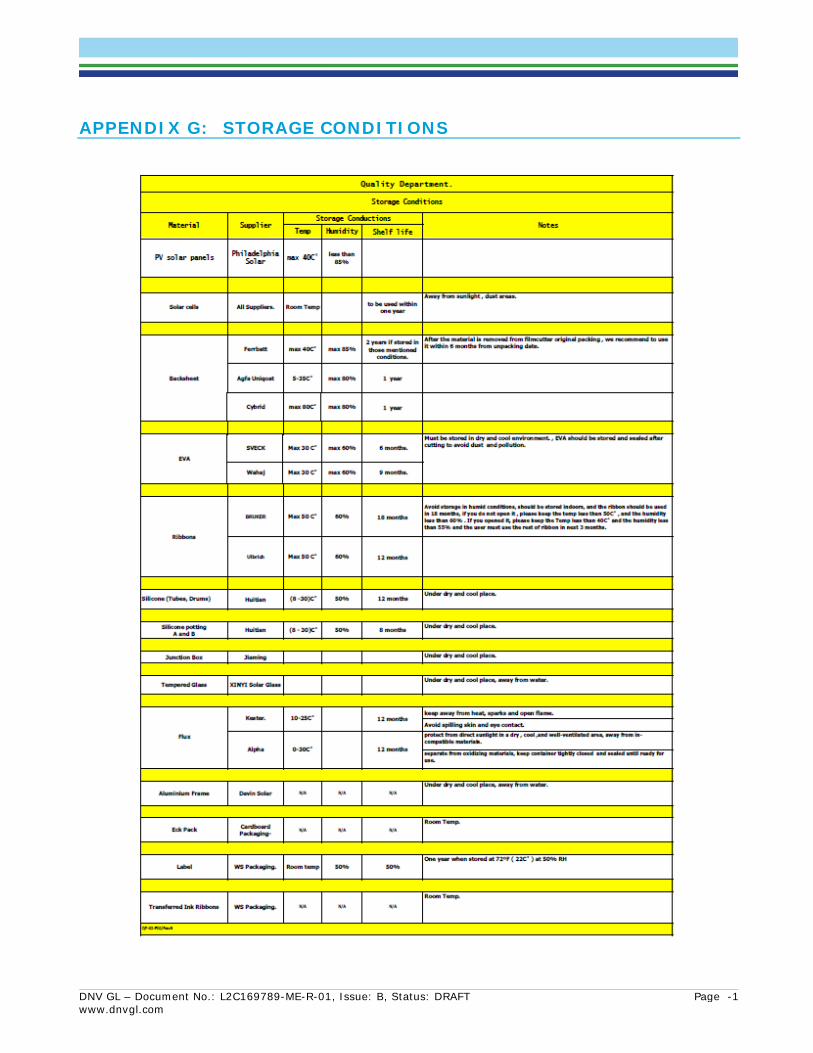
DNV GL – Document No.: L2C169789-ME-R-01, Issue: B, Status: DRAFT Page -1 www.dnvgl.com
APPENDIX G: STORAGE CONDITIONS
ABOUT DNV GL Driven by our purpose of safeguarding life, property and the environment, DNV GL enables organizations to advance the safety and sustainability of their business. We provide classification and technical assurance along with software and independent expert advisory services to the maritime, oil and gas, and energy industries. We also provide certification services to customers across a wide range of industries. Operating in more than 100 countries, our 16,000 professionals are dedicated to helping our customers make the world safer, smarter, and greener.