Embed Size (px)
Citation preview
Independent Science Advisory Committee (ISAC)
2009 Report on the Platte River Recovery Implementation Program (PRRIP)
Submitted to
PRRIP Governance Committee
c/o Dr. Jerry Kenny, Executive Director, Platte River Recovery Implementation Program
Headwaters Corporation, 3710 Central Avenue, Suite E
Kearney, Nebraska 68847
Prepared by
ISAC Mr. David Marmorek, ESSA Technologies Ltd.
Dr. Philip Dixon, Iowa State University Dr. David Galat, University of Missouri
Dr. Robert Jacobson, U.S. Geological Survey, Columbia, Missouri Mr. Kent Loftin, HydroPlan LLC
Dr. John Nestler, Fisheries and Environmental Services
Sept 10, 2009.

Citation: ISAC (Independent Science Advisory Committee). 2009. 2009 Report on the Platte River Recovery
Implementation Program. Prepared for the PRRIP Governance Committee. 38 pp.
2009 ISAC Report on the Platte River Recovery Implementation Program
3
Table of Contents
List of Tables................................................................................................................................................................4
List of Figures ..............................................................................................................................................................4
1. Introduction ..........................................................................................................................................................5
2. Summary of ISAC Findings on Main Topic Areas ............................................................................................7
2.1 Conceptual Ecological Models (CEMs) and Priority Hypotheses ...........................................................7 2.2 Experimental Design................................................................................................................................8 2.3 Modeling ................................................................................................................................................11 2.4 Data Analysis, Synthesis and Reporting ................................................................................................11 2.5 Invasive Species .....................................................................................................................................13 2.6 AMP Management Objectives ...............................................................................................................13 2.7 Recommended Sequence of Activities for Addressing Our Recommendations ....................................14
3. Comments on Specific Questions Posed for Each Topic ....................................................................................15
3.1 CEMs and Priority Hypotheses ..............................................................................................................15 3.2 Experimental Design..............................................................................................................................20 3.3 Modeling ................................................................................................................................................23 3.4 Data Analysis, Synthesis and Reporting ................................................................................................25 3.5 Invasive Species .....................................................................................................................................27 3.6 AMP Management Objectives ...............................................................................................................27
4. References Cited .................................................................................................................................................30
Appendix A – ISAC Membership.............................................................................................................................32
Appendix B – Questions Submitted to ISAC...........................................................................................................33
Appendix C – Agenda for June 1-2 Meeting in Cheyenne, WY ............................................................................37

2009 ISAC Report on the Platte River Recovery Implementation Program
4
List of Tables
Table 1. Comments on priority hypotheses in the AMP.............................................................................................18
List of Figures
Figure 1. Example of a CEM (from the Trinity River) which recognizes actions outside of Program control. ............9
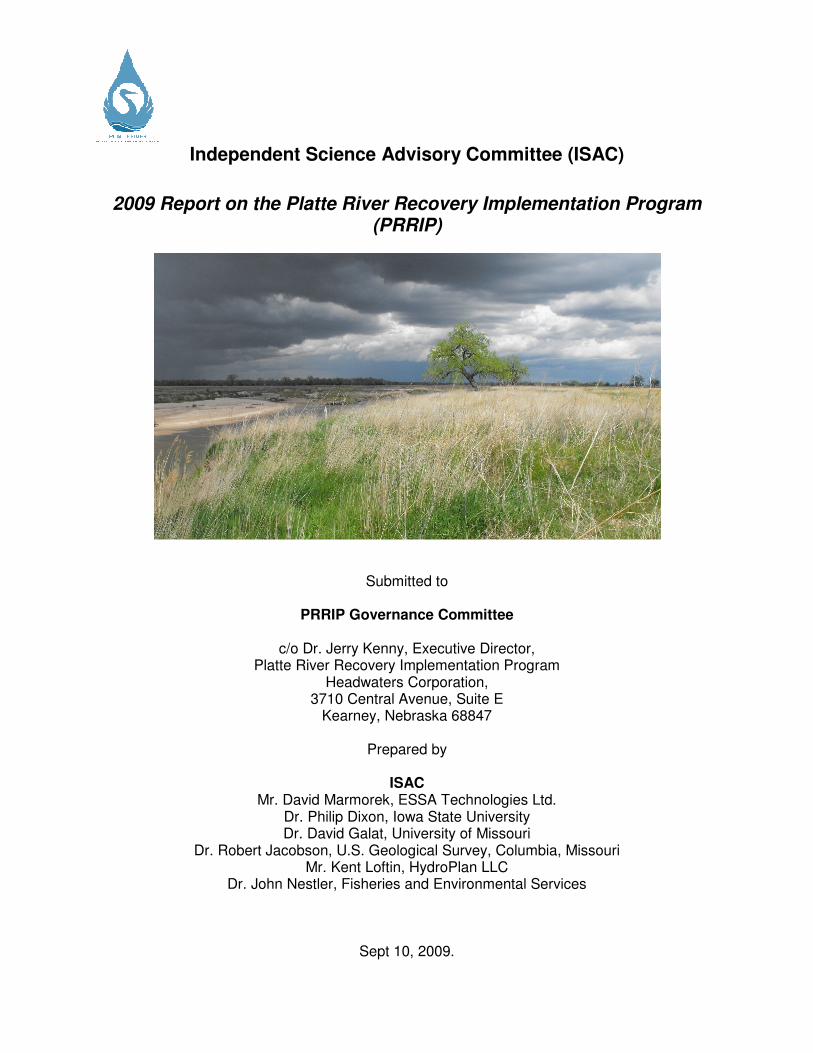
Figure 2. Whooping crane CEM which recognizes actions and events outside of Program control. ........................10
Figure 3. Factors affecting the ability to distinguish alternative hypotheses with adaptive management
experiments, and the value of information for decisions.. ..................................................................13
2009 ISAC Report on the Platte River Recovery Implementation Program
5
1. Introduction
The Independent Science Advisory Committee (ISAC) consists of six scientists (Appendix A) who have
been appointed for the period 2009-2011 to assist the Platte River Restoration Implementation Program
(PRRIP). Our tasks include independent review of the scientific approach to adaptive management,
monitoring, and research related to implementation of the Adaptive Management Program (AMP), as well
as other items assigned to us. We report directly to the Governance Committee (GC) of the PRRIP. In
developing our recommendations we have reviewed written documentation, viewed sections of the river,
and also deepened our understanding of the Platte River ecosystem, past decisions, and future plans
through extensive dialogue with Program participants. The participants that we have consulted include the
Program’s Executive Director (ED - Jerry Kenney), AMP and ISAC Coordinator (Chad Smith of
Headwaters Corporation), as well as the Adaptive Management Working Group (AMWG) and Technical
Advisory Committee (TAC). Although informed by these consultations, our recommendations have been
developed independently.
The ISAC first met on March 11-12th in Kearney, NE, and was provided with an overview of the AMP.
Topics briefly discussed at that meeting included conceptual ecological models, the paired experimental
design approach, invasive species, data organization and synthesis, whooping crane objectives, and forage
fish monitoring. This was an informal meeting wherein various ISAC members commented
independently on different topics. Minutes from that meeting were prepared by the ISAC Chair (David
Marmorek) and Chad Smith, and circulated on March 23, 2009.
Subsequent to the March meeting, Chad Smith elicited from the AMWG and TAC ideas for further
specific questions to be posed to the ISAC. Mr. Smith provided the ISAC with a list of 28 questions on
May 12th 2009 (Appendix B). We discussed these questions with Mr. Smith during a conference call held
May 27th, 2009, seeking to understand the underlying motivation and background for each question. We
then divided up the questions according to our expertise and interest, so that we could each note our
potential responses prior to meeting in Cheyenne, WY, on June 1-2nd
. The agenda for the Cheyenne
meeting (Appendix C) provided just enough time for the ISAC to proceed through the following steps:
agree on our principles of operation and approach to our tasks; independently outline draft responses to
specific questions; ask clarifying questions of the ED, staff and AMWG (at the ISAC’s request); collate,
review and synthesize our responses into a PowerPoint presentation for the GC; and present an overview
of our findings to the GC.
This report provides written documentation of our findings, and is organized around the six major topics
of the 28 questions outlined in Appendix B:
A) Conceptual Ecological Models (CEMs) and Priority Hypotheses;
B) Experimental Design;
C) Modeling;
D) Data Analysis, Synthesis and Reporting;
E) Invasive Species; and
F) AMP Management Objectives.
Section 2 provides our main findings, and is an expansion of the presentation given to the GC on June 2.
This section should be of primary interest to the GC and all Program participants because it is a synthesis
of broad conclusions generated by all ISAC members working together, and reflects our consensus on
major topics.
Section 3 provides answers to the specific questions posed for each topic, and provides more detail for
technically oriented Program participants. It collates the comments independently generated by individual
ISAC members who addressed various subsets of questions, and should be viewed as a collection of

2009 ISAC Report on the Platte River Recovery Implementation Program
6
comments, with some dialogue, rather than as a synthesis. While our responses to the questions were
generally consistent, they do reflect unique and complementary perspectives shaped by our disciplinary
expertise and individual experience. Where the content of these questions overlapped considerably, we
provided combined answers to a subset of questions.
2009 ISAC Report on the Platte River Recovery Implementation Program
7
2. Summary of ISAC Findings on Main Topic Areas
2.1 Conceptual Ecological Models (CEMs) and Priority Hypotheses
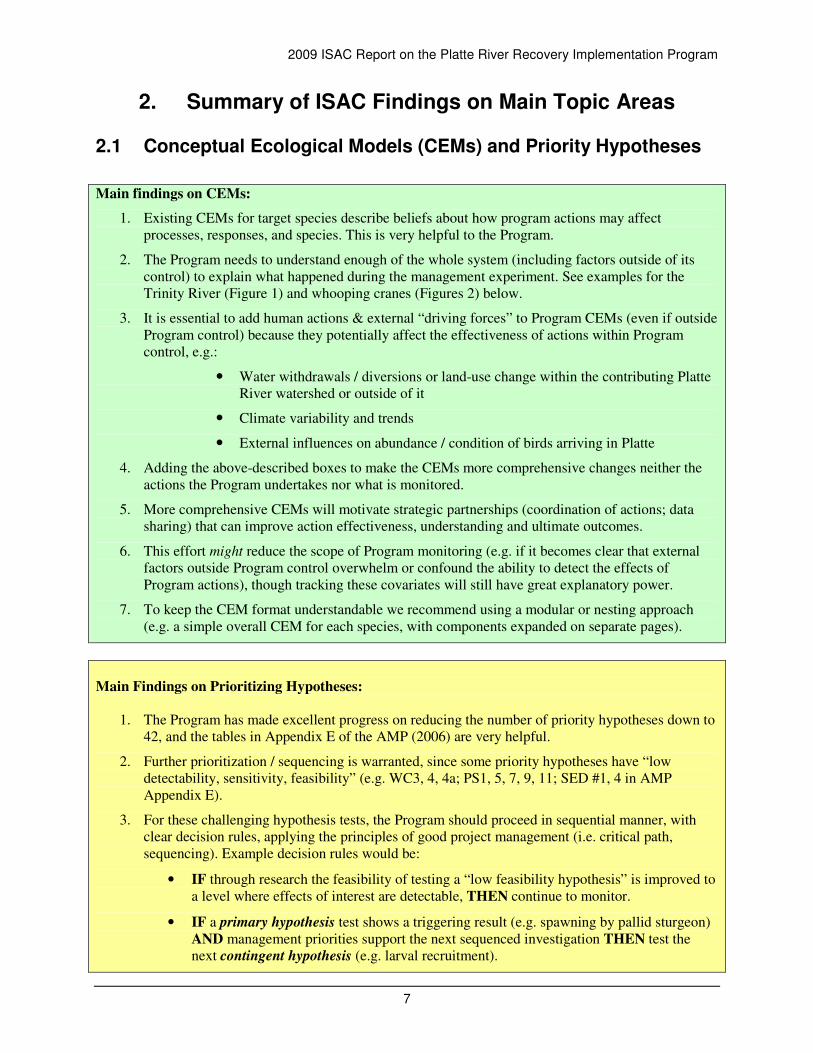
Main findings on CEMs:
1. Existing CEMs for target species describe beliefs about how program actions may affect
processes, responses, and species. This is very helpful to the Program.
2. The Program needs to understand enough of the whole system (including factors outside of its
control) to explain what happened during the management experiment. See examples for the
Trinity River (Figure 1) and whooping cranes (Figures 2) below.
3. It is essential to add human actions & external “driving forces” to Program CEMs (even if outside
Program control) because they potentially affect the effectiveness of actions within Program
control, e.g.:
� Water withdrawals / diversions or land-use change within the contributing Platte
River watershed or outside of it
� Climate variability and trends
� External influences on abundance / condition of birds arriving in Platte
4. Adding the above-described boxes to make the CEMs more comprehensive changes neither the
actions the Program undertakes nor what is monitored.
5. More comprehensive CEMs will motivate strategic partnerships (coordination of actions; data
sharing) that can improve action effectiveness, understanding and ultimate outcomes.
6. This effort might reduce the scope of Program monitoring (e.g. if it becomes clear that external
factors outside Program control overwhelm or confound the ability to detect the effects of
Program actions), though tracking these covariates will still have great explanatory power.
7. To keep the CEM format understandable we recommend using a modular or nesting approach
(e.g. a simple overall CEM for each species, with components expanded on separate pages).
Main Findings on Prioritizing Hypotheses:
1. The Program has made excellent progress on reducing the number of priority hypotheses down to
42, and the tables in Appendix E of the AMP (2006) are very helpful.
2. Further prioritization / sequencing is warranted, since some priority hypotheses have “low
detectability, sensitivity, feasibility” (e.g. WC3, 4, 4a; PS1, 5, 7, 9, 11; SED #1, 4 in AMP
Appendix E).
3. For these challenging hypothesis tests, the Program should proceed in sequential manner, with
clear decision rules, applying the principles of good project management (i.e. critical path,
sequencing). Example decision rules would be:
• IF through research the feasibility of testing a “low feasibility hypothesis” is improved to
a level where effects of interest are detectable, THEN continue to monitor.
• IF a primary hypothesis test shows a triggering result (e.g. spawning by pallid sturgeon)
AND management priorities support the next sequenced investigation THEN test the
next contingent hypothesis (e.g. larval recruitment).
2009 ISAC Report on the Platte River Recovery Implementation Program
8
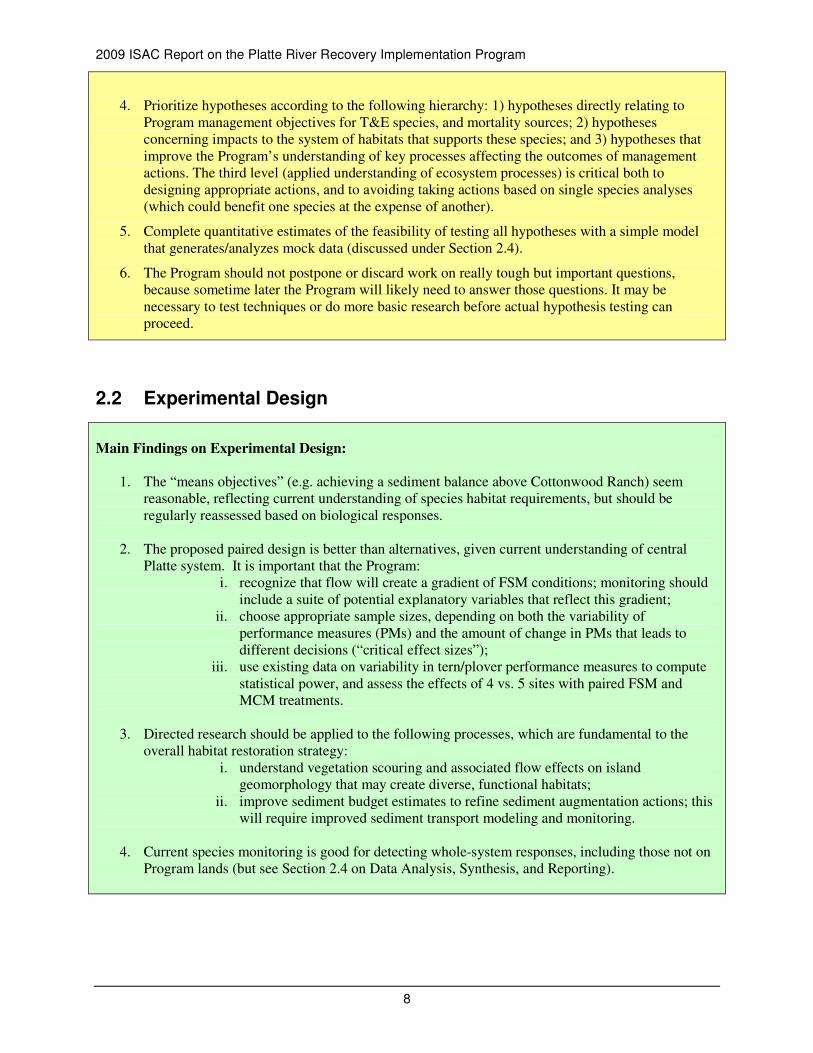
4. Prioritize hypotheses according to the following hierarchy: 1) hypotheses directly relating to
Program management objectives for T&E species, and mortality sources; 2) hypotheses
concerning impacts to the system of habitats that supports these species; and 3) hypotheses that
improve the Program’s understanding of key processes affecting the outcomes of management
actions. The third level (applied understanding of ecosystem processes) is critical both to
designing appropriate actions, and to avoiding taking actions based on single species analyses
(which could benefit one species at the expense of another).
5. Complete quantitative estimates of the feasibility of testing all hypotheses with a simple model
that generates/analyzes mock data (discussed under Section 2.4).
6. The Program should not postpone or discard work on really tough but important questions,
because sometime later the Program will likely need to answer those questions. It may be
necessary to test techniques or do more basic research before actual hypothesis testing can
proceed.
2.2 Experimental Design
Main Findings on Experimental Design:
1. The “means objectives” (e.g. achieving a sediment balance above Cottonwood Ranch) seem
reasonable, reflecting current understanding of species habitat requirements, but should be
regularly reassessed based on biological responses.
2. The proposed paired design is better than alternatives, given current understanding of central
Platte system. It is important that the Program:
i. recognize that flow will create a gradient of FSM conditions; monitoring should
include a suite of potential explanatory variables that reflect this gradient;
ii. choose appropriate sample sizes, depending on both the variability of
performance measures (PMs) and the amount of change in PMs that leads to
different decisions (“critical effect sizes”);
iii. use existing data on variability in tern/plover performance measures to compute
statistical power, and assess the effects of 4 vs. 5 sites with paired FSM and
MCM treatments.
3. Directed research should be applied to the following processes, which are fundamental to the
overall habitat restoration strategy:
i. understand vegetation scouring and associated flow effects on island
geomorphology that may create diverse, functional habitats;
ii. improve sediment budget estimates to refine sediment augmentation actions; this
will require improved sediment transport modeling and monitoring.
4. Current species monitoring is good for detecting whole-system responses, including those not on
Program lands (but see Section 2.4 on Data Analysis, Synthesis, and Reporting).
2009 ISAC Report on the Platte River Recovery Implementation Program
9
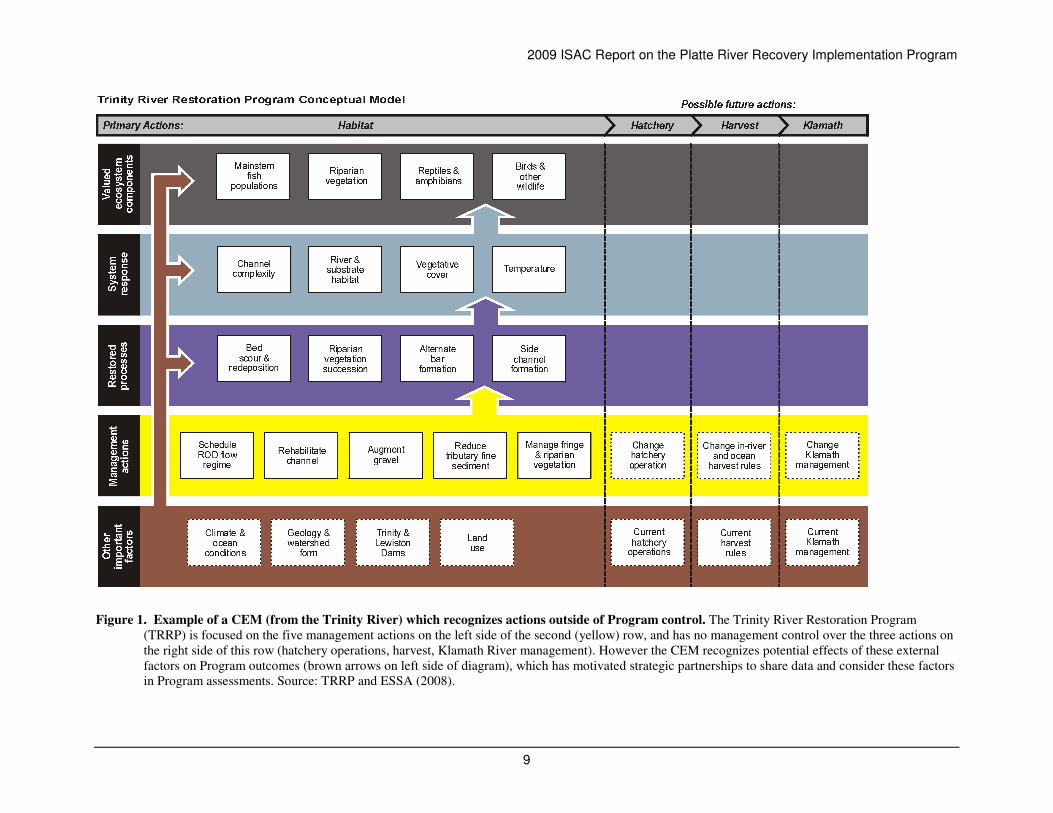
Figure 1. Example of a CEM (from the Trinity River) which recognizes actions outside of Program control. The Trinity River Restoration Program
(TRRP) is focused on the five management actions on the left side of the second (yellow) row, and has no management control over the three actions on
the right side of this row (hatchery operations, harvest, Klamath River management). However the CEM recognizes potential effects of these external
factors on Program outcomes (brown arrows on left side of diagram), which has motivated strategic partnerships to share data and consider these factors
in Program assessments. Source: TRRP and ESSA (2008).
2009 ISAC Report on the Platte River Recovery Implementation Program
10
Whooping Crane CEM
Whooping Crane Fitness
Overwinter
Survival/Mortality
Survival/mortalityand Reproduction
- Territorial areas- Food abundance /
availability
- Energy storage- Predation- Movement rates- Stress (disturbance)
- Nesting areas- Nesting sites- Chick production &
survival - Chick predation
Crab abundance andavailability
Water Salinity Freshwater inflow
Evaporation
Migration PeriodSurvival/mortality
- Stopover and stagingareas
- Stopover sites availability- Weather patterns- Migration mortality
(predation, collision
hazards, disturbance)
A
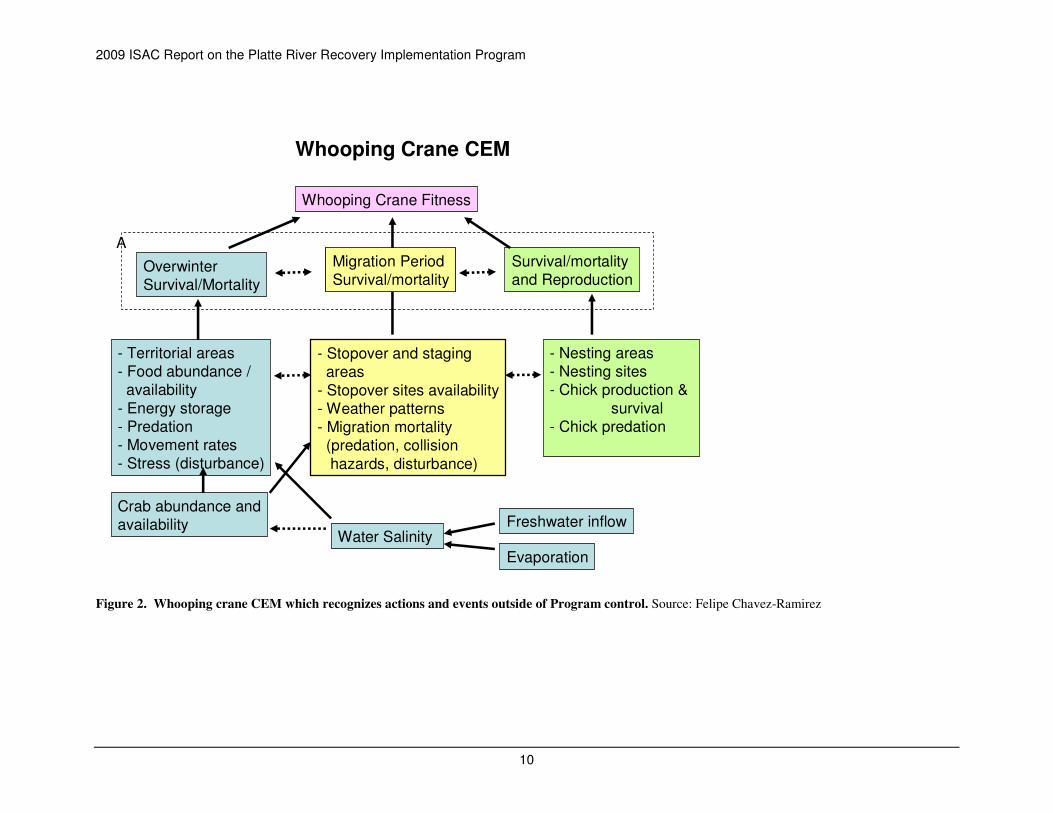
Figure 2. Whooping crane CEM which recognizes actions and events outside of Program control. Source: Felipe Chavez-Ramirez
2009 ISAC Report on the Platte River Recovery Implementation Program
11
2.3 Modeling
Main Findings on Modeling:
1. The Program should continue to use coupled hydrology, hydraulics, sediment transport, and
vegetation/habitat response models (e.g. models with SEDVEG-like capabilities) to assess
management actions.
2. The Program needs to increase the credibility of the above models through:
� documented performance assessment (for example, through ability to replicate
historical conditions); and
� documented sensitivity analyses (to assess which inputs are critical to predictions
and to improve parameter estimates).
3. The Program should add rapid prototyping models for other system components (e.g. possible
water & land scenarios, threatened and endangered species, sampling error), so as to:
� increase the Program’s ability to understand, visualize, and predict system
responses;
� better coordinate and integrate field studies;
� simulate design of management experiments (Section 2.4); and
� enable stakeholders to explore model behavior (even if they are just looking at
the stored results of previously run scenarios).
2.4 Data Analysis, Synthesis and Reporting
Main findings on Data Analysis, Synthesis and Reporting:
1. The reliability of the hypothesis test to assess Flow-Sediment-Mechanical (FSM) vs. Mechanical
Creation and Maintenance (MCM) depends on factors inside and outside of Program control. The
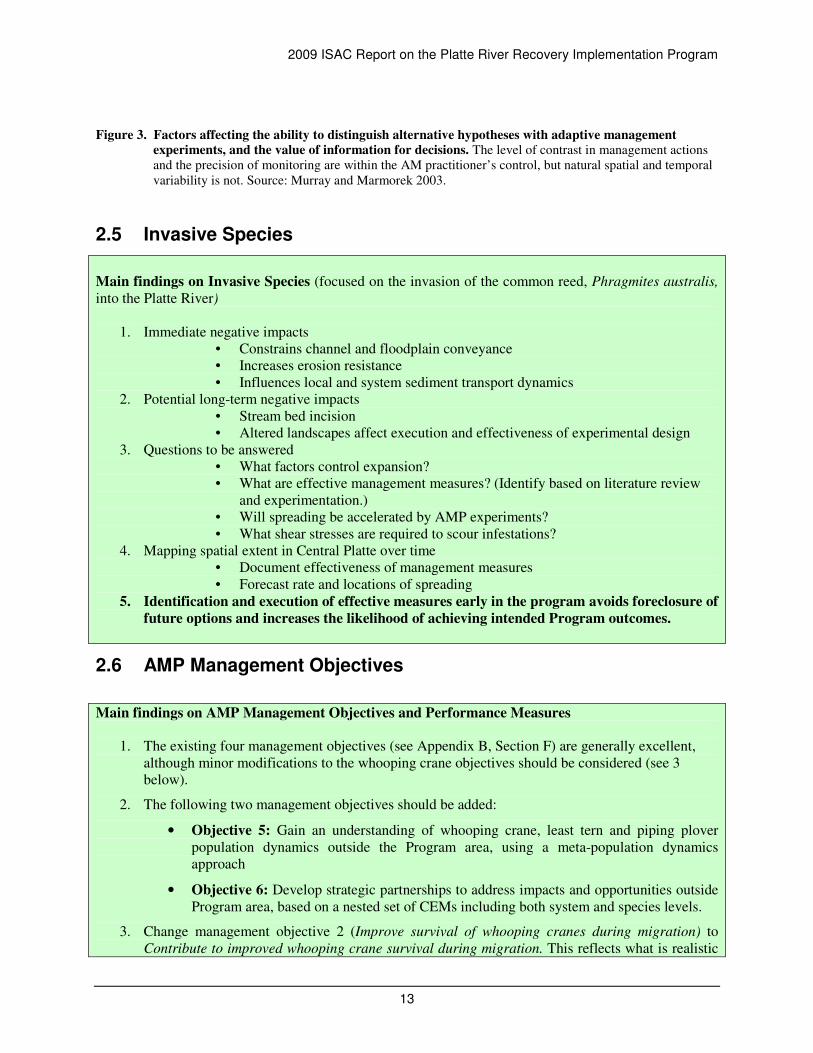
interaction of these factors needs to be fully explored (Figure 3).
2. We recommend that the Program develop a mock report based on mock (simulated) data, which
will help to organize the data analysis plan and reprioritize hypothesis tests (see #6 below).
3. The Program should analyze data quickly (within one season or year of data collection), share
syntheses at annual meetings, and adjust priorities based on learning.
4. The Program should not duplicate agency databases (e.g. USGS, USFWS, BoR), but rather skim
key variables & metadata into centralized PRRIP database, while ensuring strong data quality
procedures and consistent spatial / temporal references.
5. Reviewed data and reports should be made available to all in the spirit of transparency. If
participating agencies or institutions do not freely distribute published reports to the public, the
Program should make such reports available to stakeholders through an online library system.
6. To improve the ultimate value of information for decisions (Figure 2), the Program should
2009 ISAC Report on the Platte River Recovery Implementation Program
12
develop a mock report based on mock data (i.e. the type of data you expect to acquire over the
period of the First Increment). This would involve the following steps, which build upon
protocols developed by the US Environmental Protection Agency (EPA 2000) for defining data
quality objectives:
a. Define the decisions that you want to make at different times (e.g. assessments of action
effectiveness, revisions of actions).
b. Develop alternative land and water scenarios (e.g. number of willing sellers, water use,
climate), which reflect the uncertainty in implementing actions (Peterman 2004).
c. Simulate the expected range of contrast in actions under the experimental design.
d. Simulate the effectiveness in producing habitat, given various alternative hypotheses.
e. Simulate species’ responses to habitat changes, including confounding factors.
f. Add the expected sampling error in estimating performance measures.
g. Combining steps b to f will generate mock data.
h. Analyze the mock data as you would the real data.
i. Write up a mock report & draw conclusions for the key decisions outlined in step a.
j. Gain insight on the feasibility of hypothesis tests and ability to apply new information to
management decisions.
k. Revise (as required) the CEMs, experimental design, hypothesis priorities, sampling plan,
and data analysis plan.
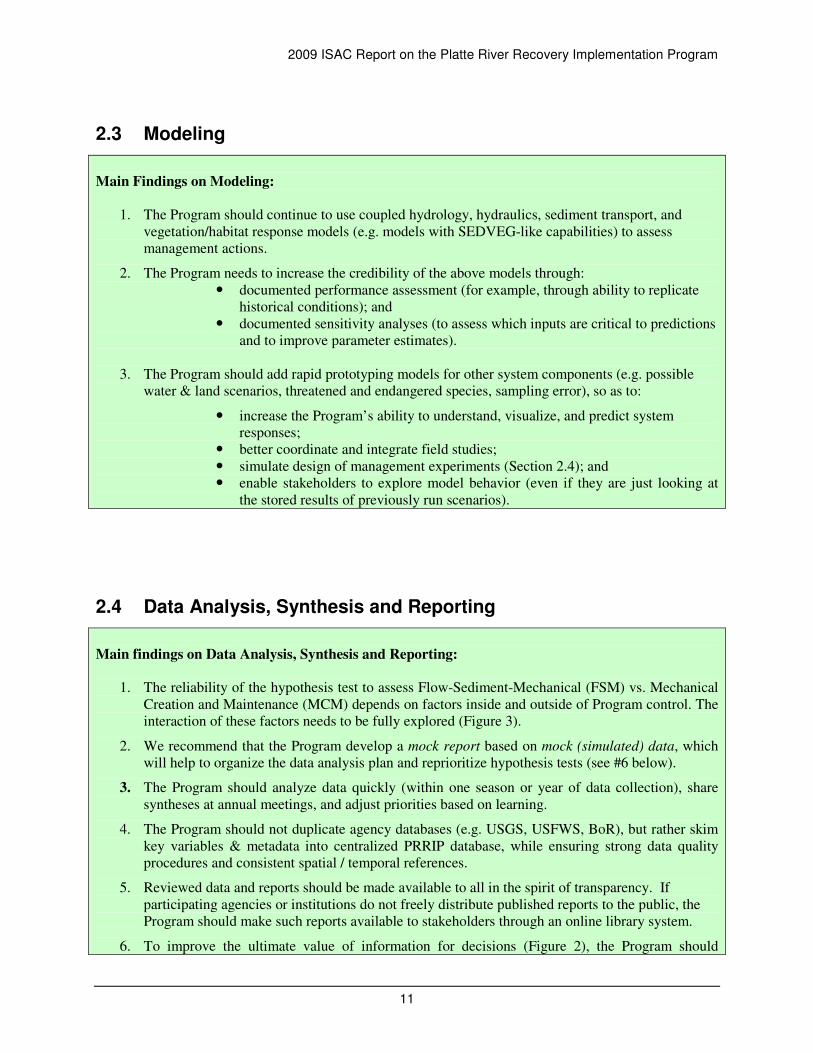
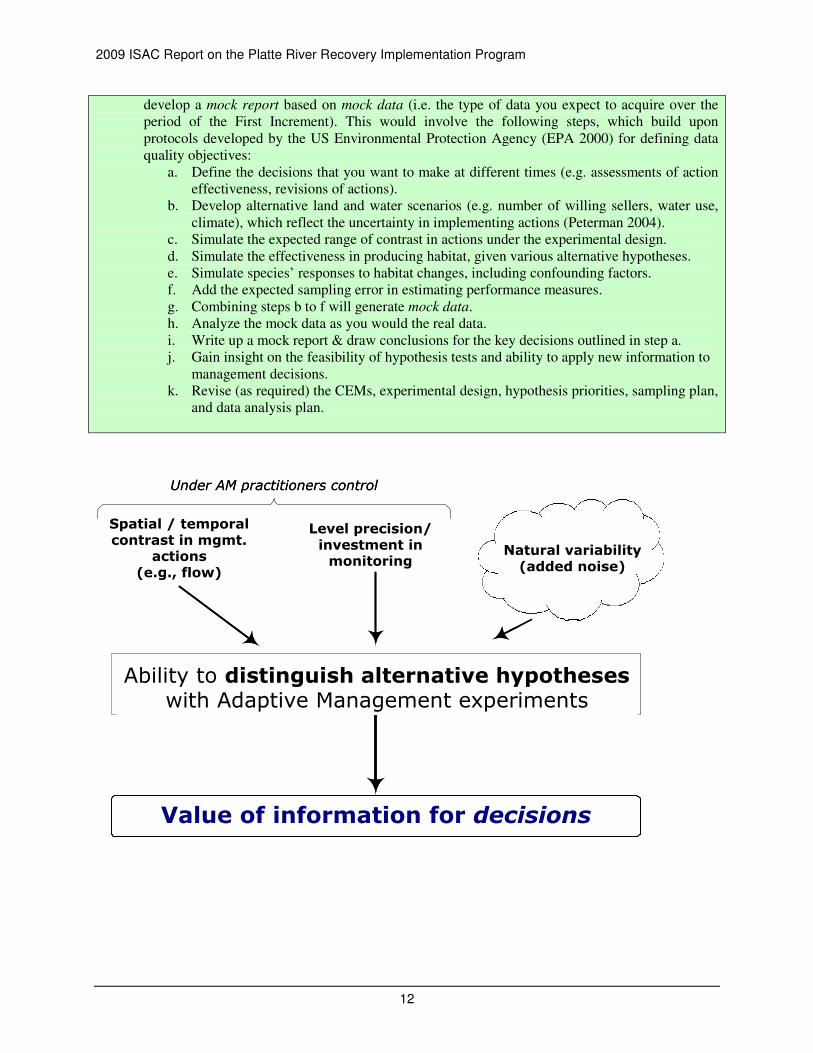
Spatial / temporalcontrast in mgmt.
actions(e.g., flow)
Level precision/investment inmonitoring
Natural variability(added noise)
Ability to distinguish alternative hypotheses w AMexperiments
Value of information for decisions
Under AM practitioners control
Ability to distinguish alternative hypotheseswith Adaptive Management experiments
2009 ISAC Report on the Platte River Recovery Implementation Program
13
Figure 3. Factors affecting the ability to distinguish alternative hypotheses with adaptive management
experiments, and the value of information for decisions. The level of contrast in management actions
and the precision of monitoring are within the AM practitioner’s control, but natural spatial and temporal
variability is not. Source: Murray and Marmorek 2003.
2.5 Invasive Species
Main findings on Invasive Species (focused on the invasion of the common reed, Phragmites australis,
into the Platte River)
1. Immediate negative impacts
• Constrains channel and floodplain conveyance
• Increases erosion resistance
• Influences local and system sediment transport dynamics
2. Potential long-term negative impacts
• Stream bed incision
• Altered landscapes affect execution and effectiveness of experimental design
3. Questions to be answered
• What factors control expansion?
• What are effective management measures? (Identify based on literature review
and experimentation.)
• Will spreading be accelerated by AMP experiments?
• What shear stresses are required to scour infestations?
4. Mapping spatial extent in Central Platte over time
• Document effectiveness of management measures
• Forecast rate and locations of spreading
5. Identification and execution of effective measures early in the program avoids foreclosure of
future options and increases the likelihood of achieving intended Program outcomes.
2.6 AMP Management Objectives
Main findings on AMP Management Objectives and Performance Measures
1. The existing four management objectives (see Appendix B, Section F) are generally excellent,
although minor modifications to the whooping crane objectives should be considered (see 3
below).
2. The following two management objectives should be added:
• Objective 5: Gain an understanding of whooping crane, least tern and piping plover
population dynamics outside the Program area, using a meta-population dynamics
approach
• Objective 6: Develop strategic partnerships to address impacts and opportunities outside
Program area, based on a nested set of CEMs including both system and species levels.
3. Change management objective 2 (Improve survival of whooping cranes during migration) to
Contribute to improved whooping crane survival during migration. This reflects what is realistic
2009 ISAC Report on the Platte River Recovery Implementation Program
14
and reduces the Program scope. Many factors external to the Program (e.g. power line mortality
in north Texas, forage quality at other stopovers) affect migration mortality of whooping cranes.
The whooping crane CEM should be revised to reflect these factors.
4. The existing whooping crane performance measures are appropriate (e.g., increase WC use days),
but others should be added (e.g. weight gain while at Platte, time budgets (% of time spent
feeding, resting, preening, defending, moving)).
5. Use a contingent, incremental approach for the sturgeon objective, only progressing to more
detailed studies once initial questions have been answered (see Main Findings on Prioritizing
Hypotheses in Section 2.1). The stage sensitivity study will document the hydrologic sensitivity
of lower Platte to central Platte flow management. If there is a change in flow which could be
significant to sturgeon, then the next logical step would be to use a sparse, stationary telemetry
framework to define migrations of sturgeon in/out of the Platte. If the telemetry results suggest
that sturgeon are using the Platte for spawning, then consider studies of larval recruitment. One
ISAC member has suggested that sparse telemetry studies could be done as a first step to
determining the level and location of use of the Platte by pallid sturgeon, but to do such studies as
part of the Missouri River Restoration Program (in coordination with the PRRIP).
6. Design forage fish approach based on the terns’ perspective, not the fishes’ perspective (See Q28
in Section 3.6).
2.7 Recommended Sequence of Activities for Addressing Our Recommendations
We would suggest the following sequence:
1. Work on Mock Report (Section 2.4), to facilitate:
a. More comprehensive CEMs for each species (Section 2.1)
b. Form strategic partnerships as guided by expanded CEMs (Section 2.1)
c. Clear data analysis plan (Section 2.4)
d. Additional rapid prototyping models for other system parts (Section 2.3)
e. Reprioritized hypotheses (Section 2.1)
f. Improved experimental design (Section 2.2), performance measures (Section 2.6)
and sampling efforts, as required
2. Update sediment transport assessment (Section 2.2(3) and 2.3), including consideration of
Phragmites (Section 2.5)
3. Establish ongoing data management, synthesis and reporting procedures (Section 2.4)
2009 ISAC Report on the Platte River Recovery Implementation Program
15
3. Comments on Specific Questions Posed for Each Topic
3.1 CEMs and Priority Hypotheses
Q1) Why is it necessary for Program CEMs to reflect small- and large-scale ecological processes?
The ISAC first clarified that “small” refers to processes within PRRIP lands and potentially affected by
PRRIP actions, whereas “large” includes other processes like whooping crane winter range (outside
PRRIP lands) and climate change (beyond PRRIP control). Our key point is that the Program needs to
understand enough of the system (including factors outside of Program control) to explain what happened
during the experiment. It doesn’t change what actions the Program undertakes. The following paragraphs
reflect additional points raised by ISAC members:
• Marmorek: Tracking covariates of potentially confounding influences (e.g. freshwater and ocean
conditions for salmon, Lawson et al. 2004, Paulsen and Fisher 2005, Marmorek et al. 2004) can help
to remove variation and isolate the treatment effect of interest. Including other processes in Program
CEMs doesn’t mean that the Program has to pay for monitoring them; the Program can rely on data
collected by others.
• Loftin: Critical factors either affecting or helping to understand changes in endangered species (ES)
clearly include factors outside the PRRIP. These are mostly habitat and best left to be described by
other ISAC members; however, much of the hydrology that is critical to habitat throughout the ES’
entire range has been altered and is human-managed to some or a large degree. Additionally, if there
are significant climate changes that affect the hydrology and ultimately habitat outside of the PRRIP,
then it would be good to include this in the CEMs.
• Nestler: It is not possible to achieve objectives by ignoring significant parts of the system in the
CEM. The act of ignoring the system-level context of the problem/challenge will result in well-
intentioned, but futile program actions. This is really a broader issue of reductionism versus holism.
It is possible to use a reductionist approach in water resources planning/engineering and integrate
later because the uncertainties are generally small, and there are robust procedures to deal with them.
However, a reductionist approach doesn’t work in restoration ecology because there are no accepted
procedures for integrating the separate analyses. This philosophical divide is what is really behind
this question.
• Galat: Large-scale processes can have a major affect on small-scale processes. This is a fundamental
principle of ecological hierarchy theory. For example, the quality of winter forage far outside of
project area influences numbers of whooping cranes, least terns, and piping plovers that migrate
through or nest on the Platte the following spring. Performance measures for PRRIP are not
independent of off-site factors (external drivers) and therefore they should be reflected in the CEM.
Q2) Does the term “ecological processes” include anthropogenic influences?
Our key point is that the Program needs to include anthropogenic influences and external driving forces
(e.g. water withdrawals and diversions, land use change, climate variability including climate change) in
CEMs, so that everyone is aware of factors potentially affecting the effectiveness of actions under
Program control. There are varying views on the best format for including such factors in CEMs:
2009 ISAC Report on the Platte River Recovery Implementation Program
16
• Marmorek and Jacobson: Anthropogenic influences should be represented on CEMs as actions or
stressors / filters.
• Loftin: Clearly the anthropogenic influences on hydrology and land cover have a major impact on the
ES and should be included to the appropriate degree when describing and/or modeling ecological
processes.
• Nestler: A process is a quantity/dt or a quantity/dx. There is no such thing as a “natural” versus
“anthropogenic” process; they differ only in magnitude not in kind. It is possible to consider
processes as having certain means and occurring within certain ranges to differentiate “natural”
versus “anthropogenic”.
• Galat: Ecological processes are affected by anthropogenic influences and thus ‘includes’ them. For
example, the magnitude and timing of irrigation water withdrawals (anthropogenic influence) may
affect least tern and piping plover reproductive success: Hydrology �sandbar availability �least
tern nesting �least tern population size.
Q3) What constitutes “inclusive” in terms of a CEM capturing the full range of ecological processes and interactions, in both spatial and temporal scales?
• Marmorek: The CEM should include any human action or ecological process which could
significantly affect the effectiveness of program actions in meeting management objectives, with the
caveat that CEMs should provide clarity and not be too complex.
• Loftin: All the major processes and their linkages should be included in CEMs. Process groups can
be lumped in a single “box” if helpful for showing less detail, but they should be described in a
separate figure.
• Nestler: A CEM describes the state of the knowledge: how the system works focused on Valued
Ecosystem Components VECs that are linked to Program goals and objectives. It provides both
direction and context for management actions. I thought the example of evening power line collisions
being a significant source of mortality for migrating whooping cranes because roosting areas were too
far apart was a most excellent example of the potential futility of restricting the CEM to project
boundaries and potential project actions.
• Galat: At a minimum CEMs need to include annual distribution of target species and ideally include
spatial lifecycle processes for targeted species over their spatial distribution.
Q4) How should the Program consider revising or updating the CEMs to better encompass these processes and interactions?
• Loftin: Generally, CEMs should be expanded as necessary using lumped processes when necessary
and detailing those lumped on a supplemental figure. The process for this doing this should be a bit
like brainstorming with the appropriate experts involved in the process. This process will need a
facilitator who is actually more of a participant and integrator.
• Nestler: It’s a system – so describe what we know/think about how the system works and that
includes power line collisions per the example above. Pare back at the action phase not at the CEM
phase. Others must have similar goals, so the program/CEM actions are really a road map to the
development of strategic partnerships. The situation of two neighbors provides an analogy. I don’t
control what happens on my neighbor’s property, but we may establish a strategic partnership to
mutually agree on what kind of new fence we need.
• Galat: Current CEMs are project specific and very operational. CEMs should be more species based
and linked to Program models.
2009 ISAC Report on the Platte River Recovery Implementation Program
17
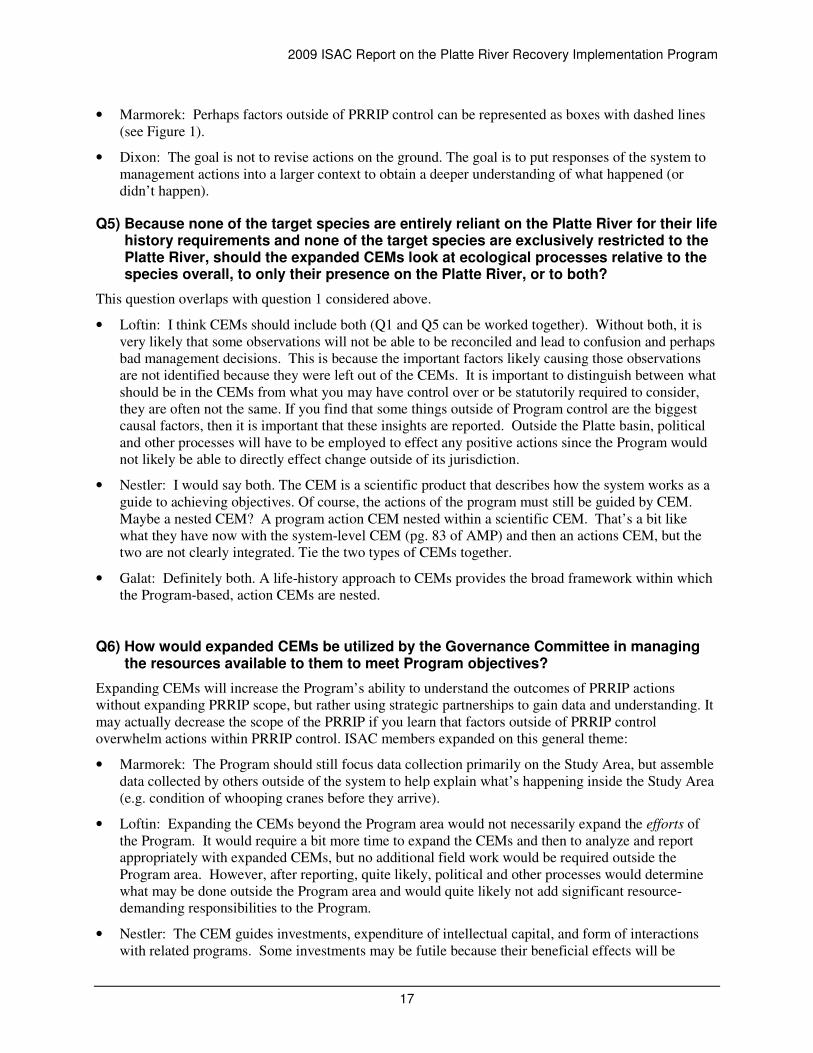
• Marmorek: Perhaps factors outside of PRRIP control can be represented as boxes with dashed lines
(see Figure 1).
• Dixon: The goal is not to revise actions on the ground. The goal is to put responses of the system to
management actions into a larger context to obtain a deeper understanding of what happened (or
didn’t happen).
Q5) Because none of the target species are entirely reliant on the Platte River for their life history requirements and none of the target species are exclusively restricted to the Platte River, should the expanded CEMs look at ecological processes relative to the species overall, to only their presence on the Platte River, or to both?
This question overlaps with question 1 considered above.
• Loftin: I think CEMs should include both (Q1 and Q5 can be worked together). Without both, it is
very likely that some observations will not be able to be reconciled and lead to confusion and perhaps
bad management decisions. This is because the important factors likely causing those observations
are not identified because they were left out of the CEMs. It is important to distinguish between what
should be in the CEMs from what you may have control over or be statutorily required to consider,
they are often not the same. If you find that some things outside of Program control are the biggest
causal factors, then it is important that these insights are reported. Outside the Platte basin, political
and other processes will have to be employed to effect any positive actions since the Program would
not likely be able to directly effect change outside of its jurisdiction.
• Nestler: I would say both. The CEM is a scientific product that describes how the system works as a
guide to achieving objectives. Of course, the actions of the program must still be guided by CEM.
Maybe a nested CEM? A program action CEM nested within a scientific CEM. That’s a bit like
what they have now with the system-level CEM (pg. 83 of AMP) and then an actions CEM, but the
two are not clearly integrated. Tie the two types of CEMs together.
• Galat: Definitely both. A life-history approach to CEMs provides the broad framework within which
the Program-based, action CEMs are nested.
Q6) How would expanded CEMs be utilized by the Governance Committee in managing the resources available to them to meet Program objectives?
Expanding CEMs will increase the Program’s ability to understand the outcomes of PRRIP actions
without expanding PRRIP scope, but rather using strategic partnerships to gain data and understanding. It
may actually decrease the scope of the PRRIP if you learn that factors outside of PRRIP control
overwhelm actions within PRRIP control. ISAC members expanded on this general theme:
• Marmorek: The Program should still focus data collection primarily on the Study Area, but assemble
data collected by others outside of the system to help explain what’s happening inside the Study Area
(e.g. condition of whooping cranes before they arrive).
• Loftin: Expanding the CEMs beyond the Program area would not necessarily expand the efforts of
the Program. It would require a bit more time to expand the CEMs and then to analyze and report
appropriately with expanded CEMs, but no additional field work would be required outside the
Program area. However, after reporting, quite likely, political and other processes would determine
what may be done outside the Program area and would quite likely not add significant resource-
demanding responsibilities to the Program.
• Nestler: The CEM guides investments, expenditure of intellectual capital, and form of interactions
with related programs. Some investments may be futile because their beneficial effects will be
2009 ISAC Report on the Platte River Recovery Implementation Program
18
superseded by factors that are outside the control/purview of the Program. These factors or processes
are the grist for strategic partnerships. There must be others that share or at least significantly overlap
with the Program’s portion of the objective space.
• Galat: I think there is a misperception here that the PRRIP must manage all aspects of a CEM; this is
neither necessary nor desirable. CEMs provide the organizing component for Program planning
(Ogden et al. 2005), as described by the quote cited below, in which Platte River could be substituted
for all italicized occurrences of South Florida:
“…conceptual models are used as planning tools to guide and focus scientific support for the South Florida
ecosystem restoration initiative and to build understanding and consensus among scientists and managers
regarding the set of working hypotheses that explain the sources and effects of major anthropogenically
induced changes on the natural system of the natural systems of South Florida. The hypotheses identify
specific, large-scale stressors on the natural systems, ecological effects of these stressors, and
recommended biological and ecological attributes of the natural systems that can best serve as indicators of
the effectiveness of restoration programs designed to reduce or eliminate the effects of the identified
stressors. In other words, each hypothesis describes ecological linkages between a stressor and a key
attribute of the natural system that has been altered due to effects of that stressor.” (Ogden et al. 2005)
CEMs serve to guide and focus the PRRIP as to what it can influence and what drivers are outside of
its scope or responsibility. In my opinion, PRRIP CEMs should be either species or system (place)
based rather than management action based. External drivers that impact local drivers and
performance measures need to be identified since they may produce variability in local responses,
which if their potential source were not identified might be mistaken for structural uncertainty. Those
aspects that PRRIP has influence over can be highlighted within a broad CEM. For example, the
number of whooping cranes stopping during spring migration at the project area is in part dependent
on overwinter survival in coastal Texas. If overwinter survival were not part of the CEM for
whooping cranes, variability in their spring stop-over numbers on the Platte might be attributed to
project actions rather than an external stressor. Failure to develop a system based CEM will increase
Program uncertainty due to ‘partial observability” (pg 4 of AMP 2006).
Q7) Is the guidance on Pages 17-18 of the AMP for prioritizing the Priority Hypotheses descriptive enough to assist with testing the Priority Hypotheses during the First Increment?
• Marmorek: There was a noble effort to filter down hypotheses to a priority set of 42, but I wonder if
the criteria still admitted too many hypotheses. The Program needs a much stronger quantitative
evaluation of the logistical and statistical feasibility of testing hypotheses, which considers
implementation uncertainty in actions (Peterman 2004), ability to statistically separate treatment
effects and potential confounding effects. The best way to do this is to simply simulate/rapid
prototype the whole experiment, and use the generated data to produce mock reports, as outlined in
Section 2.4 and Table 1.
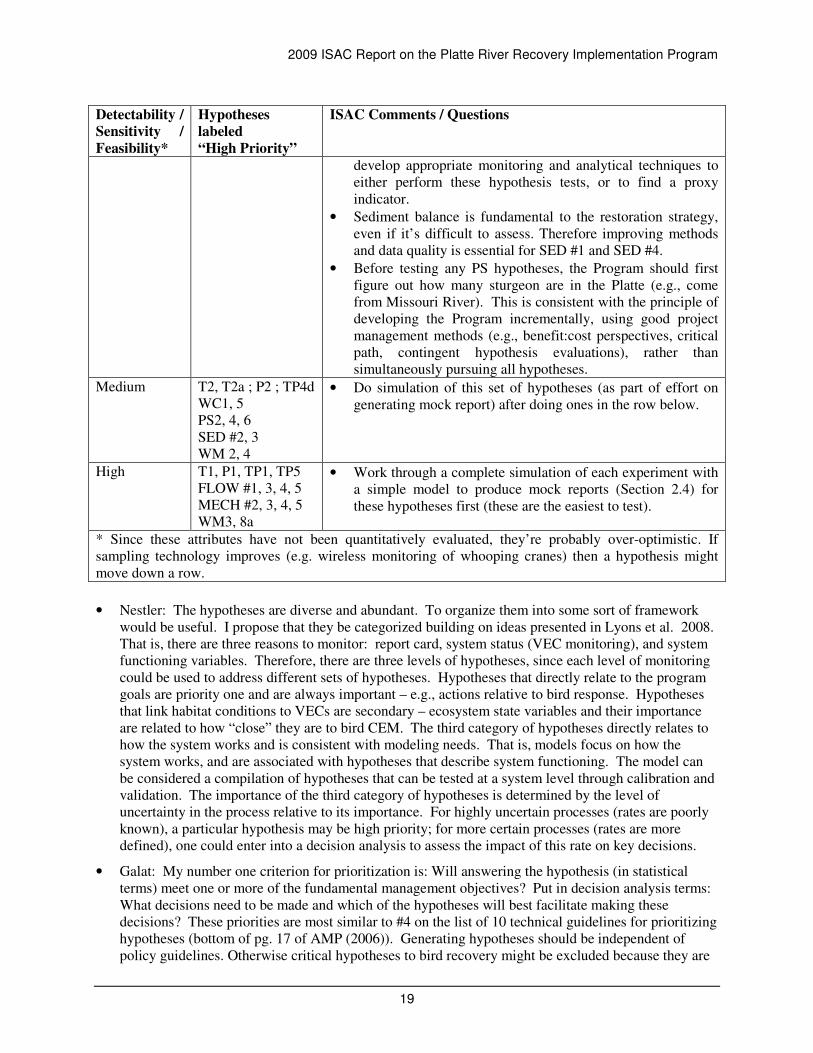
Table 1. Comments on priority hypotheses in the AMP.
Detectability /
Sensitivity /
Feasibility*
Hypotheses
labeled
“High Priority”
ISAC Comments / Questions
Low WC3, 4, 4a
PS1, 5, 7, 9, 11
SED #1, 4
• Is it realistic to test these hypotheses, given their low
feasibility? Even if it would be valuable to do so, why bother
if it’s not feasible? How badly do you need to know the
answer to each hypothesis? It may take several years to
2009 ISAC Report on the Platte River Recovery Implementation Program
19
Detectability /
Sensitivity /
Feasibility*
Hypotheses
labeled
“High Priority”
ISAC Comments / Questions
develop appropriate monitoring and analytical techniques to
either perform these hypothesis tests, or to find a proxy
indicator.
• Sediment balance is fundamental to the restoration strategy,
even if it’s difficult to assess. Therefore improving methods
and data quality is essential for SED #1 and SED #4.
• Before testing any PS hypotheses, the Program should first
figure out how many sturgeon are in the Platte (e.g., come
from Missouri River). This is consistent with the principle of
developing the Program incrementally, using good project
management methods (e.g., benefit:cost perspectives, critical
path, contingent hypothesis evaluations), rather than
simultaneously pursuing all hypotheses.
Medium T2, T2a ; P2 ; TP4d
WC1, 5
PS2, 4, 6
SED #2, 3
WM 2, 4
• Do simulation of this set of hypotheses (as part of effort on
generating mock report) after doing ones in the row below.
High T1, P1, TP1, TP5
FLOW #1, 3, 4, 5
MECH #2, 3, 4, 5
WM3, 8a
• Work through a complete simulation of each experiment with
a simple model to produce mock reports (Section 2.4) for
these hypotheses first (these are the easiest to test).
* Since these attributes have not been quantitatively evaluated, they’re probably over-optimistic. If
sampling technology improves (e.g. wireless monitoring of whooping cranes) then a hypothesis might
move down a row.
• Nestler: The hypotheses are diverse and abundant. To organize them into some sort of framework
would be useful. I propose that they be categorized building on ideas presented in Lyons et al. 2008.
That is, there are three reasons to monitor: report card, system status (VEC monitoring), and system
functioning variables. Therefore, there are three levels of hypotheses, since each level of monitoring
could be used to address different sets of hypotheses. Hypotheses that directly relate to the program
goals are priority one and are always important – e.g., actions relative to bird response. Hypotheses
that link habitat conditions to VECs are secondary – ecosystem state variables and their importance
are related to how “close” they are to bird CEM. The third category of hypotheses directly relates to
how the system works and is consistent with modeling needs. That is, models focus on how the
system works, and are associated with hypotheses that describe system functioning. The model can
be considered a compilation of hypotheses that can be tested at a system level through calibration and
validation. The importance of the third category of hypotheses is determined by the level of
uncertainty in the process relative to its importance. For highly uncertain processes (rates are poorly
known), a particular hypothesis may be high priority; for more certain processes (rates are more
defined), one could enter into a decision analysis to assess the impact of this rate on key decisions.
• Galat: My number one criterion for prioritization is: Will answering the hypothesis (in statistical
terms) meet one or more of the fundamental management objectives? Put in decision analysis terms:
What decisions need to be made and which of the hypotheses will best facilitate making these
decisions? These priorities are most similar to #4 on the list of 10 technical guidelines for prioritizing
hypotheses (bottom of pg. 17 of AMP (2006)). Generating hypotheses should be independent of
policy guidelines. Otherwise critical hypotheses to bird recovery might be excluded because they are
2009 ISAC Report on the Platte River Recovery Implementation Program
20
not within Program objectives. Testing them should reflect Program guidelines, but identifying
hypotheses should largely depend on identified drivers and stressors.
• Dixon: The list in the document (pg. 17-18) is not really a filtering mechanism. The critical path idea
could be morphed into the contingent hypothesis concept (IF we learn X, THEN we test hypothesis
Y).
• Jacobson: Pallid sturgeon is a good example of the contingent hypothesis idea. The Program will
shave off the biggest peaks in exchange for having more frequent, smaller peaks. The first question is
whether this change in stage will make any difference to the lower Platte River, which is largely
ground-water driven. If there’s no influence, then end of story. If there is a potential influence on
sturgeon, then you will need to know how much difference in flow is significant to the species. It
would be very useful to have a telemetry station at the mouth of the Platte River to detect how many
fish are coming in from the Missouri. You need to know if adults are spawning in the Platte before
looking to find out if there’s larval recruitment. See Section 2.6 (point 5).
3.2 Experimental Design
Q8) Are the experimental “means” objectives appropriate for implementation of the Program’s management strategies/actions?
The ISAC agreed that the existing means objectives were appropriate, and that they should be
supplemented with two additional means objectives:
• Objective 5: Gain an understanding of whooping crane, least tern and piping plover
population dynamics outside the Program area, using a meta-population dynamics
approach
• Objective 6: Develop strategic partnerships to address impacts and opportunities outside
Program area, based on a nested set of CEMs including both system and species levels.
Additional ISAC comments:
• Dixon: It’s appropriate to have means objectives like this, in that you’re one step away from birds,
and these are much more measurable indicators. It would be good to assess the detectability of newly
utilized sites.
• Marmorek: It’s important to ensure that you will have enough contrasts in habitat attributes using the
habitat parameter criteria defined from the Dec 11 /08 PRRIP meeting on habitat parameters for least
terns, piping plovers and whooping cranes. Contrasts in habitat attributes will be necessary for testing
alternative hypotheses related to habitat-VEC relationships.
• Galat: It’s good that you’ll have data on the entire habitat that’s out there, and plover/tern use of the
entire river regardless of what you’ve created. Habitat preferences will vary from year to year based
on conditions (e.g. dry vs. wet years).
Q9) Do the “means” objectives link adequately to the Program’s habitat criteria for terns, plovers, and whooping cranes?
ISAC comments on this question reflect an interactive conversation, and have been grouped into various
topic areas:
• Updating means objectives.
o Galat: Means objectives are practical steps to achieving intended habitat criteria (which
are based on literature and local knowledge), but the real proof of the pudding will be the
2009 ISAC Report on the Platte River Recovery Implementation Program
21
biological responses, and how they relate to biological benchmarks (described in
Appendix E of the AMP).
o Loftin: You will need to frequently update habitat criteria based on observed data on
habitat-biological functional relationships.
o Nestler: You will also need to update models that are used for management decisions so
that they become a corporate memory of science for the program.
o Dixon: A good example of updating models is the waterfowl models used to evaluate
impacts of hunting (U.S. Fish and Wildlife Service 2009).
• Means objectives and design decisions:
o Marmorek: If you are thinking of using attainment of means objectives as a guide to
changing management actions, then you need to ask yourselves: “What actions are really
up for re-examination during the First Increment?” It may take all of the First Increment
before you really know the effectiveness of Program actions.
o Nestler: For some design decisions (e.g., Where should we acquire islands? Is it better to
have 5 complexes of 2,000a or 2 complexes of 5,000a? How can you best consolidate
flows?), it will be best to use literature (and practicalities) to guide you.
o Marmorek: You may want to lay out a table with a variety of different mixes of # sites
and sizes of sites as columns (alternative decisions), and have your ecological objectives
as rows (e.g. WC, PP, LT, cost, experimental design flexibility), and just do some
qualitative assessments of relative merits (e.g. ranking) to organize your thinking.
Hammond et al. 1999 (the originators of the PrOACT approach that you’ve already
adopted in your rapid prototyping efforts) have some helpful examples of this kind of
qualitative decision analysis, and useful strategies for cropping down the size of the
objectives by alternatives matrix to simplify the decision problem.
o Loftin: We did an analysis like this of alternative combinations of sites and site
treatments in Florida; the difficult part is being able to evaluate relative merits of each
potential site and treatment combination against multiple objectives. In the Florida
example, we varied reservoir sizes and water treatment capacities across multiple sites
and compared different combinations by their net delivery of flood control, water supply,
and water quality treatment benefits.
• Habitat Quantity vs. Other Limiting Factors:
o Nestler: With only 90 terns, you may have more than enough habitat capacity. At low
population densities, productivity (e.g. food availability) and survival are probably more
critical. Physical habitat defined by flow is a necessary but not sufficient condition for
successful survival.
o Dixon: Until 5 years ago, there was no successful nesting of least terns and piping
plovers on the Platte River.
o Galat: Recent increases may simply have been due to other factors outside of this region.
If the river is dewatered, there’s clearly no forage. Bioenergetics issues come into the
question of whether habitat capacity or other factors are limiting. If you have to fly a long
way from a sandpit to the river, it’s not very efficient energetically. As for the forage fish
question (#28), it makes sense to work top-down to address food-limitation question, and
first ask “are the birds of healthy weights”? Food is unlikely to be a limiting factor at low
population densities since a low population size likely has an insignificant impact on food
resources. More subtle factors that influence reproductive success like locating mates,

2009 ISAC Report on the Platte River Recovery Implementation Program
22
courtship behavior, etc. frequently come into play with very low density bird populations.
o Marmorek: You could use a contingent hypothesis approach – look at bird weights vs.
age to decide if food availability is a problem.
Q10) Will the paired design offer necessary statistical power and the potential for distinguishing habitat selection between the two management strategies?
• Dixon: You can’t answer that question until you do the power analysis. You have strong statistical
support through Drew Tyre at the University of Nebraska. He (or someone else well-qualified) could
compute estimates of statistical power based on estimates of natural variability in the key
performance measures (PMs) and the magnitude of changes in these PMs which are of interest to
decision makers.
• Marmorek: Estimates of statistical power could be incorporated into the extension of rapid prototype
modeling associated with the development of a mock report (described in Section 2.4)
• Galat: True replicates, controls and randomization are not possible in the PRRIP. What we have on
the Platte might be better termed a quasi-experiment (Block et al. 2001) and more specifically an
impact quasi-experiment (Williams et al. 2002).
Q11) Should the AMWG consider an alternative experimental design? If the ISAC suggests an alternative design, please describe the basic design given the four available habitat complexes (Cottonwood Ranch, Elm Creek, Wyoming property, and Dippel).
• Dixon: There is no reason to consider an alternative to the paired design, but you will need to ensure
that you measure important covariates which differ among various sites and could be just as
important correlates of bird density and behavior as your management treatments.
• Marmorek: You might be able to expand the number of sites in your analyses by acquiring data from
other investigators (for either FSM or MCM treatments).
Q12) Does the ISAC have recommendations for directed research the Program could conduct to investigate the influence of flow factors such as duration, frequency, and timing on vegetation and river form?
• Jacobson: Monitoring and modeling of flow effects on physical habitat should consider flow releases
and pulses of varying frequency, magnitude, and duration that arise from unplanned, opportunistic
events. This will require a flexible, adaptive monitoring plan that can bracket geomorphically
effective events. Vegetation scour is not instantaneous. You will need pre- and post-event
measurements of cross-sections for planned flow events, as well as for unusual large flow events.
• Marmorek: You need to do a reconnaissance of how many data points you could actually feasibly
acquire, and what analyses you would do after getting them.
• Nestler: It would be simpler to use a good computational fluid dynamics model to look at expected
scour to explore these factors. Lisa Fotherby is looking at improving the BoR’s existing models to do
this. Some combination of empirical and computational fluid dynamics modeling would be required,
especially to model the vegetation scour processes.
Q13) Are there any tools or sources of data aside from the ongoing Program monitoring protocols and other directed research that are critical to assessing system-level responses to Program actions?
• Jacobson: Sediment augmentation is a major factor in the recovery plan. The range of sediment
2009 ISAC Report on the Platte River Recovery Implementation Program
23
transport estimates should be addressed and there is a need to reconcile modeling and measurements.
I strongly recommend expanded sediment transport measurements, justified by the central role of
sediment transport in habitat dynamics and the high costs of augmentation. Methods of estimating
sediment input from tributaries are very weak. You need to know how fast sediment moves when you
dump it in, and you can’t predict that very well.
• Dixon: You need to be sure that your monitoring will work under different scenarios (e.g. a scenario
where MCM attracts birds, while the overall central Platte stays constant). You should be able to
detect that if you’re doing effective monitoring of the entire reach.
• Galat: Expanded CEMs (Sections 2.1 and 3.1) should help you to recognize any critical gaps in
existing monitoring and research. The piping plover, whooping crane and least tern scientists in the
Platte River are on top of the literature, and are well connected to existing networks of researchers.
They should and will get region-wide information that’s relevant to interpreting local responses, and
determining if the drivers are internal to the system or external.
3.3 Modeling
Q14) What approach should the Program take to utilizing models as predictive tools for implementation of management actions – simple and user-friendly design-aid tools directed at answering specific questions or a more complex consolidative system (integrated hydrology/sediment/vegetation) model?
• Loftin: All appropriate tools should be used without a view that a single tool will provide all the
“answers.” Following the concept of “multiple modes of inquiry” will serve the Program well. The
different tools and the inherently slightly different results they will produce is a healthy attribute
forcing understanding and reconciliation of what the models really say. Differences should not
generally be viewed as “dueling models.”
• Jacobson: The existing models (SEDVEG versions and SRH-1DV) provide an important framework
for exploring sensitivity of the system to variable inputs. The models have a large number of
parameters that need to be estimated, and it is arguably impossible to validate such models.
However, in coordination with data collection, the models can be used to consolidate understanding
and explore sensitivity.
Q15) Based on your collective experience should the Program develop a new or adapt an existing integrated hydrology/sediment/vegetation model to serve as a predictive tool for implementation of management actions? If so, what strategies do you recommend for maximizing transparency and stakeholder buy-in?
• Loftin: Generally, adapting an existing model has many advantages if that model is selected wisely.
You will have its pedigree working to your advantage including prior reviews, applications, and user
groups. In most cases this will also be more effective and efficient. If program priorities rule in favor
of creating an entirely new model, it should proceed with great discipline and receive proper external
reviews for validity. Either approach used should ensure that the model is capable of producing
outputs in a form that management can use to make decisions. (Model output must comply with
performance measure metrics adopted by the Program.)
• Jacobson: The program should update the SEDVEG model to SRH-1DV and nest 2-D models within
it to capture high-resolution processes. Such models should include visualization and interaction so
that stakeholders can easily grasp and run model scenarios, even if these are stored outputs from
multiple runs done previously.
2009 ISAC Report on the Platte River Recovery Implementation Program
24
Q16) How could the tern/plover and whooping crane Rapid Prototype models be expanded to include other important parameters?
• Dixon: The basic components are in the current models. A two-stage model is appropriate for terns
and plovers. I couldn’t figure out the whooping crane model, so I have no comments there.
Comments on terns and plovers model:
a. Are the effects of flooding and nest predation factored into the fledge ratio? If not, they
need to be included, which will lead to a smaller fledge, but more accurate ratio.
b. The effects of density dependence are quite strong; the calculated fledge ratio is about 1/2
the maximum for plovers and about 1/3 the maximum for terns. Hence, this part of the
model is very important. Have you examined the sensitivity of model conclusions to the
form and parameterization of density dependence?
c. Is the response to new habitat immediate? That is implicit in your current model, in
which habitat area influences the demography via density dependence.
d. Possible alternate models (some probably are biologically meaningless, so this is a
brainstorm list, not a carefully checked set):
� The probability of nesting on the central Platte River is linearly dependent on
available habitat. Hence, juvenile production is linearly dependent on habitat.
� A density-dependent meta-population model, in which each chunk of habitat is a
meta-population with a maximum number of colonies. Density dependence acts
only within meta-populations. Building habitat adds meta-populations.
� Some form of density-independent model. The difficulty here will be
incorporating habitat area.
� Stochastic population growth models explicitly consider the variability in year-
year vital rates. For at least some types of models, the population growth rates
are lower in a stochastic model because boom years do not compensate for poor
years.
Q17) Should the Program consider development of a large-scale physical model and/or seek relevant data on channel dynamics from other analogous river systems?
• Loftin: On the development of a large-scale physical model, not necessarily; on the use of relevant
data from other analogous river systems, absolutely. A large-scale physical model has only two
values: 1) to help resolve informational needs for numerical models that are absolutely not available
by other means (physical models for this purpose may not “look” like the prototype, i.e., the river, but
rather like an engineering/laboratory model, e.g., a glass sided flume); and 2) to provide visualization
for stakeholders and non-technical managers and officials. These models do look like the prototype
and can be great public information tools (first) with some technical value (second), but are needed
less and less as advancements are made in numerical modeling and computer animations of their
results. Also, this second type of physical model is the most expensive to build and maintain.
• Jacobson: I would explore the Loup River because of the potential for examining a more or less
unaltered flow regime. However, it is clearly not a braided river. Still, it may show something about
geomorphically effective events and tern/plover habitat.
2009 ISAC Report on the Platte River Recovery Implementation Program
25
3.4 Data Analysis, Synthesis and Reporting
Q18) What recommendations does the ISAC have for building an approach to data analysis and synthesis?
The ISAC recommends doing the mock report simulation analysis outlined in Section 2.4.
• Marmorek: As for databases, allow those who populate separate databases to continue to do that (e.g.
USGS, USFWS, BoR) and then have PRRIP extract key variables and associated metadata from
agency databases into a centralized PRRIP database that facilitates cross-disciplinary analyses.
Avoids creating duplicate datasets. The Trinity River Restoration Program is gradually implementing
this approach.1
• Jacobson: The Program should provide a centralized depository of information, catalogued, easy and
free to download for all stakeholders. Engage a third party – an institution that can be intimately
involved in all aspects of data collection – to synthesize diverse science outputs emerging from
various projects (UNL?).
• Dixon: At some appropriate frequency, critically examine: a) the models and their parameter
estimates, and b) the differences among treatments. Use the available data to re-estimate
demographic parameters and compare alternative models. The waterfowl management programs
(U.S. Fish and Wildlife Service 2009) use an annual cycle of data analysis and model evaluation to
support harvest recommendations. That may be more frequent than needed here because
management decisions are not made annually.
• Loftin: One aspect of our advice on this point is that best practices suggest that data not be stored in
two places lest the secondary location will always be at risk to be behind the currency of the primary
source. This has to be tempered with practicality, but when possible, the secondary source should
utilize links and retrieve the data from the source each time it is used (in case the source has been
updated unbeknownst to the end user). For simulation models, there needs to be an exception where
the best “snap shot” at a given point in time needs to be documented as an input data version and that
version should only be updated when there is substantially new data to warrant it and the new input
data version properly documented as there may be changes in the historical record if errors have been
discovered and corrected.
Q19) Are the 11 remaining years of the First Increment sufficient to test between the two management strategies?
• Marmorek: This depends on strength of treatments and level of contrast, including natural variation in
flows beyond Program control. The modeling for the mock report effort (Section 2.4) will give you a
sense for how long it might take to complete this test, and what improvements in experimental design
may be required (e.g. stronger contrast in treatments, more precise monitoring – see Figure 3)
• Jacobson: The logistical problem is that the flow driver will not be completely controllable. Flow
does not seem to be amenable to direct experimentation – and there’s not enough time for replicates –
but it may be amenable to exploratory and opportunistic approaches for learning during the First
Increment.
• Dixon: The ability to test the two strategies depends on the size of the difference between treatments
and the variability between years, between sites, and between islands. Some data are available to
estimate those variance components.
1 See http://www.trrp.net/science/IIMS.htm
2009 ISAC Report on the Platte River Recovery Implementation Program
26
Q20) Are there critical findings that may cause a change in the management strategies (i.e. new model output, invasive species) before the end of the First Increment?
• Marmorek: The analysis that lays the foundation for the mock report may suggest a change in the
design within the terms of the agreements (e.g. same total amount of water and land, same treatments
but allocated differently in time and space to increase contrast)
• Jacobson: Certainly, the role of Phragmites in constraining conveyance and increasing erosion
resistance is critical. Updated sediment transport rates could also lead to major realignment of
strategies. Consideration of the effects of long-term incision (compared to short-term redress of
sediment imbalance) may require that the experimental design be altered.
Q21) If the Program undertakes a “mock report” that discusses the results of implementation of the AMP over the course of the First Increment what would the ISAC recommend as appropriate structure and content for that report?
• Marmorek: Start by preparing an outline for the report that you would produce at the end of the First
Increment. Then, based on the simulation analyses described in Section 2.4, fill in that report with
mock graphs and tables (and statistical tests) for different combinations of water / land scenarios and
hypotheses. Then try to draw mock conclusions for each set of results for each of the major
hypothesis tests, but particularly the comparison of the FSM and MCM management strategies. What
would you conclude for each potential combination of water / land scenarios and hypotheses? The
key performance measures would be the proportion of these cases (and their attributes) which
generates a high statistical power test of FSM vs. MCM (say 0.7 power or higher). The results may be
sobering, but will force you to re-evaluate your methods as described in Section 2.4 and under Q19.
Some potentially useful examples of similar decision analyses include Peters and Marmorek (2001),
Bradford et al. 2005, and Alexander et al. 2006.
Q22) Does the Program need to refine and clarify the decision analysis framework being used to develop experimental objectives, design management actions as experiments, develop monitoring and research plans, and ultimately use results to inform and help adjust management and policy?
This question seems almost rhetorical. The answer is: “YES!” Other comments:
• Galat /Marmorek: You need to plan in advance what you are going to do with the monitoring data
you collect, and how you will step back though the hypotheses, CEMs, means objectives, and
management objectives to make decisions? In short, you need to preplan how will get from data to
decisions, and preparation of the mock report will help you to do that (see Section 2.4 and Q21).
• Galat: Defining the decisions that need to be made should be the first step. This might be a great
application of PrOACT tools in the sense of forcing more explicit predictions of the consequences of
actions. The present monitoring protocols are not always designed to yield data that answer priority
hypotheses. The dependent variables of interest for testing hypotheses, and the associated
quantitative management objectives listed in Appendix E of the AMP (2006, pg. 157) are excellent.
However, they do not clearly emerge from the monitoring protocols listed in Table 1 of the AMP
(2006, pg. 58). All the pieces need to reinforce one another within an AM loop.
Q23) What is an adequate timeframe for reporting on the status of AMP implementation and results/progress toward management objectives?
The Program should analyze data quickly (within one season or year of data collection), share syntheses
at annual meetings, and adjust priorities based on learning.
2009 ISAC Report on the Platte River Recovery Implementation Program
27
3.5 Invasive Species
Q24) What key questions does the Program need to investigate regarding the influence of vegetation on river form and function?
• Loftin: The Program must understand the controlling factors and ensure that the program and its
experiments do not worsen the spread of Phragmites. Also, early intervention should be accelerated
if possible to help ensure the best future opportunities, and avoid having invasive plants foreclose
major habitat restoration opportunities. Finally, effort should be spent to map and forecast the
potential spread of this and other exotic species.
• Jacobson: You need to narrow understanding of the shear stresses needed to scour vegetation of
various classes. This can be addressed through careful field studies coupled with 2-D models.
Q25) Should the invasion of Phragmites change the Program’s approach to implementation of the AMP? If so, how?
• Loftin: It is possible that delay (because of extended AMP activities) may result in greater spread of
Phragmites. A watchful eye should be put on getting answers to these problems and looking for the
earliest application(s) of intervention.
• Jacobson: For conveyance issues, it sounds like Phragmites control may need to be in place in canals
before flows can be effective.
3.6 AMP Management Objectives
Q26) Should the whooping crane management objective be modified to provide a stronger link between Program actions, measured parameters, and species response?
As described in Section 2.6, the ISAC believes that management objective 2 (Improve survival of
whooping cranes during migration) should be changed to Contribute to improved whooping crane
survival during migration. This reflects what is realistic and reduces the Program scope.
• Galat: The current whooping crane objective is not doable within the Program since many factors
outside of the Program affect whooping crane survival during migration (e.g., forage quality at other
stop-over locations). This is a good example where an expanded whooping crane CEM would
identify primary factors that affect survival during migration, and then highlight those that PRRIP has
some control over.
Q27) The Program’s long-term goal is to “improve and maintain the associated habitats”, which includes “testing the assumption that managing flow in the central Platte River also improves the pallid sturgeon’s lower Platte River habitat”. The specific management objective in the AMP related to pallid sturgeon is currently a “Do No Harm” objective. From a scientific and AMP implementation standpoint, how should the Program approach prioritizing actions related to pallid sturgeon in the lower Platte River as detailed on Pages 45 and 66 of the AMP?
• Jacobson: Evidence supports the notion that Platte River pallid sturgeon are Missouri River sturgeon.
Movement of fish between the Missouri and Platte is a fundamental issue that needs to be addressed
through expanded telemetry. If it is demonstrated that Program-managed discharge events persist
downstream to affect reaches occupied by sturgeon, the remainder of the actions will depend on
2009 ISAC Report on the Platte River Recovery Implementation Program
28
establishing the relative numbers of sturgeon using the Platte, and whether the Platte (or Elkhorn)
provides critical habitat for its reproduction.
Q28) In assessing the tern/plover management objective, several Priority Hypotheses postulate relationships between tern/plover productivity, flow, and forage availability. Current Program monitoring efforts related to forage fish for least terns have generally shown an abundance of fish even after low flow periods. The TAC has subsequently considered eliminating or pairing back on these monitoring efforts. However, concerns were raised that the elimination of such monitoring (and without associated research plans) would leave the Program with no means of evaluating the effectiveness or need for USFWS target flows related to least terns and forage fish. What approaches should the Program use to appropriately study and assess the effectiveness of the USFWS target flows in meeting their various stated purposes? Does our existing set of hypotheses (and planned monitoring and research efforts) accomplish this?
• Dixon (focusing on the analysis of the relationship between forage fish and discharge): The focus of
these analyses is to describe and evaluate the relationship between forage fish and discharge. As I
roughly recall from the discussion at the March 2009 meeting, the discharge (the effect of interest)
varies between dates. When both date (a factor variable) and discharge (a continuous variable) are
included in the model, the date variable serves to assess the lack of fit to the linear regression (or
spline smooth) for discharge. This is probably not what was intended. I suggest that you examine
each site’s data to assess whether the slope of the line varies among sites. If so, you should consider a
model that includes only a random effect of site on both the intercept (1|site) and slope
(discharge|site). If not, then consider a model with only a random effect of site on the intercept.
• Galat: An Interior Least Term CEM that addresses tern bioenergetics would be helpful here as it
would ID those factors that determine tern productivity related to forage base. Here are some factors
such a model would include:
o Size of forage: (0.5 to 3” defined by PRRIP is appropriate).
o Composition of forage: abundance for selected taxa (i.e., generally young-of-year and
adults of small-bodied species and young-of-year of large bodied species that are surface
feeders (e.g., topminnows, mosquitofish)) or pelagic (many minnows, shiners, gizzard
shad), particularly schooling species (although see below).
o Energy quality of forage – calories/gram. I think we can assume that this would be about
equal for all fishes.
o Ease of capture of forage, which is related to composition. Fishes at the surface are more
easily captured than those deeper in the water column. Schooling species are generally
easier for terns to locate (they first detect the school), but targeting individual fish for
capture is likely less for a fish in a school (schooling is a predation defense).
Foraging efficiency depends on:
o The distance of the feeding area from the nest. This defines the time required for
foraging forays (time between feeding of young) and energy expended by adults for
foraging.
o The depth of water: Terns are sight feeders and generally forage in the top 0.5 m so fish
present below this depth are considered unavailable;
o Water clarity. It is predicted that foraging success will decrease as water clarity
(turbidity) and depth increase – as might occur during a flow pulse during the fledgling
2009 ISAC Report on the Platte River Recovery Implementation Program
29
feeding season (see below).
The current monitoring program is based on previous monitoring programs (surveillance or
observational monitoring: monitoring that provides estimates of system status and system dynamics
not related to a priori hypotheses) whose purpose was not directly related to Hypothesis T2 or T2a,
and therefore may not be the most effective approach to address this priority hypothesis. The Program
should develop targeted monitoring (monitoring based on a priori hypotheses and associated models
of system responses to management; see Nichols & Williams 2006). For example, it is not the
abundance of fish at a location that is relevant to tern foraging, but the density of target sized fishes
per volume of water in the tern foraging zone.
It is recommended that a forage fish evaluation program be designed to explicitly test PRRIP interior
least tern (ILT) foraging priority hypotheses, and be based primarily on the tern’s perspective not the
fishes’. What this means is that the program should first address if food is potentially limiting ILT
fledgling rate, or might become limiting as numbers of tern nests increase during the recovery
program. For example, the fundamental question is: does food limit ILT reproductive success on the
Platte? More specifically, are growth rates of Platte ILT chicks similar or different than those of
other ILT colonies (e.g., Missouri River, Mississippi River)? What is the current incidence of
apparent starvation of Platte ILT chicks? How do these differ between sand-pit and river sites? A
bioenergetics model of ILT chicks coupled with the current Northern Prairie USGS foraging study
would tell us the biomass (number) of fish required for successful fledging. This could then be linked
to predicted scenarios of tern nesting populations to determine IF forage might become limiting at
some future nest density.
Any fish monitoring program should be closely integrated with the current USGS tern and plover
foraging study. The spatial fish sampling design should not be based on historical transects but be
spatially and temporally linked to tern nesting colonies. For example, forage fish sampling sites
should be based on concentric circles at various distances out from sand pit and sandbar colonies.
This can then be used to address if terns forage based on prey density or distance from nest, or some
combination of the two.
Given the usual high density of potential forage fishes during the ILT nesting season it was
hypothesized that forage is not limiting to ILT fledgling success on the Middle Mississippi River (See
Dugger 1997, Tibbs and Galat 1998, Dugger et al. 2002). Consequently, it appears more profitable to
first assess if food is potentially limiting ILT fledgling success through a modeling approach than to
continue an observational forage fish monitoring study that is likely to produce weak inferences. This
is primarily because of the large number of potential hypotheses that can be invoked to explain how
differences in composition, abundance and habitat use of the forage fishes’ prey base, all of which are
notoriously variable, might relate to ILT fledging success. The current ILT foraging study will give
information on where terns forage and (foraging habitat use). The associated environmental variables
collected (depth, water clarity, temp, etc) could be linked to similar habitat-based results from past /
current fish monitoring programs to examine use vs. availability (i.e., selection). Results from this
coupled with modeling could then be used to design a more hypothesis-targeted fish monitoring
program, if questions remain.
Factors that affect the density of fish and the ILTs ability to locate prey are high priority. For the
river this is likely to be flow pulses during the fledgling feeding period. One hypothesis is that flow
pulses will likely dilute fish density per volume of water and reduce water clarity, thereby increasing
the time spent foraging per nest visit to feed chicks, and decreasing the number of prey fed to young
per unit time decreases. This might be reflected in reduced growth rate, time to fledging, or increased
fledgling mortality.

2009 ISAC Report on the Platte River Recovery Implementation Program
30
4. References Cited
Alexander, C.A.D., C.N. Peters, D.R. Marmorek and P. Higgins. 2006. A decision analysis of flow management
experiments for Columbia River mountain whitefish (Prosopium williamsoni) management. Can. J. Fish. Aquat.
Sci. 63: 1142-1156.
Block, W. M., A. B. Franklin, J. J.P. Ward, J. L. Ganey, and G.C. White. 2001. Design and implementation of
monitoring studies to evaluate the success of ecological restoration on wildlife. Restoration Ecology 9: 293-303.
Bradford, M.J., J. Korman and P.S. Higgins. 2005. Using confidence intervals to estimate the response of salmon
populations to habitat alterations. Can. J. Fish. Aquat. Sci. 62: 2716-2726. doi: 10.1139/F05-179.
EPA (United States Environmental Protection Agency). 2000. Guidance for the Data Quality Objectives Process.
EPA QA/G-4. Office of Environmental Information, Washington, DC. www.epa.gov/quality1/qs-docs/g4-
final.pdf
Dugger, K.M. 1997. Foraging ecology and reproductive success of the least terns nesting on the lower Mississippi
River. Ph. D. Dissertation. University of Missouri, Columbia. 137 pp.
Dugger, K.M., M.R. Ryan, D.L. Galat, R.B. Renken and J.W. Smith. 2002. Reproductive success of the interior
least tern (Sterna antillarum) in relation to hydrology on the lower Mississippi River. River Research and
Applications 18: 97-195.
Hammond, J.S., R.L. Keeney and H. Raiffa. 1999. Smart Choices: A practical guide to making better decisions.
Harvard Business School Press, Boston, Massachusetts.
Lawson, P.W. E.A. Logerwell, N.J. Mantua, R.C. Francis, and V.N. Agostini. 2004. Environmental factors
influencing freshwater survival and smolt production in Pacific Northwest Coho salmon (Oncorhynchus
kisutch). Can. J. Fish. Aquat. Sci. 61(3): 360–373
Lyons, J. E., M.C. Runge, H.P. Laskowski, and W.L. Kendall. 2008. Monitoring in the context of structured
decision making and adaptive management. Journal of Wildlife Management 72: 1683–1692.
Marmorek, D.I. Parnell, M. Porter, C. Pinkham, C. Alexander, C. Peters, J. Hubble, C. Paulsen, and T.
Fisher. 2004. "A Multiple Watershed Approach to Assessing the Effects of Habitat Restoration Actions on
Anadromous and Resident Fish Populations", 2004 Technical Report, Project No. 200300300, 448 electronic
pages, (BPA Report DOE/BP-00012481-1). http://www.essa.com/documents/ESSA%20Multi-
watershed%20report%20H00012481-1.pdf
Murray, C. and D. Marmorek. 2003. Adaptive management: a science-based approach to managing ecosystems in
the face of uncertainty. Presented at the Fifth International Conference on Science and Management of
Protected Areas: Making Ecosystem Based Management Work, Victoria, British Columbia, May 11-16, 2003.
http://www.sampaa.org/PDF/ch8/8.9.pdf
Nichols, J.D., and B.K. Williams. 2006. Monitoring for conservation. Trends in Ecology and Evolution 21: 668-
673.
Ogden, J.C., S.M. Davis, K.J. Jacobs, T. Barnes, and H.E. Fling. 2005. The use of conceptual ecological models
to guide ecosystem restoration in South Florida Wetlands 25: 795–809.
Paulsen, C.M., and T.R. Fisher. 2005. Do habitat actions affect juvenile survival? An information theoretic
approach applied to endangered Snake River Chinook salmon. Transactions of the American Fisheries Society
134(1): 68-85.
2009 ISAC Report on the Platte River Recovery Implementation Program
31
Peterman, R.M. 2004. An overview of the precautionary approach in fisheries and some suggested extensions.
Chapter 23 in Proceedings of The World Summit on Salmon, June 10-12, 2002. Edited by Patricia Gallagher
and Laurie Wood. Simon Fraser University. http://www.sfu.ca/cstudies/science/summit.htm
Peters, C.N. and D.R. Marmorek. 2001. Application of decision analysis to evaluate recovery actions for
threatened Snake River spring and summer Chinook salmon (Oncorhynchus tshawytscha). Can. J. Fish. Aquat.
Sci. 58(12): 2431-2446.
PRRIP (Platte River Recovery Implementation Program) 2006. Adaptive Management Plan. Attachment 3 of
the Platte River Recovery Implementation Program Document. 254 pp incl. appendices
http://platteriverprogram.org/Documents/PRRIP%20Attachment%203%20-%20adaptive_management_plan.pdf
Tibbs, J.E. and D.L. Galat. 1998. The influence of river stage on endangered least terns and their fish prey in the
Mississippi River (USA). Regulated Rivers: research and management 14: 257-266.
TRRP (Trinity River Restoration Program) and ESSA Technologies Ltd. 2008. Integrated Assessment Plan,
Version 0.99 – December 2008. Draft report prepared for the Trinity River Restoration Program, Weaverville,
CA. 269 pp. http://trrp.net/documents/IAP/IAP%20Draft%20v_99_Dec19.pdf
U.S. Fish and Wildlife Service. 2009. Adaptive Harvest Management: 2009 Hunting Season. U.S. Dept. Interior,
Washington D.C. 52 pp. http://www.fws.gov/migratorybirds/NewReportsPublications/AHM/Year2009/2009-
AHM-report%28Final%29.pdf
Williams, B.K., J.D. Nichols, and M.J. Conroy. 2002. Analysis and management of animal populations. Academic
Press, San Diego.
2009 ISAC Report on the Platte River Recovery Implementation Program
32
Appendix A – ISAC Membership
Dr. Philip Dixon – Department of Statistics, Iowa State University, Ames, IA
Dr. David Galat – USGS/University of Missouri Cooperative Fish & Wildlife Research Unit, Columbia
MO
Dr. Robert Jacobson – Research Hydrologist, USGS, Columbia MO
Mr. Kent Loftin – HydroPlan, LLC, Hobe Sound, FL.
Mr. David Marmorek (ISAC Chair) – President, ESSA Technologies Ltd., Vancouver BC
Dr. John Nestler – Fisheries Engineer and Ecohydraulics, Fisheries and Environmental Services,
Vicksburg MS
2009 ISAC Report on the Platte River Recovery Implementation Program
33
Appendix B – Questions Submitted to ISAC
PLATTE RIVER RECOVERY IMPLEMENTATION PROGRAM
TO: Independent Scientific Advisory Committee (ISAC)
FROM: Chad Smith, ED Office
RE: Questions to address during June 2009 ISAC meeting
DATE: May 27, 2009
The Platte River Recovery Implementation Program (Program) requests your review of and response to
the following questions related to implementation of the Program’s Adaptive Management Plan (AMP).
These questions have been developed and submitted by Program staff, the Adaptive Management
Working Group (AMWG), and the Technical Advisory Committee (TAC). The questions build on key
issues facing the Program as implementation of the AMP progresses and relate to several of the main
items discussed at the initial ISAC meeting in March 2009.
We anticipate these questions will serve as the focus of discussion during the June 2009 ISAC meeting in
Cheyenne. The expectation is that the ISAC will provide some initial framing thoughts during your
presentation to the Governance Committee (GC) on the afternoon of June 2 and then more detailed
responses in a written “Response to Questions” to be generated after the June meeting. Additional
questions that arise during the ISAC meeting or that are posed by the GC can be addressed in the written
response as well.
Conceptual Ecological Models and Priority Hypotheses
The AMP includes several Conceptual Ecological Models (CEMs) that are broad conjectures about how
the Platte River system functions and serve as visual representations of current understandings of the
Platte River system, management actions, and indicator variables. The AMP provides some guidance on
reviewing and evaluating the CEMs, and there was significant discussion during the March 2009 ISAC
meeting about the need to broaden the scope of the CEMs to include influences outside the scope of the
Program even if not affected by Program actions. This effort to broaden the CEMs could become quite
extensive, so if it is to be undertaken the ISAC needs to address the following questions for the AMWG
and the GC:
1) Why is it necessary for Program CEMs to reflect small- and large-scale ecological processes?
2) Do “ecological processes” include anthropogenic influences?
3) What constitutes “inclusive” in terms of a CEM capturing the full range of ecological processes
and interactions, in both spatial and temporal scales?
4) How should the Program consider revising or updating the CEMs to better encompass these
processes and interactions?
5) Because none of the target species are entirely reliant on the Platte River for their life history
requirements and none of the target species are exclusively restricted to the Platte River, should
the expanded CEMs look at ecological processes relative to the species overall, to only their
presence on the Platte River, or to both?
6) How would expanded CEMs be utilized by the Governance Committee in managing the
resources available to them to meet Program objectives?
2009 ISAC Report on the Platte River Recovery Implementation Program
34
The AMP includes 42 Priority Hypotheses that are more specific in regard to system function and
response to management actions. Many of these hypotheses are competing and, even in conjunction with
X-Y graphs, are still general in nature.
7) Is the guidance on Pages 17-18 of the AMP for prioritizing the Priority Hypotheses descriptive
enough to assist with testing the Priority Hypotheses during the First Increment?
Experimental Design
Through the course of several workshops, the AMWG has now identified specific experimental “means”
objectives for several management actions to be implemented under the AMP. The current objectives
focus primarily on the Flow-Sediment-Mechanical (FSM) management strategy but also include actions
under the Mechanical Creation and Maintenance (MCM) management strategy. As discussed in the
Program’s Strategic Science Plan, the adaptive management experimental “means” objectives for the
2009-2015 time period include:
Sediment Augmentation Achieve sediment balance just upstream of Cottonwood Ranch.
Mechanical Actions Given a balanced sediment budget and implementation of Program short-duration high flows,
mechanically create/maintain (MCM) and create/maintain with flows and sediment (FSM) Program-
defined habitat for the target species (least tern, piping plover, and whooping crane).
Short-Duration High Flows (SDHF) Given a balanced sediment budget and appropriate channel width, determine:
���� Sand bar area and height at a reference flow of 1,200 cfs at Program complexes resulting from SDHF.
���� Degree of maintenance of sand bars with less than 25% vegetative cover at Program complexes
resulting from SDHF (includes sandbars created by flows and FSM bars constructed by Program).
���� The role of SDHF in maintenance of active channel width at Program complexes.
As initially proposed, implementation of these management actions is being conducted through a “paired
design” where actions under both the FSM and MCM strategy are planned to occur simultaneously in
space and time. For example, under the Mechanical Actions objective, two different types of potential
tern/plover nesting islands would be designed and constructed at each of four Program habitat complexes
– some islands would be designed and built to be overtopped and maintained by SDHF; other islands
would be designed and built in the same location to be high enough to avoid being overtopped by SDHF
(these islands would require mechanical vegetation and predator management).
8) Are the experimental “means” objectives appropriate for implementation of the Program’s
management strategies/actions?
9) Do the “means” objectives link adequately to the Program’s habitat criteria for terns, plovers,
and whooping cranes?
10) Will the paired design offer necessary statistical power and the potential for distinguishing
habitat selection between the two management strategies?
11) Should the AMWG consider an alternative experimental design? If the ISAC suggests an
alternative design, please describe the basic design given the four available habitat complexes
(Cottonwood Ranch, Elm Creek, Wyoming property, and Dippel).
12) Does the ISAC have recommendations for directed research the Program could conduct to
investigate the influence of flow factors such as duration, frequency, and timing on vegetation
and river form?
13) Are there any tools or sources of data aside from the ongoing Program monitoring protocols
2009 ISAC Report on the Platte River Recovery Implementation Program
35
and other directed research that are critical to assessing system-level responses to Program
actions?
Modeling The Bureau of Reclamation (BOR) used the SedVeg system model (sediment transport and vegetation) as
a predictive tool during development of the Final Environmental Impact Statement for the Program. BOR
is now developing the SRH-1DV system model, and Program staff has been talking to outside experts and
consultants about other available tools. In addition, the AMWG developed two Rapid Prototype models
that serve as simple but useful tools for predicting potential species response to habitat availability during
the First Increment.
14) What approach should the Program take to utilizing models as predictive tools for
implementation of management actions – simple and user-friendly design-aid tools directed at
answering specific questions or a more complex consolidative system (integrated
hydrology/sediment/vegetation) model?
15) Based on your collective experience should the Program develop a new or adapt an existing
integrated hydrology/sediment/vegetation model to serve as a predictive tool for
implementation of management actions? If so, what strategies do you recommend for
maximizing transparency and stakeholder buy-in?
16) How could the tern/plover and whooping crane Rapid Prototype models be expanded to include
other important parameters?
17) Should the Program consider development of a large-scale physical model and/or seek relevant
data on channel dynamics from other analogous river systems?
Data Analysis, Synthesis, and Reporting To complete the adaptive management cycle, information gained from implementation, monitoring, and
research must be evaluated and synthesized to ultimately result in changes to the management approach
and associated policy.
18) What recommendations does the ISAC have for building an approach to data analysis and
synthesis?
19) Are the 11 remaining years of the First Increment sufficient to test between the two
management strategies?
20) Are there critical findings that may cause a change in the management strategies (i.e. new
model output, invasive species) before the end of the First Increment?
21) If the Program undertakes a “mock report” that discusses the results of implementation of the
AMP over the course of the First Increment what would the ISAC recommend as appropriate
structure and content for that report?
22) Does the Program need to refine and clarify the decision analysis framework being used to
develop experimental objectives, design management actions as experiments, develop
monitoring and research plans, and ultimately use results to inform and help adjust
management and policy?
23) What is an adequate timeframe for reporting on the status of AMP implementation and
results/progress toward management objectives?
Invasive Species
Invasion of common reed (Phragmites australis) into the Platte River system seems to be significantly
influencing river form and function, including sediment transport and stability of bars and banks.
2009 ISAC Report on the Platte River Recovery Implementation Program
36
24) What key questions does the Program need to investigate regarding the influence of vegetation
on river form and function?
25) Should the invasion of Phragmites change the Program’s approach to implementation of the
AMP? If so, how?
AMP Management Objectives AMP implementation performance measures are the management objectives, which include:
•••• Improve production of interior least tern and piping plover from the central Platte River ���� Increase nesting pairs
���� Increase fledge ratios
���� Decrease adult mortality by reducing predation
•••• Improve survival of whooping cranes during migration ���� Increase habitat availability on central Platte River (area of suitable roosting habitat and foraging
habitat, proportion of population, crane use days)
•••• Avoid adverse impacts from Program actions on pallid sturgeon populations ���� No indicators identified; further research needed
•••• Within overall objectives 1-3, provide benefits to non-target listed species and non-listed species of
concern and reduce likelihood of future listings ���� Increase habitat availability on central Platte River
26) Should the whooping crane management objective be modified to provide a stronger link
between Program actions, measured parameters, and species response?
27) The Program’s long-term goal is to “improve and maintain the associated habitats”, which
includes “testing the assumption that managing flow in the central Platte River also improves
the pallid sturgeon’s lower Platte River habitat”. The specific management objective in the
AMP related to pallid sturgeon is currently a “Do No Harm” objective. From a scientific and
AMP implementation standpoint, how should the Program approach prioritizing actions
related to pallid sturgeon in the lower Platte River as detailed on Pages 45 and 66 of the AMP?
28) In assessing the tern/plover management objective, several Priority Hypotheses postulate
relationships between tern/plover productivity, flow, and forage availability. Current Program
monitoring efforts related to forage fish for least terns have generally shown an abundance of
fish even after low flow periods. The TAC has subsequently considered eliminating or pairing
back on these monitoring efforts. However, concerns were raised that the elimination of such
monitoring (and without associated research plans) would leave the Program with no means of
evaluating the effectiveness or need for USFWS target flows related to least terns and forage
fish. What approaches should the Program use to appropriately study and assess the
effectiveness of the USFWS target flows in meeting their various stated purposes? Does our
existing set of hypotheses (and planned monitoring and research efforts) accomplish this?
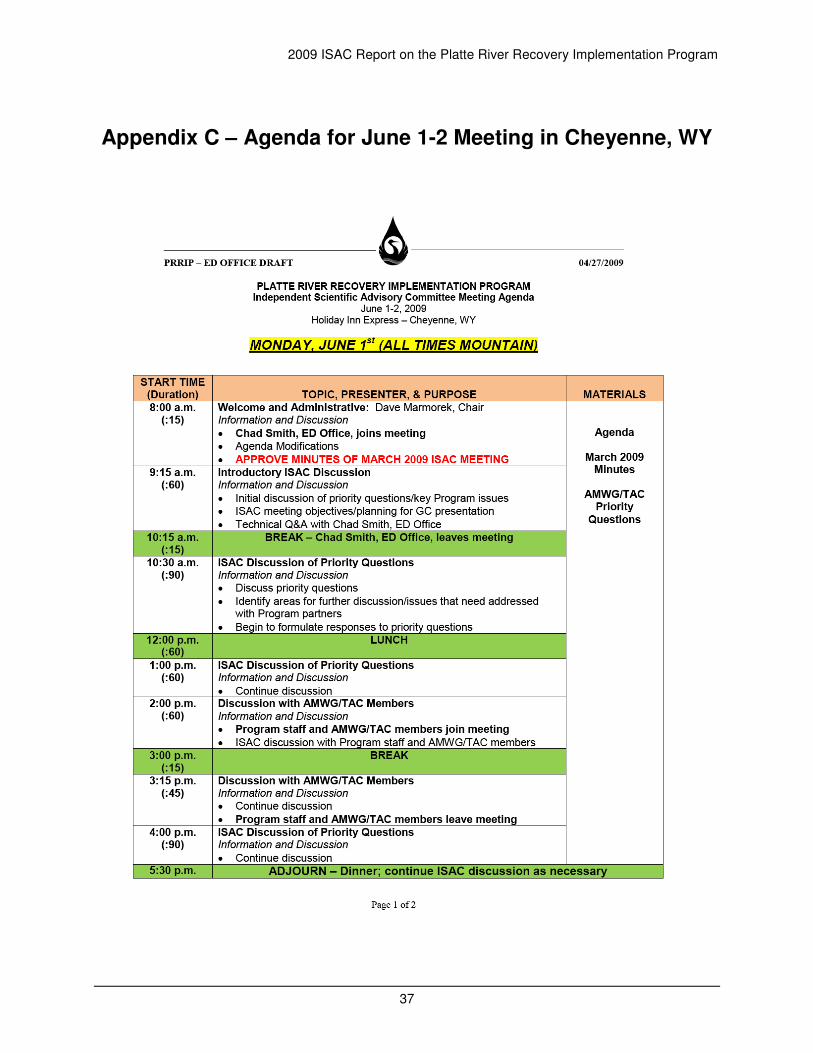
2009 ISAC Report on the Platte River Recovery Implementation Program
37
Appendix C – Agenda for June 1-2 Meeting in Cheyenne, WY
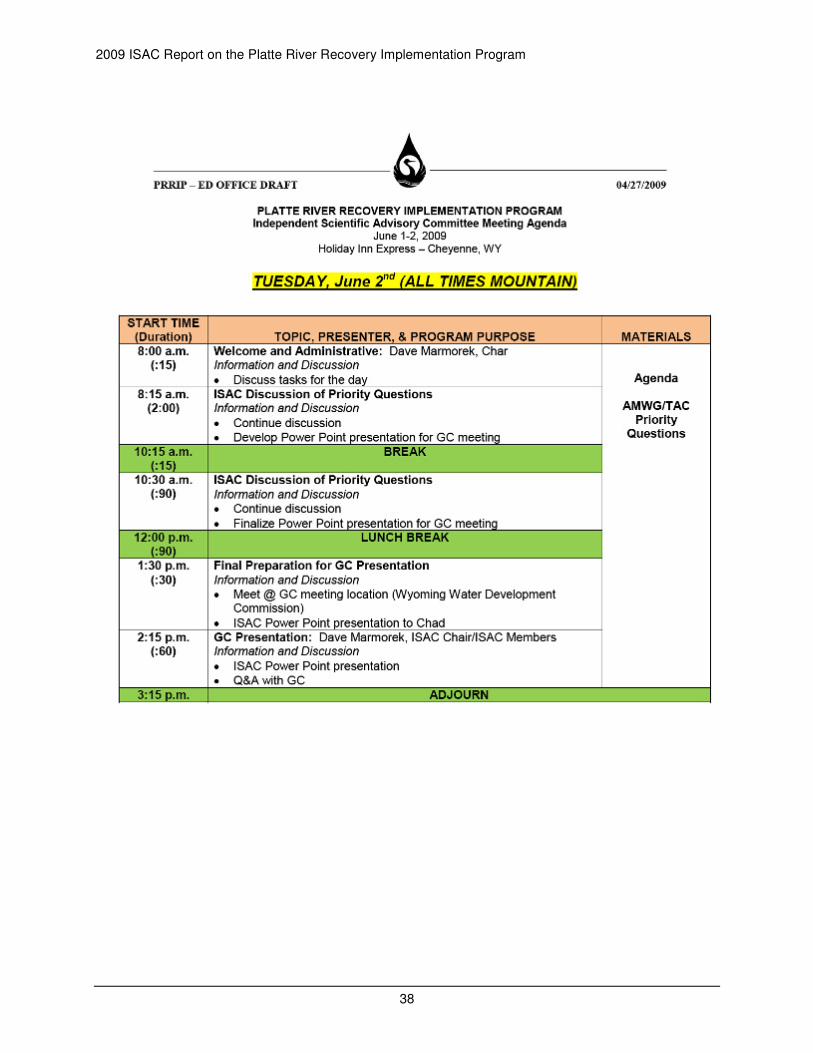
2009 ISAC Report on the Platte River Recovery Implementation Program
38