Embed Size (px)
Citation preview

r r
INDEPENDENT RESEARCH Luxury Goods 2nd December 2015 Buying opportunities despite volatile environment! Luxury Goods
CHRISTIAN DIOR BUY FV EUR170 vs. 172
Last Price EUR173.2 Market Cap. EUR31,475m HERMES Intl BUY FV EUR344
vs. 350
Last Price EUR335.5 Market Cap. EUR35,418m HUGO BOSS NEUTRAL FV EUR110 Last Price EUR81.64 Market Cap. EUR5,747m KERING NEUTRAL FV EUR173
vs. 177 Last Price EUR162.15 Market Cap. EUR20,474m LVMH BUY FV EUR177
vs. 182 Last Price EUR157.4 Market Cap. EUR79,979m RICHEMONT BUY FV CHF90 Last Price CHF78 Market Cap. CHF43,680m SALVATORE FERRAGAMO BUY FV EUR26.0
vs.26.5 Last Price EUR22.75 Market Cap. EUR3,840m THE SWATCH GROUP NEUTRAL FV CHF430 Last Price CHF364.4 Market Cap. CHF19,748m TOD'S GROUP NEUTRAL FV EUR82
vs. 85 Last Price EUR75.7 Market Cap. EUR2,317m
After a relatively poor Q3, the recent terrorist attacks in Paris are likely and unfortunately to affect Q4 sales growth. Therefore, we prefer to be cautious and slightly adjust our FY 15 and 16 organic sales growth. We leave unchanged our rating.
Luxury groups’ Q3 results releases highlighted some important points including a new trend: i/ a global slowdown with 3% average organic sales growth after +6% in Q2; ii/ confirmation of buoyant performances in Japan and Europe with respectively 22% and 14% organic sales growth; iii/ a deterioration in Asia-Pacific, particularly in Hong Kong and Macao; and iv/ the new trend is the slowdown perceived in North America during the quarter (0%) after a dynamic Q2 (+8%). The common factor of all these moves is the predominant impact of currencies and therefore tourist flows.
The tragic events in Paris on November 13th are likely to have, unfortunately, an impact on traffic in stores and tourist numbers to Paris, and this is just before the strategic Christmas period, which should lead to a poor Q4 2015 sales momentum and likely also in Q1 2016 in our view. Q4 accounts for 30% of FY sales in this industry. Nevertheless, we argue that this effect should not last very long and we anticipate a recovery from the end of Q1 2016, ceteris paribus. Nevertheless, we revise down by one point our FY 15 and 16 organic sales increase.
Our First Consumer Conference which was held on November 27th allowed us to meet the management of some luxury groups. The overall conclusion from the meetings was that management remained cautious in the short term and admitted there would some impact on sales momentum following the attacks.
Consequently, we also adjust many of our FVs. Nevertheless, we leave unchanged our recommendations and particularly our Buy recommendation on LVMH (FV: EUR177 vs EUR182), on Hermès (FV: EUR344 vs EUR350) and on Richemont (FV: CHF90).
91
96
101
106
111
116
121
126
STOXX EUROPE 600 PERS & H/H GDS E STOXX EUROPE 600
02/12/15
Source Thomson Reuters
Analyst: Sector Analyst Team: Loïc Morvan Nikolaas Faes 33(0) 1 70 36 57 24 Antoine Parison [email protected] Cédric Rossi
Virginie Roumage
Luxury Goods
2
Table of contents
1. Momentum slowdown in Q3 ................................................................................................... 3
1.1. Some slowdown versus Q2 .............................................................................................................. 3
1.2. But Q2 slowdown is not a new trend! ........................................................................................... 4
1.3. More volatile US market in Q3 ....................................................................................................... 4
2. Consequence of terrorists attacks in Paris.............................................................................. 6
2.1. Europe accounts for 33% of luxury goods market ..................................................................... 6
2.2. Europe is one of the sales growth driver YTD ............................................................................ 8
2.3. First takeaways after the attacks in Paris ....................................................................................... 8
2.4. New assumptions for 2015 and 2016 ............................................................................................. 9
2.5. What have we learnt from our 1st Consumer Conference? ...................................................... 10
3. Valuation & recommendation ................................................................................................ 11
3.1. Stockmarket performances not so affected by November 13th!.............................................. 11
3.2. Peer comparison .............................................................................................................................. 11
3.3. Changes to Fair Values and recommendation ............................................................................ 12
Bryan Garnier stock rating system .............................................................................................. 15

Luxury Goods
3
1. Momentum slowdown in Q3 Although Q3 2015 organic sales growth clearly slowed down versus Q2, we would also like to highlight that the subdued activity of the luxury goods sector is not a new trend. Furthermore, Q3 has been characterised by more volatile momentum in North America with even further deterioration in Asia-Pacific.
1.1. Some slowdown versus Q2 In Q3, luxury groups’ organic sales growth slowed down versus Q2 with an average 3% increase after +6% in Q2 and +1% in Q1 (penalised by a very poor Japan due to very demanding comps). Amongst our luxury groups sample, the best performer was, once again, Hermès, with an 8% increase, while the worst performance was achieved by the two Italian groups. Salvatore Ferragamo remained almost stable (-0.6%) and Tod’s revenues declined 2% after the Q2 rebound (+8%).
Nevertheless, we would also highlight the very solid performance of LVMH. Actually, thanks to a very well-balanced business (Spirits, Leather goods, Perfumes, Jewellery, Selective Retail) and geographical sales breakdown, the luxury goods worldwide leader achieved a 7% revenue increase during the quarter, despite a poor 3% growth for the Leather goods division (including for Louis Vuitton) but thanks to a strong recovery at Wines & Spirits (+16%, of which +23% for Cognac). The Gucci brand’s (Kering) sales were almost stable during the quarter (-0.4%, including +1% for Retail alone) after +4.6% in Q2.
We remind that Richemont recorded 3% organic sales growth for H1 (April to September) after +4% on 5m (April to August), which implies around stable sales momentum in the month of September. The Swiss group’s management added, which is not really encouraging, that October sales were down 7%. Hugo Boss and Burberry both also recorded a very poor and very disappointing Q3. The German group achieved a 1% organic sales decline in Q3 following +7% in Q2, including -7% in Americas and -12% in Asia-Pacific, while the British brand recorded 1% same stores sales growth in H1 (consensus was expecting +6%), following +6% in Q1, implying -5% in Q2 alone (July-September) with a further clear deterioration in both Asia-Pacific (mid single-digit sales decline in H1 versus low single-digit decline in Q1) and the Americas (low single-digit sales growth following a high single-digit increase in Q1).
Fig. 1: Quarterly organic sales growth (%) LFL sales growth (%) Q1 14 Q2 14 Q3 14 Q4 14 2014 Q1 15 Q2 15 Q3 15
Hermès 15 10 11 10 11 8 10 8
Hugo Boss 6 8 9 3 6 3 7 -1
LVMH 6 4 4 5 5 3 9 7
o/w F& L division 9 0 2 4 3 1 10 3
Kering 4 4 4 5 5 -1 8 3
Kering Luxury 6 6 4 4 5 -3 8 3
o/w Gucci brand 0 -1 -2 0 -1 -8 5 0
Prada 4 5 3 0 2 -6 2 0
Richemont 15 5 4 0 2 2 2 3
Salvatore Ferragamo 8 8 3 8 7 2 3 0
Swatch Group 6 3 2 0 1 4 4 2
Tod's Group 2 -4 0 2 0 -3 8 -2
Average Luxury 7 4 4 4 4 1 6 3
Source: Company Data; Bryan, Garnier & Co ests.
Organic sales growth slowed down in Q3 versus Q2
In Q3, organic sales growth reached 3% vs +6% in Q2

Luxury Goods
4
1.2. But the Q3 slowdown is not a new trend! But this subdued momentum is not, in our view, new for the luxury goods sector. Actually, in the interesting chart below, we see that since Q2 2011, the luxury groups’ average organic sales growth has slowed continuously (from a very high and exceptional level, almost never seen before in the industry), and the relatively low Q3 2015 level is therefore not an exception. The trend is, according to us, only continuing, with, this time, significant trend differences between the geographical areas (see below).
From now on, the luxury groups have to adapt (and they are doing so) their strategies and opex policies to, this normalisation industry momentum. This may imply, for instance, greater selectivity in store expansions which could lead in some cases (in China but not only…) to a few store closures or more likely store relocations. Among others, Louis Vuitton, Gucci or some Richemont brands (Jaeger LeCoultre for instance in Hong Kong) have done this recently and, in our view, are likely to do it again in the coming months.
Fig. 2: Quarterly organic sales growth
Source: Company Data; Bryan, Garnier & Co ests.
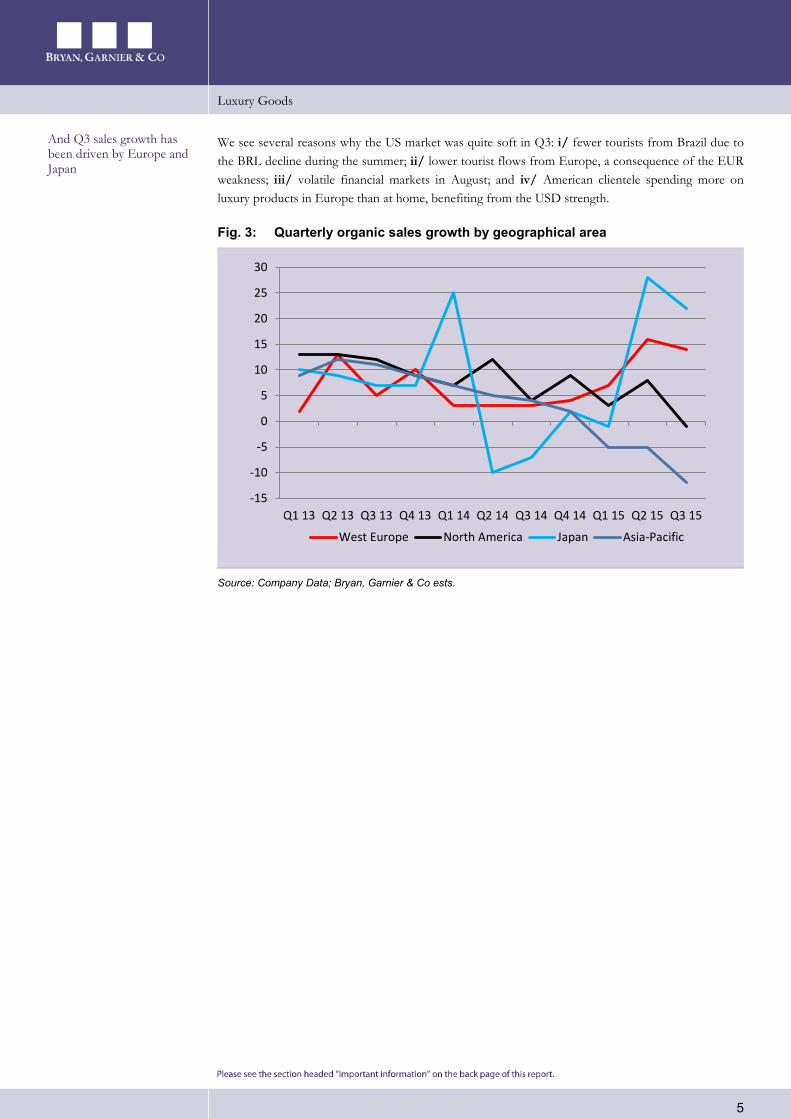
1.3. More volatile US market in Q3 One of the clear trends that we saw in Q3 is the much more volatile luxury market in North America (+0%) after a strong Q2 (+8%) as shown in the table on the following page. Furthermore, further deterioration in Asia-Pacific (-12% in Q3 following -5% in Q2), and particularly in Greater China (both Hong Kong and Macau underperforming Mainland China), has been unsurprisingly noticed. On the other hand, and this is the continuation of the older trend, Europe and Japan have both achieved strong performances in Q3 (respectively +14% and +22% on average) that have been fuelled by tourist flows from China to Japan and from the US and more globally from Asia (including China) to Europe. Nevertheless, in both cases, local demand has also been quite well oriented, which is relatively new. Clearly, these encouraging tourist flows have been partly driven by currency fluctuations (EUR and JPY weaknesses versus the USD).
0
5
10
15
20
25
30
Q111
Q211
Q311
Q411
Q112
Q212
Q312
Q412
Q113
Q213
Q313
Q413
Q114
Q214
Q314
Q414
Q115
Q215
Q315
organic sales growth (%)
Since Q2 2011, luxury sales growth has slowed quarter after quarter
Q3 has been characterised by further deterioration in APAC and no growth in America…
Luxury Goods
5
We see several reasons why the US market was quite soft in Q3: i/ fewer tourists from Brazil due to the BRL decline during the summer; ii/ lower tourist flows from Europe, a consequence of the EUR weakness; iii/ volatile financial markets in August; and iv/ American clientele spending more on luxury products in Europe than at home, benefiting from the USD strength.
Fig. 3: Quarterly organic sales growth by geographical area
Source: Company Data; Bryan, Garnier & Co ests.
-15
-10
-5
0
5
10
15
20
25
30
Q1 13 Q2 13 Q3 13 Q4 13 Q1 14 Q2 14 Q3 14 Q4 14 Q1 15 Q2 15 Q3 15
West Europe North America Japan Asia-Pacific
And Q3 sales growth has been driven by Europe and Japan
Luxury Goods
6
2. Consequence of the terrorist attacks in Paris
The tragic terrorist attacks that happened in Paris on November 13th will have, in our view and without doubt, a negative impact on Q4 organic sales growth at least in Europe with clearly fewer tourists and also more cautious behaviour by local clientele (less traffic in department stores…).
Beyond the human consequences of these awful events, we highlight a few points.
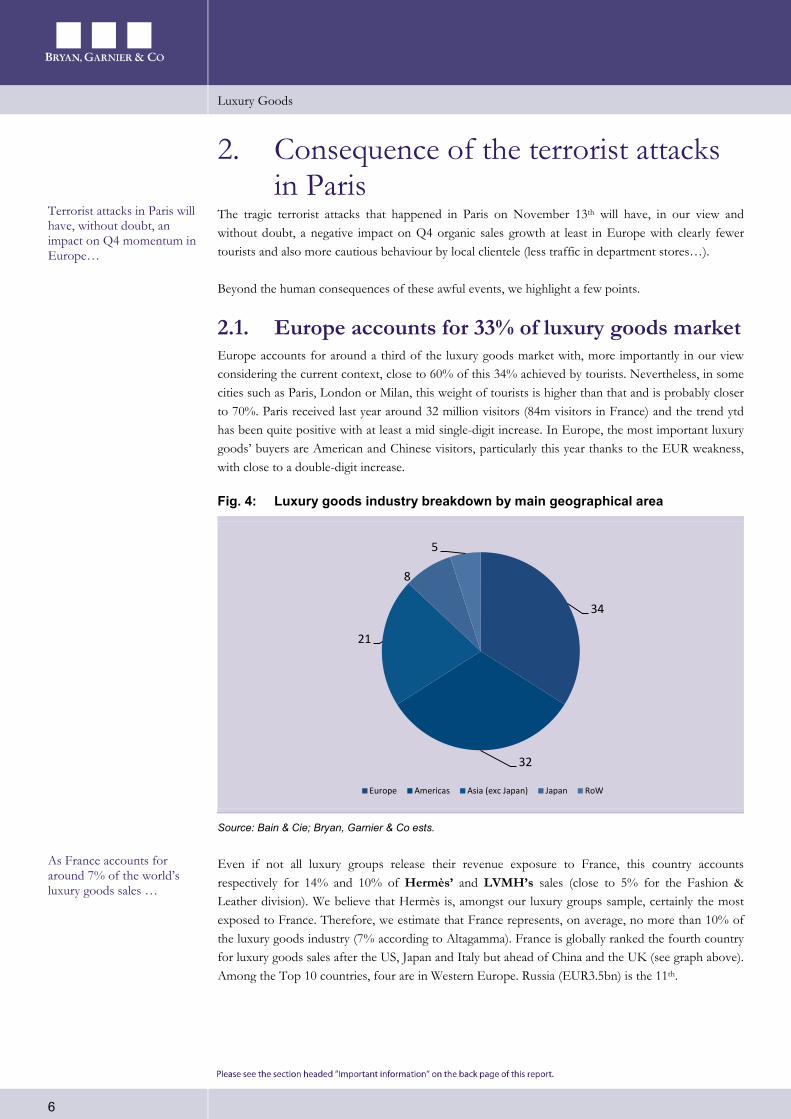
2.1. Europe accounts for 33% of luxury goods market Europe accounts for around a third of the luxury goods market with, more importantly in our view considering the current context, close to 60% of this 34% achieved by tourists. Nevertheless, in some cities such as Paris, London or Milan, this weight of tourists is higher than that and is probably closer to 70%. Paris received last year around 32 million visitors (84m visitors in France) and the trend ytd has been quite positive with at least a mid single-digit increase. In Europe, the most important luxury goods’ buyers are American and Chinese visitors, particularly this year thanks to the EUR weakness, with close to a double-digit increase.
Fig. 4: Luxury goods industry breakdown by main geographical area
Source: Bain & Cie; Bryan, Garnier & Co ests.
Even if not all luxury groups release their revenue exposure to France, this country accounts respectively for 14% and 10% of Hermès’ and LVMH’s sales (close to 5% for the Fashion & Leather division). We believe that Hermès is, amongst our luxury groups sample, certainly the most exposed to France. Therefore, we estimate that France represents, on average, no more than 10% of the luxury goods industry (7% according to Altagamma). France is globally ranked the fourth country for luxury goods sales after the US, Japan and Italy but ahead of China and the UK (see graph above). Among the Top 10 countries, four are in Western Europe. Russia (EUR3.5bn) is the 11th.
34
32
21
8
5
Europe Americas Asia (exc Japan) Japan RoW
Terrorist attacks in Paris will have, without doubt, an impact on Q4 momentum in Europe…
As France accounts for around 7% of the world’s luxury goods sales …

Luxury Goods
7
Fig. 5: Top countries’ luxury goods sales (2014)
Source: Altagamma; Bryan, Garnier & Co ests.
According to Altagamma, Paris (4% of luxury goods sales) is the second most important city worldwide after New York (10%) for luxury goods sales but slightly ahead of London (4%) and Hong Kong (3%). It is worth noting that among the Top 10 cities worldwide, four cities are in Western Europe (the fourth is Munich). Moscow is also in the Top 10.
Fig. 6: Top cities’ luxury goods sales (2014)
Source: Altagamma; Bryan, Garnier & Co ests.
65
18 16 15 15 1310 9
0
10
20
30
40
50
60
70
US Japan Italy France China UK Germany SouthKorea
Luxury sales (EURbn)
22
1110
87
65 5
0
5
10
15
20
25
New York Paris London HongKong
Tokyo Seoul Beijing Milano
Luxury sales (EURbn)
…And Paris alone for around 4% of the world’s luxury goods sales …
Luxury Goods
8
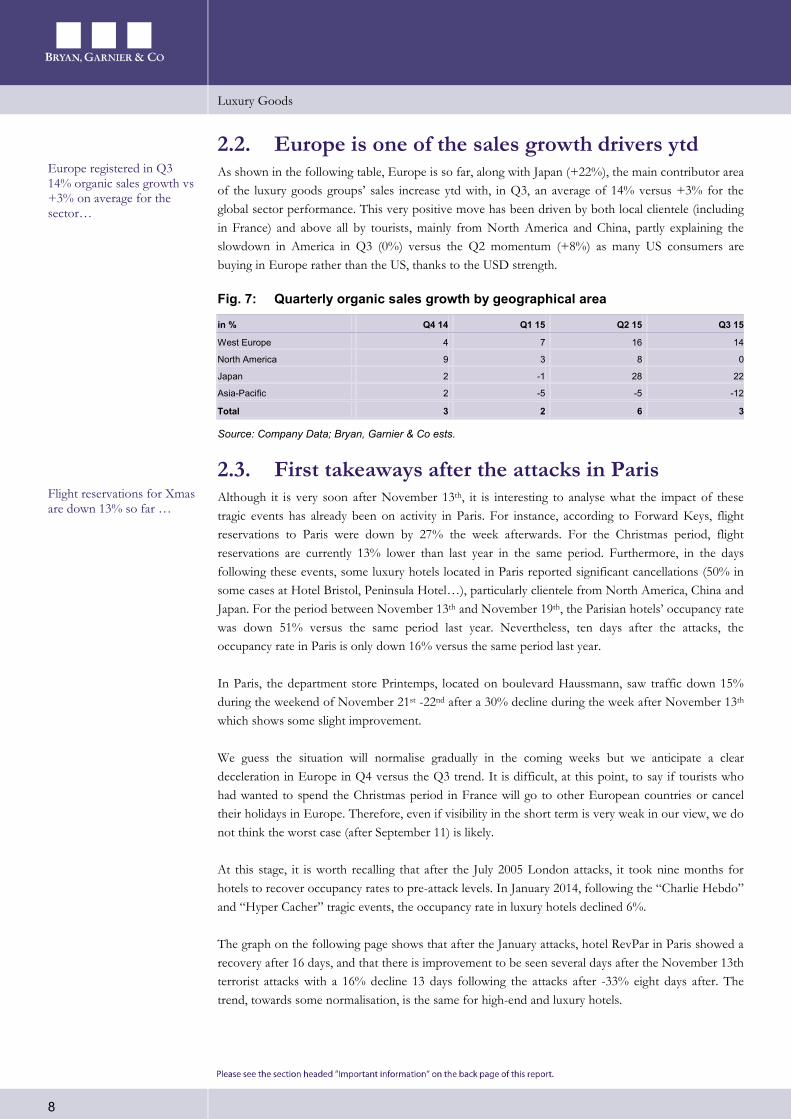
2.2. Europe is one of the sales growth drivers ytd As shown in the following table, Europe is so far, along with Japan (+22%), the main contributor area of the luxury goods groups’ sales increase ytd with, in Q3, an average of 14% versus +3% for the global sector performance. This very positive move has been driven by both local clientele (including in France) and above all by tourists, mainly from North America and China, partly explaining the slowdown in America in Q3 (0%) versus the Q2 momentum (+8%) as many US consumers are buying in Europe rather than the US, thanks to the USD strength.
Fig. 7: Quarterly organic sales growth by geographical area
in % Q4 14 Q1 15 Q2 15 Q3 15
West Europe 4 7 16 14
North America 9 3 8 0
Japan 2 -1 28 22
Asia-Pacific 2 -5 -5 -12
Total 3 2 6 3
Source: Company Data; Bryan, Garnier & Co ests.
2.3. First takeaways after the attacks in Paris Although it is very soon after November 13th, it is interesting to analyse what the impact of these tragic events has already been on activity in Paris. For instance, according to Forward Keys, flight reservations to Paris were down by 27% the week afterwards. For the Christmas period, flight reservations are currently 13% lower than last year in the same period. Furthermore, in the days following these events, some luxury hotels located in Paris reported significant cancellations (50% in some cases at Hotel Bristol, Peninsula Hotel…), particularly clientele from North America, China and Japan. For the period between November 13th and November 19th, the Parisian hotels’ occupancy rate was down 51% versus the same period last year. Nevertheless, ten days after the attacks, the occupancy rate in Paris is only down 16% versus the same period last year.
In Paris, the department store Printemps, located on boulevard Haussmann, saw traffic down 15% during the weekend of November 21st -22nd after a 30% decline during the week after November 13th
which shows some slight improvement.
We guess the situation will normalise gradually in the coming weeks but we anticipate a clear deceleration in Europe in Q4 versus the Q3 trend. It is difficult, at this point, to say if tourists who had wanted to spend the Christmas period in France will go to other European countries or cancel their holidays in Europe. Therefore, even if visibility in the short term is very weak in our view, we do not think the worst case (after September 11) is likely.
At this stage, it is worth recalling that after the July 2005 London attacks, it took nine months for hotels to recover occupancy rates to pre-attack levels. In January 2014, following the “Charlie Hebdo” and “Hyper Cacher” tragic events, the occupancy rate in luxury hotels declined 6%.
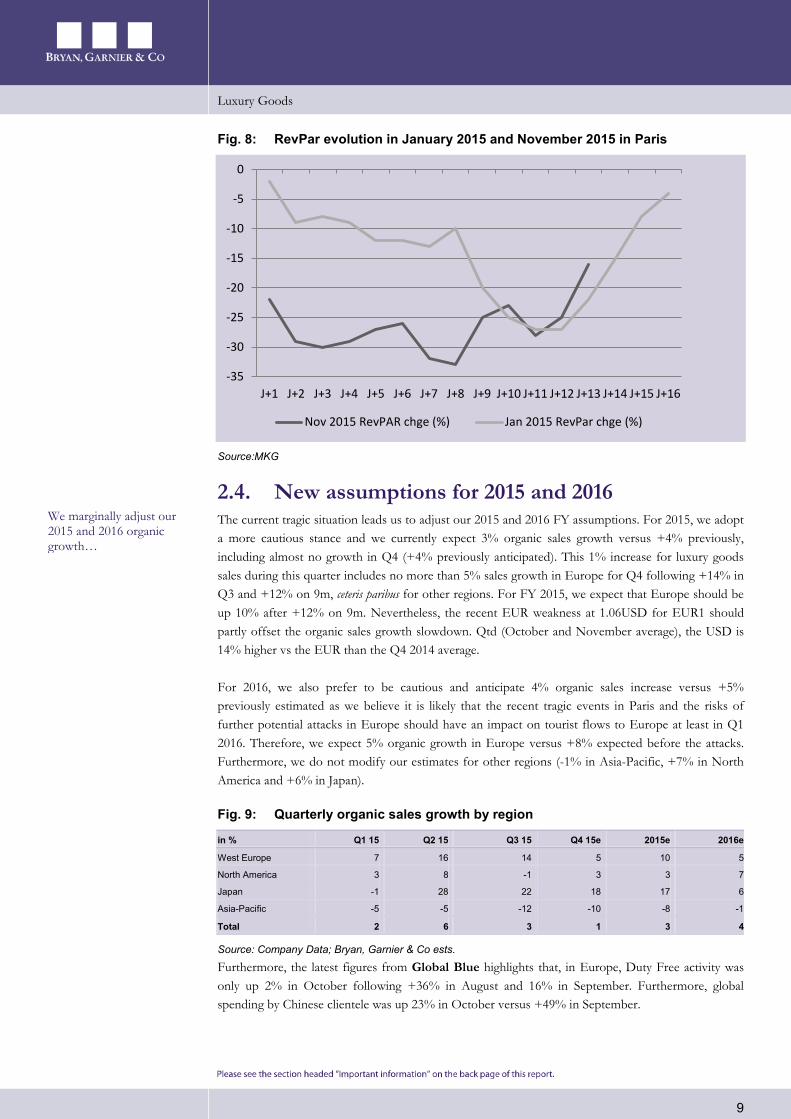
The graph on the following page shows that after the January attacks, hotel RevPar in Paris showed a recovery after 16 days, and that there is improvement to be seen several days after the November 13th terrorist attacks with a 16% decline 13 days following the attacks after -33% eight days after. The trend, towards some normalisation, is the same for high-end and luxury hotels.
Europe registered in Q3 14% organic sales growth vs +3% on average for the sector…
Flight reservations for Xmas are down 13% so far …
Luxury Goods
9
Fig. 8: RevPar evolution in January 2015 and November 2015 in Paris
Source:MKG
2.4. New assumptions for 2015 and 2016 The current tragic situation leads us to adjust our 2015 and 2016 FY assumptions. For 2015, we adopt a more cautious stance and we currently expect 3% organic sales growth versus +4% previously, including almost no growth in Q4 (+4% previously anticipated). This 1% increase for luxury goods sales during this quarter includes no more than 5% sales growth in Europe for Q4 following +14% in Q3 and +12% on 9m, ceteris paribus for other regions. For FY 2015, we expect that Europe should be up 10% after +12% on 9m. Nevertheless, the recent EUR weakness at 1.06USD for EUR1 should partly offset the organic sales growth slowdown. Qtd (October and November average), the USD is 14% higher vs the EUR than the Q4 2014 average.
For 2016, we also prefer to be cautious and anticipate 4% organic sales increase versus +5% previously estimated as we believe it is likely that the recent tragic events in Paris and the risks of further potential attacks in Europe should have an impact on tourist flows to Europe at least in Q1 2016. Therefore, we expect 5% organic growth in Europe versus +8% expected before the attacks. Furthermore, we do not modify our estimates for other regions (-1% in Asia-Pacific, +7% in North America and +6% in Japan).
Fig. 9: Quarterly organic sales growth by region
in % Q1 15 Q2 15 Q3 15 Q4 15e 2015e 2016e
West Europe 7 16 14 5 10 5
North America 3 8 -1 3 3 7
Japan -1 28 22 18 17 6
Asia-Pacific -5 -5 -12 -10 -8 -1
Total 2 6 3 1 3 4
Source: Company Data; Bryan, Garnier & Co ests.
Furthermore, the latest figures from Global Blue highlights that, in Europe, Duty Free activity was only up 2% in October following +36% in August and 16% in September. Furthermore, global spending by Chinese clientele was up 23% in October versus +49% in September.
-35
-30
-25
-20
-15
-10
-5
0
J+1 J+2 J+3 J+4 J+5 J+6 J+7 J+8 J+9 J+10 J+11 J+12 J+13 J+14 J+15 J+16
Nov 2015 RevPAR chge (%) Jan 2015 RevPar chge (%)
We marginally adjust our 2015 and 2016 organic growth…
Luxury Goods
10
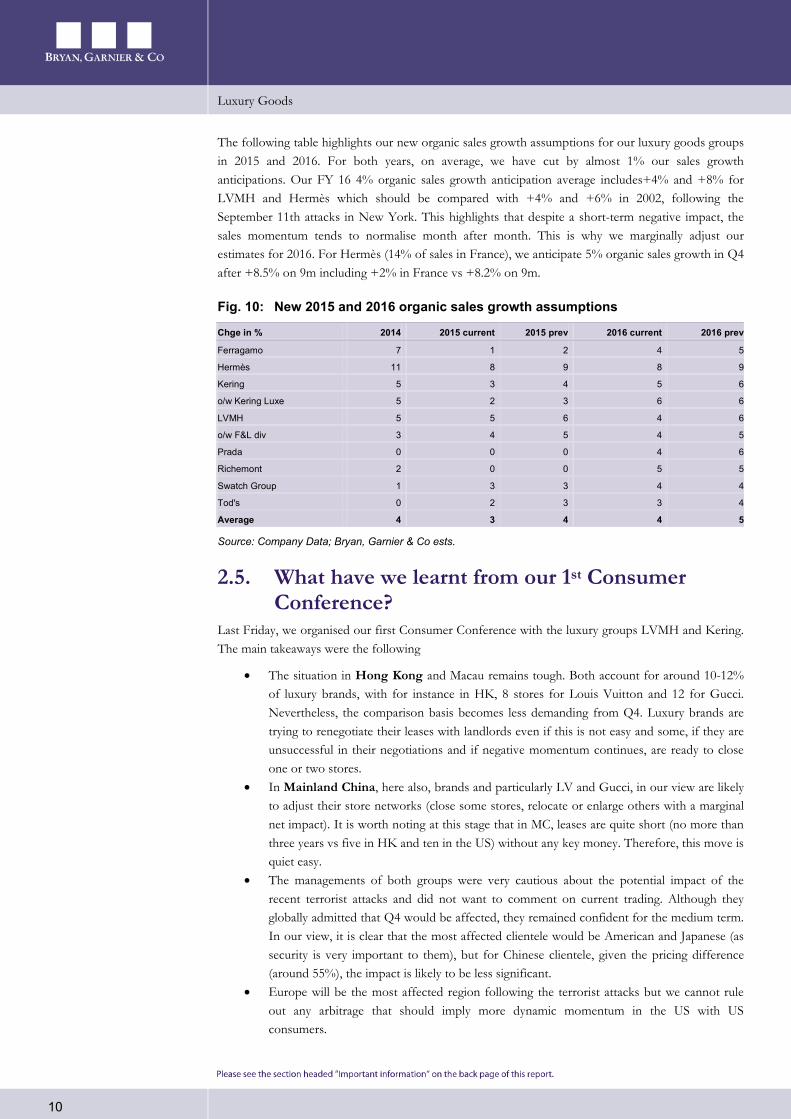
The following table highlights our new organic sales growth assumptions for our luxury goods groups in 2015 and 2016. For both years, on average, we have cut by almost 1% our sales growth anticipations. Our FY 16 4% organic sales growth anticipation average includes+4% and +8% for LVMH and Hermès which should be compared with +4% and +6% in 2002, following the September 11th attacks in New York. This highlights that despite a short-term negative impact, the sales momentum tends to normalise month after month. This is why we marginally adjust our estimates for 2016. For Hermès (14% of sales in France), we anticipate 5% organic sales growth in Q4 after +8.5% on 9m including +2% in France vs +8.2% on 9m.
Fig. 10: New 2015 and 2016 organic sales growth assumptions
Chge in % 2014 2015 current 2015 prev 2016 current 2016 prev
Ferragamo 7 1 2 4 5
Hermès 11 8 9 8 9
Kering 5 3 4 5 6
o/w Kering Luxe 5 2 3 6 6
LVMH 5 5 6 4 6
o/w F&L div 3 4 5 4 5
Prada 0 0 0 4 6
Richemont 2 0 0 5 5
Swatch Group 1 3 3 4 4
Tod's 0 2 3 3 4
Average 4 3 4 4 5
Source: Company Data; Bryan, Garnier & Co ests.
2.5. What have we learnt from our 1st Consumer Conference?
Last Friday, we organised our first Consumer Conference with the luxury groups LVMH and Kering. The main takeaways were the following
• The situation in Hong Kong and Macau remains tough. Both account for around 10-12% of luxury brands, with for instance in HK, 8 stores for Louis Vuitton and 12 for Gucci. Nevertheless, the comparison basis becomes less demanding from Q4. Luxury brands are trying to renegotiate their leases with landlords even if this is not easy and some, if they are unsuccessful in their negotiations and if negative momentum continues, are ready to close one or two stores.
• In Mainland China, here also, brands and particularly LV and Gucci, in our view are likely to adjust their store networks (close some stores, relocate or enlarge others with a marginal net impact). It is worth noting at this stage that in MC, leases are quite short (no more than three years vs five in HK and ten in the US) without any key money. Therefore, this move is quiet easy.
• The managements of both groups were very cautious about the potential impact of the recent terrorist attacks and did not want to comment on current trading. Although they globally admitted that Q4 would be affected, they remained confident for the medium term. In our view, it is clear that the most affected clientele would be American and Japanese (as security is very important to them), but for Chinese clientele, given the pricing difference (around 55%), the impact is likely to be less significant.
• Europe will be the most affected region following the terrorist attacks but we cannot rule out any arbitrage that should imply more dynamic momentum in the US with US consumers.

Luxury Goods
11
3. Valuations & recommendations Following our new assumptions on most of our luxury groups (excluding the Swiss groups), we have adjusted our FVs.
3.1. Stockmarket performances not so affected by November 13th!
On the last three months, luxury groups’ shares have been down 3% and Richemont, Hermès, and LVMH are in the top 3 best performers. Furthermore and unsurprisingly, since November 13th, shares have been down 1% on average (-5% vs Stoxx 600) with -2% for LVMH but no change for Hermès. This highlights that investors are more focused on long-term trends and react less to the short-term view which show that they are more “mature”.
Fig. 11: Stockmarket performance of luxury groups
Three months performance YTD
Source: Datastream
3.2. Peer comparisons On 2016 EV/EBIT, LVMH and Richemont are trading in line with the sector average while the two Italian groups (Ferragamo and Tod’s) are, as usual, trading at a premium vs the peers’ average, excluding Hermès.
Fig. 12: Peer comparison
x 2015e
EV/EBIT 2016e
EV/EBIT 2015 premium on
average (ii) 2016 premium on
average (ii)
Burberry 11.4 10.6 -11% -11%
Hermès Intl 22.7 20.4 - -
Kering 14.5 13.0 12% 10%
LVMH 13.0 11.7 1% 0%
Prada 10.4 10.7 -14% -10%
Richemont 12.5 11.8 -4% 0%
Salvatore Ferragamo 14.8 13.1 13% 9%
Swatch Group 11.2 10.2 -16% -14%
Tiffany 12.6 11.3 -3% -5%
Tod’s Group 14.2 13.0 11% 11%
(i) Luxury average 14.0 12.7 - -
(ii) Luxury average (excl. Hermés) 12.0 11.9 - -
Source: Company Data; Bryan, Garnier & Co ests
Absolute performances4
COACHRICHEMONT NLVMHHERMES INTL.KERINGCHRISTIAN DIORMULBERRY GROUPTHE SWATCH GROUP 'B'TIFFANY & COTOD'SSALVATORE FERRAGAMOBURBERRY GROUPPRADABOSS (HUGO) (XET)
-25.0 -20.0 -15.0 -10.0 -5.0 0.0 5.0 10.0
Absolute performances1
CHRISTIAN DIORLVMHHERMES INTL.MULBERRY GROUPSALVATORE FERRAGAMOTOD'SKERINGRICHEMONT NCOACHTHE SWATCH GROUP 'B'BOSS (HUGO) (XET)BURBERRY GROUPTIFFANY & COPRADA
-50.0 -40.0 -30.0 -20.0 -10.0 0.0 10.0 20.0 30.0

Luxury Goods
12
3.3. Changes to Fair Values and recommendations As shown in the below table, we leave unchanged our recommendations on our luxury groups coverage. We have revised down by around 2% and 3% our Fair Values on Hermès, LVMH and Kering. On the other hand, we leave unchanged our FV for the two Swiss groups. For Richemont, we had already adjusted our assumptions and we are expecting sales to be down 3% in H2. On Swatch, we do not change anything as France is a marginal country.
We also leave unchanged our Buy recommendation on LVMH with a 12% upside on our new FV, on Richemont (16% upside) and also on Hermès despite the low upside but in order to take into account the resilient status of the share as highlighted by the relatively good share price performance since November 13th.
Fig. 13: Change to Fair Values
EUR Previous recommendation
New recommendation
Previous FV New FV
Christian Dior Buy Buy 172 170
Hermès Intl Buy Buy 350 344
Hugo Boss Neutral Neutral 110 110
LVMH Buy Buy 182 177
Kering Neutral Neutral 177 173
Prada (HKD) Neutral Neutral 52 52
Richemont (CHF) Buy Buy 90 90
Salvatore Ferragamo Buy Buy 26.5 26
Swatch Group (CHF) Neutral Neutral 430 430
Tod's Neutral Neutral 85 82
Source: Company Data; Bryan, Garnier & Co ests.

Luxury Goods
13
Christian Dior
Ratings Date Ratings Price 12/12/12 BUY EUR129.3
10/10/12 NEUTRAL EUR107.45
28/11/11 BUY EUR89.18
Target Price Date Target price 25/09/15 EUR172
24/03/15 EUR178
13/01/15 EUR156
10/01/14 EUR151
16/01/13 EUR145
12/12/12 EUR142
10/10/12 EUR127
Hermès Intl.
Date Ratings Price 28/11/14 BUY EUR262.75
28/11/11 NEUTRAL EUR150
Date Target price 24/04/15 EUR350
24/03/15 EUR343
13/02/15 EUR315
28/11/14 EUR305
10/01/14 EUR225
19/07/13 EUR205
22/03/13 EUR200
16/01/13 EUR194
12/12/12 EUR186
Kering
Date Ratings Price 18/02/15 NEUTRAL EUR185
15/01/14 BUY EUR146.15
28/11/11 NEUTRAL EUR101.35
Date Target price 25/09/15 EUR177
28/07/15 EUR183
07/07/15 EUR180
07/05/15 EUR188
22/04/15 EUR195
07/04/15 EUR205
24/03/15 EUR210
18/02/15 EUR185
13/01/15 EUR176
08/10/14 EUR172
10/01/14 EUR178
26/07/13 EUR174
18/02/13 EUR166
13/02/13 EUR152
16/01/13 EUR150
LVMH
Ratings Date Ratings Price 04/02/15 BUY EUR144.5
25/07/14 NEUTRAL EUR139.8
12/12/12 BUY EUR140
10/10/12 NEUTRAL EUR122.1
10/10/11 BUY EUR107.3
Target Price Date Target price 25/09/15 EUR182
29/07/15 EUR186
24/03/15 EUR180
04/02/15 EUR158
13/01/15 EUR145
18/12/14 EUR140
08/10/14 EUR150
25/07/14 EUR156
10/01/14 EUR167
17/10/13 EUR162
03/10/13 EUR165
16/01/13 EUR160
12/12/12 EUR155
101.7
111.7
121.7
131.7
141.7
151.7
161.7
171.7
181.7
191.7
30/05/14 30/08/14 30/11/14 28/02/15 31/05/15 31/08/15 30/11/15
CHRISTIAN DIOR Fair Value Achat Neutre Vente
250.0
270.0
290.0
310.0
330.0
350.0
17/02/15 17/05/15 17/08/15
HERMES INTL. Fair Value Achat Neutre Vente
120.7
130.7
140.7
150.7
160.7
170.7
180.7
190.7
200.7
210.7
17/02/15 17/05/15 17/08/15
KERING Fair Value Achat Neutre Vente
121.6
131.6
141.6
151.6
161.6
171.6
181.6
191.6
17/02/15 17/05/15 17/08/15
LVMH Fair Value Achat Neutre Vente

Luxury Goods
14
Salvatore Ferragamo
Ratings Date Ratings Price 25/09/15 BUY EUR23.34
24/03/15 NEUTRAL EUR29.6
29/08/14 BUY EUR20.62
30/08/12 NEUTRAL EUR17.07
06/06/12 BUY EUR15.36
23/03/12 NEUTRAL EUR16.22
Target Price Date Target price 13/11/15 EUR26.5
23/10/15 EUR27
25/09/15 EUR29
24/03/15 EUR30
13/03/15 EUR26.5
30/01/15 EUR25.5
13/01/15 EUR23.6
14/11/14 EUR23.4
29/08/14 EUR23.7
21/01/14 EUR23
10/01/14 EUR23.5
14/05/13 EUR21.8
22/03/13 EUR20
16/01/13 EUR18.6
12/12/12 EUR17.7
Tod's Group
Ratings Date Ratings Price 23/01/15 NEUTRAL EUR80.9
23/05/12 SELL EUR80.7
13/05/11 NEUTRAL EUR91.85
27/07/07 BUY EUR57.94
Target Price Date Target price 25/09/15 EUR85
07/08/15 EUR88
24/03/15 EUR83
23/01/15 EUR78
13/01/15 EUR74
13/11/14 EUR72
08/10/14 EUR88
08/08/14 EUR92
12/03/14 EUR100
30/01/14 EUR106
24/01/14 EUR111
10/01/14 EUR114
08/08/13 EUR107
02/08/13 EUR104
15/05/13 EUR85
16/01/13 EUR80
21.0
23.0
25.0
27.0
29.0
31.0
17/02/15 17/05/15 17/08/15
SALVATORE FERRAGAMO Fair Value Achat Neutre Vente
75.0
80.0
85.0
90.0
95.0
100.0
17/02/15 17/05/15 17/08/15
TOD'S Fair Value Achat Neutre Vente

Luxury Goods
15
Bryan Garnier stock rating system For the purposes of this Report, the Bryan Garnier stock rating system is defined as follows: Stock rating
BUY Positive opinion for a stock where we expect a favourable performance in absolute terms over a period of 6 months from the publication of a recommendation. This opinion is based not only on the FV (the potential upside based on valuation), but also takes into account a number of elements including a SWOT analysis, positive momentum, technical aspects and the sector backdrop. Every subsequent published update on the stock will feature an introduction outlining the key reasons behind the opinion.
NEUTRAL Opinion recommending not to trade in a stock short-term, neither as a BUYER or a SELLER, due to a specific set of factors. This view is intended to be temporary. It may reflect different situations, but in particular those where a fair value shows no significant potential or where an upcoming binary event constitutes a high-risk that is difficult to quantify. Every subsequent published update on the stock will feature an introduction outlining the key reasons behind the opinion.
SELL Negative opinion for a stock where we expect an unfavourable performance in absolute terms over a period of 6 months from the publication of a recommendation. This opinion is based not only on the FV (the potential downside based on valuation), but also takes into account a number of elements including a SWOT analysis, positive momentum, technical aspects and the sector backdrop. Every subsequent published update on the stock will feature an introduction outlining the key reasons behind the opinion.
Distribution of stock ratings
BUY ratings 57.4% NEUTRAL ratings 33.3% SELL ratings 9.3%
Research Disclosure Legend 1 Bryan Garnier shareholding
in Issuer Bryan Garnier & Co Limited or another company in its group (together, the “Bryan Garnier Group”) has a shareholding that, individually or combined, exceeds 5% of the paid up and issued share capital of a company that is the subject of this Report (the “Issuer”).
No
2 Issuer shareholding in Bryan Garnier
The Issuer has a shareholding that exceeds 5% of the paid up and issued share capital of one or more members of the Bryan Garnier Group.
No
3 Financial interest A member of the Bryan Garnier Group holds one or more financial interests in relation to the Issuer which are significant in relation to this report
No
4 Market maker or liquidity provider
A member of the Bryan Garnier Group is a market maker or liquidity provider in the securities of the Issuer or in any related derivatives.
No
5 Lead/co-lead manager In the past twelve months, a member of the Bryan Garnier Group has been lead manager or co-lead manager of one or more publicly disclosed offers of securities of the Issuer or in any related derivatives.
No
6 Investment banking agreement
A member of the Bryan Garnier Group is or has in the past twelve months been party to an agreement with the Issuer relating to the provision of investment banking services, or has in that period received payment or been promised payment in respect of such services.
No
7 Research agreement A member of the Bryan Garnier Group is party to an agreement with the Issuer relating to the production of this Report.
No
8 Analyst receipt or purchase of shares in Issuer
The investment analyst or another person involved in the preparation of this Report has received or purchased shares of the Issuer prior to a public offering of those shares.
No
9 Remuneration of analyst The remuneration of the investment analyst or other persons involved in the preparation of this Report is tied to investment banking transactions performed by the Bryan Garnier Group.
No
10 Corporate finance client In the past twelve months a member of the Bryan Garnier Group has been remunerated for providing corporate finance services to the issuer or may expect to receive or intend to seek remuneration for corporate finance services from the Issuer in the next six months.
No
11 Analyst has short position The investment analyst or another person involved in the preparation of this Report has a short position in the securities or derivatives of the Issuer.
No
12 Analyst has long position The investment analyst or another person involved in the preparation of this Report has a long position in the securities or derivatives of the Issuer.
No
13 Bryan Garnier executive is an officer
A partner, director, officer, employee or agent of the Bryan Garnier Group, or a member of such person’s household, is a partner, director, officer or an employee of, or adviser to, the Issuer or one of its parents or subsidiaries. The name of such person or persons is disclosed above.
No
14 Analyst disclosure The analyst hereby certifies that neither the views expressed in the research, nor the timing of the publication of the research has been influenced by any knowledge of clients positions and that the views expressed in the report accurately reflect his/her personal views about the investment and issuer to which the report relates and that no part of his/her remuneration was, is or will be, directly or indirectly, related to the specific recommendations or views expressed in the report.
Yes
15 Other disclosures Other specific disclosures: Report sent to Issuer to verify factual accuracy (with the recommendation/rating, price target/spread and summary of conclusions removed).
No
A copy of the Bryan Garnier & Co Limited conflicts policy in relation to the production of research is available at www.bryangarnier.com

London Beaufort House 15 St. Botolph Street London EC3A 7BB Tel: +44 (0) 207 332 2500 Fax: +44 (0) 207 332 2559 Authorised and regulated by the Financial Conduct Authority (FCA)
Paris 26 Avenue des Champs Elysées 75008 Paris Tel: +33 (0) 1 56 68 75 00 Fax: +33 (0) 1 56 68 75 01 Regulated by the Financial Conduct Authority (FCA) and the Autorité de Contrôle prudential et de resolution (ACPR)
New York 750 Lexington Avenue New York, NY 10022 Tel: +1 (0) 212 337 7000 Fax: +1 (0) 212 337 7002 FINRA and SIPC member
Geneva rue de Grenus 7 CP 2113 Genève 1, CH 1211 Tel +4122 731 3263 Fax+4122731 3243 Regulated by the FINMA
New Delhi The Imperial Hotel Janpath New Delhi 110 001 Tel +91 11 4132 6062 +91 98 1111 5119 Fax +91 11 2621 9062
Important information This document is classified under the FCA Handbook as being investment research (independent research). Bryan Garnier & Co Limited has in place the measures and arrangements required for investment research as set out in the FCA’s Conduct of Business Sourcebook. This report is prepared by Bryan Garnier & Co Limited, registered in England Number 03034095 and its MIFID branch registered in France Number 452 605 512. Bryan Garnier & Co Limited is authorised and regulated by the Financial Conduct Authority (Firm Reference Number 178733) and is a member of the London Stock Exchange. Registered address: Beaufort House 15 St. Botolph Street, London EC3A 7BB, United Kingdom This Report is provided for information purposes only and does not constitute an offer, or a solicitation of an offer, to buy or sell relevant securities, including securities mentioned in this Report and options, warrants or rights to or interests in any such securities. This Report is for general circulation to clients of the Firm and as such is not, and should not be construed as, investment advice or a personal recommendation. No account is taken of the investment objectives, financial situation or particular needs of any person. The information and opinions contained in this Report have been compiled from and are based upon generally available information which the Firm believes to be reliable but the accuracy of which cannot be guaranteed. All components and estimates given are statements of the Firm, or an associated company’s, opinion only and no express representation or warranty is given or should be implied from such statements. All opinions expressed in this Report are subject to change without notice. To the fullest extent permitted by law neither the Firm nor any associated company accept any liability whatsoever for any direct or consequential loss arising from the use of this Report. Information may be available to the Firm and/or associated companies which are not reflected in this Report. The Firm or an associated company may have a consulting relationship with a company which is the subject of this Report. This Report may not be reproduced, distributed or published by you for any purpose except with the Firm’s prior written permission. The Firm reserves all rights in relation to this Report. Past performance information contained in this Report is not an indication of future performance. The information in this report has not been audited or verified by an independent party and should not be seen as an indication of returns which might be received by investors. Similarly, where projections, forecasts, targeted or illustrative returns or related statements or expressions of opinion are given (“Forward Looking Information”) they should not be regarded as a guarantee, prediction or definitive statement of fact or probability. Actual events and circumstances are difficult or impossible to predict and will differ from assumptions. A number of factors, in addition to the risk factors stated in this Report, could cause actual results to differ materially from those in any Forward Looking Information. Disclosures specific to clients in the United Kingdom This Report has not been approved by Bryan Garnier & Co Limited for the purposes of section 21 of the Financial Services and Markets Act 2000 because it is being distributed in the United Kingdom only to persons who have been classified by Bryan Garnier & Co Limited as professional clients or eligible counterparties. Any recipient who is not such a person should return the Report to Bryan Garnier & Co Limited immediately and should not rely on it for any purposes whatsoever. Notice to US investors This research report (the “Report”) was prepared by Bryan Garnier & Co Limited for information purposes only. The Report is intended for distribution in the United States to “Major US Institutional Investors” as defined in SEC Rule 15a-6 and may not be furnished to any other person in the United States. Each Major US Institutional Investor which receives a copy of this Report by its acceptance hereof represents and agrees that it shall not distribute or provide this Report to any other person. Any US person that desires to effect transactions in any security discussed in this Report should call or write to our US affiliated broker, Bryan Garnier Securities, LLC. 750 Lexington Avenue, New York NY 10022. Telephone: 1-212-337-7000. This Report is based on information obtained from sources that Bryan Garnier & Co Limited believes to be reliable and, to the best of its knowledge, contains no misleading, untrue or false statements but which it has not independently verified. Neither Bryan Garnier & Co Limited and/or Bryan Garnier Securities LLC make no guarantee, representation or warranty as to its accuracy or completeness. Expressions of opinion herein are subject to change without notice. This Report is not an offer to buy or sell any security. Bryan Garnier Securities, LLC and/or its affiliate, Bryan Garnier & Co Limited may own more than 1% of the securities of the company(ies) which is (are) the subject matter of this Report, may act as a market maker in the securities of the company(ies) discussed herein, may manage or co-manage a public offering of securities for the subject company(ies), may sell such securities to or buy them from customers on a principal basis and may also perform or seek to perform investment banking services for the company(ies). Bryan Garnier Securities, LLC and/or Bryan Garnier & Co Limited are unaware of any actual, material conflict of interest of the research analyst who prepared this Report and are also not aware that the research analyst knew or had reason to know of any actual, material conflict of interest at the time this Report is distributed or made available..