Embed Size (px)
Citation preview
University of CaliforniaAlthough the University Maintains Extensive Financial Records, It Should Provide Additional Information to Improve Public Understanding of Its Operations
July 2011 Report 2010‑105
IndependentTRANSPARENT Accountability
NONPARTISAN

The first five copies of each California State Auditor report are free. Additional copies are $3 each, payable by check or money order. You can obtain reports by contacting the Bureau of State Audits at the following address:
California State Auditor Bureau of State Audits
555 Capitol Mall, Suite 300 Sacramento, California 95814
916.445.0255 or TTY 916.445.0033
OR
This report is also available on the World Wide Web http://www.bsa.ca.gov
The California State Auditor is pleased to announce the availability of an on‑line subscription service. For information on how to subscribe, please contact the Information Technology Unit at 916.445.0255, ext. 456,
or visit our Web site at www.bsa.ca.gov.
Alternate format reports available upon request.
Permission is granted to reproduce reports.
For questions regarding the contents of this report, please contact Margarita Fernández, Chief of Public Affairs, at 916.445.0255.

CALIFORNIA STATE AUDITORB u r e a u o f S t a t e A u d i t sDoug Cordiner
Chief Deputy
Elaine M. HowleState Auditor
5 5 5 Ca p i t o l M a l l , S u i t e 3 0 0 S a c r a m e n t o, C A 9 5 8 1 4 9 1 6 . 4 4 5 . 0 2 5 5 9 1 6 . 3 2 7 . 0 0 1 9 f a x w w w. b s a . c a . g ov
July 28, 2011 2010-105
The Governor of California President pro Tempore of the Senate Speaker of the Assembly State Capitol Sacramento, California 95814
Dear Governor and Legislative Leaders:
As requested by the Joint Legislative Audit Committee, the California State Auditor presents this audit report concerning the University of California (university), focusing on public funding, student fees, and auxiliary enterprises. The report concludes that public revenues increased from $9.3 billion in fiscal year 2005–06 to $11.3 billion in fiscal year 2009–10. Revenue from tuition and fees grew the most of any single revenue category due to increased rates and increases in enrollment. This revenue increase along with new revenues from the federal American Recovery and Reinvestment Act of 2009 helped to partially offset the decline in state funding in fiscal years 2008–09 and 2009–10. We also concluded that public expenses, excluding certain retirement expenses, increased from $8.2 billion in fiscal year 2005–06 to $9.4 billion in fiscal year 2009–10. The retirement expenses increased by $3 billion because of a change in accounting rules and updated actuarial valuations.
In addition, the university budgeted widely varying amounts to its 10 campuses. For fiscal year 2009–10, the per-student budget amount ranged from $12,309 for the Santa Barbara campus to $55,186 for the San Francisco campus. Although the university identified four factors that it believes contributed to the differing budget amounts, it did not quantify their effects. The university can also improve the transparency of its financial operations. Although the university publishes annually a report of the campuses’ financial schedules, it could provide other information including beginning and ending balances for individual funds and could publish consistent information for its auxiliary enterprises. We further reported that the Office of the President needs to more precisely track about $1 billion of expenses annually that it currently tracks in a single accounting code—Miscellaneous Services—and that a recent change in university policy allows campuses to subsidize auxiliary enterprises with funding from other sources, despite the intent that they be self-supporting. Finally, we discovered two instances when the university designated $23 million in student funding to pay for capital projects on the Los Angeles campus that were not authorized by the student referendum establishing the fee.
Respectfully submitted,
ELAINE M. HOWLE, CPA State Auditor

Blank page inserted for reproduction purposes only.

University of CaliforniaAlthough the University Maintains Extensive Financial Records, It Should Provide Additional Information to Improve Public Understanding of Its Operations
July 2011 Report 2010‑105

Blank page inserted for reproduction purposes only.

viiCalifornia State Auditor Report 2010-105
July 2011
Contents
Summary 1
Introduction 7
Chapter 1UniversityRevenuesandExpensesHaveUndergoneaFewSignificantChangesOverthePastFiveYears 15
Chapter 2TheUniversityShouldCompleteItsReexaminationofCampusBaseBudgetsandCouldImprovetheTransparencyofItsBudgetProcess 29
Recommendations 43
Chapter 3AlthoughtheUniversityHasNumerousProcessestoProvideDetailedAccountabilityforVariousTypesofFunding,ItCould ImprovetheTransparencyofItsFinancialOperations 45
Recommendations 63
Appendix AUniversityFundingSourcesandMethodsforBudgetingFundingtoCampuses 65
Appendix BPer‑StudentSpendingCalculations 71
Response to the AuditUniversityofCalifornia 79
CaliforniaStateAuditor’sCommentsontheResponseFromtheUniversityofCalifornia 87

California State Auditor Report 2010-105
July 2011
viii
Blank page inserted for reproduction purposes only.
1California State Auditor Report 2010-105
July 2011
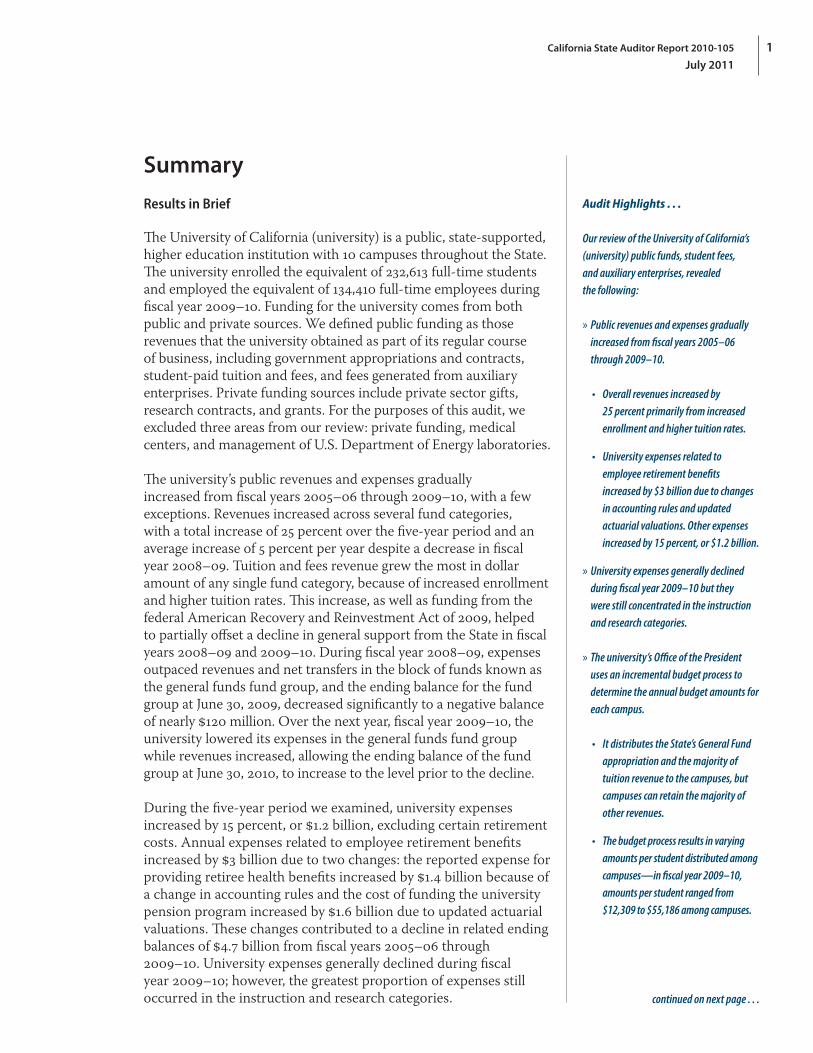
Audit Highlights . . .
Our review of the University of California’s (university) public funds, student fees, and auxiliary enterprises, revealed the following:
» Public revenues and expenses gradually increased from fiscal years 2005–06 through 2009–10.
• Overall revenues increased by 25 percent primarily from increased enrollment and higher tuition rates.
• University expenses related to employee retirement benefits increased by $3 billion due to changes in accounting rules and updated actuarial valuations. Other expenses increased by 15 percent, or $1.2 billion.
» University expenses generally declined during fiscal year 2009–10 but they were still concentrated in the instruction and research categories.
» The university’s Office of the President uses an incremental budget process to determine the annual budget amounts for each campus.
• It distributes the State’s General Fund appropriation and the majority of tuition revenue to the campuses, but campuses can retain the majority of other revenues.
• The budget process results in varying amounts per student distributed among campuses—in fiscal year 2009–10, amounts per student ranged from $12,309 to $55,186 among campuses.
continued on next page . . .
Summary
Results in Brief
The University of California (university) is a public, state‑supported, higher education institution with 10 campuses throughout the State. The university enrolled the equivalent of 232,613 full‑time students and employed the equivalent of 134,410 full‑time employees during fiscal year 2009–10. Funding for the university comes from both public and private sources. We defined public funding as those revenues that the university obtained as part of its regular course of business, including government appropriations and contracts, student‑paid tuition and fees, and fees generated from auxiliary enterprises. Private funding sources include private sector gifts, research contracts, and grants. For the purposes of this audit, we excluded three areas from our review: private funding, medical centers, and management of U.S. Department of Energy laboratories.
The university’s public revenues and expenses gradually increased from fiscal years 2005–06 through 2009–10, with a few exceptions. Revenues increased across several fund categories, with a total increase of 25 percent over the five‑year period and an average increase of 5 percent per year despite a decrease in fiscal year 2008–09. Tuition and fees revenue grew the most in dollar amount of any single fund category, because of increased enrollment and higher tuition rates. This increase, as well as funding from the federal American Recovery and Reinvestment Act of 2009, helped to partially offset a decline in general support from the State in fiscal years 2008–09 and 2009–10. During fiscal year 2008–09, expenses outpaced revenues and net transfers in the block of funds known as the general funds fund group, and the ending balance for the fund group at June 30, 2009, decreased significantly to a negative balance of nearly $120 million. Over the next year, fiscal year 2009–10, the university lowered its expenses in the general funds fund group while revenues increased, allowing the ending balance of the fund group at June 30, 2010, to increase to the level prior to the decline.
During the five‑year period we examined, university expenses increased by 15 percent, or $1.2 billion, excluding certain retirement costs. Annual expenses related to employee retirement benefits increased by $3 billion due to two changes: the reported expense for providing retiree health benefits increased by $1.4 billion because of a change in accounting rules and the cost of funding the university pension program increased by $1.6 billion due to updated actuarial valuations. These changes contributed to a decline in related ending balances of $4.7 billion from fiscal years 2005–06 through 2009–10. University expenses generally declined during fiscal year 2009–10; however, the greatest proportion of expenses still occurred in the instruction and research categories.
California State Auditor Report 2010-105
July 2011
2
The individual campuses receive budget amounts from the University of California Office of the President (Office of the President) but are largely autonomous in their spending. The Office of the President uses an incremental budget process to determine the annual budget amounts for each campus. This process consists of a permanent base amount, which varies by campus, and incremental adjustments made annually to the base amount. Using this incremental process, the Office of the President distributes the State’s General Fund appropriation and the majority of tuition revenue to the campuses. Together, these revenues accounted for $4.4 billion in fiscal year 2009–10. The university allows campuses to retain other types of revenues, such as student services fees, nonresident tuition, and auxiliary enterprises. Although the university generally delegates responsibility to campuses for ensuring that they spend their funding appropriately, the Office of the President provides oversight to verify that financial aid and outreach programs to potential students are appropriately funded.
The university’s incremental budget process results in a distribution of the general funds and tuition budget that varies widely per student among the campuses. For fiscal year 2009–10, the amount per student ranged from $12,309 at the Santa Barbara campus to $55,186 at the San Francisco campus. Although we understand that differences in funding among the campuses can exist because the Office of the President does not distribute all funding to campuses on a per‑student basis (for example, it provides funding to certain campuses for specific research or public service programs), we would expect that the university would be able to identify the reasons for any differences and be able to quantify them. The Office of the President provided four examples of factors that contributed to differences in per‑student amounts among the campuses: specific research and public service programs that are budgeted separately from instruction, the size of a campus’s health sciences program, historical variations in the amount of support provided for graduate students, and historical variations in the level of state support. However, the university has not quantified any of these factors.
While we found no evidence that the Office of the President considered the racial or ethnic makeup of the student populations at the campuses as part of its budget process, we noted that the four campuses with a higher than average percentage of students from underrepresented racial or ethnic groups all received less funding than they would have received if each campus received the same amount per student. This disparity highlights the importance of being able to quantify and explain the differences in the level of per‑student funding at the campuses.
• The four campuses with a higher‑than‑average percentage of students from underrepresented racial or ethnic groups together received less funding than they would have if campuses received the same amount per student.
» The Office of the President does not make the methodology it uses to determine the amount of funds provided to each campus readily available.
» The Office of the President currently tracks about $1 billion annually in a Miscellaneous Services accounting code.
» The Los Angeles campus, the Office of the President, and the Regents of the University of California designated the use of $23 million in revenue for unauthorized purposes.

3California State Auditor Report 2010-105
July 2011
Although the Office of the President has taken steps to make its budget more transparent in recent years, it could do more to improve the transparency of the processes it uses to determine annual budget amounts for the campuses. The Office of the President does not make the methodology it uses to determine the amount of funds provided to each campus readily available to university stakeholders. This reduces stakeholders’ ability to understand how funding is budgeted to campuses and to hold the university accountable for its method of budgeting funds.
The university maintains detailed records of revenues, expenses, and beginning and ending balances of funds for its operations. Its corporate financial system contains revenue and expenditure records for more than 32,000 funds with revenues from public sources. These records provide sufficient information to determine the types of revenues and expenses for each fund, and to report on the impact transactions within a fund have on their respective ending balances from year to year. The university’s financial records also identify whether funds have restrictions placed on them. These records show that each year from 36 percent to 38 percent of public revenues were restricted for specific uses by sources such as federal contracts and grant agreements during fiscal years 2005–06 through 2009–10. The university can use the rest of its public revenues at its discretion. The university also maintains records of overhead cost reimbursement for contracts and grants. By examining these records, we were able to determine the amount of funds the university received and how most of the funds were spent.
Further, we found that the university pledged tuition revenue to obtain debt financing at lower interest rates. However, the Office of the President took steps to ensure that external debt financing proposals identified specific repayment sources that it deemed were appropriate for this purpose. We examined financial records to determine whether the university had made any debt payments for principal or interest out of tuition revenue and identified no such payments. We also identified another university system, the University of Texas, that pledges tuition revenue in this way.
The university publishes annually a report of campus financial schedules that provides useful information about its operations. However, access to additional information, such as beginning and ending balances and information related to specific funds, would be beneficial. Fund‑specific information, including balances, would allow users to review the financial performance of specific organizational units from year to year, as well as identify funds with poor financial performance or negative balances. Without fund information, stakeholders do not have complete information to help them hold the Office of the President accountable for the

California State Auditor Report 2010-105
July 2011
4
university’s financial performance. In the supplemental information to this report located on our Web site (www.bsa.ca.gov/reports/2010‑105/), we present data from the financial records maintained by the Office of the President.
In our review of university accounting records, we found that the Office of the President uses a single accounting code, Miscellaneous Services, to account for more than $6 billion for the five years we reviewed, or about 25 percent, of the annual public noncompensation expenses for the university. This lack of specificity prohibits meaningful analysis of a significant portion of the university’s expenses at a systemwide level, and limits the ability of stakeholders to understand how the university uses these funds.
We examined the university’s policies regarding auxiliary enterprises—revenue‑generating programs or activities that are operated like businesses, such as housing, dining, and parking. The Office of the President delegates responsibility to the campuses to account for and provide oversight of their auxiliary enterprises. Further, as of December 2010, auxiliary enterprises are no longer required to be entirely self‑supporting. The university revised its definition of an auxiliary enterprise at that time to allow campuses to subsidize these enterprises with available funding from appropriate sources. Even so, it is important that the university disclose any subsidization that occurs so that stakeholders can hold campuses accountable for this new use of funding.
Finally, in reviewing capital financing of auxiliary enterprises, we found that the Los Angeles campus, the Office of the President, and the Regents of the University of California (regents) designated the use of $23 million in revenue from a student referendum for unauthorized purposes. Although the university believes it has the authority to use these revenues for the two capital projects we examined, our legal counsel stated that neither the policies in place when students approved the referendum nor the regents’ approval of the referendum’s results provide a sufficient basis for expanding the uses of the revenue beyond the purposes stated in the original referendum. Despite designating a total of $23 million in referendum funds for these two projects, the university has spent only $5.2 million to date on one of the projects and has dropped its intention to spend $15 million on the other project.
5California State Auditor Report 2010-105
July 2011
Recommendations
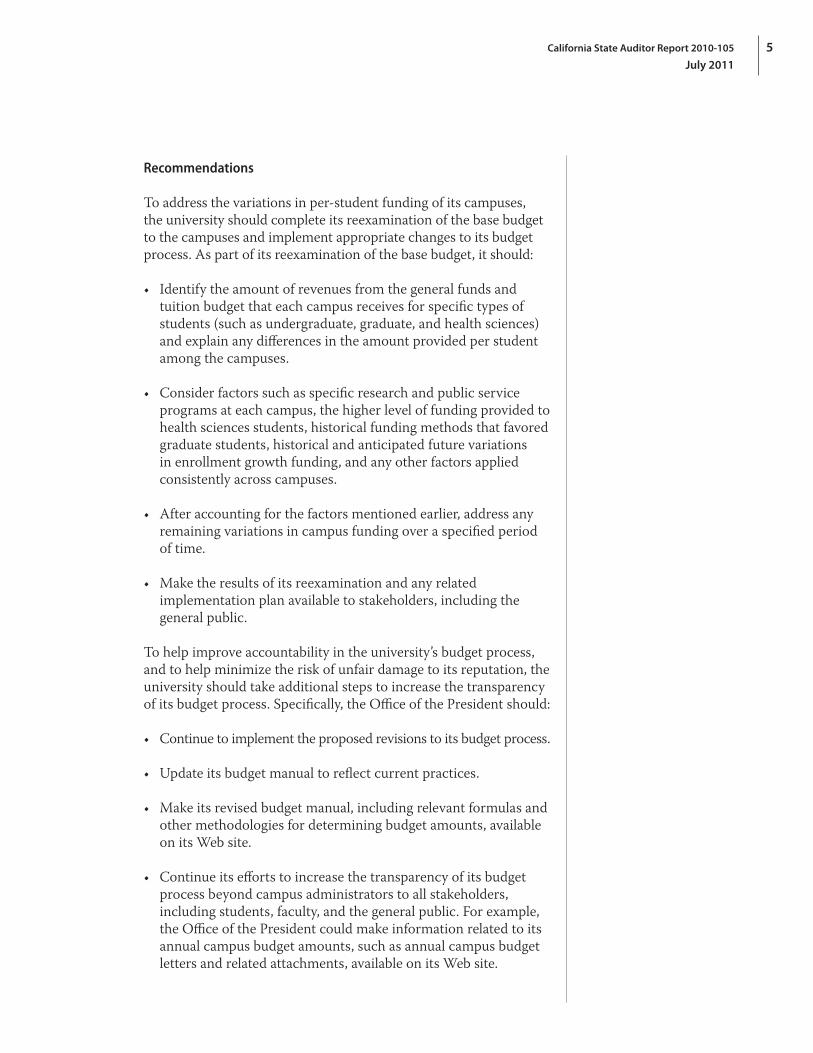
To address the variations in per‑student funding of its campuses, the university should complete its reexamination of the base budget to the campuses and implement appropriate changes to its budget process. As part of its reexamination of the base budget, it should:
• Identify the amount of revenues from the general funds and tuition budget that each campus receives for specific types of students (such as undergraduate, graduate, and health sciences) and explain any differences in the amount provided per student among the campuses.
• Consider factors such as specific research and public service programs at each campus, the higher level of funding provided to health sciences students, historical funding methods that favored graduate students, historical and anticipated future variations in enrollment growth funding, and any other factors applied consistently across campuses.
• After accounting for the factors mentioned earlier, address any remaining variations in campus funding over a specified period of time.
• Make the results of its reexamination and any related implementation plan available to stakeholders, including the general public.
To help improve accountability in the university’s budget process, and to help minimize the risk of unfair damage to its reputation, the university should take additional steps to increase the transparency of its budget process. Specifically, the Office of the President should:
• Continue to implement the proposed revisions to its budget process.
• Update its budget manual to reflect current practices.
• Make its revised budget manual, including relevant formulas and other methodologies for determining budget amounts, available on its Web site.
• Continue its efforts to increase the transparency of its budget process beyond campus administrators to all stakeholders, including students, faculty, and the general public. For example, the Office of the President could make information related to its annual campus budget amounts, such as annual campus budget letters and related attachments, available on its Web site.
California State Auditor Report 2010-105
July 2011
6
Agency Comments
The university states that it agrees with the importance of transparency and accountability. However, it adamantly disagrees with our analysis and comments in Chapter 2 regarding variations in per‑student funding among the campuses. Despite objecting strongly to the way we arrive at our conclusions, the university agrees that these variations should be examined. Finally, although it disputes certain language in our report regarding other issues, it stated that it concurs with the general intent behind the recommendations.

7California State Auditor Report 2010-105
July 2011
Introduction
Background
The University of California (university) was founded in 1868 as a public, state‑supported, higher education institution. It was written into the California Constitution as a public trust, to be administered by an independent governing board, the Regents of the University of California (regents). The regents include 26 members: 18 members appointed by the governor with the approval of the California Senate, seven ex officio members, and one student member appointed by the regents.
The university is led by a president who is responsible for overall policy development, planning, and resource allocations. The University of California Office of the President (Office of the President) is the systemwide headquarters of the university, managing its fiscal and business operations, and supporting its academic and research missions across its campuses, laboratories, and medical centers. A chancellor at each campus is responsible for managing campus operations. The regents have delegated authority to the Academic Senate1 to determine conditions for admission, establish degree requirements, and approve courses and curricula. Special faculty committees serve in an advisory capacity to the regents, the president, and the chancellors in a variety of matters.
The university has 10 campuses: Berkeley, Davis, Irvine, Los Angeles, Merced, Riverside, San Diego, San Francisco, Santa Barbara, and Santa Cruz. Nine of the campuses offer undergraduate, graduate, and professional education; the San Francisco campus is devoted exclusively to health sciences graduate and professional education. The university operates five academic medical centers in Los Angeles, San Francisco, Sacramento, San Diego, and Orange counties. Approximately 150 university institutes, centers, bureaus, and research laboratories operate in all parts of the State. The university is also involved in managing three U.S. Department of Energy laboratories. In fiscal year 2009–10 the university enrolled the equivalent of 232,613 full‑time students and employed the equivalent of 134,410 full‑time employees.
The 1960 Master Plan for Higher Education2 (master plan) designates the university as the primary state‑supported academic agency for research, with exclusive jurisdiction over instruction
1 According to its Web site, the Academic Senate represents the faculty in the shared government of the university. The Academic Senate is led by a 60‑member assembly and a 20‑member council.
2 The 1960 master plan is a 230‑page report that lays out recommendations for the future of California’s higher education. Certain provisions of the master plan were enacted into law by the Donahoe Higher Education Act in 1960.
California State Auditor Report 2010-105
July 2011
8
in law, medicine, dentistry, and veterinary medicine in public higher education. With certain exceptions, the university has the sole authority to award doctoral degrees in all fields of learning. Consistent with the master plan, the university’s mission is threefold:
• Teaching of qualified individuals by offering undergraduate, professional, and graduate academic education through the postdoctoral degree.
• Research directed toward advancing the understanding of arts and sciences and the interpretation of human history.
• Public service that helps fulfill the university’s obligation to disseminate knowledge. Examples of public service activities include operating agricultural extension programs, disseminating research results, and operating museums and performing arts spaces.
Like the master plan, the Higher Education Compact (compact) was designed to provide guidance to the State’s and the university’s decision makers. This compact between the former governor and the university was a multiyear plan spanning fiscal years 2005–06 through 2010–11 and called for providing the university and California State University (CSU) systems with sufficient funding to support their core missions. For the university’s base budget, the compact called for the State to provide a 3 percent increase in the State’s General Fund appropriation in fiscal years 2005–06 and 2006–07 and a 5 percent increase in fiscal years 2008–09, 2009–10, and 2010–11. Additionally, the compact called for the State to provide funding for enrollment growth of 5,000 students annually through the end of the decade. To justify this increase in enrollment, the compact cited the master plan, which lays out the university’s commitment to provide space for the top 12.5 percent of qualifying graduating California high school seniors. The compact also specified that increases in undergraduate fees should correspond to increases in per capita income but, in the face of fiscal crisis, can be up to 10 percent per year.
To support its core mission, the university operates some revenue‑generating programs. The term auxiliary enterprise refers to noninstructional programs within the university that are operated like commercial businesses and offer goods or services for sale. The university’s auxiliary enterprises include programs such as student housing, dining, and parking. They do not include legally separate entities such as booster clubs, foundations, and most

9California State Auditor Report 2010-105
July 2011
alumni associations.3 Some revenue‑generating programs, such as hospitals and clinics, are not considered auxiliary enterprises when they serve a teaching function.
Scope and Methodology
The Joint Legislative Audit Committee (audit committee) requested the Bureau of State Audits (bureau) to audit the university with a focus on public funds, student fees, and auxiliary enterprises. Further, the letter requesting this audit asked the bureau to focus on information that is centrally contained at the Office of the President to the extent possible. The audit committee asked the bureau to identify the major sources of public funding over the most recent five years, including funding from the federal government, and to review and evaluate the policies and practices that the university uses to track and allocate public funding.
To identify the major sources of public funding, we reviewed the university’s accounting manual, interviewed staff of the Office of the President, and obtained detailed electronic financial records from the university’s corporate financial system. For fiscal year 2009–10, these records consisted of about 103,000 public and nonpublic funds. Using data from the corporate financial system, we analyzed information within fund categories, the fund groups within each category, and the funds within each fund group to arrive at the number of funds associated with the data we analyzed. We further analyzed these records for fiscal years 2005–06 through 2009–10 and identified the revenue sources that included public funding.
We defined public funding as those revenues that the university obtained as part of its regular course of business. Examples of the types of revenues we examined include those provided by a government entity (including federal, state, or local governments), tuition and fees paid by students, and revenues from auxiliary enterprises. We excluded from our scope those revenues from the sales and services of medical centers and services provided as educational activities (including dental and optometry clinics) because the focus of the audit request did not center on medical center revenue. Because the audit request specified public funding, we also excluded private gifts, contracts, and grants. Similarly, we excluded fund groups within the endowment fund category, with the exception of the university opportunity fund group, which we included because it includes public revenues from the federal government. We further excluded the university’s management of
3 The university’s definition of an auxiliary enterprise differs from the CSU system’s definition. Auxiliary organizations within CSU can include nonprofit entities such as campus foundations that are not part of the university.
California State Auditor Report 2010-105
July 2011
10
U.S. Department of Energy laboratories from our scope because these activities have relatively minimal impact on other university operations. Using these criteria, we analyzed the financial data provided by the university to identify the major sources of public funding. We then identified trends, investigated anomalies, and determined the nature of each revenue source.
To review and evaluate the university’s policies and practices for tracking and allocating public funding, we interviewed staff of the Office of the President and examined budget letters from the Office of the President to the campuses. We also determined the types of data included in the university’s corporate financial system and reviewed relevant policies in the university’s accounting manual. Appendix A summarizes the university’s methods for distributing public funding to campuses.
The bureau was also asked to determine how the university spent its state appropriations, student fees, federal grant funding, and any inflationary increases in federal grant funding and to review and evaluate the procedures and practices used by the university to track and adjust nonsalary expenditure categories such as travel, consultants, entertainment, and general supplies. To determine how the university spent its public funding, we analyzed financial data provided by the university from its corporate financial system for fiscal years 2005–06 through 2009–10. We identified the revenues associated with each type of public funding, such as state appropriations, and used the financial data to determine how the university spent the funding.
Regarding inflationary increases,4 we were asked how the university spent this type of increase in grant funding if employee salaries are frozen. To help determine how the university spent inflationary increases in federal grant funding, we interviewed university staff and examined federal and university grant policies and university financial and personnel policies. We also visited three campuses—Berkeley, Los Angeles, and San Diego—at which we performed additional audit work. We selected these three campuses because the university’s financial information showed that they were the three campuses with the highest levels of research expenses. Also, because information from the university stated that grants from the National Institutes of Health (NIH) and the National Science Foundation (NSF) accounted for nearly 80 percent of the university’s federal research contract and grant awards in fiscal
4 The term inflationary increase (sometimes called an escalator increase) refers to statements included in fiscal policies issued by the NIH. The NIH issues an annual fiscal policy in which it identifies an inflation allowance for its investments in research and an increase in the average cost of grants. In its policy for federal fiscal year 2009–10, the NIH identified a 2 percent inflation allowance for NIH investments in research supported by grants and stated that the average cost of grants is allowed to increase by 2 percent over federal fiscal year 2008–09.
11California State Auditor Report 2010-105
July 2011
year 2008–09, we focused our review on NIH and NSF grants, and included grants from other federal agencies only as necessary. Finally, we judgmentally selected a sample of five grants at each campus we visited to determine whether faculty and staff associated with the grants received salary increases. To provide as much opportunity as possible to identify salary increases, we focused on grants that were at least two years in length and that closed either in 2009 or by April 2010, and included other grants not meeting these criteria only as necessary. Because our sample size is small, the results of our review should not be projected to the universe of federal research grants at the university.
To review and evaluate the procedures used by the university to track and adjust nonsalary expense categories, we reviewed its accounting manual and the financial data for these expenses. For the purpose of this audit, we defined nonsalary expenses as those that did not involve employee compensation (noncompensation expenses). To identify the amounts of the university’s noncompensation expenses, we reviewed the university’s accounting manual and interviewed staff of the Office of the President to determine which accounting codes the university used to record expenses related to compensation in the financial data. These accounting codes included those for salaries, wages, and benefits, among others. We grouped the remaining accounting codes into broad categories based on the type of expenses they recorded. For example, we grouped three different accounting codes related to travel expenses into one single travel category. Additionally, we interviewed Office of the President personnel to determine how such expenses were monitored and reported.
The audit committee also asked the bureau to determine, for the types of public funding mentioned earlier, the amount that is restricted to specific purposes by the funding source (restricted funds) and to identify how the university defines restricted funds. To meet these objectives, we reviewed the university’s policies regarding the definition and use of restricted funds and interviewed Office of the President staff. We analyzed financial records to identify the assets that the university has identified as restricted. In addition, we analyzed financial data to identify trends in the amount of funds that are restricted or designated and investigated any anomalies.
Additionally, the audit committee asked the bureau to assess the university’s policies and practices for tracking per‑student expenditures for instruction and to identify the average amount per student that the university has spent on instruction for undergraduate students in each of the past five fiscal years. To meet these objectives, we identified the per‑student expenditure calculations related to the university and evaluated the values and methodology for each calculation. We identified methods for calculating per‑student spending statistics used by the Legislature,
California State Auditor Report 2010-105
July 2011
12
the Department of Finance, the university, the California Postsecondary Education Commission, and the National Association of College and University Business Officers (NACUBO) and the specific purpose of each method. For the calculations used by state agencies, we identified the per‑student instruction expenditures for each methodology for the past five years. To determine the average amount of instruction spending for undergraduate students only, we calculated this amount using NACUBO’s method of weighting enrollment with the expenditure amounts the other state agencies used in their calculations. We discuss these statistics and the calculation methods in Appendix B.
Finally, we were asked to obtain the university’s definition of an auxiliary enterprise. We were also asked to determine the number of auxiliary enterprises that exist in the university system, the methods the university uses to track revenues and expenditures of auxiliary enterprises, and the policies and practices the university has in place to ensure that state funding is not used to supplement or guarantee projects or programs authorized by auxiliary enterprises. To meet these objectives, we reviewed the university’s accounting manual and relevant policies and practices established by the Office of the President that govern the operations of auxiliary enterprises. Because the Office of the President did not know the number of auxiliary enterprises that exist within the university, we had to estimate this number. To arrive at this estimate, we examined the financial data provided by the Office of the President because no other reliable source of this information could be found. To determine the university’s policies and practices for monitoring and reporting auxiliary enterprise revenues and expenses, we reviewed the university’s accounting manual and interviewed staff of the Office of the President. Further, we reviewed the policies related to monitoring and reporting auxiliary enterprise revenues and expenses at three campuses—Berkeley, Los Angeles, and San Diego. Finally, to determine how the university ensures that state funding is not used to supplement or guarantee projects for auxiliary enterprises, we reviewed the university’s accounting manual and interviewed relevant staff of the Office of the President. We determined that the Office of the President delegates this responsibility to the campuses, and therefore, we interviewed staff at the three campuses we visited.
During the course of the audit, several specific concerns related to the university’s revenues and expenses were brought to our attention. When these concerns fell within the scope of our audit, we included them in our review. To address these concerns and the issues included in the audit committee’s request, we analyzed data from the university’s corporate financial system. Each of the 10 university campuses provides campus financial data to the Office of the President. The data are then aggregated in the corporate

13California State Auditor Report 2010-105
July 2011
financial system. The U.S. Government Accountability Office whose standards we follow, requires us to assess the sufficiency and appropriateness of computer‑processed information. However, to assess the sufficiency and appropriateness of these data would require the bureau to perform testing at each of the 10 campuses and at the Office of the President. We did not conduct such testing because of the impracticality and expense involved. Nevertheless, we were able to verify that the revenue and expenditure data we obtained from the Office of the President’s financial system were generally consistent with the published financial schedules for each of the 10 university campuses. Therefore, for the purposes of this audit we determined the data to be of undetermined reliability.

California State Auditor Report 2010-105
July 2011
14
Blank page inserted for reproduction purposes only.

15California State Auditor Report 2010-105
July 2011
Chapter 1
UNIVERSITY REVENUES AND EXPENSES HAVE UNDERGONE A FEW SIGNIFICANT CHANGES OVER THE PAST FIVE YEARS
Chapter Summary
Financial information from the University of California’s (university) corporate financial system shows that revenues from public funding sources increased each year during the past five fiscal years, with the exception of a one‑year decline during fiscal year 2008–09 because of a decrease in the State’s General Fund appropriation. A major contributor to these increases was tuition and fee revenue increases, which grew due to both increased tuition rates and higher enrollment levels. The amount of funding provided by the State declined in fiscal year 2008–09, but growth in tuition and fee revenue and temporary funding from the federal American Recovery and Reinvestment Act of 2009 (Recovery Act) partially offset this reduction.
Similarly, from fiscal years 2005–06 through 2009–10, the university’s financial records show that expenses for most fund categories increased gradually, except benefits expenses. Expenses for retirement benefits increased by $3 billion from fiscal years 2005–06 through 2009–10 due to a required accounting change for health benefits and annual actuarial calculations for the pension program. The large increase in retirement expenses caused the ending balances5 for those related funds to decline by $4.7 billion over the five fiscal years we reviewed. The trend changed in fiscal year 2009–10, when expenses unrelated to retirement decreased. Expenses unrelated to employee compensation from fiscal years 2005–06 through 2009–10 were primarily for operations, Miscellaneous Services, and scholarships and fellowships. In addition to the financial information discussed in this report, we include on our Web site a link (www.bsa.ca.gov/reports/2010‑105/) to more detailed financial information from the corporate financial system for fiscal year 2009–10.
University Revenues From Public Funding Sources Have Increased by an Average of 5 Percent Per Year
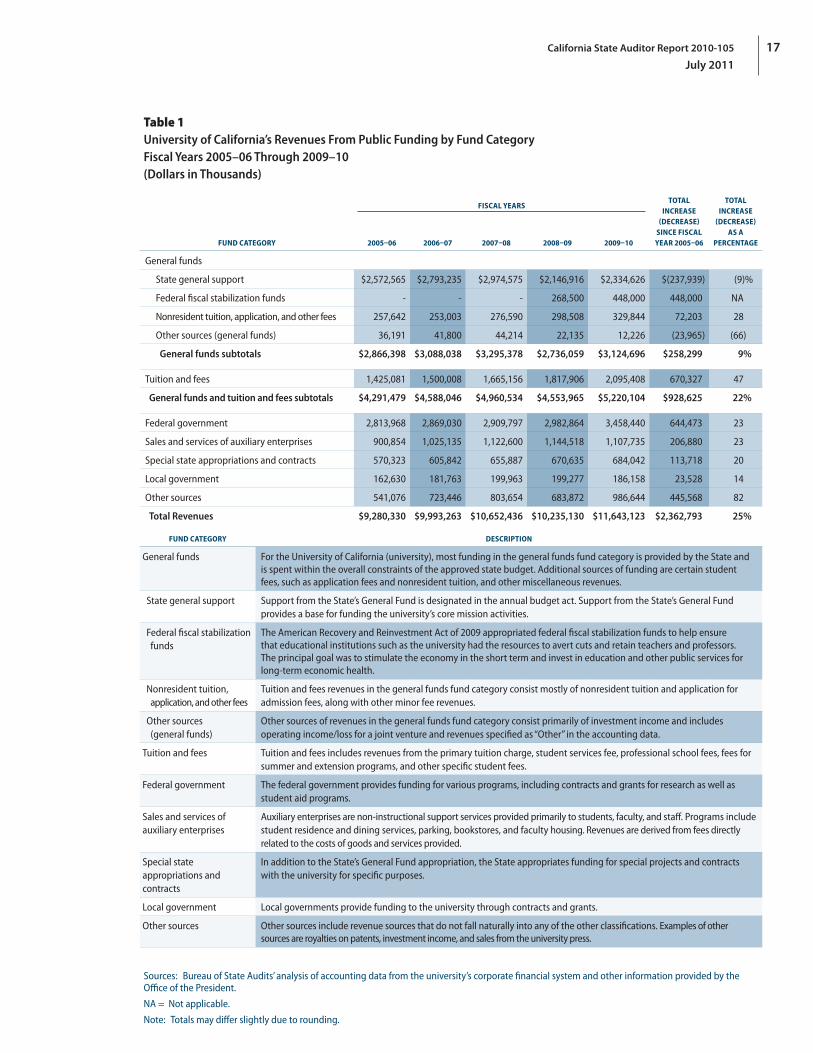
As shown in Table 1 on page 17, the amount of revenues the university received from public funding sources increased by a total of 25 percent over the five‑year period we reviewed, from
5 The balance of a fund, typically measured at the beginning or end of a fiscal year, represents the value of a fund’s assets, such as cash, less its liabilities, such as accounts payable.

California State Auditor Report 2010-105
July 2011
16
$9.3 billion in fiscal year 2005–06 to more than $11.6 billion in fiscal year 2009–10. This represents an average increase of about 5 percent per year, with an increase occurring in each fiscal year except 2008–09. The university categorizes revenues from public funding in its financial data based on six major sources: the State, tuition and fees, federal government, sales and services of auxiliary enterprises, local government, and other sources. These revenues are recorded under seven different fund categories. Revenues from the State are recorded under the general funds fund group6 and the special state appropriations and contracts fund category. Tuition and fee revenues are recorded in the tuition and fees fund category and in the general funds fund group (for fees such as nonresident tuition). See the text box for how the university defines the term general fund. The increase in public funding was the result of revenue growth in all seven of these fund categories, with the largest percentage increases in the tuition and fees category and the other sources category.
Over the five years we examined, the amount of revenues in the tuition and fees fund category grew more from a dollar standpoint than any other category, with a $670 million (47 percent) increase from fiscal year 2005–06. As we discuss in the following section, this increase resulted from both increased tuition and fee rates and higher student enrollment. Revenues in the other sources fund category had the largest percentage increase at 82 percent, with a $446 million increase, from $541 million in fiscal year 2005–06 to $987 million in fiscal year 2009–10. However, these revenues did not increase consistently, and a decrease in fiscal year 2008–09 contributed to the decline in total revenues for that year. The increase in revenue and other
year‑to‑year variations in the other sources category were due primarily to fluctuations in the fair market value of the university’s investments.
Another significant increase in revenues occurred in the fund category for the auxiliary enterprises operated by the university. As shown in Table 1, revenues generated by auxiliary enterprises increased by 23 percent, from $901 million in fiscal year 2005–06 to $1.1 billion in fiscal year 2009–10. An increase in housing revenue contributed to this increase. According to the University of California Office of the President (Office of the President), the university has needed to accommodate an increasing number of students in university housing—a type of auxiliary enterprise—and that a rapid growth in demand required the university to adapt dorms to house additional students.
6 The general funds fund category includes only the general funds fund group. The university uses the term general funds fund group to describe this category.
Definitions for General Fund
TheUniversityofCalifornia(university)usesthetermgeneral fundinseveralways.Theuniversityprovidedthefollowingdefinitionsforclarity:
• University of California general funds (UC general funds)—Abudgetcategorythatincludesnonresidenttuition,aportionofthefederalindirectcostreimbursement,overheadonstateagencyagreements,aportionofpatentroyaltyincome,interestonbalancesfromthegeneralfundsfundgroup(definedbelow),andincomefromfeesforapplicationforadmissionandsomeothersmallerfees.Thefundingisintendedtoprovidegeneralsupportfortheuniversity’scoremissionactivities,alongwiththeState’sGeneralFundandtuitionrevenue sources.
• General funds and tuition budget—AbudgetcategorythatrepresentsthetotalamountateachcampusfortheappropriationfromtheState’sGeneralFund,tuitionrevenue(netofstudentfinancialaid),andUCgeneralfundsthatisavailabletosupportcoremissionactivities.
• General funds fund group—AcollectionoffundsusedtorecordrevenueandexpendituretransactionsfromtheState’sGeneralFundandUCgeneralfundsforgeneraloperationstiedtothoserevenuesources.Thisfundgroupincludes,amongothers,the19900fund(definedbelow),afundfornonresidenttuition,andafundforacademicpreparationprograms.
• General fund 19900—Thelargestsinglefundinthe generalfundsfundgroup,representinggeneralsupport.Otherfundsinthegeneralfundfunds groupareusedforcertainspecificrevenuesourcesordesignated expenditures.
Source: University’s Office of the President.
17California State Auditor Report 2010-105
July 2011
Table 1University of California’s Revenues From Public Funding by Fund Category Fiscal Years 2005–06 Through 2009–10 (Dollars in Thousands)
FUND CATEGORY
FISCAL YEARSTOTAL
INCREASE (DECREASE)
SINCE FISCAL YEAR 2005–06
TOTAL INCREASE
(DECREASE) AS A
PERCENTAGE2005–06 2006–07 2007–08 2008–09 2009–10
General funds
State general support $2,572,565 $2,793,235 $2,974,575 $2,146,916 $2,334,626 $(237,939) (9)%
Federal fiscal stabilization funds ‑ ‑ ‑ 268,500 448,000 448,000 NA
Nonresident tuition, application, and other fees 257,642 253,003 276,590 298,508 329,844 72,203 28
Other sources (general funds) 36,191 41,800 44,214 22,135 12,226 (23,965) (66)
General funds subtotals $2,866,398 $3,088,038 $3,295,378 $2,736,059 $3,124,696 $258,299 9%
Tuition and fees 1,425,081 1,500,008 1,665,156 1,817,906 2,095,408 670,327 47
General funds and tuition and fees subtotals $4,291,479 $4,588,046 $4,960,534 $4,553,965 $5,220,104 $928,625 22%
Federal government 2,813,968 2,869,030 2,909,797 2,982,864 3,458,440 644,473 23
Sales and services of auxiliary enterprises 900,854 1,025,135 1,122,600 1,144,518 1,107,735 206,880 23
Special state appropriations and contracts 570,323 605,842 655,887 670,635 684,042 113,718 20
Local government 162,630 181,763 199,963 199,277 186,158 23,528 14
Other sources 541,076 723,446 803,654 683,872 986,644 445,568 82
Total Revenues $9,280,330 $9,993,263 $10,652,436 $10,235,130 $11,643,123 $2,362,793 25%
FUND CATEGORY DESCRIPTION
General funds For the University of California (university), most funding in the general funds fund category is provided by the State and is spent within the overall constraints of the approved state budget. Additional sources of funding are certain student fees, such as application fees and nonresident tuition, and other miscellaneous revenues.
State general support Support from the State’s General Fund is designated in the annual budget act. Support from the State’s General Fund provides a base for funding the university’s core mission activities.
Federal fiscal stabilization funds
The American Recovery and Reinvestment Act of 2009 appropriated federal fiscal stabilization funds to help ensure that educational institutions such as the university had the resources to avert cuts and retain teachers and professors. The principal goal was to stimulate the economy in the short term and invest in education and other public services for long‑term economic health.
Nonresident tuition, application, and other fees
Tuition and fees revenues in the general funds fund category consist mostly of nonresident tuition and application for admission fees, along with other minor fee revenues.
Other sources (general funds)
Other sources of revenues in the general funds fund category consist primarily of investment income and includes operating income/loss for a joint venture and revenues specified as “Other” in the accounting data.
Tuition and fees Tuition and fees includes revenues from the primary tuition charge, student services fee, professional school fees, fees for summer and extension programs, and other specific student fees.
Federal government The federal government provides funding for various programs, including contracts and grants for research as well as student aid programs.
Sales and services of auxiliary enterprises
Auxiliary enterprises are non‑instructional support services provided primarily to students, faculty, and staff. Programs include student residence and dining services, parking, bookstores, and faculty housing. Revenues are derived from fees directly related to the costs of goods and services provided.
Special state appropriations and contracts
In addition to the State’s General Fund appropriation, the State appropriates funding for special projects and contracts with the university for specific purposes.
Local government Local governments provide funding to the university through contracts and grants.
Other sources Other sources include revenue sources that do not fall naturally into any of the other classifications. Examples of other sources are royalties on patents, investment income, and sales from the university press.
Sources: Bureau of State Audits’ analysis of accounting data from the university’s corporate financial system and other information provided by the Office of the President.
NA = Not applicable.
Note: Totals may differ slightly due to rounding.
California State Auditor Report 2010-105
July 2011
18
Both Rate Increases and Enrollment Growth Have Driven Increases in Tuition and Fee Revenue, Which Have Partially Offset Declines in State Funding
The revenue category with the largest year‑to‑year fluctuations over the five‑year period we reviewed was state general support. These revenues are included in the general funds fund group. The amount of state general support received by the university is determined by the State in the annual budget act. This amount increased from one year to the next for each of the five fiscal years we reviewed except for 2008–09, when it declined by $828 million, or 28 percent. After the fiscal year 2007–08 to 2008–09 decline in revenue, state general support increased by $188 million, or 9 percent, to $2.3 billion in fiscal year 2009–10.
During the five‑year period, the amount of state general support revenues ranged from a high of nearly $3 billion in fiscal year 2007–08 to a low of $2.1 billion in fiscal year 2008–09. These amounts were in addition to the federal Recovery Act fiscal stabilization funding provided to the university by the State in the amounts of $268.5 million in fiscal year 2008–09 and $448 million in fiscal year 2009–10. Excluding this federal funding, the amounts of state general support in fiscal years 2008–09 and 2009–10 were the lowest of the five‑year period, with $238 million less in state support in fiscal year 2009–10 than in fiscal year 2005–06. The Office of the President stated that Recovery Act funding is expected to end in fiscal year 2010–11, and that it received $106.6 million in fiscal stabilization revenues for that year. University accounting records also show that the Recovery Act provided $222 million in federal grant, appropriation, and contract revenues in fiscal year 2009–10, in addition to the fiscal stabilization funds.
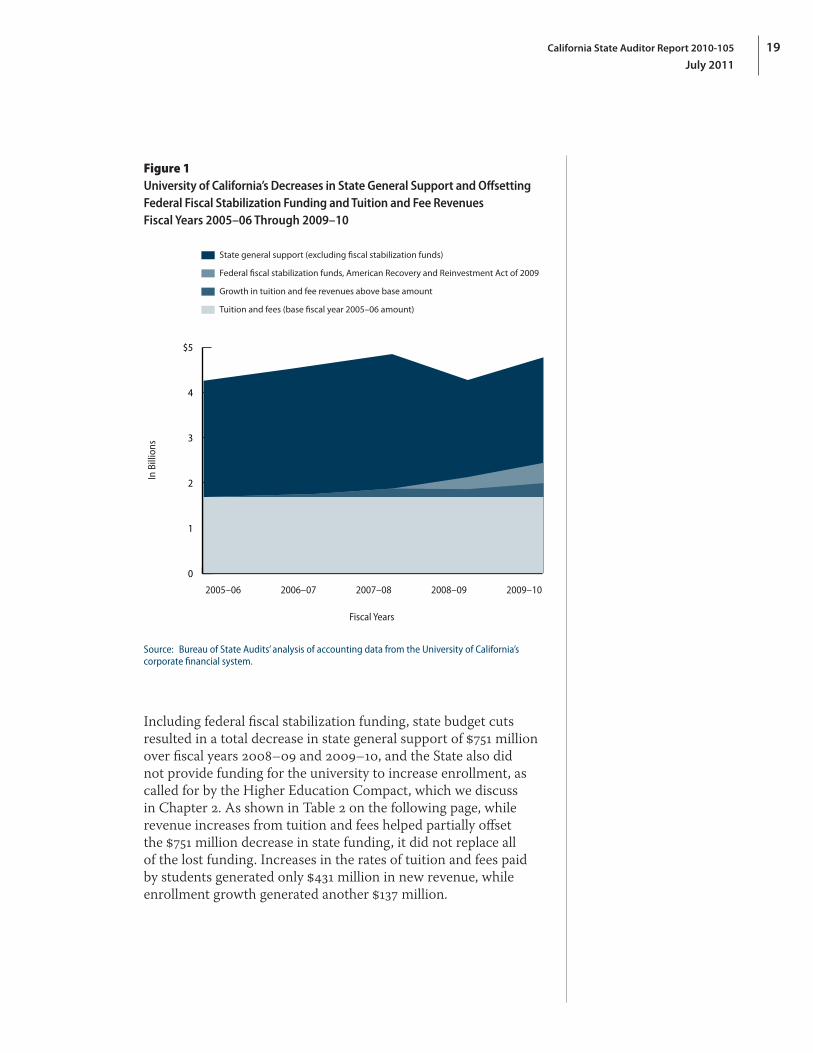
According to meeting minutes of the Regents of the University of California (regents) and the university’s annual budgets, the decline in state support in fiscal years 2008–09 and 2009–10 contributed to the need for the university to increase tuition rates. During the period from fiscal years 2005–06 through 2009–10, the university increased the tuition rates paid by all students four times, while the number of enrolled students increased by 13 percent. Consequently, revenues in the tuition and fees fund category, which exclude nonresident tuition, increased by $670 million, a 47 percent increase, from $1.4 billion in fiscal year 2005–06 to $2.1 billion in fiscal year 2009–10. As shown in Figure 1, tuition and fee revenues increased throughout the five‑year period. These increased revenues, along with the federal fiscal stabilization funds, partially offset the lower amount of state general support in fiscal years 2008–09 and 2009–10.
From fiscal years 2005–06 through 2009–10, the university increased tuition rates paid by all students four times, while the number of enrolled students increased by 13 percent.
19California State Auditor Report 2010-105
July 2011
Figure 1University of California’s Decreases in State General Support and Offsetting Federal Fiscal Stabilization Funding and Tuition and Fee Revenues Fiscal Years 2005–06 Through 2009–10
In B
illio
ns
0
1
2
3
4
$5
State general support (excluding fiscal stabilization funds)
Growth in tuition and fee revenues above base amount
Tuition and fees (base fiscal year 2005–06 amount)
Federal fiscal stabilization funds, American Recovery and Reinvestment Act of 2009
2005–06 2006–07 2007–08 2008–09 2009–10
Fiscal Years
Source: Bureau of State Audits’ analysis of accounting data from the University of California’s corporate financial system.
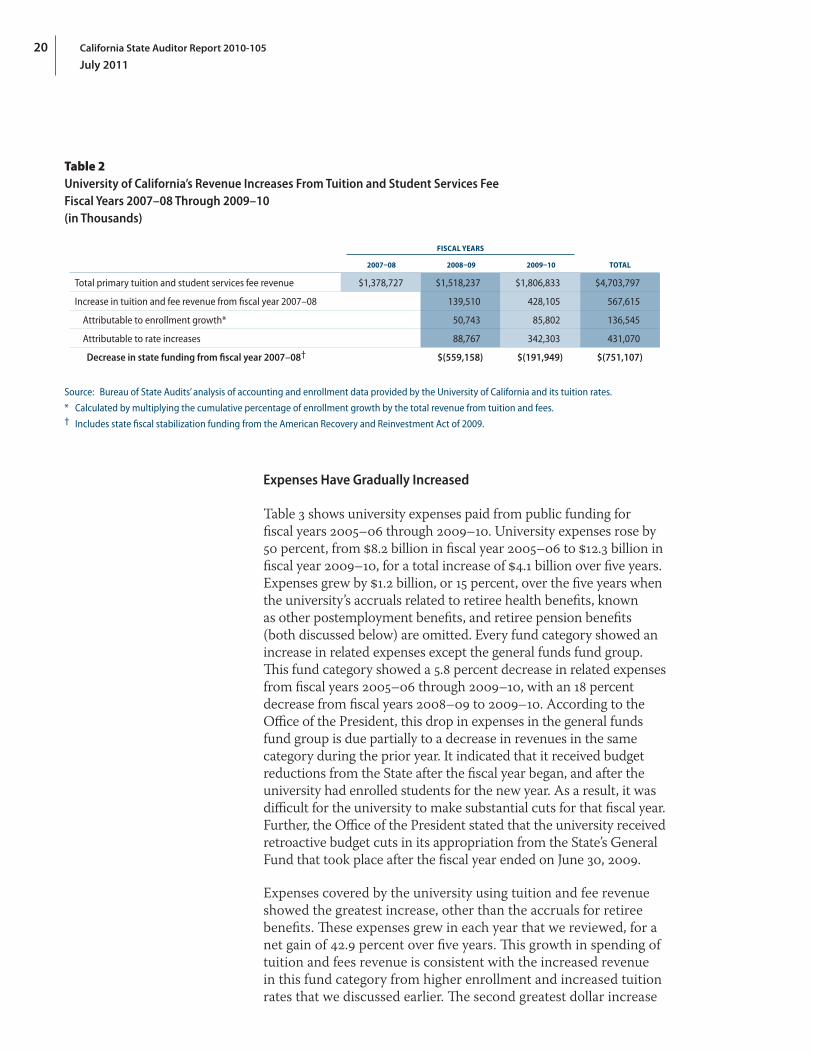
Including federal fiscal stabilization funding, state budget cuts resulted in a total decrease in state general support of $751 million over fiscal years 2008–09 and 2009–10, and the State also did not provide funding for the university to increase enrollment, as called for by the Higher Education Compact, which we discuss in Chapter 2. As shown in Table 2 on the following page, while revenue increases from tuition and fees helped partially offset the $751 million decrease in state funding, it did not replace all of the lost funding. Increases in the rates of tuition and fees paid by students generated only $431 million in new revenue, while enrollment growth generated another $137 million.
California State Auditor Report 2010-105
July 2011
20
Table 2University of California’s Revenue Increases From Tuition and Student Services Fee Fiscal Years 2007–08 Through 2009–10 (in Thousands)
FISCAL YEARS
TOTAL 2007–08 2008–09 2009–10
Total primary tuition and student services fee revenue $1,378,727 $1,518,237 $1,806,833 $4,703,797
Increase in tuition and fee revenue from fiscal year 2007–08 139,510 428,105 567,615
Attributable to enrollment growth* 50,743 85,802 136,545
Attributable to rate increases 88,767 342,303 431,070
Decrease in state funding from fiscal year 2007–08† $(559,158) $(191,949) $(751,107)
Source: Bureau of State Audits’ analysis of accounting and enrollment data provided by the University of California and its tuition rates.
* Calculated by multiplying the cumulative percentage of enrollment growth by the total revenue from tuition and fees.† Includes state fiscal stabilization funding from the American Recovery and Reinvestment Act of 2009.
Expenses Have Gradually Increased
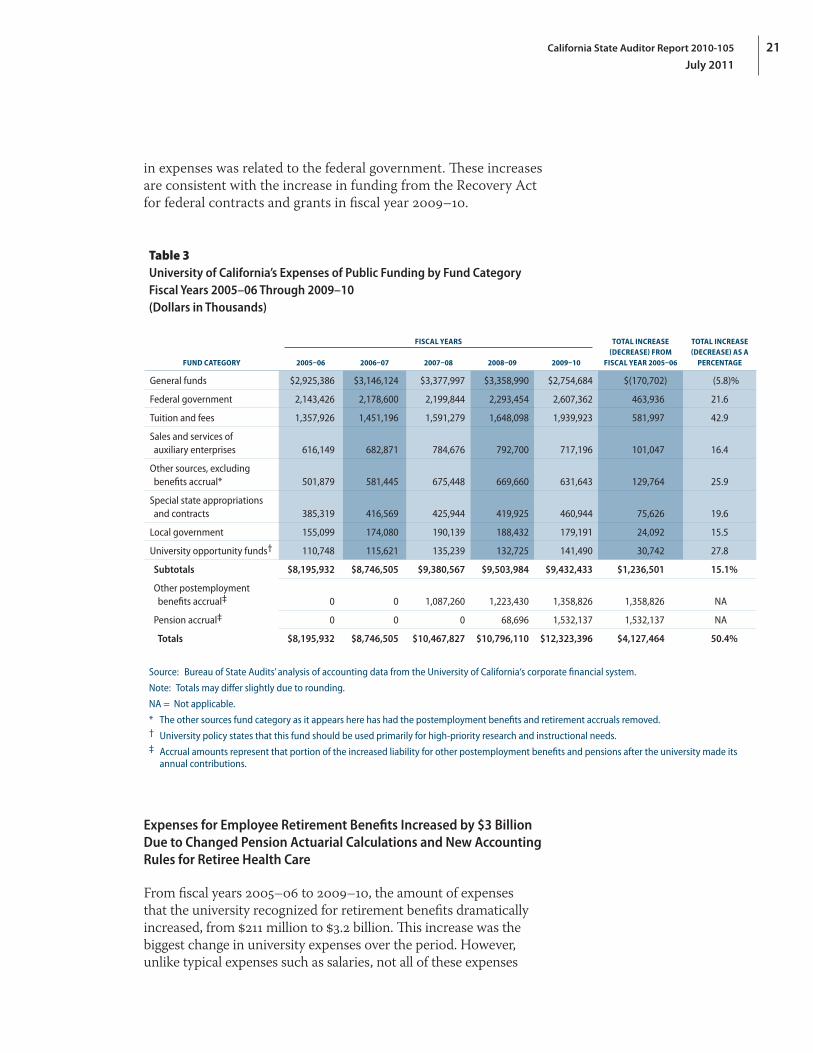
Table 3 shows university expenses paid from public funding for fiscal years 2005–06 through 2009–10. University expenses rose by 50 percent, from $8.2 billion in fiscal year 2005–06 to $12.3 billion in fiscal year 2009–10, for a total increase of $4.1 billion over five years. Expenses grew by $1.2 billion, or 15 percent, over the five years when the university’s accruals related to retiree health benefits, known as other postemployment benefits, and retiree pension benefits (both discussed below) are omitted. Every fund category showed an increase in related expenses except the general funds fund group. This fund category showed a 5.8 percent decrease in related expenses from fiscal years 2005–06 through 2009–10, with an 18 percent decrease from fiscal years 2008–09 to 2009–10. According to the Office of the President, this drop in expenses in the general funds fund group is due partially to a decrease in revenues in the same category during the prior year. It indicated that it received budget reductions from the State after the fiscal year began, and after the university had enrolled students for the new year. As a result, it was difficult for the university to make substantial cuts for that fiscal year. Further, the Office of the President stated that the university received retroactive budget cuts in its appropriation from the State’s General Fund that took place after the fiscal year ended on June 30, 2009.
Expenses covered by the university using tuition and fee revenue showed the greatest increase, other than the accruals for retiree benefits. These expenses grew in each year that we reviewed, for a net gain of 42.9 percent over five years. This growth in spending of tuition and fees revenue is consistent with the increased revenue in this fund category from higher enrollment and increased tuition rates that we discussed earlier. The second greatest dollar increase
21California State Auditor Report 2010-105
July 2011
in expenses was related to the federal government. These increases are consistent with the increase in funding from the Recovery Act for federal contracts and grants in fiscal year 2009–10.
Table 3University of California’s Expenses of Public Funding by Fund Category Fiscal Years 2005–06 Through 2009–10 (Dollars in Thousands)
FUND CATEGORY
FISCAL YEARS TOTAL INCREASE (DECREASE) FROM
FISCAL YEAR 2005–06
TOTAL INCREASE (DECREASE) AS A
PERCENTAGE2005–06 2006–07 2007–08 2008–09 2009–10
General funds $2,925,386 $3,146,124 $3,377,997 $3,358,990 $2,754,684 $(170,702) (5.8)%
Federal government 2,143,426 2,178,600 2,199,844 2,293,454 2,607,362 463,936 21.6
Tuition and fees 1,357,926 1,451,196 1,591,279 1,648,098 1,939,923 581,997 42.9
Sales and services of auxiliary enterprises 616,149 682,871 784,676 792,700 717,196 101,047 16.4
Other sources, excluding benefits accrual* 501,879 581,445 675,448 669,660 631,643 129,764 25.9
Special state appropriations and contracts 385,319 416,569 425,944 419,925 460,944 75,626 19.6
Local government 155,099 174,080 190,139 188,432 179,191 24,092 15.5
University opportunity funds† 110,748 115,621 135,239 132,725 141,490 30,742 27.8
Subtotals $8,195,932 $8,746,505 $9,380,567 $9,503,984 $9,432,433 $1,236,501 15.1%
Other postemployment benefits accrual‡ 0 0 1,087,260 1,223,430 1,358,826 1,358,826 NA
Pension accrual‡ 0 0 0 68,696 1,532,137 1,532,137 NA
Totals $8,195,932 $8,746,505 $10,467,827 $10,796,110 $12,323,396 $4,127,464 50.4%
Source: Bureau of State Audits’ analysis of accounting data from the University of California‘s corporate financial system.
Note: Totals may differ slightly due to rounding.
NA = Not applicable.
* The other sources fund category as it appears here has had the postemployment benefits and retirement accruals removed.† University policy states that this fund should be used primarily for high‑priority research and instructional needs.‡ Accrual amounts represent that portion of the increased liability for other postemployment benefits and pensions after the university made its
annual contributions.
Expenses for Employee Retirement Benefits Increased by $3 Billion Due to Changed Pension Actuarial Calculations and New Accounting Rules for Retiree Health Care
From fiscal years 2005–06 to 2009–10, the amount of expenses that the university recognized for retirement benefits dramatically increased, from $211 million to $3.2 billion. This increase was the biggest change in university expenses over the period. However, unlike typical expenses such as salaries, not all of these expenses

California State Auditor Report 2010-105
July 2011
22
directly correlate with cash payments. In fact, in fiscal year 2009–10, $2.9 billion of the expense was for accruals to record the required contributions for employee retirement benefits.
During fiscal year 2007–08, the university adopted a new accounting standard (GASB 457) related to postemployment benefits other than pensions. Under the new standard, the university is required to recognize the expense for retiree health and dental benefits during the period in which the benefits are earned. The statement also requires the university to provide information about accrued liabilities associated with the benefits and the extent of the progress being made in funding the plan. The university has begun following an actuarially determined plan to record the required contributions for providing postemployment health benefits. To record this liability, the university recognized a $1.36 billion expense in fiscal year 2007–08 for retirement health benefits. The expense increased to $1.5 billion in fiscal year 2008–09 and $1.6 billion in fiscal year 2009–10. Thus far, the university has recognized more than $4.4 billion of the liability, but it has paid less than 20 percent of this liability each year. Future changes made by the university to pay the remaining portion of this expense will likely have a significant impact on the university’s annual budget, as the amount of the annual expense is significant, with the $1.6 billion other postemployment benefits expense in fiscal year 2009–10 representing 13 percent of expenses. As of the beginning of fiscal year 2009–10, the university had an unfunded liability calculated to be $14.5 billion.
Further, due to an increase in the university’s required contribution to its pension fund, the university recognized a $1.6 billion expense in fiscal year 2009–10, a significant increase from the $69 million expense for fiscal year 2008–09 and the $2.6 million expense in fiscal year 2007–08. The amount the university is required to contribute to its pension system is calculated by actuaries and is updated each year. Similar to the other postemployment benefits accrual, the majority of the fiscal year 2009–10 expense for the university’s retirement plan has not been paid. The retiree pension system was considered to be fully funded at the beginning of fiscal year 2008–09; however, at the end of fiscal year 2009–10, the university owed about $1.6 billion for its unpaid pension expenses from the prior two years.
While Ending Balances for Most Funds Remained Stable, Retirement Accruals Decreased the Total Ending Balance by $4.7 Billion
Total ending balances for the university’s current funds decreased significantly from fiscal years 2005–06 through 2009–10. In fiscal year 2005–06, the university’s public funds had an ending balance
7 The Governmental Accounting Standards Board, or GASB, is the independent organization that establishes standards of accounting and financial reporting for state and local governments.
Thus far, the university has recognized more than $4.4 billion of the retirement health benefits liability, but it has paid less than 20 percent of the liability each year.
23California State Auditor Report 2010-105
July 2011
of $2.6 billion; by the end of fiscal year 2009–10 this amount had decreased by $5.3 billion to a negative balance of nearly $2.7 billion. This major change in the university’s ending balances is due almost entirely to a $4.7 billion decrease in the balance of funds in the other sources category, from a balance of nearly $900 million at the end of fiscal year 2005–06 to a $3.8 billion negative balance at the end of fiscal year 2009–10. This negative balance is related primarily to the accrual of retirement benefits expenses. Although the university has funded a portion of these expenses, the remainder has created a growing liability. When the university does not contribute the required amount to its pension system or retiree health benefit trust, its liabilities increase by that amount. As investment returns and predictions of future income and costs change, the amount owed by the university can also fluctuate.
During fiscal year 2008–09, the balance in the general funds fund group dropped from a beginning balance of $422 million to a negative balance of nearly $120 million at the end of the year. This decrease of $542 million occurred due to expenses outpacing revenues and net transfers during the fiscal year. According to the Office of the President, midyear and post–fiscal year budget reductions contributed to expenses exceeding revenues in the general funds fund group during fiscal year 2008–09. The university decreased expenses from the general funds fund group by $604 million in fiscal year 2009–10 while revenues increased by $389 million, due in large part to a $180 million increase in federal fiscal stabilization funds. As a result of revenues exceeding expenses in fiscal year 2009–10, the ending balance for the general funds fund group was restored to a level comparable to its levels during fiscal years 2005–06 through 2007–08.
University Expenses Remained Concentrated in Instruction and Research
The university uses 10 different function categories to record its current expenses. Expenses are assigned to function categories according to their purpose. For this analysis, we excluded expense accruals of two types of retirement expenses so that we could more easily identify changes over time in the function categories. As shown in Table 4 on the following page, the majority of university expenses for each year were in the instruction and research categories. Nearly all of the university’s expense categories saw an overall increase in expenses over the five‑year period and total expenses increased in each fiscal year except 2009–10.
Expenses for teaching hospitals increased by the largest percentage of any category. Documents indicate that the university spent public funding on its teaching hospitals to maintain a sufficiently large and diverse patient population for teaching purposes; the funding provides
Nearly all of the university’s expense categories saw an overall increase in expenses over the five‑year period, with expenses for teaching hospitals increasing by the largest percentage of any category.

California State Auditor Report 2010-105
July 2011
24
financial support for patients who are essential for the teaching program because their cases are rare or complicated but who cannot pay for the full cost of their medical care. According to the Office of the President, the increase was caused by varying amounts of insurance adjustments. The category with the second largest percentage increase was student aid. This category was unaffected by the university’s reduction in expenses in the general funds fund group in fiscal year 2009–10, showing a 3 percent increase over the prior year.
Table 4University of California’s Expenses of Public Funding by Function Category Fiscal Years 2005–06 Through 2009–10 (Dollars in Thousands)
FUNCTION CATEGORY
FISCAL YEARS TOTAL INCREASE (DECREASE) SINCE
FISCAL YEAR 2005–06
TOTAL INCREASE (DECREASE) AS A PERCENTAGE2005–06 2006–07 2007–08 2008–09 2009–10
Instruction $2,410,257 $2,585,539 $2,800,424 $2,825,580 $2,771,637 $361,380 15.0%
Research 2,260,640 2,309,272 2,368,408 2,452,320 2,583,782 323,142 14.3
Auxiliary enterprises 703,991 791,414 905,387 916,106 878,949 174,958 24.9
Institutional support 700,074 787,107 802,470 837,590 739,899 39,825 5.7
Academic support 714,815 725,739 823,039 781,789 710,125 (4,690) (0.7)
Student services 446,575 472,857 538,257 543,394 540,247 93,672 21.0
Maintenance and operation of plant 446,785 470,442 522,101 515,644 507,521 60,736 13.6
Student aid 225,938 260,097 269,380 296,730 381,976 156,038 69.1
Public service 284,656 292,012 302,408 300,184 305,130 20,474 7.2
Teaching hospitals 2,202 52,026 48,694 34,648 13,167 10,965 498.0
Totals $8,195,932 $8,746,505 $9,380,567 $9,503,984 $9,432,433 $1,236,501 15.1%
CATEGORY DESCRIPTION
Instruction All current expenses of instructional departments, including expenses for research done as part of regular instructional programs.
Research Expenses of all separately organized research units, including research institutes, centers, bureaus, laboratories, and stations.
Auxiliary enterprises Expenses of the auxiliary enterprises, intended to be self‑supporting, operated primarily to serve the students and staff.
Institutional support Expenses of the general administrative offices serving the University of California (university), such as the Regents of the University of California, president, vice presidents, and chancellors.
Academic support Expenses for activities related to educational departments, such as optometry and dental clinics. Also, the category includes expenses of all central and branch libraries administered by the campus general libraries.
Student services Expenses for services to the student body as a whole, such as health services and counseling programs.
Maintenance and operation of plant All expenses (including salaries and wages) required to maintain and operate the physical plant.
Student aid Expenses for scholarships, fellowships, and prizes.
Public service Expenses for activities intended to serve the general public, such as campus cultural events, operating museums, and providing cooperative extensions.
Teaching hospitals Expenses for teaching hospitals.
Sources: Bureau of State Audits’ analysis of accounting data from the university’s corporate financial system and other information provided by the Office of the President.
Notes: Excludes the accrual of two types of retirement expenses: other postemployment benefits and pension expenses.
Totals may differ slightly due to rounding.

25California State Auditor Report 2010-105
July 2011
Expenses in the instruction category showed growth from fiscal years 2005–06 through 2008–09 before falling 2 percent in fiscal year 2009–10. This 2 percent drop in expenses came almost exclusively from a drop in the amount of expenses paid from the general funds fund group. In fact, the university increased its payments of instruction expenses from many other categories in fiscal year 2009–10. This included increased instruction expenses from the tuition and fees, federal government, and special state appropriations fund categories. The university stated that increased enrollment led it to prioritize instruction‑related expenses during this time period to make up for a drop in state funding. The net growth in instruction‑related expenses over the five‑year period was 15 percent.
Expenses in the academic support category rose from fiscal years 2005–06 through 2007–08 before declining by almost $113 million during fiscal years 2008–09 and 2009–10. Again, the decreases were due to the reduction in expenses paid from the general funds fund group.
Most Noncompensation Expenses Have Been for Operations, Miscellaneous Services, or Scholarships and Fellowships
To analyze noncompensation expense trends, we reviewed expense information by object code for the five fiscal years from 2005–06 through 2009–10. The university records each expense as belonging to one of nearly 200 expense categories called object codes. We defined noncompensation expenses as expenses not directly related to any of the following: employee salaries and wages; employee benefits, including medical insurance and retirement expenses; employer contributions to retirement funds; or taxes paid as the result of employing someone. We grouped the remaining noncompensation expenses by object code into categories such as social activities and entertainment, travel, general office supplies, scholarships and fellowships, as well as operating expenses, which include expenses for utilities, laboratory materials, general supplies, and medical supplies. Because it accounted for a significant proportion of expenses, we did not group the Miscellaneous Services object code with other codes.
Figure 2 on the following page shows that approximately half of the university’s noncompensation expenses for fiscal years 2005–06 through 2009–10 were for operations.8 Approximately 25 percent were for Miscellaneous Services, nearly 20 percent were for
8 We consolidated the data for all five years because the proportion of expenses within most categories did not change significantly over time. The largest change in proportion occurred in the scholarships and fellowships category, increasing from 17.5 percent in fiscal year 2005–06 to 23.9 percent in fiscal year 2009–10.
Expenses in the academic support category rose from fiscal years 2005–06 through 2007–08 before declining by almost $113 million during fiscal years 2008–09 and 2009–10.

California State Auditor Report 2010-105
July 2011
26
scholarships and fellowships, and about 3 percent were for travel. The remaining 2 percent were for general office supplies, food and beverages for meetings and conferences, social activities and entertainment, and other expenses. The other expenses category consists of four university object codes: Nonoperating Expenses, Other Losses‑Other Than Capital Assets, Fines and Penalties, and Donations and Contributions.
Figure 2University of California’s Noncompensation Expenses by Category, Showing Each Category’s Amount and Percentage of Public Funding Fiscal Years 2005–06 Through 2009–10 (Dollars in Thousands)
Scholarships and fellowships—$4,750,459 (19.6%)
Travel—$793,155 (3.3%)
Food and beverages for meetings and conferences—$179,995 (0.7%)
General office supplies and equipment—$169,807 (0.7%)
Social activities and entertainment—$45,706 (0.2%)
Other expenses*—$23,343 (0.1%)
Miscellaneous Services—$5,952,314 (24.6%)
Operations—$12,317,582 (50.8%)
Source: Bureau of State Audits’ analysis of accounting data from the University of California’s (university) corporate financial system.
* “Other expenses” consists of four university object codes: nonoperating expenses, other losses–other than capital assets, fines and penalties, and donations and contributions.
The Office of the President indicated that it does not engage in any active tracking of expenses and that there is no set, comprehensive policy in place for routinely checking on how campuses use funding. According to the Office of the President, noncompensation expenses may be budgeted at the program, department, or college level; however, the Office of the President has little to no knowledge of, oversight over, or other role in tracking noncompensation expenses and that each campus has its own method for tracking these expenses. In fact, the Office of the President allows the campuses to report a significant portion of their noncompensation expenses under

27California State Auditor Report 2010-105
July 2011
the object code Miscellaneous Services, which can include consultant fees and advertising expenses. As shown in Figure 2, this object code included nearly $6 billion in expenses from fiscal years 2005–06 through 2009–10. We further discuss the large amount of expenses attributed to this single object code in Chapter 3.

California State Auditor Report 2010-105
July 2011
28
Blank page inserted for reproduction purposes only.

29California State Auditor Report 2010-105
July 2011
Chapter 2
THE UNIVERSITY SHOULD COMPLETE ITS REEXAMINATION OF CAMPUS BASE BUDGETS AND COULD IMPROVE THE TRANSPARENCY OF ITS BUDGET PROCESS
Chapter Summary
The University of California (university) Office of the President (Office of the President) allocates funding from certain revenue sources to the campuses while the revenues from other sources are retained by or are returned to the campus that generated them. Campuses have a large degree of autonomy over their spending decisions, though the Office of the President provides oversight in certain specific areas.
On a per‑student basis, the amount of funding provided through the budget process varied among the campuses. The university budgeted higher‑than‑average amounts per student for certain campuses, while other campuses received much lower levels per student. Although the university identified various reasons for these differences, it did not quantify the impact of these reasons and thus demonstrate that it had budgeted equitable amounts for each campus. The fact that the four campuses with a higher‑than‑average proportion of students from underrepresented racial or ethnic groups all received less than the average amount of funding per student highlights the importance of demonstrating that budgeted amounts are equitable.
Although the university has made efforts recently to improve the transparency of its budget process, it should take additional steps to increase the ability of stakeholders to better hold the university accountable for how it distributes public funding to various campuses, and to reduce the risk that the allocation process may be perceived as inequitable.
The Office of the President Distributes Funding From Certain Sources to Campuses but Gives Campuses a Large Degree of Autonomy Over Spending Decisions
According to the university’s director of operating budget, the university uses an incremental budgeting process. This means that the majority of the revenues distributed by the Office of the President are permanently budgeted for the campuses and are considered the base budget. The university then makes incremental adjustments to the base budget. The current base distribution is a result of decisions made by prior university presidents,

California State Auditor Report 2010-105
July 2011
30
administration at the Office of the President, and the Regents of the University of California (regents). The Office of the President does not distribute all revenues received from all sources to the campuses, but it does determine the amounts of the general funds and tuition budget that the campuses receive. In fiscal year 2009–10, this funding totaled $4.4 billion.
The Office of the President distributes the majority of these revenues incrementally to the campuses from the general funds fund group based on budgeted enrollment goals for each campus and the campus’s proportional share of the system’s base budget. Additional funding may be allocated for specific programs and initiatives depending on systemwide priorities and issues arising in any given year. The general funds fund group includes the State’s appropriation, a portion of the overhead included in federal and state contracts and grants, application fees from prospective students, some interest earned on cash balances for the general funds fund group, and a portion of patent royalty income. Although the university includes nonresident tuition as part of the general funds fund group, the Office of the President distributes it back to the campus that generated the revenues.9 The Office of the President allocates the majority of these revenues incrementally based on budgeted enrollment goals. According to the director of operating budget, the revenues that the Office of the President does not distribute are collected and retained by the campuses and include student services fee revenue, nonresident tuition, revenue from self‑supporting programs, campus‑based student fees, and health insurance fees. Appendix A explains the distribution methods for funding by revenue source according to the policies in place from fiscal years 2005–06 through 2009–10. The university is recommending a new allocation process for fiscal year 2011–12, and we describe some of the proposed changes in this appendix.
According to the director of operating budget, the Office of the President delegates responsibility to the campuses to ensure that funding is used appropriately. Although the university has systemwide policies that inform campuses about how certain types of funding could and should be used, the Office of the President exerts only limited oversight after setting the budgets for the campuses. However, the university does have some internal controls in place to protect against distributing more state funding than is available and to detect some types of expenditures that vary from expected amounts. Specifically, the coordinator of the Office of the President’s Division of Resource Management (resource management) stated that she actively monitors the
9 Before fiscal year 2007–08, the Office of the President included nonresident tuition as part of general fund 19900 for both accounting and allocation purposes. Starting in fiscal year 2007–08, the university allowed campuses to retain nonresident tuition.
The Office of the President exerts only limited oversight after setting the budgets for the campuses.

31California State Auditor Report 2010-105
July 2011
university’s budget amount identified in the governor’s proposed budget, budget revisions, and any modifying legislation and then reconciles these documents to the amount of state funding distributed to the campuses. According to the coordinator, resource management uses accounting system data to help detect certain spending patterns that vary from what was expected. Resource management staff enter control totals for certain funds included in the general funds fund group into the accounting system, and an automated computer process compares incoming quarterly data from the campuses against these figures.
According to the director of operating budget, the Office of the President takes a more active oversight role in two areas: financial aid and outreach programs to potential students. For instance, he stated that for the outreach programs, the Office of the President requests detailed reports annually from campuses regarding budgets and expenditures. Otherwise, the director of operating budget indicated that Office of the President’s analysts typically review details of campus expenditures only as needed for budget development and planning or as required by the Legislature or the Department of Finance, or at the request of an interested party such as the regent faculty leadership, students, parents, the press, and members of the public. The Office of the President stated that it does not police campus budgets.
The University’s Budget Process Has Resulted in Varied Campus Funding
To determine whether variances in budgeted per‑student amounts existed among the campuses, we examined the amount of the general funds and tuition budget that the Office of the President distributed to each campus on a per‑student basis for fiscal year 2009–10. We looked at the per‑student budget for each campus as a way to review the results of the budget process. Because the Office of the President does not provide all money in the general funds and tuition budget to the campuses on a per‑student basis (for example, it provides funding for specific research and public service programs to individual campuses), we understand that differences likely will exist. However, we would also expect that the university would be able to identify the reasons for any differences in the per‑student base budgets provided to the campuses. The Office of the President stated that variation in base budgets is the cumulative result of decades of budget decisions by the regents and past presidents to achieve the university’s mission of teaching, research, and public service, and that quantifying the impact of these decisions would require an extraordinary amount of analysis by budget staff. The Office of the President believes that such an analysis would not be a good use of limited administrative resources. Furthermore, the
The Office of the President’s analysts primarily review areas of funding only to develop budgets or as required by the Legislature or at the request of an interested party.

California State Auditor Report 2010-105
July 2011
32
Office of the President notes that the State has no expectation that funding for individual university campuses be determined formulaically, that the State provides a great deal of flexibility to the university to determine the best use of state support to achieve its mission, and that this flexibility has been a key factor in the achievement and continuing pursuit of excellence at its 10 campuses. Notwithstanding the comments from the Office of the President, we believe that quantifying variations in the per‑student amounts among the campuses is necessary so that stakeholders have assurance that public funding is being equitably distributed.
Because the Office of the President does not distribute the State’s General Fund appropriation separately, but includes it as part of the general funds and tuition budget, we analyzed how the Office of the President distributed the general funds and tuition budget to the campuses. To improve the accuracy of this analysis, we subtracted three items included in the general funds and tuition budget that were not related to enrollment of state‑supportable students: nonresident tuition, outreach programs to potential students, and a portion of overhead revenues for federal contracts and grants. After this adjustment, the primary state appropriation, including federal fiscal stabilization funding, made up nearly 70 percent of the revenue in the university’s general funds and tuition budget in fiscal year 2009–10, with most of the remaining revenue coming from tuition paid by students.
The amount of the general funds and tuition budget that the Office of the President has permanently budgeted to each campus on a per‑student basis varies significantly. For fiscal year 2009–10, the amount budgeted per student ranged from $12,309 at the Santa Barbara campus to $55,186 at the San Francisco campus. Table 5 shows the per‑student general funds and tuition budget and the difference between each campus’s share of the university general funds and tuition budget and its share of university enrollment.
As Table 5 shows, four campuses—Berkeley, Davis, Los Angeles, and San Francisco—received greater shares of the budget per student than their corresponding share of enrollment. These budgets resulted in the four campuses receiving, respectively, $11.5 million, $30.2 million, $99.2 million, and $156.3 million in general funds and tuition budget amounts above the average amount per student for their share of enrollment. The remaining six campuses had lower‑than‑average amounts per student.
The Office of the President stated that several factors that contributed to the differences in per‑student amounts among the campuses and provided information related to four of them: specific research and public service programs budgeted separately
The historic allocation processes favored campuses with larger graduate student populations—namely, Berkeley, Davis, Los Angeles, and San Francisco received a greater‑than‑average share of the general funds and tuition budget.

33California State Auditor Report 2010-105
July 2011
from instruction, the size of a campus’s health sciences program, historical variations in the amount of support provided for graduate students, and historical variations in the level of state support.
With respect to the first factor, the Office of the President indicated that some campuses operate research and public service programs that are separate from instructional programs. It noted that the funding for these programs is included in the general funds and tuition budget and would contribute to variances in the per‑student distribution of the budget among the campuses. However, the Office of the President stated that because allocations for such programs have been made incrementally over many years and because it does not review campus base budgets as part of the incremental budget process, it does not currently have a complete list of these programs that should be excluded from per‑student funding calculations or a calculation of the amount of the base budget for these programs on each campus.
Table 5University of California Campuses’ Share of the General Funds and Tuition Budget Compared to Their Share of Enrollment Fiscal Year 2009–10
CAMPUS
UNIVERSITY GENERAL FUNDS AND TUITION BUDGET PER STATE‑SUPPORTABLE
STUDENT
SHARE OF GENERAL FUNDS
AND TUITION BUDGET
SHARE OF STATE‑SUPPORTED
ENROLLMENT
BUDGET OVER (UNDER) SHARE OF
ENROLLMENT (DOLLARS IN THOUSANDS)
Berkeley $17,010 15.0% 14.6% $11,469
Davis 17,660 14.8 13.9 30,197
Irvine 14,008 10.5 12.5 (70,103)
Los Angeles 19,529 18.9 16.1 99,232
Merced 16,550 1.6 1.6 (315)
Riverside 14,319 7.3 8.5 (42,412)
San Diego 15,670 12.2 12.9 (26,861)
San Francisco 55,186 6.3 1.9 156,250
Santa Barbara 12,309 7.6 10.2 (94,645)
Santa Cruz 12,846 6.0 7.7 (62,812)
Source: Bureau of State Audits’ analysis of budget and enrollment data provided by the University of California Office of the President.
Note: Enrollment includes students in state‑supportable programs and excludes nonresident students and students in self‑supporting programs.
The Office of the President also stated that health sciences programs are significantly more expensive than general campus programs, and that campuses with health sciences programs have a higher level of funding per health sciences student than per student funding in
California State Auditor Report 2010-105
July 2011
34
general campus programs. San Francisco is solely a health sciences school enrolling only graduate students, which appears to explain why its per‑student share of the general funds and tuition budget is so much higher than the average. As shown in Table 6, the three campuses with the highest proportion of students in health sciences programs are also those with the highest general funds and tuition budget provided per student: San Francisco, Los Angeles, and Davis. Further, three of the four campuses that receive the lowest allocation of the general funds and tuition budget have few to no health sciences students.
Additionally, the Office of the President stated that historic allocation processes recognized the higher costs of educating graduate students and compensated campuses accordingly for enrolling larger graduate student populations. Prior to the 1990s, the university allocated a portion of the general funds and tuition budget based on enrollment levels, but it weighted the allocations of faculty salaries in favor of graduate students, based on the fact that graduate programs require a lower student‑to‑faculty ratio. Consequently, campuses with larger graduate student populations (namely, Berkeley, Davis, Los Angeles, and San Francisco) received a greater share of the general funds and tuition budget. Due to the university’s incremental budget process, the historic adjustment to account for graduate student enrollments is built into the current base budget received by each campus. According to the director of operating budget, during the mid‑1990s, the university stopped weighting the allocation of new funding for enrollment growth based on graduate student populations, but it did not subsequently evaluate the base budgets to determine whether they were still appropriate. As mentioned earlier, the university made an explicit decision to not revisit campus base budgets, but to rely on the incremental budget process. As a result, the campus base budgets are still weighted toward the graduate enrollments that existed before the mid‑1990s, regardless of their current enrollment levels and mix of graduate and undergraduate students. For example, the Berkeley, Davis, Los Angeles, and San Francisco campuses had the highest proportions of graduate students in fiscal year 1989–90. As Table 6 shows, these four campuses still had the highest proportions of graduate students in fiscal year 2009–10 and they continued to receive the largest amount of the university general funds and tuition budget per student in fiscal year 2009–10.
Lastly, the Office of the President indicated that the amount of state funding provided for enrollment growth has varied over time. The Office of the President stated that historically the amount of state funding provided for enrollment growth was higher (after accounting for inflationary adjustments) than it has been in recent years. As a result, campuses that have experienced growth more recently may have a relatively smaller base budget on a per‑student basis than the campuses whose enrollments have grown in earlier years. The Office
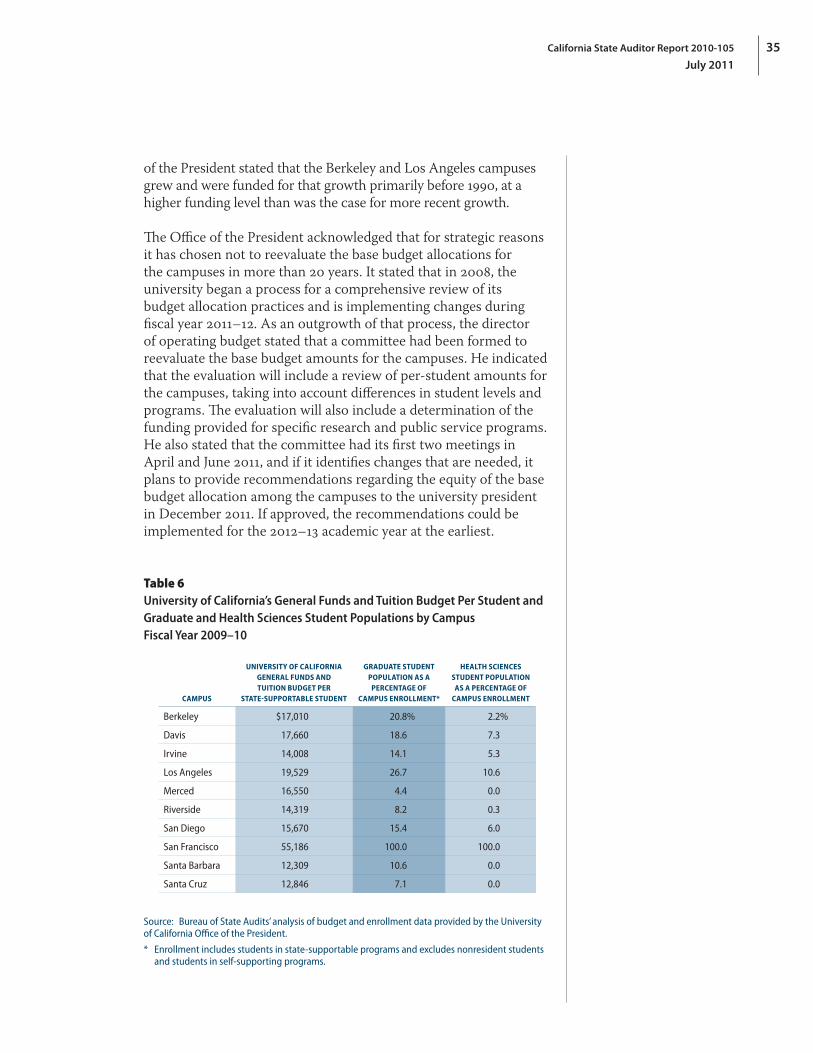
35California State Auditor Report 2010-105
July 2011
of the President stated that the Berkeley and Los Angeles campuses grew and were funded for that growth primarily before 1990, at a higher funding level than was the case for more recent growth.
The Office of the President acknowledged that for strategic reasons it has chosen not to reevaluate the base budget allocations for the campuses in more than 20 years. It stated that in 2008, the university began a process for a comprehensive review of its budget allocation practices and is implementing changes during fiscal year 2011–12. As an outgrowth of that process, the director of operating budget stated that a committee had been formed to reevaluate the base budget amounts for the campuses. He indicated that the evaluation will include a review of per‑student amounts for the campuses, taking into account differences in student levels and programs. The evaluation will also include a determination of the funding provided for specific research and public service programs. He also stated that the committee had its first two meetings in April and June 2011, and if it identifies changes that are needed, it plans to provide recommendations regarding the equity of the base budget allocation among the campuses to the university president in December 2011. If approved, the recommendations could be implemented for the 2012–13 academic year at the earliest.
Table 6University of California’s General Funds and Tuition Budget Per Student and Graduate and Health Sciences Student Populations by Campus Fiscal Year 2009–10
CAMPUS
UNIVERSITY OF CALIFORNIA GENERAL FUNDS AND TUITION BUDGET PER
STATE‑SUPPORTABLE STUDENT
GRADUATE STUDENT POPULATION AS A
PERCENTAGE OF CAMPUS ENROLLMENT*
HEALTH SCIENCES STUDENT POPULATION
AS A PERCENTAGE OF CAMPUS ENROLLMENT
Berkeley $17,010 20.8% 2.2%
Davis 17,660 18.6 7.3
Irvine 14,008 14.1 5.3
Los Angeles 19,529 26.7 10.6
Merced 16,550 4.4 0.0
Riverside 14,319 8.2 0.3
San Diego 15,670 15.4 6.0
San Francisco 55,186 100.0 100.0
Santa Barbara 12,309 10.6 0.0
Santa Cruz 12,846 7.1 0.0
Source: Bureau of State Audits’ analysis of budget and enrollment data provided by the University of California Office of the President.
* Enrollment includes students in state‑supportable programs and excludes nonresident students and students in self‑supporting programs.
California State Auditor Report 2010-105
July 2011
36
The Office of the President further stated that it is a goal of the university that all campuses achieve the level of excellence in teaching, research, and public service achieved by the Berkeley and Los Angeles campuses, although each in its own unique areas, and that while other campuses receive a lower amount of funding per student due to the factors discussed previously, without a significant increase in investment from the State, it would be problematic to equalize funding. It further stated that the university does not wish to jeopardize the achievements of the Berkeley and Los Angeles campuses by shifting funds away to other campuses in an effort to provide an equal amount of the general funds and tuition budget per student. The Office of the President noted that reducing funding at some campuses to increase funding at others is undesirable for two primary reasons. First, it noted that the university considers funding for the campuses to be a long‑term investment, including the hiring and retaining of faculty. The Office of the President indicated that faculty layoffs would damage the investment that has been made in developing the faculty at the campuses, and that the university has a policy against dismissal of faculty for any reason other than good cause. Second, it noted that the university wishes to foster the achievement of excellence by all of the campuses, and that removing funding from the Berkeley and Los Angeles campuses could jeopardize those two campuses’ achievements.
Although the explanations it provided for the variances in per‑student amounts appear reasonable, the Office of the President has not been able to fully quantify the differences in the per‑student allocation. For example, the Office of the President indicated that the base budget provided to each campus includes money for specific research and public service programs that are separately budgeted from instruction; however, it indicated that it has not yet determined the amount that is provided to each campus for those programs that should not be included in a calculation of funding per student. It further indicated that there is no agreed‑upon methodology for comparing funding per student either across the system (or in higher education), and that there is no agreement on a method for weighting health sciences enrollments, graduate students, or professional degree programs for which students pay different tuition. It also noted that there is no agreement on how to evaluate the research and public service programs, which vary in the level to which they complement instruction.
Because the university has not quantified the differences in the base budget provided per student among the campuses and does not have an agreed‑upon methodology for comparing per‑student calculations, stakeholders cannot be assured that the state funding that is the primary component of the base budget is being equitably distributed to the various campuses. We would expect that the university would be able to quantify and account for the various
The Office of the President noted that reducing funding at some campuses to increase funding at others is undesirable.

37California State Auditor Report 2010-105
July 2011
factors that affect the level of funding provided to a campus, such as those described previously, and determine the amount provided for each type of student. After adjusting for these factors, such as specific research programs and varying types of academic programs such as health sciences, the university should be able to calculate the amount provided to each student on a comparable basis. However, the university has not done so.
To consider the potential effects of the Office of the President’s inability to quantify the impact of the four factors it identified on variations in the per‑student budget, we reviewed the racial and ethnic makeup of the campuses’ enrollments and the per‑student budget amounts for each campus for fiscal year 2009–10. We acknowledge that decisions from the university’s budget, admissions, and enrollment processes are relatively independent of one another and that different people are involved in each of these processes. Budget decisions involve the regents, the Office of the President, and the campuses; admissions decisions involve campuses and applicants; and enrollment decisions involve applicants and their families. When considered together, however, it is reasonable to conclude that the decisions resulting from these three processes can affect the education an individual student receives from the university. As the Office of the President noted previously, one of its goals is for all campuses to achieve the level of excellence achieved by the Berkeley and Los Angeles campuses.
Although we found no evidence that the Office of the President considered the racial or ethnic makeup of the campuses’ enrollments as part of its budget process, the process resulted in lower‑than‑average per‑student base budgets for the four campuses that have a higher proportion of students from underrepresented racial or ethnic groups. As summarized in Table 7 on the following page, the Merced, Riverside, Santa Barbara, and Santa Cruz campuses all enrolled a higher‑than‑average proportion of students from Hispanic, Black, American Indian, or Alaskan Native racial or ethnic groups, yet together they received far less per student than those campuses with lower enrollments of these groups. The Office of the President noted that none of these four campuses has a medical school or other significant health sciences programs, and that they have the lowest proportions of graduate students in the system. It also pointed out that each of the other six campuses operated multiple high‑cost instructional programs such as schools of law, business, or health sciences and that all but one of these campuses operated other special programs such as agricultural experimental stations, neuropsychiatric institutes, or oceanographic institutes. Nevertheless, because the per‑student amounts vary so much among the campuses and have not been quantitatively explained, the Office of the President increases the risk that stakeholders may view the per‑student amounts as inequitable.
The budget process resulted in lower‑than‑average per‑student base budgets for the four campuses that have a higher proportion of students from underrepresented racial or ethnic groups.

California State Auditor Report 2010-105
July 2011
38
Table 7University of California’s Per‑Student General Funds and Tuition Budget for Campuses With a Higher or Lower Proportion Than Average of Students From Underrepresented Racial or Ethnic Groups Fiscal Year 2009–10
CAMPUS OR GROUP OF CAMPUSES
STUDENT POPULATION BY RACIAL OR ETHNIC GROUP
GENERAL FUNDS AND TUITION BUDGET PER STATE‑SUPPORTABLE
STUDENT†
DIFFERENCE FROM AVERAGE BUDGET PER STATE‑SUPPORTABLE
STUDENT
TOTAL DIFFERENCE IN ALLOCATION OF
GENERAL FUNDS AND TUITION BUDGET
UNDERREPRESENTED RACIAL OR ETHNIC
GROUPS*
ALL OTHER RACIAL OR
ETHNIC GROUPS
Universitywide 18% 82% $16,644 NA NA
Four campuses with a higher proportion of students from underrepresented racial or ethnic groups than average‡
27 73 13,307 $(3,337) $(200,184,338)
Five campuses with a lower proportion of students from underrepresented racial or ethnic groups than average§
15 85 16,937 294 43,934,186
San FranciscoII 12 88 55,186 38,542 156,250,152
Sources: Bureau of State Audits’ analysis of budget and enrollment data provided by the University of California (university) Office of the President, and the university’s Integrated Postsecondary Education Data System survey submissions for fall 2009.
NA = Not applicable.
* Underrepresented racial or ethnic groups include Hispanic, Black (non‑Hispanic), American Indian, and Alaskan Native.† Enrollment includes students in state‑supportable programs and excludes nonresident students and students in self‑supporting programs.‡ Includes the Merced, Riverside, Santa Barbara, and Santa Cruz campuses.§ Includes the Berkeley, Los Angeles, San Diego, Irvine, and Davis campuses.II San Francisco is listed separately because it has a student population that includes only graduate students in the health sciences, which
distinguishes it from the other nine campuses.
The University Could Improve the Transparency of Its Process for Calculating and Allocating Funding to Campuses
The university can improve the transparency of its budget process by making available more information about its budget policies and the amounts and calculations for campus budgets. Transparency is perceived to be beneficial to the operation of an organization and to the organization’s stakeholders. When organizations operate transparently, stakeholders are able to access greater amounts of information that help hold decision makers accountable for their decisions. Conversely, an absence of transparency can lower the level of accountability. The promotion of accountability through improved public information was one of several recommendations made by the National Commission on the Cost of Higher Education, established by the U.S. Congress. After observing that financial decisions made in higher education institutions are often not transparent, the commission recommended that the academic community develop better consumer information about costs and prices to improve these institutions’ accountability to the general public.
39California State Auditor Report 2010-105
July 2011
The university also acknowledges the benefits of accountability. In establishing his recent accountability program, the university president stated that the university should be accountable to taxpayers, students, parents, and the Legislature. Since the launch of this program, the university has released three annual accountability reports, which were written in part to “promote and reflect the university’s commitment to be open and accountable to all Californians.” The most recent of these reports included presentations on the university’s budget, including revenue and expense information. However, they lacked information about the process used to budget funding for the campuses. The Office of the President stated that the accountability report is focused on outcomes, not processes.
Although the Office of the President has recently made efforts to improve the transparency of its budget, it could do more to improve the transparency of the processes it uses to budget funding amounts for the campuses. In recent years, the Office of the President’s budget letters to the campuses’ chancellors have included more details about how it calculated budget amounts than in prior years. The Office of the President also stated that it presented information on the budget process to the campuses. However, the budget process and methodologies for determining budget amounts are not readily available to stakeholders among the general campus community. This reduces stakeholders’ ability to understand how campuses’ funding is budgeted and to hold the university accountable for its method of budgeting funding. According to the director of operating budget, the reason for not making the university’s methods more widely available is that the methodologies are highly complex and evolving and require a strong baseline knowledge of the financial operations of the system. Furthermore, he stated that the Office of the President’s budget allocations are incomplete because they presume a working knowledge of the context and issues leading to allocation decisions. He indicated that the Office of the President does not publish its budget methods to prevent such a complex topic from being inappropriately interpreted, and stated that campus budget offices are better equipped to answer questions from their local communities. However, we believe this approach runs contrary to the university’s stated commitment to be open and accountable to all Californians.
The limited transparency of the university’s budgeting process also presents a risk due to the varying amounts of the general funds and tuition budget that the university provides to each campus. As previously discussed, the campuses receive different per‑student amounts of the general funds and tuition budget, and the Office of the President has identified four factors that it believes contributed to these variations. However, because the
Although the most recent reports released by the university included presentations of its budget, they lacked the information about the process used to budget funding for the campuses.
California State Auditor Report 2010-105
July 2011
40
Office of the President does not provide details about its budget process, university stakeholders cannot sufficiently evaluate this process and do not have sufficient information to determine if the university’s allocation of state funding is equitable. This raises the risk that stakeholders may view the process as wrongly favoring or disfavoring particular campuses. Such conclusions, especially when made public, may divert university staff from their core responsibilities as they respond to them and may ultimately harm the university’s reputation.
The Office of the President has developed revisions to its budget process that it states it will implement in fiscal year 2011–12. This revised process, portions of which we discuss in Appendix A, will, according to the university, move it toward improving this transparency issue. Under the new policy, each campus will be assigned a revenue budget for individual components of the general funds fund group, thus making it easier to record, monitor, and report information about the amount of revenues budgeted.
A further issue is that the Office of the President has not fully documented its budget policies. According to the director of operating budget, the university formerly had a manual for its budgeting process, but it became outdated as more authority was transferred from the Office of the President to the campus chancellors. Furthermore, according to the director of operating budget, the university has been faced with rapidly shifting circumstances over the years, requiring adjustments to allocation policies and methodologies on a frequent basis. Because of these rapidly changing circumstances, he stated that the university has relied on annual allocation letters from the president to the chancellors to explain methodologies and clarify policies. Without a current budget manual, staff at the Office of the President lack formal criteria for determining campus budgets. For example, when explaining why the Office of the President changed the enrollment estimates used to calculate budget amounts for four campuses for fiscal year 2007–08, the director of operating budget recalled that amounts for three campuses were adjusted down because the governor’s proposed enrollment growth targets were lower than the university had requested. He also stated that he did not recall why the amount for the fourth campus was increased but said that it seemed that the campus increased its enrollment significantly during fiscal year 2007–08. Nevertheless, without an established policy for adjusting enrollment growth targets as a basis for adjusting budget calculations, stakeholders have less assurance that the university is not making arbitrary decisions that favor one campus over another.
Not providing details about the budget process raises the risk that stakeholders may view the process as wrongly favoring or disfavoring particular campuses.
41California State Auditor Report 2010-105
July 2011
The State’s and the University’s Departures From Long‑Term Enrollment and Funding Plans Resulted in Unfunded University Costs
Various planning documents and budget appropriations help determine the university’s enrollment levels. The Master Plan for Higher Education (master plan) instructs the university, as the highest level of public higher education in California, to select from among the top‑performing 12.5 percent of California high school graduates who apply to the system. The Higher Education Compact (compact) between the university and the former governor, in effect from fiscal years 2005–06 through 2010–11, laid out a funding plan to ensure that the university had the resources to continue providing education in accordance with the master plan. The compact includes an agreement that the State would provide the university with funding to increase enrollment by 5,000 students during each year in which the compact is in effect. However, the document that actually provides state funding to the university is the annual budget act. The budget act language that increases the number of students the State will typically fund includes a requirement that the university return a portion of the funding for enrollment growth to the State if the university fails to achieve its enrollment target. Consequently, the university has a strong incentive to ensure that it enrolls at least that number of students.
Every year, the governor’s proposed budget typically includes an enrollment target for the university. In three of the five years we looked at, this target was based on the 5,000 student enrollment growth specified in the compact. However, in fiscal years 2008–09 and 2009–10, the State did not provide funding for these enrollment increases in the respective budget acts. The university asserted that in each fiscal year from 2006–07 to 2009–10 it enrolled more students than the State budgeted for in its appropriation to the university. According to the director of operating budget, the university continued to enroll students beyond the level provided by state funding to afford access for the students specified in the master plan, though it did take steps to slow enrollment growth in fiscal years 2009–10 and 2010–11.
The university’s director of operating budget stated that for fiscal year 2009–10 the Office of the President asked campuses to curb their enrollment of incoming freshmen. The university’s intent was to begin bringing enrollment levels more in line with available resources and state funding. The director also indicated that when campuses were unable to achieve enrollment reductions to the level requested, the university president considered imposing punitive measures against campuses for fiscal year 2011–12 but ultimately decided not to do so in light of other funding constraints and changes in the public higher education environment in California.

California State Auditor Report 2010-105
July 2011
42
Table 8 shows the fiscal impact of the university’s enrollment, broken down by the number of students that would have been funded according to the former governor’s commitment in the compact and the university’s enrollment above the growth agreed upon in the compact. For fiscal years 2005–06 through 2007–08, the State generally funded enrollment growth according to the terms of the compact. However, for fiscal years 2008–09 and 2009–10, it provided no funding in the budget acts for enrollment growth. Consequently, as of fiscal year 2009–10, the State had not provided nearly $110 million in enrollment growth funding that the former governor committed to in the compact. In addition, the university’s enrollment of students beyond the agreed‑upon growth factor resulted in costs of more than $56 million that state funding would have otherwise covered.
Table 8University of California’s Actual Enrollment and Funding of Students Versus Enrollment and Funding Agreed Upon in the Higher Education Compact Fiscal Years 2005–06 Through 2009–10
FISCAL YEARS
2005–06 2006–07 2007–08 2008–09 2009–10
Total Enrollment of Students Normally Funded by the State* 188,285 197,091 203,906 210,558 213,589
Students funded by state appropriations 187,676 193,455 198,455 198,455 198,455
Students enrolled but not funded by state appropriations 609 3,636 5,451 12,103 15,134
Breakdown of Students Not Funded
Students who should have been funded per Higher Education Compact (compact) 5,000 10,000
Over (under) funding by the State (dollars in thousands)† $(54,840) $(109,670)
Enrollment above growth levels agreed upon in compact 609 3,636 5,451 7,103 5,134
Marginal cost of excess enrollment (dollars in thousands)† $4,585 $35,996 $57,694 $77,906 $56,305
Total Funding Gap (dollars in thousands) $4,585 $35,996 $57,694 $132,746 $165,975
Sources: Bureau of State Audits’ analysis of governor’s budgets, annual budget acts, and the compact in effect from fiscal years 2005–06 through 2010–11.
* Enrollment includes only state‑supportable students.† Underfunding per the compact and marginal cost of excess enrolled students are based on the agreed‑upon calculation of the annual marginal cost
of instruction for enrollment growth.
To make up for this funding gap, the university had to either raise funding from other revenue sources, such as tuition, or operate without the funding, thus hindering its ability to maintain the quality of the education it offers. Rather than sacrificing quality, the university has repeatedly increased tuition rates in recent years. Although portions of the tuition increases help the university cover the costs of these students above the agreed‑upon enrollment

43California State Auditor Report 2010-105
July 2011
growth, the increases also help offset losses in funding that the former governor agreed to provide according to the compact, but recent budgets have omitted.
Recommendations
To address the variations in per‑student funding of its campuses, the university should complete its reexamination of the base budgets to the campuses and implement appropriate changes to its budget process. As part of its reexamination of the base budget, it should:
• Identify the amount of general funds and tuition budget revenues that each campus receives for specific types of students (such as undergraduate, graduate, and health sciences) and explain any differences in the amount provided per student among the campuses.
• Consider factors such as specific research and public service programs at each campus, the higher level of funding provided to health sciences students, historical funding methods that favored graduate students, historical and anticipated future variations in enrollment growth funding, and any other factors applied consistently across campuses.
• After accounting for the factors mentioned earlier, address any remaining variations in campus funding over a specified period of time.
• Make the results of its reexamination and any related implementation plan available to stakeholders, including the general public.
To help improve accountability in the university’s budget process, and to help minimize the risk of unfair damage to its reputation, the university should take additional steps to increase the transparency of its budget process. Specifically, the Office of the President should:
• Continue to implement the proposed revisions to its budget process.
• Update its budget manual to reflect current practices.
• Make its revised budget manual, including relevant formulas and other methodologies for determining budget amounts, available on its Web site.

California State Auditor Report 2010-105
July 2011
44
• Continue its efforts to increase the transparency of its budget process beyond campus administrators to all stakeholders, including students, faculty, and the general public. For example, the Office of the President could make information related to its annual campus budget amounts, such as annual campus budget letters and related attachments, available on its Web site.

45California State Auditor Report 2010-105
July 2011
Chapter 3
ALTHOUGH THE UNIVERSITY HAS NUMEROUS PROCESSES TO PROVIDE DETAILED ACCOUNTABILITY FOR VARIOUS TYPES OF FUNDING, IT COULD IMPROVE THE TRANSPARENCY OF ITS FINANCIAL OPERATIONS
Chapter Summary
The University of California (university) Office of the President (Office of the President) maintains extensive accounting records in its corporate financial system that document the university’s annual financial operations. Among other things, the Office of the President uses these records to prepare the university’s annual financial statements. These records also show whether restrictions have been placed on revenues. When revenues are restricted, the university must spend them for specific purposes. For instance, the university generally must spend funding from the federal government for the purposes described by the terms of the federal contracts and grants, such as research. The university’s records show that less than 40 percent of the public revenues accounted for by the Office of the President are restricted. The university can use the rest of its public revenues at its discretion.
The university provides financial data in its annual campus financial schedules; however, in some cases providing additional information or providing it more consistently would improve transparency. For example, the university could provide beginning and ending balance information for individual funds and could publish consistent revenue and expense information for its auxiliary enterprises, such as the student bookstores. Additionally, the Office of the President does not have detailed records of how the university spent about one fourth of its public noncompensation expenses. Instead, the Office of the President uses a single expense code—Miscellaneous Services—that included nearly $6 billion for the five years from fiscal years 2005–06 through 2009–10.
Despite the intent that auxiliary enterprises be self‑supporting, a December 2010 change in policy has given campuses the authority to subsidize them with funding from other revenue sources, including public funding. Because of this change, greater transparency in reporting the financial operations of auxiliary enterprises would better allow stakeholders to hold the university accountable for this new use of funding.
We reviewed the university’s practices for guaranteeing debt to fund capital projects and found no cause for concern. We also noted that the university’s practice is consistent with that of another major
California State Auditor Report 2010-105
July 2011
46
university system. However, we discovered two instances in which the university designated a total of $23 million in student funding restricted by a referendum to help pay for capital projects on the Los Angeles campus; as of April 2011 the Los Angeles campus stated that it had spent $5.2 million of this funding for one of the projects. In these instances, the university designated the funding to be used for purposes not authorized by the referendum.
The university also receives hundreds of millions of dollars each year for contract and grant overhead. The university used this funding for several purposes, including institutional support, instruction, and research. Further, certain federal policies allow increases in federal grant funding over time. However, in years when the State did not provide funding for across‑the‑board salary increases, the university did not provide increases for staff at large.
The University Maintains Extensive Financial Records, but Certain Records Are Not Disclosed and Others Lack Important Details
The Office of the President maintains records in its corporate financial system that it uses to prepare the university’s annual financial statements. These records include detailed information regarding revenues and expenses for about 100,000 funds, and a record of revenues that have restrictions on their use. Although the university’s financial statements and campus financial schedules present a significant amount of financial information, they are not sufficiently detailed or presented in a format to enable a reader to determine the financial performance of individual components of the university. Further, the Office of the President uses only a single accounting code, Miscellaneous Services, to account for an average of about $1 billion in annual campus expenses.
The University Maintains Detailed Records of Revenues, Expenses, Transfers, and Beginning and Ending Balances
The university maintains financial records for more than 32,000 funds related to our audit scope. These records contain information related to revenues, expenditures, transfers, and beginning and ending balances. These funds are classified into 46 fund groups, which are further grouped into nine fund categories used for financial reporting. For example, the Los Angeles campus has a fund to account for revenue from the application fees for its school of law. The university includes this fund in the law fees fund group with similar funds from other campuses. The law fees fund group falls under the tuition and fees fund category for financial reporting. Table 9 shows the number of funds and fund groups within our scope for each of the nine fund categories used for financial reporting.
We discovered two instances in which the university designated $23 million in student funding to help pay for capital projects on the Los Angeles campus—purposes not authorized by the referendum.

47California State Auditor Report 2010-105
July 2011
Table 9Number of Fund Groups and Funds, by Category, for Which the University of California Maintains Records of Public Funding Fiscal Year 2009–10
FUND CATEGORY NUMBER OF FUND GROUPS NUMBER OF FUNDS
General funds 1 264
Tuition and fees 20 725
Federal government 8 21,258
Sales and services of auxiliary enterprises 1 397
Special state appropriations and contracts 4 3,514
Local government 2 1,415
University opportunity funds* 1 121
Other sources 8 3,803
Reserves 1 530
Totals 46 32,027
Source: Bureau of State Audits’ analysis of the University of California’s (university) accounting data from the corporate financial system.
* University policy states that this fund should be used primarily for high‑priority research and instructional needs.
For each fund, the Office of the President maintains records with details about the sources of revenue and the categories of expense. As an example, Table 10 on the following page shows a summary of the fiscal year 2009–10 accounting data for the general fund 19900 at the Berkeley campus. The data show that there were revenues in four account group categories (such as tuition and fees) and five subordinate revenue account groups (such as $783,000 in application for admission). The table also shows the expense categories to which expenses were recorded, such as instruction and academic support. With this information, university stakeholders can determine whether revenues exceed expenses in a given fiscal year.
In addition to detailed revenue and expense information, the university financial records include the amounts transferred into or out of each fund, and the beginning and ending balances. In conjunction with the operating revenues and expenditures, the net transfers into or out of the fund determine the change in the fund’s balance for the fiscal year. In the example in Table 10, the general fund 19900 at the Berkeley campus spent significantly less than it received in revenues and the $78 million it transferred out. This change shows that the campus rebuilt a positive ending balance during the fiscal year. The net effect of the activities for the fiscal year was a roughly $73 million increase in the ending balance, from a $64 million negative balance at the beginning of fiscal year 2009–10 to a positive balance of more than $9 million at the end of the fiscal year.

California State Auditor Report 2010-105
July 2011
48
Table 10Accounting Information for the University of California, Berkeley General Fund 19900 Fiscal Year 2009–10 (in Thousands)
Beginning Balance $(63,645)
REVENUES
Revenue Account Group Category Revenue Account Group
Tuition and feesApplication for admission $783
Other general fund student fees 390
State government California general support 387,733
Sales and services of educational activities Educational activity 64
Other sources Other 41
Total Revenues $389,011
EXPENDITURES
Expenditure Category
Instruction $(127,017)
Research (25,623)
Public service (1,209)
Academic support (32,540)
Student services 360
Institutional support (37,137)
Maintenance and operation of plant (8,287)
Student aid (6,498)
Total Expenditures $(237,949)
Total Transfers $(78,253)
Ending Balance $9,163
Source: Bureau of State Audits’ analysis of the University of California’s accounting data from the corporate financial system.
Note: Totals may differ slightly due to rounding.
The Majority of Public Fund Revenues Can Be Used at the University’s Discretion
During fiscal years 2005–06 through 2009–10, the university reported funds in its financial statements as either restricted or unrestricted pursuant to a requirement issued by the Governmental Accounting Standards Board (GASB).10 The university stated that it used the GASB definition for restricted funds: funds with constraints on their use that either are externally imposed by creditors (such as through debt covenants), grantors, contributors, or laws or regulations of other governments or are imposed by
10 GASB is the independent organization that establishes standards of accounting and financial reporting for state and local governments.
49California State Auditor Report 2010-105
July 2011
law through constitutional provisions or enabling legislation. The university classified the remaining funds as unrestricted. GASB also notes that unrestricted funds may be further classified as designated to indicate that management does not consider them to be available for general operations. However, it states that in contrast to restricted funds, these constraints are placed internally and can be removed or modified by management. GASB further specifies that designations of unrestricted funds should not be included in the financial statements.
From fiscal years 2005–06 through 2009–10, financial information from the corporate financial system shows that the university classified from 36 percent to 38 percent of its public revenues as restricted. These public revenues consisted primarily of federal government contracts and grants. The corporate financial system also shows that the university classified the remaining 62 percent to 64 percent of public revenue either as unrestricted or as unrestricted and designated. The Office of the President stated that it does not use the “designated” distinction for any purpose other than to indicate that the funding is not in the general funds fund group. The Office of the President also stated that the classification of funds as either unrestricted or designated has no impact on how the funding is used; it may allocate funding of either type specifically for a particular function or activity.
The university’s classification of public funding in its corporate financial system as restricted appears reasonable. More than 99 percent of revenues classified as restricted funds stemmed from federal government sources, special state appropriations and contracts, and local government sources during fiscal years 2005–06 through 2009–10.
More Detailed Financial Information Can Be Useful
Transparent government operations promote accountability by making information available to stakeholders, including the public, who can then help hold decision makers accountable. The university has recognized the benefits of transparency and accountability in its own policies. The university’s systemwide accounting manual states that because the university is one entity with multiple campuses, “financial information must be recorded and reported on a consistent basis. Also, all campuses should follow uniform procedures when handling transactions that relate to the State of California or the Federal government.”
More than 99 percent of revenues classified as restricted funds stemmed from federal government sources, special state appropriations and contracts, and local government sources.
California State Auditor Report 2010-105
July 2011
50
The university publishes campus financial information annually in campus financial schedules. Although these schedules provide information that is useful for helping a user to understand a campus’s financial operations, they lack sufficient detail for a more complete understanding of the finances of many specific aspects of university operations, and their presentation is not always consistent. In particular, the schedules do not include beginning and ending balances. This balance information would allow users to review the financial performance of a university component and its associated fund or group of funds from year to year. For instance, it would allow for the identification of funds that have negative balances or that are in danger of having a negative balance in the near future.
Intercollegiate athletics at the Berkeley campus, for example, had a negative ending balance that sank to a deficit of more than $31 million over several years before the campus eliminated the deficit in fiscal year 2006–07.11 If fund‑specific information had been more readily available, stakeholders would have had the opportunity to identify the deficit spending sooner, hold the campus accountable, and inquire as to how the campus was planning to address the situation. Without this type of fund information, stakeholders do not have all the information they need to monitor the university’s financial performance.
Further, the campus financial schedules do not present information consistently in a way that allows for comparison. For example, the Office of the President reports revenues for auxiliary enterprises using categories that do not always match the categories used for auxiliary enterprise expenses. For one campus’s financial schedules, the Office of the President reported revenues for auxiliary enterprises in six broad categories, which included a student union and bookstore category. However, the financial schedules for the same campus’s auxiliary enterprises did not include expenses for the student union and bookstore. Because of this type of inconsistency, users of the campus financial schedules cannot easily determine whether an auxiliary enterprise is breaking even, making a profit, or operating at a loss.
On our Web site, the section linking to this audit report also includes a link to a Web page (www.bsa.ca.gov/reports/2010‑105/)that provides stakeholders additional information for reviewing the financial operations of the university. This Web page summarizes financial data from the university’s corporate financial system for fiscal year 2009–10. These data provide information to help users
11 According to documents issued by the Berkeley campus’s athletics director, starting in 2007 all deficits for intercollegiate athletics will be the sole responsibility of the athletics department.
Because of inconsistencies, users of the campus financial schedules cannot easily determine whether an auxiliary enterprise is breaking even, making a profit, or operating at a loss.

51California State Auditor Report 2010-105
July 2011
better understand the general financial performance of each public fund. We present these data for the funds in the categories listed in Table 9. Further, we present the data elements shown in Table 10 for each fund.
Expenses Assigned to the Miscellaneous Services Code Need More Description
Two documents describe the university’s approach to its financial reports. In its statement of ethical values and standards of ethical conduct,12 the university acknowledges that its financial reports must be accurate, clear, and complete. Further, in its systemwide accounting manual, the university says that accounting object codes, which are used to record the nature of each expenditure, are used to accumulate expenditures for the annual financial report and for special studies of expenditures. However, as shown in Figure 2 on page 26, the university uses a single accounting code, Miscellaneous Services, to account for about $6 billion in expenses, or approximately 25 percent of its public noncompensation expenses over the five‑year period reviewed. Lumping such a large amount into a single accounting code in its corporate financial system impedes the ability of the university and its stakeholders the opportunity to analyze and understand these expenses at a systemwide level.
The university has not created specific accounting codes to separately identify the types of expenses that it groups together in the Miscellaneous Services code. In addition, the university’s systemwide accounting manual provides little direction in describing the Miscellaneous Services code. It identifies only “advertising, outside consultant’s fees, etc.” to be assigned the code. According to the Office of the President’s director of corporate accounting, while individual campuses may have object codes they use to account for expenses that are eventually rolled up into the Miscellaneous Services accounting code, the Office of the President cannot provide greater detail about expenses charged at the systemwide level. The director explained that the code is used to account for expenses for everything that the university has deemed not in need of independent reporting, such as consulting services.
In contrast to the university’s grouping of these expense items under a single object code, the State requires greater detail in its accounting system. In its Uniform Codes Manual, the State requires its agencies to account for their expenses related to consultants
12 The Regents of the University of California adopted the university’s statement of ethical values and standards of ethical conduct in May 2005. In this document, the university acknowledges that it is committed to integrity, excellence, accountability, and respect and that the standards apply to all members of the university community.
The Office of the President uses a single accounting code to account for about $6 billion in expenses, or approximately 25 percent of its public noncompensation expenses over the five‑year period reviewed.

California State Auditor Report 2010-105
July 2011
52
through specific object codes. This manual also identifies a separate object code for advertising expenses. Additionally, the university uses other codes to account for certain expenses that are generally of lesser amounts. For example, the object code for Office Furniture/Equipment included expenses that totaled roughly $8 million in fiscal years 2005–06 through 2009–10. Another code, Social Activities and Entertainment, totaled approximately $46 million over the same five‑year time period. More detailed recording of the expenses that it currently accounts for in the Miscellaneous Services code would be consistent with the university’s practice of recording other types of expenses in more detail and following the direction given to state agencies.
The Office of the President Imposes Few Guidelines for the Campuses’ Operation of Auxiliary Enterprises
Policy changes in December 2010 have increased the campuses’ authority over auxiliary enterprises. Although auxiliary enterprises have historically been self‑supporting, these policy changes now allow campuses to subsidize auxiliary enterprises from other revenue sources. Further, the Office of the President delegates oversight of operations, accounting, and financial reporting of the auxiliary enterprises to the campuses.
Auxiliary Enterprises No Longer Must Be Self‑Supporting
As we discuss in the Introduction, the term auxiliary enterprise refers to noninstructional programs within the university that are operated like commercial businesses and offer goods or services for sale. Auxiliary enterprises include programs such as student housing, dining, and parking. At the Berkeley and Los Angeles campuses, intercollegiate athletics departments (athletics) are considered auxiliary enterprises because of the significant amount of revenues that the departments generate through sales to the general public.
Before December 2010 auxiliary enterprises were required to be self‑supporting. However, the athletics department at the Berkeley campus had accumulated a deficit over several years and was not self‑supporting. The Office of the President investigated the matter and ultimately determined that athletics is a hybrid of an auxiliary enterprise and student services. The university established a definition for hybrid auxiliary enterprises in an update to its policies in December 2010. This update also removed the requirement that auxiliary enterprises be self‑supporting, and allows campuses to subsidize any auxiliary enterprise with appropriate available funding. Although auxiliary enterprises are intended to serve students, faculty, and staff by providing goods
The athletics department at the Berkeley campus had accumulated a deficit over several years and was not self‑supporting.

53California State Auditor Report 2010-105
July 2011
and services, they also provide noninstructional support. Because auxiliary enterprises can now be subsidized with other funding, it is important that the university disclose any subsidization that occurs so that stakeholders can hold campuses accountable for this new use of funding.
The Office of the President Relies on Campuses to Oversee Auxiliary Enterprises
The Office of the President does not maintain a list of the auxiliary enterprises within the university, nor could it provide us with the number of auxiliary enterprises. However, our review of records from the university’s corporate financial system identified 280 funds for auxiliary enterprises.13 As indicated in Table 11 on the following page, the largest category of the university’s auxiliary enterprise funds, consisting of 57 percent of the total, is housing. The parking and transportation services, business and student services, and dining services categories make up an additional 25 percent.
Although the Office of the President receives information related to the revenues, expenses, transfers, and beginning and ending balances for each of the 280 auxiliary enterprise funds, it delegates oversight of the operations, accounting, and financial reporting of the auxiliary enterprises to the campuses. Each campus is responsible for the business management functions of its auxiliary enterprises, such as maintaining the accounting records and financial reporting, budget control, and determining the use of auxiliary enterprise profits. The three campuses we contacted—Berkeley, Los Angeles, and San Diego—indicated that they rely on their accounting departments to manage the revenue and expenses of the auxiliary enterprises. In addition, the Berkeley and Los Angeles campuses stated that the planned revenues and proposed expenses are reviewed by the vice chancellor overseeing the auxiliary enterprises, the budget office, and the chancellor. The three campuses further indicated that generally profits are spent on the auxiliary enterprise or the type of enterprise that generated the revenue. For example, the Los Angeles campus stated that if an auxiliary enterprise generated profits, the profits would be reinvested into the enterprise for maintenance and repair projects for an existing facility, for the construction of a new facility, or to increase the quantity or quality of services offered by the auxiliary enterprise.
13 The university’s corporate financial system identified 438 separate funds for auxiliary enterprises. To avoid overestimating the number of auxiliary enterprises, we excluded certain funds from our count. Reasons for exclusion included duplicate fund numbers; funds used only for administrative or accounting purposes, such as those for accumulating reserves or for accruing compensation; and funds for which the university recorded no revenues or expenses in fiscal year 2009–10.
The Office of the President does not maintain a list of the auxiliary enterprises within the university, nor could it provide us with the number of such enterprises—we identified 280 funds for these enterprises.

California State Auditor Report 2010-105
July 2011
54
Tabl
e 11
Esti
mat
ed N
umbe
r of F
unds
Wit
hin
Each
Cat
egor
y of
the
Uni
vers
ity
of C
alifo
rnia
’s A
uxili
ary
Ente
rpri
ses
Fisc
al Y
ear 2
009–
10
CATE
GO
RY
CAM
PUS
OFF
ICE
OF
THE
PRES
IDEN
T A
ND
SY
STEM
WID
ETO
TAL
PER
CEN
TAG
E O
F TO
TAL
BER
KEL
EYD
AVIS
IRV
INE
LOS
AN
GEL
ESM
ERCE
DR
IVER
SID
ESA
NTA
B
AR
BA
RA
SAN
TA
CRU
ZSA
N D
IEG
OSA
N
FRA
NCI
SCO
Hou
sing
2017
929
112
1824
244
115
956
.8%
Park
ing
and
tran
spor
tatio
n se
rvic
es1
53
21
24
12
12
248.
6
Busi
ness
and
stud
ent s
ervi
ces
00
00
02
11
118
023
8.2
Din
ing
serv
ices
41
22
14
01
61
022
7.9
Subt
otal
s25
2314
333
2023
2743
143
228
81.5
%
Conf
eren
ce, e
vent
, and
hot
el se
rvic
es1
02
50
00
11
30
134.
6
Asso
ciat
ed st
uden
ts, s
tude
nt u
nion
s,
and
stud
ent c
ente
rs1
21
10
22
10
20
124.
3
Book
stor
es0
01
01
20
13
30
113.
9
Child
car
e ce
nter
s0
00
01
12
01
40
93.
2
Real
est
ate
and
spac
e re
ntal
02
00
01
10
01
05
1.8
Inte
rcol
legi
ate
athl
etic
s1
00
10
00
00
00
20.
7
Tota
ls28
2718
405
2628
3048
273
280
CATE
GO
RY
DES
CRIP
TIO
N
Hou
sing
Dor
mito
ries,
apar
tmen
ts, a
nd fa
mily
hou
sing
for s
tude
nts a
nd fa
culty
at t
he U
nive
rsity
of C
alifo
rnia
(uni
vers
ity).
Park
ing
and
tran
spor
tatio
n se
rvic
esPa
rkin
g st
ruct
ures
, car
pool
ing
prog
ram
s, an
d bi
cycl
e se
rvic
es.
Busi
ness
and
stud
ent s
ervi
ces
Busi
ness
like
prog
ram
s, in
clud
ing
copi
er a
nd m
ail s
ervi
ces,
stud
ent I
D c
ards
, and
sund
ry sh
ops.
Din
ing
serv
ices
Cafe
teria
s ins
ide
hous
ing
build
ings
, oth
er c
ampu
s‑ru
n ea
terie
s, an
d ca
terin
g se
rvic
es.
Conf
eren
ce, e
vent
, and
hot
el se
rvic
esH
otel
s and
oth
er a
ccom
mod
atio
ns re
nted
to v
isiti
ng fa
culty
, and
eve
nt o
r con
fere
nce
serv
ices
.
Asso
ciat
ed st
uden
ts, s
tude
nt u
nion
s,
and
stud
ent c
ente
rsSt
uden
t gov
ernm
ents
, uni
ons,
and
cent
ers.
Book
stor
esCa
mpu
s boo
ksto
res.
Child
car
e ce
nter
sCh
ild c
are
serv
ices
.
Real
est
ate
and
spac
e re
ntal
Uni
vers
ity‑o
wne
d pr
oper
ty o
r spa
ce th
at is
rent
ed o
ut.
Inte
rcol
legi
ate
athl
etic
sIn
terc
olle
giat
e sp
orts
pro
gram
s at t
he B
erke
ley
and
Los A
ngel
es c
ampu
ses.
Sour
ces:
Bur
eau
of S
tate
Aud
its’ a
naly
sis o
f acc
ount
ing
data
from
the
Uni
vers
ity o
f Cal
iforn
ia’s
corp
orat
e fin
anci
al sy
stem
and
cam
puse
s’ W
eb si
tes.
55California State Auditor Report 2010-105
July 2011
When asked how they guard against the inappropriate use of state funding for auxiliary enterprises, the campuses indicated that they rely on their respective accounting department’s use of certain account codes or funds, and on regular and periodic reviews of accounting records, to ensure that state funding is not inappropriately used to fund auxiliary enterprises. University policy states that campus subsidization should be paid out of appropriate funds. We did not audit these controls, but based on expenditure information provided by the university, it appears as though nonauxiliary enterprise funds were not used inappropriately for auxiliary enterprise expenses from fiscal years 2005–06 through 2009–10. However, the 2010 policy changes that allow campuses to subsidize auxiliary enterprises increases the importance of ensuring that only appropriate funding is used to support auxiliary enterprises.
Although Certain University Policies for Securing Capital Financing Are Appropriate, the University Wrongfully Designated Certain Student Fees to Pay for Two Capital Projects
The university’s student fee policy allows for a referendum process by which the student body can vote to impose a fee on itself, the funding from which will be used for certain agreed‑upon purposes. The university inappropriately designated revenues from a referendum at the Los Angeles campus to help pay for two capital projects despite the fact that the referendum did not authorize the use of the revenues for these projects. Further, in reviewing the university’s bond policies, we determined that state funds were appropriately excluded from revenues used to guarantee the bonds. Although the university pledged tuition revenues to help achieve better interest rates, it did not actually use this funding during fiscal years 2005–06 through 2009–10 for debt payments.
The University Inappropriately Designated Student Fee Revenues to Fund Capital Projects
The Los Angeles campus, the Office of the President, and the Regents of the University of California (regents) designated $23 million from an inappropriate revenue source to help pay for two capital projects, and the Los Angeles campus spent $5.2 million on one of those projects. The university’s policy for campus‑based student fees includes a referendum process that allows students to impose a fee upon themselves by a vote of the student body. Revenues from these fees are then used for certain purposes specified in the referendum. Until 2002 Section 84.20 of the university’s Compulsory Campus‑Based Student Fee Policy stated that all student referendum results are advisory and are subject to
The 2010 policy changes that allow campuses to subsidize auxiliary enterprises increases the importance of ensuring that only appropriate funding is used to support auxiliary enterprises.

California State Auditor Report 2010-105
July 2011
56
final approval by the regents. In 2002 the regents delegated to the university president the authority to approve student referendum results.
Employing this referendum process, in 2000 students at the Los Angeles campus voted to approve the Student Programs, Activities, and Resource Center (SPARC) fee. The SPARC referendum states that the fees must be used for the renovation, expansion, and maintenance of the Men’s Gymnasium and the John Wooden Recreation Center, and for the cost of facility repairs and equipment replacement at the Sunset Canyon Recreation Center and Tennis Courts, the Los Angeles Tennis Center, and Drake Stadium.
However, the university later designated the use of revenues from the SPARC referendum for capital projects not named specifically in the referendum. In 2008 the regents approved the use of $8 million in SPARC fee revenue for construction of the South Campus Student Center. In 2009 the regents indicated in a proposal that they intended to use $15 million in SPARC fee revenue for renovations to the Pauley Pavilion basketball arena. The Los Angeles campus stated that as of April 2011 it had spent $5.2 million in SPARC fee revenues for the South Campus Student Center. As for the planned renovations for the Pauley Pavilion, the Los Angeles campus dropped its intention to use SPARC fee revenues for that project by April 2010.
When the university approves the use of SPARC fee revenue for unauthorized purposes, sufficient funding may not be available for the capital projects for which the SPARC fee revenue was intended. Further, the provisions of the referendum require a reduction in the SPARC fee amount students pay when the debt used for construction of both the Men’s Gymnasium and the John Wooden Recreation Center is fully retired. The university’s use of SPARC fee revenue for unauthorized purposes prolongs the period over which students must pay the higher fee.
The university believes it had the authority to use SPARC fee revenues for these two capital projects. According to the Office of the President, referendum results are advisory under Section 84.20 of the policy, and the regents retain ultimate authority under the State Constitution to impose or modify any and all student fees, including those established by campus‑based referenda. The Office of the President explained that Item 7 of the SPARC fee referendum provided a degree of flexibility when the regents approved the SPARC referendum. Item 7 states that the “Wooden Center Board of Governors and the Student Fee Advisory Committee shall periodically report to the Chancellor and Vice Chancellor‑Student Affairs on their evaluation of the needs of future generations for facilities on campus.”
The university’s use of the Student Programs, Activities, and Resource Center fee revenue for unauthorized purposes prolongs the period over which students must pay the higher fee.

57California State Auditor Report 2010-105
July 2011
The Office of the President also stated that when the regents approved the SPARC fee referendum at a November 2000 meeting, the “approval item” included language defining how Item 7 would be implemented. The approval item stated that SPARC fee revenue could be used for the Men’s Gymnasium and the John Wooden Recreation Center “and similar needs of other student‑fee supported activity and recreational facilities on the Los Angeles campus.” Because the regents approved this language, the Office of the President asserted that using SPARC fee revenue for the South Campus Student Center project and the intended use of SPARC fee revenue for the Pauley Pavilion project were consistent with the referendum language as subsequently defined by the regents’ action.
According to our legal counsel, neither the policies in place when students approved the SPARC fee referendum nor Item 7 of the SPARC referendum provided a sufficient basis for expanding the uses of the fee beyond those purposes stated in the original referendum. While Section 84.20 clearly provides that student‑referendum results are subject to the regents’ approval, our legal counsel does not think that the plain meaning of the authority to “approve” results—which means to express a favorable opinion of the results—also includes the authority to modify the language of the referendum. Regarding Item 7, this provision simply requires periodic reporting regarding the future need for campus facilities. We do not believe that a requirement to report on future campus facility needs reasonably translates into authority to finance future campus facility needs that were not approved by students in the original referendum.
Finally, despite the university’s assertions that it may modify any and all fees, courts have placed restrictions on its ability to do so. In November 2007 a California appellate court upheld a lower court’s award of more than $28 million in damages to current and former students who sued the university for raising various fees.
Although the University Pledges General Revenues to Reduce Interest Rates on Debt, It Uses Specified Sources to Make Debt Payments
While we were performing our fieldwork for this audit, a concern was brought to our attention suggesting that the university was inappropriately pledging student fees as a revenue source to repay debt for capital projects and that the university had actually used tuition revenues to repay the debt. Although the university does indeed pledge general revenues, including tuition and student services fees, when it seeks outside financing in the form of general revenue bonds, we found no evidence that the university actually used tuition revenues to repay the debt.
A California appellate court upheld a lower court’s award of more than $28 million in damages to current and former students who sued the university for raising various fees.
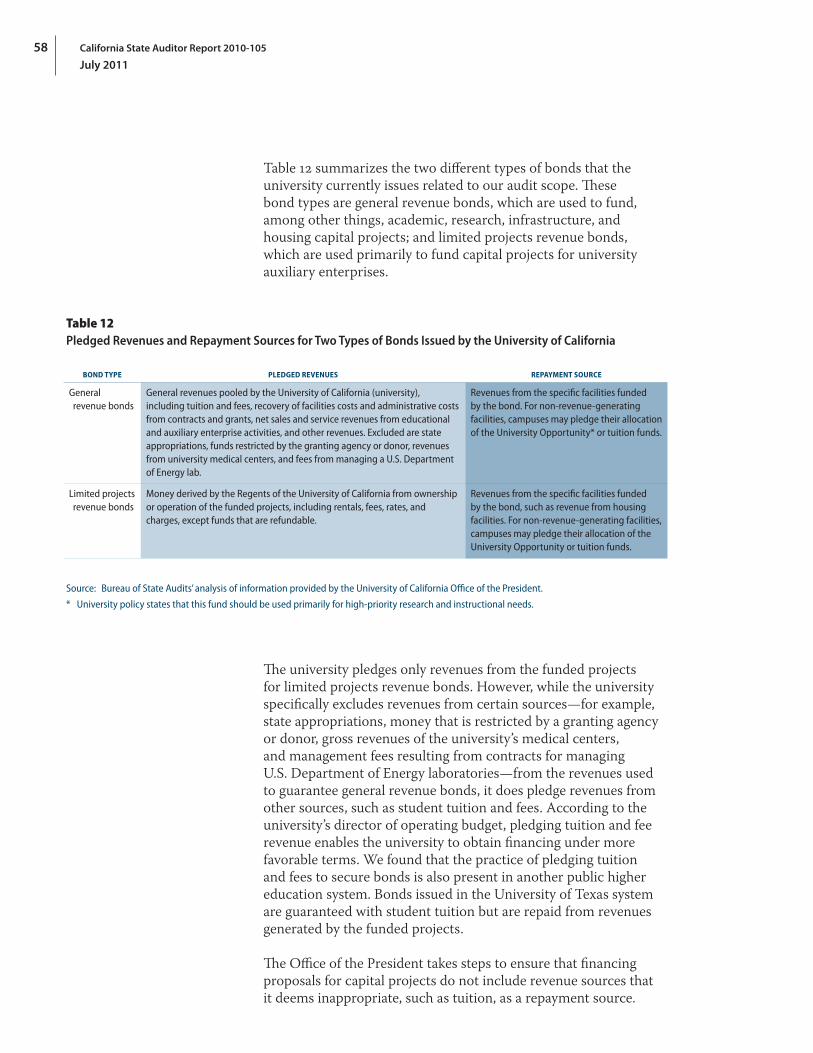
California State Auditor Report 2010-105
July 2011
58
Table 12 summarizes the two different types of bonds that the university currently issues related to our audit scope. These bond types are general revenue bonds, which are used to fund, among other things, academic, research, infrastructure, and housing capital projects; and limited projects revenue bonds, which are used primarily to fund capital projects for university auxiliary enterprises.
Table 12Pledged Revenues and Repayment Sources for Two Types of Bonds Issued by the University of California
BOND TYPE PLEDGED REVENUES REPAYMENT SOURCE
General revenue bonds
General revenues pooled by the University of California (university), including tuition and fees, recovery of facilities costs and administrative costs from contracts and grants, net sales and service revenues from educational and auxiliary enterprise activities, and other revenues. Excluded are state appropriations, funds restricted by the granting agency or donor, revenues from university medical centers, and fees from managing a U.S. Department of Energy lab.
Revenues from the specific facilities funded by the bond. For non‑revenue‑generating facilities, campuses may pledge their allocation of the University Opportunity* or tuition funds.
Limited projects revenue bonds
Money derived by the Regents of the University of California from ownership or operation of the funded projects, including rentals, fees, rates, and charges, except funds that are refundable.
Revenues from the specific facilities funded by the bond, such as revenue from housing facilities. For non‑revenue‑generating facilities, campuses may pledge their allocation of the University Opportunity or tuition funds.
Source: Bureau of State Audits’ analysis of information provided by the University of California Office of the President.
* University policy states that this fund should be used primarily for high‑priority research and instructional needs.
The university pledges only revenues from the funded projects for limited projects revenue bonds. However, while the university specifically excludes revenues from certain sources—for example, state appropriations, money that is restricted by a granting agency or donor, gross revenues of the university’s medical centers, and management fees resulting from contracts for managing U.S. Department of Energy laboratories—from the revenues used to guarantee general revenue bonds, it does pledge revenues from other sources, such as student tuition and fees. According to the university’s director of operating budget, pledging tuition and fee revenue enables the university to obtain financing under more favorable terms. We found that the practice of pledging tuition and fees to secure bonds is also present in another public higher education system. Bonds issued in the University of Texas system are guaranteed with student tuition but are repaid from revenues generated by the funded projects.
The Office of the President takes steps to ensure that financing proposals for capital projects do not include revenue sources that it deems inappropriate, such as tuition, as a repayment source.

59California State Auditor Report 2010-105
July 2011
Each bond document pledges specific revenues, and university policy ensures that all projects funded by the bonds have specified repayment sources. These repayment sources are designated by funding proposals as approved by the regents or the university president under delegated authority. For example, the renovation plans approved in 2009 for the Pauley Pavilion on the Los Angeles campus had an estimated cost of $185 million, $60 million of which would be paid through external financing. To pay the debt service, the proposal identified net revenues from the basketball program as the repayment revenue source. For each proposal, the Office of the President’s external finance, budget, financial management, general counsel, and real estate offices all review the assessment of whether a project is financially feasible, as well as identify repayment sources, which must comply with university guidelines. Although we did not evaluate this process, we reviewed the university’s accounting records and verified that the university did not use any tuition revenues to make debt payments during fiscal years 2005–06 through 2009–10.
The University Receives Hundreds of Millions of Dollars Per Year for Contract and Grant Overhead
In fiscal year 2009–10 the university received more than $2 billion in federal contract and grant revenue, of which more than $700 million was provided for overhead costs. Portions of this funding were included as part of the general funds and tuition budget and were distributed to specific funds, such as the University Opportunity Fund.
The university receives funding to administer grants and contracts through the indirect cost recovery process. To establish the amount of these funds, the university negotiates an indirect cost rate with the federal government. Indirect cost recovery at the campuses has historically been nearly 50 percent. A 50 percent indirect cost rate means that for every $100 of funding provided for a specific purpose, another $50 is provided for overhead costs, such as acquiring and maintaining buildings, utilities, and campus administrative expenses.
We were asked to determine how the university spent revenues received from the federal government to administer grants. Each year the Office of the President administers a process to distribute revenues from federal overhead among different funds. Three funds receive almost 93 percent of these revenues: the general fund 19900, which is a pooled fund, and the University Opportunity Fund and Off‑the‑Top Fund, both of which are funded mostly by federal overhead revenues. The general fund 19900, as a pooled fund, also receives revenues from other sources. As a result, we can only identify how its total revenues were used; we cannot determine
Indirect cost recovery at the campuses has historically been nearly 50 percent—for every $100 of funding provided for a specific purpose, another $50 is provided for overhead expenses.

California State Auditor Report 2010-105
July 2011
60
how revenues from just indirect cost recovery were spent from this fund. University policy dictates that the general fund 19900 be used for general operating expenses, the Off‑the‑Top Fund for federal contract and grant administration and overhead costs, and the University Opportunity Fund primarily for high‑priority research and instructional needs. The Office of the President distributes revenues from all three funds to the campuses. Table 13 shows the accounting information for each of these three funds for fiscal year 2009–10, including the amount of indirect cost recovery revenue transferred to each fund.
As shown in Table 13, the University Opportunity Fund and Off‑the‑Top Fund receive only transfers; no revenue comes directly into these funds. Amounts totaling $152 million were spent on many categories from these two funds, with the largest concentration of expenses occurring in the institutional support category. This category includes expenses for general administrative offices in support of the university. Also for these two funds, the university transferred $179 million to other funds; we did not analyze the funds to which the university transferred this funding. In contrast, the general fund 19900 received $287 million in indirect cost recovery transfers, transferred out $109 million to other funds, and recorded most of its expenses in the instruction category. The amount allocated to each fund is determined by the Office of the President using various formulas. These formulas are based on agreements between the university and the State. For more details regarding the allocation of federal overhead cost revenues, see Appendix A.
When State Funding Is Not Available, the University Does Not Increase Overall Salaries
One of the underlying questions this audit was to answer relates to inflationary increases14 in federal grant funding and frozen employee salaries. Although the university on numerous occasions increased compensation for faculty, staff, and students associated with federal grants before July 2008, it offered very few compensation increases after that date.
14 The term inflationary increase (sometimes called escalator increase) refers to statements included in fiscal policies issued by the National Institutes of Health (NIH). The NIH issues an annual fiscal policy in which it identifies an inflation allowance for its investments in research and an increase in the average cost of grants. In its policy for federal fiscal year 2009–10, the NIH identified a 2 percent inflation allowance for NIH investments in research supported by research grants and stated that the average cost of grants is allowed to increase by 2 percent over federal fiscal year 2008–09.
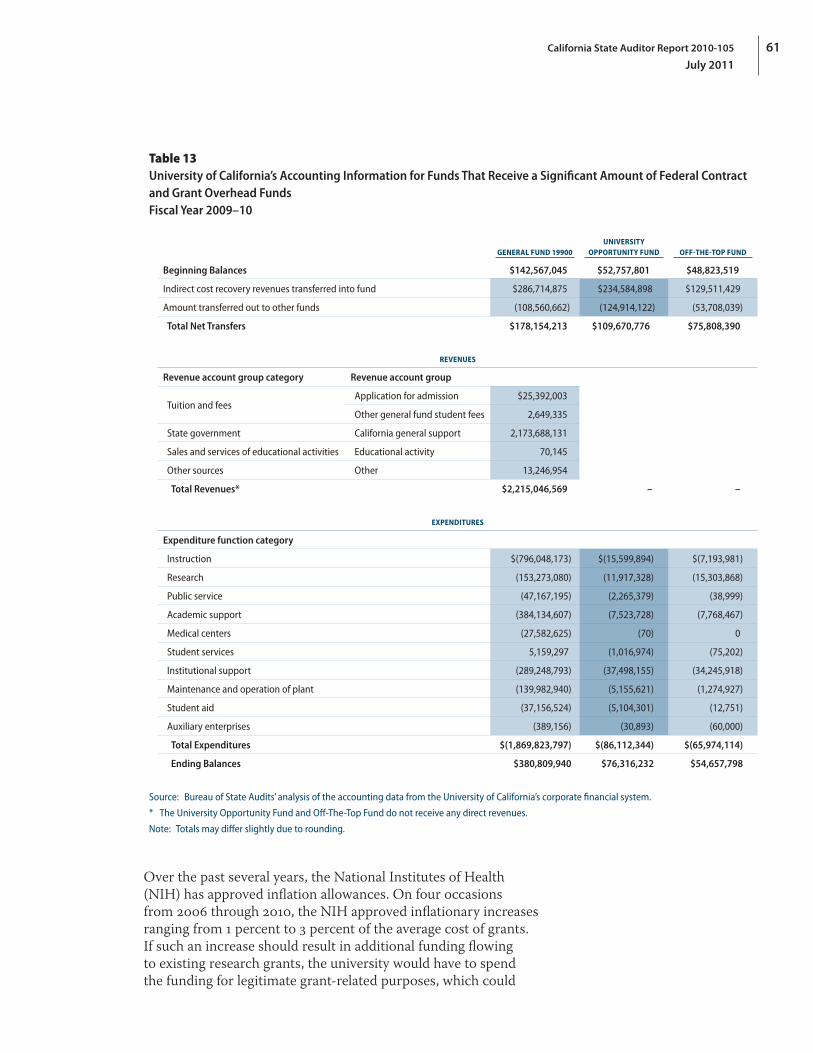
61California State Auditor Report 2010-105
July 2011
Table 13University of California’s Accounting Information for Funds That Receive a Significant Amount of Federal Contract and Grant Overhead Funds Fiscal Year 2009–10
GENERAL FUND 19900UNIVERSITY
OPPORTUNITY FUND OFF‑THE‑TOP FUND
Beginning Balances $142,567,045 $52,757,801 $48,823,519
Indirect cost recovery revenues transferred into fund $286,714,875 $234,584,898 $129,511,429
Amount transferred out to other funds (108,560,662) (124,914,122) (53,708,039)
Total Net Transfers $178,154,213 $109,670,776 $75,808,390
REVENUES
Revenue account group category Revenue account group
Tuition and feesApplication for admission $25,392,003
Other general fund student fees 2,649,335
State government California general support 2,173,688,131
Sales and services of educational activities Educational activity 70,145
Other sources Other 13,246,954
Total Revenues* $2,215,046,569 – –
EXPENDITURES
Expenditure function category
Instruction $(796,048,173) $(15,599,894) $(7,193,981)
Research (153,273,080) (11,917,328) (15,303,868)
Public service (47,167,195) (2,265,379) (38,999)
Academic support (384,134,607) (7,523,728) (7,768,467)
Medical centers (27,582,625) (70) 0
Student services 5,159,297 (1,016,974) (75,202)
Institutional support (289,248,793) (37,498,155) (34,245,918)
Maintenance and operation of plant (139,982,940) (5,155,621) (1,274,927)
Student aid (37,156,524) (5,104,301) (12,751)
Auxiliary enterprises (389,156) (30,893) (60,000)
Total Expenditures $(1,869,823,797) $(86,112,344) $(65,974,114)
Ending Balances $380,809,940 $76,316,232 $54,657,798
Source: Bureau of State Audits’ analysis of the accounting data from the University of California’s corporate financial system.
* The University Opportunity Fund and Off‑The‑Top Fund do not receive any direct revenues.
Note: Totals may differ slightly due to rounding.
Over the past several years, the National Institutes of Health (NIH) has approved inflation allowances. On four occasions from 2006 through 2010, the NIH approved inflationary increases ranging from 1 percent to 3 percent of the average cost of grants. If such an increase should result in additional funding flowing to existing research grants, the university would have to spend the funding for legitimate grant‑related purposes, which could

California State Auditor Report 2010-105
July 2011
62
include compensation increases. Further, it is university policy to include projected compensation increases as part of research grant proposals.
Our review of a sample of 15 federally funded research grants from three of the university’s campuses—Berkeley, Los Angeles, and San Diego—confirmed that the campuses included compensation increases as part of the proposals for all 15 grants. For example, for a $5.9 million grant from the NIH, Berkeley included as part of its grant proposal a 3 percent annual increase in faculty and staff salaries, a 3 percent annual wage increase for graduate students, and a maximum 8 percent annual increase for subcontractor salaries.
We also found that the campuses increased compensation for certain employees working on the 15 grants. Specifically, we noted 315 compensation increases from 2002 through 2009 for employees associated with the grants. For example, in October 2007 Berkeley increased the salary of an Assistant III working on one grant by $150 per month—from $3,334 to $3,484. Of these 315 compensation increases, all but nine, or 3 percent, occurred before July 2008.
The Office of the President indicated that although it did not impose a salary freeze, it made no salary range adjustments for staff during fiscal years 2008–09 and 2009–10. The Office of the President stated that it tends not to provide range adjustments and merit increases to faculty and staff at large when the State does not include funding for such increases. Further, the university follows a civil service‑like salary schedule for salaries and wages. According to the Office of the President, it tends to treat all employees in the same job classification the same for purposes of salary adjustments provided to a category of employees and that the source of funding used to provide compensation for an employee—for example, federal grants or state appropriations—is not a factor in determining salary and salary increases.
With respect to the nine instances of salary and wage increases occurring during or after July 2008, four were merit or promotion increases; four were “equity,” “salary‑cap,” or “market” adjustments; and one was a negotiated salary increase for a health sciences faculty member. The Office of the President indicated that all nine increases were appropriate and that overarching policy gives campus chancellors the authority to set salary for academic appointees. It also told us that “academic merits” continue to be paid regardless of how bad a fiscal crisis is and that faculty come up for merit increases every two to three years, therefore, in any given year there would be some faculty merit increases. According to the Office of the President, salary increases can occur if an
We noted 315 compensation increases from 2002 through 2009 for employees associated with the 15 grants we examined.

63California State Auditor Report 2010-105
July 2011
individual is promoted or receives an equity or retention increase.15 In the “salary cap” instance, the Office of the President stated that the campus increased a professor’s salary on his annual review date because the NIH had previously increased the maximum salary that could be paid to those working on NIH grants. Regarding the “market increases,” the Office of the President stated that they were made to achieve parity with other faculty who had received increases previously. In the absence of funding from the State for general salary increases, it is the Office of the President’s sense that campuses have been funding compensation increases for employees from core funds such as state funding and student fee revenue, or by using tactics such as layoffs, holding vacant positions open, hiring more lecturers and fewer faculty members, not replacing equipment, increasing class sizes, or using the savings from the restructuring of off‑campus units.
Recommendations
To increase the transparency of university funds, the Office of the President should make available annually financial information regarding its funds, including beginning and ending balances; revenues, expenses, and transfers; and the impact of these transactions on the balances from year to year.
To ensure that the campus financial information published by the Office of the President can be better evaluated by interested stakeholders, the university should disclose instances in which campuses subsidize auxiliary enterprises with revenues from other funding sources and should disclose the sources of that funding.
To improve the transparency of its expenses, the university should identify more specific categories for expenses that are recorded under the Miscellaneous Services accounting code and should implement object codes that account for these expenses in more detail.
To ensure that campuses do not inappropriately use revenues generated from student fees imposed by referenda, the university should ensure that it, the regents, and the campuses do not expand the uses for such revenues beyond those stated in the referenda.
15 University policy allows for equity increases to correct a significant salary inequity in individual circumstances based on factors such as rapidly changing market conditions. Retention increases may be provided to retain employees at the university, rather than have them consider positions elsewhere.

California State Auditor Report 2010-105
July 2011
64
We conducted this audit under the authority vested in the California State Auditor by Section 8543 et seq. of the California Government Code and according to generally accepted government auditing standards. Those standards require that we plan and perform the audit to obtain sufficient, appropriate evidence to provide a reasonable basis for our findings and conclusions based on our audit objectives specified in the scope section of the report. We believe that the evidence obtained provides a reasonable basis for our findings and conclusions based on our audit objectives.
Respectfully submitted,
ELAINE M. HOWLE, CPA State Auditor
Date: July 28, 2011
Staff: Phillip Jelicich, Deputy State Auditor Dale A. Carlson, MPA, CGFM, Project Manager Daniel P. Andersen, CIA Angela Dickison, CPA Amanda S. Garvin-Adicoff Bob Harris, MPP Vern Hines Kat Scoggin
Legal Counsel: Sharon Reilly, Chief Legal Counsel Scott A. Baxter, JD
IT Audit Support: Michelle Baur, CISA, Audit Principal Jeanne Rimpo, MS Benjamin W. Wolfgram, ACDA
For questions regarding the contents of this report, please contact Margarita Fernández, Chief of Public Affairs, at 916.445.0255.

65California State Auditor Report 2010-105
July 2011
Appendix A
UNIVERSITY FUNDING SOURCES AND METHODS FOR BUDGETING FUNDING TO CAMPUSES
As discussed in Chapter 2, the University of California (university) uses an incremental budget process. As such, in any given year, the base budget for each campus is the same as the prior year’s budget. For the most part, the only funding the university’s Office of the President allocates to campuses annually are increases or decreases to revenues. The university’s funding comes from a variety of sources, some of which place restrictions on how the money can be spent. Consequently, the University of California Office of the President (Office of the President) distributes funding based on its source.
The Primary Revenues That the Office of the President Allocates Are the State’s General Fund Appropriation and Tuition
Each campus retains the majority of the various types of tuition and fees paid by its students. In addition, the Office of the President distributes the State’s General Fund appropriation and revenues from tuition increases among the campuses, determining the amount primarily using enrollment growth projections and the relative share each campus receives of the base budget. Table A.1 on the following page shows the distribution methods for tuition and fees and the State’s General Fund appropriation for fiscal years 2005–06 through 2009–10, but omits student financial aid, which we discuss in the following section.
The University Generally Allocates Funding Dedicated to Financial Aid According to Need
In every year from fiscal years 2005–06 through 2009–10, the State’s General Fund appropriation to the university included $52.2 million of funding earmarked for student financial aid. University policy requires that most new fees and increases to existing tuition or fees include a return‑to‑aid component of at least 25 percent that sets aside a portion of those revenues for student financial aid.16 Further, the Regents of the University of California (regents) had previously approved the Blue and Gold Opportunity Plan, which guarantees grant and scholarship coverage of certain tuition and fees of students admitted to the university whose income falls below a certain level.17
16 According to the Office of the President, exceptions to this policy are fees charged for enrollment in self‑supporting degree programs, such as executive graduate business administration programs, summer fees charged to non‑university students, and university extension fees.
17 In the 2009–10 academic year, the level of income was an adjusted gross family income of $70,000, but this threshold will increase to $80,000 for the 2011–12 academic year. Only undergraduate students are eligible, and only for the first four years if they were admitted as freshmen or for two years if they were admitted as transfers.
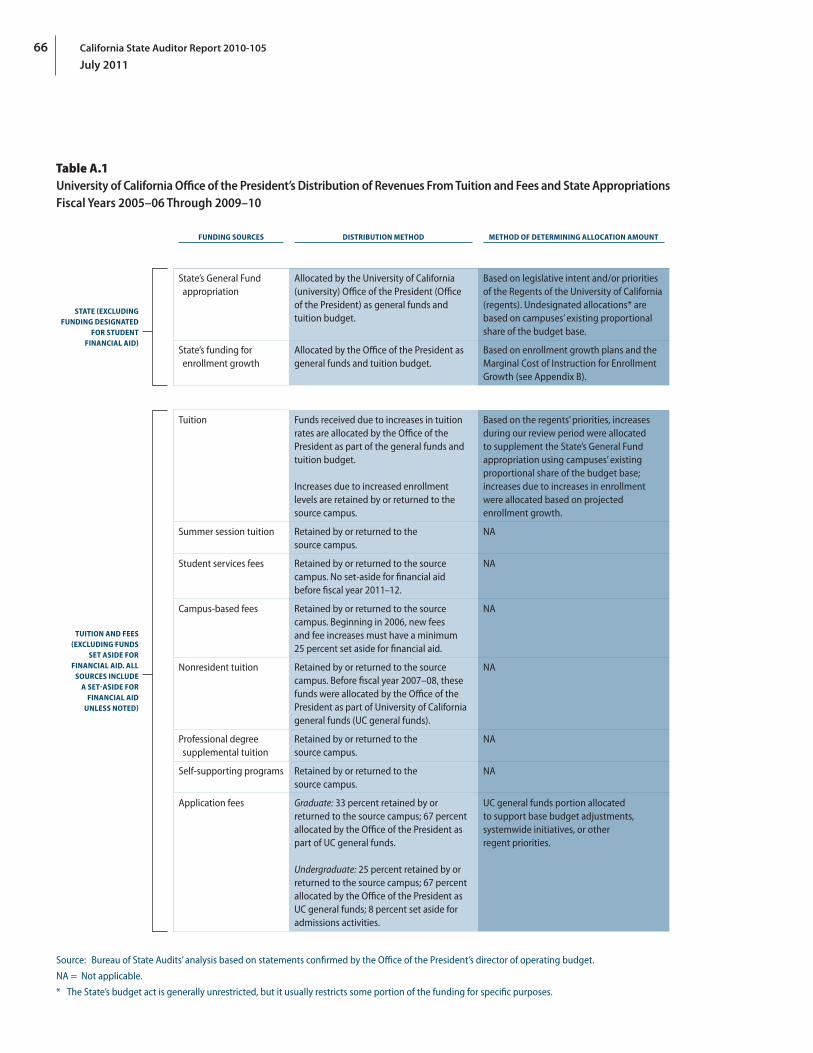
California State Auditor Report 2010-105
July 2011
66
Table A.1University of California Office of the President’s Distribution of Revenues From Tuition and Fees and State Appropriations Fiscal Years 2005–06 Through 2009–10
FUNDING SOURCES DISTRIBUTION METHOD METHOD OF DETERMINING ALLOCATION AMOUNT
STATE (EXCLUDING FUNDING DESIGNATED
FOR STUDENT FINANCIAL AID)
State’s General Fund appropriation
Allocated by the University of California (university) Office of the President (Office of the President) as general funds and tuition budget.
Based on legislative intent and/or priorities of the Regents of the University of California (regents). Undesignated allocations* are based on campuses’ existing proportional share of the budget base.
State’s funding for enrollment growth
Allocated by the Office of the President as general funds and tuition budget.
Based on enrollment growth plans and the Marginal Cost of Instruction for Enrollment Growth (see Appendix B).
TUITION AND FEES (EXCLUDING FUNDS
SET ASIDE FOR FINANCIAL AID. ALL
SOURCES INCLUDE A SET‑ASIDE FOR
FINANCIAL AID UNLESS NOTED)
Tuition Funds received due to increases in tuition rates are allocated by the Office of the President as part of the general funds and tuition budget.
Increases due to increased enrollment levels are retained by or returned to the source campus.
Based on the regents’ priorities, increases during our review period were allocated to supplement the State’s General Fund appropriation using campuses’ existing proportional share of the budget base; increases due to increases in enrollment were allocated based on projected enrollment growth.
Summer session tuition Retained by or returned to the source campus.
NA
Student services fees Retained by or returned to the source campus. No set‑aside for financial aid before fiscal year 2011–12.
NA
Campus‑based fees Retained by or returned to the source campus. Beginning in 2006, new fees and fee increases must have a minimum 25 percent set aside for financial aid.
NA
Nonresident tuition Retained by or returned to the source campus. Before fiscal year 2007–08, these funds were allocated by the Office of the President as part of University of California general funds (UC general funds).
NA
Professional degree supplemental tuition
Retained by or returned to the source campus.
NA
Self‑supporting programs Retained by or returned to the source campus.
NA
Application fees Graduate: 33 percent retained by or returned to the source campus; 67 percent allocated by the Office of the President as part of UC general funds.
Undergraduate: 25 percent retained by or returned to the source campus; 67 percent allocated by the Office of the President as UC general funds; 8 percent set aside for admissions activities.
UC general funds portion allocated to support base budget adjustments, systemwide initiatives, or other regent priorities.
Source: Bureau of State Audits’ analysis based on statements confirmed by the Office of the President’s director of operating budget.
NA = Not applicable.
* The State’s budget act is generally unrestricted, but it usually restricts some portion of the funding for specific purposes.
67California State Auditor Report 2010-105
July 2011
Every year, the Office of the President’s Budget and Capital Resources department determines the total amount of funds available for financial aid and reports that number to the Office of the President’s Student Financial Support (SFS) unit. According to the director of operating budget at the Office of the President, the SFS unit determines financial aid funding for undergraduate students to campuses based on the individual needs of students. The director of operating budget also stated that many factors influence the SFS unit’s determinations of financial aid for graduate students, including a campus’s need for teaching assistants (positions that are often offered to graduate students as a form of financial aid‑funded employment) and increases in fellowship awards. Donors may also restrict gifts made to the campuses to financial aid, and the campuses have the ability to use unrestricted private funds to offer supplemental financial aid.
Campuses Retain the Majority of Increases in Indirect Cost Recovery Revenue
The university has requirements in place that determine how indirect costs are set and how it spends revenues generated from indirect costs. When the university receives a grant or contract to conduct research, the agreement often includes funding not only for direct expenses, but also for indirect expenses. Direct expenses include compensation, equipment, and travel. Indirect expenses include overhead and institutional support.
A policy of the university requires it to charge outside entities enough to cover both direct and indirect expenses. The policy also authorizes the university president to negotiate and approve indirect cost rates to be applied to contracts and grants. Further, this policy points out that federal requirements dictate that proposals for indirect cost rates be supported with cost accounting data. Rates for indirect costs have historically been around 50 percent. In fiscal year 2009–10, the university received more than $700 million in indirect cost recovery revenues from the federal government.
Table A.2 on the following page shows the distribution and allocation of indirect cost recovery revenue received by the university from federal and state sources. After returning a portion of the revenue from indirect cost recovery to campuses for Garamendi projects18 and neuropsychiatric institutes,19 the university divides the remaining money into three different funds
18 Garamendi projects are faculty research facilities named for the author of the legislation that enabled the funding bonds.
19 Neuropsychiatric institutes are treatment and research facilities, such as the Semel Institute at the Los Angeles campus.
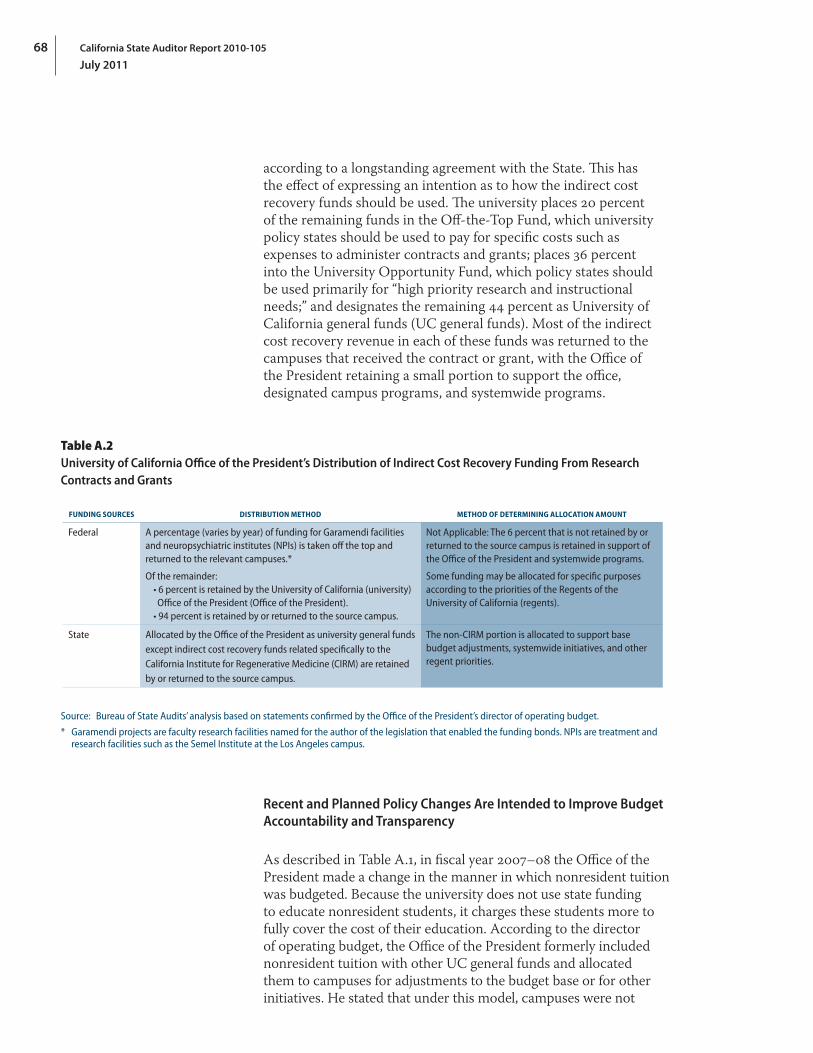
California State Auditor Report 2010-105
July 2011
68
according to a longstanding agreement with the State. This has the effect of expressing an intention as to how the indirect cost recovery funds should be used. The university places 20 percent of the remaining funds in the Off‑the‑Top Fund, which university policy states should be used to pay for specific costs such as expenses to administer contracts and grants; places 36 percent into the University Opportunity Fund, which policy states should be used primarily for “high priority research and instructional needs;” and designates the remaining 44 percent as University of California general funds (UC general funds). Most of the indirect cost recovery revenue in each of these funds was returned to the campuses that received the contract or grant, with the Office of the President retaining a small portion to support the office, designated campus programs, and systemwide programs.
Table A.2University of California Office of the President’s Distribution of Indirect Cost Recovery Funding From Research Contracts and Grants
FUNDING SOURCES DISTRIBUTION METHOD METHOD OF DETERMINING ALLOCATION AMOUNT
Federal A percentage (varies by year) of funding for Garamendi facilities and neuropsychiatric institutes (NPIs) is taken off the top and returned to the relevant campuses.*
Of the remainder: • 6 percent is retained by the University of California (university) Office of the President (Office of the President).
• 94 percent is retained by or returned to the source campus.
Not Applicable: The 6 percent that is not retained by or returned to the source campus is retained in support of the Office of the President and systemwide programs.
Some funding may be allocated for specific purposes according to the priorities of the Regents of the University of California (regents).
State Allocated by the Office of the President as university general funds except indirect cost recovery funds related specifically to the California Institute for Regenerative Medicine (CIRM) are retained by or returned to the source campus.
The non‑CIRM portion is allocated to support base budget adjustments, systemwide initiatives, and other regent priorities.
Source: Bureau of State Audits’ analysis based on statements confirmed by the Office of the President’s director of operating budget.
* Garamendi projects are faculty research facilities named for the author of the legislation that enabled the funding bonds. NPIs are treatment and research facilities such as the Semel Institute at the Los Angeles campus.
Recent and Planned Policy Changes Are Intended to Improve Budget Accountability and Transparency
As described in Table A.1, in fiscal year 2007–08 the Office of the President made a change in the manner in which nonresident tuition was budgeted. Because the university does not use state funding to educate nonresident students, it charges these students more to fully cover the cost of their education. According to the director of operating budget, the Office of the President formerly included nonresident tuition with other UC general funds and allocated them to campuses for adjustments to the budget base or for other initiatives. He stated that under this model, campuses were not

69California State Auditor Report 2010-105
July 2011
held responsible for generating a specified amount of nonresident tuition revenue. He also added that if nonresident tuition revenue declined at a campus, that campus would actually experience only a partial revenue decline under the former pooling approach. The director of operating budget also stated that concerns existed about transparency; faculty desired a stronger ability to track how nonresident tuition funding was being allocated.
Beginning in fiscal year 2007–08, the Office of the President revised part of its budget process to better ensure that campuses met their revenue targets for nonresident tuition or determined how the campus would address any revenue shortfall that resulted from underenrolling nonresident students. Under this revised process, the campuses retained all the nonresident tuition they generated. This was not the first time that the Office of the President revised the university’s budget process. In 2000 the university similarly adjusted its budget processes for distributing indirect cost recovery funds from federal grants and contracts to ensure that the majority of increases to the revenue were distributed to the campuses that generated the contracts or grants.
Campuses raised similar concerns about the handling of tuition and fee revenue as tuition rates increased. After consultations and collaboration with the campuses, the Office of the President developed a proposal for a revised budget process. It stated that it is implementing this revised process during fiscal year 2011–12. The proposal’s primary change is to continue the trend started with nonresident tuition by ensuring that campuses retain nearly all revenues they generate. Under this proposal, to fund the Office of the President and programs not affiliated with a specific campus, such as the university’s Washington, D.C., center and the multicampus research units, the Office of the President is proposing a broad‑based assessment of campus funding. Undergraduate financial aid would continue to be allocated based on need.
The University Distributes Other Funding Depending on the Source and Provides Funding for the Office of the President and Systemwide Programs From Small Assessments on Various Revenues
Table A.3 on the following page shows the method of distribution and, when relevant, how the Office of the President calculates the amounts of allocations for revenues from various other sources. Campuses retain revenue from university extension programs, the majority of auxiliary enterprise revenue, a portion of patent royalties, and any interest earned on campus‑managed cash balances, which are referred to as short‑term investment pool earnings. Additionally, campuses retain direct cost reimbursement revenue from research contracts and grants. To fund the budget

California State Auditor Report 2010-105
July 2011
70
for the Office of the President itself, and to support systemwide programs that are not affiliated with a specific campus, the Office of the President retains a small portion of revenues from various activities, including auxiliary enterprises, indirect cost recovery, teaching hospitals, and investment earnings from funds held by the Office of the President.
Table A.3University of California’s Office of the President’s Distribution of Revenues From Sources Other Than Government, Tuition, and Fees
FUNDING SOURCES DISTRIBUTION METHOD METHOD OF DETERMINING ALLOCATION AMOUNT
Auxiliary enterprises Retained by or returned to the source campus, except 0.2 percent allocated to the University of California’s (university) Office of the President.
Not applicable
University extension Retained by or returned to the source campus beginning in fiscal year 2008–09.
Before fiscal year 2008–09, the Office of the President allocated some portion of revenues from Continuing Education of the Bar in support of Office of the President administration.
Patent royalty revenue (net of payments to joint holders and direct expense)
For these revenues, 35 percent is distributed to the inventor and 25 percent of the remainder is allocated by the Office of the President as University of California general funds (UC general funds).Remainder is retained by or returned to the source campus, with 15 percent from patents licensed after 1997 designated for inventors’ research program.
UC general funds portion is allocated to support base budget adjustments, systemwide initiatives, or other priorities of the Regents of the University of California (regents).
Short‑term investment pool earnings
Earnings from funds held by the Office of the President are allocated by the Office of the President.
Earnings from campus‑held funds are retained by or returned to the source campus.
Allocated to support base budget adjustments, systemwide initiatives, or other regent priorities.
Source: Bureau of State Audits’ analysis based on statements confirmed by the Office of the President.
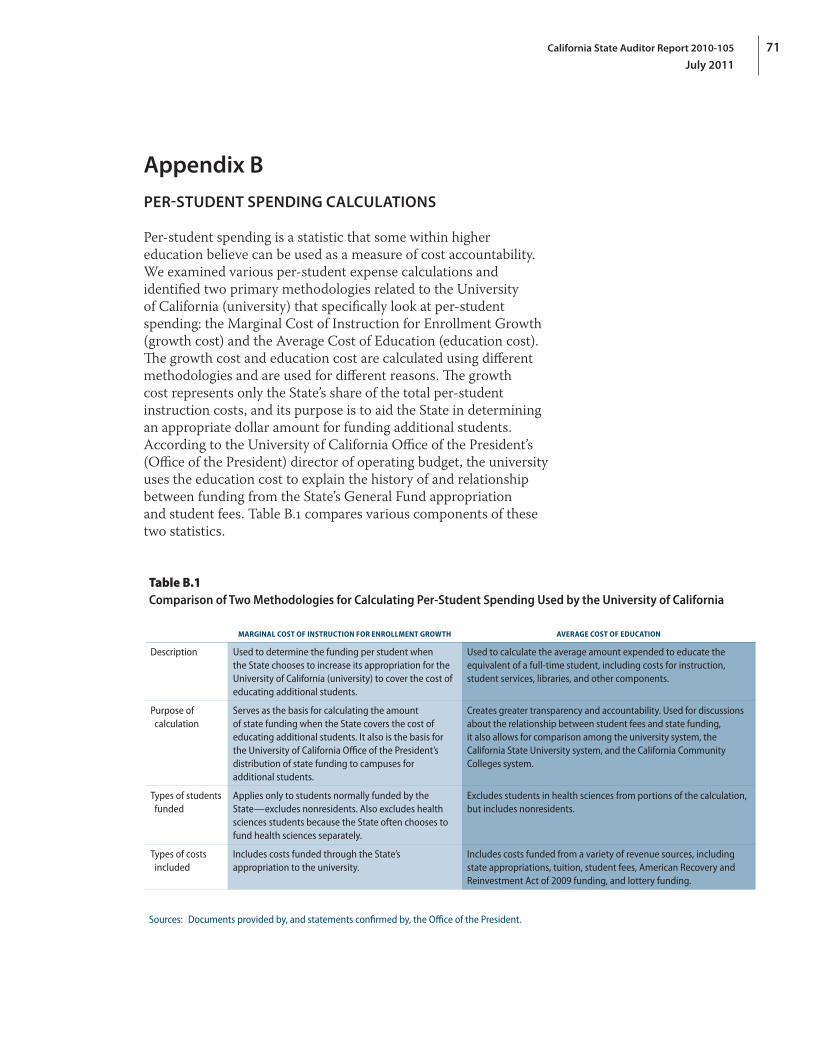
71California State Auditor Report 2010-105
July 2011
Appendix B
PER‑STUDENT SPENDING CALCULATIONS
Per‑student spending is a statistic that some within higher education believe can be used as a measure of cost accountability. We examined various per‑student expense calculations and identified two primary methodologies related to the University of California (university) that specifically look at per‑student spending: the Marginal Cost of Instruction for Enrollment Growth (growth cost) and the Average Cost of Education (education cost). The growth cost and education cost are calculated using different methodologies and are used for different reasons. The growth cost represents only the State’s share of the total per‑student instruction costs, and its purpose is to aid the State in determining an appropriate dollar amount for funding additional students. According to the University of California Office of the President’s (Office of the President) director of operating budget, the university uses the education cost to explain the history of and relationship between funding from the State’s General Fund appropriation and student fees. Table B.1 compares various components of these two statistics.
Table B.1Comparison of Two Methodologies for Calculating Per‑Student Spending Used by the University of California
MARGINAL COST OF INSTRUCTION FOR ENROLLMENT GROWTH AVERAGE COST OF EDUCATION
Description Used to determine the funding per student when the State chooses to increase its appropriation for the University of California (university) to cover the cost of educating additional students.
Used to calculate the average amount expended to educate the equivalent of a full‑time student, including costs for instruction, student services, libraries, and other components.
Purpose of calculation
Serves as the basis for calculating the amount of state funding when the State covers the cost of educating additional students. It also is the basis for the University of California Office of the President’s distribution of state funding to campuses for additional students.
Creates greater transparency and accountability. Used for discussions about the relationship between student fees and state funding, it also allows for comparison among the university system, the California State University system, and the California Community Colleges system.
Types of students funded
Applies only to students normally funded by the State—excludes nonresidents. Also excludes health sciences students because the State often chooses to fund health sciences separately.
Excludes students in health sciences from portions of the calculation, but includes nonresidents.
Types of costs included
Includes costs funded through the State’s appropriation to the university.
Includes costs funded from a variety of revenue sources, including state appropriations, tuition, student fees, American Recovery and Reinvestment Act of 2009 funding, and lottery funding.
Sources: Documents provided by, and statements confirmed by, the Office of the President.

California State Auditor Report 2010-105
July 2011
72
Growth Cost
The State uses the growth cost in determining the amount, if any, by which to increase its General Fund appropriation to cover the costs of educating additional students. Because the growth cost is used as a tool to assist the State in funding more students, the only expenses considered are those paid out of the State’s General Fund appropriation. According to the director of operating budget, the growth cost is based on actual expenditures for the entire university system and is not intended to reflect the true marginal cost of enrolling a single additional student. Rather, the growth cost is an average per‑student amount of the aggregate cost of increasing enrollment by a significant amount. The last time within our audit scope that the State provided enrollment growth funding was for fiscal year 2007–08; the State provided funding to increase the number of students enrolled by 5,000, or the size of a small college.
The Department of Finance (Finance) and the Legislative Analyst’s Office (LAO) each has its own method for calculating growth cost during the state budget process. According to the director of operating budget, representatives from the university system, the California State University system, the California Postsecondary Education Commission (CPEC), the LAO, legislative staff from the budget subcommittee, and Finance met to determine one appropriate methodology for calculating the growth cost. However, there was no ultimate agreement. Consequently, the growth cost calculated by Finance is used in the governor’s budget, and the LAO uses its own method of calculating growth cost, which is the figure that appeared in the budget acts of 2006 and 2007.
The final amount for growth cost that ends up in the governor’s proposed budget and the budget act is not the total growth cost. It reflects only the portion of the total growth cost that the State funds. According to the Office of the President, a portion of the total costs is supported by tuition and fee revenue generated from increases in enrollment. Although the university calculates growth cost using both Finance’s and the LAO’s methodologies every year, the director of operating budget stated that the university discusses the growth cost only in the context of enrollment growth. Consequently, the figure does not necessarily appear in university budget documents in years in which the State chooses not to increase the number of students it funds. Table B.2 shows that, for fiscal years 2005–06 through 2009–10, the differences between the costs calculated using the two methodologies were insignificant.
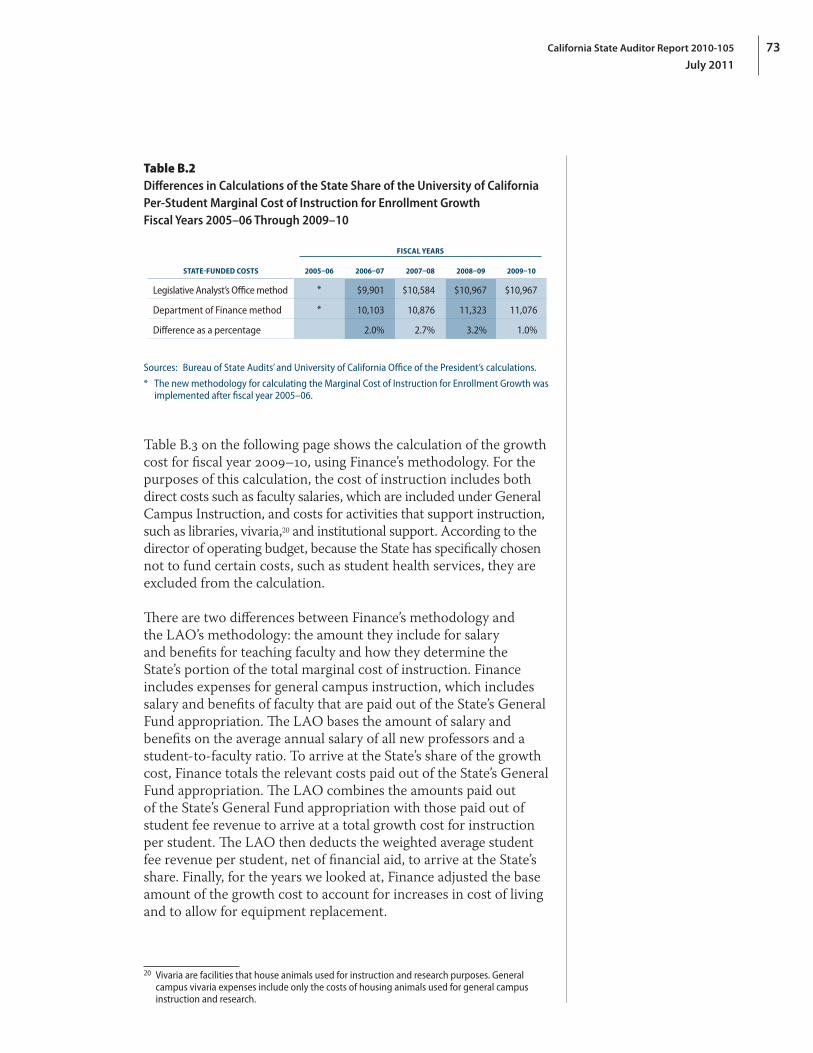
73California State Auditor Report 2010-105
July 2011
Table B.2Differences in Calculations of the State Share of the University of California Per‑Student Marginal Cost of Instruction for Enrollment Growth Fiscal Years 2005–06 Through 2009–10
STATE‑FUNDED COSTS
FISCAL YEARS
2005–06 2006–07 2007–08 2008–09 2009–10
Legislative Analyst’s Office method * $9,901 $10,584 $10,967 $10,967
Department of Finance method * 10,103 10,876 11,323 11,076
Difference as a percentage 2.0% 2.7% 3.2% 1.0%
Sources: Bureau of State Audits’ and University of California Office of the President’s calculations.
* The new methodology for calculating the Marginal Cost of Instruction for Enrollment Growth was implemented after fiscal year 2005–06.
Table B.3 on the following page shows the calculation of the growth cost for fiscal year 2009–10, using Finance’s methodology. For the purposes of this calculation, the cost of instruction includes both direct costs such as faculty salaries, which are included under General Campus Instruction, and costs for activities that support instruction, such as libraries, vivaria,20 and institutional support. According to the director of operating budget, because the State has specifically chosen not to fund certain costs, such as student health services, they are excluded from the calculation.
There are two differences between Finance’s methodology and the LAO’s methodology: the amount they include for salary and benefits for teaching faculty and how they determine the State’s portion of the total marginal cost of instruction. Finance includes expenses for general campus instruction, which includes salary and benefits of faculty that are paid out of the State’s General Fund appropriation. The LAO bases the amount of salary and benefits on the average annual salary of all new professors and a student‑to‑faculty ratio. To arrive at the State’s share of the growth cost, Finance totals the relevant costs paid out of the State’s General Fund appropriation. The LAO combines the amounts paid out of the State’s General Fund appropriation with those paid out of student fee revenue to arrive at a total growth cost for instruction per student. The LAO then deducts the weighted average student fee revenue per student, net of financial aid, to arrive at the State’s share. Finally, for the years we looked at, Finance adjusted the base amount of the growth cost to account for increases in cost of living and to allow for equipment replacement.
20 Vivaria are facilities that house animals used for instruction and research purposes. General campus vivaria expenses include only the costs of housing animals used for general campus instruction and research.

California State Auditor Report 2010-105
July 2011
74
Table B.3University of California’s Growth Cost Calculation Using the Department of Finance Methodology Fiscal Year 2009–10
STATE’S SHARE (DOLLARS IN THOUSANDS)
PER‑STUDENT CALCULATION*
(IN WHOLE DOLLARS)
General Campus Instruction $1,419,332
Libraries’ Academic Support 156,604
Other Academic Support 162,779
Remove costs for museums and galleries, demonstration schools, dental and optometry clinics, neuropsychiatric institutes, occupational health center, veterinary medical teaching facilities, health sciences vivaria,† and other health sciences (104,123)
Institutional Support 279,849
Remove costs for executive management, logistical services, and community relations (171,049)
Operations and Maintenance 383,963
Remove costs for plant administration and noninstructional and research space (85,232)
Provisions for Allocation‡ 74,765
Remove costs for lease purchase (175,078)
State’s General Fund share after adjustments $1,941,810 $10,427
Adjustment for equipment replacement $41,485
State’s General Fund share with equipment replacement adjustment $1,983,295 $10,650
State’s General Fund share with equipment replacement adjustment and 4 percent cost‑of‑living adjustment (marginal cost)
$11,076
Source: University of California Office of the President.
* Based on budgeted enrollment level in the governor’s budget for fiscal year 2009–10 of 186,224 full‑time equivalent students. Includes only state‑supportable students. Nonresidents and health sciences students are excluded.
† Vivaria are facilities for caring for animals used in instruction and research. The portion of vivaria expenses attributed to the needs of health sciences programs are omitted from this calculation.
‡ Provisions for allocation are funds that are not restricted or designated for specific purposes, but for which the campuses have discretion to determine their use.
Education Cost
According to the director of operating budget, the university uses the education cost statistic in the budget for the Regents of the University of California (regents) and any time the Office of the President needs to explain the history and relationship between state funding and student fees. The Office of the President calculates the education cost figure every year. Both instruction and student have specific meanings in the context of this calculation. Instruction includes not only the direct expense of providing instruction, such as faculty salaries, but also indirect expenses that

75California State Auditor Report 2010-105
July 2011
support instruction, such as libraries and institutional overhead. The director of operating budget stated that the calculation excludes health sciences instruction costs. He further stated that health sciences programs are typically more expensive than general campus programs. Student does not include all students at the university. Student enrollment in health sciences programs is excluded from portions of the calculation.
According to the director of operating budget, the CPEC uses the education cost figure in its publications to compare the different segments of California’s public higher education systems over time. The university adopted the same methodology as the CPEC, except that it omits financial aid costs, which, according to the director of operating budget, are costs of creating access to the university system rather than costs of providing instruction and instruction‑related expenses.
The director of operating budget also stated that the university does not calculate an education cost statistic that focuses specifically on undergraduates. He mentioned that in the 1980s, the university used student‑to‑faculty ratios in which graduate students were weighted more heavily than undergraduates as a means of distributing enrollment growth funding among the campuses.
The National Association of College and University Business Officers (NACUBO) published a method of calculating per‑student spending for undergraduate students in 2002 that discusses the costs relevant to instruction. NACUBO’s method also discusses the need to distinguish between undergraduates and graduates in calculating per‑student spending. In fact, NACUBO recommends calculating an undergraduate‑only version of the statistic if the university’s student population is made up of more than 15 percent graduate students or has particularly expensive graduate programs. In fiscal year 2009–10, only the Berkeley, Davis, and Los Angeles campuses in the university system had a graduate student population that was greater than 15 percent of the total student body, while the Irvine and San Diego campuses were close to the threshold at 14 percent and 15 percent, respectively. NACUBO produces an undergraduate per‑student spending statistic by counting graduate students as equivalent to 1.25 undergraduate students, thus weighting the enrollment figure used in the calculation.
Table B.4 on the following page presents the education cost calculations for general campus students. Further, using NACUBO’s methodology, we present a weighted average for undergraduates. From fiscal years 2005–06 through 2009–10, the education cost, excluding financial aid, was 2 percent to 4 percent greater than the weighted average cost calculated for undergraduate students.
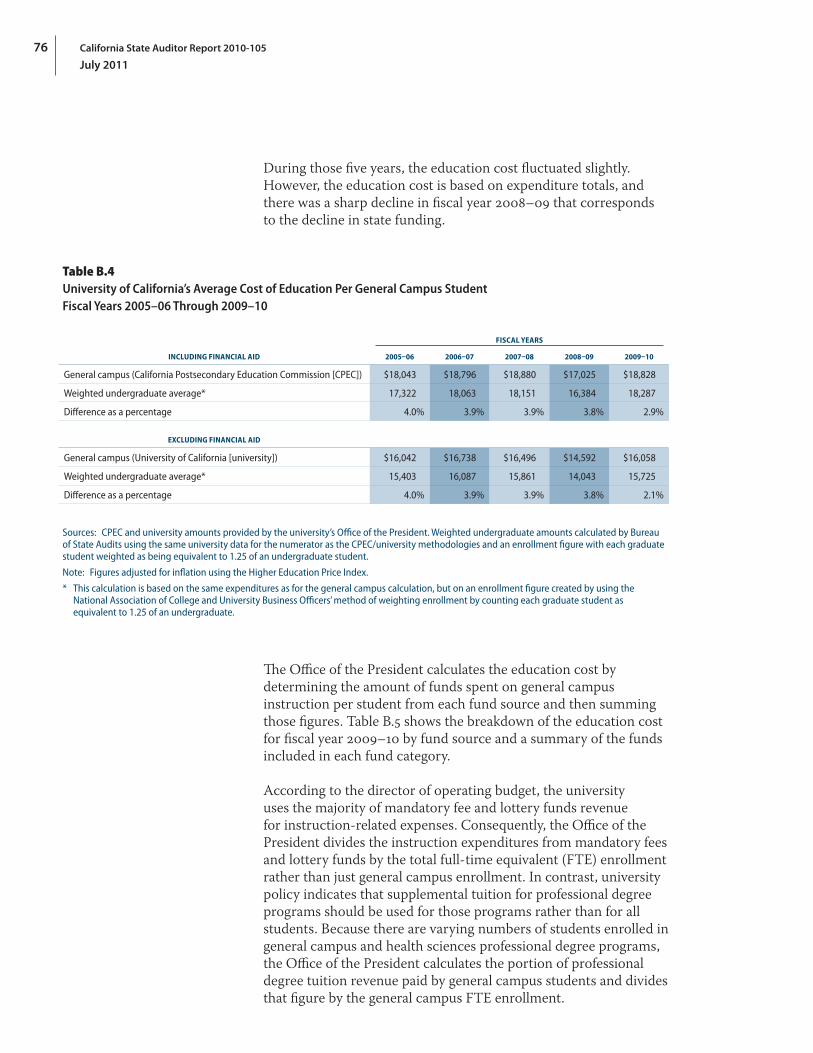
California State Auditor Report 2010-105
July 2011
76
During those five years, the education cost fluctuated slightly. However, the education cost is based on expenditure totals, and there was a sharp decline in fiscal year 2008–09 that corresponds to the decline in state funding.
Table B.4University of California’s Average Cost of Education Per General Campus Student Fiscal Years 2005–06 Through 2009–10
INCLUDING FINANCIAL AID
FISCAL YEARS
2005–06 2006–07 2007–08 2008–09 2009–10
General campus (California Postsecondary Education Commission [CPEC]) $18,043 $18,796 $18,880 $17,025 $18,828
Weighted undergraduate average* 17,322 18,063 18,151 16,384 18,287
Difference as a percentage 4.0% 3.9% 3.9% 3.8% 2.9%
EXCLUDING FINANCIAL AID
General campus (University of California [university]) $16,042 $16,738 $16,496 $14,592 $16,058
Weighted undergraduate average* 15,403 16,087 15,861 14,043 15,725
Difference as a percentage 4.0% 3.9% 3.9% 3.8% 2.1%
Sources: CPEC and university amounts provided by the university’s Office of the President. Weighted undergraduate amounts calculated by Bureau of State Audits using the same university data for the numerator as the CPEC/university methodologies and an enrollment figure with each graduate student weighted as being equivalent to 1.25 of an undergraduate student.
Note: Figures adjusted for inflation using the Higher Education Price Index.
* This calculation is based on the same expenditures as for the general campus calculation, but on an enrollment figure created by using the National Association of College and University Business Officers’ method of weighting enrollment by counting each graduate student as equivalent to 1.25 of an undergraduate.
The Office of the President calculates the education cost by determining the amount of funds spent on general campus instruction per student from each fund source and then summing those figures. Table B.5 shows the breakdown of the education cost for fiscal year 2009–10 by fund source and a summary of the funds included in each fund category.
According to the director of operating budget, the university uses the majority of mandatory fee and lottery funds revenue for instruction‑related expenses. Consequently, the Office of the President divides the instruction expenditures from mandatory fees and lottery funds by the total full‑time equivalent (FTE) enrollment rather than just general campus enrollment. In contrast, university policy indicates that supplemental tuition for professional degree programs should be used for those programs rather than for all students. Because there are varying numbers of students enrolled in general campus and health sciences professional degree programs, the Office of the President calculates the portion of professional degree tuition revenue paid by general campus students and divides that figure by the general campus FTE enrollment.

77California State Auditor Report 2010-105
July 2011
Table B.5University of California’s Average Cost of Education by Funding Source (Including Financial Aid) Fiscal Year 2009–10
FUNDING SOURCE AMOUNT PER STUDENT
State Appropriation and University of California General Funds (UC general funds)
The state appropriation includes the American Recovery and Reinvestment Act of 2009 (Recovery Act) money. UC general funds include interest income on balances in the general funds fund group; nonresident tuition; and portions of application fees, indirect cost recovery on federal and state research contracts and grants, and patent royalty income.
$10,201
Mandatory Fees
Mandatory fees include all revenue from tuition and student services fees paid by all students.
8,110
Professional Degree Supplemental Tuition
This tuition represents an estimate of professional degree supplemental tuition revenue from general campus programs.
405
Lottery Funds 112
Total $18,828
Source: University of California Office of the President.

California State Auditor Report 2010-105
July 2011
78
Blank page inserted for reproduction purposes only.
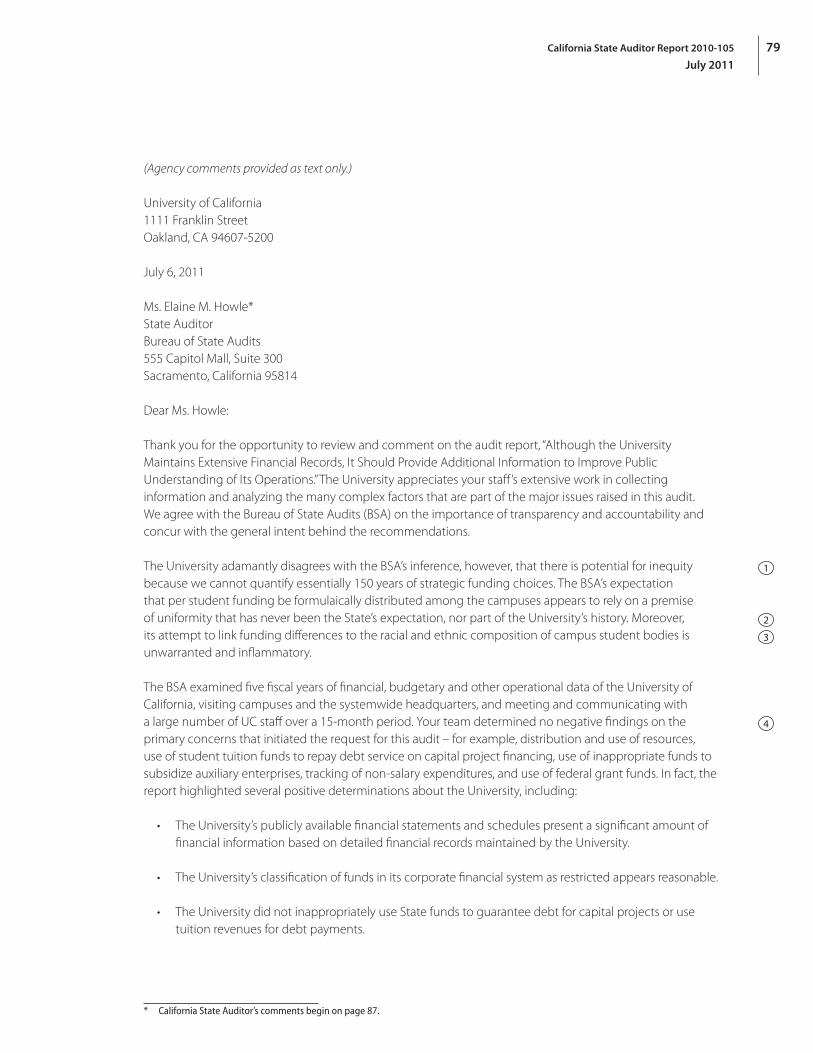
79California State Auditor Report 2010-105
July 2011
(Agency comments provided as text only.)
University of California 1111 Franklin Street Oakland, CA 94607-5200
July 6, 2011
Ms. Elaine M. Howle* State Auditor Bureau of State Audits 555 Capitol Mall, Suite 300 Sacramento, California 95814
Dear Ms. Howle:
Thank you for the opportunity to review and comment on the audit report, “Although the University Maintains Extensive Financial Records, It Should Provide Additional Information to Improve Public Understanding of Its Operations.” The University appreciates your staff’s extensive work in collecting information and analyzing the many complex factors that are part of the major issues raised in this audit. We agree with the Bureau of State Audits (BSA) on the importance of transparency and accountability and concur with the general intent behind the recommendations.
The University adamantly disagrees with the BSA’s inference, however, that there is potential for inequity because we cannot quantify essentially 150 years of strategic funding choices. The BSA’s expectation that per student funding be formulaically distributed among the campuses appears to rely on a premise of uniformity that has never been the State’s expectation, nor part of the University’s history. Moreover, its attempt to link funding differences to the racial and ethnic composition of campus student bodies is unwarranted and inflammatory.
The BSA examined five fiscal years of financial, budgetary and other operational data of the University of California, visiting campuses and the systemwide headquarters, and meeting and communicating with a large number of UC staff over a 15-month period. Your team determined no negative findings on the primary concerns that initiated the request for this audit – for example, distribution and use of resources, use of student tuition funds to repay debt service on capital project financing, use of inappropriate funds to subsidize auxiliary enterprises, tracking of non-salary expenditures, and use of federal grant funds. In fact, the report highlighted several positive determinations about the University, including:
• The University’s publicly available financial statements and schedules present a significant amount of financial information based on detailed financial records maintained by the University.
• The University’s classification of funds in its corporate financial system as restricted appears reasonable.
• The University did not inappropriately use State funds to guarantee debt for capital projects or use tuition revenues for debt payments.
1
2
3
4
* California State Auditor’s comments begin on page 87.

California State Auditor Report 2010-105
July 2011
80
Related to declarations that have previously been made by the University, BSA affirmed the following:
• During the recent fiscal crisis, the University has protected its core mission. University expenses remain concentrated in instruction and research
• While the University has raised tuition in order to maintain quality during a period of declining investment by the State, recent tuition increases have not fully offset the loss of State funds.
• The State’s failure to provide funding for enrollment growth impedes the University’s ability to maintain the quality of the educational program.
This letter serves to provide general comments on the recommendations included in each chapter of the report, including specific actions to address areas of concern.
Chapter 1 – University Revenues and Expenses Have Undergone a Few Significant Changes Over the Past Five Years
We note that this chapter did not include any recommendations.
Chapter 2 – The University Should Complete Its Reexamination of the Campus Base Budgets and Could Improve the Transparency of its Budget Process
General Comments:
As stated earlier, the University adamantly disagrees with the BSA’s analysis and comments inferring an inequitable distribution of funding across campuses. The BSA’s expectation that funding would be distributed on an equal per-student basis ignores the fact that the University is charged with a tripartite mission of instruction, research, and public service, and further ignores the fact that each UC campus is unique, offering its own array of instructional, research and public service programs and facing its own challenges and cost pressures. For example, it is not plausible to expect that the San Francisco campus, devoted exclusively to graduate programs in the health sciences, would receive the same funding per-student as the Santa Cruz campus, which offers no health sciences programs and enrolls less than 10% of its student body at the graduate level.
The Bureau’s assumption that the University should be able to quantify any differences in funding per student belies the fact that the flexibility to make specific, strategic investments in campuses at specific points in time has been a crucial aspect of the University’s success in achieving excellence on all ten of its campuses. Former University President Clark Kerr cited the value of this flexibility in his memoirs and this key factor is no less valid today. The University rejects rigid, formulaic allocations. The University has, over many years, made nuanced, incremental allocations to achieve specific goals and priorities and address specific funding needs that cannot be reduced to a simple formula.
While we object strongly to the way the BSA arrives at its conclusions in this chapter, the University agrees that funding differences among the campuses should be analyzed. To that end, UC is currently engaged in a lengthy review of funding among the campuses (as we describe in more detail below), an effort that
5
1
2
6
7
2
8
9
Ms. Elaine M. Howle July 6, 2011 Page 2

81California State Auditor Report 2010-105
July 2011
had been identified as timely before the BSA audit appeared headed in this direction. However, unlike the BSA finding, there is no pre-determined conclusion underlying this effort. The review may or may not result in changes to the distribution of funding among campuses; if the latter, it will be because the rationale for historical allocations will have been validated, though not necessarily “quantified.”
Finally, we strongly object to the BSA’s use of the variation in the race/ethnicity profiles of our campus student populations to further cast into doubt the integrity of the University’s allocation process. There is absolutely no basis – statistically, historically, or ethically – for drawing such a connection. Furthermore, the BSA makes no investigation into or observation of disproportionate or inequitable treatment or outcomes for students at different campuses. The University of California has a firm commitment to diversity and an extraordinary record when it comes to the persistence and graduation of students from all California communities. Four- and six-year graduation rates for all combinations of race/ethnicity and gender are higher at UC than at 21 public peer institutions. Furthermore, the proportions of low-income and first-generation students are significantly larger at UC campuses than among our public research institution peers. As we have noted above, the flexibility provided to the University to make strategic investments has been critical to its achievement of excellence in this and other areas.
The University’s Allocation Process
Action: As mentioned in the report, the University has formed a systemwide committee to review the historical base budgets. The creation of this committee follows a multi-year consultative effort to comprehensively review the University’s budget processes that began in 2008. This effort has resulted in a series of changes to the budget processes that are being implemented during 2011–12. The systemwide committee, jointly chaired by the University’s Provost and Executive Vice President and the Executive Vice President for Business Operations, consists of campus Chancellors, campus Executive Vice Chancellors, campus Vice Chancellors for Planning and Budget, faculty leadership, and other leadership from the Office of the President.
The committee is charged with developing a methodology for appropriately comparing funding provided to campuses on a per-student basis. The committee will explore the appropriate weights to apply to different types of students, including health sciences and other graduate students, cost variations across campuses, the appropriate treatment of specific programs not tied to the University’s research and public service, and the strategic decisions of past Regents and presidents that should be considered.
Once an appropriate method for comparison is determined, the committee will then consider whether any variation should be ameliorated and the means by which that might occur. The committee’s deliberations will keep in mind the recent budget landscape and the likelihood of renewed State support in the near future. With the latest State budget act, the University has lost more than a quarter of its State support since 2007–08. This decline has dramatically altered the University’s relationship with the State and has lead to significant shifts in the composition of campus budgets. The committee will submit its recommendations to me in December 2011.
8
10
3
Ms. Elaine M. Howle July 6, 2011 Page 3

California State Auditor Report 2010-105
July 2011
82
Transparency of Budget Process
Action: The University is implementing changes to its budget process that will be completed during the 2011–12 fiscal year.
We are discarding our former budget and planning manual and developing a new set of budget guidelines. These guidelines will arise largely from the changes in the budget process being implemented in 2011–12 as well as the dramatic shifts in the University’s budget landscape in recent years. Due to the likelihood of continuing budget changes and the new challenges and priorities that will surely arise , the new guidelines will maintain and reinforce the discretion available to The Regents and the President to make strategic decisions that will enable the University to maintain excellence in all areas of its missions—teaching, research and public service.
Once completed, the new guidelines will be placed on the University’s website.
We believe the campus financial schedules, which we already make public, provide a substantial level of detail to stakeholders. To do the same for budgets we would need to create a whole new system, which would be impractical and inefficient. Following the implementation of the budget process changes during 2011–12 and the review of campus base budgets to be completed in December 2011, the University will develop a mechanism for publishing year-end amounts of State funds budgeted at each campus on the University’s website.
Chapter 3 – Although the University Has Numerous Processes to Provide Detailed Accountability for Various Types of Funding, It Could Improve the Transparency of Its Financial Operations
Transparency of University Funds
General Comments:
Presently, net asset information is available in our Annual Financial Report (posted on our website) at an aggregate level, in the categories of:
• Invested in Capital Assets, Net of Related Debt
• Reserved for Minority Interests
• Restricted, Nonexpendable, Endowments and Gifts
• Restricted, Expendable, Endowments and Gifts
• Restricted, Expendable, Other, Including Debt Service, Loans, Capital Projects and Appropriations
• Unrestricted
Campus general ledgers contain detailed information on net assets, including revenue, expenditures and transfers as well as beginning and ending net assets for departments, schools, programs and other activities. The detail in campus general ledgers enables campus management to make decisions about their local operations.
11
12
Ms. Elaine M. Howle July 6, 2011 Page 4

83California State Auditor Report 2010-105
July 2011
To report in accordance with generally accepted accounting principles, certain year-end entries are recorded in the aggregate (for example, self-insurance accruals, pension and other postemployment benefit accruals) either at the systemwide level or the campus level. Because these transactions are not recorded in individual departments, schools, programs or funds, some individual net asset balances may provide misleading information to the reader. Additionally, certain net assets balances are restricted for use, while others are unrestricted, and can be reallocated between activities at the discretion of the campus.
The University has over 75,000 funds throughout our campuses and medical centers, and information on individual funds would often not be meaningful out of context of the entire University’s financial position. Net assets would be meaningful at an aggregate level only. Thus, our evaluation of this recommendation will include an analysis of whether additional details of net assets could be meaningful to the broader public, especially in light of the significant staff time required to implement this recommendation.
Finally, please note that due to State regulations, there are limitations on our ability to carry forward net assets for State appropriations received from the State of California, therefore, virtually all of the University’s net assets are from sources other than State appropriations. Ultimately our conversations on this topic will be with our Board of Regents, which must determine if our transparency on this topic is appropriate, especially given the trade-off in staff time required to implement the recommendation in its entirety.
Action: We anticipate it will take between 12 and 18 months to review this recommendation and implement any steps that we conclude are valuable to our broader public audience.
Campus Financial Information on Auxiliary Enterprises
General Comments:
Campuses are provided the flexibility to organize and manage their auxiliary operations to meet their individual needs under the University’s Business and Finance Bulletin A-72, Establishment of Auxiliary Enterprises (BFB-72). Generally, auxiliaries are self-supporting, although they are not required to be self-supporting. Other appropriate funds can be used to support auxiliary organizations at the discretion of the chancellor. Donor gifts are an example of funds from other appropriate sources that may be used to support an auxiliary organization. Funds from other sources are only used when permitted. State funds are not appropriate for this purpose.
This report recommends that campuses disclose when auxiliaries are subsidized. While these disclosures are not required under regulatory and financial reporting requirements applicable to the University (such as those issued by the Government Accounting Standards Board of the Integrated Postsecondary Education Data System surveys conducted annually by the U.S. Department’s National Center for Education Statistics), we recognize and understand the importance of transparency in auxiliary operations. As such, we will endeavor to provide a reasonable amount of data to our broader public. We would note however that consistent data on subsidizing auxiliary enterprises from other funding sources is not available. Our enterprise operates on numerous different financial systems, and changing the financial reporting model to gather this data would create an administrative burden for campuses.
Again, we will discuss this with our Board of Regents, which we expect will weigh the benefit of any changes to our reporting systems against the cost, including staff time required.
12
13
12
14
15
Ms. Elaine M. Howle July 6, 2011 Page 5

California State Auditor Report 2010-105
July 2011
84
Action: We will reexamine our reporting model and evaluate whether it should be modified to identify and report subsidies from other funding sources for auxiliary enterprises. We expect the evaluation to take between 12 and 18 months.
Transparency of University Expenses
General Comments:
As stated in previous responses, above, the University is committed to providing significant transparency and accountability in all of our operations. Like any $22 billion organization, however, we operate diverse and varied business units, often on separate financial platforms. This significantly increases the complexity of our financial reporting.
In the University financial systems, the “object code” identifies the type of expenditure. The University collects data from the campuses using over 200 object codes, including one entitled Miscellaneous Services, to consistently classify the information for external regulatory and financial reporting. These codes have been established over the years to track certain categories of expenditures and are listed in our Accounting Manual Chapter A-115-2, Accounting Codes: General Ledger, Exhibit F, List of Valid Object Codes: Expenditures. Object codes are established to (1) comply with regulatory and financial reporting requirements applicable to the University, such as those issued by the Government Accounting Standards Board, (2) submit data to IPEDS (the Integrated Postsecondary Education Data System, surveys conducted annually by the U.S. Department’s National Center for Education Statistics), (3) be consistent with other colleges and universities by reference to guidance published by the National Association of College and University Business Officers (NACUBO), and (4) satisfy the operational reporting needs of management.
Individual campuses have additional details in their financial records, including specific data on payments to vendors. We were not asked to provide additional information on miscellaneous expenses during the audit, and if the information had been requested, we would have been able to provide details from the individual campus financial systems. Should stakeholders request this type of information, we would obtain the information from individual campuses.
Ultimately, if more specific categories of expenditures in miscellaneous services are added, the new categories should be meaningful across all campuses and reflect significant areas of expenditures on a consolidated basis. While each campus has more detail in their financial systems for miscellaneous services at their specific location, due to the diverse activities at each of our campuses, collecting or comparing this information has not been a priority for the University. Establishing more detailed codes for miscellaneous services would entail gathering historical data from each campus to analyze common types of expenditures that could be reported consistently across all of the campuses.
Action: We will carefully consider the need to modify object codes in our chart of accounts, keeping in mind the administrative burden on campuses of making changes to their information systems and the accompanying retraining of staff. This should take between 12 and 24 months.
15
16
17
17
Ms. Elaine M. Howle July 6, 2011 Page 6

85California State Auditor Report 2010-105
July 2011
Use of Revenues Generated From Student Fees Imposed by Referenda
General Comments:
We disagree with this recommendation and strongly dispute BSA’s conclusion that revenue generated by a campus-based student fee on the Los Angeles campus (the SPARC fee) was inappropriately identified to fund two capital projects on the Los Angeles campus.
The University’s Policy on Compulsory Campus-Based Student Fees (Policy) describes “Compulsory campus-based student fees [which] may only be established, increased, or renewed following a referendum in which students vote in favor of the compulsory fees, except as provided in Section 83.00 of these Policies.” These fees and their terms are only effective after approval by The Regents or the President. Once a fee has been imposed by The Regents or the President, the terms of its collection and expenditure are binding throughout the life of the fee. Typically, these terms are the same as those contained in the referendum. However, the Board of Regents (and by delegated authority, the President) retains ultimate authority pursuant to its constitutional autonomy to impose or modify any and all student fees—including those established in response to campus-based referenda. Moreover, a referendum may contain errors, unworkable terms, unacceptable provisions, or ambiguities that The Regents (or the President) may correct when approving the fee. Although The Regents and the President do not take such actions lightly, modifications to fee terms are well within their authority.
After the SPARC fee was approved by The Regents for assessment on the Los Angeles campus, The Regents later approved the use of SPARC fee revenue for two capital projects not specifically named in the referendum passed by students. However, The Regents’ approval of the SPARC fee stated that the revenue could be used for the facilities named in the referendum language “and similar needs of other student-fee supported activity and recreational facilities on the Los Angeles campus.” Because the Regental approval of the SPARC fee included this language, using SPARC fee revenue for the South Campus Student Center project and the intended use of SPARC fee revenue for the Pauley Pavilion project is consistent with the purpose of the fee as defined by The Regents’ action. In addition, a student-majority advisory board created via the SPARC fee referendum, the Student Activities Center Board of Governors (SAC BOG), voted in favor of supporting the use of SPARC fee revenue to contribute towards the South Campus Student Center project.
The BSA also refers to a California court ruling as support for its finding that The Regents (and by delegated authority, the President) do not maintain authority to modify campus-based fees. For the purposes of this audit, the University assumes that the BSA refers to the California Court of Appeal ruling in Kashmiri v. Regents of the University of California.
That ruling, however, does not stand for the proposition that the BSA asserts. Rather the Kashimiri ruling is limited to its specific circumstances. The Court concluded that the University could not increase student fees (1) for a specific academic term once the University had issued student bills for that term and (2) if the University had explicitly advised students that certain professional degree fees would remain constant over a period of time. As such, the principles asserted in Kashmiri do not apply to the general terms of (including the use of funds generated by) the SPARC Fee or any other campus-based student fee.
18
18
19
18
18
18
Ms. Elaine M. Howle July 6, 2011 Page 7

California State Auditor Report 2010-105
July 2011
86
Action: To ensure that campuses and students are aware of the appropriate use revenues generated from campus-based student fees, as appropriate, the University plans to review its Policy on Compulsory Campus‑Based Student Fees and revise the Policy and/or issue guidelines to further clarify that student referendum results are solely advisory to The Regents and the President.
In closing, while we disagree strongly with certain conclusions and commentary in the BSA’s report, we fully support what we believe was the intent of this audit – to continue to enhance the transparency of the University’s performance, with the end goal of improving the public’s understanding of our operations and facilitate accountability to our stakeholders. We take BSA’s recommendations very seriously and, in many cases, we have already put measures in place that are in line with the intent of the recommendations in this report.
With that said, I cannot help but comment on the extraordinary time and effort – and considerable expense on the part of the BSA and the University – that went into this audit, which in the end found only minor issues to address. We are proud of the fact that we have come through this review with validation of so many of our procedures and policies which in recent years have come under considerable public scrutiny. But, at what cost? I urge the Legislative Audit Committee to require those who seek to use the limited audit resources of the State to provide more evidence of malfeasance than innuendo and presupposition behind their requests.
I want to express our appreciation to the management and staff of the BSA for their professional efforts in conducting this audit. Our interactions were collaborative and informative as much for us as we hope they were for them.
Sincerely yours,
(Signed by: Mark G. Yudof )
Mark G. Yudof President
cc: Senior Vice President and Chief Compliance & Audit Officer Vacca
20
Ms. Elaine M. Howle July 6, 2011 Page 8

87California State Auditor Report 2010-105
July 2011
Comments
CALIFORNIA STATE AUDITOR’S COMMENTS ON THE RESPONSE FROM THE UNIVERSITY OF CALIFORNIA
To provide clarity and perspective, we are commenting on the response from the University of California (university). The numbers below correspond to the numbers we have placed in the margins of the university’s response.
The university is incorrect in its statement that we infer that there is potential for inequity. On page 37 we stated that because the per‑student amounts vary so much among the campuses and have not been quantitatively explained, the University of California Office of the President (Office of the President) increases the risk that stakeholders may view the per‑student amounts as inequitable. Further, the university is incorrect if it believes that we expect it to review 150 years of strategic funding choices. We did not specify a period of time for which it should review its funding decisions. On page 43 we recommended that the university complete its reexamination of the base budgets to the campuses.
We question the university’s objection to using formulas to distribute funding among the campuses. According to the Office of the President, the university has distributed enrollment growth funding to the campuses formulaically for many years. Further, the university is incorrect in its statements on page 2 of its response that we expect that funding would be distributed on an equal per‑student basis and that we ignored that its mission includes instruction, research, and public service. On page 31 of our report, we acknowledge this mission when we state that because the Office of the President does not provide all money to the campuses on a per‑student basis (for example, funding for specific research and public service programs), we understand that differences in the amount of funding per student likely will exist.
We disagree with the university’s statement that our discussion of funding differences and the racial and ethnic composition of campus student bodies is unwarranted and inflammatory and its statement on page 3 of its response that there is no basis for drawing such a connection. As we noted on page 37 of our report, when considered together, it is reasonable to conclude that the decisions resulting from the budget, enrollment, and admissions decision processes can affect the education an individual student receives from the university. We also stated on page 37 of our report that although we found no evidence that the Office of the President considered the racial or ethnic makeup of the campuses’ enrollments as part of its budget process, the process resulted in
1
2
3

California State Auditor Report 2010-105
July 2011
88
lower than average per‑student base budgets for the four campuses that have a higher proportion of students from underrepresented racial or ethnic groups.
The university’s statement that we determined no negative findings on the primary concerns that initiated the request for the audit ignores the approved audit objectives we were asked to examine by the Joint Legislative Audit Committee. All findings and recommendations in our report are related to these audit objectives.
We did not state in our report that during the recent fiscal crisis the university has protected its core mission. However, we did state on page 23 of our report that the majority of the university’s expenses remained concentrated in instruction and research.
The university is mistaken if it believes that we would expect the San Francisco and Santa Cruz campuses to receive the same level of total funding per student. As we discuss on pages 32 through 36 of our report, we acknowledge the four factors that the university identified as contributing to variances, including the size of a campus’s health sciences program and the amount of support provided for graduate students. However, as we state in our recommendation on page 43 of our report, the university should identify the amount of general funds and tuition budget revenues that each campus receives for specific types of students (such as undergraduate, graduate, and health sciences) and explain any differences in the amount provided per student among the campuses. While we would not expect the university to explain any difference between the amount of funds provided for health sciences graduate students at the San Francisco campus and the amount of funds provided for other types of students at the Santa Cruz campus, we would expect the university to explain the differences in the amounts of funds provided for similar types of students (e.g. health sciences graduate students) among the campuses.
The university is incorrect that we misrepresented the university’s flexibility to make specific, strategic investments in campuses has been a crucial aspect of its success. We state in our recommendation on page 43 that when reviewing the base budgets for the campuses, it should consider several factors including specific research and public service programs at each campus, and other factors applied consistently across campuses.
Despite the university’s objections about the way we arrived at our conclusions and its assertion on page 3 of its response that a predetermined conclusion was underlying our work, we stand behind the work we performed. As we state on page 64, we conducted this audit according to generally accepted
4
5
6
7
8

89California State Auditor Report 2010-105
July 2011
government auditing standards. Those standards require that we obtain sufficient, appropriate evidence to provide a reasonable basis for our findings and conclusions. Further, we state in our recommendation on page 43 regarding the university’s review of campus base budgets that, after accounting for the various factors we discussed, the university should address any remaining variations in campus funding over a specified period of time. We therefore understand that the possibility exists that the university’s review of the base budgets for each campus may not identify the need to adjust funding amounts for some campuses.
Some readers may incorrectly infer from the university’s comment regarding its identification of the need to engage in a review of the funding differences among the campuses before the Bureau of State Audits’ audit appeared headed in this direction that this topic was not a part of our original audit scope. As we note in our report’s scope and methodology on page 9, we were requested to review and evaluate the policies and practices that the university uses to track and allocate public funding.
We believe that the university’s assertion that it will validate the methodology for historical allocations but not necessarily quantify the amounts does not go far enough. As we state in our recommendation on page 43 of our report, the university should identify the amount of general funds and tuition budget funding that each campus receives for different types of students and explain any differences in the amount provided.
The university’s publication of year‑end amounts of state funding budgeted at each campus on its Web site will not sufficiently address our recommendation for two reasons. First, public funding includes more than just state funding. As we mention on page 9, we defined public funding as that which the university obtained as part of its regular course of business, including revenues provided by a government entity, student tuition and fees, and auxiliary enterprises. Second, budget building is an effort that begins long before a fiscal year ends. We believe that the Office of the President should make available budget information as soon as it informs campuses of their budget amounts. If these amounts change during a fiscal year, the university should also promptly make this information available.
We recognize that the net assets (what we call beginning or ending balances for a fund) for certain funds may not reflect certain systemwide or campus level accruals. However, we believe that the advantages achieved through disclosing beginning and ending balances for the university’s public funds outweigh any disadvantages. Further, we disagree with the university’s statement that net assets would be meaningful at only an aggregate level.
9
10
11
12
California State Auditor Report 2010-105
July 2011
90
As we state on page 50 of our report, without this type of fund information, stakeholders do not have all the information they need to monitor the university’s financial performance.
The statement that the university has over 75,000 funds does not agree with information in our audit report. As we indicate on page 9, we identified about 103,000 funds for fiscal year 2009–10 through our analysis of detailed electronic financial records from the university’s corporate financial system. We stand by our work.
We appreciate the university’s concern about the trade‑off in staff time to implement this recommendation. In that light, the university may wish to consider implementing a Web site similar to the one we created that contains supplemental accounting information we obtained during this audit. On our Web site, we present a link (www.bsa.ca.gov/reports/2010‑105/) to information related to public funding from the university’s corporate financial system related to fund categories; fund groups; and funds that includes beginning balances, revenues, expenses, transfers, and ending balances. Our information technology team created this Web site using fewer than 60 hours of staff time. We therefore fail to see why the university believes it needs between 12 and 18 months to review and implement this recommendation.
The university appears to be reading too much into our recommendation on page 63 that it disclose instances when campuses subsidize auxiliary enterprises with revenues from other funding sources and disclose the sources of that funding. The Berkeley campus’s subsidizing of the intercollegiate athletics auxiliary enterprise is the only instance of subsidizing that came to our attention during the audit. Unless the university expects campuses to subsidize auxiliary enterprises far more frequently than has happened in the recent past, the administrative burden and the time involved in changing its financial reporting model that the university mentions would not seem to be a reasonable investment of limited resources.
The university’s statements that the campuses had more detailed information regarding the Miscellaneous Services object code and that it would have provided this information had we asked for it is irrelevant. As we state on page 9, the approach of this audit was to focus on information that was centrally contained within the Office of the President to the extent possible.
The university states that “collecting or comparing” the Miscellaneous Services information has not been a priority because of the diverse activities on its campuses. As we mention on page 51 of our report, lumping such a large amount of expenses—about $6 billion over the five years we examined or about 25 percent of its public noncompensation expenses—into a single accounting
13
14
15
16
17

91California State Auditor Report 2010-105
July 2011
code impedes the ability of the university and its stakeholders to analyze and understand these expenses at a systemwide level. Further, the university’s estimate of between 12 and 24 months to review and implement this recommendation seems overly long based on the steps it described it would take.
The university includes several inaccurate statements in this section of its response. These statements include that it “retains ultimate authority pursuant to its constitutional autonomy to impose or modify any and all student fees,” that we conclude that the university does not have the authority to modify campus‑based fees, and that the court’s ruling “does not stand for the proposition that [the bureau] asserts.” We state on page 57 of our report that courts have placed restrictions on the university’s ability to modify any and all fees. The court’s award of $28 million in damages supports the point that the university’s authority to raise fees is not “ultimate.” Also, we did not conclude that the university lacked the authority to modify campus‑based fees; our comments address only the two projects we examined. We state on page 57 of our report that, according to our legal counsel, neither the policies in place when students approved the Student Programs, Activities, and Resource Center (SPARC) fee referendum nor Item 7 of the SPARC referendum provide a sufficient basis for expanding the uses of the fee beyond those purposes stated in the original referendum.
The university’s statement that a board voted in favor of supporting the use of SPARC fee revenue is irrelevant. The referendum did not give this board the authority to expand the use of SPARC fee revenues. As we state on page 56 of our report, the role of the Wooden Center Board of Governors and the Student Fee Advisory Committee is to periodically report [emphasis added] to the Chancellor and Vice Chancellor–Student Affairs on their evaluation of the needs of future student generations for facilities on campus.
The university’s statement that the bureau “found only minor issues to address” relative to the time and effort invested in the audit is an opinion, not a fact. We stand by our conclusions and recommendations as a value‑added service provided not only to the university but also to its stakeholders, including the public and the Legislature. Clearly, because we included the issues we identified during audit fieldwork in our 77‑page audit report, we believed them to be sufficiently important to share with the university and its stakeholders. These issues include variations in per‑student budget amounts that we describe in Chapter 2. Because the university has not quantified the variations among the campuses, stakeholders cannot be assured that state funding is equitably distributed to the campuses. Further, these issues also include the need for increased transparency that we describe in both Chapter 2 and Chapter 3. As we state on page 38, when organizations operate transparently, stakeholders are able to access greater amounts of information and help hold decision makers accountable for their decisions.
18
19
20

California State Auditor Report 2010-105
July 2011
92
cc: Members of the LegislatureOffice of the Lieutenant GovernorMilton Marks Commission on California State
Government Organization and EconomyDepartment of FinanceAttorney GeneralState ControllerState TreasurerLegislative AnalystSenate Office of ResearchCalifornia Research BureauCapitol Press