Embed Size (px)
Citation preview
INDEPENDENT ENVIRONMENTAL ENGINEERS, SCIENTISTS AND CONSULTANTS
25th Annual Region VI Pretreatment Association Workshop
August 5, 2009
Wastewater Rate Equity – Cost of Service, Customer Classes &
Surcharges

INDEPENDENT ENVIRONMENTAL ENGINEERS, SCIENTISTS AND CONSULTANTS
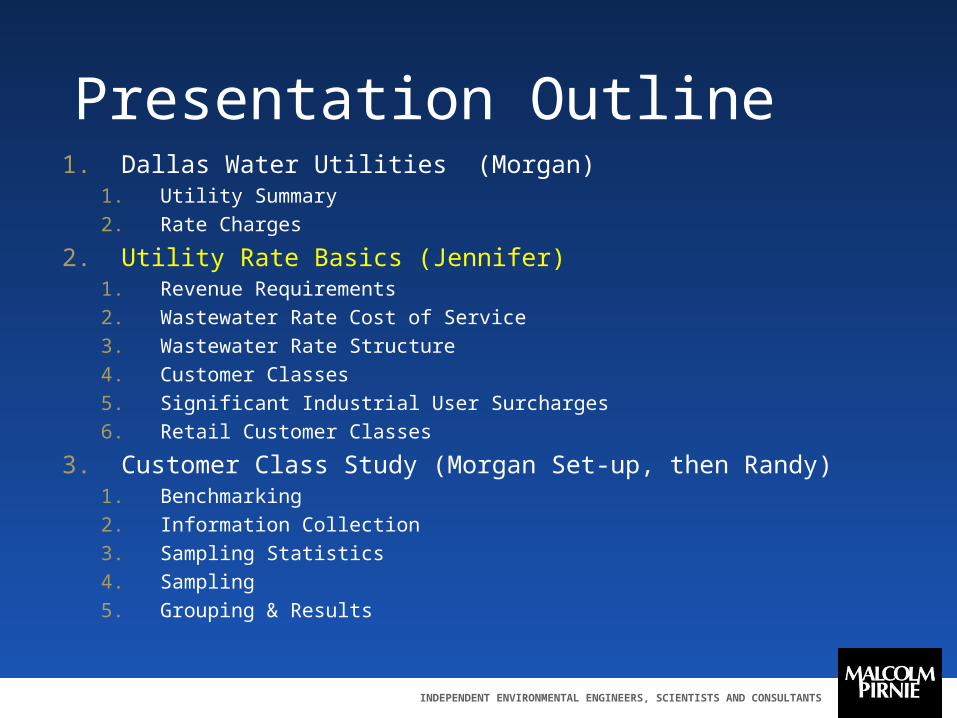
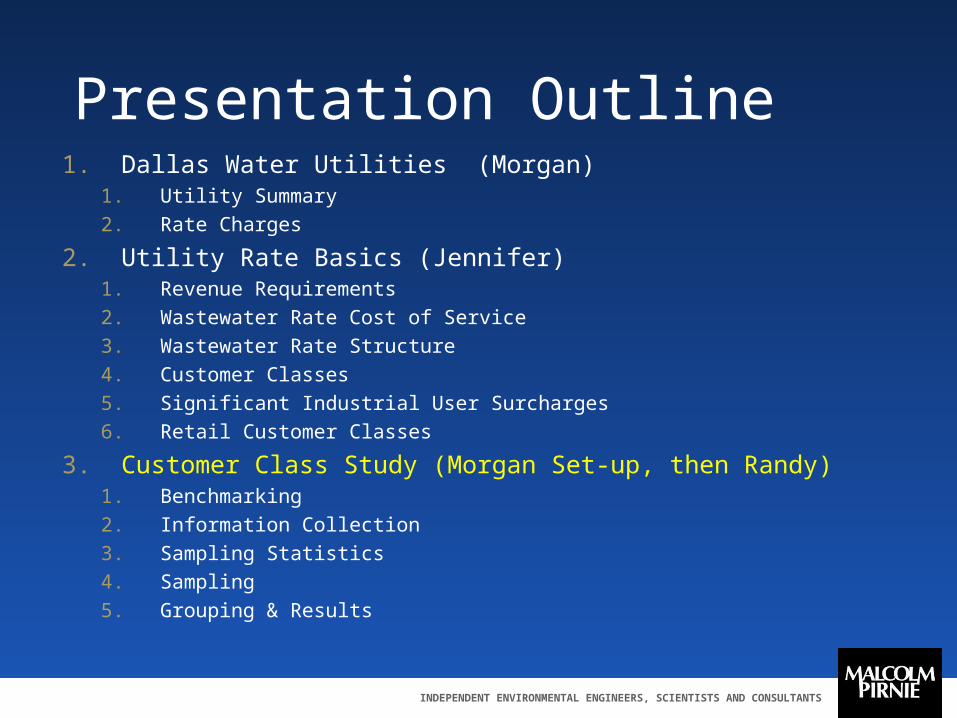
Presentation Outline1. Dallas Water Utilities (Morgan)
1. Utility Summary
2. Rate Charges
2. Utility Rate Basics (Jennifer)1. Revenue Requirements
2. Wastewater Rate Cost of Service
3. Wastewater Rate Structure
4. Customer Classes
5. Significant Industrial User Surcharges
6. Retail Customer Classes
3. Customer Class Study (Morgan Set-up, then Randy)1. Benchmarking
2. Information Collection
3. Sampling Statistics
4. Sampling
5. Grouping & Results
INDEPENDENT ENVIRONMENTAL ENGINEERS, SCIENTISTS AND CONSULTANTS
Dallas Water Utilities is a large, Municipally owned regional water/wastewater supplier
Self-supporting Costs are driven by infrastructure
requirements for both growth and renewal Responsibility for planning for water
requirements for service area
INDEPENDENT ENVIRONMENTAL ENGINEERS, SCIENTISTS AND CONSULTANTS
The department is funded from water and wastewater revenues, and receives no tax dollars
Approximately 1,500 employees Population served (treated water)
1.3 million - City of Dallas 960,000+ wholesale customer cities
699 square mile service area 306,000 retail customer accounts 4,850 miles of water mains 4,200 miles of wastewater mains 3 water treatment plants 2 wastewater treatment plants Wholesale customers
24 treated water, 3 untreated water, 11 wastewater
City of Dallas Water Utilities Fact Sheet
INDEPENDENT ENVIRONMENTAL ENGINEERS, SCIENTISTS AND CONSULTANTS
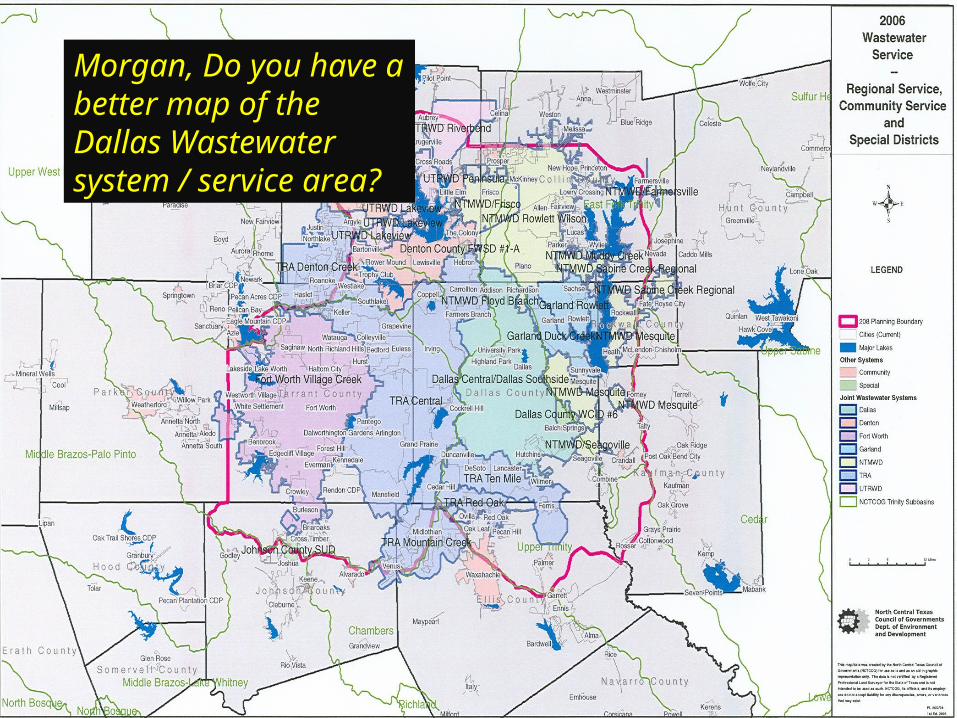
Morgan, Do you have a better map of the Dallas Wastewater system / service area?
INDEPENDENT ENVIRONMENTAL ENGINEERS, SCIENTISTS AND CONSULTANTS
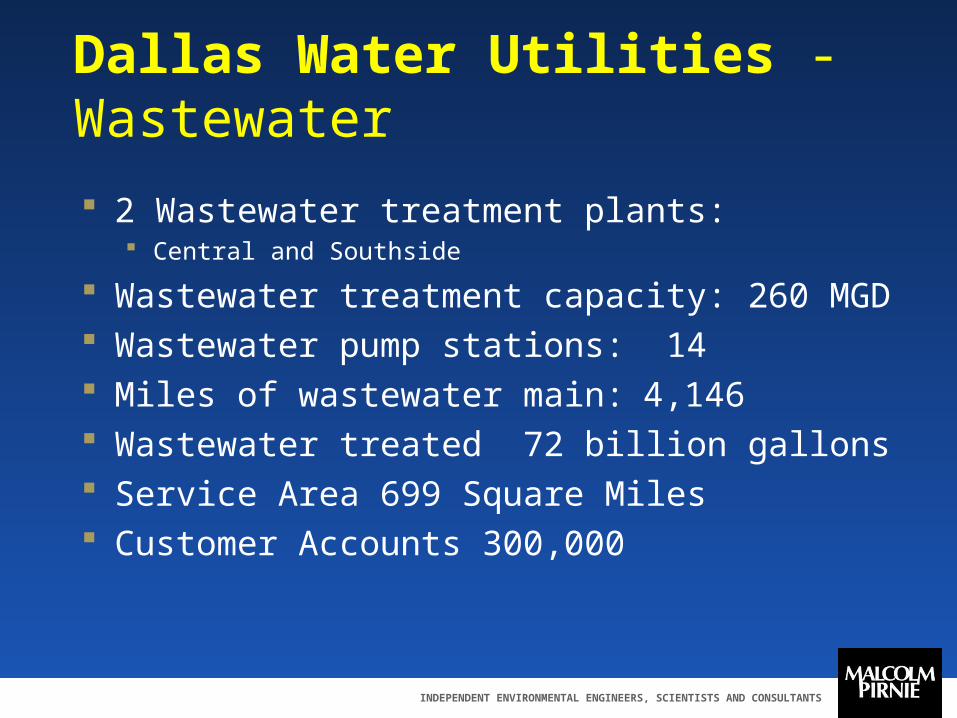
Dallas Water Utilities - Wastewater
2 Wastewater treatment plants: Central and Southside
Wastewater treatment capacity: 260 MGD Wastewater pump stations: 14 Miles of wastewater main: 4,146 Wastewater treated 72 billion gallons Service Area 699 Square Miles Customer Accounts 300,000
INDEPENDENT ENVIRONMENTAL ENGINEERS, SCIENTISTS AND CONSULTANTS
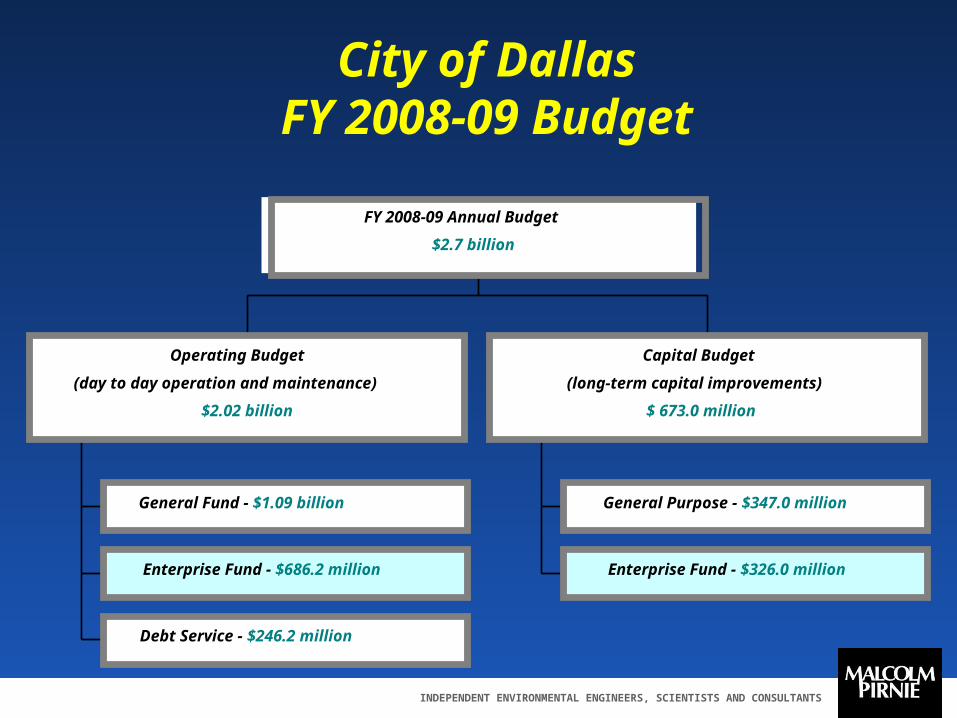
General Fund - $1.09 billion
Enterprise Fund - $686.2 million
Debt Service - $246.2 million
Operating Budget
(day to day operation and maintenance)
$2.02 billion
General Purpose - $347.0 million
Enterprise Fund - $326.0 million
Capital Budget
(long-term capital improvements)
$ 673.0 million
FY 2008-09 Annual Budget
$2.7 billion
City of DallasFY 2008-09 Budget
INDEPENDENT ENVIRONMENTAL ENGINEERS, SCIENTISTS AND CONSULTANTS
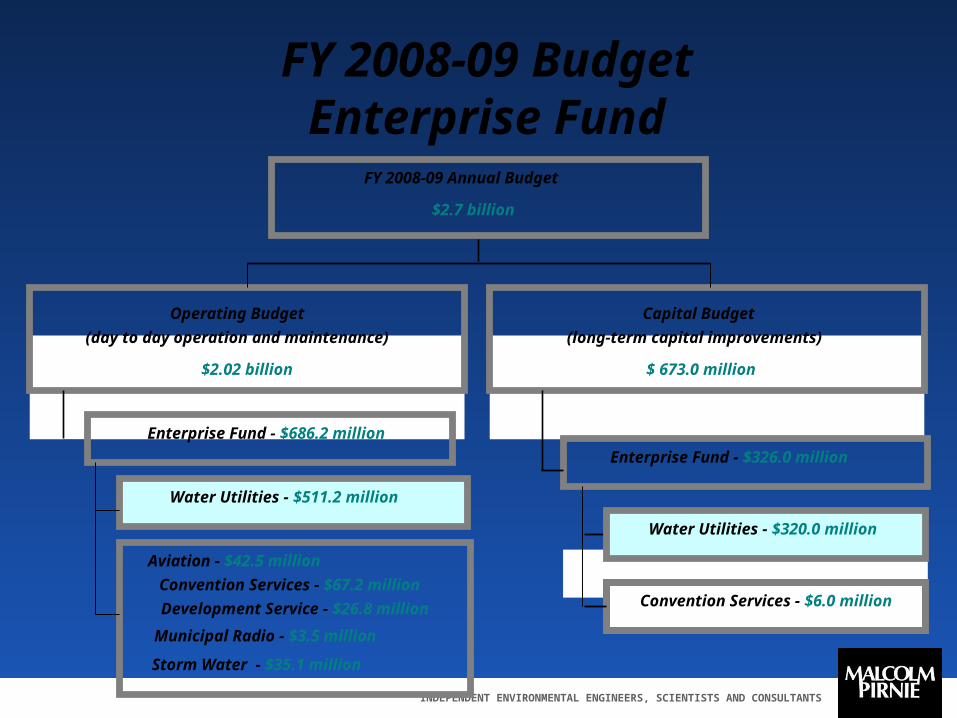
Water Utilities - $511.2 million
Operating Budget
(day to day operation and maintenance)
$2.02 billion
Enterprise Fund - $326.0 million
Water Utilities - $320.0 million
Capital Budget
(long-term capital improvements)
$ 673.0 million
FY 2008-09 Annual Budget
$2.7 billion
FY 2008-09 BudgetEnterprise Fund
Enterprise Fund - $686.2 million
Convention Services - $6.0 million
Aviation - $42.5 million
Development Service - $26.8 million
Convention Services - $67.2 million
Storm Water - $35.1 million
Municipal Radio - $3.5 million
INDEPENDENT ENVIRONMENTAL ENGINEERS, SCIENTISTS AND CONSULTANTS
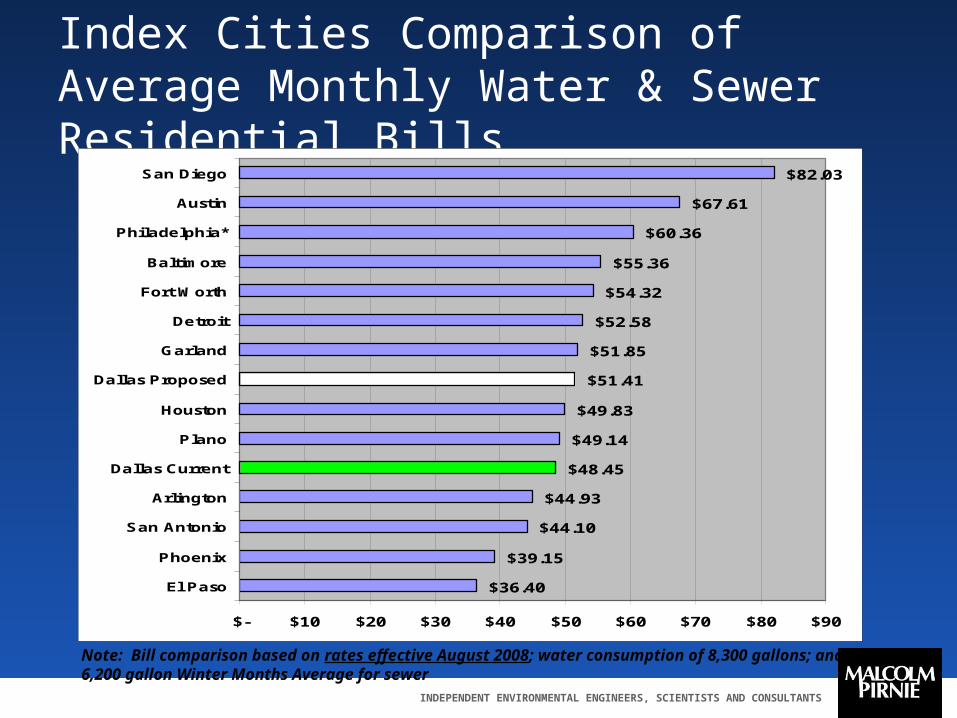
Index Cities Comparison of Average Monthly Water & Sewer Residential Bills
Note: Bill comparison based on rates effective August 2008; water consumption of 8,300 gallons; and, 6,200 gallon Winter Months Average for sewer
$36.40
$39.15
$44.10
$44.93
$48.45
$49.14
$49.83
$51.41
$51.85
$52.58
$54.32
$55.36
$60.36
$67.61
$82.03
$- $10 $20 $30 $40 $50 $60 $70 $80 $90
El Paso
Phoenix
San Antonio
Arlington
Dallas Current
Plano
Houston
Dallas Proposed
Garland
Detroit
Fort Worth
Baltimore
Philadelphia*
Austin
San Diego
INDEPENDENT ENVIRONMENTAL ENGINEERS, SCIENTISTS AND CONSULTANTS
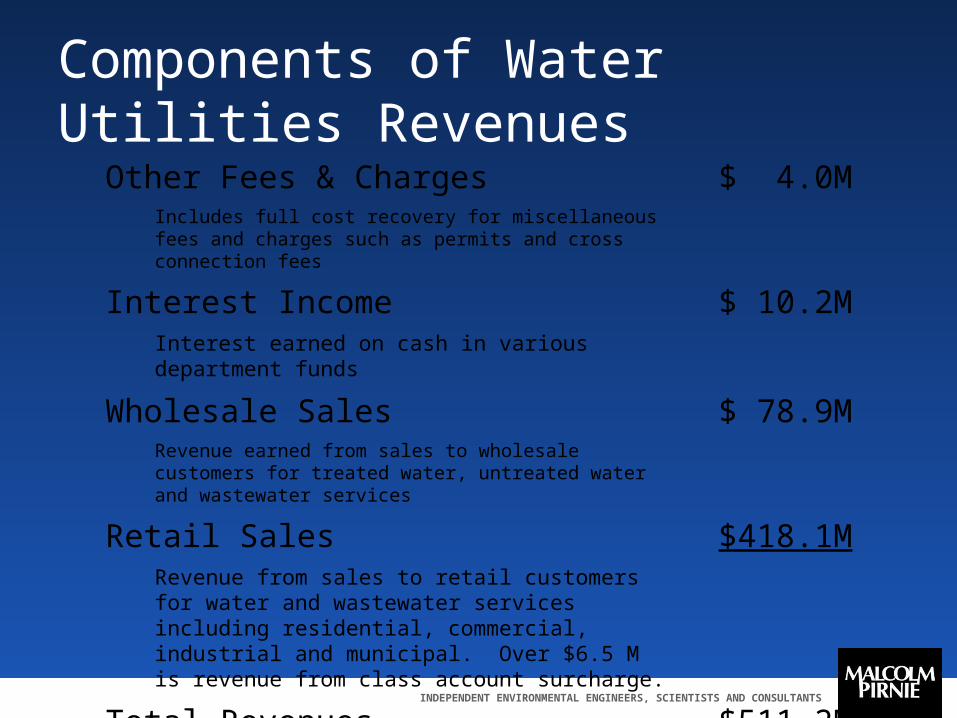
Components of Water Utilities Revenues
Other Fees & Charges $ 4.0MIncludes full cost recovery for miscellaneous fees and charges such as permits and cross connection fees
Interest Income $ 10.2MInterest earned on cash in various department funds
Wholesale Sales $ 78.9MRevenue earned from sales to wholesale customers for treated water, untreated water and wastewater services
Retail Sales $418.1MRevenue from sales to retail customers for water and wastewater services including residential, commercial, industrial and municipal. Over $6.5 M is revenue from class account surcharge.
Total Revenues $511.2M
INDEPENDENT ENVIRONMENTAL ENGINEERS, SCIENTISTS AND CONSULTANTS
Surcharge Program
A Surcharge program is a procedure for recovering costs incurred while treating high strength waste discharged by industrial (SIU Surcharge Program) and commercial users (Customer Classes) into the wastewater system.
It is an additional charge made to a customer that discharges high strength wastewater that is amenable to treatment by the wastewater system but that exceeds the strength of normal wastewater.
INDEPENDENT ENVIRONMENTAL ENGINEERS, SCIENTISTS AND CONSULTANTS
DWU Customer Class Groups
Non-industrial (SIU) customers that routinely discharge Biochemical Oxygen Demand (BOD) and Total Suspended Solids (TSS) concentrations exceeding 250 mg/L are classified into the four class groups established under Dallas City Code Eating Places Equipment Service Facilities Food and Kindred Products Processing Drinking Places
INDEPENDENT ENVIRONMENTAL ENGINEERS, SCIENTISTS AND CONSULTANTS
Presentation Outline1. Dallas Water Utilities (Morgan)
1. Utility Summary
2. Rate Charges
2. Utility Rate Basics (Jennifer)1. Revenue Requirements
2. Wastewater Rate Cost of Service
3. Wastewater Rate Structure
4. Customer Classes
5. Significant Industrial User Surcharges
6. Retail Customer Classes
3. Customer Class Study (Morgan Set-up, then Randy)1. Benchmarking
2. Information Collection
3. Sampling Statistics
4. Sampling
5. Grouping & Results
INDEPENDENT ENVIRONMENTAL ENGINEERS, SCIENTISTS AND CONSULTANTS
Principal Objectives of Rate Design & Cost-of-Service Study
Develop a comprehensive cost-of-service study that properly allocates costs to each customer class to ensure a fair and equitable rate structure.
Design Rate Structure that meets community values.
INDEPENDENT ENVIRONMENTAL ENGINEERS, SCIENTISTS AND CONSULTANTS
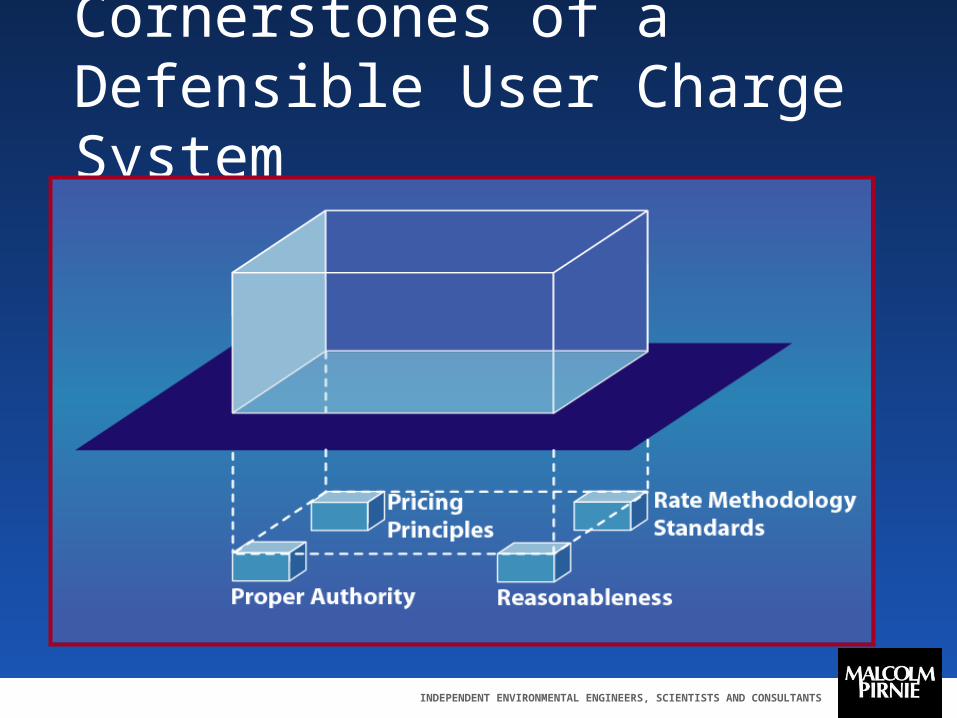
Cornerstones of a Defensible User Charge System
INDEPENDENT ENVIRONMENTAL ENGINEERS, SCIENTISTS AND CONSULTANTS
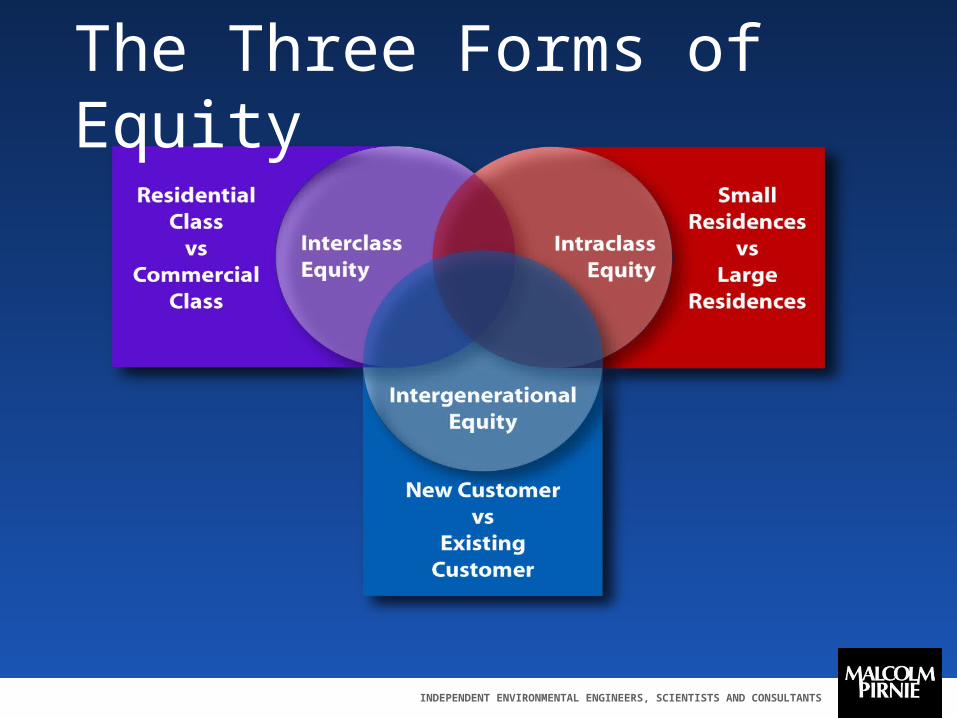
The Three Forms of Equity
INDEPENDENT ENVIRONMENTAL ENGINEERS, SCIENTISTS AND CONSULTANTS
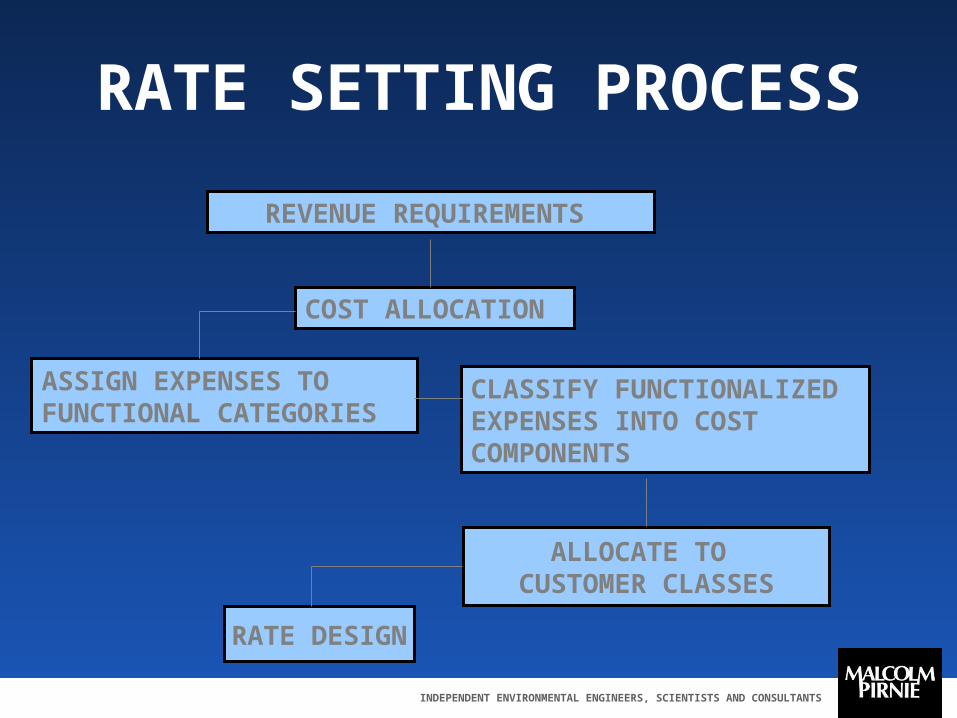
RATE SETTING PROCESS
REVENUE REQUIREMENTS
COST ALLOCATION
ASSIGN EXPENSES TOFUNCTIONAL CATEGORIES
CLASSIFY FUNCTIONALIZEDEXPENSES INTO COSTCOMPONENTS
ALLOCATE TO CUSTOMER CLASSES
RATE DESIGN
INDEPENDENT ENVIRONMENTAL ENGINEERS, SCIENTISTS AND CONSULTANTS
INDEPENDENT ENVIRONMENTAL ENGINEERS, SCIENTISTS AND CONSULTANTS
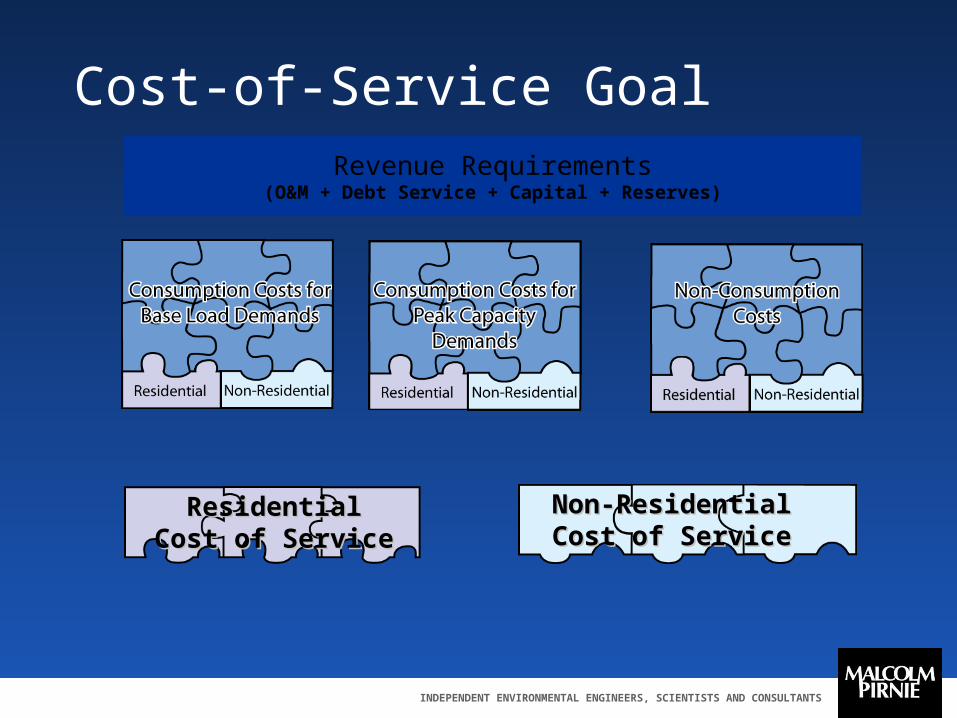
Cost-of-Service GoalRevenue Requirements
(O&M + Debt Service + Capital + Reserves)
ResidentialResidentialCost of ServiceCost of Service
Non-ResidentialNon-ResidentialCost of ServiceCost of Service
INDEPENDENT ENVIRONMENTAL ENGINEERS, SCIENTISTS AND CONSULTANTS
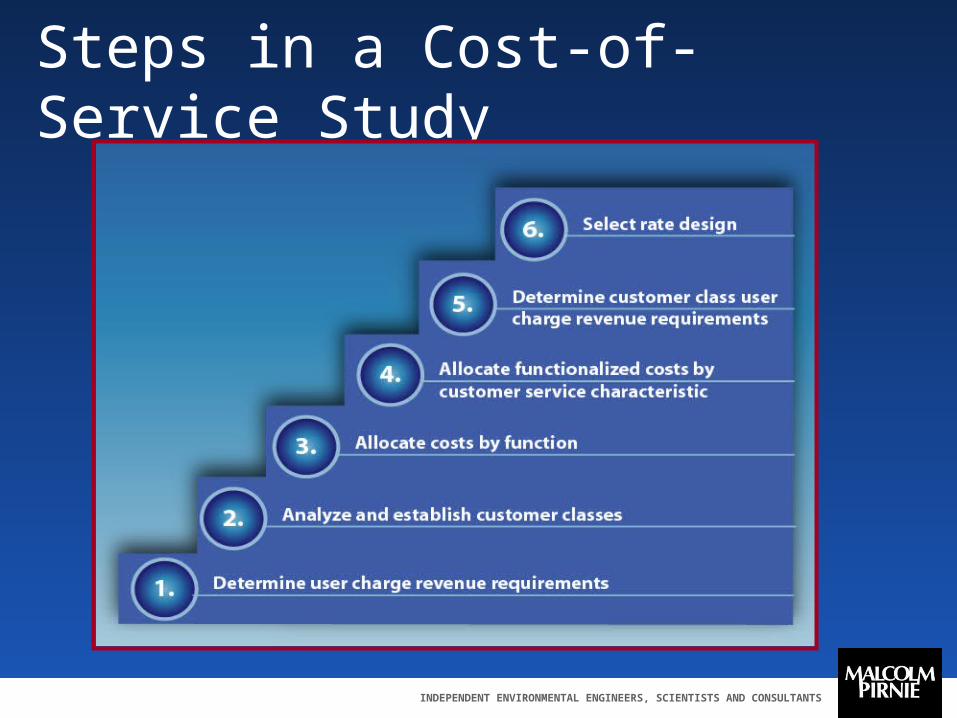
Steps in a Cost-of-Service Study
INDEPENDENT ENVIRONMENTAL ENGINEERS, SCIENTISTS AND CONSULTANTS
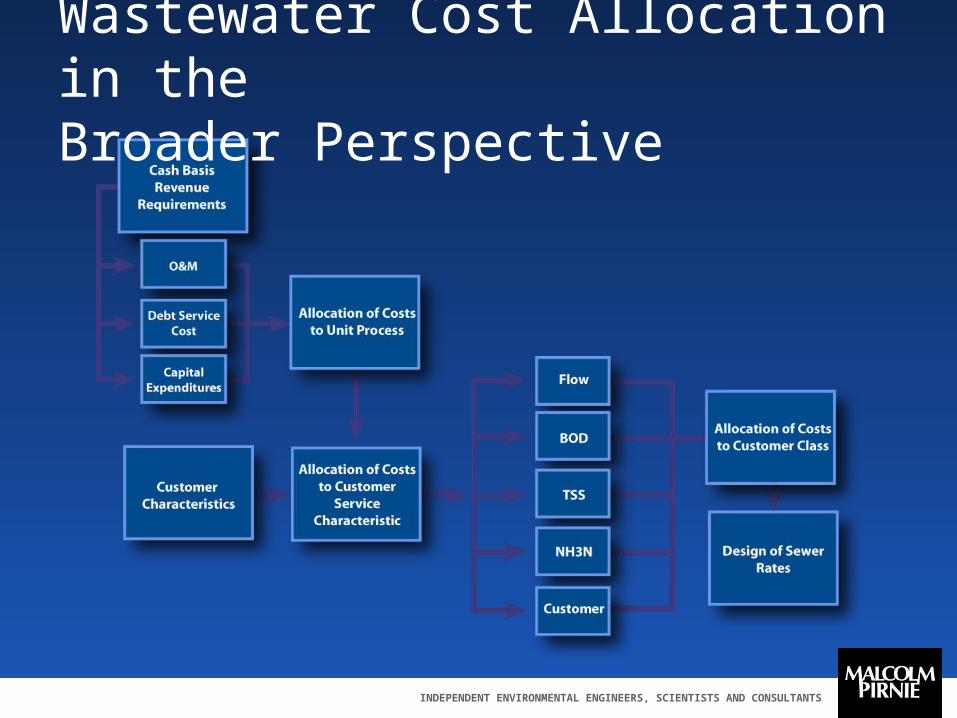
Wastewater Cost Allocation in the Broader Perspective
INDEPENDENT ENVIRONMENTAL ENGINEERS, SCIENTISTS AND CONSULTANTS
Issue 1: Wastewater Cost Allocation Options
Design Basis Functional Basis Hybrid Approach
INDEPENDENT ENVIRONMENTAL ENGINEERS, SCIENTISTS AND CONSULTANTS
Design Basis
Allocates costs based on engineering design criteria Less administrative burden Least implementation risk Potential positive impact on conservation due to
increased unit cost for wastewater treatment and disposal
INDEPENDENT ENVIRONMENTAL ENGINEERS, SCIENTISTS AND CONSULTANTS
Functional Basis
Allocates costs based on operational or functional purposes
Minimal administrative burden
INDEPENDENT ENVIRONMENTAL ENGINEERS, SCIENTISTS AND CONSULTANTS
Hybrid Approach
Allocates O&M costs based on function and capital costs based on design
More acceptable to public and political officials Increased administrative burden Improved interclass and intraclass equity Improved sustainability Recommended by consulting team
INDEPENDENT ENVIRONMENTAL ENGINEERS, SCIENTISTS AND CONSULTANTS
Issue 2: Customer Service Characteristics
Flow, BOD, and TSS only Considerations
Add Total Kjeldahl Nitrogen (TKN)? Add Phosphorus? Add O&G?
INDEPENDENT ENVIRONMENTAL ENGINEERS, SCIENTISTS AND CONSULTANTS
Flow, BOD, and TSS Only
DWU’s current methodology Least administrative burden Most common approach
INDEPENDENT ENVIRONMENTAL ENGINEERS, SCIENTISTS AND CONSULTANTS
Add Total Kjeldahl Nitrogen (TKN)
Difficult to implement without additional data Likely to become increasingly important in future (policy
durability – discharge permits) Improved interclass and intraclass equity Improved sustainability Recommended (once sufficient data is available from
sampling program)
INDEPENDENT ENVIRONMENTAL ENGINEERS, SCIENTISTS AND CONSULTANTS
Add Phosphorus
Difficult to implement without additional data Likely to become increasingly important in future (policy
durability) Improved interclass and intraclass equity Improved sustainability Recommended (once sufficient data is available from
sampling program)
INDEPENDENT ENVIRONMENTAL ENGINEERS, SCIENTISTS AND CONSULTANTS
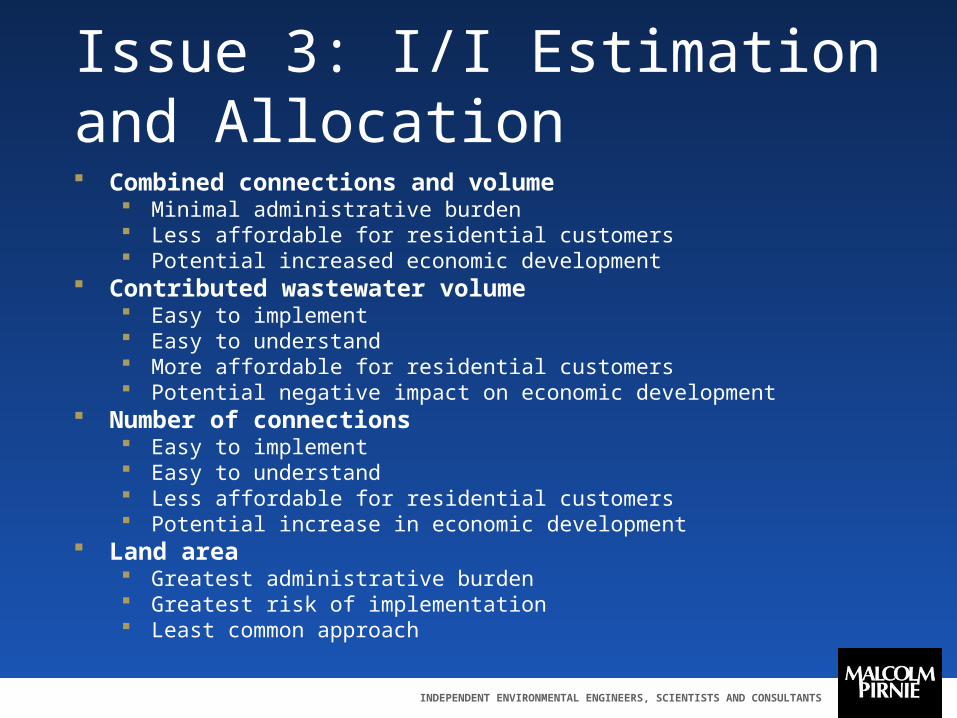
Issue 3: I/I Estimation and Allocation Combined connections and volume
Minimal administrative burden Less affordable for residential customers Potential increased economic development
Contributed wastewater volume Easy to implement Easy to understand More affordable for residential customers Potential negative impact on economic development
Number of connections Easy to implement Easy to understand Less affordable for residential customers Potential increase in economic development
Land area Greatest administrative burden Greatest risk of implementation Least common approach
INDEPENDENT ENVIRONMENTAL ENGINEERS, SCIENTISTS AND CONSULTANTS
Presentation Outline1. Dallas Water Utilities (Morgan)
1. Utility Summary
2. Rate Charges
2. Utility Rate Basics (Jennifer)1. Revenue Requirements
2. Wastewater Rate Cost of Service
3. Wastewater Rate Structure
4. Customer Classes
5. Significant Industrial User Surcharges
6. Retail Customer Classes
3. Customer Class Study (Morgan Set-up, then Randy)1. Benchmarking
2. Information Collection
3. Sampling Statistics
4. Sampling
5. Grouping & Results
INDEPENDENT ENVIRONMENTAL ENGINEERS, SCIENTISTS AND CONSULTANTS
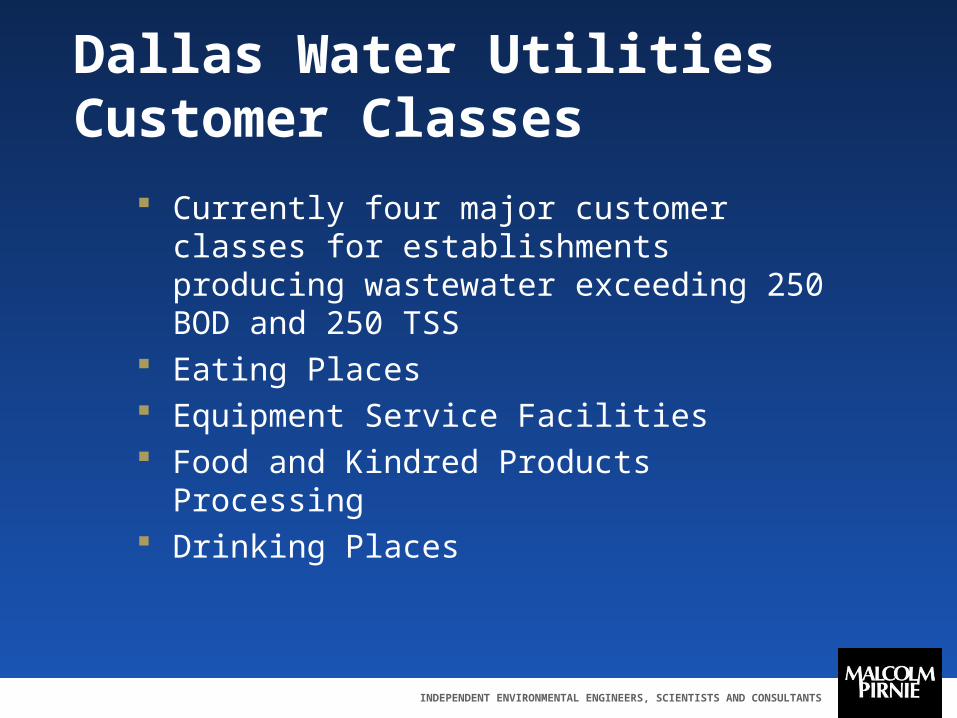
Dallas Water Utilities Customer Classes
Currently four major customer classes for establishments producing wastewater exceeding 250 BOD and 250 TSS
Eating Places Equipment Service Facilities Food and Kindred Products Processing Drinking Places

INDEPENDENT ENVIRONMENTAL ENGINEERS, SCIENTISTS AND CONSULTANTS
Surcharge Class Study Phase I
1. Benchmark Other Utilities
2. Develop Database Structure & Populate with Existing Data
3. Screen Database to Develop Study Groups
4. Develop Statistical Sampling Approach based on Study Groups
5. Develop Sampling & Analysis Plan
INDEPENDENT ENVIRONMENTAL ENGINEERS, SCIENTISTS AND CONSULTANTS
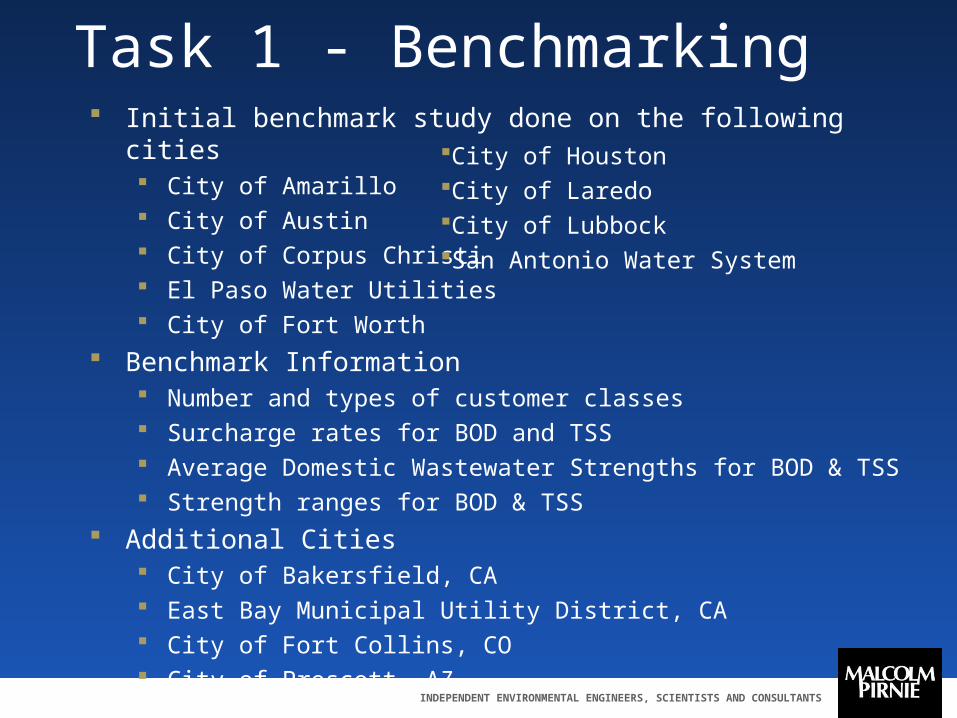
Task 1 - Benchmarking Initial benchmark study done on the following cities
City of Amarillo City of Austin City of Corpus Christi El Paso Water Utilities City of Fort Worth
Benchmark Information Number and types of customer classes Surcharge rates for BOD and TSS Average Domestic Wastewater Strengths for BOD & TSS Strength ranges for BOD & TSS
Additional Cities City of Bakersfield, CA East Bay Municipal Utility District, CA City of Fort Collins, CO City of Prescott, AZ
City of HoustonCity of LaredoCity of LubbockSan Antonio Water System

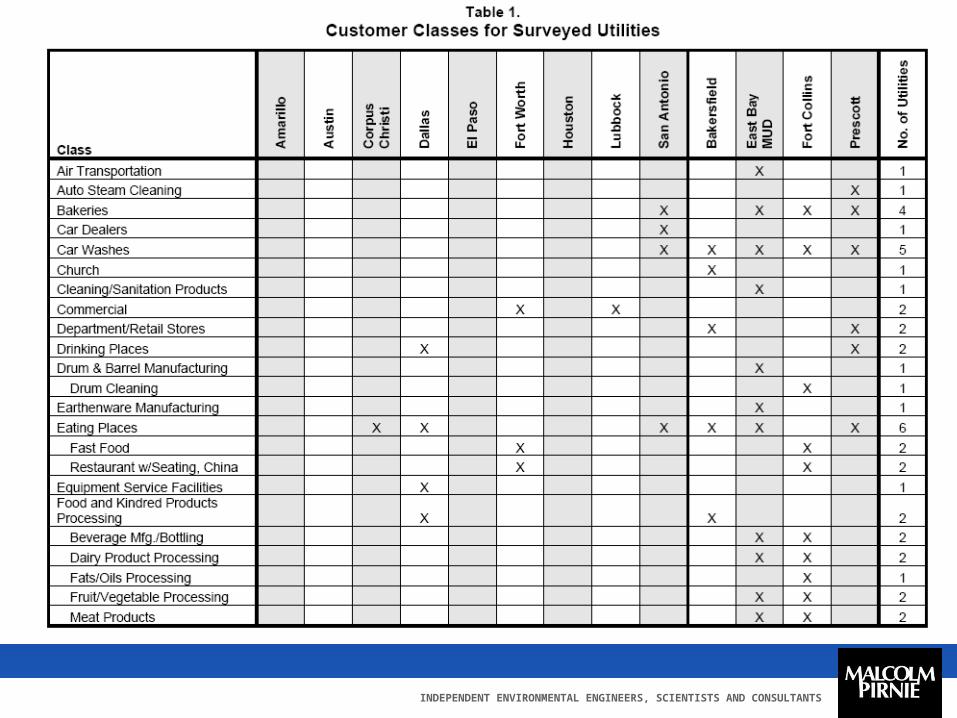
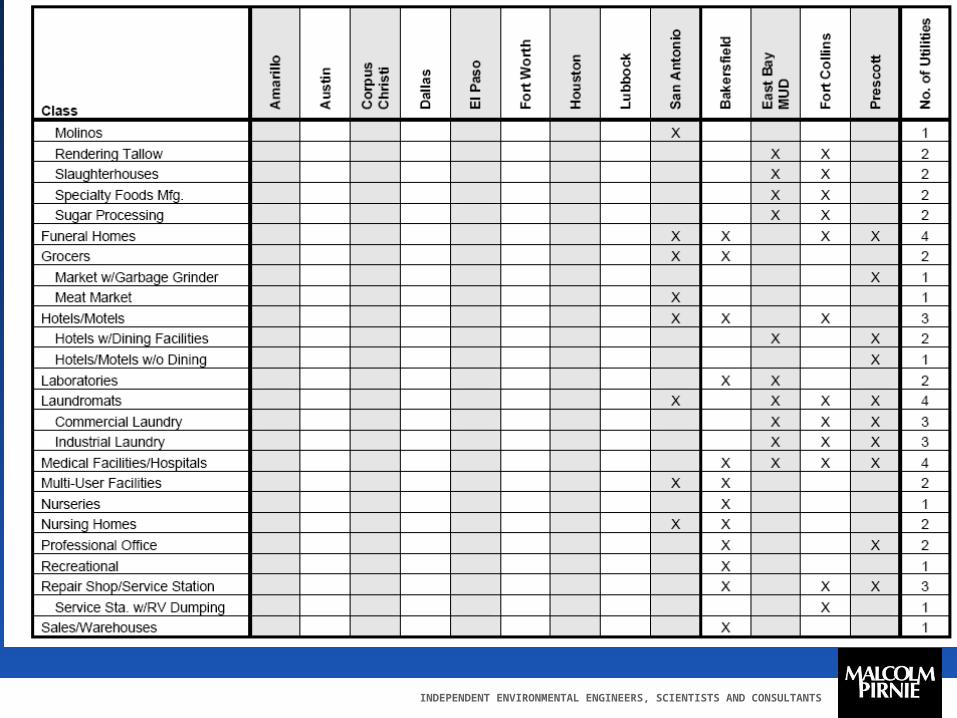
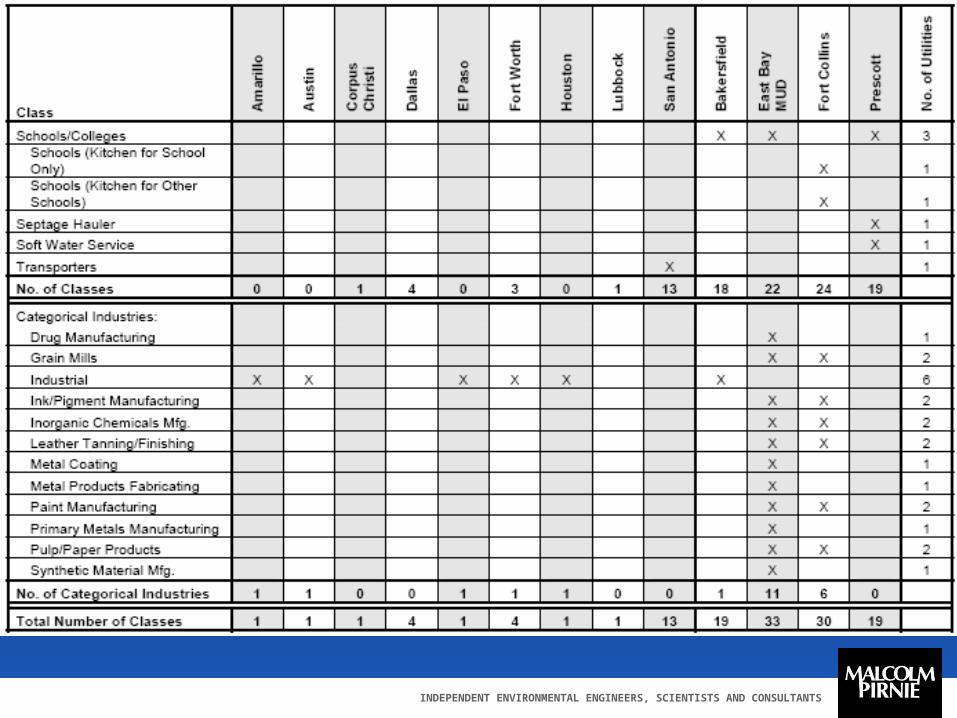
INDEPENDENT ENVIRONMENTAL ENGINEERS, SCIENTISTS AND CONSULTANTS
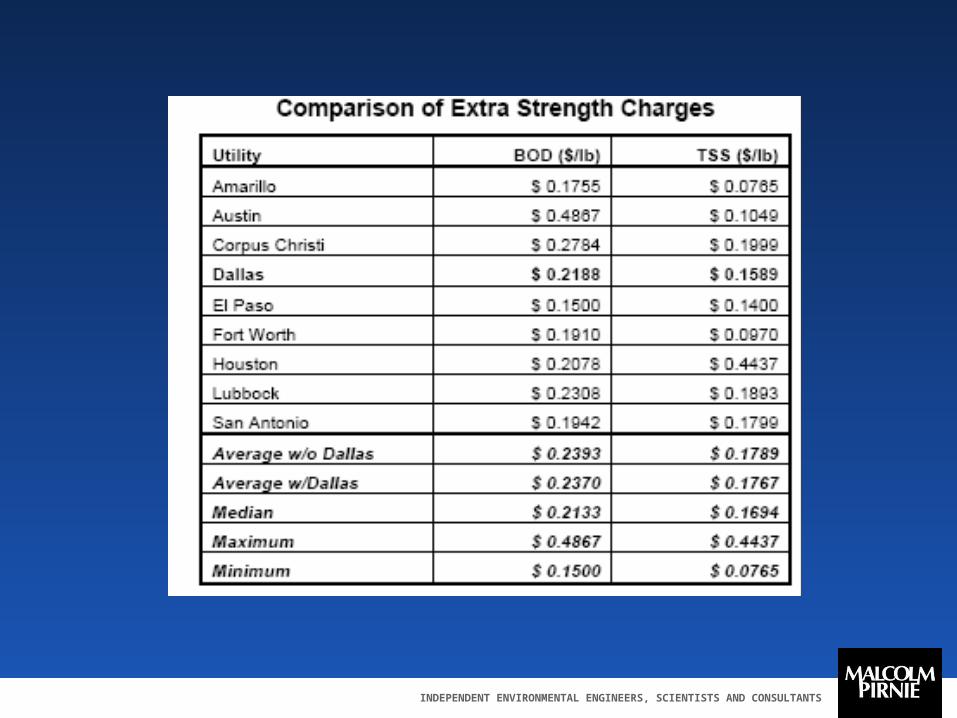
Benchmark Information
Number and types of customer classes Surcharge rates for BOD and TSS Average Domestic Wastewater Strengths
for BOD & TSS Strength ranges for BOD & TSS
INDEPENDENT ENVIRONMENTAL ENGINEERS, SCIENTISTS AND CONSULTANTS
INDEPENDENT ENVIRONMENTAL ENGINEERS, SCIENTISTS AND CONSULTANTS
INDEPENDENT ENVIRONMENTAL ENGINEERS, SCIENTISTS AND CONSULTANTS

INDEPENDENT ENVIRONMENTAL ENGINEERS, SCIENTISTS AND CONSULTANTS
Benchmark Information
Number and types of customer classes Surcharge rates for BOD and TSS Average Domestic Wastewater Strengths
for BOD & TSS Strength ranges for BOD & TSS
INDEPENDENT ENVIRONMENTAL ENGINEERS, SCIENTISTS AND CONSULTANTS
INDEPENDENT ENVIRONMENTAL ENGINEERS, SCIENTISTS AND CONSULTANTS
Benchmark Information
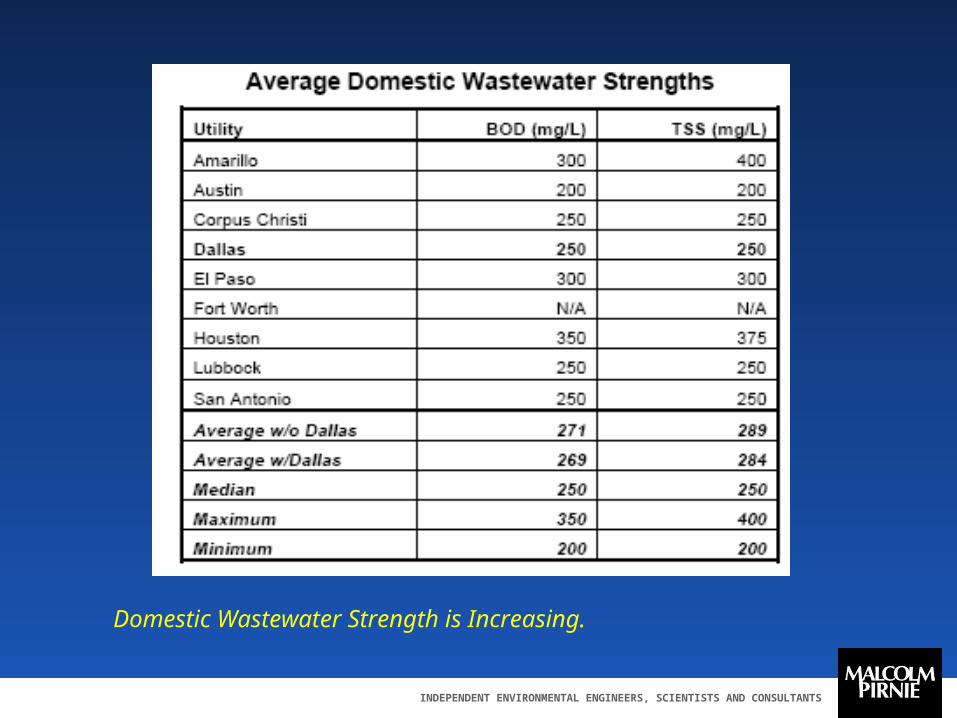
Number and types of customer classes Surcharge rates for BOD and TSS Average Domestic Wastewater Strengths
for BOD & TSS Strength ranges for BOD & TSS
INDEPENDENT ENVIRONMENTAL ENGINEERS, SCIENTISTS AND CONSULTANTS
Domestic Wastewater Strength is Increasing.

INDEPENDENT ENVIRONMENTAL ENGINEERS, SCIENTISTS AND CONSULTANTS
Benchmark Information
Number and types of customer classes Surcharge rates for BOD and TSS Average Domestic Wastewater Strengths
for BOD & TSS Strength ranges for BOD & TSS
INDEPENDENT ENVIRONMENTAL ENGINEERS, SCIENTISTS AND CONSULTANTS
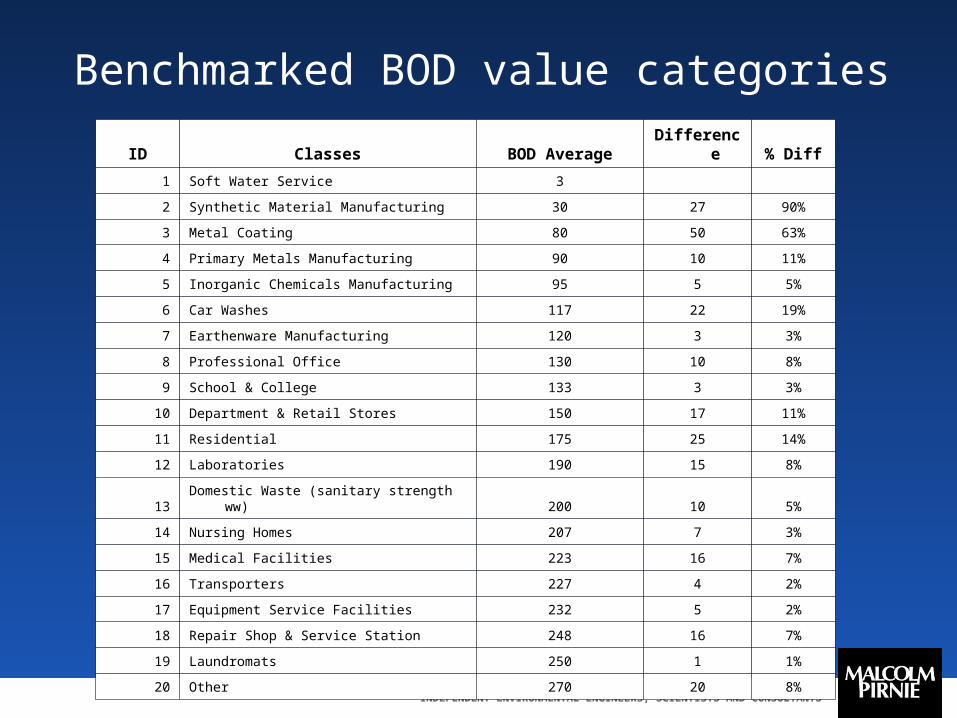
Benchmarked BOD value categoriesID Classes BOD Average Difference % Diff
1 Soft Water Service 3
2 Synthetic Material Manufacturing 30 27 90%
3 Metal Coating 80 50 63%
4 Primary Metals Manufacturing 90 10 11%
5 Inorganic Chemicals Manufacturing 95 5 5%
6 Car Washes 117 22 19%
7 Earthenware Manufacturing 120 3 3%
8 Professional Office 130 10 8%
9 School & College 133 3 3%
10 Department & Retail Stores 150 17 11%
11 Residential 175 25 14%
12 Laboratories 190 15 8%
13 Domestic Waste (sanitary strength ww) 200 10 5%
14 Nursing Homes 207 7 3%
15 Medical Facilities 223 16 7%
16 Transporters 227 4 2%
17 Equipment Service Facilities 232 5 2%
18 Repair Shop & Service Station 248 16 7%
19 Laundromats 250 1 1%
20 Other 270 20 8%
INDEPENDENT ENVIRONMENTAL ENGINEERS, SCIENTISTS AND CONSULTANTS
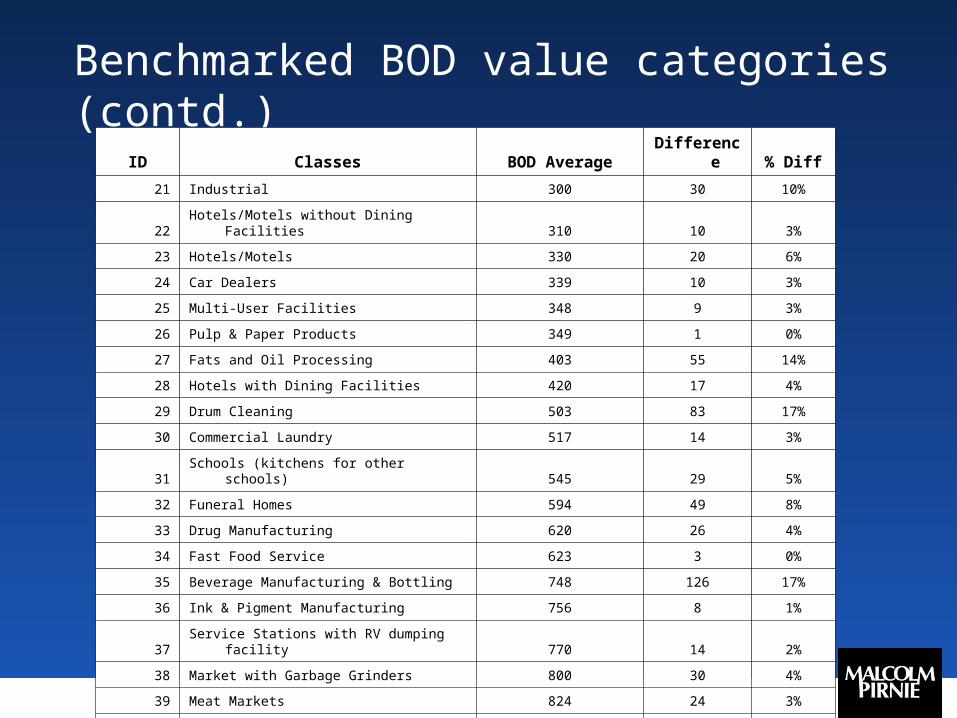
Benchmarked BOD value categories (contd.)ID Classes BOD Average Difference % Diff
21 Industrial 300 30 10%
22 Hotels/Motels without Dining Facilities 310 10 3%
23 Hotels/Motels 330 20 6%
24 Car Dealers 339 10 3%
25 Multi-User Facilities 348 9 3%
26 Pulp & Paper Products 349 1 0%
27 Fats and Oil Processing 403 55 14%
28 Hotels with Dining Facilities 420 17 4%
29 Drum Cleaning 503 83 17%
30 Commercial Laundry 517 14 3%
31 Schools (kitchens for other schools) 545 29 5%
32 Funeral Homes 594 49 8%
33 Drug Manufacturing 620 26 4%
34 Fast Food Service 623 3 0%
35 Beverage Manufacturing & Bottling 748 126 17%
36 Ink & Pigment Manufacturing 756 8 1%
37 Service Stations with RV dumping facility 770 14 2%
38 Market with Garbage Grinders 800 30 4%
39 Meat Markets 824 24 3%
40 Grain Mills 829 5 1%
INDEPENDENT ENVIRONMENTAL ENGINEERS, SCIENTISTS AND CONSULTANTS
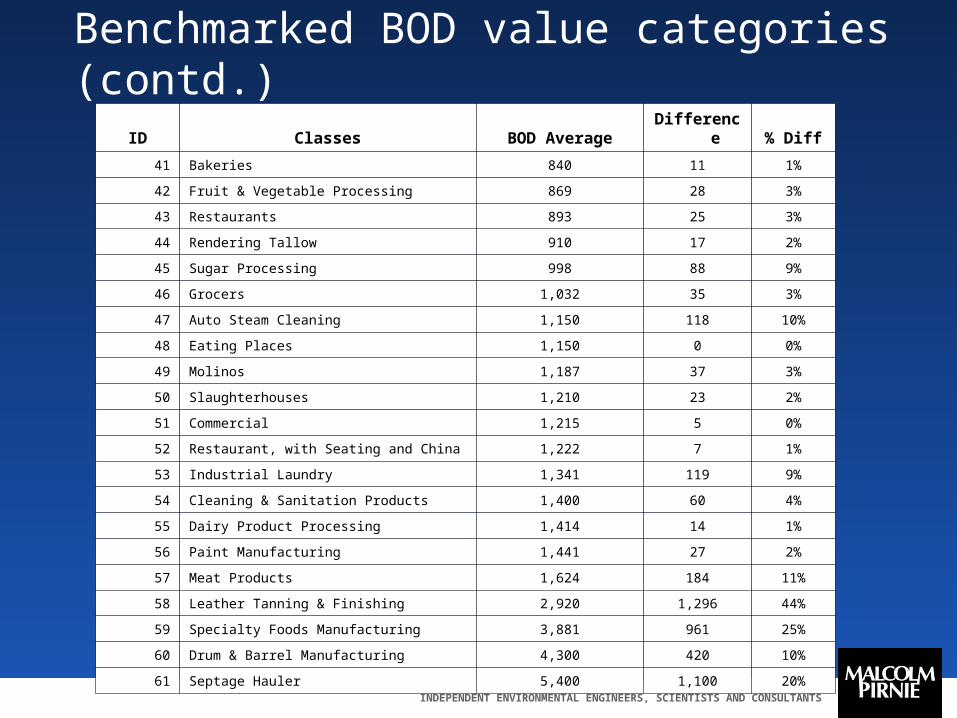
Benchmarked BOD value categories (contd.)ID Classes BOD Average Difference % Diff
41 Bakeries 840 11 1%
42 Fruit & Vegetable Processing 869 28 3%
43 Restaurants 893 25 3%
44 Rendering Tallow 910 17 2%
45 Sugar Processing 998 88 9%
46 Grocers 1,032 35 3%
47 Auto Steam Cleaning 1,150 118 10%
48 Eating Places 1,150 0 0%
49 Molinos 1,187 37 3%
50 Slaughterhouses 1,210 23 2%
51 Commercial 1,215 5 0%
52 Restaurant, with Seating and China 1,222 7 1%
53 Industrial Laundry 1,341 119 9%
54 Cleaning & Sanitation Products 1,400 60 4%
55 Dairy Product Processing 1,414 14 1%
56 Paint Manufacturing 1,441 27 2%
57 Meat Products 1,624 184 11%
58 Leather Tanning & Finishing 2,920 1,296 44%
59 Specialty Foods Manufacturing 3,881 961 25%
60 Drum & Barrel Manufacturing 4,300 420 10%
61 Septage Hauler 5,400 1,100 20%
INDEPENDENT ENVIRONMENTAL ENGINEERS, SCIENTISTS AND CONSULTANTS
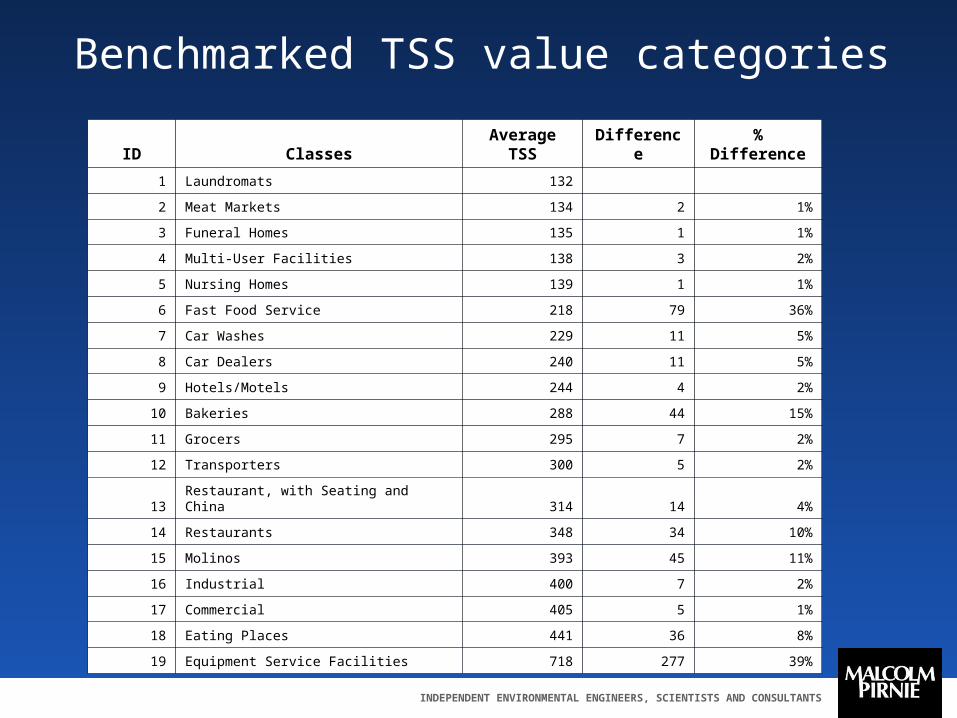
Benchmarked TSS value categories
ID Classes Average TSS Difference % Difference
1 Laundromats 132
2 Meat Markets 134 2 1%
3 Funeral Homes 135 1 1%
4 Multi-User Facilities 138 3 2%
5 Nursing Homes 139 1 1%
6 Fast Food Service 218 79 36%
7 Car Washes 229 11 5%
8 Car Dealers 240 11 5%
9 Hotels/Motels 244 4 2%
10 Bakeries 288 44 15%
11 Grocers 295 7 2%
12 Transporters 300 5 2%
13 Restaurant, with Seating and China 314 14 4%
14 Restaurants 348 34 10%
15 Molinos 393 45 11%
16 Industrial 400 7 2%
17 Commercial 405 5 1%
18 Eating Places 441 36 8%
19 Equipment Service Facilities 718 277 39%
INDEPENDENT ENVIRONMENTAL ENGINEERS, SCIENTISTS AND CONSULTANTS
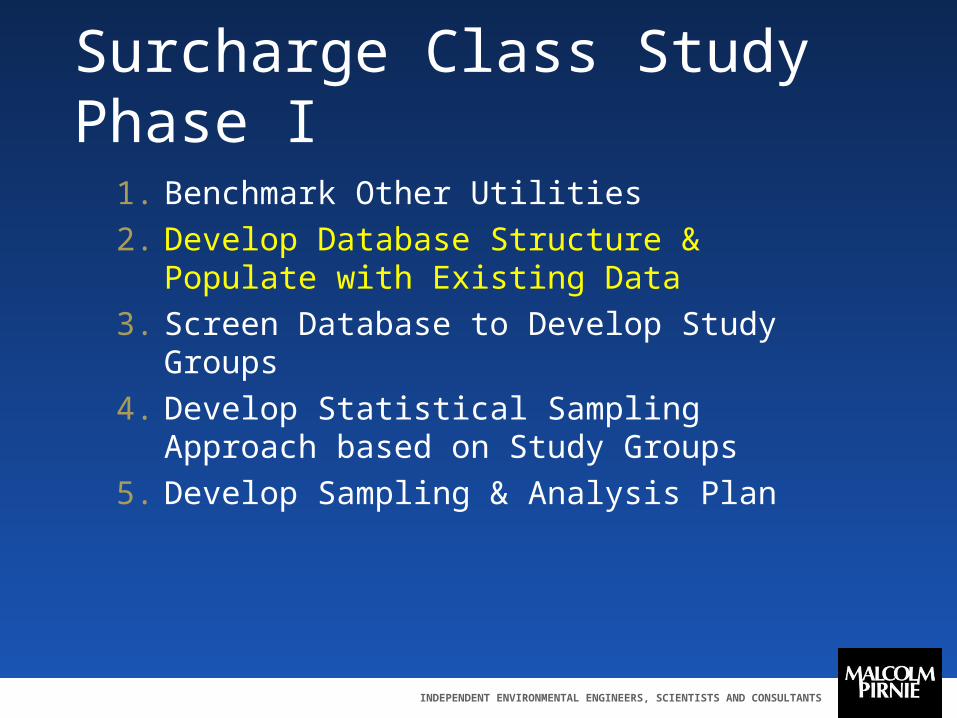
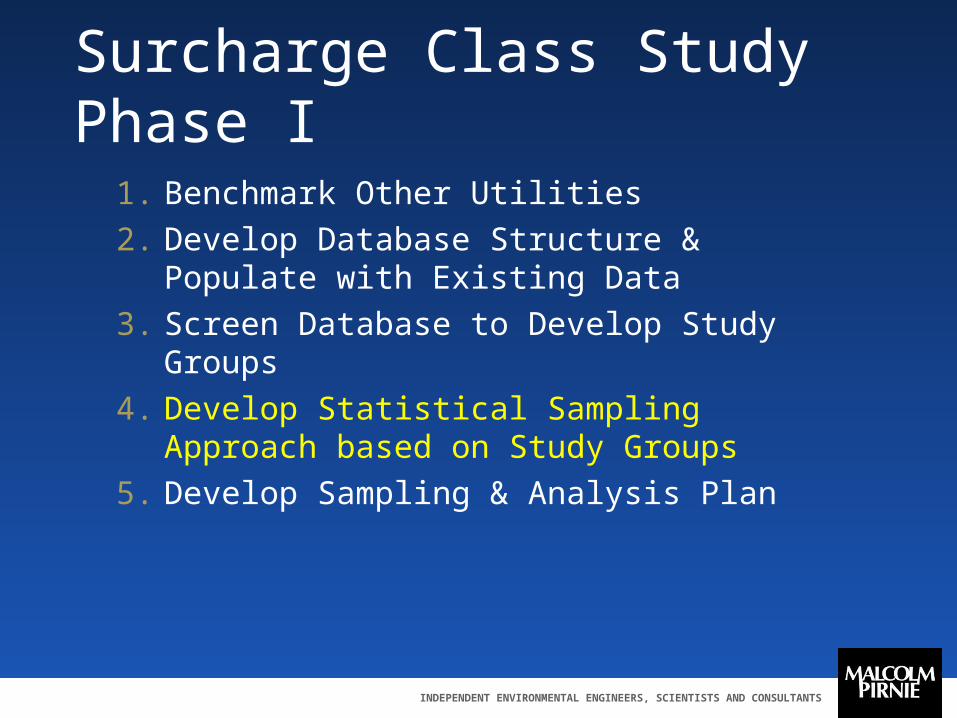
Surcharge Class Study Phase I
1. Benchmark Other Utilities
2. Develop Database Structure & Populate with Existing Data
3. Screen Database to Develop Study Groups
4. Develop Statistical Sampling Approach based on Study Groups
5. Develop Sampling & Analysis Plan
INDEPENDENT ENVIRONMENTAL ENGINEERS, SCIENTISTS AND CONSULTANTS
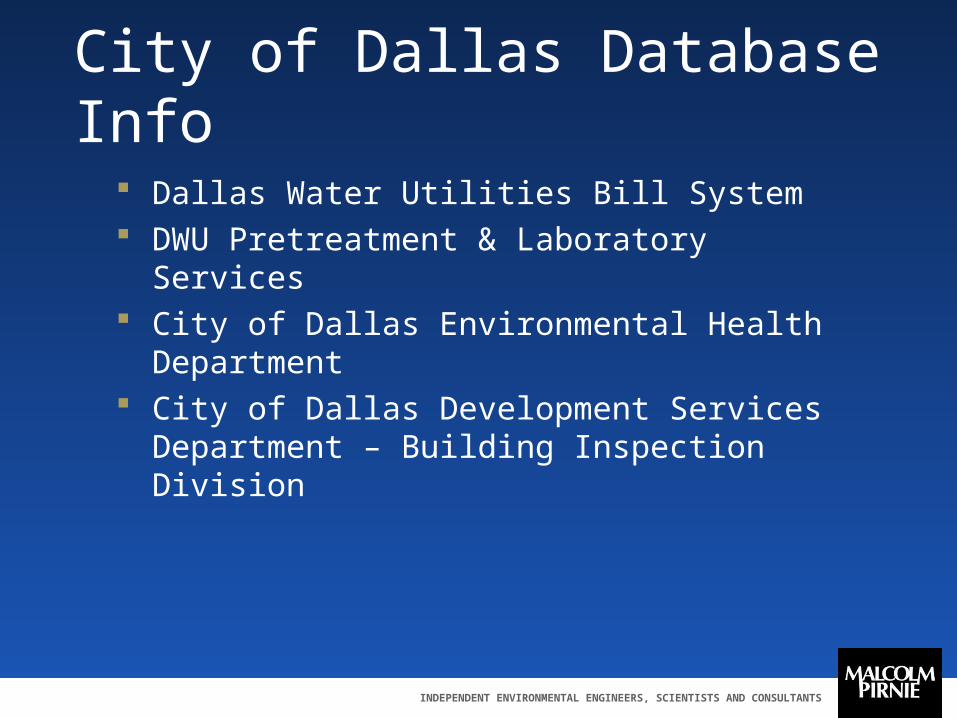
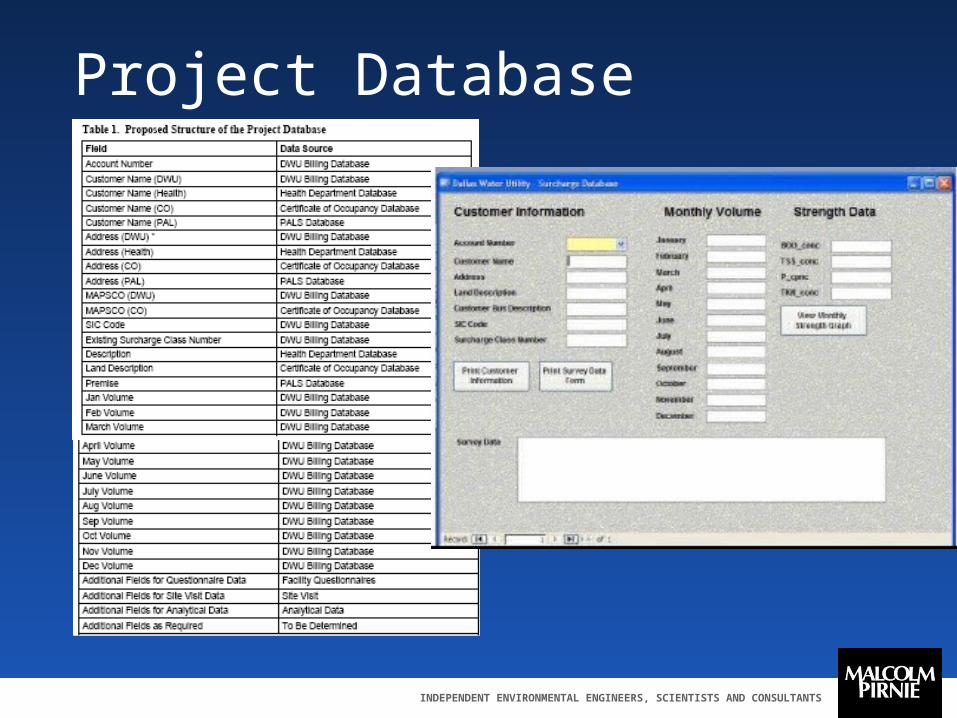
City of Dallas Database Info
Dallas Water Utilities Bill System DWU Pretreatment & Laboratory Services City of Dallas Environmental Health Department City of Dallas Development Services
Department – Building Inspection Division
INDEPENDENT ENVIRONMENTAL ENGINEERS, SCIENTISTS AND CONSULTANTS
Project Database
INDEPENDENT ENVIRONMENTAL ENGINEERS, SCIENTISTS AND CONSULTANTS
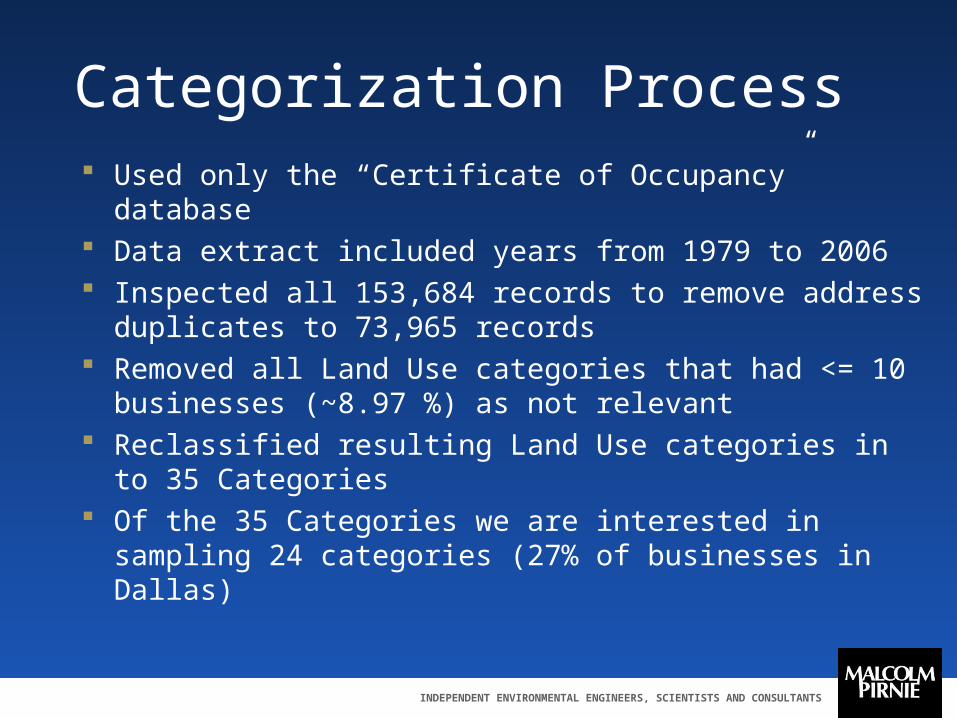
Categorization Process Used only the “Certificate of Occupancy” database Data extract included years from 1979 to 2006 Inspected all 153,684 records to remove address
duplicates to 73,965 records Removed all Land Use categories that had <= 10
businesses (~8.97 %) as not relevant Reclassified resulting Land Use categories in to 35
Categories Of the 35 Categories we are interested in sampling 24
categories (27% of businesses in Dallas)

INDEPENDENT ENVIRONMENTAL ENGINEERS, SCIENTISTS AND CONSULTANTS
Surcharge Class Study Phase I
1. Benchmark Other Utilities
2. Develop Database Structure & Populate with Existing Data
3. Screen Database to Develop Study Groups
4. Develop Statistical Sampling Approach based on Study Groups
5. Develop Sampling & Analysis Plan
INDEPENDENT ENVIRONMENTAL ENGINEERS, SCIENTISTS AND CONSULTANTS
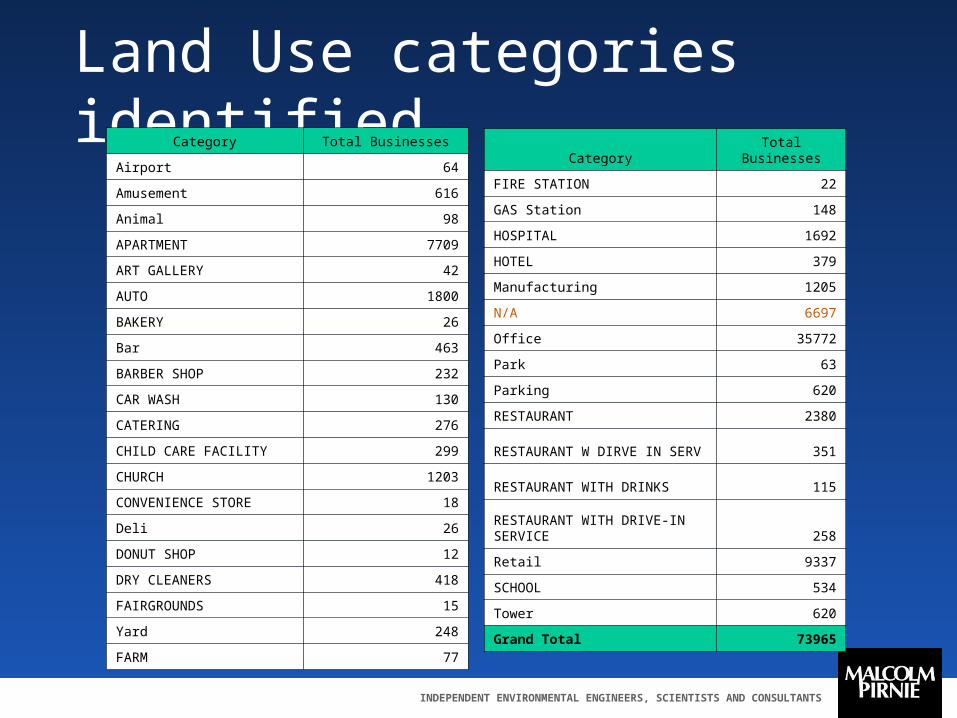
Land Use categories identifiedCategory Total Businesses
Airport 64
Amusement 616
Animal 98
APARTMENT 7709
ART GALLERY 42
AUTO 1800
BAKERY 26
Bar 463
BARBER SHOP 232
CAR WASH 130
CATERING 276
CHILD CARE FACILITY 299
CHURCH 1203
CONVENIENCE STORE 18
Deli 26
DONUT SHOP 12
DRY CLEANERS 418
FAIRGROUNDS 15
Yard 248
FARM 77
Category Total Businesses
FIRE STATION 22
GAS Station 148
HOSPITAL 1692
HOTEL 379
Manufacturing 1205
N/A 6697
Office 35772
Park 63
Parking 620
RESTAURANT 2380
RESTAURANT W DIRVE IN SERV 351
RESTAURANT WITH DRINKS 115
RESTAURANT WITH DRIVE-IN SERVICE 258
Retail 9337
SCHOOL 534
Tower 620
Grand Total 73965
INDEPENDENT ENVIRONMENTAL ENGINEERS, SCIENTISTS AND CONSULTANTS
Surcharge Class Study Phase I
1. Benchmark Other Utilities
2. Develop Database Structure & Populate with Existing Data
3. Screen Database to Develop Study Groups
4. Develop Statistical Sampling Approach based on Study Groups
5. Develop Sampling & Analysis Plan
INDEPENDENT ENVIRONMENTAL ENGINEERS, SCIENTISTS AND CONSULTANTS
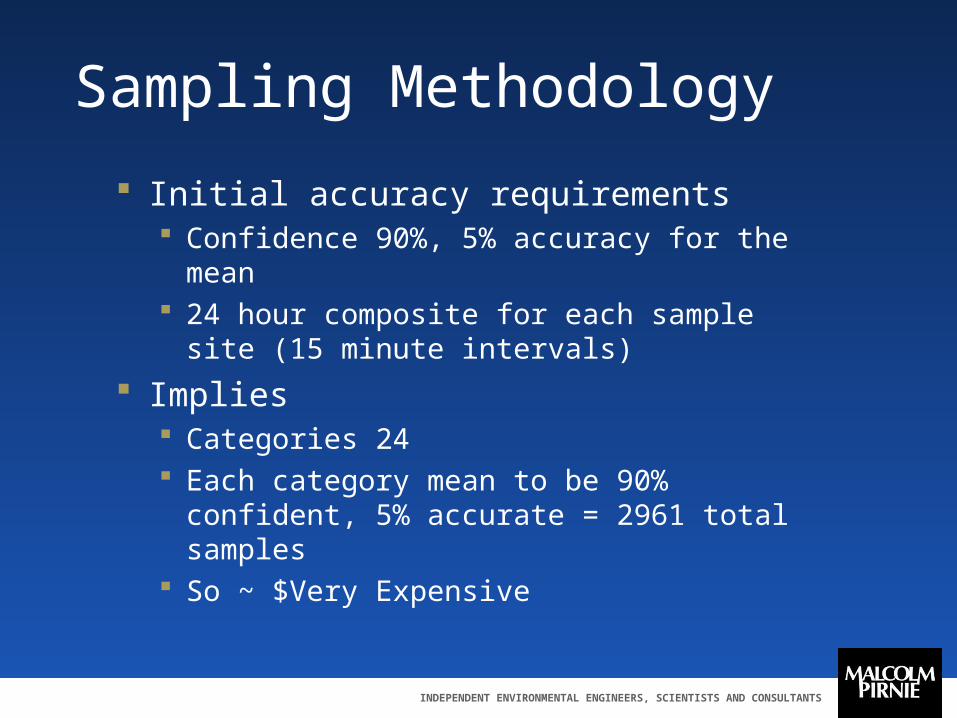
Sampling Methodology
Initial accuracy requirements Confidence 90%, 5% accuracy for the mean 24 hour composite for each sample site (15
minute intervals)
Implies Categories 24 Each category mean to be 90% confident,
5% accurate = 2961 total samples So ~ $Very Expensive
INDEPENDENT ENVIRONMENTAL ENGINEERS, SCIENTISTS AND CONSULTANTS
Reducing Cost Considerations
Number of samples Sampling methodology Number of categories Supporting software Accuracy desired/required Number of iterations
INDEPENDENT ENVIRONMENTAL ENGINEERS, SCIENTISTS AND CONSULTANTS
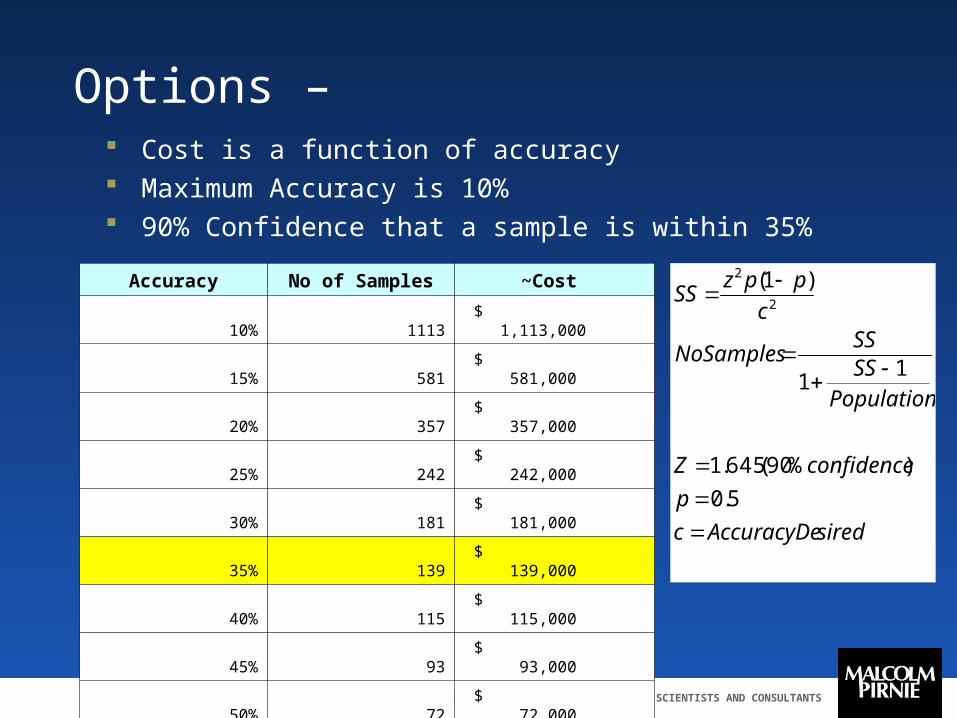
Options – Cost is a function of accuracy Maximum Accuracy is 10% 90% Confidence that a sample is within 35%
siredAccuracyDec
p
confidenceZ
Population
SSSS
NoSamples
c
ppzSS
5.0
)%90(645.1
11
)1(2
2 Accuracy No of Samples ~Cost
10% 1113 $ 1,113,000
15% 581 $ 581,000
20% 357 $ 357,000
25% 242 $ 242,000
30% 181 $ 181,000
35% 139 $ 139,000
40% 115 $ 115,000
45% 93 $ 93,000
50% 72 $ 72,000

INDEPENDENT ENVIRONMENTAL ENGINEERS, SCIENTISTS AND CONSULTANTS
Surcharge Class Study Phase I
1. Benchmark Other Utilities
2. Develop Database Structure & Populate with Existing Data
3. Screen Database to Develop Study Groups
4. Develop Statistical Sampling Approach based on Study Groups
5. Develop Sampling & Analysis Plan
INDEPENDENT ENVIRONMENTAL ENGINEERS, SCIENTISTS AND CONSULTANTS
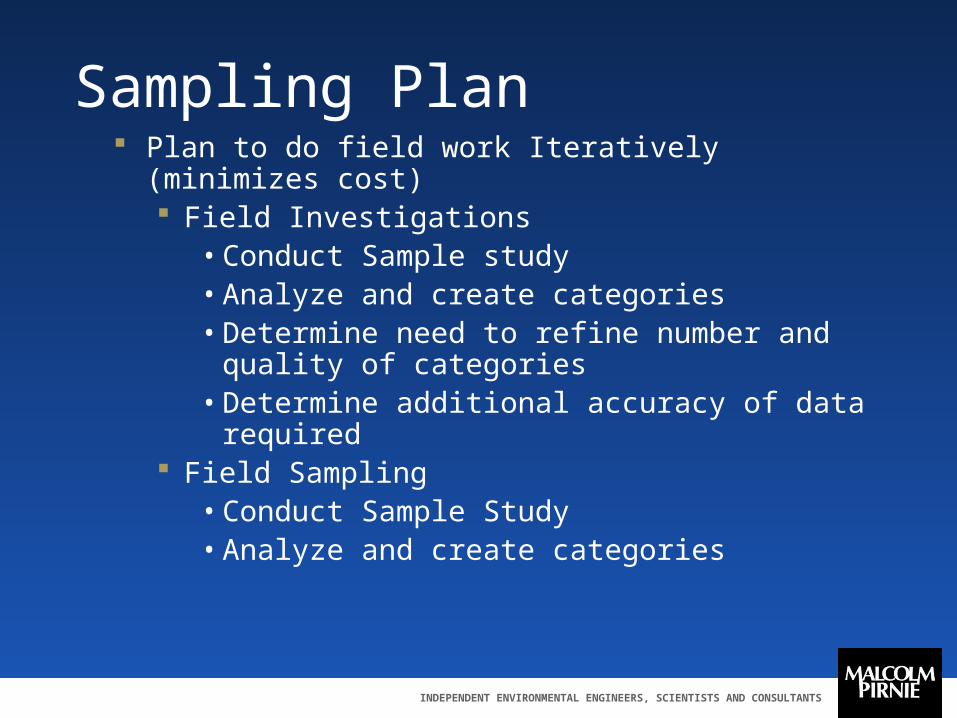
Sampling Plan Plan to do field work Iteratively (minimizes cost)
Field Investigations• Conduct Sample study• Analyze and create categories• Determine need to refine number and quality of
categories • Determine additional accuracy of data required
Field Sampling• Conduct Sample Study• Analyze and create categories
INDEPENDENT ENVIRONMENTAL ENGINEERS, SCIENTISTS AND CONSULTANTS
Surcharge Class Study Phase II
Customer Survey Design Survey Distribution Field Sampling & Data Validation Statistical Analysis Reporting Final Recommendations
INDEPENDENT ENVIRONMENTAL ENGINEERS, SCIENTISTS AND CONSULTANTS
Cover Letter – Drivers Do not cause alarm in the public about waste water rates
increasing Attempt not to bias the survey results Survey and the sampling should not end up on the council
agenda or evening news Survey methodology should be mathematically sound Survey responses should enable physical sampling
activities Survey response rate target of 10%
INDEPENDENT ENVIRONMENTAL ENGINEERS, SCIENTISTS AND CONSULTANTS
Survey Design Structure / Principles
One questionnaire for all participants Keeping the questionnaire short Logical grouping of questions Multiple choice questions No questions related to water rates Privacy will be maintained of the data
INDEPENDENT ENVIRONMENTAL ENGINEERS, SCIENTISTS AND CONSULTANTS
Survey Sections
Business information Validation Validate the physical business address Validate business category type Hours/season of operation Sampling can be done when the business is
generating waste
Water Equipment Rate Class Related Physical sampling
Restrictions that would hinder setting up a sampler
INDEPENDENT ENVIRONMENTAL ENGINEERS, SCIENTISTS AND CONSULTANTS
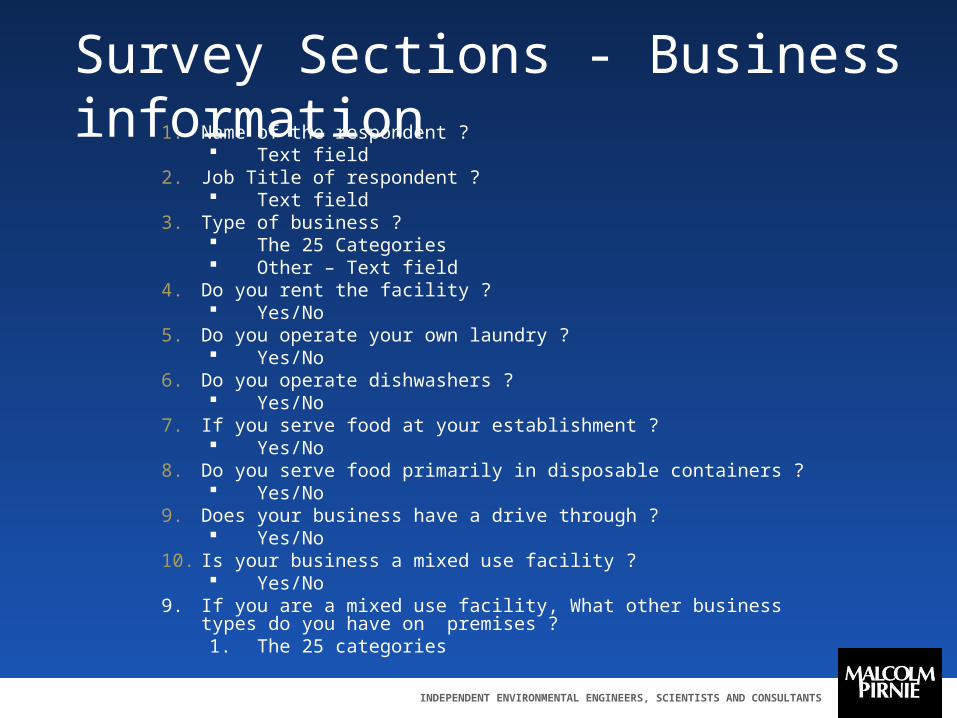
Survey Sections - Business information1. Name of the respondent ?
Text field2. Job Title of respondent ?
Text field3. Type of business ?
The 25 Categories Other – Text field
4. Do you rent the facility ? Yes/No
5. Do you operate your own laundry ? Yes/No
6. Do you operate dishwashers ? Yes/No
7. If you serve food at your establishment ? Yes/No
8. Do you serve food primarily in disposable containers ? Yes/No
9. Does your business have a drive through ? Yes/No
10. Is your business a mixed use facility ? Yes/No
9. If you are a mixed use facility, What other business types do you have on premises ?1. The 25 categories
INDEPENDENT ENVIRONMENTAL ENGINEERS, SCIENTISTS AND CONSULTANTS
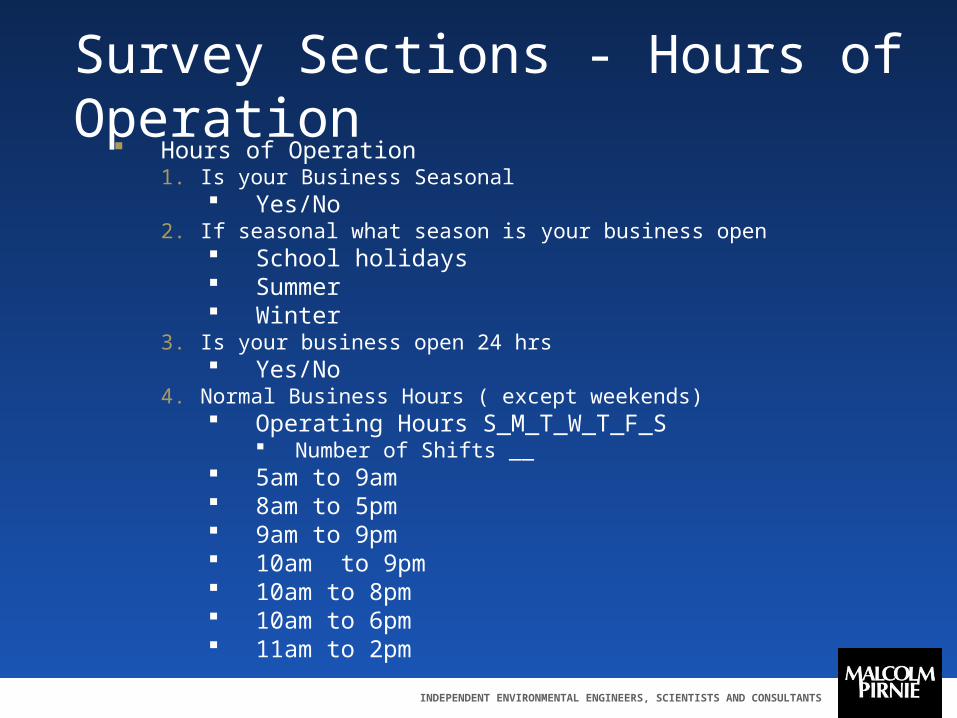
Survey Sections - Hours of Operation Hours of Operation
1. Is your Business Seasonal Yes/No
2. If seasonal what season is your business open School holidays Summer Winter
3. Is your business open 24 hrs Yes/No
4. Normal Business Hours ( except weekends) Operating Hours S_M_T_W_T_F_S
Number of Shifts __ 5am to 9am 8am to 5pm 9am to 9pm 10am to 9pm 10am to 8pm 10am to 6pm 11am to 2pm
INDEPENDENT ENVIRONMENTAL ENGINEERS, SCIENTISTS AND CONSULTANTS
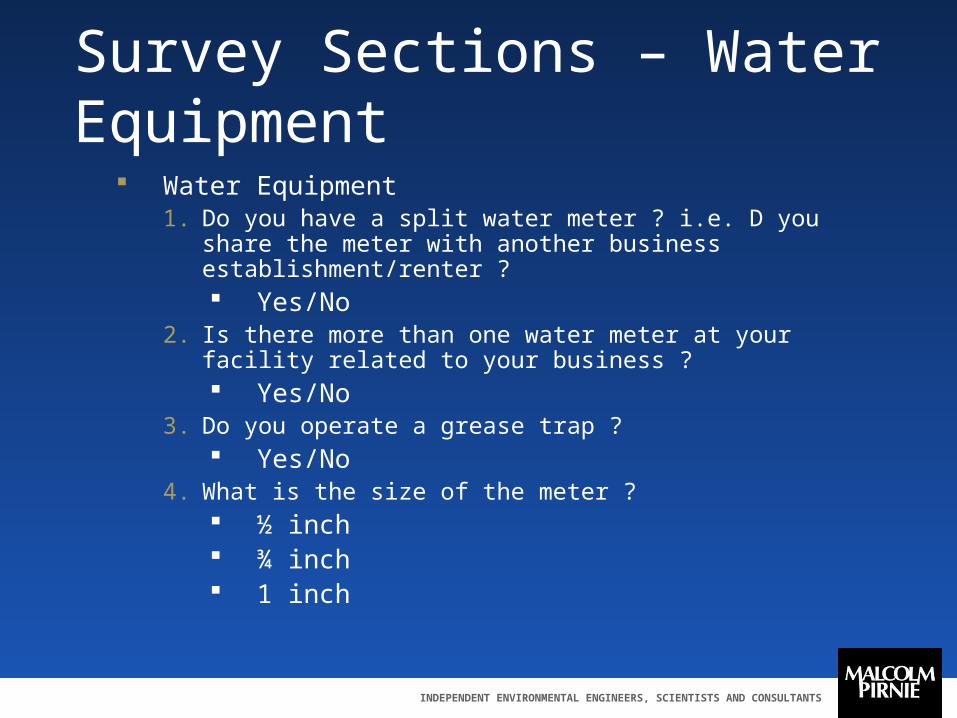
Survey Sections – Water Equipment
Water Equipment1. Do you have a split water meter ? i.e. D you share the
meter with another business establishment/renter ? Yes/No
2. Is there more than one water meter at your facility related to your business ? Yes/No
3. Do you operate a grease trap ? Yes/No
4. What is the size of the meter ? ½ inch ¾ inch 1 inch
INDEPENDENT ENVIRONMENTAL ENGINEERS, SCIENTISTS AND CONSULTANTS
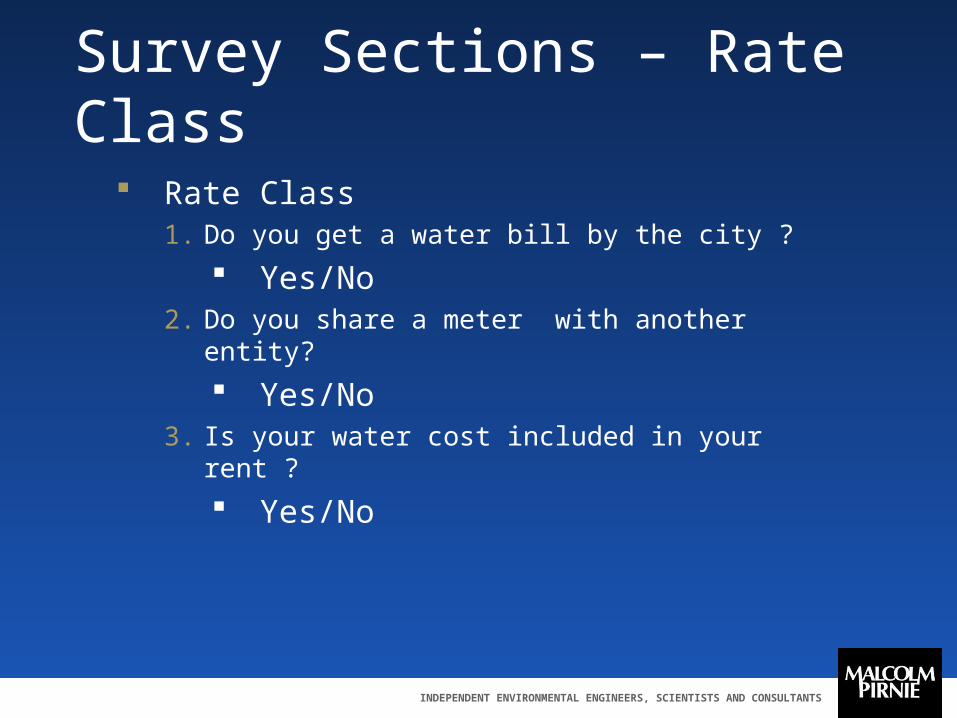
Survey Sections – Rate Class
Rate Class1. Do you get a water bill by the city ?
Yes/No2. Do you share a meter with another entity?
Yes/No3. Is your water cost included in your rent ?
Yes/No
INDEPENDENT ENVIRONMENTAL ENGINEERS, SCIENTISTS AND CONSULTANTS
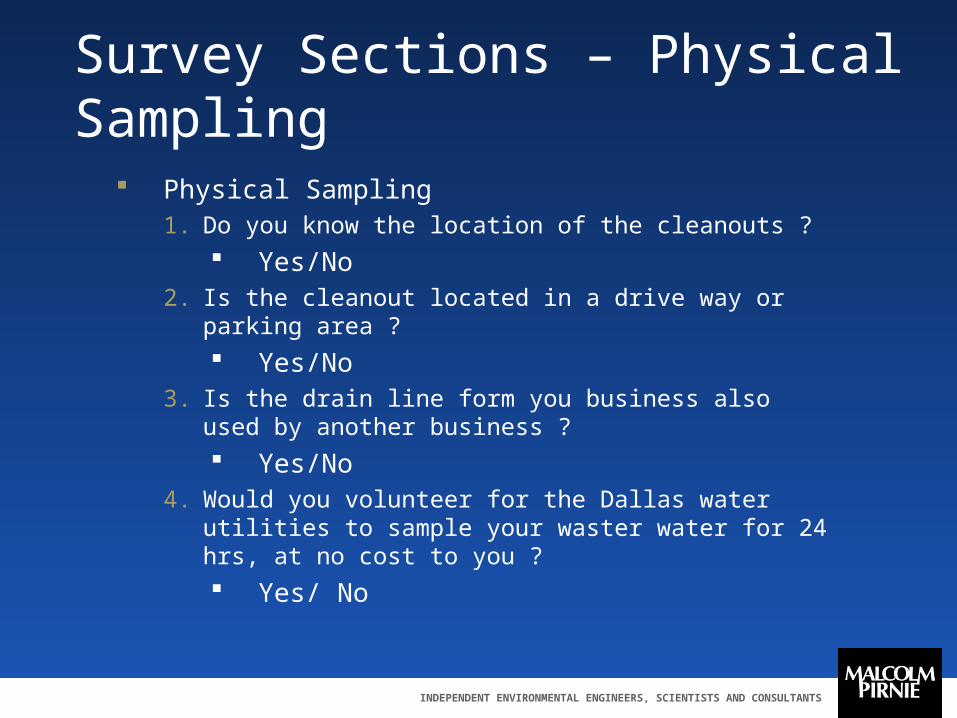
Survey Sections – Physical Sampling
Physical Sampling1. Do you know the location of the cleanouts ?
Yes/No2. Is the cleanout located in a drive way or parking area ?
Yes/No3. Is the drain line form you business also used by another
business ?
Yes/No4. Would you volunteer for the Dallas water utilities to sample
your waster water for 24 hrs, at no cost to you ?
Yes/ No

INDEPENDENT ENVIRONMENTAL ENGINEERS, SCIENTISTS AND CONSULTANTS
Surcharge Class Study Phase II
Customer Survey Design Survey Distribution Field Sampling & Data Validation Statistical Analysis Reporting Final Recommendations
INDEPENDENT ENVIRONMENTAL ENGINEERS, SCIENTISTS AND CONSULTANTS
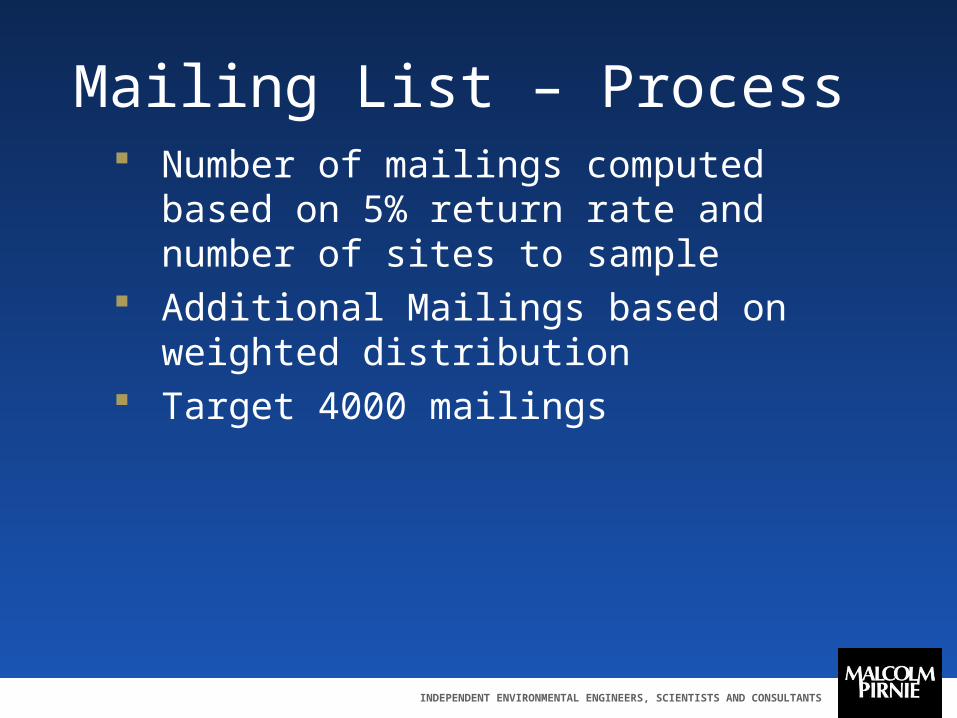
Mailing List – Process Number of mailings computed based on
5% return rate and number of sites to sample
Additional Mailings based on weighted distribution
Target 4000 mailings
INDEPENDENT ENVIRONMENTAL ENGINEERS, SCIENTISTS AND CONSULTANTS
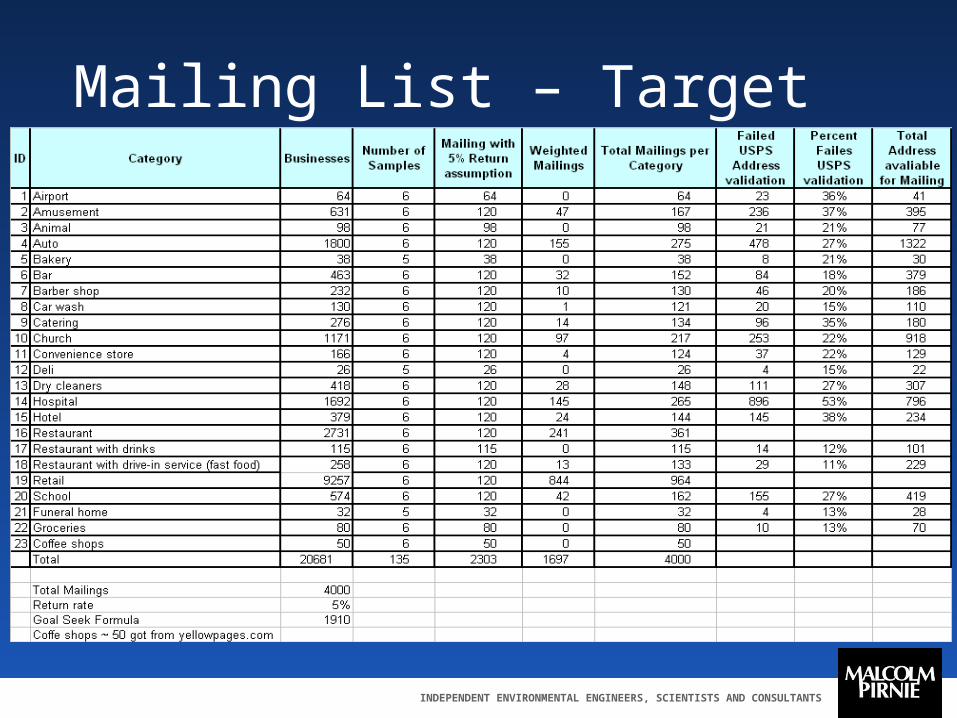
Mailing List – Target
INDEPENDENT ENVIRONMENTAL ENGINEERS, SCIENTISTS AND CONSULTANTS
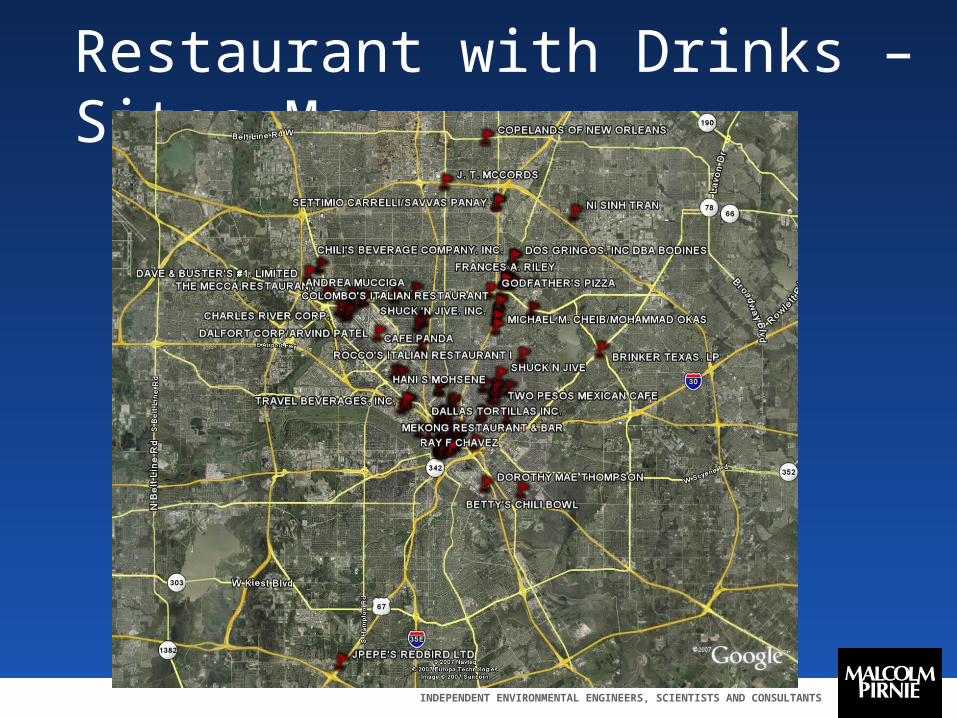
Restaurant with Drinks – Sites Map
In Progress
INDEPENDENT ENVIRONMENTAL ENGINEERS, SCIENTISTS AND CONSULTANTS
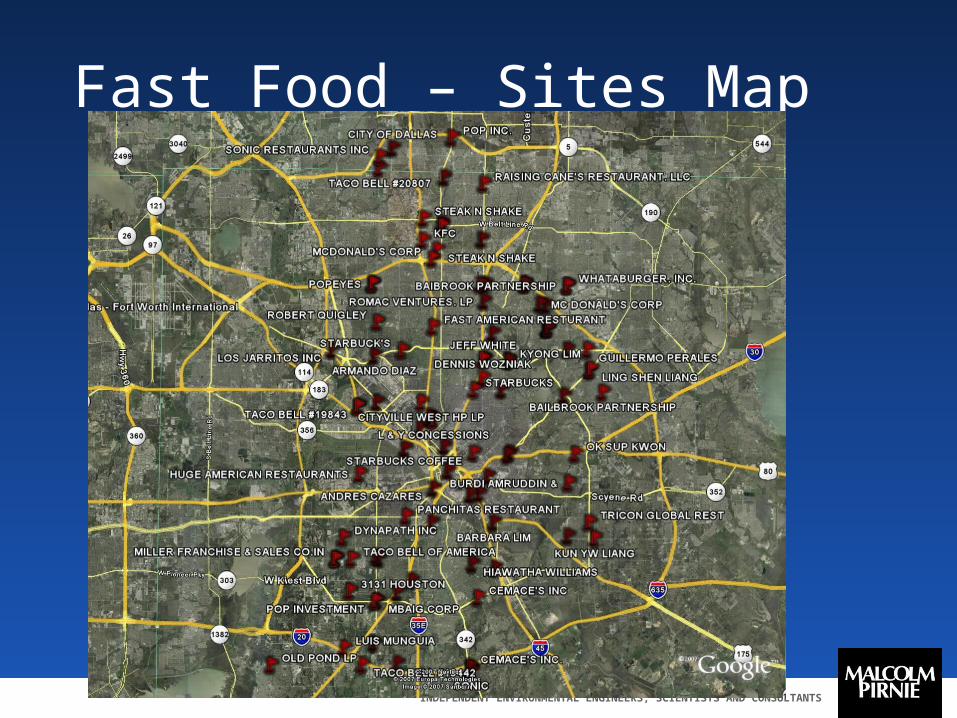
Fast Food – Sites Map
In Progress
INDEPENDENT ENVIRONMENTAL ENGINEERS, SCIENTISTS AND CONSULTANTS
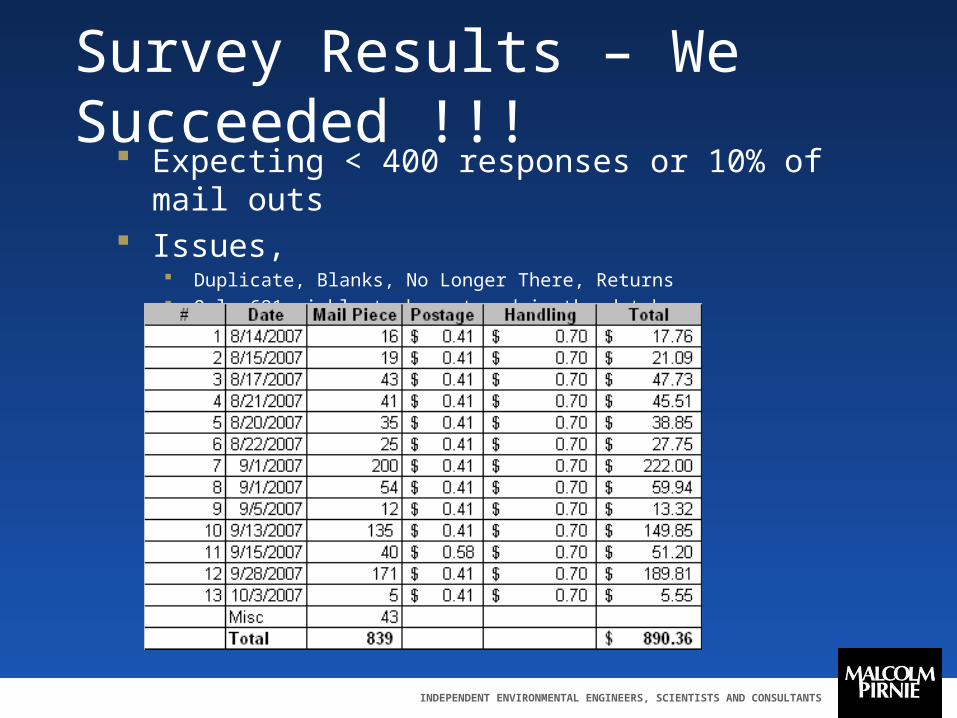
Survey Results – We Succeeded !!! Expecting < 400 responses or 10% of mail outs Issues,
Duplicate, Blanks, No Longer There, Returns Only 691 viable to be entered in the database
INDEPENDENT ENVIRONMENTAL ENGINEERS, SCIENTISTS AND CONSULTANTS
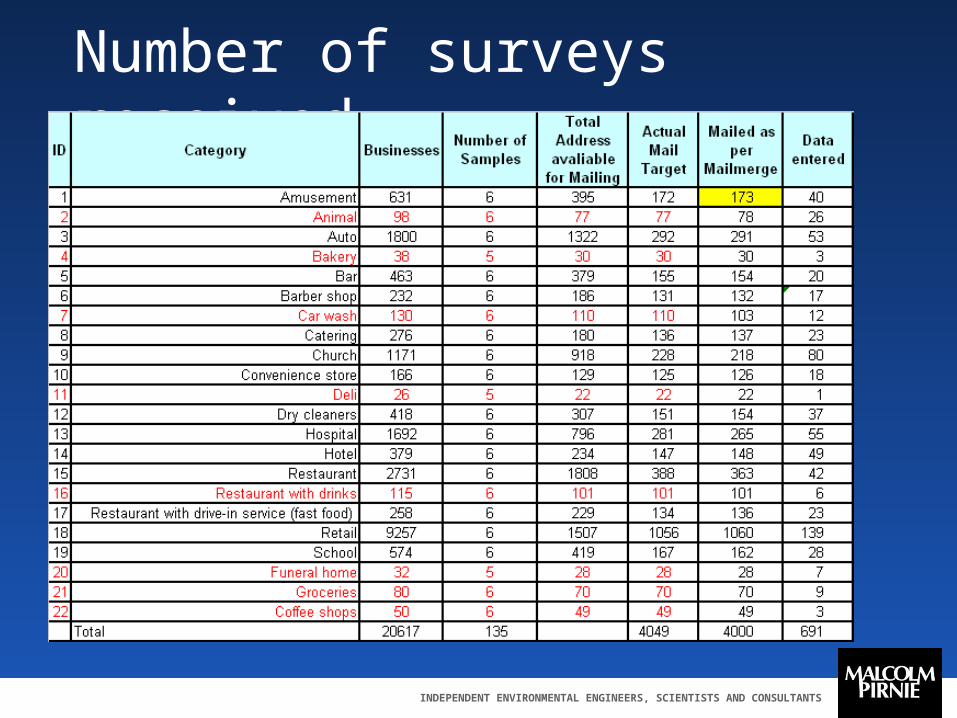
Number of surveys received
INDEPENDENT ENVIRONMENTAL ENGINEERS, SCIENTISTS AND CONSULTANTS
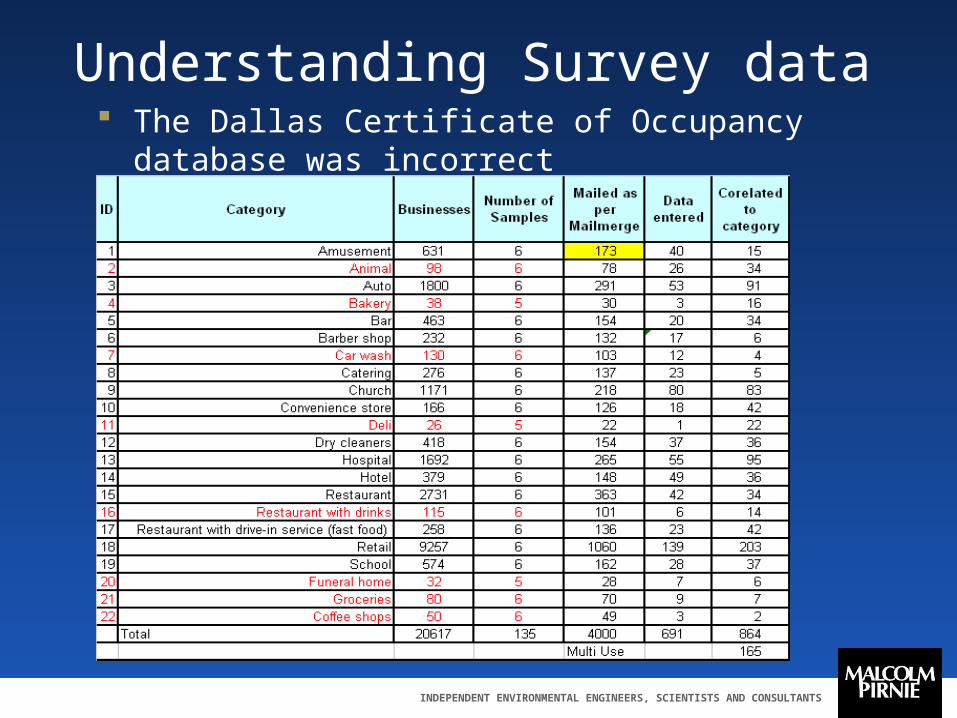
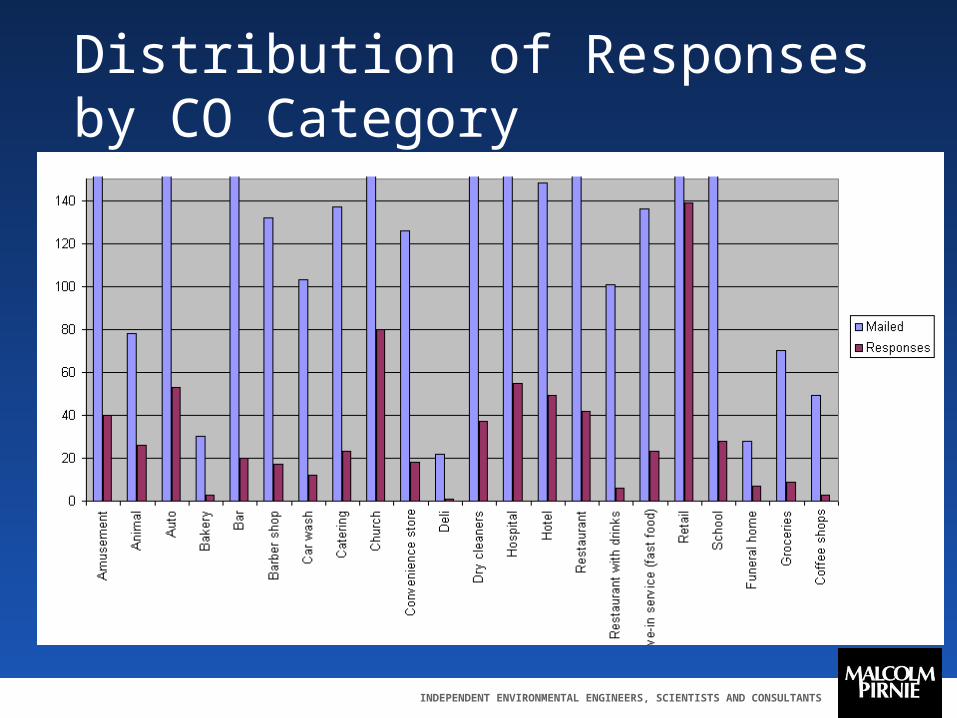
Understanding Survey data The Dallas Certificate of Occupancy database
was incorrect
INDEPENDENT ENVIRONMENTAL ENGINEERS, SCIENTISTS AND CONSULTANTS
Distribution of Responses by CO Category
INDEPENDENT ENVIRONMENTAL ENGINEERS, SCIENTISTS AND CONSULTANTS
Survey Results – Data Entry & Validation
Enter data in excel then transfer to Access Database
Scan paper copy into the file server Data Entry Effort - 10 surveys per hour Some people also sent back the cover page
increasing weight and postage Originally we had $224 in the budget for
postage actual cost $700+ Increase in Data entry time from 40hrs estimate
to 100+ hrs
INDEPENDENT ENVIRONMENTAL ENGINEERS, SCIENTISTS AND CONSULTANTS
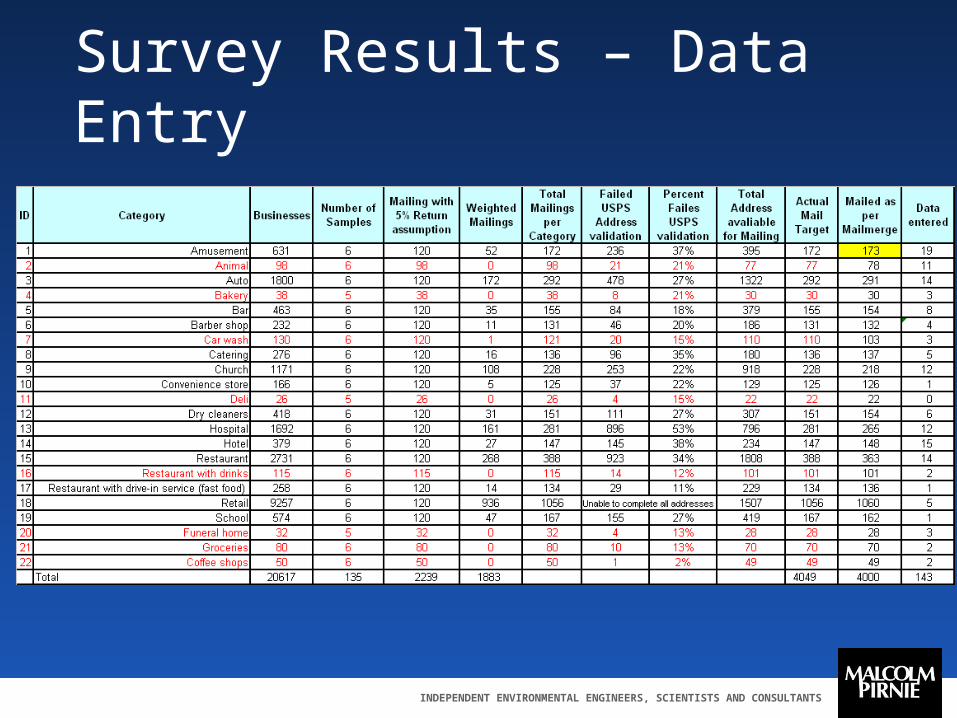
Survey Results – Data Entry
INDEPENDENT ENVIRONMENTAL ENGINEERS, SCIENTISTS AND CONSULTANTS
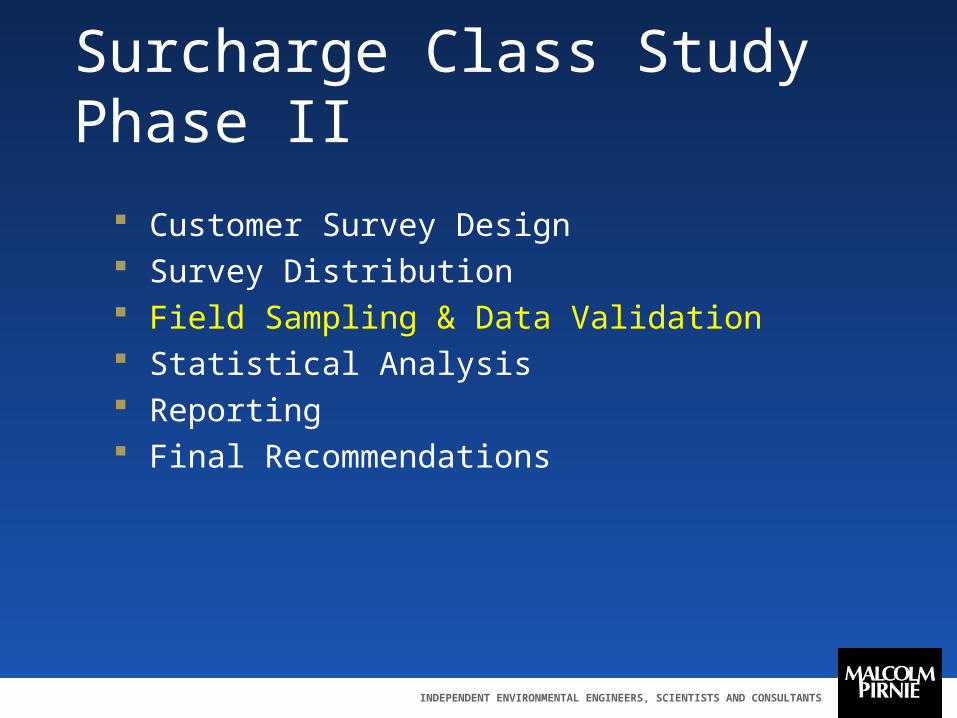
Surcharge Class Study Phase II
Customer Survey Design Survey Distribution Field Sampling & Data Validation Statistical Analysis Reporting Final Recommendations
INDEPENDENT ENVIRONMENTAL ENGINEERS, SCIENTISTS AND CONSULTANTS
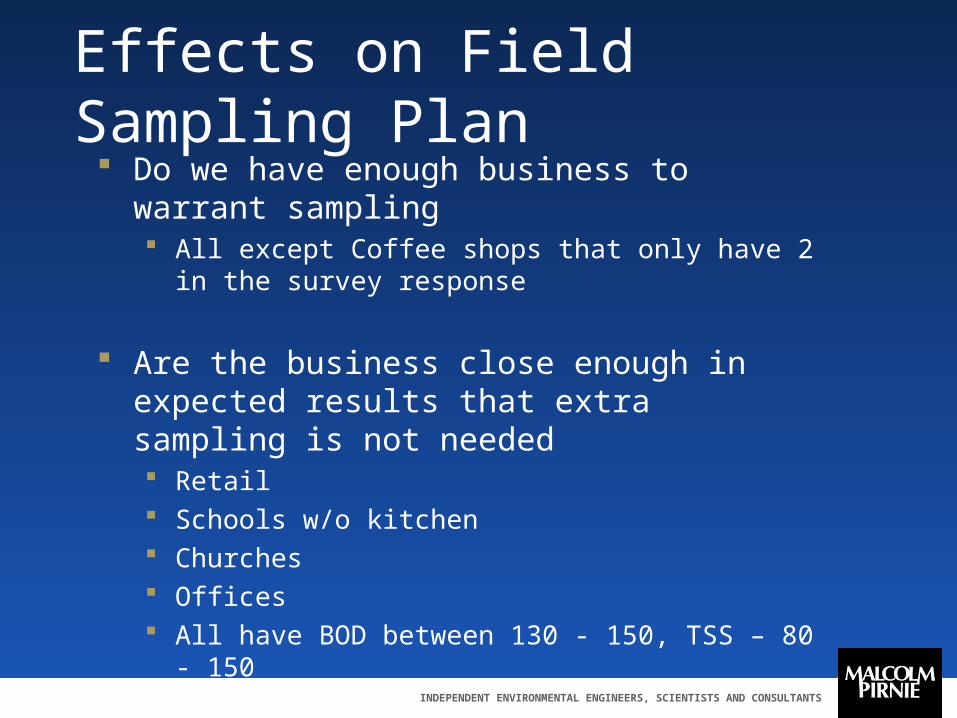
Effects on Field Sampling Plan Do we have enough business to warrant
sampling All except Coffee shops that only have 2 in the survey
response
Are the business close enough in expected results that extra sampling is not needed Retail Schools w/o kitchen Churches Offices All have BOD between 130 - 150, TSS – 80 - 150
INDEPENDENT ENVIRONMENTAL ENGINEERS, SCIENTISTS AND CONSULTANTS
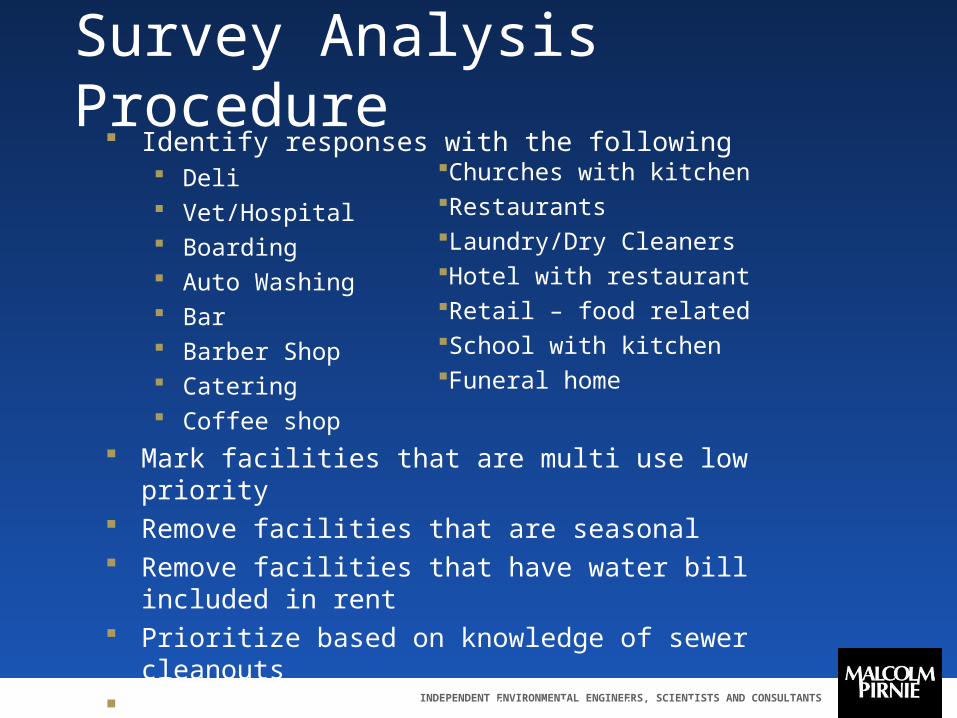
Survey Analysis Procedure Identify responses with the following
Deli Vet/Hospital Boarding Auto Washing Bar Barber Shop Catering Coffee shop
Mark facilities that are multi use low priority Remove facilities that are seasonal Remove facilities that have water bill included in rent Prioritize based on knowledge of sewer cleanouts Prioritize based on water treatment devices Generate map in Google
Churches with kitchenRestaurantsLaundry/Dry CleanersHotel with restaurantRetail – food relatedSchool with kitchenFuneral home
INDEPENDENT ENVIRONMENTAL ENGINEERS, SCIENTISTS AND CONSULTANTS
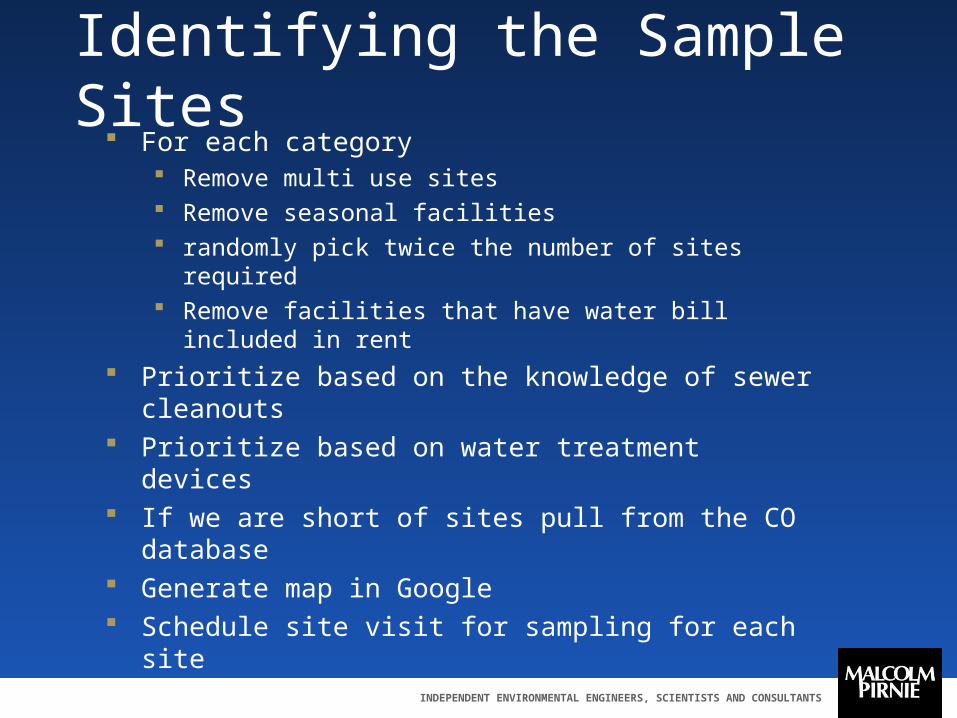
Identifying the Sample Sites For each category
Remove multi use sites Remove seasonal facilities randomly pick twice the number of sites required Remove facilities that have water bill included in rent
Prioritize based on the knowledge of sewer cleanouts Prioritize based on water treatment devices If we are short of sites pull from the CO database Generate map in Google Schedule site visit for sampling for each site
INDEPENDENT ENVIRONMENTAL ENGINEERS, SCIENTISTS AND CONSULTANTS
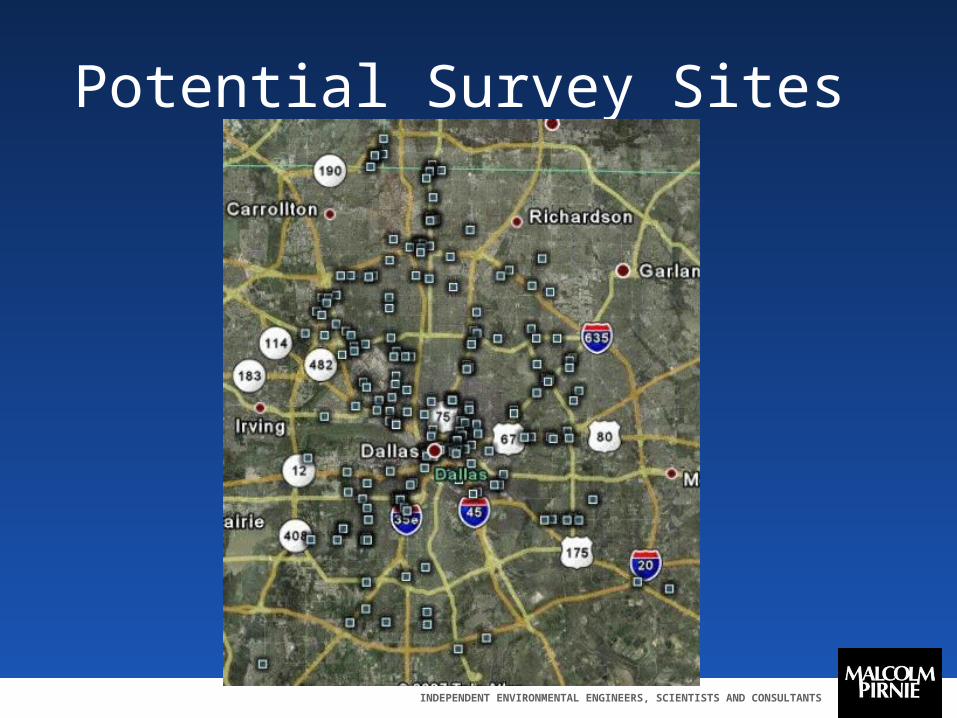
Potential Survey Sites
INDEPENDENT ENVIRONMENTAL ENGINEERS, SCIENTISTS AND CONSULTANTS
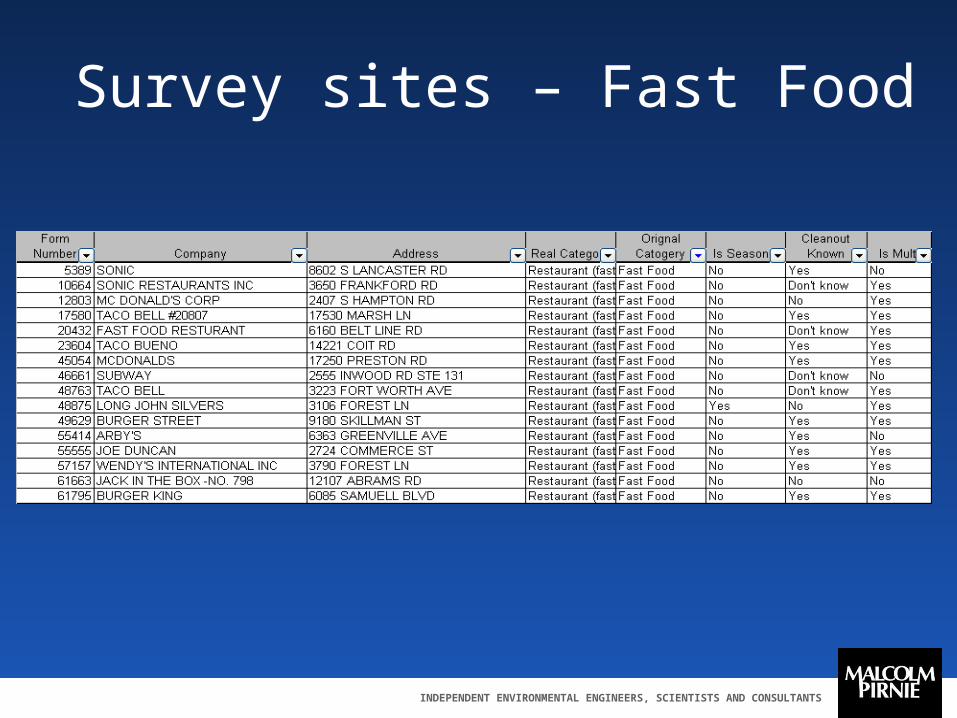
Survey sites – Fast Food
INDEPENDENT ENVIRONMENTAL ENGINEERS, SCIENTISTS AND CONSULTANTS
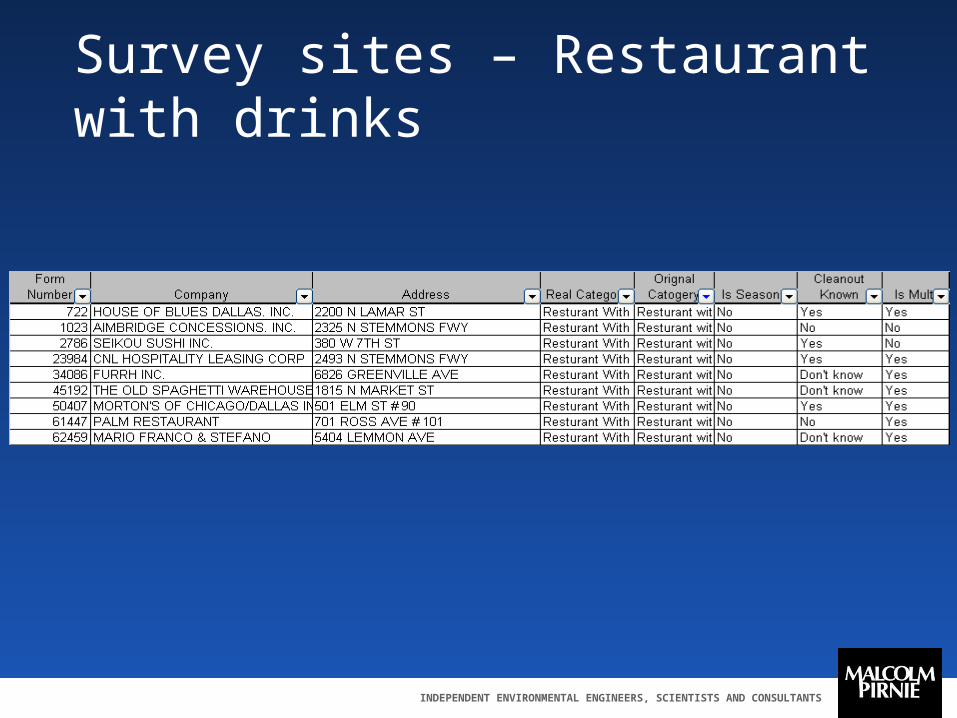
Survey sites – Restaurant with drinks
INDEPENDENT ENVIRONMENTAL ENGINEERS, SCIENTISTS AND CONSULTANTS
Field Survey - Overview Develop the forms for site inspection
Pictures of the site Pictures of the water meter showing the reading Pictures of the sampler installed GPS coordinates of the sampler on site Facility code Weather conditions Time reached facility Time Sampler turned on Time Sampler picked up Sampler condition
INDEPENDENT ENVIRONMENTAL ENGINEERS, SCIENTISTS AND CONSULTANTS
Field Survey - Overview Site Recon (280 Recons for 139 Samples)
Is the site suitable for sampler install Criteria ? Saves cost by not having a sampling crew out there
Field Crew route planning Save cost on drive time Sampler pre programming Battery charge
Sampler - two crews Three sites per day, per crew, 6 days a week
Data analysis Report generation, review & finalization
INDEPENDENT ENVIRONMENTAL ENGINEERS, SCIENTISTS AND CONSULTANTS
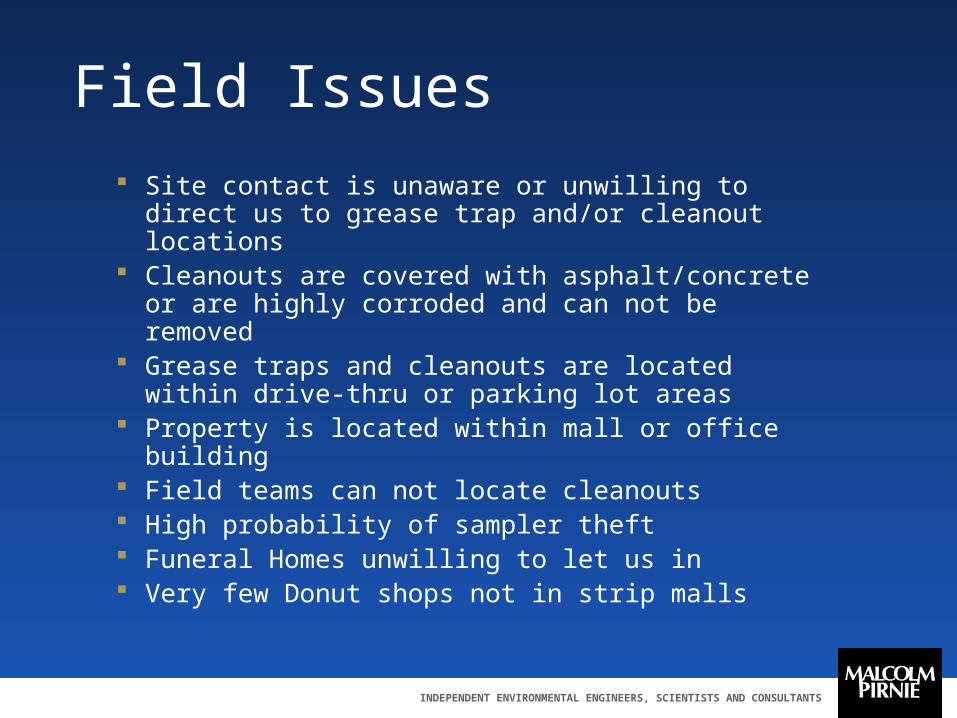
Field Issues
Site contact is unaware or unwilling to direct us to grease trap and/or cleanout locations
Cleanouts are covered with asphalt/concrete or are highly corroded and can not be removed
Grease traps and cleanouts are located within drive-thru or parking lot areas
Property is located within mall or office building Field teams can not locate cleanouts High probability of sampler theft Funeral Homes unwilling to let us in Very few Donut shops not in strip malls
INDEPENDENT ENVIRONMENTAL ENGINEERS, SCIENTISTS AND CONSULTANTS
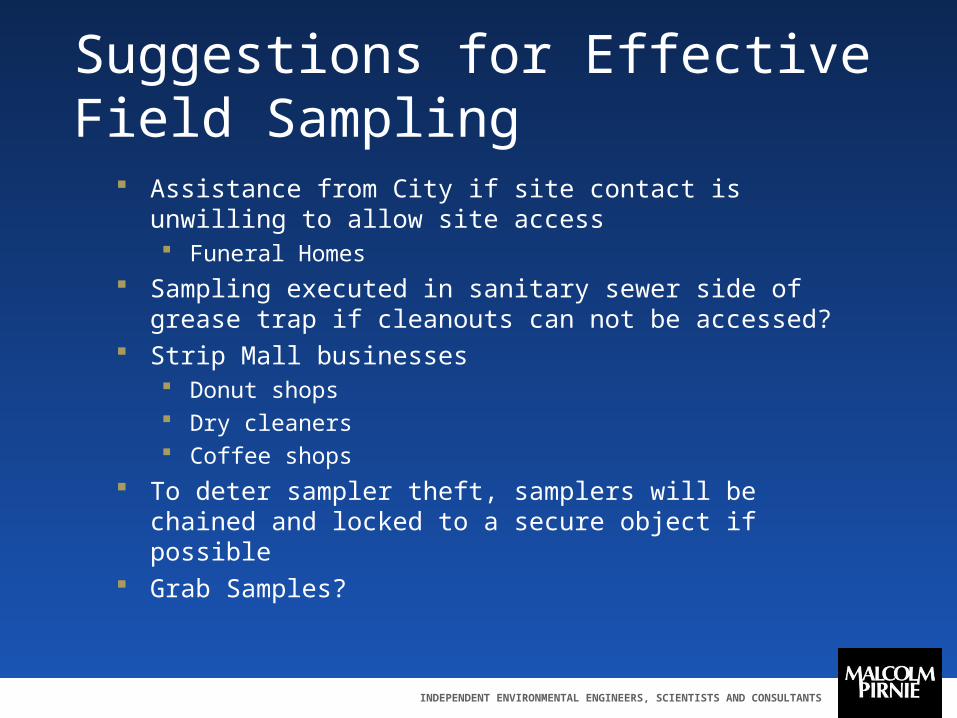
Suggestions for Effective Field Sampling
Assistance from City if site contact is unwilling to allow site access Funeral Homes
Sampling executed in sanitary sewer side of grease trap if cleanouts can not be accessed?
Strip Mall businesses Donut shops Dry cleaners Coffee shops
To deter sampler theft, samplers will be chained and locked to a secure object if possible
Grab Samples?

INDEPENDENT ENVIRONMENTAL ENGINEERS, SCIENTISTS AND CONSULTANTS
Surcharge Class Study Phase II
Customer Survey Design Survey Distribution Field Sampling & Data Validation Statistical Analysis Reporting Final Recommendations
INDEPENDENT ENVIRONMENTAL ENGINEERS, SCIENTISTS AND CONSULTANTS
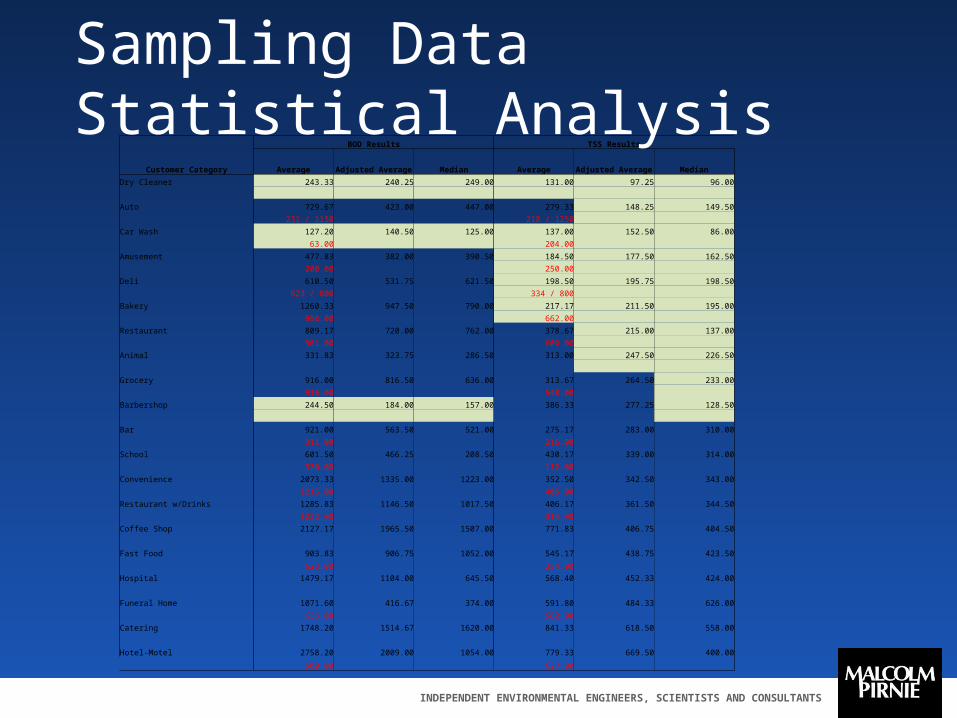
BOD Results TSS Results
Customer Category AverageAdjusted Average Median Average
Adjusted Average Median
Dry Cleaner 243.33 240.25 249.00 131.00 97.25 96.00
Auto 729.67 423.00 447.00 279.33 148.25 149.50
231 / 1150 218 / 1250
Car Wash 127.20 140.50 125.00 137.00 152.50 86.00
63.00 204.00
Amusement 477.83 382.00 390.50 184.50 177.50 162.50
200.00 250.00
Deli 610.50 531.75 621.50 198.50 195.75 198.50
623 / 800 334 / 800
Bakery 1260.33 947.50 790.00 217.17 211.50 195.00
988.00 662.00
Restaurant 809.17 720.00 762.00 378.67 215.00 137.00
961.00 600.00
Animal 331.83 323.75 286.50 313.00 247.50 226.50
Grocery 916.00 816.50 636.00 313.67 264.50 233.00
916.00 548.00
Barbershop 244.50 184.00 157.00 386.33 277.25 128.50
Bar 921.00 563.50 521.00 275.17 283.00 310.00
311.00 216.00
School 601.50 466.25 208.50 430.17 339.00 314.00
330.00 112.00
Convenience 2073.33 1335.00 1223.00 352.50 342.50 343.00
1215.00 405.00
Restaurant w/Drinks 1285.83 1146.50 1017.50 406.17 361.50 344.50
1222.00 314.00
Coffee Shop 2127.17 1965.50 1507.00 771.83 406.75 404.50
Fast Food 903.83 906.75 1052.00 545.17 438.75 423.50
623.00 334.00
Hospital 1479.17 1104.00 645.50 568.40 452.33 424.00
Funeral Home 1071.60 416.67 374.00 591.80 484.33 626.00
635.00 562.00
Catering 1748.20 1514.67 1620.00 841.33 618.50 558.00
Hotel-Motel 2758.20 2009.00 1054.00 779.33 669.50 400.00
500.00 627.00
Sampling Data Statistical Analysis
INDEPENDENT ENVIRONMENTAL ENGINEERS, SCIENTISTS AND CONSULTANTS
Additional Sampling Evaluation
Hotel / Motel had significant variation - onsite restaurants vs. continental breakfast
Some sampling and testing determined non-representative
Additional samples needed to provide statistical numbers
Some classes had large variations
INDEPENDENT ENVIRONMENTAL ENGINEERS, SCIENTISTS AND CONSULTANTS
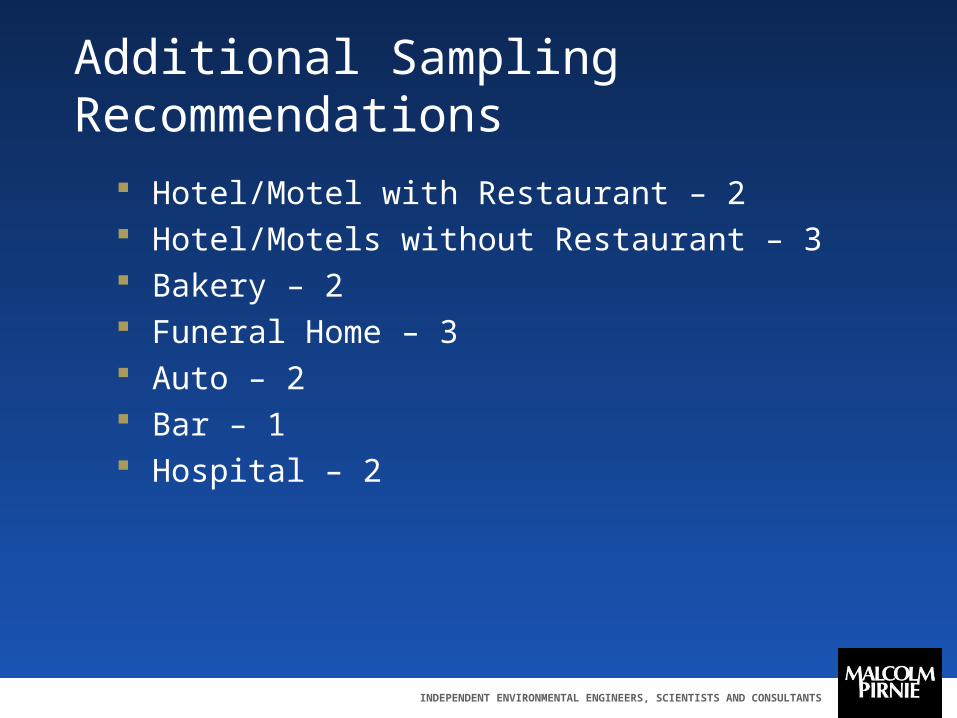
Additional Sampling Recommendations
Hotel/Motel with Restaurant – 2 Hotel/Motels without Restaurant – 3 Bakery – 2 Funeral Home – 3 Auto – 2 Bar – 1 Hospital – 2

INDEPENDENT ENVIRONMENTAL ENGINEERS, SCIENTISTS AND CONSULTANTS
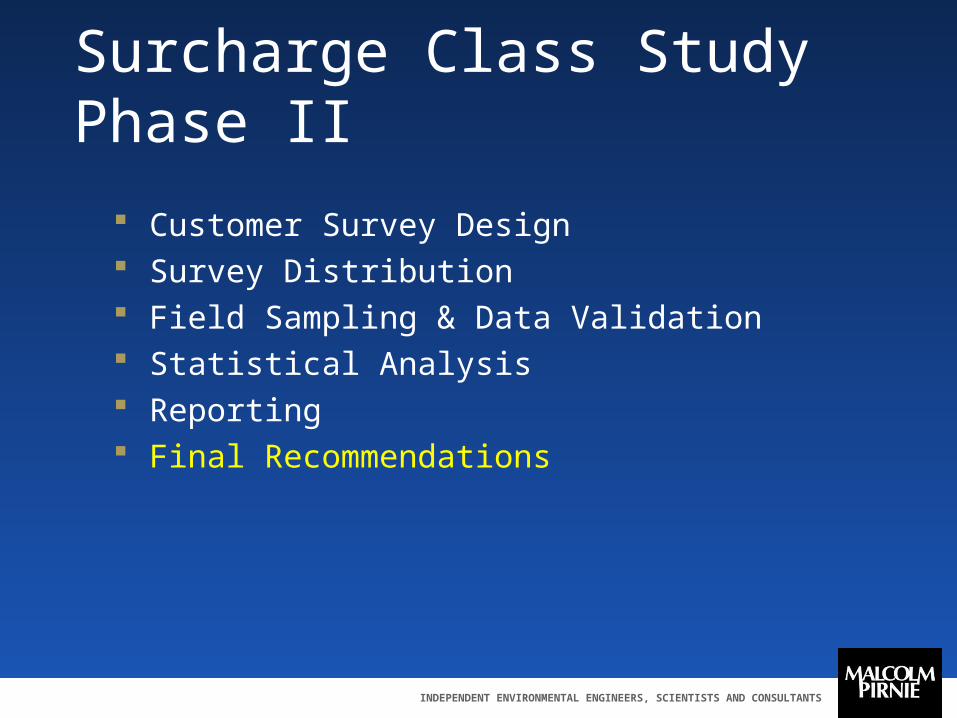
Surcharge Class Study Phase II
Customer Survey Design Survey Distribution Field Sampling & Data Validation Statistical Analysis Reporting Final Recommendations
INDEPENDENT ENVIRONMENTAL ENGINEERS, SCIENTISTS AND CONSULTANTS
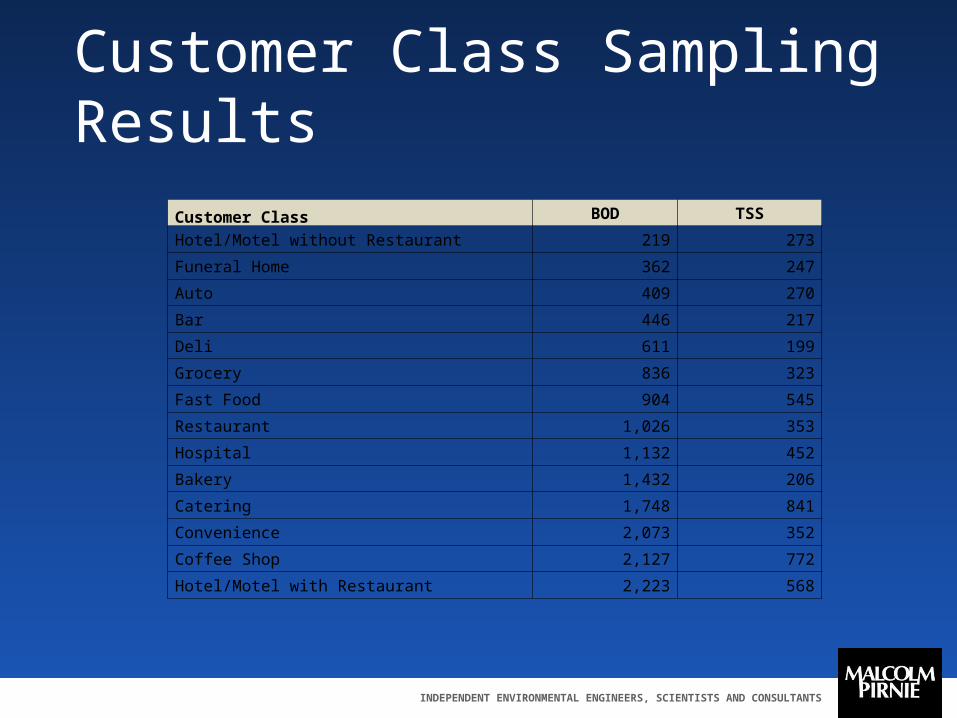
Customer Class Sampling Results
Customer Class BOD TSS
Hotel/Motel without Restaurant 219 273
Funeral Home 362 247
Auto 409 270
Bar 446 217
Deli 611 199
Grocery 836 323
Fast Food 904 545
Restaurant 1,026 353
Hospital 1,132 452
Bakery 1,432 206
Catering 1,748 841
Convenience 2,073 352
Coffee Shop 2,127 772
Hotel/Motel with Restaurant 2,223 568
INDEPENDENT ENVIRONMENTAL ENGINEERS, SCIENTISTS AND CONSULTANTS
Surcharge Class Study Phase II
Customer Survey Design Survey Distribution Field Sampling & Data Validation Statistical Analysis Reporting Final Recommendations
INDEPENDENT ENVIRONMENTAL ENGINEERS, SCIENTISTS AND CONSULTANTS
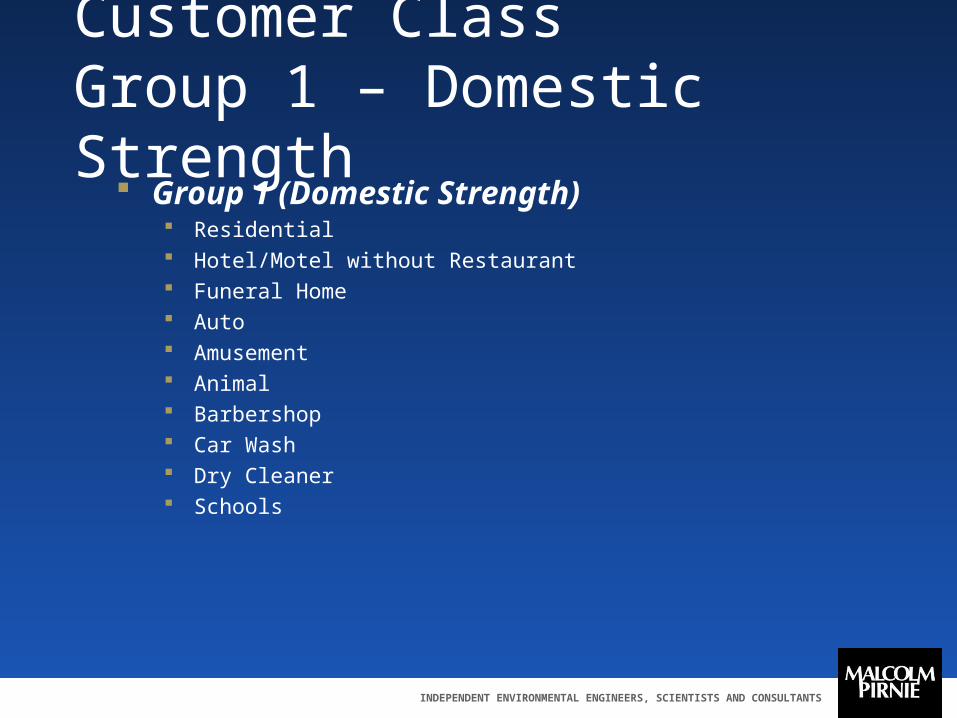
Customer ClassGroup 1 – Domestic Strength
Group 1 (Domestic Strength) Residential Hotel/Motel without Restaurant Funeral Home Auto Amusement Animal Barbershop Car Wash Dry Cleaner Schools
INDEPENDENT ENVIRONMENTAL ENGINEERS, SCIENTISTS AND CONSULTANTS
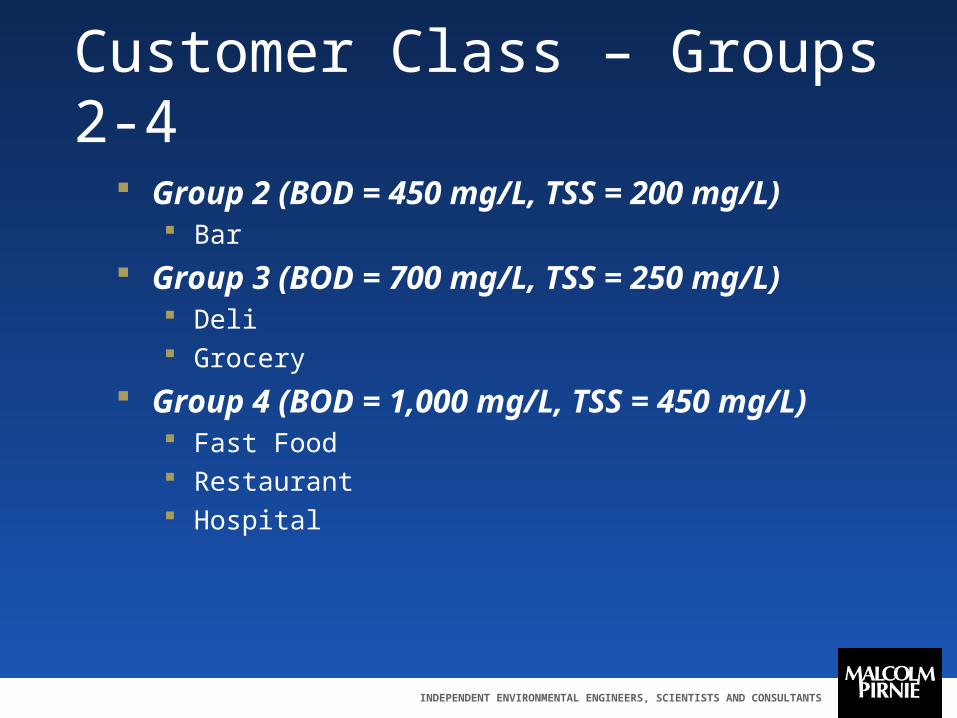
Customer Class – Groups 2-4
Group 2 (BOD = 450 mg/L, TSS = 200 mg/L) Bar
Group 3 (BOD = 700 mg/L, TSS = 250 mg/L) Deli Grocery
Group 4 (BOD = 1,000 mg/L, TSS = 450 mg/L) Fast Food Restaurant Hospital
INDEPENDENT ENVIRONMENTAL ENGINEERS, SCIENTISTS AND CONSULTANTS
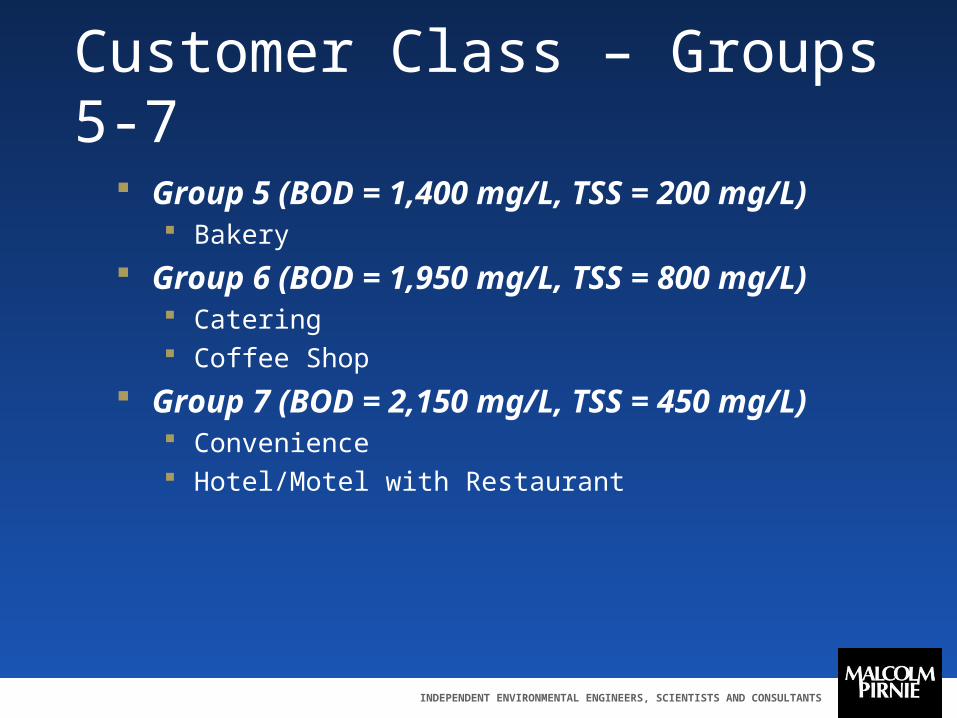
Customer Class – Groups 5-7
Group 5 (BOD = 1,400 mg/L, TSS = 200 mg/L) Bakery
Group 6 (BOD = 1,950 mg/L, TSS = 800 mg/L) Catering Coffee Shop
Group 7 (BOD = 2,150 mg/L, TSS = 450 mg/L) Convenience Hotel/Motel with Restaurant
INDEPENDENT ENVIRONMENTAL ENGINEERS, SCIENTISTS AND CONSULTANTS
Significant Industrial Users Surcharge – Group X
SIUs are sampled and managed through DWU Pretreatment & Laboratory Services
SIUs are not a customer class as currently defined in the City Ordinance
INDEPENDENT ENVIRONMENTAL ENGINEERS, SCIENTISTS AND CONSULTANTS
Future Steps
Dallas Water Utilities calculates new wastewater billing rates for Customer Classes
City of Dallas Ordinance is updated with new Customer Classes
Billing systems are updated Certificate of Occupancy forms are updated to
identify Customer Class as new business are added
INDEPENDENT ENVIRONMENTAL ENGINEERS, SCIENTISTS AND CONSULTANTS
Morgan Dadgostar, Dallas Water Utilities, [email protected]
Jennifer Ivey, Malcolm Pirnie Inc., [email protected]
Randy McIntyre, Malcolm Pirnie Inc., [email protected]