Embed Size (px)
Citation preview
Corporate advisers Legal advisers
Independent Directors recommend that you ACCEPT the Mawarid Offer in the absence of a superior proposal
The Independent Expert has concluded that the Offer is “Fair and Reasonable” to UCL Shareholders
Target's Statement
In response to the offer by Mawarid Mining LLC to acquire all of your ordinary shares in UCL Resources Limited ACN 002 118 872
THIS DOCUMENT CONTAINS IMPORTANT INFORMATION AND REQUIRES YOUR IMMEDIATE ATTENTION. IF YOU ARE IN ANY DOUBT AS TO HOW TO DEAL WITH THIS DOCUMENT CONSULT YOUR STOCKBROKER, LEGAL OR FINANCIAL ADVISER.
For
per
sona
l use
onl
y
Target’s statement
Table of contents
Letter to Shareholders -------------------------------------------------------------------------------------- 2
What should you do? ---------------------------------------------------------------------------------------- 4
Why you should accept the Mawarid Offer --------------------------------------------------------------- 5
Frequently asked questions about the Mawarid Offer --------------------------------------------------- 9
1 Independent Directors’ recommendation ------------------------------------------------------- 12
2 Key terms of the Mawarid Offer ------------------------------------------------------------------ 13
3 Profile of UCL --------------------------------------------------------------------------------------- 16
4 About Mawarid ------------------------------------------------------------------------------------- 22
5 Your choices as a UCL Shareholder -------------------------------------------------------------- 25
6 Tax consequences --------------------------------------------------------------------------------- 27
7 Directors’ interests -------------------------------------------------------------------------------- 29
8 Additional information ---------------------------------------------------------------------------- 32
9 Approval of Target’s Statement ------------------------------------------------------------------ 34
10 Definitions and interpretation -------------------------------------------------------------------- 35
Annexure A -------------------------------------------------------------------------------------------------- 39 Independent Expert's Report 39
Annexure B -------------------------------------------------------------------------------------------------- 40 Company announcements 40
For
per
sona
l use
onl
y
Target's Statement
Important Notices
Shareholder information
To make a fully informed decision, read this Target’s Statement. If you have any questions, please call the UCL Resources Limited (UCL) Shareholder information line on +61 2 9279 1760 on weekdays between 9.00am and 5.00pm, or visit our website at www.uclresources.com.au.
The Directors are committed to ensuring Shareholders are kept informed of developments. Important developments under the control of UCL will be notified direct to Shareholders.
About this document
This document is a Target’s Statement issued by UCL under Part 6.5 Division 3 of the Corporations Act in response to a Bidder’s Statement issued by Mawarid.
If you are in any doubt as to how to deal with this document, consult your stockbroker or your legal, financial or other professional adviser as soon as possible.
A copy of this Target’s Statement has been lodged with ASIC and sent to ASX. Neither ASIC nor ASX take any responsibility for the content of this Target’s Statement.
Defined terms
A number of defined terms are used in this Target’s Statement. These terms are explained in the definitions in Section 10.
Forward looking statements
This Target’s Statement contains forward looking statements. The forward looking statements in this Target’s Statement reflect views held at the date of this Target’s Statement.
You should be aware that such statements involve inherent risks and uncertainties. Actual events or results may differ materially from the events or results expressed or implied in any forward looking statement and those deviations are both normal and to be expected. None of UCL, its officers or any person named in this Target’s Statement with their consent or involved in the preparation of this Target’s Statement makes any representation or warranty, as to the accuracy or likelihood of fulfilment of any forward looking statement. You should not place undue reliance on those statements.
Privacy statement
UCL has collected your information from the register of Shareholders. The Corporations Act permits that information to be made available to certain persons, including Mawarid. Your information may also be disclosed on a confidential basis to UCL’s related bodies corporate and external service providers and may be required to be disclosed to regulatory parties such as ASIC. You can contact us for details of information held by us about you.
For
per
sona
l use
onl
y
Target's Statement 2
Letter to Shareholders 1 May 2013 Dear Shareholder Independent Directors recommend acceptance of the Mawarid Offer
On 23 April 2013, Mawarid Mining LLC (Mawarid) made an on-market takeover bid for all the Shares that it does not already own in UCL Resources Limited (UCL).
You should shortly receive the Bidder’s Statement from Mawarid containing an offer to acquire all of your UCL Shares for 31 cents cash per Share (Mawarid Offer).
Your Independent Directors recommend that you accept the Mawarid Offer in the absence of a superior proposal.
This Target’s Statement sets out your Independent Directors’ reasons for that recommendation.
Except for Dr Mohammed Al-Barwani, who is also the Chairman of MB Holding Company LLC (MB Holding), the parent company of Mawarid, each of your Directors intends to accept the Mawarid Offer in respect of all UCL Shares they hold or control.
Prior to the announcement of the Offer, UCL had a market capitalisation of approximately $11.4 million. UCL is focusing on the development of the Sandpiper Marine Phosphate Project (Sandpiper) located in Namibia. Sandpiper’s capital expenditure has been estimated to be in the order of US$323 million. Assuming project debt of 50%, UCL would have to raise in the order of $80-90 million to fund its share of Sandpiper’s capital cost at a time of challenging equity markets, particularly for small and medium sized companies.
The Mawarid Offer is unconditional and in cash. The Offer Price represents substantial premiums of:
(a) 182% to UCL’s closing Share price on 22 April 2013, being the day prior to the announcement of the Offer;
(b) 145% to UCL’s 30 business day VWAP prior to the announcement of the Offer; and
(c) 131% to UCL’s 90 business day VWAP prior to the announcement of the Offer.
The Mawarid Offer provides tangible value to UCL Shareholders in a time of continued uncertainty and difficult capital markets. In the absence of the Mawarid Offer, UCL would have to raise several times its market capitalisation to fund its share of Sandpiper’s capital cost. It is the Independent Directors’ view that the Mawarid Offer is in the best interests of Shareholders when compared to currently available alternatives.
The certainty of a cash payment at a significant premium to recent market prices for your investment in UCL is particularly attractive given the relative quantum of UCL’s funding requirement for Sandpiper and the risks associated with project development.
For
per
sona
l use
onl
y
Target's Statement 3
An Independent Expert’s Report (IER) has been prepared by Grant Thornton Corporate Finance Pty Ltd (Grant Thornton) and is set out in Annexure A to this Target’s Statement. The Independent Expert has concluded that the Mawarid Offer is “Fair and Reasonable”. The key reasons for the Independent Expert’s conclusion are:
(a) the Offer Price of 31 cents per UCL Share is within the assessed valuation range of 27.0 cents to 37.1 cents for UCL Shares on a control basis;
(b) the Mawarid Offer represents an opportunity for UCL Shareholders to receive certain and immediate value for their UCL Shares;
(c) UCL will be required to raise additional debt and equity funds in the short term which in the Independent Expert’s opinion will result in significant dilution of existing Shareholders. The Mawarid Offer removes any potential financial funding and dilutionary risks for UCL Shareholders; and
(d) it is likely that the liquidity of UCL Shares will decrease following the Mawarid Offer.
While the Independent Directors recommend that Shareholders accept the Mawarid Offer in the absence of a superior proposal, it is important that Shareholders understand that there are disadvantages associated with doing so. These include:
(a) they will no longer be entitled to receive any economic benefit associated with an investment in UCL, or from the development of either Sandpiper or Mehdiabad; and
(b) they will no longer benefit from any increase in the trading price of UCL Shares.
Since the Mawarid Offer was announced on 23 April 2013, Mawarid has acquired 38.09% of UCL Shares meaning that its total relevant interest in UCL is now 57.1%. A summary of Mawarid’s intentions in circumstances where it obtains relevant interests of 50% or more is set out in Section 7 of the Bidder’s Statement.
Twynam Agricultural Group Pty Ltd (a substantial shareholder of UCL prior to the announcement of the Offer) has already accepted the Mawarid Offer.
If you have any questions about the Mawarid Offer, please call the UCL Shareholder information line on +61 2 9279 1760 on weekdays between 9.00am and 5.00pm, or visit UCL’s website at www.uclresources.com.au.
Yours faithfully
Ian W Ross Chairman
For
per
sona
l use
onl
y
Target's Statement 4
What should you do? 1 You should read this Target’s Statement, which contains your Independent Directors’
recommendation to accept the Mawarid Offer in the absence of a superior proposal and their reasons for this recommendation.
2 To accept the Mawarid Offer:
• If your UCL Shares are held in a CHESS Holding (your HIN starts with “X”), you must instruct your Controlling Participant to accept the Mawarid Offer.
• If your UCL Shares are held in an Issuer Sponsored Holding (your SRN starts with “I”) and do not have a Broker, you will need to appoint a Broker to accept the Mawarid Offer.
• If you are a Broker or an ASX Participant, you will need to initiate acceptance in accordance with the requirements of the ASX Settlement Operating Rules.
• If you are a beneficial owner whose UCL Shares are held in the name of a broker, investment dealer, bank, trust company or other nominee, you should contact that nominee for assistance in accepting the Mawarid Offer.
Brokerage will apply to your acceptance of the Mawarid Offer.
3 If you have any questions, please call the UCL Shareholder information line on +61 2 9279 1760 on a weekday between 9.00am and 5.00pm.
For
per
sona
l use
onl
y

Target's Statement 5
Why you should accept the Mawarid Offer
1 You will receive a significant premium for your UCL Shares
2 The Independent Expert has concluded that the Mawarid Offer is “Fair and Reasonable”
3 The Mawarid Offer is an unconditional and 100% cash offer
4 The Mawarid Offer is supported by UCL’s Independent Directors
5 UCL’s Independent Directors intend to accept the Mawarid Offer in respect of all UCL Shares they hold or control
6 There may be adverse consequences associated with not accepting the Mawarid Offer
7 No superior proposal has emerged
8 UCL would need to raise in the order of $80-90 million to fund its share of Sandpiper’s capital cost
While the Independent Directors recommend that Shareholders accept the Mawarid Offer in the absence of a superior proposal, it is important that Shareholders understand that there are disadvantages associated with doing so. These include:
(a) they will no longer be entitled to receive any economic benefit associated with an investment in UCL, or from the development of either Sandpiper or Mehdiabad
(b) they will no longer benefit from any increase in the trading price of UCL Shares
For
per
sona
l use
onl
y
Target's Statement 6
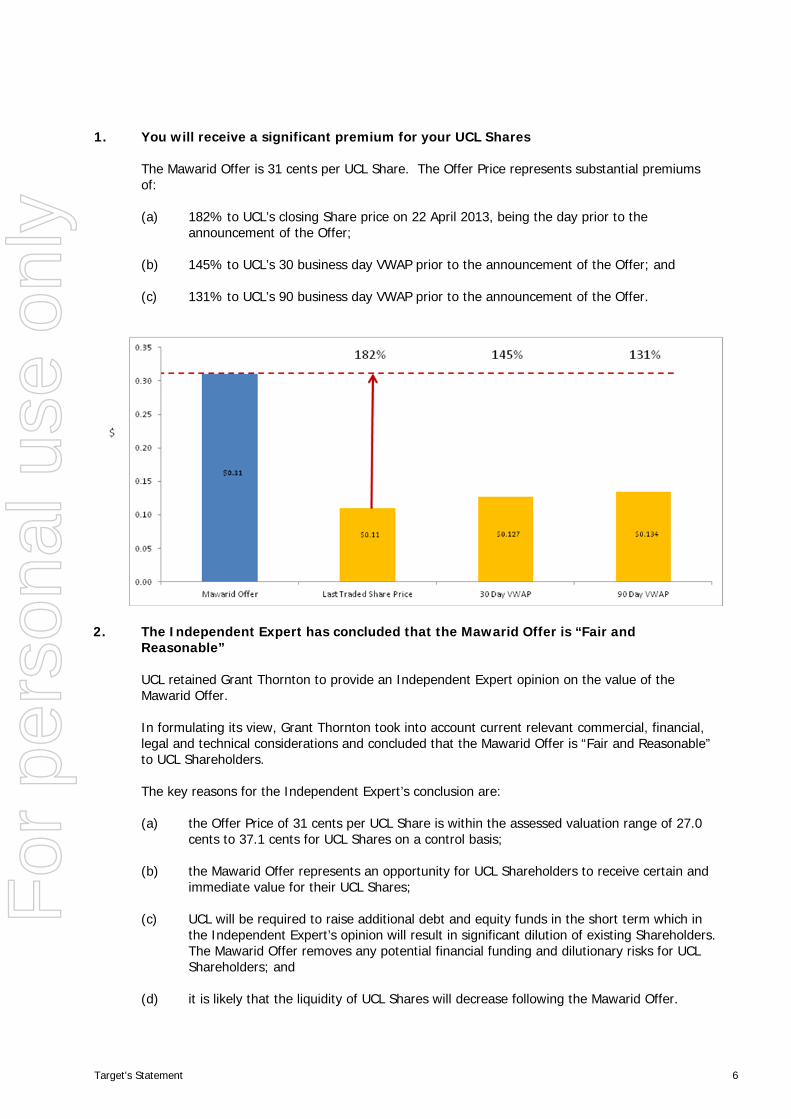
1. You will receive a significant premium for your UCL Shares
The Mawarid Offer is 31 cents per UCL Share. The Offer Price represents substantial premiums of:
(a) 182% to UCL’s closing Share price on 22 April 2013, being the day prior to the announcement of the Offer;
(b) 145% to UCL’s 30 business day VWAP prior to the announcement of the Offer; and
(c) 131% to UCL’s 90 business day VWAP prior to the announcement of the Offer.
2. The Independent Expert has concluded that the Mawarid Offer is “Fair and Reasonable”
UCL retained Grant Thornton to provide an Independent Expert opinion on the value of the Mawarid Offer.
In formulating its view, Grant Thornton took into account current relevant commercial, financial, legal and technical considerations and concluded that the Mawarid Offer is “Fair and Reasonable” to UCL Shareholders.
The key reasons for the Independent Expert’s conclusion are:
(a) the Offer Price of 31 cents per UCL Share is within the assessed valuation range of 27.0 cents to 37.1 cents for UCL Shares on a control basis;
(b) the Mawarid Offer represents an opportunity for UCL Shareholders to receive certain and immediate value for their UCL Shares;
(c) UCL will be required to raise additional debt and equity funds in the short term which in the Independent Expert’s opinion will result in significant dilution of existing Shareholders. The Mawarid Offer removes any potential financial funding and dilutionary risks for UCL Shareholders; and
(d) it is likely that the liquidity of UCL Shares will decrease following the Mawarid Offer.
For
per
sona
l use
onl
y
Target's Statement 7
3. The Mawarid Offer is an unconditional 100% cash offer
The Mawarid Offer is an unconditional 100% cash offer. Mawarid has indicated that the Offer Price will be paid from its own cash reserves and that it has transferred such amount into an Australian Bank account.
The Mawarid Offer provides immediate and certain value for your UCL Shares with settlement occurring three Trading Days after your acceptance, in accordance with usual rules for settlement of on-market transactions on ASX.
4. The Mawarid Offer is supported by UCL’s Independent Directors
Except for Dr Mohammed Al-Barwani who is the Chairman of MB Holding, the parent company of Mawarid and has consequently abstained from making any recommendation, your Directors unanimously recommend that you accept the Mawarid Offer in the absence of a superior proposal.
5. UCL’s Independent Directors intend to accept the Mawarid Offer in respect of all UCL Shares they hold or control
Except for Dr Mohammed Al-Barwani, each of your Directors intends to accept the Mawarid Offer in respect of all UCL Shares they hold or control.
6. There may be adverse consequences associated with not accepting the Mawarid Offer If you do not accept the Mawarid Offer and Mawarid gains effective control of UCL but is not entitled to proceed to compulsory acquisition of the outstanding UCL Shares, then you would remain a minority Shareholder in UCL. If UCL remains listed, it is unlikely that the UCL Share price would sustain the current takeover premium and, accordingly, would likely fall below the Offer Price. In particular, if only a limited number of Shareholders remain, it is also possible that the market for your UCL Shares may become less liquid, making it more difficult to sell your UCL Shares in the future. In addition, you would likely be required to fund your respective share of UCL’s funding commitment for Sandpiper or be diluted.
There is also a risk that if there is insufficient spread of UCL Shareholders, UCL may be de-listed from the ASX which could have a further adverse effect on the price and marketability of your UCL Shares.
7. No superior proposal has emerged
At the date of this Target’s Statement, your Directors have not received a competing proposal from any other potential acquirer, nor are they aware of any party with an intention to make such a proposal.
Given the nature of the Mawarid Offer and its respective holdings in UCL and Sandpiper, the Directors consider it unlikely that a competing proposal will emerge.
8. UCL would need to raise in the order of $80-90 million to fund its share of Sandpiper’s capital cost.
Sandpiper’s capital expenditure has been estimated to be in the order of US$323 million. Assuming project debt of 50%, UCL would have to raise in the order of $80-90 million to fund its share of Sandpiper’s capital cost at a time of challenging equity markets, particularly for small and medium sized companies.
For
per
sona
l use
onl
y

Target's Statement 8
Given UCL’s market capitalisation, Shareholders who do not participate in UCL’s equity raising will be substantially diluted.
For
per
sona
l use
onl
y
Target's Statement 9
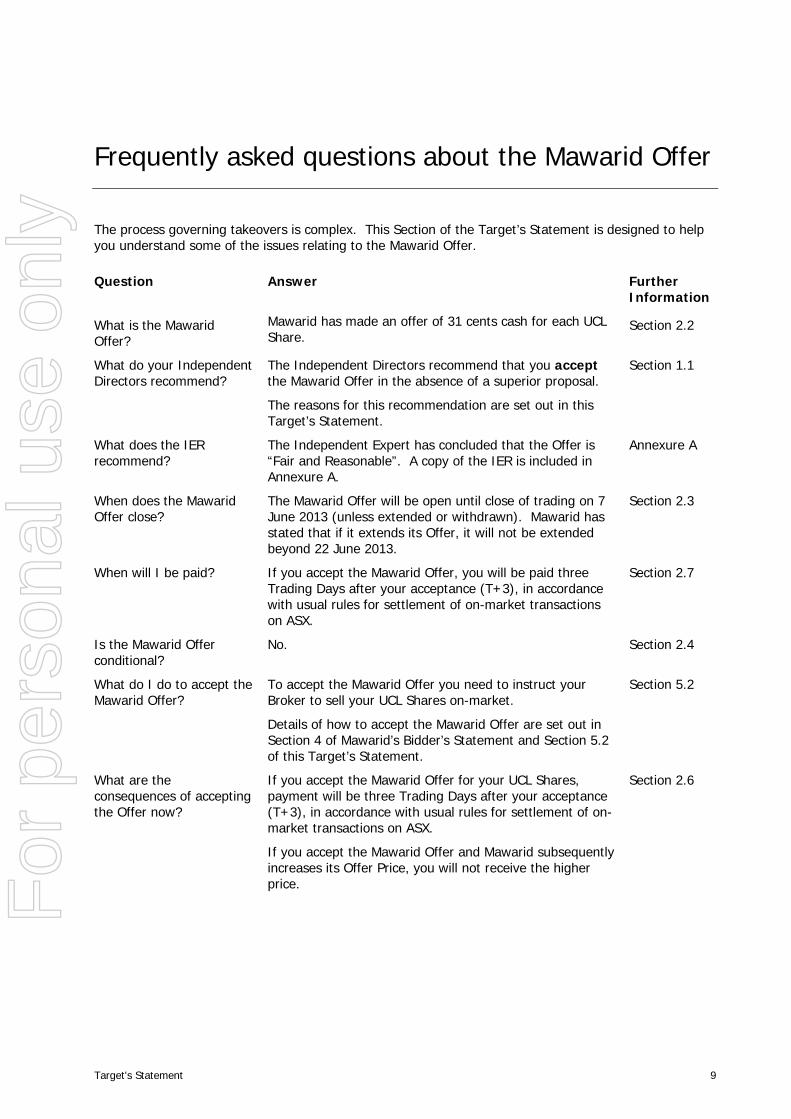
Frequently asked questions about the Mawarid Offer
The process governing takeovers is complex. This Section of the Target’s Statement is designed to help you understand some of the issues relating to the Mawarid Offer. Question Answer Further
Information
What is the Mawarid Offer?
Mawarid has made an offer of 31 cents cash for each UCL Share.
Section 2.2
What do your Independent Directors recommend?
The Independent Directors recommend that you accept the Mawarid Offer in the absence of a superior proposal.
The reasons for this recommendation are set out in this Target’s Statement.
Section 1.1
What does the IER recommend?
The Independent Expert has concluded that the Offer is “Fair and Reasonable”. A copy of the IER is included in Annexure A.
Annexure A
When does the Mawarid Offer close?
The Mawarid Offer will be open until close of trading on 7 June 2013 (unless extended or withdrawn). Mawarid has stated that if it extends its Offer, it will not be extended beyond 22 June 2013.
Section 2.3
When will I be paid? If you accept the Mawarid Offer, you will be paid three Trading Days after your acceptance (T+3), in accordance with usual rules for settlement of on-market transactions on ASX.
Section 2.7
Is the Mawarid Offer conditional?
No. Section 2.4
What do I do to accept the Mawarid Offer?
To accept the Mawarid Offer you need to instruct your Broker to sell your UCL Shares on-market.
Details of how to accept the Mawarid Offer are set out in Section 4 of Mawarid’s Bidder’s Statement and Section 5.2 of this Target’s Statement.
Section 5.2
What are the consequences of accepting the Offer now?
If you accept the Mawarid Offer for your UCL Shares, payment will be three Trading Days after your acceptance (T+3), in accordance with usual rules for settlement of on-market transactions on ASX.
If you accept the Mawarid Offer and Mawarid subsequently increases its Offer Price, you will not receive the higher price.
Section 2.6
For
per
sona
l use
onl
y
Target's Statement 10
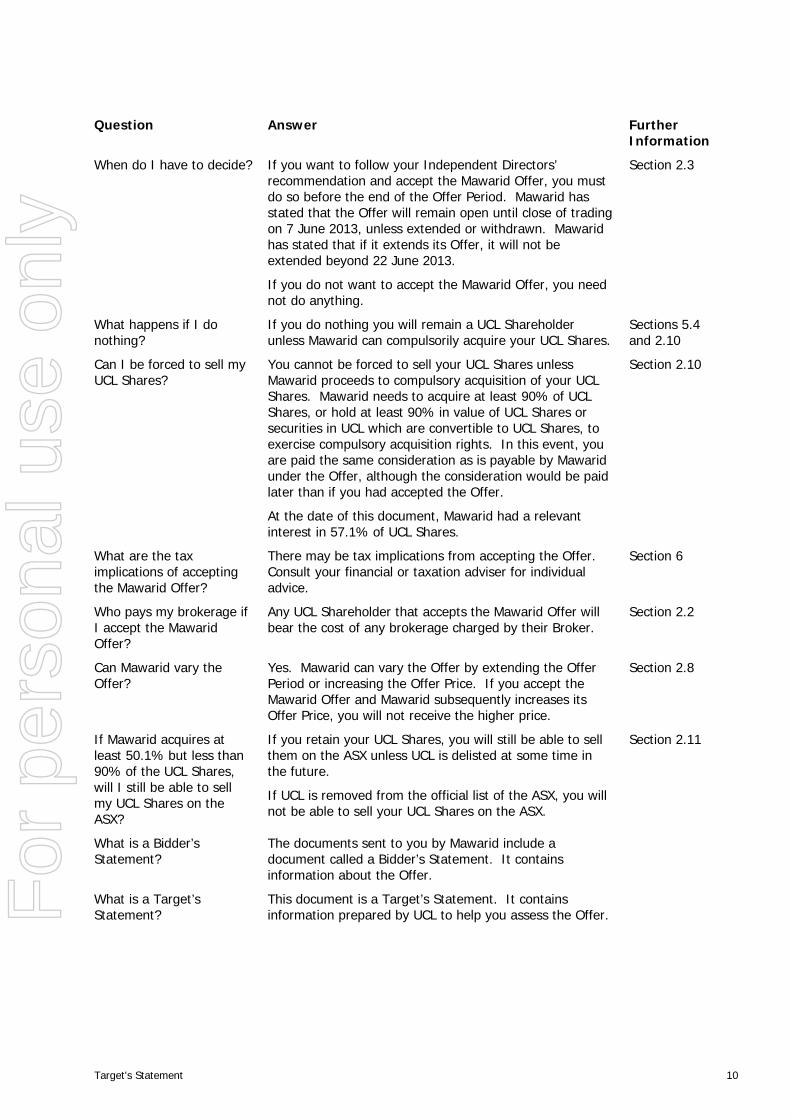
Question Answer Further Information
When do I have to decide? If you want to follow your Independent Directors’ recommendation and accept the Mawarid Offer, you must do so before the end of the Offer Period. Mawarid has stated that the Offer will remain open until close of trading on 7 June 2013, unless extended or withdrawn. Mawarid has stated that if it extends its Offer, it will not be extended beyond 22 June 2013.
If you do not want to accept the Mawarid Offer, you need not do anything.
Section 2.3
What happens if I do nothing?
If you do nothing you will remain a UCL Shareholder unless Mawarid can compulsorily acquire your UCL Shares.
Sections 5.4 and 2.10
Can I be forced to sell my UCL Shares?
You cannot be forced to sell your UCL Shares unless Mawarid proceeds to compulsory acquisition of your UCL Shares. Mawarid needs to acquire at least 90% of UCL Shares, or hold at least 90% in value of UCL Shares or securities in UCL which are convertible to UCL Shares, to exercise compulsory acquisition rights. In this event, you are paid the same consideration as is payable by Mawarid under the Offer, although the consideration would be paid later than if you had accepted the Offer.
At the date of this document, Mawarid had a relevant interest in 57.1% of UCL Shares.
Section 2.10
What are the tax implications of accepting the Mawarid Offer?
There may be tax implications from accepting the Offer. Consult your financial or taxation adviser for individual advice.
Section 6
Who pays my brokerage if I accept the Mawarid Offer?
Any UCL Shareholder that accepts the Mawarid Offer will bear the cost of any brokerage charged by their Broker.
Section 2.2
Can Mawarid vary the Offer?
Yes. Mawarid can vary the Offer by extending the Offer Period or increasing the Offer Price. If you accept the Mawarid Offer and Mawarid subsequently increases its Offer Price, you will not receive the higher price.
Section 2.8
If Mawarid acquires at least 50.1% but less than 90% of the UCL Shares, will I still be able to sell my UCL Shares on the ASX?
If you retain your UCL Shares, you will still be able to sell them on the ASX unless UCL is delisted at some time in the future.
If UCL is removed from the official list of the ASX, you will not be able to sell your UCL Shares on the ASX.
Section 2.11
What is a Bidder’s Statement?
The documents sent to you by Mawarid include a document called a Bidder’s Statement. It contains information about the Offer.
What is a Target’s Statement?
This document is a Target’s Statement. It contains information prepared by UCL to help you assess the Offer.
For
per
sona
l use
onl
y

Target's Statement 11
Question Answer Further Information
What if I have other questions about the Offer?
If you have any questions, please call the UCL Shareholder information line on +61 2 9279 1760 on a weekday between 9.00am and 5.00pm, or visit UCL’s website at www.uclresources.com.au.
Announcements made to the ASX by UCL and other information relating to the Mawarid Offer can be obtained from UCL’s website at www.uclresources.com.au.
For
per
sona
l use
onl
y
Target's Statement 12
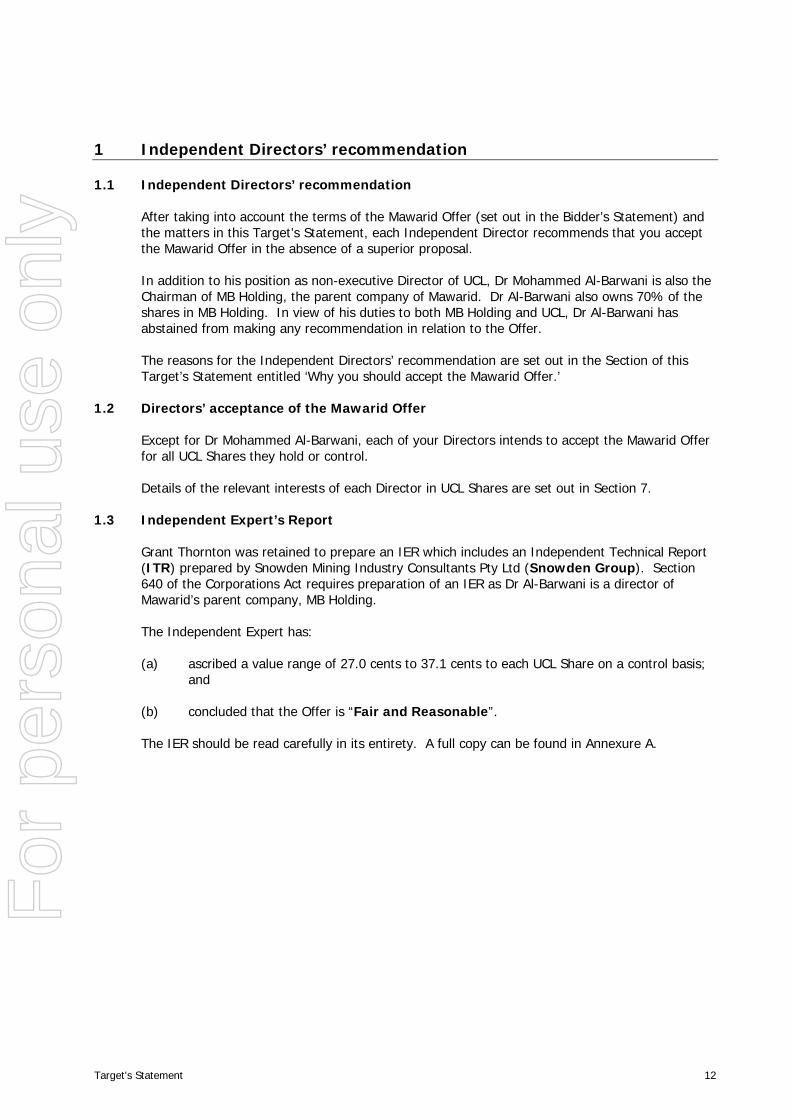
1 Independent Directors’ recommendation
1.1 Independent Directors’ recommendation
After taking into account the terms of the Mawarid Offer (set out in the Bidder’s Statement) and the matters in this Target’s Statement, each Independent Director recommends that you accept the Mawarid Offer in the absence of a superior proposal.
In addition to his position as non-executive Director of UCL, Dr Mohammed Al-Barwani is also the Chairman of MB Holding, the parent company of Mawarid. Dr Al-Barwani also owns 70% of the shares in MB Holding. In view of his duties to both MB Holding and UCL, Dr Al-Barwani has abstained from making any recommendation in relation to the Offer.
The reasons for the Independent Directors’ recommendation are set out in the Section of this Target’s Statement entitled ‘Why you should accept the Mawarid Offer.’
1.2 Directors’ acceptance of the Mawarid Offer
Except for Dr Mohammed Al-Barwani, each of your Directors intends to accept the Mawarid Offer for all UCL Shares they hold or control.
Details of the relevant interests of each Director in UCL Shares are set out in Section 7.
1.3 Independent Expert’s Report
Grant Thornton was retained to prepare an IER which includes an Independent Technical Report (ITR) prepared by Snowden Mining Industry Consultants Pty Ltd (Snowden Group). Section 640 of the Corporations Act requires preparation of an IER as Dr Al-Barwani is a director of Mawarid’s parent company, MB Holding.
The Independent Expert has:
(a) ascribed a value range of 27.0 cents to 37.1 cents to each UCL Share on a control basis; and
(b) concluded that the Offer is “Fair and Reasonable”.
The IER should be read carefully in its entirety. A full copy can be found in Annexure A.
For
per
sona
l use
onl
y
Target's Statement 13
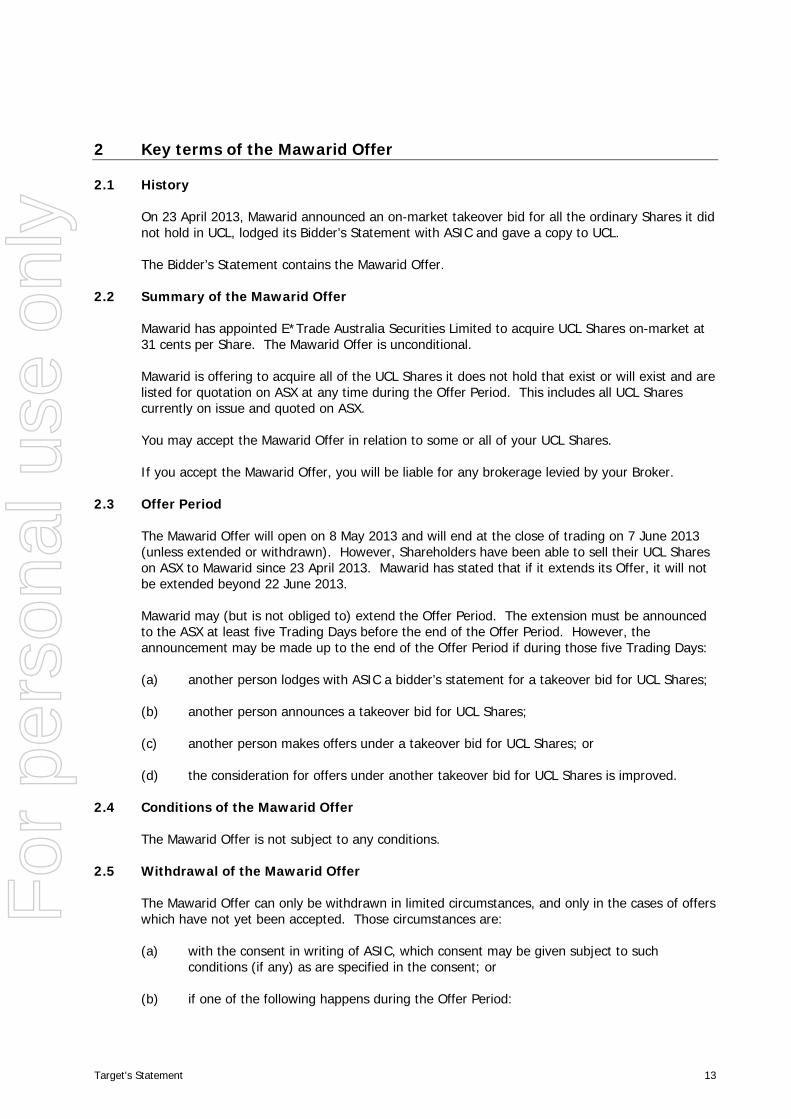
2 Key terms of the Mawarid Offer
2.1 History
On 23 April 2013, Mawarid announced an on-market takeover bid for all the ordinary Shares it did not hold in UCL, lodged its Bidder’s Statement with ASIC and gave a copy to UCL.
The Bidder’s Statement contains the Mawarid Offer.
2.2 Summary of the Mawarid Offer
Mawarid has appointed E*Trade Australia Securities Limited to acquire UCL Shares on-market at 31 cents per Share. The Mawarid Offer is unconditional.
Mawarid is offering to acquire all of the UCL Shares it does not hold that exist or will exist and are listed for quotation on ASX at any time during the Offer Period. This includes all UCL Shares currently on issue and quoted on ASX.
You may accept the Mawarid Offer in relation to some or all of your UCL Shares.
If you accept the Mawarid Offer, you will be liable for any brokerage levied by your Broker.
2.3 Offer Period
The Mawarid Offer will open on 8 May 2013 and will end at the close of trading on 7 June 2013 (unless extended or withdrawn). However, Shareholders have been able to sell their UCL Shares on ASX to Mawarid since 23 April 2013. Mawarid has stated that if it extends its Offer, it will not be extended beyond 22 June 2013.
Mawarid may (but is not obliged to) extend the Offer Period. The extension must be announced to the ASX at least five Trading Days before the end of the Offer Period. However, the announcement may be made up to the end of the Offer Period if during those five Trading Days:
(a) another person lodges with ASIC a bidder’s statement for a takeover bid for UCL Shares;
(b) another person announces a takeover bid for UCL Shares;
(c) another person makes offers under a takeover bid for UCL Shares; or
(d) the consideration for offers under another takeover bid for UCL Shares is improved.
2.4 Conditions of the Mawarid Offer
The Mawarid Offer is not subject to any conditions.
2.5 Withdrawal of the Mawarid Offer
The Mawarid Offer can only be withdrawn in limited circumstances, and only in the cases of offers which have not yet been accepted. Those circumstances are:
(a) with the consent in writing of ASIC, which consent may be given subject to such conditions (if any) as are specified in the consent; or
(b) if one of the following happens during the Offer Period:
For
per
sona
l use
onl
y
Target's Statement 14
(i) a liquidator or provisional liquidator of UCL or of a subsidiary is appointed;
(ii) a court makes an order for the winding up of UCL or of a subsidiary;
(iii) an administrator of UCL, or of a subsidiary, is appointed under Sections 436A, 436B or 436C of the Corporations Act;
(iv) UCL or a subsidiary executes a deed of company arrangement; or
(v) a receiver, or a receiver and manager, is appointed in relation to the whole, or a substantial part, of the property of UCL or of a subsidiary.
The Corporations Act sets out a number of other circumstances in which a bidder can withdraw an on-market offer where its voting power is less than 50%. These circumstances do not apply to Mawarid given that as at the date of this document it had a voting power of greater than 50% in respect of UCL.
2.6 Effect of acceptance
If you accept the Mawarid Offer, you will forfeit the opportunity to benefit from any superior offer made by another bidder for your UCL Shares, if such an offer were to eventuate, or any increase in the Offer Price.
2.7 Payment of consideration
If you accept the Mawarid Offer, you will be paid three Trading Days after your acceptance (T+3), in accordance with usual rules for settlement of on-market transactions on ASX.
2.8 Changes to the Mawarid Offer
Mawarid can vary the Offer by:
(a) extending the Offer Period up to 22 June 2013; or
(b) increasing the consideration offered under the Mawarid Offer.
If you accept the Offer and Mawarid subsequently increases its Offer Price, you are not entitled to receive the higher price.
2.9 Funding
The funding for the acquisition of UCL Shares will be provided from Mawarid’s own cash reserves. Mawarid has transferred such amount into an Australian Bank account.
Further details about these arrangements are set out in Section 9 of the Bidder’s Statement.
2.10 Compulsory acquisition
Mawarid has indicated in Section 7.2 of its Bidder’s Statement that, if it is entitled to do so, it will proceed to compulsorily acquire all remaining UCL Shares.
Under Section 661A of the Corporations Act, Mawarid is entitled to compulsorily acquire any UCL Shares for which it has not received an acceptance of its Offer if, during or at the end of the Offer Period, Mawarid and its associates have a relevant interest in at least 90% (by number) of UCL Shares. The consideration per UCL Share payable to UCL Shareholders whose Shares are compulsorily acquired is the same as that payable under the Mawarid Offer.
For
per
sona
l use
onl
y
Target's Statement 15
On 30 April 2013, Mawarid announced that it had a relevant interest in 57.1% of UCL Shares on issue.
If Mawarid is entitled to proceed to compulsory acquisition, it will have one month after the Offer Period to give compulsory acquisition notices to UCL Shareholders who have not accepted the Offer. UCL Shareholders have statutory rights to challenge the compulsory acquisition, but a successful challenge will require the Shareholders to establish to the satisfaction of a court that the terms of the Offer do not represent ‘fair value’ for the UCL Shares.
2.11 Mawarid’s intention if 90% threshold not met
Mawarid has stated in Section 7.3 of its Bidder’s Statement that if it acquires less than 90% of the UCL Shares (so that it cannot proceed to compulsorily acquire the remaining Shares), but still gains effective control of UCL, then it will consider:
(a) the benefits and suitability of UCL remaining listed on ASX having regard to the ASX Listing Rules and the additional corporate and compliance costs. If UCL is delisted, UCL Shares cannot be traded on the ASX;
(b) depending on the level of ownership achieved, replacing:
(i) the Directors; and
(ii) UCL nominees appointed as directors of any company,
with Mawarid nominee directors to reflect Mawarid’s majority ownership of UCL; and
(c) acquiring additional UCL Shares under the “creep” provisions set out in the Corporations Act.
If UCL becomes a controlled entity but not a wholly owned subsidiary of Mawarid, there are also a number of other objectives and goals that a newly constituted Board of Directors of UCL would attempt to implement, to the extent possible and appropriate, as set out in Section 7.3 of the Bidder’s Statement.
Mawarid has also stated that to the extent that UCL does not become a wholly owned subsidiary of Mawarid and there are minority Shareholders of UCL, Mawarid intends that the Mawarid nominees appointed as Directors of UCL will act at all times in accordance with their fiduciary duties and that all shareholder approvals and other legal requirements are complied with in pursuing any of the intentions outlined in the Bidder’s Statement.
Those requirements may require the approval of minority Shareholders to the implementation of any particular objective.
For
per
sona
l use
onl
y
Target's Statement 16
3 Profile of UCL
This Section contains more detailed information on UCL’s businesses, financial outlook and its management.
3.1 Introduction
UCL is an Australian registered public company listed on the ASX (ASX:UCL). Immediately prior to the announcement of the Offer, UCL had a market capitalisation of approximately $11.4 million.
UCL’s material mining assets are:
(a) its 42.5% interest in Sandpiper located off the Namibian coast; and
(b) its 24.5% interest in the Mehdiabad Project located in central Iran.
3.2 Business overview
Sandpiper
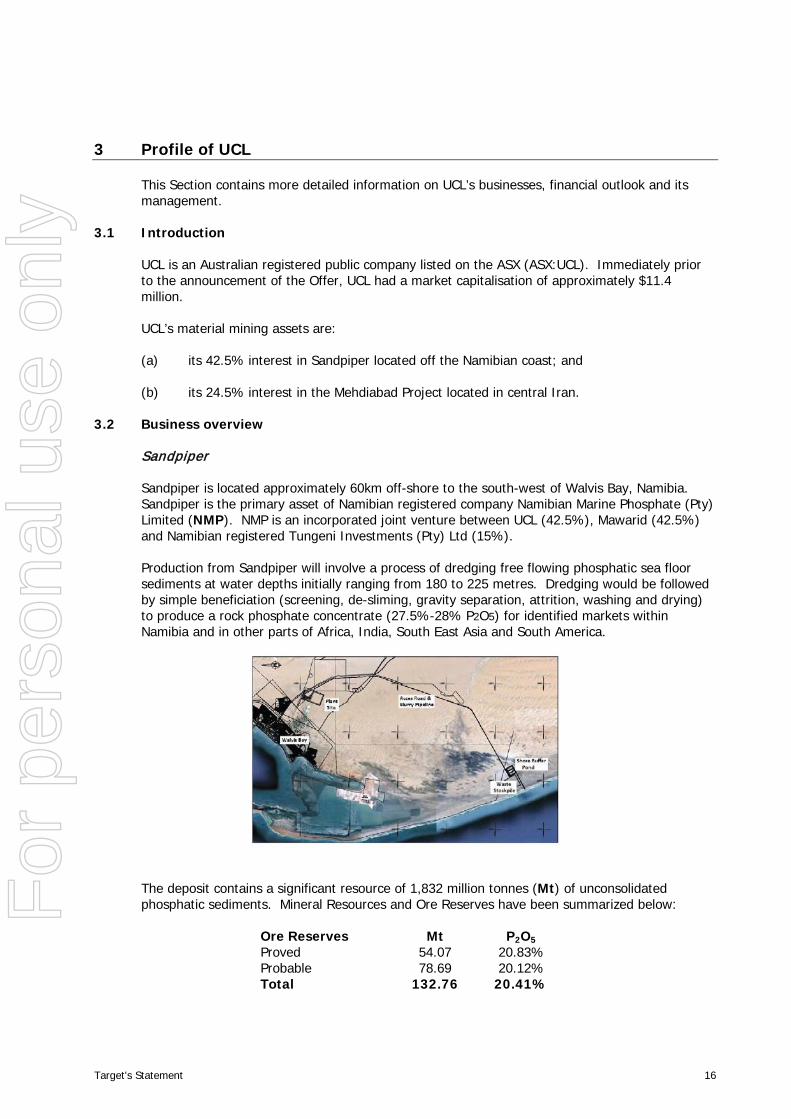
Sandpiper is located approximately 60km off-shore to the south-west of Walvis Bay, Namibia. Sandpiper is the primary asset of Namibian registered company Namibian Marine Phosphate (Pty) Limited (NMP). NMP is an incorporated joint venture between UCL (42.5%), Mawarid (42.5%) and Namibian registered Tungeni Investments (Pty) Ltd (15%).
Production from Sandpiper will involve a process of dredging free flowing phosphatic sea floor sediments at water depths initially ranging from 180 to 225 metres. Dredging would be followed by simple beneficiation (screening, de-sliming, gravity separation, attrition, washing and drying) to produce a rock phosphate concentrate (27.5%-28% P2O5) for identified markets within Namibia and in other parts of Africa, India, South East Asia and South America.
The deposit contains a significant resource of 1,832 million tonnes (Mt) of unconsolidated phosphatic sediments. Mineral Resources and Ore Reserves have been summarized below:
Ore Reserves Mt P2O5 Proved 54.07 20.83% Probable 78.69 20.12% Total 132.76 20.41%
For
per
sona
l use
onl
y
Target's Statement 17
Mineral Resources* Mt P2O5 Indicated 79.75 19.82% Inferred 1,608.00 18.90% Total 1,687.75 *Mineral Resources excluding Ore Reserves
The information in this Target’s Statement that relates to Mineral Resources and Ore Reserves for Sandpiper is based on information compiled by Mr Roger Daniel who is a member of the Australasian Institute of Mining and Metallurgy. Mr Daniel is a full-time employee of UCL. Mr Daniel has sufficient experience which is relevant to the style of mineralisation and type of deposit under consideration and to the activity which is being undertaken to qualify as a Competent Person as defined in the JORC Code. Mr Daniel consents to the inclusion in the Target’s Statement of the matters based on his information in the form and context in which it appears. A Definitive Feasibility Study (DFS) was completed in March 2012 confirming that Sandpiper is technically feasible and has the potential to be a long life operation. Updated DFS results were released to the market on 12 April 2013. In 2012, NMP lodged a marine Environmental Impact Assessment (EIA) and Environmental Management Plan Report (EMPR) with the Namibian Ministry of Environment and Tourism. NMP continues to work with the Namibian regulatory authorities to progress the EIA and EMPR and at the date of this document had not received the marine Environmental Contract. Execution of the marine Environmental Contract is an important step in Sandpiper’s path to production. NMP operates Sandpiper under the terms of a Shareholders’ Agreement between NMP and its shareholders. This agreement governs decision-making with respect to Sandpiper. Some decisions require unanimous shareholder approval including approval of capital expenditure and adoption of business plans. Other decisions are by simple majority vote.
Mehdiabad
The Mehdiabad lead-zinc-silver project is the primary asset of Iranian registered company Mehdiabad Zinc Company (MZC). MZC is an incorporated joint venture between UCL (24.5%), Karoun Dez Dasht (45.6%), Itok GmbH (24.5%) and a number of minority shareholders (5.4%).
A third party to the joint venture company, the Iranian Mines and Mining Industries Development and Renovation Organisation (IMIDRO), holds the exploration licence relating to Mehdiabad. In December 2006, IMIDRO purported to terminate several agreements between the shareholders in MZC relating to Mehdiabad. Progress with respect to Mehdiabad has been halted since that time and consequently expenditure on Mehdiabad has been fully impaired in the books of UCL. Notwithstanding, the UCL Board considered it should maintain an interest in Mehdiabad and continued to work with the relevant Iranian authorities to seek an amicable agreement. In 2012, a 25 year Production Agreement for Mehdiabad was executed between IMIDRO and MZC.
The exploration status of Mehdiabad remains unchanged since 2008 and is summarized below. Over 52,000 metres of diamond drilling delineated a 394 million tonne resource containing zinc (Zn), lead (Pb) and silver (Ag). Details of the resource (utilising a 2.0% Zn equivalent cut-off grade) as reported in 2007 include:
Resource Classification
Tonnes (Mt)
Zn (%)
Pb (%)
Ag (g/t)
Measured 140 4.1 1.6 34 Indicated 222 4.2 1.6 36 Inferred 32 4.5 1.4 38 Total 394 4.2 1.6 36
For
per
sona
l use
onl
y
Target's Statement 18
The information in this Target’s Statement that relates to Mineral Resources for Mehdiabad, including metallurgical recoveries and the appropriateness of the use of a 2% lower Zn cut-off grade (the appropriate lower economic cut-off for zinc resources) for reporting of Resources, is based on information compiled by Patrick Scott, consultant to UCL. Mr Scott is a director of PS Associates Pty Ltd and a Fellow of the Australasian Institute of Mining and Metallurgy. Mr Scott has sufficient experience which is relevant to the style of mineralisation and type of deposit under consideration and to the activity which he is undertaking to qualify as a Competent Person as defined in the JORC Code. Mr Scott consents to the inclusion in the Target’s Statement of the matters based on his information in the form and context in which it appears.
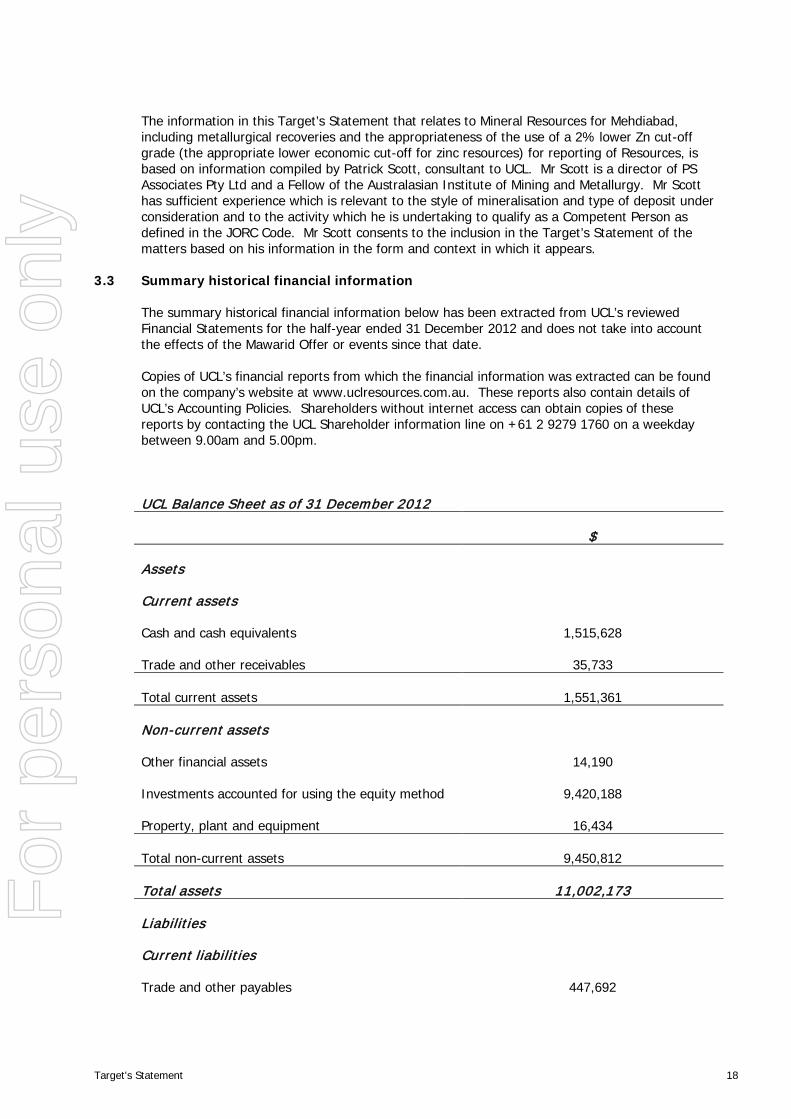
3.3 Summary historical financial information
The summary historical financial information below has been extracted from UCL’s reviewed Financial Statements for the half-year ended 31 December 2012 and does not take into account the effects of the Mawarid Offer or events since that date.
Copies of UCL’s financial reports from which the financial information was extracted can be found on the company’s website at www.uclresources.com.au. These reports also contain details of UCL’s Accounting Policies. Shareholders without internet access can obtain copies of these reports by contacting the UCL Shareholder information line on +61 2 9279 1760 on a weekday between 9.00am and 5.00pm.
UCL Balance Sheet as of 31 December 2012
$
Assets
Current assets
Cash and cash equivalents 1,515,628
Trade and other receivables 35,733
Total current assets 1,551,361
Non-current assets
Other financial assets 14,190
Investments accounted for using the equity method 9,420,188
Property, plant and equipment 16,434
Total non-current assets 9,450,812
Total assets 11,002,173
Liabilities
Current liabilities
Trade and other payables 447,692
For
per
sona
l use
onl
y
Target's Statement 19
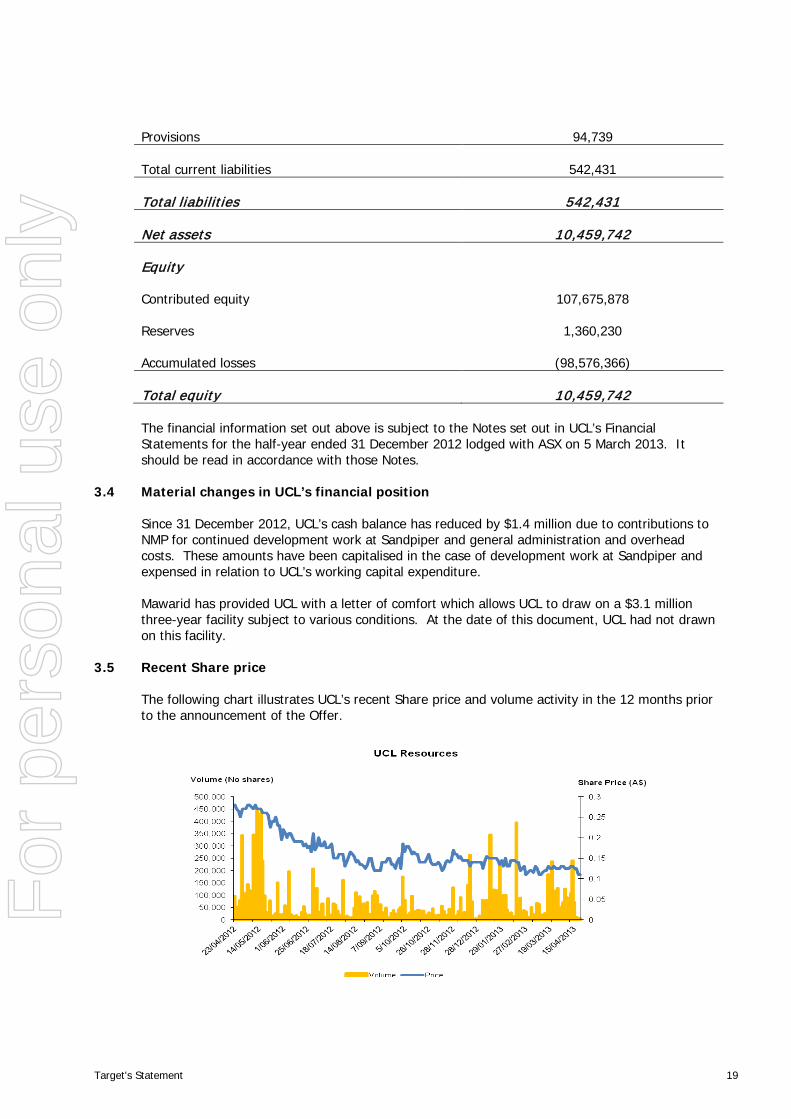
Provisions 94,739
Total current liabilities 542,431
Total liabilities 542,431
Net assets 10,459,742
Equity
Contributed equity 107,675,878
Reserves 1,360,230
Accumulated losses (98,576,366)
Total equity 10,459,742
The financial information set out above is subject to the Notes set out in UCL’s Financial Statements for the half-year ended 31 December 2012 lodged with ASX on 5 March 2013. It should be read in accordance with those Notes.
3.4 Material changes in UCL’s financial position
Since 31 December 2012, UCL’s cash balance has reduced by $1.4 million due to contributions to NMP for continued development work at Sandpiper and general administration and overhead costs. These amounts have been capitalised in the case of development work at Sandpiper and expensed in relation to UCL’s working capital expenditure.
Mawarid has provided UCL with a letter of comfort which allows UCL to draw on a $3.1 million three-year facility subject to various conditions. At the date of this document, UCL had not drawn on this facility.
3.5 Recent Share price
The following chart illustrates UCL’s recent Share price and volume activity in the 12 months prior to the announcement of the Offer.
For
per
sona
l use
onl
y

Target's Statement 20
UCL Shares have traded below 20 cents per Share for the nine months and below 15 cents for the three months prior to the announcement of the Mawarid Offer.
3.6 Continuously disclosing entity
As a company listed on the securities exchange operated by the ASX and a ‘disclosing entity’ under the Corporations Act, UCL is subject to regular reporting and continuous disclosure obligations. UCL’s recent announcements are available on the company’s website at www.uclresources.com.au. Further announcements concerning developments which require disclosure will continue to be made available on this website after the date of this Target’s Statement.
These documents can also be accessed through the ASX’s website at www.asx.com.au.
3.7 No material litigation
The Directors are not aware of any current material litigation involving UCL.
3.8 Issued capital
At the date of this document, UCL’s issued capital was 103,605,361 fully paid ordinary Shares as disclosed in the last Appendix 3B lodged with the ASX.
UCL has no listed options, however the Company does have unlisted options. At the date of this document, UCL had 3,933,335 unlisted options issued to directors and ex-directors either in accordance with the UCL employee share option plan or approval by UCL Shareholders.
There are no voting rights attached to the unlisted options. Holders are entitled to receive one fully paid UCL Share at an exercise price stipulated in the option certificate or option deed.
At the date of this document, UCL had 2,875,000 performance rights issued to executives and directors in accordance with the UCL performance rights plan. Details are set out in the table below. Performance rights
Action performance rights vest upon
Expiry date Exercise price
485,000 MZC being granted a valid licence to exploit Mehdiabad
4 September 2014 $0.1461
726,667 Completion of the definitive feasibility study in respect of Sandpiper
31 March 2014 $0.2724
565,000 Completion of phase 1 (on completion of the first run-of-mine ore discharged from the dredge vessel) in respect of Sandpiper
2 years after vesting 60 day VWAP prior to vesting
450,000 First commercial production of beneficiated phosphate from Sandpiper
2 years after vesting Nil exercise price
648,333 First commercial shipment of beneficiated phosphate from Sandpiper
2 years after vesting 60 day VWAP prior to vesting
For
per
sona
l use
onl
y
Target's Statement 21
For further details of the relevant interests in Shares, options and performance rights of each UCL Director, refer to Section 7.1.
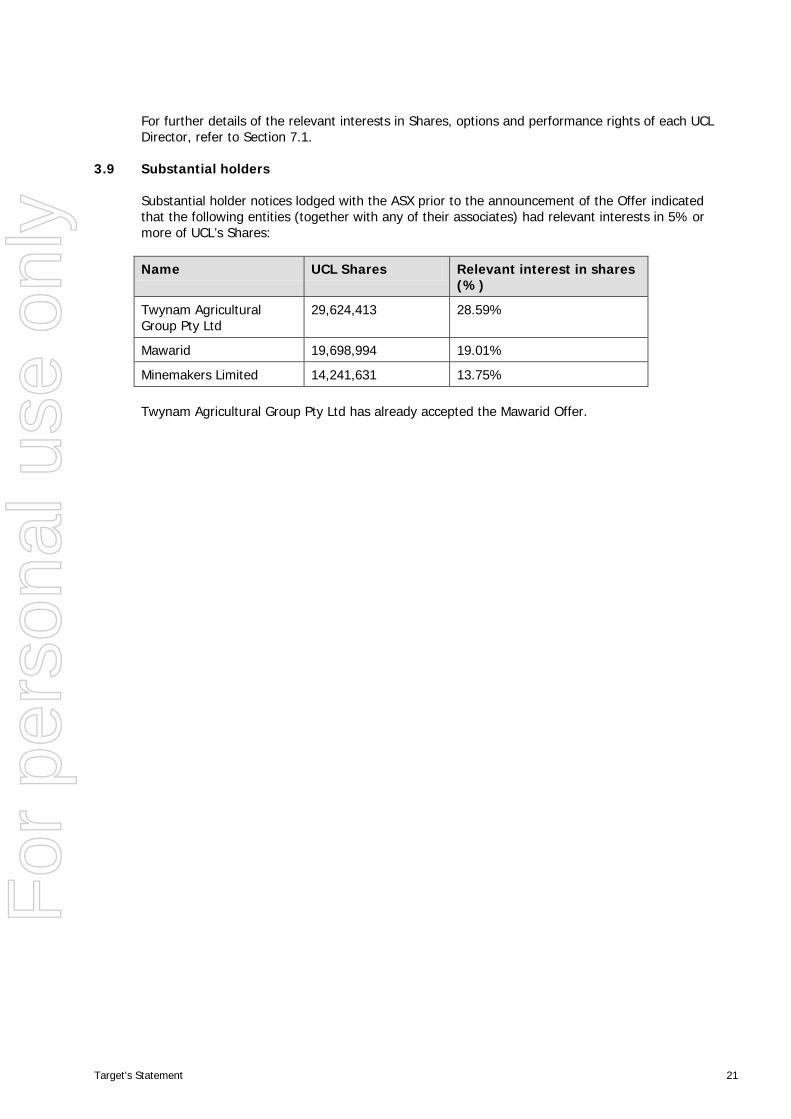
3.9 Substantial holders
Substantial holder notices lodged with the ASX prior to the announcement of the Offer indicated that the following entities (together with any of their associates) had relevant interests in 5% or more of UCL’s Shares: Name UCL Shares Relevant interest in shares
(%)
Twynam Agricultural Group Pty Ltd
29,624,413 28.59%
Mawarid 19,698,994 19.01%
Minemakers Limited 14,241,631 13.75%
Twynam Agricultural Group Pty Ltd has already accepted the Mawarid Offer.
For
per
sona
l use
onl
y
Target's Statement 22
4 About Mawarid
4.1 Important information
The following information about Mawarid is based on public information, including information in the Bidder’s Statement, and has not been independently verified. UCL makes no representation or warranty, express or implied as to the accuracy or completeness of this information. The information on Mawarid in this Target’s Statement should not be considered comprehensive.
4.2 Overview of Mawarid and its principal activities
The following overview of Mawarid and its principal activities is taken from Section 5 of the Bidder’s Statement. Mawarid is limited liability company incorporated in the Sultanate of Oman. Mawarid is a subsidiary of MB Holding. MB Holding is owned by Dr. Mohammed Al-Barwani (as to 70%) and 6 of his immediate family members (as to 5% each).
Mawarid's head office is located in the Sultanate of Oman. Mawarid also has operational offices in Kazakhstan, the Kingdom of Saudi Arabia and Tanzania.
Mawarid was originally established under the name of National Mining Company to explore and develop mining opportunities in Oman and internationally, primarily related to the mining and processing of copper, gold and silver ore. Mawarid was the first private sector mining company to engage in the exploration and development of copper and gold assets in the Sultanate of Oman. Mawarid currently has approximately 480 employees.
Mawarid has expertise in exploration, drilling, project evaluation, mine planning, and mining and processing. Mawarid operates several open pit copper mines and processes ore at its copper concentrate facility in Lasail, Oman, which is the only copper concentrator plant in the country.
Mawarid’s strategy is to expand exploration activities within Oman as well as the range of minerals to be mined and processed. Mawarid’s management intends to utilise its installed capacity and expertise to expand its project portfolio into international markets as well.
Prior to the announcement of the Offer, Mawarid held approximately 19.01% of the issued capital of UCL and 42.5% of the issued capital of NMP the joint venture company for Sandpiper. UCL also holds 42.5% of the issued capital of NMP.
Mawarid recently made an investment in Nautilus Minerals Inc. (and now holds approximately 16.6% of the issued capital of Nautilus Minerals Inc.). Nautilus Minerals Inc. is a TSX listed entity engaged in development of subsea mining of minerals in Papua New Guinea and in the pacific region.
4.3 Overview of MB Holding
MB Holding is a leading business house in the Sultanate of Oman with operations primarily in the Middle East, Europe, United Kingdom, Asia-Pacific, South East Asia and Australasia. MB Holdings operates its businesses through four business segments that focus on oil and gas well services (MB Petroleum Services LLC), the exploration and production of oil and gas (Petrogas E&P LLC), the development and mining of mineral resources (Mawarid) and engineering & manufacturing services catering to the oil and gas, aviation, mining and marine industries (United Engineering Services LLC). MB Holding also operates an investments segment through which it periodically undertakes investments in a variety of financial instruments, including bonds, notes and equities.
For
per
sona
l use
onl
y
Target's Statement 23
MB Holding’s four primary business lines operate as individual profit centres and each of these business lines is conducted through operating subsidiaries.
MB Holding was first established in 1982 under the name MB Trading by Dr. Al-Barwani, the current chairman of MB Holding. Through a number of subsequent acquisitions, as well as the organic growth and expansion of its operations, MB Holding now operates in 20 countries and continues to identify and pursue additional areas of operation.
In 2004, MB Holding was reorganised and the companies through which its four business segments operate were brought under MB Holding as operational subsidiaries. Today, MB Holding employs more than 6,000 individuals in twenty countries. MB Holding’s overall strategic objective is to be a global player in providing integrated oil and gas well services and exploring and producing oil, gas and mineral resources responsibly and cost effectively. In addition to this overall strategy, each of the individual business lines has its own specific strategy.
Exploration and Production
MB Holding conducts its oil and gas exploration and production business through Petrogas E&P LLC (Petrogas), a wholly owned subsidiary. Petrogas is active in Oman and overseas, and was established in January of 1999. Petrogas was founded to diversify the existing oil services business of the MB Group and added an exploration and production business to complement its oil field services business. MB Holding’s principal strategy within its exploration and production business line is to actively pursue exploration and production opportunities in Oman as well as internationally, principally in the Gulf region and the Indian subcontinent, and to develop a portfolio of producing and exploration assets.
Mining and Minerals
MB Holding conducts its mining and minerals business through Mawarid.
Engineering and Manufacturing Services
MB Holding conducts its engineering and manufacturing services through United Engineering Services LLC (UES), a wholly owned subsidiary of MB Holding with a presence in Oman, United Kingdom and Malaysia. UES focuses on providing engineering, manufacturing and trading services related to the oil and gas, aviation and marine industry and its customers consist of oil and gas companies, sovereign entities and manufacturing companies.
Oil & Gas Services
MB Holding conducts its oil and gas services through Mohammed Al-Barwani Petroleum Services LLC (MBPS), a wholly owned subsidiary of MB Holding. MBPS has operations in nearly 18 countries and provides integrated oil and gas services such as drilling, workover, well service, well test, coiled tubing, completion, pumping, wireline and mud logging services through a one stop shop.
4.4 Partners
As a limited liability company incorporated in the Sultanate of Oman, Mawarid does not have directors (as would be the case for an Australian incorporated company). Mawarid is controlled and operated by its shareholders.
As at the date of the Bidder’s Statement, the shareholders of Mawarid are MB Holding (holding 99.9% of the issued capital of Mawarid) and Dr. Al-Barwani (holding 0.1% of the issued capital of Mawarid).
For
per
sona
l use
onl
y
Target's Statement 24
Dr. Mohammed Ali Al-Barwani - Chairman of MB Holding
Dr. Al-Barwani is the founder, owner and Chairman of the MB Holding Group. He holds a Bachelor’s Degree in Science from Miami University, Ohio, United States of America and a Master’s Degree in Petroleum Engineering from Heriot-Watt University, Edinburgh, United Kingdom.
Dr. Al-Barwani serves on the Board of several companies in Oman and abroad including UCL, Nautilus Minerals Inc., Transgulf Investment Holding Company (of which he serves as Chairman), Al Madina Gulf Insurance Co. (of which he serves as Chairman), and Oman Aviation Services Co. Dr. Al-Barwani previously served on the board of directors of the National Bank of Oman (during 1997-2005), Taageer Investment & Leasing Co. (during 2001-2005) and Shell Oman Marketing Co. (SAOG) (during 2001-2006). Dr. Al-Barwani has also been Regional Vice President of the International Association of Drilling Contractors and is an active member of the Oman-India Business Association.
4.5 Publicly available information
Mawarid and MB Holding are privately owned entities.
Further publicly available information on Mawarid can be found at www.mawaridmining.com.
Further publicly available information on MB Holding can be found at www.mbholdingco.com.
For
per
sona
l use
onl
y
Target's Statement 25
5 Your choices as a UCL Shareholder
5.1 Your choices
As a UCL Shareholder, you can respond to the Mawarid Offer in one of three ways:
(a) accept the Mawarid Offer;
(b) sell your UCL Shares to a person other than Mawarid; or
(c) not sell your UCL Shares.
Your Independent Directors recommend that you accept the Mawarid Offer in the absence of a superior proposal.
5.2 Accept the Offer
Before accepting the Mawarid Offer you should:
(a) read Mawarid’s Bidder’s Statement in full;
(b) read this Target’s Statement including the IER in full;
(c) consider the information given on Mawarid and UCL in the Bidder’s Statement and this Target’s Statement; and
(d) consult your broker, financial or other professional adviser if you are in any doubt as to what action to take or how to accept the Mawarid Offer.
If you have any queries about the Mawarid Offer you may also call the UCL Shareholder information line on +61 2 9279 1760 on a weekday between 9.00am and 5.00pm or visit UCL’s website at www.uclresources.com.au.
How you accept the Mawarid Offer depends on whether your UCL Shares are in an issuer sponsored holding or a CHESS holding.
(a) If your UCL Shares are held in a CHESS Holding (your HIN starts with “X”), you must instruct your Controlling Participant to accept the Mawarid Offer.
(b) If your UCL Shares are held in an Issuer Sponsored Holding (your SRN starts with “I”) and do not have a Broker, you will need to appoint a Broker to accept the Mawarid Offer.
(c) If you are a Broker or an ASX Participant, you will need to initiate acceptance in accordance with the requirements of the ASX Settlement Operating Rules.
(d) If you are a beneficial owner whose UCL Shares are held in the name of a broker, investment dealer, bank, trust company or other nominee, you should contact that nominee for assistance in accepting the Mawarid Offer.
Mawarid has stated that the Offer will remain open until close of trading on 7 June 2013, unless extended or withdrawn. Mawarid has stated that if it extends its Offer, it will not be extended beyond 22 June 2013.
For
per
sona
l use
onl
y
Target's Statement 26
Your Independent Directors recommend that you accept the Offer in the absence of a superior proposal.
5.3 Sell your UCL Shares
During the Offer Period, you can still sell your UCL Shares to a person other than Mawarid, provided you have not already accepted the Mawarid Offer for those Shares.
The latest price for UCL Shares may be obtained from the ASX website www.asx.com.au.
If you choose to sell your UCL Shares, you should be aware that you:
(a) will lose the ability to accept the Mawarid Offer or any higher offer for your UCL Shares (which may or may not eventuate);
(b) will lose the opportunity to receive future returns from UCL;
(c) may be liable for capital gains tax on the sale (refer to Section 6 for further details); and
(d) may incur a brokerage charge.
Apart from paragraph (a) above, the effect of accepting the Mawarid Offer is likely to be the same.
5.4 Not sell your UCL Shares
The Independent Directors recommend that you accept the Mawarid Offer in the absence of a superior proposal. However, if you do not wish to sell your UCL Shares you should do nothing.
Mawarid now has a relevant interest in more than 50% of UCL Shares. You should note that:
(a) if Mawarid does not obtain a relevant interest in more than 90% of the UCL Shares and therefore cannot proceed to compulsory acquisition, you will be a minority Shareholder and may be subject to the risks set out in Section 2.11 of this Target’s Statement; and
(b) if Mawarid acquires a relevant interest in 90% of the Shares it has indicated that it intends to compulsorily acquire your Shares (notwithstanding that you did not accept the Mawarid Offer – see Section 2.10 for further details).
For
per
sona
l use
onl
y
Target's Statement 27
6 Tax consequences
6.1 Introduction
The following is a general summary of the potential Australian income tax consequences generally applicable to a Shareholder who disposes of UCL Shares under the Mawarid Offer. This summary is based on the law and practice in effect on the date of this Target’s Statement.
The following summary is not intended to be an authoritative or complete statement of the tax law applicable to the specific circumstances of every Shareholder.
In particular the summary is only applicable to Shareholders that are Australian residents for income tax purposes and hold their UCL Shares on capital account for income tax purposes. This summary does not apply to Shareholders that hold their UCL Shares in the course of a business of trading or dealing in securities.
All Shareholders are advised to seek independent professional advice about their particular circumstances and non-resident Shareholders should seek their own advice on the Australian and foreign taxation consequences associated with any sale of their UCL Shares.
6.2 CGT consequences on the disposal of UCL Shares
A Shareholder that accepts the Mawarid Offer and whose Shares are subsequently transferred to Mawarid, is taken to have disposed of their UCL Shares for Australian capital gains tax (CGT) purposes. Shareholders will make a capital gain equal to the amount by which the Offer Price exceeds the cost base that the Shareholder has for the UCL Shares. Subject to the availability of the CGT discount (see below) and any losses available to be offset against the capital gain, this amount is included in the Shareholder’s taxable income.
A Shareholder will alternatively make a capital loss equal to the amount by which the reduced cost base of the UCL Shares exceeds the consideration. A capital loss may be used to offset a capital gain made in the same income year or be carried forward to offset a capital gain made in a future income year, subject to the satisfaction of certain loss recoupment tests applicable to companies.
The cost base of UCL Shares would generally be equal to the amount the relevant Shareholder paid to acquire the UCL Shares which includes certain incidental costs (such as brokerage) associated with the acquisition.
6.3 UCL Shares acquired before 20 September 1985
Any Shareholder who acquired (or is deemed to have acquired) their UCL Shares prior to 20 September 1985 may be entitled to treat these shares as a “pre-CGT” asset and, hence, not subject to CGT.
The treatment for any pre-CGT UCL Shares will be that no capital gain or loss will arise on the disposal of the UCL Shares.
6.4 UCL Shares acquired before 21 September 1999
Any Shareholder who acquired their UCL Shares before 11.45am (legal time in the Australian Capital Territory) on 21 September 1999 may index the cost base of their UCL Shares to take account of inflation between the calendar quarter in which the UCL Shares were acquired and the calendar quarter ended 30 September 1999.
For
per
sona
l use
onl
y
Target's Statement 28
If a Shareholder who is an individual, the trustee of a trust or a complying superannuation entity chooses to index the cost base of their UCL Shares, then the CGT discount will not be available to them (see below). Note that the cost base of UCL Shares cannot be indexed in working out the amount of any capital loss.
6.5 CGT discount
Any Shareholder who is an individual, the trustee of a trust or a complying superannuation entity may be entitled to claim the CGT discount in calculating any capital gain provided that:
(a) the UCL Shares were acquired at least 12 months before disposal to Mawarid;
(b) the Shareholder did not choose to index the cost base of their UCL Shares (see above); and
(c) the CGT discount is applied to the capital gain after any available capital losses are first offset against that capital gain.
A Shareholder who is an individual or the trustee of a trust may discount the capital gain by 50% and include 50% of the capital gain in the taxable income of that individual or trust.
A Shareholder that is a complying superannuation entity may discount the capital gain by 33⅓% and include 66⅔% of the capital gain in the taxable income of that complying superannuation entity.
The CGT discount is not available to a Shareholder that is a company unless holding the Shares as trustee.
6.6 CGT rollover
The Mawarid Offer is 31 cents cash per Share. Therefore, no CGT rollover relief will be available to UCL Shareholders.
6.7 Obtain your own taxation advice
Do not rely on the comments or the statements contained in this Target’s Statement or the Bidder’s Statement as advice about your own affairs. The taxation laws are complex and there could be implications in addition to those generally described in this Target’s Statement and the Bidder’s Statement.
Accordingly, consult your own tax advisers for advice applicable to your individual needs and circumstances. To the extent permitted by law, UCL does not accept any responsibility for tax implications for individual Shareholders.
For
per
sona
l use
onl
y
Target's Statement 29
7 Directors’ interests
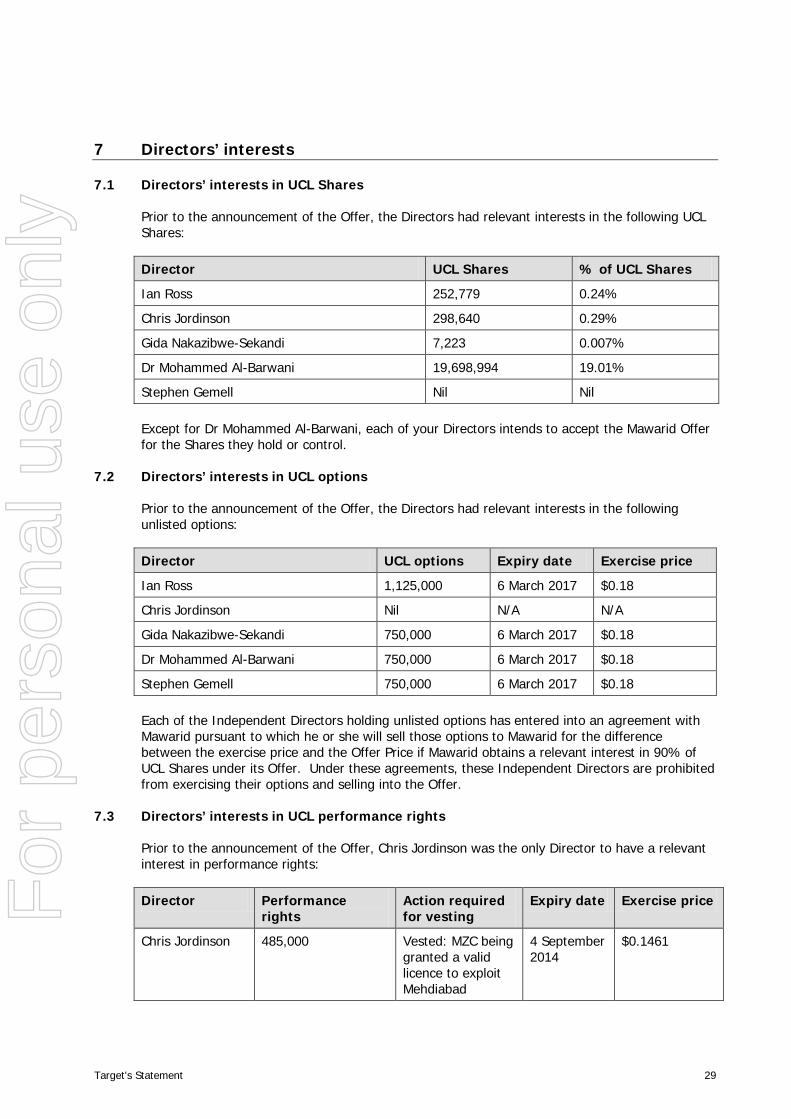
7.1 Directors’ interests in UCL Shares
Prior to the announcement of the Offer, the Directors had relevant interests in the following UCL Shares: Director UCL Shares % of UCL Shares
Ian Ross 252,779 0.24%
Chris Jordinson 298,640 0.29%
Gida Nakazibwe-Sekandi 7,223 0.007%
Dr Mohammed Al-Barwani 19,698,994 19.01%
Stephen Gemell Nil Nil
Except for Dr Mohammed Al-Barwani, each of your Directors intends to accept the Mawarid Offer for the Shares they hold or control.
7.2 Directors’ interests in UCL options
Prior to the announcement of the Offer, the Directors had relevant interests in the following unlisted options: Director UCL options Expiry date Exercise price
Ian Ross 1,125,000 6 March 2017 $0.18
Chris Jordinson Nil N/A N/A
Gida Nakazibwe-Sekandi 750,000 6 March 2017 $0.18
Dr Mohammed Al-Barwani 750,000 6 March 2017 $0.18
Stephen Gemell 750,000 6 March 2017 $0.18
Each of the Independent Directors holding unlisted options has entered into an agreement with Mawarid pursuant to which he or she will sell those options to Mawarid for the difference between the exercise price and the Offer Price if Mawarid obtains a relevant interest in 90% of UCL Shares under its Offer. Under these agreements, these Independent Directors are prohibited from exercising their options and selling into the Offer.
7.3 Directors’ interests in UCL performance rights
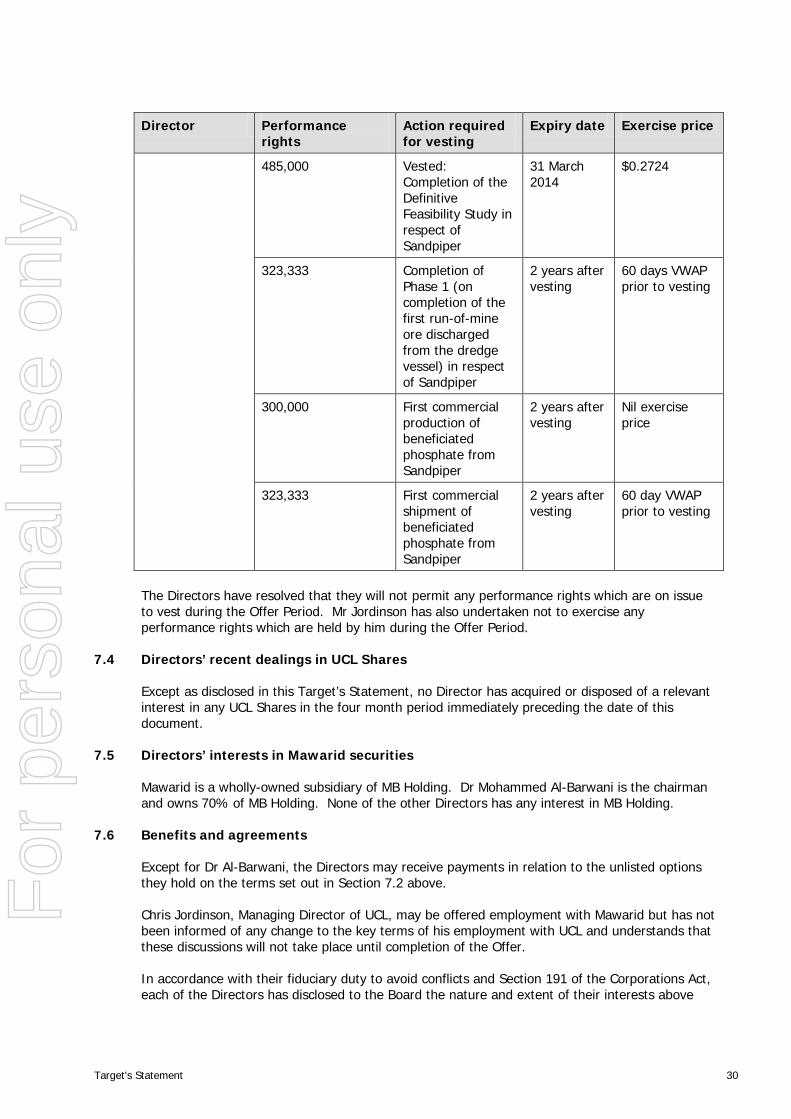
Prior to the announcement of the Offer, Chris Jordinson was the only Director to have a relevant interest in performance rights: Director Performance
rights Action required for vesting
Expiry date Exercise price
Chris Jordinson 485,000 Vested: MZC being granted a valid licence to exploit Mehdiabad
4 September 2014
$0.1461
For
per
sona
l use
onl
y
Target's Statement 30
Director Performance rights
Action required for vesting
Expiry date Exercise price
485,000 Vested: Completion of the Definitive Feasibility Study in respect of Sandpiper
31 March 2014
$0.2724
323,333 Completion of Phase 1 (on completion of the first run-of-mine ore discharged from the dredge vessel) in respect of Sandpiper
2 years after vesting
60 days VWAP prior to vesting
300,000 First commercial production of beneficiated phosphate from Sandpiper
2 years after vesting
Nil exercise price
323,333 First commercial shipment of beneficiated phosphate from Sandpiper
2 years after vesting
60 day VWAP prior to vesting
The Directors have resolved that they will not permit any performance rights which are on issue to vest during the Offer Period. Mr Jordinson has also undertaken not to exercise any performance rights which are held by him during the Offer Period.
7.4 Directors’ recent dealings in UCL Shares
Except as disclosed in this Target’s Statement, no Director has acquired or disposed of a relevant interest in any UCL Shares in the four month period immediately preceding the date of this document.
7.5 Directors’ interests in Mawarid securities
Mawarid is a wholly-owned subsidiary of MB Holding. Dr Mohammed Al-Barwani is the chairman and owns 70% of MB Holding. None of the other Directors has any interest in MB Holding.
7.6 Benefits and agreements
Except for Dr Al-Barwani, the Directors may receive payments in relation to the unlisted options they hold on the terms set out in Section 7.2 above.
Chris Jordinson, Managing Director of UCL, may be offered employment with Mawarid but has not been informed of any change to the key terms of his employment with UCL and understands that these discussions will not take place until completion of the Offer.
In accordance with their fiduciary duty to avoid conflicts and Section 191 of the Corporations Act, each of the Directors has disclosed to the Board the nature and extent of their interests above
For
per
sona
l use
onl
y
Target's Statement 31
and stated that this may amount to each of them having a material personal interest in the Mawarid Offer. The following benefits have been disclosed (subject to Mawarid obtaining a relevant interest in 90% of UCL Shares):
(a) Ian Ross will receive $146,250 from the sale of his options;
(b) Gida Nakazibwe-Sekandi will receive $97,500 from the sale of her options; and
(c) Stephen Gemell will receive $97,500 from the sale of his options.
In each instance, the Board has considered the benefit or potential benefit and has formed the view that the relevant Director should not be precluded from continuing to participate in Board discussions in respect of the Mawarid Offer.
Other than as set out in this document:
(a) as a result of the Mawarid Offer no person has been or will be given any benefit (other than a benefit which can be given without member approval under the Corporations Act) in connection with the retirement of that person, or someone else, from the Board of Directors of UCL or a related body corporate of UCL; and
(b) there are no agreements made between a Director and another person in connection with, or conditional upon, the outcome of the Mawarid Offer, other than in the Director’s capacity as a holder of UCL Shares.
For
per
sona
l use
onl
y
Target's Statement 32
8 Additional information
8.1 Material contracts or commitments
UCL is required to immediately disclose to the market through ASX any information concerning it that a reasonable person would expect to have a material effect on the price or value of its Shares. UCL has complied with its continuous disclosure obligations under the Corporations Act and the ASX Listing Rules.
Except as set out elsewhere in this Target’s Statement, there have been no material contracts or commitments entered into by UCL, which would be expected to have a material effect on the price or value of UCL Shares, which have not been announced to ASX.
A list of UCL’s announcements to ASX since 1 July 2012 is set out in Annexure 2 of this Target’s Statement.
8.2 Consents
McCullough Robertson has given and has not before the date of this Target’s Statement withdrawn its consent to be named in this Target’s Statement as UCL’s legal adviser in the form and context in which it is named.
Origin Securities has given and has not before the date of this Target’s Statement withdrawn its consent to be named in this Target’s Statement as corporate adviser to UCL in the form and context in which it is named.
Grant Thornton has given and has not before the date of this Target’s Statement withdrawn its consent to be named in this Target’s Statement as the author of the IER in the form and context in which it is named.
Snowden Group has given and has not before the date of this Target’s Statement withdrawn its consent to be named in this Target’s Statement as the author of the ITR in the form and context in which it is named.
Neither McCullough Robertson, Origin Securities, Grant Thornton nor Snowden Group:
(a) has authorised or caused the issue of this Target’s Statement; or
(b) makes or purports to make any statement in this Target’s Statement nor is any statement in this Target’s Statement based on any statement by any of those parties, other than as specified in this Section.
Each of McCullough Robertson, Origin Securities, Grant Thornton and Snowden Group, to the maximum extent permitted by law, expressly disclaims and takes no responsibility for any part of this Target’s Statement other than a reference to its name, and a statement included in this Target’s Statement with the consent of that party as specified in this Section.
8.3 Publicly available information
This Target’s Statement contains statements which are made in, or based on statements made in, documents lodged with ASIC or given to the ASX by Mawarid.
As permitted by ASIC class order 01/1543, the consent of Mawarid is not required for the inclusion of those statements in this Target’s Statement. Any UCL Shareholder may obtain a copy
For
per
sona
l use
onl
y
Target's Statement 33
of those documents free of charge during the Offer Period by contacting the UCL Shareholder information line on +61 2 9279 1760 on a weekday between 9.00am and 5.00pm.
As permitted by ASIC class order 03/635, this Target’s Statement may include or be accompanied by certain statements:
(a) fairly representing a statement by an official person; or
(b) from a public official document or published book, journal or comparable publication,
and the consent of the persons to whom those statements are attributed is not required to be included in this Target’s Statement.
8.4 No other material information
This Target’s Statement is required to include all of the information that UCL Shareholders and their professional advisers would reasonably require to make an informed assessment about whether to accept the Mawarid Offer, but:
(a) only to the extent to which it is reasonable for UCL Shareholders and their professional advisers to expect to find this information in this Target’s Statement; and
(b) only if the information is known to any Director.
The Directors of UCL are of the opinion that the information that UCL Shareholders and their professional advisers would reasonably require to make an informed assessment whether to accept the Offer is:
(a) the Bidder’s Statement (to the extent that the information is not inconsistent with or superseded by information in this Target’s Statement);
(b) UCL’s annual reports and releases to the ASX, and documents lodged by UCL with ASIC before the date of this Target’s Statement;
(c) this Target’s Statement; and
(d) the IER in Annexure A.
For
per
sona
l use
onl
y
Target's Statement 34
9 Approval of Target’s Statement
This Target’s Statement has been approved by a resolution passed by the Independent Directors on 1 May 2013.
Dated 1 May 2013
Ian W Ross Chairman
For
per
sona
l use
onl
y
Target's Statement 35
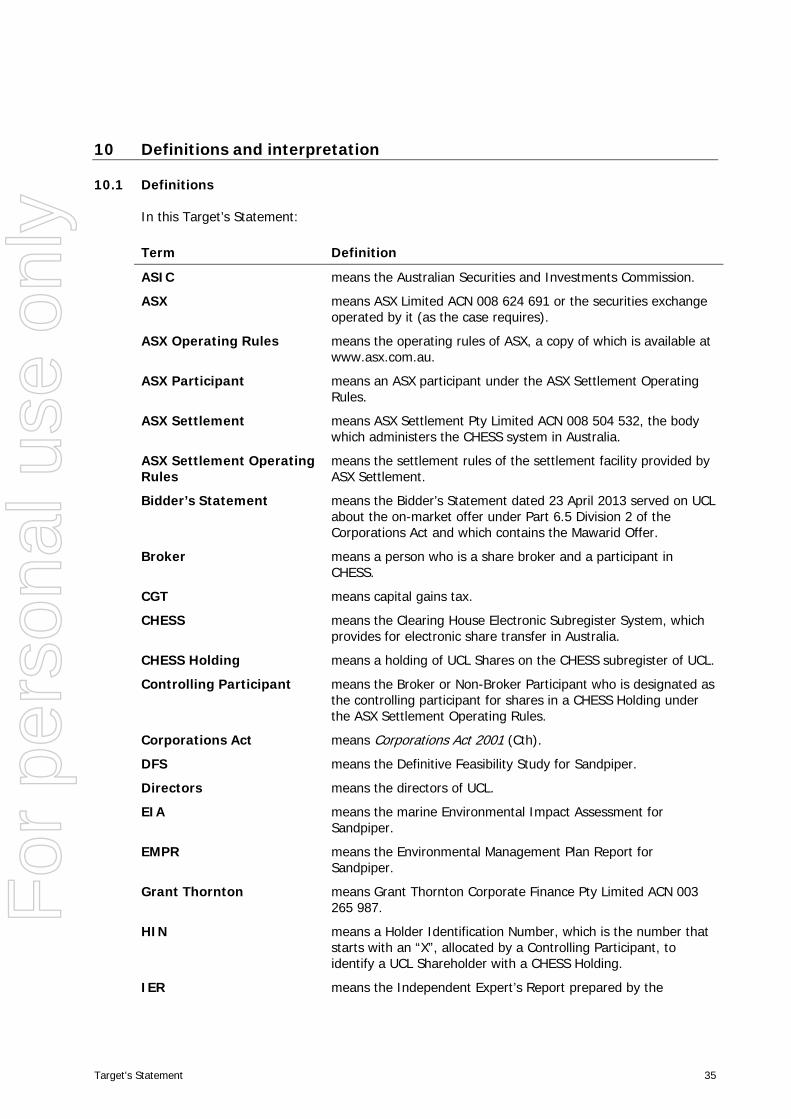
10 Definitions and interpretation
10.1 Definitions
In this Target’s Statement: Term Definition
ASIC means the Australian Securities and Investments Commission.
ASX means ASX Limited ACN 008 624 691 or the securities exchange operated by it (as the case requires).
ASX Operating Rules means the operating rules of ASX, a copy of which is available at www.asx.com.au.
ASX Participant means an ASX participant under the ASX Settlement Operating Rules.
ASX Settlement means ASX Settlement Pty Limited ACN 008 504 532, the body which administers the CHESS system in Australia.
ASX Settlement Operating Rules
means the settlement rules of the settlement facility provided by ASX Settlement.
Bidder’s Statement means the Bidder’s Statement dated 23 April 2013 served on UCL about the on-market offer under Part 6.5 Division 2 of the Corporations Act and which contains the Mawarid Offer.
Broker means a person who is a share broker and a participant in CHESS.
CGT means capital gains tax.
CHESS means the Clearing House Electronic Subregister System, which provides for electronic share transfer in Australia.
CHESS Holding means a holding of UCL Shares on the CHESS subregister of UCL.
Controlling Participant means the Broker or Non-Broker Participant who is designated as the controlling participant for shares in a CHESS Holding under the ASX Settlement Operating Rules.
Corporations Act means Corporations Act 2001 (Cth).
DFS means the Definitive Feasibility Study for Sandpiper.
Directors means the directors of UCL.
EIA means the marine Environmental Impact Assessment for Sandpiper.
EMPR means the Environmental Management Plan Report for Sandpiper.
Grant Thornton means Grant Thornton Corporate Finance Pty Limited ACN 003 265 987.
HIN means a Holder Identification Number, which is the number that starts with an “X”, allocated by a Controlling Participant, to identify a UCL Shareholder with a CHESS Holding.
IER means the Independent Expert’s Report prepared by the
For
per
sona
l use
onl
y
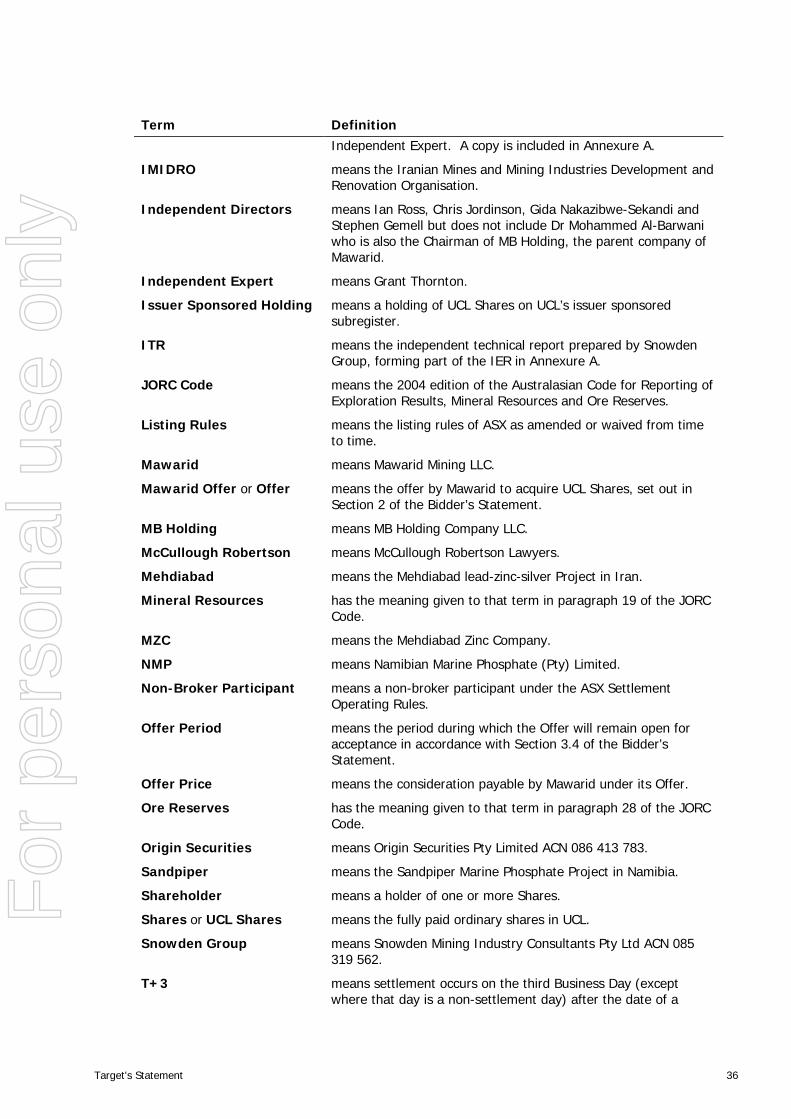
Target's Statement 36
Term Definition Independent Expert. A copy is included in Annexure A.
IMIDRO means the Iranian Mines and Mining Industries Development and Renovation Organisation.
Independent Directors means Ian Ross, Chris Jordinson, Gida Nakazibwe-Sekandi and Stephen Gemell but does not include Dr Mohammed Al-Barwani who is also the Chairman of MB Holding, the parent company of Mawarid.
Independent Expert means Grant Thornton.
Issuer Sponsored Holding means a holding of UCL Shares on UCL’s issuer sponsored subregister.
ITR means the independent technical report prepared by Snowden Group, forming part of the IER in Annexure A.
JORC Code means the 2004 edition of the Australasian Code for Reporting of Exploration Results, Mineral Resources and Ore Reserves.
Listing Rules means the listing rules of ASX as amended or waived from time to time.
Mawarid means Mawarid Mining LLC.
Mawarid Offer or Offer means the offer by Mawarid to acquire UCL Shares, set out in Section 2 of the Bidder’s Statement.
MB Holding means MB Holding Company LLC.
McCullough Robertson means McCullough Robertson Lawyers.
Mehdiabad means the Mehdiabad lead-zinc-silver Project in Iran.
Mineral Resources has the meaning given to that term in paragraph 19 of the JORC Code.
MZC means the Mehdiabad Zinc Company.
NMP means Namibian Marine Phosphate (Pty) Limited.
Non-Broker Participant means a non-broker participant under the ASX Settlement Operating Rules.
Offer Period means the period during which the Offer will remain open for acceptance in accordance with Section 3.4 of the Bidder’s Statement.
Offer Price means the consideration payable by Mawarid under its Offer.
Ore Reserves has the meaning given to that term in paragraph 28 of the JORC Code.
Origin Securities means Origin Securities Pty Limited ACN 086 413 783.
Sandpiper means the Sandpiper Marine Phosphate Project in Namibia.
Shareholder means a holder of one or more Shares.
Shares or UCL Shares means the fully paid ordinary shares in UCL.
Snowden Group means Snowden Mining Industry Consultants Pty Ltd ACN 085 319 562.
T+3 means settlement occurs on the third Business Day (except where that day is a non-settlement day) after the date of a
For
per
sona
l use
onl
y
Target's Statement 37
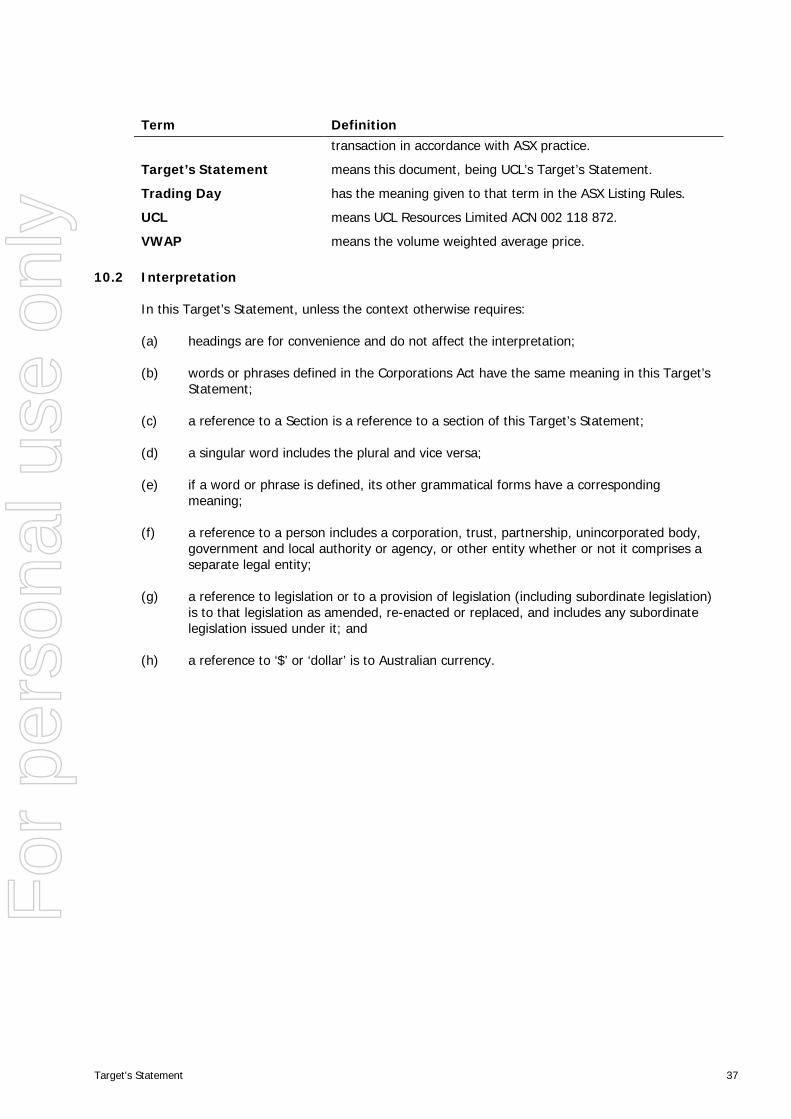
Term Definition transaction in accordance with ASX practice.
Target’s Statement means this document, being UCL’s Target’s Statement.
Trading Day has the meaning given to that term in the ASX Listing Rules.
UCL means UCL Resources Limited ACN 002 118 872.
VWAP means the volume weighted average price.
10.2 Interpretation
In this Target’s Statement, unless the context otherwise requires:
(a) headings are for convenience and do not affect the interpretation;
(b) words or phrases defined in the Corporations Act have the same meaning in this Target’s Statement;
(c) a reference to a Section is a reference to a section of this Target’s Statement;
(d) a singular word includes the plural and vice versa;
(e) if a word or phrase is defined, its other grammatical forms have a corresponding meaning;
(f) a reference to a person includes a corporation, trust, partnership, unincorporated body, government and local authority or agency, or other entity whether or not it comprises a separate legal entity;
(g) a reference to legislation or to a provision of legislation (including subordinate legislation) is to that legislation as amended, re-enacted or replaced, and includes any subordinate legislation issued under it; and
(h) a reference to ‘$’ or ‘dollar’ is to Australian currency.
For
per
sona
l use
onl
y
Target's Statement 38
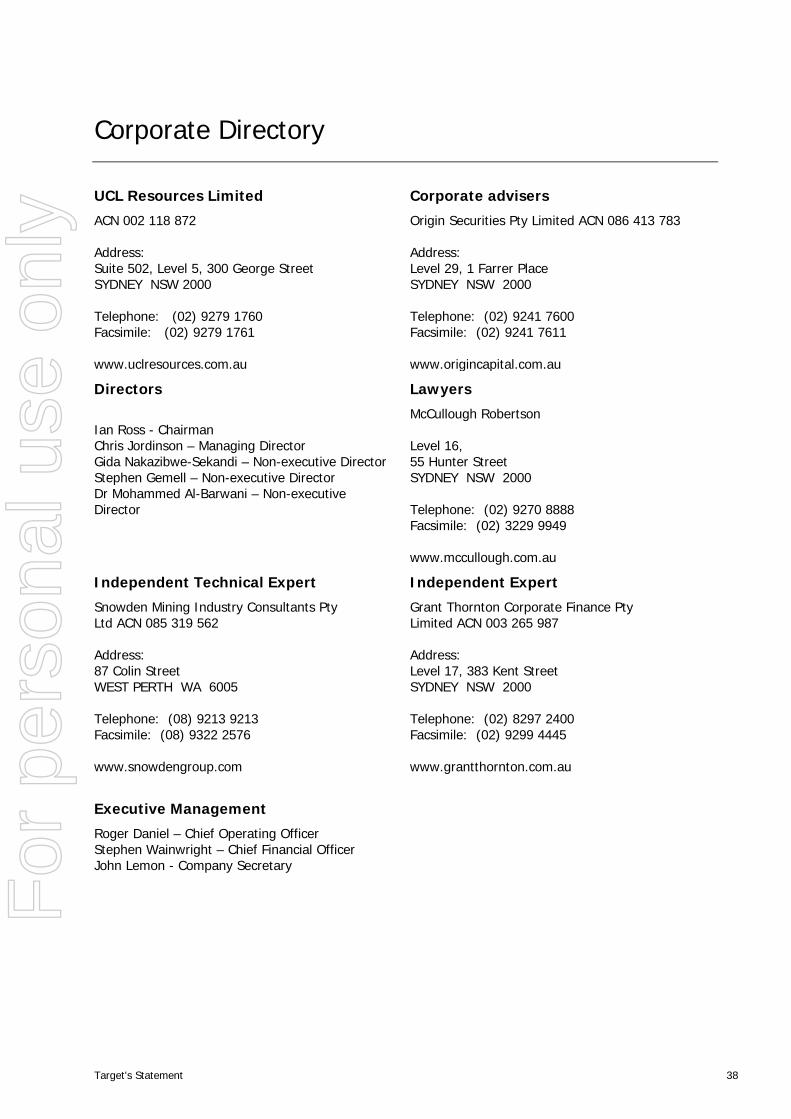
Corporate Directory
UCL Resources Limited
ACN 002 118 872 Address: Suite 502, Level 5, 300 George Street SYDNEY NSW 2000 Telephone: (02) 9279 1760 Facsimile: (02) 9279 1761 www.uclresources.com.au
Corporate advisers
Origin Securities Pty Limited ACN 086 413 783 Address: Level 29, 1 Farrer Place SYDNEY NSW 2000 Telephone: (02) 9241 7600 Facsimile: (02) 9241 7611 www.origincapital.com.au
Directors
Ian Ross - Chairman Chris Jordinson – Managing Director Gida Nakazibwe-Sekandi – Non-executive Director Stephen Gemell – Non-executive Director Dr Mohammed Al-Barwani – Non-executive Director
Lawyers
McCullough Robertson Level 16, 55 Hunter Street SYDNEY NSW 2000 Telephone: (02) 9270 8888 Facsimile: (02) 3229 9949
www.mccullough.com.au
Independent Technical Expert
Snowden Mining Industry Consultants Pty Ltd ACN 085 319 562 Address: 87 Colin Street WEST PERTH WA 6005 Telephone: (08) 9213 9213 Facsimile: (08) 9322 2576 www.snowdengroup.com
Independent Expert
Grant Thornton Corporate Finance Pty Limited ACN 003 265 987 Address: Level 17, 383 Kent Street SYDNEY NSW 2000 Telephone: (02) 8297 2400 Facsimile: (02) 9299 4445 www.grantthornton.com.au
Executive Management
Roger Daniel – Chief Operating Officer Stephen Wainwright – Chief Financial Officer John Lemon - Company Secretary
For
per
sona
l use
onl
y

Target's Statement
Annexure A
Independent Expert's Report
For
per
sona
l use
onl
y
UCL Resources Limited Independent Expert’s Report and Financial Services Guide
1 May 2013
For
per
sona
l use
onl
y
Grant Thornton Corporate Finance Pty Ltd ABN 59 003 265 987 AFSL 247140 Level 17, 383 Kent Street Sydney NSW 2000 PO Locked Bag Q800 QVB Post Office Sydney NSW 1230 T + 61 2 8297 2400 F + 61 2 9299 4445 E [email protected] W www.grantthornton.com.au
Holder of Australian Financial Services License No. 247140
Grant Thornton is a trademark owned by Grant Thornton International Ltd (UK) and used under licence by independent firms and entities throughout the world. Grant Thornton member firms in Australia are businesses trading independently under the name Grant Thornton. Grant Thornton Australia Ltd has been incorporated to conduct those businessesas a single national entity, and public notification will be given upon commencement. Liability limited by a scheme approved under Professional Standards legislation.
Dear Sirs
Independent Expert’s Report and Financial Services Guide
Introduction
UCL Resources Limited (“UCL” or “the “Company”) is a mineral exploration and development company listed on the Australian Securities Exchange (“ASX”). UCL’s main asset is a 42.5% interest in the Sandpiper marine phosphate project located in Namibia (“Sandpiper Project”)1.
Mawarid Mining LLC (“Mawarid”), a subsidiary of MB Holding Company LLC (“MB Holding”), is a limited liability company primarily engaged in the exploration and development of copper, gold and silver. Mawarid and MB Holding are based in the Sultanate of Oman.
On 23 April 2013, Mawarid made an unconditional, on-market takeover bid for all the shares in UCL that it does not already own (“Takeover Offer”) for A$0.31 cash per share (“Offer Price”). The Takeover Offer period will end at close of trading on 7 June 2013, unless extended or withdrawn2. UCL Shareholders have been able to accept the Takeover Offer on market since 23 April 2013.
Mawarid has entered into an agreement with the holders of 3.8 million options in UCL under which Mawarid will purchase the options for the difference between the exercise price and the Offer Price, subject to Mawarid successfully acquiring 90% or more of UCL’s Shares under the Takeover Offer and UCL is delisted from the ASX. The option holders have also undertaken not to exercise options held prior to 23 June 2013.
1 UCL also owns a 24.5% interest in the Mehdiabad base metals project located in Iran (“Mehdiabad Project”). 2 Mawarid has indicated in the Bidder’s Statement that the Takeover Offer will not be extended beyond 22 June 2013.
The Independent Directors UCL Resources Limited Level 2, 300 George Street SYDNEY NSW 2000
1 May 2013
For
per
sona
l use
onl
y
2
Prior to the announcement of the Takeover Offer, Mawarid held a 19.01% interest in UCL. On 30 April 2013, we have been informed that Mawarid held a relevant interest in 57.1% of UCL shares. UCL’s largest shareholder Twynam Agriculture Group Pty Ltd (28.59% interest in UCL) has already accepted the Takeover Offer.
The Independent Directors unanimously recommend that UCL Shareholders accept the Takeover Offer in the absence of a superior proposal. The Independent Directors intend to accept the Takeover Offer in respect of all UCL Shares they hold or control.
Purpose of the report
Dr. Mohammed Al-Barwani, Non-Executive Director of UCL, is also the Chairman of MB Holding. Accordingly, the independent directors of UCL have commissioned Grant Thornton Corporate Finance to provide an independent expert’s report to assess whether the Takeover Offer is fair and reasonable to the UCL Shareholders for the purposes of Section 640 of the Corporations Act.
For the purpose of this report, an independent technical specialist, Snowden Mining Industry Consultants Pty Ltd (“Snowden”), was engaged to provide an independent technical report (“the Technical Report”) in relation to the UCL’s assets. Snowden’s report is included as Appendix F to this report.
Summary of opinion
Grant Thornton Corporate Finance has concluded that the Takeover Offer is fair and reasonable to UCL Shareholders.
Fairness Assessment
In forming our opinion in relation to the fairness of the Takeover Offer, Grant Thornton Corporate Finance has compared the fair market value per share of UCL on a control basis before the announcement of the Takeover Offer to the Offer Price of A$0.31 per UCL Share.
In our assessment of the fair market value of UCL before the Takeover Offer, we have relied on the following:
The market value of net assets – based on the sum of parts of UCL’s development and exploration assets, and other assets and liabilities as set out in UCL’s reviewed balance sheet as at 31 December 2012. In our valuation assessment of the Sandpiper Project, we have taken into account the future potential dilutionary impact of the funding requirements for its development3.
Comparable transaction –Minemakers Limited completed the sale of its 42.5% interest in the Sandpiper Project to Mawarid in December 2012 for a total cash consideration A$25 million (“the Sandpiper Transaction”). We are of the opinion that the Sandpiper Transaction represents a relevant reference point for the fair market value of UCL.
3 As set out in the Target’s Statement, Management of UCL is expecting that UCL would have to raise equity between A$80 million and A$90 million to fund its share of the development of the Sandpiper Project.
For
per
sona
l use
onl
y
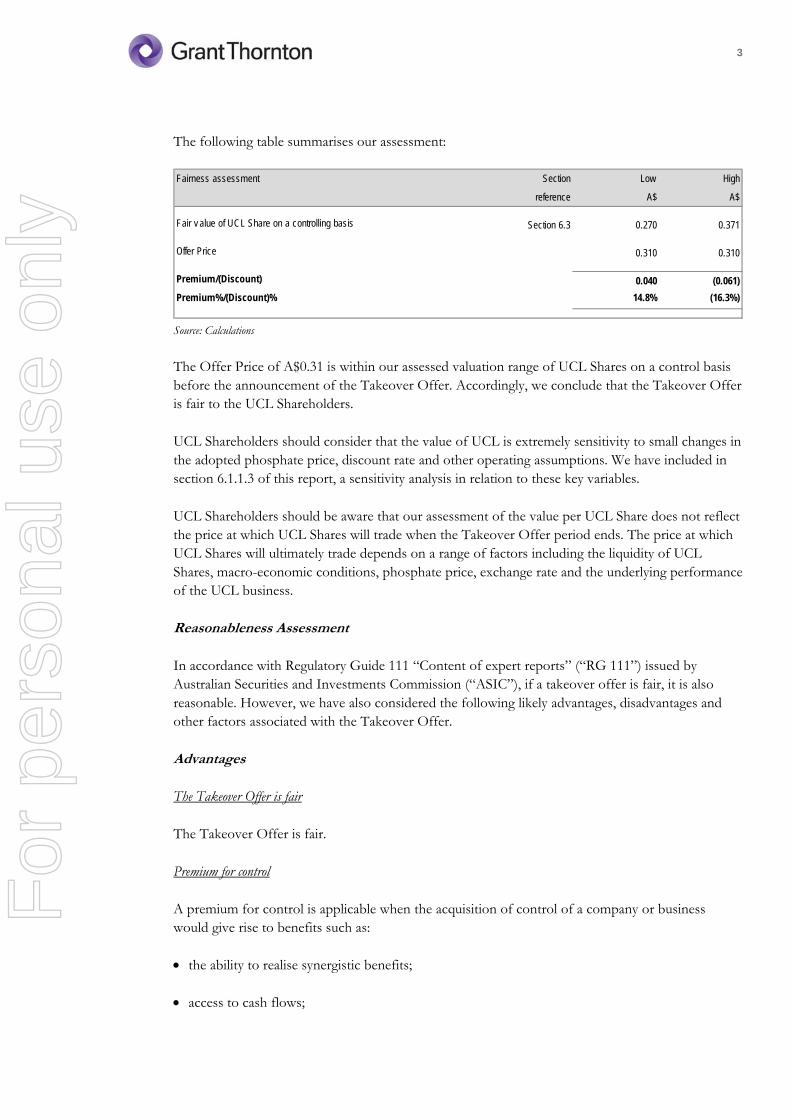
3
The following table summarises our assessment:
Source: Calculations
The Offer Price of A$0.31 is within our assessed valuation range of UCL Shares on a control basis before the announcement of the Takeover Offer. Accordingly, we conclude that the Takeover Offer is fair to the UCL Shareholders.
UCL Shareholders should consider that the value of UCL is extremely sensitivity to small changes in the adopted phosphate price, discount rate and other operating assumptions. We have included in section 6.1.1.3 of this report, a sensitivity analysis in relation to these key variables.
UCL Shareholders should be aware that our assessment of the value per UCL Share does not reflect the price at which UCL Shares will trade when the Takeover Offer period ends. The price at which UCL Shares will ultimately trade depends on a range of factors including the liquidity of UCL Shares, macro-economic conditions, phosphate price, exchange rate and the underlying performance of the UCL business.
Reasonableness Assessment
In accordance with Regulatory Guide 111 “Content of expert reports” (“RG 111”) issued by Australian Securities and Investments Commission (“ASIC”), if a takeover offer is fair, it is also reasonable. However, we have also considered the following likely advantages, disadvantages and other factors associated with the Takeover Offer.
Advantages
The Takeover Offer is fair
The Takeover Offer is fair.
Premium for control
A premium for control is applicable when the acquisition of control of a company or business would give rise to benefits such as:
the ability to realise synergistic benefits;
access to cash flows;
Fairness assessment Section Low High
reference A$ A$
Fair v alue of UCL Share on a controlling basis Section 6.3 0.270 0.371
Offer Price 0.310 0.310
Premium/(Discount) 0.040 (0.061)
Premium%/(Discount)% 14.8% (16.3%)
For
per
sona
l use
onl
y
4
access to tax benefits; and
control of the board of directors of the company.
Evidence from studies indicates that premiums for control on successful takeovers have frequently been in the range of 20% to 40% in Australia and that the premiums vary significantly from transaction to transaction.
The Offer Price of A$0.31 per UCL Share represents a premium of:
182% compared with the closing price of UCL up to and including 22 April 2013 (last trading day before the announcement of the Takeover Offer).
135% compared with the 1 month VWAP of UCL up to and including 22 April 2013.
131% compared with the 3 month VWAP of UCL up to and including 22 April 2013.
This premium for control is unlikely to be available to the UCL Shareholders in the absence of the Takeover Offer.
Ability to realise their investment in UCL
The Takeover Offer represents an opportunity for UCL Shareholders to receive certain and immediate value in the form of an unconditional cash offer for their investment in UCL. The Takeover Offer provides an opportunity to UCL Shareholders to exit their investment in UCL at a significant premium which is unlikely to be available in the absence of the Takeover Offer.
UCL Shareholders will no longer be exposed to the on-going risks associated with holding an investment in UCL which includes market volatility, changes in the phosphate price, exchange rate volatility and operational and financing risks. In particular, as discussed in Snowden’s report, we note that the operations of the Sandpiper Project will involve off-shore dredging at an unprecedented depth which presents material operational and financial risks.
Potential funding requirements
It is noted that UCL has a cash balance of approximately A$1.5 million as at 31 December 2012. In the absence of Takeover Offer, UCL will be required to raise additional funds in the short term through debt and equity financing to development of the Sandpiper Project. The capital expenditure for the Sandpiper Project has been estimated to be approximately US$323 in the definitive feasibility study of which UCL will be required to fund 50.0% or US$161 million4 via a combination of debt and equity.
Based on the market capitalisation of UCL before the Takeover Offer, the current market conditions and the specific risks of the Sandpiper Project, it is our opinion that that any equity raisings will result in significant dilution of existing ownership interest of UCL Shareholders in the
4 Includes 50% funding obligation of Tungeni Investments (Pty) Ltd (“Tungeni”), a Namibian investment company owning a 15% interest in the Sandpiper Project.
For
per
sona
l use
onl
y
5
Company. The Takeover Offer removes any potential financial, funding and dilutionary risks for UCL Shareholders.
Trading in UCL Shares
As set out in the Target’s Statement, Mawarid has already a relevant interest in 57.1% of the issued capital of UCL. Mawarid’s intentions if it acquires more than 50% of UCL Shares are set out in the Bidder’s Statement. If UCL Shareholders do not accept the Takeover Offer and Mawarid does not become entitle to compulsory acquire all outstanding UCL Shares, it is likely that the liquidity of UCL Shares will decrease even further.
Disadvantages
No participation in future potential upside of UCL
UCL Shareholders accepting the Takeover Offer will no longer have exposure to the Sandpiper Project and the other early stage assets of UCL.
Our valuation assessment of UCL is particularly sensitive to movements in the phosphate price and exchange rates. For the purpose of forming a view on the appropriate phosphate prices to use for the valuation, Grant Thornton Corporate Finance has had regard to the historical spot prices, forecast prices prepared by various brokers and consensus estimates.
Given the volatility in commodity markets, the current levels of commodity prices relative to historical long run prices, and the widely varying views of industry analysts, assumptions regarding future phosphate price are inherently subject to considerable uncertainty. It should be noted that the value of the Sandpiper Project could vary materially based on changes in phosphate price. Grant Thornton has undertaken a sensitivity analysis in section 6.1.1.3 of the Independent Expert’s Report (“IER”) to highlight the impact on our assessment of UCL of different phosphate prices and exchanges rates.
Accepting UCL Shareholders will give up the right to participate in the future potential upside of the Sandpiper Project in the event of favourable movements of phosphate prices and exchange rates. Accepting Shareholders can however reinvest the proceeds of the Takeover Offer in similar investment opportunities.
Other factors
Prospect of a superior offer or alternative transaction
In our opinion, given the structure of the Takeover Offer (on-market and unconditional) and the current shareholding of Mawarid in UCL, it is unlikely that a higher or a superior offer will emerge.
Uncertainty regarding the prospectivity of the assets
The value of resources and reserves will depend upon, amongst other things, phosphate prices and currency exchange rates. Any material change in quantity of resources, or any reserve, or grade, may affect the economic viability of any future mines. Any material reductions in the estimates of
For
per
sona
l use
onl
y
6
resources, or reserves, or the ability to extract any such resources or reserves, could have a material adverse effect on future results and financial condition. Resource estimates, including those contained in the Technical Report, are expressions of judgment based on knowledge, experience and industry practice. Often these estimates were appropriate when made but may change significantly when new information becomes available. There are risks associated with such estimates. Resource estimates are necessarily imprecise and depend to some extent upon interpretations, which may ultimately prove to be inaccurate and require adjustment. Adjustments to exploration activities could affect future development and mining plans.
Potential uplift from the Mehdiabad
It is noted that UCL has invested approximately A$16.8 million on exploration and feasibility activities in relation to the Mehdiabad Project. The ability of UCL to recover its invested capital is heavily dependent on the resolution of the current ownership issues and the jurisdiction risk in Iran. Accepting UCL Shareholders will not be exposed to the potential value uplift in the Mehdiabad Project. However, we note that our valuation assessment of UCL includes a value for the Mehdiabad Project between A$1.1 million and A$4 million notwithstanding this project has been fully impaired by UCL for financial reporting purposes.
Other tax implications
The taxation consequences for accepting UCL Shareholders will vary according to their individual circumstances. If appropriate or required, UCL Shareholders should seek independent financial and tax advice on the implications of accepting the Takeover Offer.
Implications if the Takeover Offer is not successful
If Mawarid is not entitled to compulsory acquire all outstanding UCL Shares when the Takeover Offer ends, all other things being equal, UCL Shares may trade at prices materially below the value of the consideration offered by Mawarid.
We also note that the UCL Share price is not liquid and not reflective of the underlying market value of the Sandpiper Project. Remaining UCL Shareholders will have a reduced ability to sell their shares at a market price. In addition, UCL Shareholders will likely be required to fund their respectively share of UCL’s funding commitment for the Sandpiper Project or be diluted.
The Independent Directors unanimously recommend, in the absence of a superior proposal, UCL Shareholders to accept the Takeover Offer.
As set out in the Target’s Statement, at the date of this report, the independent directors of UCL have, in the absence of a superior proposal, recommended acceptance of the Takeover Offer. F
or p
erso
nal u
se o
nly
7
Previous valuation of UCL
We note that Grant Thornton Corporate Finance was appointed as an independent expert by UCL in February 2012 (“2012 IER”) in relation to off-market takeover offer made by Minemakers. Our valuation assessment of UCL at that time was higher than the assessed valuation range included in this report.
We are of the opinion that our current valuation assessment of UCL is reasonable due to the following:
The main valuation methodology adopted for the valuation of the Sandpiper Project in the 2012 IER was different as UCL had not completed a DFS and it did not have reserves at that point in time. We note that our valuation assessment of the Sandpiper Project was based on the preferred value assessed by Snowden based on the in-situ resources. If the low-end of Snowden valuation range for the Sandpiper Project is adopted, our valuation assessment of UCL in the 2012 IER is in line with the low end of the current valuation.
The Sandpiper Transaction completed by Minemakers in December 2012 provides further support to our valuation assessment based on the DCF.
We have discussed our valuation assessment of the Sandpiper Project based on the DCF with Snowden and Snowden has confirmed that it is not inconsistent with their view of the fair market value of the Sandpiper Project in the 2012 IER.
Reasonableness conclusion
Based on the qualitative factors identified above, it is our opinion that the Takeover Offer is REASONABLE to UCL Shareholders.
Overall conclusion
After considering the above mentioned quantitative and qualitative factors, Grant Thornton Corporate Finance has concluded that the Takeover Offer is FAIR AND REASONABLE to UCL Shareholders.
Other matters
Grant Thornton Corporate Finance has prepared a Financial Services Guide in accordance with the Corporations Act. The Financial Services Guide is set out in the following section.
The decision of whether or not to accept the Takeover Offer is a matter for each UCL Shareholder to decide based on their own views of value of UCL and expectations about future market conditions, UCL’s performance, risk profile and investment strategy. If UCL Shareholders are in doubt about the action they should take in relation to the Takeover Offer, they should seek their own professional advice.
For
per
sona
l use
onl
y

8
Yours faithfully GRANT THORNTON CORPORATE FINANCE PTY LTD
ANDREA DE CIAN LIZ SMITH Director Director
For
per
sona
l use
onl
y
1 May 2012
Financial Services Guide
1 Grant Thornton Corporate Finance Pty Ltd
Grant Thornton Corporate Finance Pty Ltd (“Grant Thornton Corporate Finance” or “GTCF”) carries on a business, and has a registered office, at Level 17, 383 Kent Street, Sydney NSW 2000. Grant Thornton Corporate Finance holds Australian Financial Services Licence No 247140 authorising it to provide financial product advice in relation to securities and superannuation funds to wholesale and retail clients.
Grant Thornton Corporate Finance has been engaged by UCL Resources Limited (“UCL” or “the Company”) to provide general financial product advice in the form of an independent expert’s report (“Report”) in relation to the Takeover Offer by Mawarid Mining LLC (“Mawarid”). This report is included in the Target’s Statement outlining the Takeover Offer.
2 Financial Services Guide
This Financial Services Guide (“FSG”) has been prepared in accordance with the Corporations Act, 2001 and provides important information to help retail clients make a decision as to their use of general financial product advice in a report, the services we offer, information about us, our dispute resolution process and how we are remunerated.
3 General financial product advice
In our report we provide general financial product advice. The advice in a report does not take into account your personal objectives, financial situation or needs.
Grant Thornton Corporate Finance does not accept instructions from retail clients. Grant Thornton Corporate Finance provides no financial services directly to retail clients and receives no remuneration from retail clients for financial services. Grant Thornton Corporate Finance does not provide any personal retail financial product advice directly to retail investors nor does it provide market-related advice directly to retail investors.
4 Remuneration
When providing the Report, Grant Thornton Corporate Finance’s client is the Company. Grant Thornton Corporate Finance receives its remuneration from the Company. In respect of the Report, Grant Thornton Corporate Finance will receive from UCL a fee in the range of A$45,000 to A$50,000 plus GST, which is based on commercial rates plus reimbursement of out-of-pocket expenses in relation to the preparation of the report. Our directors and employees providing financial services receive an annual salary, a performance bonus or profit share depending on their level of seniority.
Except for the fees referred to above, no related body corporate of Grant Thornton Corporate Finance, or any of the directors or employees of Grant Thornton Corporate Finance or any of those related bodies or any associate receives any other remuneration or other benefit attributable to the preparation of and provision of this report.
For
per
sona
l use
onl
y
5 Independence
Grant Thornton Corporate Finance is required to be independent of UCL in order to provide this report. The guidelines for independence in the preparation of an independent expert’s report are set out in Regulatory Guide 112 Independence of expert issued by the Australian Securities and Investments Commission (“ASIC”). The following information in relation to the independence of Grant Thornton Corporate Finance is stated below.
“Grant Thornton Corporate Finance and its related entities do not have at the date of this report, and have not had within the previous two years, any shareholding in or other relationship with UCL (and associated entities) that could reasonably be regarded as capable of affecting its ability to provide an unbiased opinion in relation to the Takeover Offer.
Grant Thornton Corporate Finance has no involvement with, or interest in the outcome of the Takeover Offer, other than the preparation of this report.
Grant Thornton Corporate Finance will receive a fee based on commercial rates for the preparation of this report. This fee is not contingent on the outcome of the Takeover Offer. Grant Thornton Corporate Finance’s out of pocket expenses in relation to the preparation of the report will be reimbursed. Grant Thornton Corporate Finance will receive no other benefit for the preparation of this report.
Grant Thornton Corporate Finance considers itself to be independent in terms of Regulatory Guide 112 “Independence of experts” issued by the ASIC.
We note that Grant Thornton Corporate Finance was appointed as an independent expert by UCL in February 2012 in relation to off-market takeover offer made by Minemakers. In our opinion, the above engagement does not impact on our ability to provide an independent and unbiased opinion in the context of the Takeover Offer. In our opinion, Grant Thornton Corporate Finance is independent of UCL, its Directors and all other parties involved in the Takeover Offer.
6 Complaints process
Grant Thornton Corporate Finance has an internal complaint handling mechanism and is a member of the Financial Industry Complaints Services Complaints Handling Tribunal, No F-3986. All complaints must be in writing and addressed to the Chief Executive Officer at Grant Thornton Corporate Finance. We will endeavour to resolve all complaints within 30 days of receiving the complaint. If the complaint has not been satisfactorily dealt with, the complaint can be referred to the Financial Ombudsman Service who can be contacted at:
PO Box 579 – Collins Street West Melbourne, VIC 8007 Telephone: 1800 335 405
Grant Thornton Corporate Finance is only responsible for this report and this FSG. Complaints or questions about the Target Statement should not be directed to Grant Thornton Corporate Finance. Grant Thornton Corporate Finance will not respond in any way that might involve any provision of financial product advice to any retail investor.
For
per
sona
l use
onl
y

Compensation arrangements
Grant Thornton Corporate Finance has professional indemnity insurance cover under its professional indemnity insurance policy. This policy meets the compensation arrangement requirements of section 912B of the Corporations Act, 2001.
For
per
sona
l use
onl
y
13
UCL Resources Limited – Independent Expert’s Report
Contents
Page
1 Overview of the Takeover Offer 14
2 Purpose and scope of the report 17
3 Profile of the industry 20
4 Profile of UCL 27
5 Valuation methodology 42
6 Valuation assessment of UCL 45
7 Valuation cross check 64
8 Sources of information, disclaimer and consents 71
Appendix A – Valuation methodologies 74
Appendix B – Discount rate 76
Appendix C – Comparable companies 83
Appendix D – Liquidity of GB Minerals and Legend 85
Appendix E – Glossary 86
Appendix F – Snowden Report 90
For
per
sona
l use
onl
y
14
UCL Resources Limited – Independent Expert’s Report
1 Overview of the Takeover Offer
1.1 Introduction
UCL Resources Limited (“UCL” or “the “Company”) is a mineral exploration and development company listed on the Australian Securities Exchange (“ASX”). UCL holds the following key assets:
42.5% interest in the Sandpiper marine phosphate project located in Namibia (“Sandpiper Project”).
24.5% interest in the Mehdiabad base metals project located in Iran (“Mehdiabad Project”).
Mawarid Mining LLC (“Mawarid”), a subsidiary of MB Holding Company LLC (“MB Holding”), is a limited liability company primarily engaged in the exploration and development of copper, gold and silver. Mawarid and MB Holding are based in the Sultanate of Oman. As at the date of our report, Mawarid has a 42.5% direct interest in the Sandpiper Project acquired from Minemakers Limited (“Minemakers” or “MAK”).
On 23 April 2013, Mawarid made an unconditional, on-market takeover bid for all the shares in UCL that it does not already own (“Takeover Offer”) for A$0.31 cash per share (“Offer Price”). The Takeover Offer period will end on 7 June 2013, unless extended or withdrawn5.
Prior to the announcement of the Takeover Offer, Mawarid held a 19.01% interest in UCL. On 30 April 2013, we have been informed that Mawarid held a relevant interest in 57.1% of UCL shares. UCL’s largest shareholder Twynam Agriculture Group Pty Ltd (28.59% interest in UCL) has already accepted the Takeover Offer.
1.2 Other relevant aspects of the Takeover Offer
Set out below is a summary of the other key terms of the Takeover Offer:
UCL and Mawarid are in the process of seeking approval from the Namibian Competition Commission (“NCC”) in relation to the Takeover Offer. This approval is not a condition to UCL Shareholders receiving consideration under the Takeover Offer.
Mawarid and UCL will enter into a debenture deed in relation to a A$3.1 million three year bullet repayment facility to UCL (“the Facility”). The Facility can be used by UCL to meet any costs incurred in the daily course of business. Key terms of the Facility include:
Interest rate equal to the lower of LIBOR plus 4% or 7% per annum.
The Facility will only be available for drawdown if Mawarid does not acquire 90% or more of UCL Shares under the Takeover Offer by 21 June 2013. However, only A$1 million of the Facility will be available for drawdown from 21 May 2013.
5 The Takeover Offer will not be extended beyond 22 June 2013.
For
per
sona
l use
onl
y
15
UCL Resources Limited – Independent Expert’s Report
UCL will be required to obtain shareholder approval to grant Mawarid an exclusive, first-ranking registered security interest over all of UCL’s present and future assets.
The drawdown of the balance of the Facility after 21 June 2013 (i.e. A$2.1 million) will be conditional on shareholder approval and granting of security interest to Mawarid.
Mawarid has entered into an agreement with the holders of 3.8 million options in UCL under which Mawarid will purchase the options for the difference between the exercise price and the Offer Price if Mawarid is successful in acquiring 90% or more of UCL’s Shares under the Takeover Offer. The option holders have also undertaken not to exercise options held prior to 23 June 2013.
The board of directors of UCL has resolved that it will not permit the vesting of any performance rights in UCL during the Takeover Offer period.
Mawarid may withdraw the Takeover Offer in respect of any unaccepted offers under limited circumstances:
With the written consent of ASIC; or
Upon the occurrence of any insolvency event as set out in section 652C(2) of the Corporations Act; or
Upon the occurrence of any prescribed event as set out in section 652C of the Corporations Act and Mawarid’s voting power in UCL is at or below 50%.
Mawarid may vary the Takeover Offer in accordance with the Corporations Act. However, Mawarid has committed not to extend the Takeover Offer beyond 22 June 2013.
1.3 Mawarid’s intention in relation to the Takeover Offer
Mawarid’s intention upon acquisition of a controlling stake (equal to or greater than 50%)6 but less than 90% of the UCL Shares are summarised below:
Seek reconstitution of the UCL Board and appointment of its nominees as UCL Directors to reflect Mawarid’s majority ownership of UCL.
Review the benefits and suitability of UCL’s listing on the ASX.
Acquire additional UCL Shares under the “creep” provisions set out in the Corporations Act (i.e. acquisitions of no more than 3% in every 6 months).
Review of UCL’s operations, assets, structure and employees to identify any business opportunities, improve performance and realise any potential synergies.
Mawarid’s intention upon acquisition of 90% or more of the UCL Shares are summarised below:
6 We note that as at the date of our report, Mawarid holds a relevant interest in more than 50% of UCL shares.
For
per
sona
l use
onl
y
16
UCL Resources Limited – Independent Expert’s Report
Compulsory acquisition of any UCL Shares not acquired under the Takeover Offer.
Delisting of UCL from ASX.
Appoint Mawarid’s nominees to the UCL Board and seek the retirement of some or all current board members of UCL and associated entities.
Review of UCL’s operations, assets, structure and employees to identify any business opportunities, improve performance and realise any potential synergies.
For
per
sona
l use
onl
y
17
UCL Resources Limited – Independent Expert’s Report
2 Purpose and scope of the report
2.1 Purpose
Section 640 of the Corporations Act requires that a target statement made in response to a takeover offer for securities in an Australian publicly listed company must be accompanied by an independent expert’s report if:
The bidder’s voting power in the target is 30% or more
For a bidder who is, or includes, an individual – the bidder is a director of the target company; or
For a bidder who is, or includes, a body corporate – a director of the bidder is a director of the target company.
We note that Dr. Mohammed Al-Barwani, Non-Executive Director of UCL is also the Chairman of MB Holding Company LLC. Accordingly, we have been requested by the independent directors of UCL to state whether the Takeover Offer is fair and reasonable to the UCL Shareholders for the purposes of Section 640 of the Corporations Act.
2.2 Basis of assessment
The Corporations Act does not define the meaning of “fair and reasonable”. In preparing this report, Grant Thornton Corporate Finance has had regard to Regulatory Guide 111 “Content of expert reports” (“RG 111”). RG 111 establishes certain guidelines in respect of independent expert’s reports prepared for the purposes of the Corporations Act. RG 111 is framed largely in relation to reports prepared pursuant to Section 640 of the Corporations Act and comments on the meaning of “fair and reasonable” in the context of a takeover offer.
As the Takeover Offer is a takeover bid, RG 111 requires the following assessment:
An offer is considered fair if the value of the offer price or consideration is equal to or greater than the value of the securities that are the subject of the offer. The comparison should be made assuming 100% ownership of the target company and irrespective of whether the consideration offered is scrip or cash and without consideration of the percentage holding of the offeror or its associates in the target company.
An offer is considered reasonable if it is fair. If the offer is not fair it may still be reasonable after considering other significant factors which justify the acceptance of the offer in the absence of a higher bid. ASIC has identified the following factors which an expert might consider when determining whether an offer is reasonable:
The offeror’s pre-existing entitlement, if any, in the shares of the target company.
Other significant shareholding blocks in the target company.
The liquidity of the market in the target company’s securities.
For
per
sona
l use
onl
y
18
UCL Resources Limited – Independent Expert’s Report
Taxation losses, cash flow or other benefits through achieving 100% ownership of the target company.
Any special value of the target company to the offer, such as particular technology and the potential to write off outstanding loans from the target company.
The likely market price if the offer is unsuccessful.
The value to an alternative offeror and likelihood of an alternative offer being made.
In arriving at our opinion, Grant Thornton Corporate Finance has determined whether the Takeover Offer is fair to the UCL Shareholders by comparing the fair market value range of UCL Shares on a controlling basis with the cash consideration of A$0.31 per UCL Share.
In considering whether the Takeover Offer is reasonable to the UCL Shareholders, we have considered a number of factors, including:
Whether the Takeover Offer is fair.
The implications to UCL and UCL Shareholders if the Takeover Offer does not complete.
Other likely advantages and disadvantages associated with the Takeover Offer as required by RG 111.
Other costs and risks associated with the Takeover Offer that could potentially affect UCL Shareholders.
For the purpose of this report, an independent technical specialist, Snowden Mining Industry Consultants Pty Ltd (“Snowden”), was engaged to provide an independent technical report (“the Technical Report”) in relation to the exploration and development assets owned by UCL. Snowden’s report is included as Appendix F to this report.
2.3 Independence
Prior to accepting this engagement, Grant Thornton Corporate Finance considered its independence with respect to the Takeover Offer with reference to the ASIC Regulatory Guide 112 “Independence of Expert’s Reports” (“RG 112”).
We note that Grant Thornton Corporate Finance was appointed as an independent expert by UCL in February 2012 in relation to off-market takeover offer made by Minemakers.
In our opinion, the above engagement does not impact on our ability to provide an independent and unbiased opinion in the context of the Takeover Offer. In our opinion, Grant Thornton Corporate Finance is independent of UCL, its Directors and all other parties involved in the Takeover Offer.
Grant Thornton Corporate Finance has no involvement with, or interest in, the outcome of the approval of the Takeover Offer other than that of independent expert. Grant Thornton Corporate
For
per
sona
l use
onl
y
19
UCL Resources Limited – Independent Expert’s Report
Finance is entitled to receive a fee based on commercial rates and including reimbursement of out-of-pocket expenses for the preparation of this report.
Except for these fees, Grant Thornton Corporate Finance will not be entitled to any other pecuniary or other benefit, whether direct or indirect, in connection with the issuing of this report. The payment of this fee is in no way contingent upon the success or failure of the Takeover Offer.
2.4 Consent and other matters
Our report is to be read in conjunction with the Target’s Statement dated on or around 1 May 2013 in which this report is included, and is prepared for the exclusive purpose of assisting UCL Shareholders in their consideration of the Takeover Offer. This report should not be used for any other purpose.
Grant Thornton Corporate Finance consents to the issue of this report in its form and context and consents to its inclusion in the Target’s Statement.
This report constitutes general financial product advice only and in undertaking our assessment, we have considered the likely impact of the Takeover Offer to the UCL Shareholders as a whole. We have not considered the potential impact of the Takeover Offer on individual shareholders. Individual shareholders have different financial circumstances and it is neither practicable nor possible to consider the implications of the Takeover Offer on individual shareholders.
The decision of whether or not to accept the Takeover Offer is a matter for each UCL Shareholder based on their own views of value of UCL and expectations about future market conditions, UCL’s performance, risk profile and investment strategy. If shareholders are in doubt about the action they should take in relation to the Takeover Offer, they should seek their own professional advice.
For
per
sona
l use
onl
y
20
UCL Resources Limited – Independent Expert’s Report
3 Profile of the industry
UCL is an ASX-listed mining company primarily focused on the exploration and development of the Sandpiper Project, a submarine phosphate project located approximately 60 km off the coast of Namibia near Walvis Bay. The Company was granted a 20-years mining license in July 2011 and completed an updated definitive feasibility study (“DFS”) on the Sandpiper Project in January 2013.
3.1 Overview
Phosphate (chemical compound P2O5) is a naturally occurring form of the element phosphorus and is used as a raw material for making all phosphate products, in particular fertilisers. Phosphate is also used in animal feed supplements, soft drinks, food preservatives, household cleaning products, toothpaste, cosmetics, fungicide, and industrial chemicals.
Deposits of phosphate usually occur in extensive layers which cover thousands of square kilometres and are mined through surface mines as phosphate rock. Phosphate rock deposits can generally be classified into three types: marine sedimentary deposits formed under the sea, apatite-rich igneous rock deposits, and guano accumulations (droppings of sea birds) harvested on various islands. We note that the Sandpiper Project’s phosphate deposits occur as unconsolidated sea floor sediments.
While the occurrence of phosphate rock is widespread, the production of phosphate rock is concentrated in only a few countries with relatively few suppliers. In 2011, China, Morocco, Western Sahara and the United States (“US”) accounted for approximately 69.2%7 of the world’s phosphate production. The majority of world phosphate production is consumed domestically by the producing countries.
Over the past years, volatility in global financial markets (“GFC”) and increasing concerns in relation to European sovereign debt levels (“European Debt Crisis”) have constrained economic activity and growth, and in turn the demand for phosphate rock. However, recent improvements in the economic environment have seen increases in demand for phosphate rock.
Although phosphate mining in Namibia is relatively new, the overall mining industry in Namibia is a mature industry with well-established mining technology and processes. As at 30 June 2012, the mining industry in Namibia accounted for more than 50% of the country’s foreign exchange earnings and was expected to expand by 50% by 2015.8 3.2 Products and Production Most of the phosphate rock in the world is mined through strip-mining at open-pit mines for phosphate deposits located close to the surface of the land. Strip-mining involves the removal of the overlying rock (overburden) and then extraction of the underlying phosphate minerals using dragline excavators or bucket wheel excavators.
In the case of Sandpiper Project which is located offshore, a conventional dredging methodology is intended to be adopted. Whilst offshore mining for phosphate is relatively new, deep sea and
7 Source: U.S. Geological Survey, Mineral Commodity Summaries, January 2013. 8 Global Business Reports, Mining in Southern Africa, June 2012
For
per
sona
l use
onl
y
21
UCL Resources Limited – Independent Expert’s Report
offshore mining are not new to the mining industry with offshore oil and gas operations having begun in the 1890s and remain common production methods today.
The conventional dredging methodology involves the scraping or sucking of the seafloor sediments with suction pipes into the vessel’s hopper for transport to shore and thereafter pumping the recovered sediments to an onshore buffer pond. The material is then screened before being hydraulically transported to a beneficiation plant where it is purified into a more concentrated form (phosphate concentrates). Phosphate concentrates are then further processed into various forms, typically for use in fertiliser production.
The fertiliser industry consumes about 90% of the world’s production9 of phosphate rock which is the main natural source of phosphorous, a primary plant nutrient. In order for the phosphorous in phosphate rock to be utilised by plants, phosphate rock usually must first be processed into a water soluble form, phosphoric acid (“PA”) or by producing single super phosphate (“SSP”) by reacting sulphuric acid with naturally occurring phosphate rock (wet-processing).
PA is mainly used to manufacture many key basic fertilisers such as di-ammonium phosphate (“DAP”) and mono ammonium phosphate (“MAP”). DAP has a high phosphorous and nitrogen content and is widely used in cropping and on grass pastures. MAP has relatively lower nitrogen content than DAP is therefore preferred for use on germinating seeds and emerging seedlings, and is a popular planting fertiliser in grain and cotton crops.
The remaining 10% of phosphate rock consumed is usually in the production of elemental phosphorus, fused phosphates, triple superphospate and in the direct application of phosphate rock to the soil as fertiliser (“DAPR”). DAPR is primarily consumed in Latin America and South East Asia as a general phosphate fertiliser in underdeveloped locations where the soil is acidic in nature, on plantation crops and in organic farming systems.
3.3 Key drivers affecting phosphate exploration and development
The key drivers affecting phosphate exploration and development include:
Demand for phosphate – the demand for phosphate exploration and development is mainly derived from the fertiliser manufacturing industry which in turn is underpinned by the demand for agriculture globally and growth in the world population.
Phosphate and fertiliser prices – low phosphate and fertiliser prices tend to have a negative impact on the level of phosphate exploration and development activities and vice versa.
Oil prices – high crude oil prices have a positive effect on the phosphate and fertiliser industry. With oil prices increasing, the demand for alternate energy sources is on the rise. Alternate energy sources such as biofuel and ethanol are plant-derived substitutes of gasoline for powering vehicles. Production of biofuels requires extensive agriculture which stimulates the use of fertilisers and subsequently phosphate.
9 Food and Agriculture Organization of the United Nations
For
per
sona
l use
onl
y
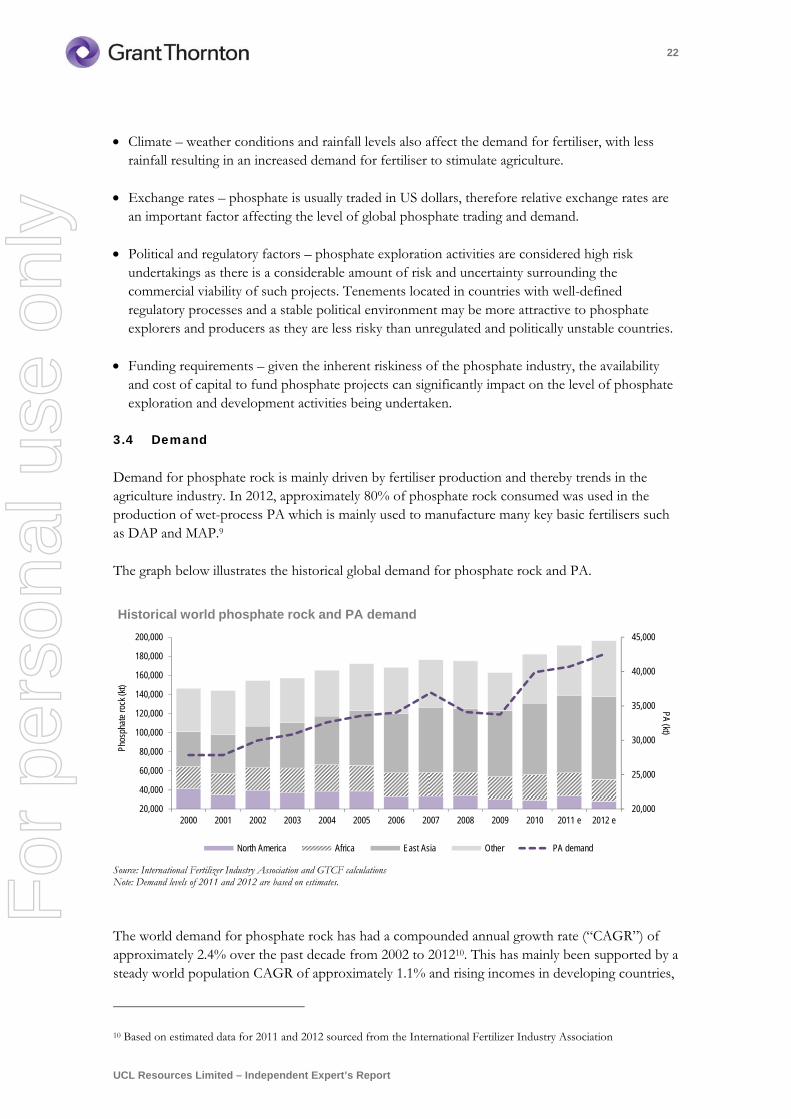
22
UCL Resources Limited – Independent Expert’s Report
Climate – weather conditions and rainfall levels also affect the demand for fertiliser, with less rainfall resulting in an increased demand for fertiliser to stimulate agriculture.
Exchange rates – phosphate is usually traded in US dollars, therefore relative exchange rates are an important factor affecting the level of global phosphate trading and demand.
Political and regulatory factors – phosphate exploration activities are considered high risk undertakings as there is a considerable amount of risk and uncertainty surrounding the commercial viability of such projects. Tenements located in countries with well-defined regulatory processes and a stable political environment may be more attractive to phosphate explorers and producers as they are less risky than unregulated and politically unstable countries.
Funding requirements – given the inherent riskiness of the phosphate industry, the availability and cost of capital to fund phosphate projects can significantly impact on the level of phosphate exploration and development activities being undertaken.
3.4 Demand
Demand for phosphate rock is mainly driven by fertiliser production and thereby trends in the agriculture industry. In 2012, approximately 80% of phosphate rock consumed was used in the production of wet-process PA which is mainly used to manufacture many key basic fertilisers such as DAP and MAP.9
The graph below illustrates the historical global demand for phosphate rock and PA.
Source: International Fertilizer Industry Association and GTCF calculations Note: Demand levels of 2011 and 2012 are based on estimates.
The world demand for phosphate rock has had a compounded annual growth rate (“CAGR”) of approximately 2.4% over the past decade from 2002 to 201210. This has mainly been supported by a steady world population CAGR of approximately 1.1% and rising incomes in developing countries,
10 Based on estimated data for 2011 and 2012 sourced from the International Fertilizer Industry Association
20,000
25,000
30,000
35,000
40,000
45,000
20,000
40,000
60,000
80,000
100,000
120,000
140,000
160,000
180,000
200,000
2000 2001 2002 2003 2004 2005 2006 2007 2008 2009 2010 2011 e 2012 e
PA (kt)Ph
osph
ate
rock
(kt)
Historical world phosphate rock and PA demand
North America Africa East Asia Other PA demand
For
per
sona
l use
onl
y
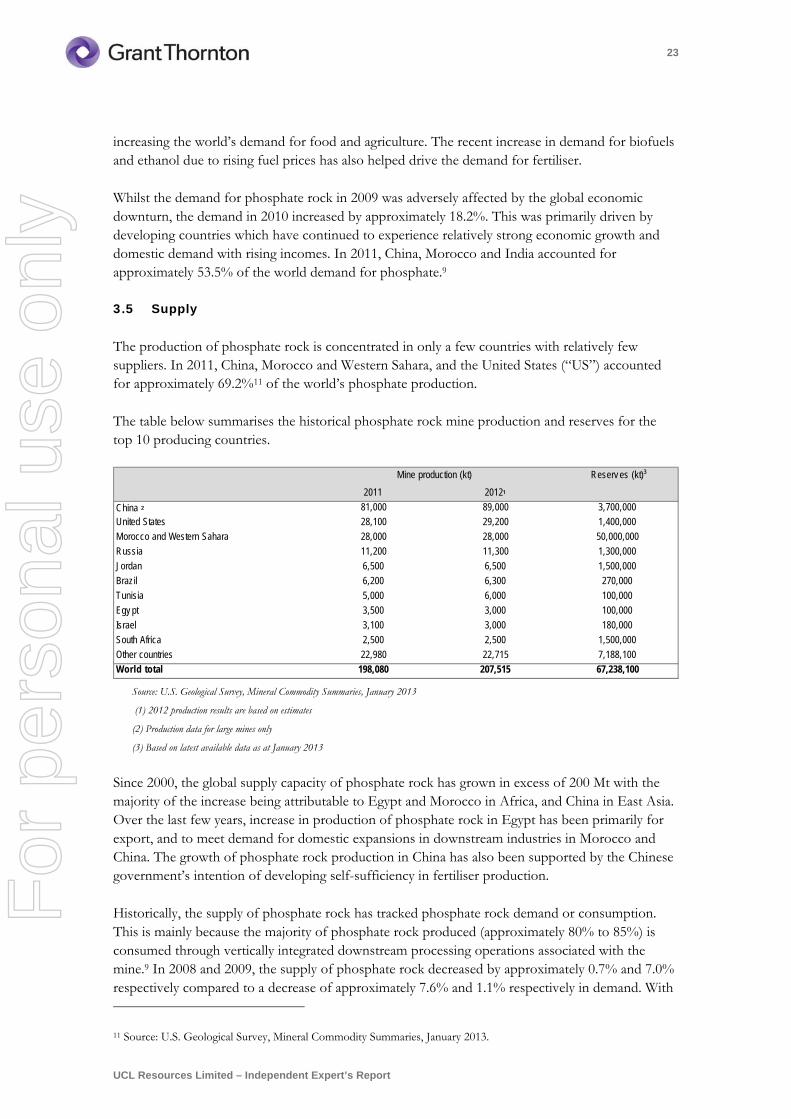
23
UCL Resources Limited – Independent Expert’s Report
increasing the world’s demand for food and agriculture. The recent increase in demand for biofuels and ethanol due to rising fuel prices has also helped drive the demand for fertiliser.
Whilst the demand for phosphate rock in 2009 was adversely affected by the global economic downturn, the demand in 2010 increased by approximately 18.2%. This was primarily driven by developing countries which have continued to experience relatively strong economic growth and domestic demand with rising incomes. In 2011, China, Morocco and India accounted for approximately 53.5% of the world demand for phosphate.9
3.5 Supply
The production of phosphate rock is concentrated in only a few countries with relatively few suppliers. In 2011, China, Morocco and Western Sahara, and the United States (“US”) accounted for approximately 69.2%11 of the world’s phosphate production.
The table below summarises the historical phosphate rock mine production and reserves for the top 10 producing countries.
Source: U.S. Geological Survey, Mineral Commodity Summaries, January 2013
(1) 2012 production results are based on estimates
(2) Production data for large mines only
(3) Based on latest available data as at January 2013
Since 2000, the global supply capacity of phosphate rock has grown in excess of 200 Mt with the majority of the increase being attributable to Egypt and Morocco in Africa, and China in East Asia. Over the last few years, increase in production of phosphate rock in Egypt has been primarily for export, and to meet demand for domestic expansions in downstream industries in Morocco and China. The growth of phosphate rock production in China has also been supported by the Chinese government’s intention of developing self-sufficiency in fertiliser production.
Historically, the supply of phosphate rock has tracked phosphate rock demand or consumption. This is mainly because the majority of phosphate rock produced (approximately 80% to 85%) is consumed through vertically integrated downstream processing operations associated with the mine.9 In 2008 and 2009, the supply of phosphate rock decreased by approximately 0.7% and 7.0% respectively compared to a decrease of approximately 7.6% and 1.1% respectively in demand. With
11 Source: U.S. Geological Survey, Mineral Commodity Summaries, January 2013.
Reserv es (kt)³
2011 2012¹China ² 81,000 89,000 3,700,000
United States 28,100 29,200 1,400,000
Morocco and Western Sahara 28,000 28,000 50,000,000
Russia 11,200 11,300 1,300,000
Jordan 6,500 6,500 1,500,000
Brazil 6,200 6,300 270,000
Tunisia 5,000 6,000 100,000
Egy pt 3,500 3,000 100,000
Israel 3,100 3,000 180,000
South Africa 2,500 2,500 1,500,000
Other countries 22,980 22,715 7,188,100
World total 198,080 207,515 67,238,100
Mine production (kt)
For
per
sona
l use
onl
y
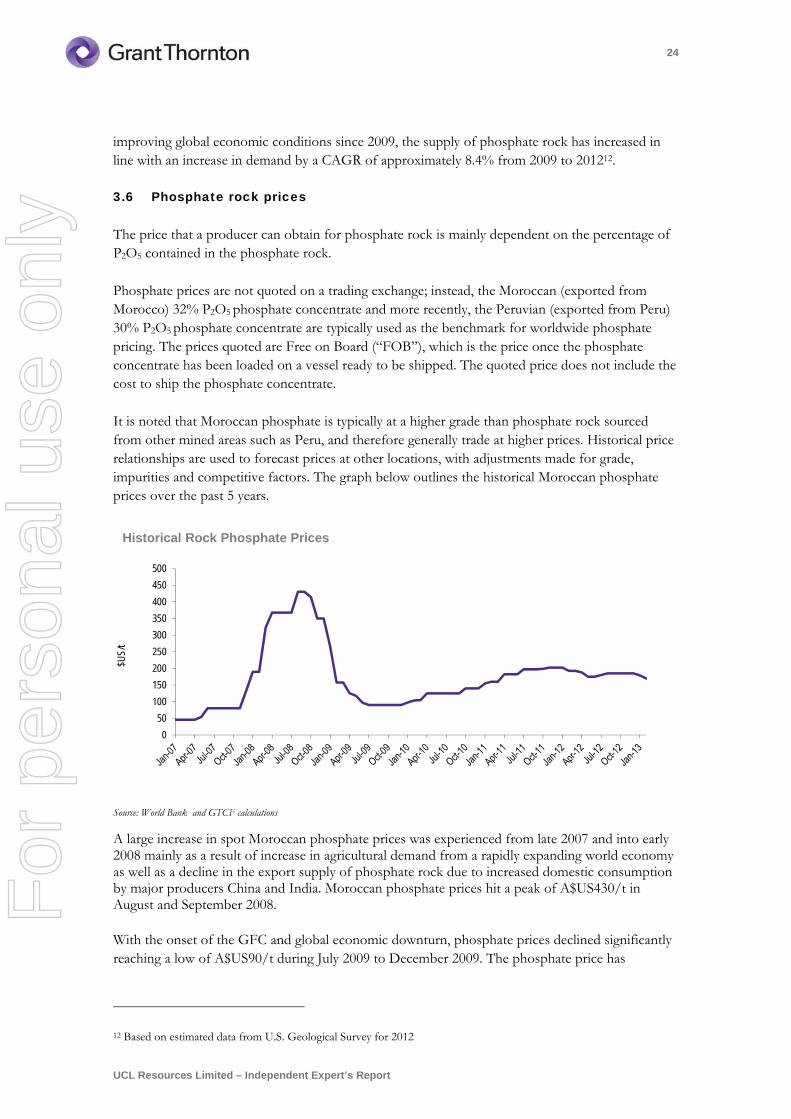
24
UCL Resources Limited – Independent Expert’s Report
improving global economic conditions since 2009, the supply of phosphate rock has increased in line with an increase in demand by a CAGR of approximately 8.4% from 2009 to 201212.
3.6 Phosphate rock prices
The price that a producer can obtain for phosphate rock is mainly dependent on the percentage of P2O5 contained in the phosphate rock.
Phosphate prices are not quoted on a trading exchange; instead, the Moroccan (exported from Morocco) 32% P2O5 phosphate concentrate and more recently, the Peruvian (exported from Peru) 30% P2O5 phosphate concentrate are typically used as the benchmark for worldwide phosphate pricing. The prices quoted are Free on Board (“FOB”), which is the price once the phosphate concentrate has been loaded on a vessel ready to be shipped. The quoted price does not include the cost to ship the phosphate concentrate.
It is noted that Moroccan phosphate is typically at a higher grade than phosphate rock sourced from other mined areas such as Peru, and therefore generally trade at higher prices. Historical price relationships are used to forecast prices at other locations, with adjustments made for grade, impurities and competitive factors. The graph below outlines the historical Moroccan phosphate prices over the past 5 years.
Source: World Bank and GTCF calculations
A large increase in spot Moroccan phosphate prices was experienced from late 2007 and into early 2008 mainly as a result of increase in agricultural demand from a rapidly expanding world economy as well as a decline in the export supply of phosphate rock due to increased domestic consumption by major producers China and India. Moroccan phosphate prices hit a peak of A$US430/t in August and September 2008. With the onset of the GFC and global economic downturn, phosphate prices declined significantly reaching a low of A$US90/t during July 2009 to December 2009. The phosphate price has
12 Based on estimated data from U.S. Geological Survey for 2012
0
50
100
150
200
250
300
350
400
450
500
$US/
t
Historical Rock Phosphate Prices
For
per
sona
l use
onl
y
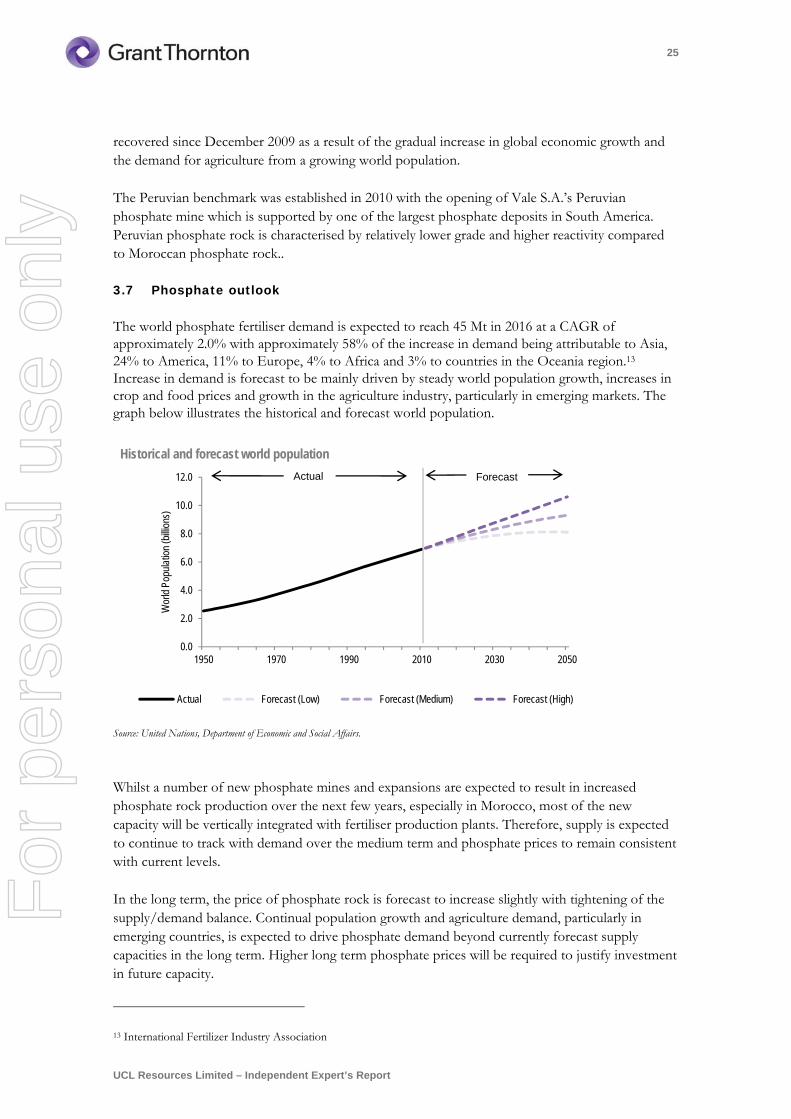
25
UCL Resources Limited – Independent Expert’s Report
recovered since December 2009 as a result of the gradual increase in global economic growth and the demand for agriculture from a growing world population.
The Peruvian benchmark was established in 2010 with the opening of Vale S.A.’s Peruvian phosphate mine which is supported by one of the largest phosphate deposits in South America. Peruvian phosphate rock is characterised by relatively lower grade and higher reactivity compared to Moroccan phosphate rock..
3.7 Phosphate outlook
The world phosphate fertiliser demand is expected to reach 45 Mt in 2016 at a CAGR of approximately 2.0% with approximately 58% of the increase in demand being attributable to Asia, 24% to America, 11% to Europe, 4% to Africa and 3% to countries in the Oceania region.13 Increase in demand is forecast to be mainly driven by steady world population growth, increases in crop and food prices and growth in the agriculture industry, particularly in emerging markets. The graph below illustrates the historical and forecast world population.
Source: United Nations, Department of Economic and Social Affairs.
Whilst a number of new phosphate mines and expansions are expected to result in increased phosphate rock production over the next few years, especially in Morocco, most of the new capacity will be vertically integrated with fertiliser production plants. Therefore, supply is expected to continue to track with demand over the medium term and phosphate prices to remain consistent with current levels.
In the long term, the price of phosphate rock is forecast to increase slightly with tightening of the supply/demand balance. Continual population growth and agriculture demand, particularly in emerging countries, is expected to drive phosphate demand beyond currently forecast supply capacities in the long term. Higher long term phosphate prices will be required to justify investment in future capacity.
13 International Fertilizer Industry Association
0.0
2.0
4.0
6.0
8.0
10.0
12.0
1950 1970 1990 2010 2030 2050
Wor
ld P
opul
atio
n (b
illion
s)
Historical and forecast world population
Actual Forecast (Low) Forecast (Medium) Forecast (High)
ForecastActual
For
per
sona
l use
onl
y
26
UCL Resources Limited – Independent Expert’s Report
3.8 Mining in Namibia
Namibia is a country located in Southern Africa. Mining is the foundation of the Namibian economy with the mining industry accounting for approximately three-quarters of Namibia’s GDP and more than 50% of foreign exchange earnings as at 30 June 2012. The mining industry in Namibia is mature and is mainly focused on diamonds, uranium and base metals such as copper, lead and zinc. Namibia is a primary source for gem-quality diamonds and is the world's fourth-largest producer of uranium. Namibia's real mining growth is forecast to increase at an average of 13.9% per year from 2012, with the industry reaching a value of US$4.2bn in 2016.14
Historical phosphate mining in Namibia has been very limited. Currently, the only phosphates mined are from guano deposits. A significant phosphate development project in Namibia at present is UCL’s Sandpiper Project located off Walvis Bay. The Sandpiper Project phosphate deposit was first discovered and regionally mapped in the late 1960s and 1970s, with subsequent exploratory work undertaken in the 1990s and 2000s. The offshore deposits were originally considered uneconomical to mine mainly due to low phosphate prices and high capital investment requirements. For further information in relation to the Sandpiper Project please refer to section 4.2.
Currently, most non-diamond mining companies in Namibia pay a flat income-tax rate of 37.5% and royalties on exports. Together, mining taxes and royalties account for approximately a quarter of the Namibian government's total revenues. However recently in 2011, the Namibian government announced the potential introduction of an additional export levy on all unprocessed mineral products mined in Namibia at a rate ranging from nil to 2%. The independent, Chamber of Mines of Namibia has warned that the introduction of the export levy may significantly constrain growth of the mining industry in Namibia which exports a majority of raw materials mined for further processing outside of Namibia. We have conducted a sensitivity analysis on the Sandpiper Project in relation to the potential introduction of the export levy in section 6.1.1.3.
14 CIA, World Factbook
For
per
sona
l use
onl
y
27
UCL Resources Limited – Independent Expert’s Report
4 Profile of UCL
4.1 Company history
UCL is a mineral resource company listed on the ASX with the following key assets:
42.5% interest in a marine phosphate project located off the coast of Namibia (“the Sandpiper Project”); and
24.5% interest in a lead-zinc-silver project located in Iran (“the Mehdiabad Project”).
Set out below is a brief overview of the recent corporate history of the Company:
Jul 2010 UCL along with joint venture partners Minemakers Limited (“Minemakers” or “MAK”) (subsequent to the acquisition of Bonaparte) and Tungeni Investments cc (“Tungeni”) formalised the incorporation of Namibian Marine Phosphate (Pty) Ltd (“NMP”) through the execution of a Shareholders Agreement (“SHA”).
Nov 2010 Through NMP, a mining license application was lodged for the Sandpiper Project and was granted in July 2011.
Nov 2011 At UCL’s Annual General Meeting (“AGM”), shareholders agreed to change the Company’s name from Union Resources Limited to UCL Resources Ltd, and also agreed to consolidate the Company’s share capital at a ratio of 1:30.
Feb 2012 Minemakers (13.1% shareholder of UCL) made an off market takeover bid for the shares in UCL which it did not own. Under the offer, UCL shareholders would receive 9 Minemakers shares for every 10 UCL shares held. In response, the board of UCL recommended unanimously that its shareholders reject the unsolicited offer.
Apr 2012 MAK announced that the initial offer of 9 MAK Shares for every 10 UCL Shares made in February 2012 has been increased to 13 MAK Shares for every 10 UCL Shares (“Revised Offer”). In response, the board of UCL recommended unanimously that its shareholders reject the Revised Offer. The offer closed in May 2012 and MAK increased its shareholding in UCL by only 2.65% to 15.76%.
UCL entered into a non-binding Memorandum of Understanding with Mawarid Mining LLC (“Mawarid”), subsidiary of MB Holding Company, for the placement of 12.1 million shares, representing 13.04% of the outstanding UCL shares on issue immediately following the placement to raise A$3.6 million (before costs) at the proposed price of A$0.30 per UCL share (“Placement”). The Placement was completed in May 2012.
May 2012 UCL made an unsolicited off-market takeover bid to acquire all shares in Minemakers. Under the offer, Minemakers shareholders would receive 1 UCL share plus 4.5 cents cash for every 1.6 Minemakers shares. In response, the board of Minemakers recommended unanimously that its shareholders reject the unsolicited offer. The offer lapsed in October 2012 and UCL did not acquire any Minemakers shares pursuant to its takeover bid.
For
per
sona
l use
onl
y
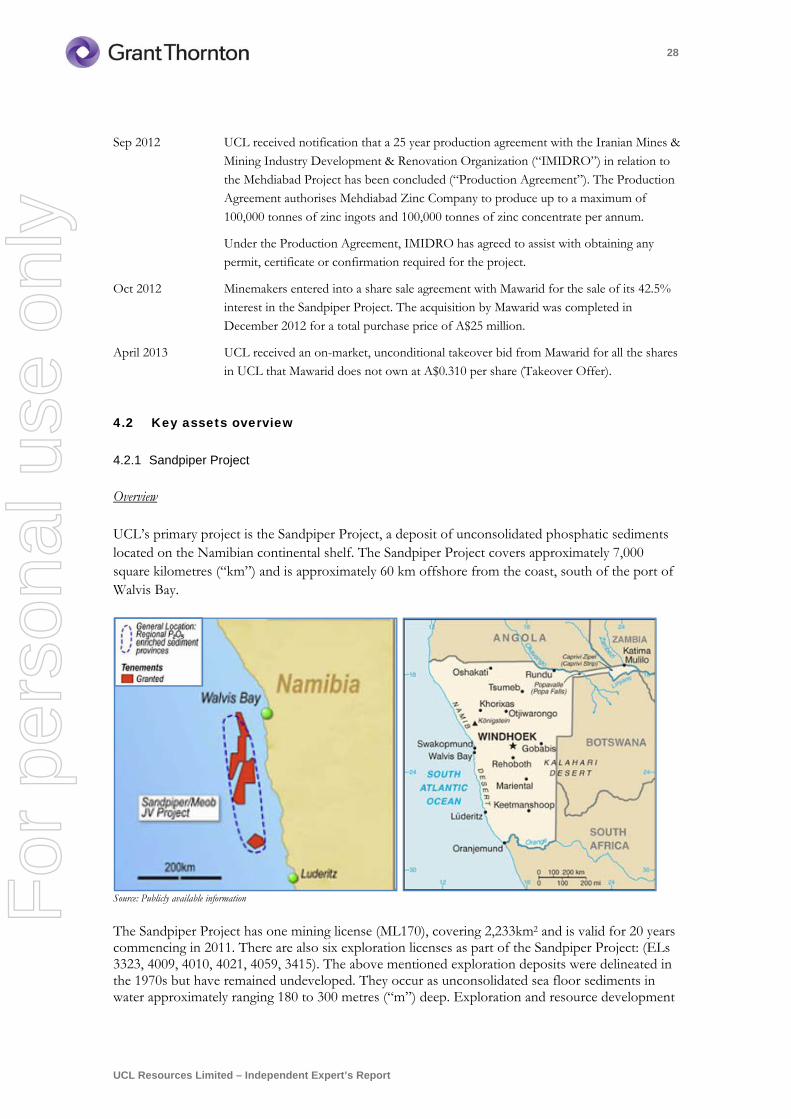
28
UCL Resources Limited – Independent Expert’s Report
Sep 2012 UCL received notification that a 25 year production agreement with the Iranian Mines & Mining Industry Development & Renovation Organization (“IMIDRO”) in relation to the Mehdiabad Project has been concluded (“Production Agreement”). The Production Agreement authorises Mehdiabad Zinc Company to produce up to a maximum of 100,000 tonnes of zinc ingots and 100,000 tonnes of zinc concentrate per annum.
Under the Production Agreement, IMIDRO has agreed to assist with obtaining any permit, certificate or confirmation required for the project.
Oct 2012 Minemakers entered into a share sale agreement with Mawarid for the sale of its 42.5% interest in the Sandpiper Project. The acquisition by Mawarid was completed in December 2012 for a total purchase price of A$25 million.
April 2013 UCL received an on-market, unconditional takeover bid from Mawarid for all the shares in UCL that Mawarid does not own at A$0.310 per share (Takeover Offer).
4.2 Key assets overview
4.2.1 Sandpiper Project
Overview
UCL’s primary project is the Sandpiper Project, a deposit of unconsolidated phosphatic sediments located on the Namibian continental shelf. The Sandpiper Project covers approximately 7,000 square kilometres (“km”) and is approximately 60 km offshore from the coast, south of the port of Walvis Bay.
Source: Publicly available information
The Sandpiper Project has one mining license (ML170), covering 2,233km2 and is valid for 20 years commencing in 2011. There are also six exploration licenses as part of the Sandpiper Project: (ELs 3323, 4009, 4010, 4021, 4059, 3415). The above mentioned exploration deposits were delineated in the 1970s but have remained undeveloped. They occur as unconsolidated sea floor sediments in water approximately ranging 180 to 300 metres (“m”) deep. Exploration and resource development
For
per
sona
l use
onl
y
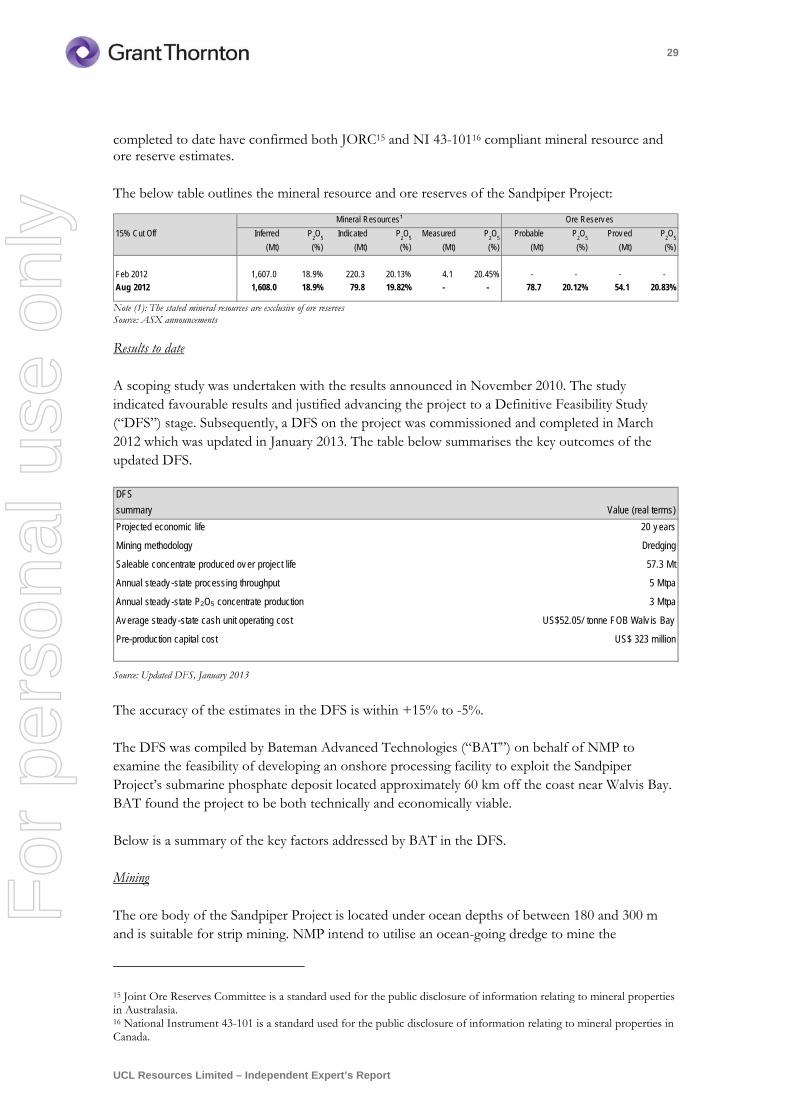
29
UCL Resources Limited – Independent Expert’s Report
completed to date have confirmed both JORC15 and NI 43-10116 compliant mineral resource and ore reserve estimates.
The below table outlines the mineral resource and ore reserves of the Sandpiper Project:
Note (1): The stated mineral resources are exclusive of ore reserves Source: ASX announcements
Results to date
A scoping study was undertaken with the results announced in November 2010. The study indicated favourable results and justified advancing the project to a Definitive Feasibility Study (“DFS”) stage. Subsequently, a DFS on the project was commissioned and completed in March 2012 which was updated in January 2013. The table below summarises the key outcomes of the updated DFS.
Source: Updated DFS, January 2013
The accuracy of the estimates in the DFS is within +15% to -5%. The DFS was compiled by Bateman Advanced Technologies (“BAT”) on behalf of NMP to examine the feasibility of developing an onshore processing facility to exploit the Sandpiper Project’s submarine phosphate deposit located approximately 60 km off the coast near Walvis Bay. BAT found the project to be both technically and economically viable. Below is a summary of the key factors addressed by BAT in the DFS. Mining
The ore body of the Sandpiper Project is located under ocean depths of between 180 and 300 m and is suitable for strip mining. NMP intend to utilise an ocean-going dredge to mine the
15 Joint Ore Reserves Committee is a standard used for the public disclosure of information relating to mineral properties in Australasia. 16 National Instrument 43-101 is a standard used for the public disclosure of information relating to mineral properties in Canada.
15% Cut Off Inferred
(Mt)
P2O
5
(%)
Indicated
(Mt)
P2O
5
(%)
Measured
(Mt)
P2O
5
(%)
Probable
(Mt)
P2O
5
(%)
Prov ed
(Mt)
P2O
5
(%)
Feb 2012 1,607.0 18.9% 220.3 20.13% 4.1 20.45% - - - -
Aug 2012 1,608.0 18.9% 79.8 19.82% - - 78.7 20.12% 54.1 20.83%
Mineral Resources¹ Ore Reserv es
DFS
summary
Projected economic life 20 y ears
Mining methodology Dredging
Saleable concentrate produced ov er project life 57.3 Mt
Annual steady -state processing throughput 5 Mtpa
Annual steady -state P2O5 concentrate production 3 Mtpa
Av erage steady -state cash unit operating cost US$52.05/ tonne FOB Walv is Bay
Pre-production capital cost US$ 323 million
Value (real terms)
For
per
sona
l use
onl
y
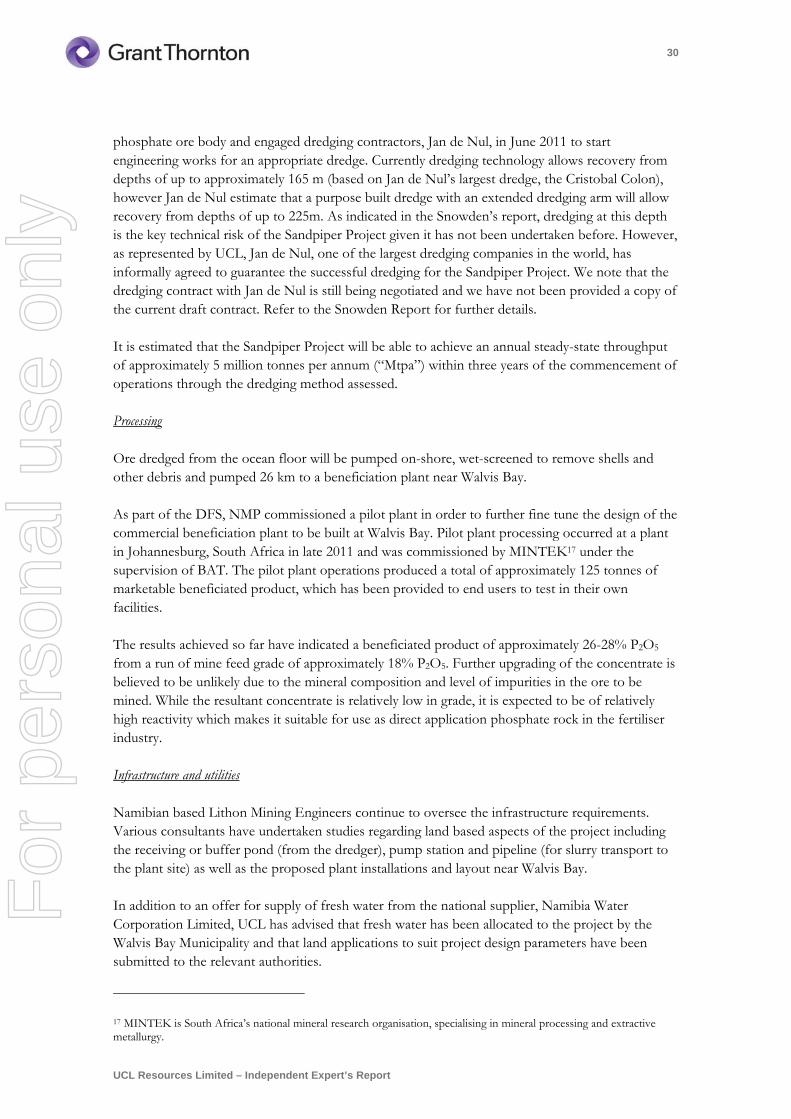
30
UCL Resources Limited – Independent Expert’s Report
phosphate ore body and engaged dredging contractors, Jan de Nul, in June 2011 to start engineering works for an appropriate dredge. Currently dredging technology allows recovery from depths of up to approximately 165 m (based on Jan de Nul’s largest dredge, the Cristobal Colon), however Jan de Nul estimate that a purpose built dredge with an extended dredging arm will allow recovery from depths of up to 225m. As indicated in the Snowden’s report, dredging at this depth is the key technical risk of the Sandpiper Project given it has not been undertaken before. However, as represented by UCL, Jan de Nul, one of the largest dredging companies in the world, has informally agreed to guarantee the successful dredging for the Sandpiper Project. We note that the dredging contract with Jan de Nul is still being negotiated and we have not been provided a copy of the current draft contract. Refer to the Snowden Report for further details. It is estimated that the Sandpiper Project will be able to achieve an annual steady-state throughput of approximately 5 million tonnes per annum (“Mtpa”) within three years of the commencement of operations through the dredging method assessed. Processing
Ore dredged from the ocean floor will be pumped on-shore, wet-screened to remove shells and other debris and pumped 26 km to a beneficiation plant near Walvis Bay. As part of the DFS, NMP commissioned a pilot plant in order to further fine tune the design of the commercial beneficiation plant to be built at Walvis Bay. Pilot plant processing occurred at a plant in Johannesburg, South Africa in late 2011 and was commissioned by MINTEK17 under the supervision of BAT. The pilot plant operations produced a total of approximately 125 tonnes of marketable beneficiated product, which has been provided to end users to test in their own facilities. The results achieved so far have indicated a beneficiated product of approximately 26-28% P2O5
from a run of mine feed grade of approximately 18% P2O5. Further upgrading of the concentrate is believed to be unlikely due to the mineral composition and level of impurities in the ore to be mined. While the resultant concentrate is relatively low in grade, it is expected to be of relatively high reactivity which makes it suitable for use as direct application phosphate rock in the fertiliser industry. Infrastructure and utilities
Namibian based Lithon Mining Engineers continue to oversee the infrastructure requirements. Various consultants have undertaken studies regarding land based aspects of the project including the receiving or buffer pond (from the dredger), pump station and pipeline (for slurry transport to the plant site) as well as the proposed plant installations and layout near Walvis Bay. In addition to an offer for supply of fresh water from the national supplier, Namibia Water Corporation Limited, UCL has advised that fresh water has been allocated to the project by the Walvis Bay Municipality and that land applications to suit project design parameters have been submitted to the relevant authorities.
17 MINTEK is South Africa’s national mineral research organisation, specialising in mineral processing and extractive metallurgy.
For
per
sona
l use
onl
y
31
UCL Resources Limited – Independent Expert’s Report
Discussions are currently underway with the port authorities with respect to the planning of bulk storage and loading facilities at Walvis Bay. Marketing An independent marketing consultant firm was commissioned to report on the long term phosphate market outlook and the probable sale price of the NMP concentrate (“Consultant Report”). Prices of concentrates for the Sandpiper Project have been based on the price of phosphate rock produced from the Bayovar mine in Peru (“Peruvian Price”) which is considered a highly comparable product. Based on the conclusions of the Consultant Report, NMP is targeting to market approximately 1 mtpa each of phosphate concentrate into the DAPR, SSP and PA markets. Environmental studies NMP lodged the Marine Environmental Impact Assessment (“EIA”) and Environmental Management Plan (“EMP”) to the Namibian Ministries of Mines and Energy and Environment and Tourism in January 2012. The EIA and EMP were prepared by J Midgley and Associates in association with Namibian environmental consultants Enviro Dynamics and was externally reviewed by CSIR Consulting and Analytical Services: Environmental Management Services (“CSIR”). The draft report stated there was presently no identified issues of environmental significance to preclude the dredging of phosphate enriched sediments from the Mining License Area No. 170. Final comments and additional considerations on the submitted draft EIA and EMP reports have been received and are being incorporated into the documents for submission to the relevant government ministries for final consideration. If final approval is granted, NMP will be issued with an environmental contract. Pathway to production NMP is undertaking discussions with potential off-take parties in relation to the concentrate to be produced, which will be used for direct application, SSP and phosphoric acid. NMP is also negotiating with relevant parties in relation to available funding options for the Sandpiper Project. In this regard, we note that NMP is currently undertaking preliminary discussions with various financial institutions. We have been advised that subject to sufficient funding arrangement and final regulatory approvals, the Sandpiper Project is expected to commence development and construction in the second half of 2013, commence production in the third quarter of 2015, and ramping up to 3Mtpa in 2018. Ownership and agreements
In October 2012, Minemakers entered into a share sale agreement (“SSA”) with UCL’s cornerstone shareholder, Mawarid for the sale of its 42.5% interest in the Sandpiper Project and 70% interest in
For
per
sona
l use
onl
y
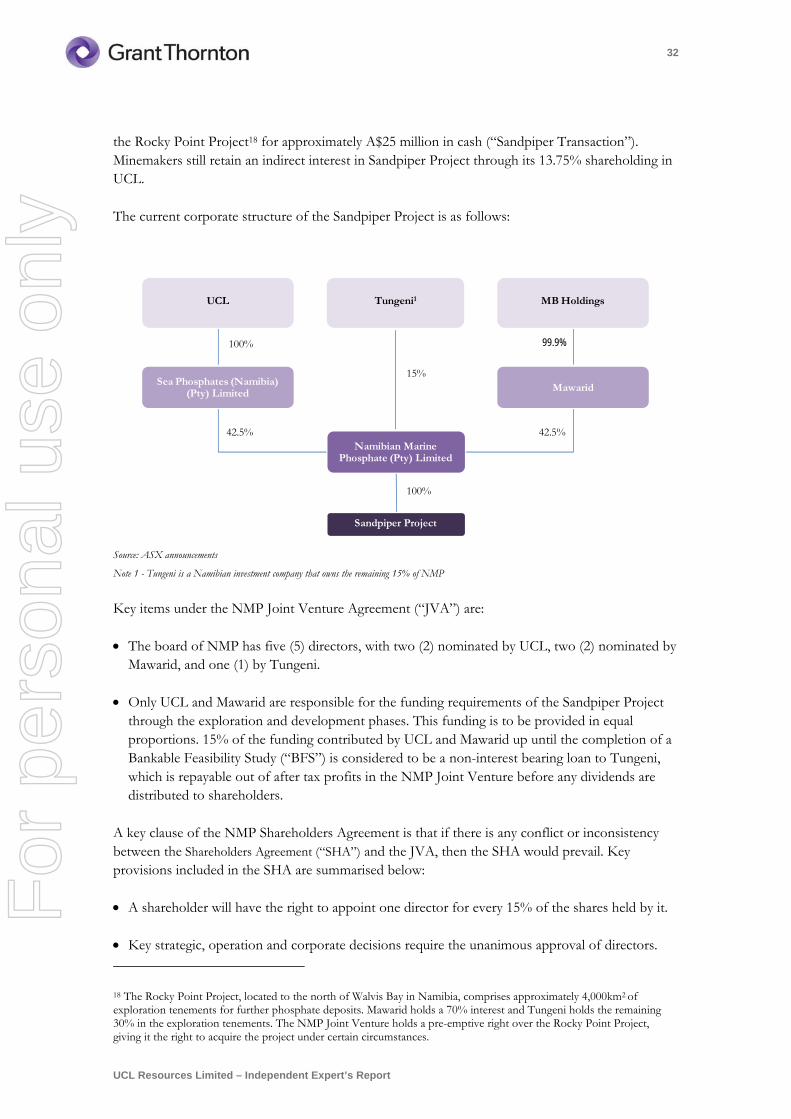
32
UCL Resources Limited – Independent Expert’s Report
the Rocky Point Project18 for approximately A$25 million in cash (“Sandpiper Transaction”). Minemakers still retain an indirect interest in Sandpiper Project through its 13.75% shareholding in UCL.
The current corporate structure of the Sandpiper Project is as follows:
Source: ASX announcements
Note 1 - Tungeni is a Namibian investment company that owns the remaining 15% of NMP
Key items under the NMP Joint Venture Agreement (“JVA”) are:
The board of NMP has five (5) directors, with two (2) nominated by UCL, two (2) nominated by Mawarid, and one (1) by Tungeni.
Only UCL and Mawarid are responsible for the funding requirements of the Sandpiper Project through the exploration and development phases. This funding is to be provided in equal proportions. 15% of the funding contributed by UCL and Mawarid up until the completion of a Bankable Feasibility Study (“BFS”) is considered to be a non-interest bearing loan to Tungeni, which is repayable out of after tax profits in the NMP Joint Venture before any dividends are distributed to shareholders.
A key clause of the NMP Shareholders Agreement is that if there is any conflict or inconsistency between the Shareholders Agreement (“SHA”) and the JVA, then the SHA would prevail. Key provisions included in the SHA are summarised below:
A shareholder will have the right to appoint one director for every 15% of the shares held by it.
Key strategic, operation and corporate decisions require the unanimous approval of directors.
18 The Rocky Point Project, located to the north of Walvis Bay in Namibia, comprises approximately 4,000km2 of exploration tenements for further phosphate deposits. Mawarid holds a 70% interest and Tungeni holds the remaining 30% in the exploration tenements. The NMP Joint Venture holds a pre-emptive right over the Rocky Point Project, giving it the right to acquire the project under certain circumstances.
100% 100%
15%
42.5% 42.5%
100%
UCL
Sea Phosphates (Namibia) (Pty) Limited
MB Holdings
Mawarid
Tungeni1
Namibian Marine Phosphate (Pty) Limited
Sandpiper Project
99.9%
For
per
sona
l use
onl
y
33
UCL Resources Limited – Independent Expert’s Report
If any shareholder fails to provide their share of funds upon request from the company, their shareholding is reduced and the respective shareholding of the other shareholders increases pro-rata on payment of such default amount.
No shareholder of NMP can engage in further marine phosphate exploration or exploitation in Namibia, apart from the exploration on the Rocky Point Project19 owned by Mawarid and Tungeni. The NMP Joint Venture holds a pre-emptive right over the Rocky Point Project, giving it the right to acquire the project under certain circumstances, including if a decision is made to proceed to completion of a DFS, a mining license is applied for, or an offer is made by a third party to purchase the project.
Pre-emptive, non-compete, tag-along and drag-along rights customary for this type of agreement.
4.2.2 Mehdiabad Zinc-Lead-Silver Project
The Mehdiabad Project is an exploration project predominantly for zinc, lead and silver. It is located in central Iran, approximately 80km southeast of the provincial city Yazd. In 1999, an Iranian joint venture company called Mehdiabad Zinc Company (“MZC”) was established and applied for and was granted an exploration license for the Mehdiabad Project. The shareholders of MZC at the time were the Iranian Mines and Mining Industries Development and Renovation Organisation (“IMIDRO”) (48.0%), UCL (24.5%), Itok GmbH (“Itok”) (24.5%) and other minority shareholders (3.0%). On 5 December 2006, UCL received a letter from IMIDRO outlining that they had terminated various agreements between the shareholders of MZC relating to the Mehdiabad Project, due to UCL failing to fulfill and complete their obligations under the agreements. UCL believed that the agreements were invalidly terminated and the ownership of the Mehdiabad Project entered into dispute. In December 2010, IMIDRO divested its 48.0% holding in MZC to Karoun Dez Dasht (“KDD Group”) and other minority shareholders. IMIDRO holds an Exploitation License to enter into a Memorandum of Understanding (“MoU”) for the operation of the Mehdiabad Project. In the event that the MoU is not formalised, UCL will explore the possibility of trying to resolve the matter through arbitration. In September 2012, MZC entered into a 25-year production agreement with IMIDRO. The agreement will enable MZC to develop an operation at the Mehdiabad Project with an estimated target production of up to 200,000 tonnes of zinc ingots and concentrate per annum. Under the agreement, IMIDRO has agreed to assist MZC with obtaining any permit, certificate or confirmation required for the project. To date, UCL has invested A$16.8 million on exploration and feasibility activities relating to the Mehdiabad Project which was fully impaired on the UCL balance sheet. No exploration activities on the project have occurred since 2008.
19 The Rocky Point Project, located to the north of Walvis Bay in Namibia, comprises approximately 4,000km2 of exploration tenements for further phosphate deposits. Mawarid holds a 70% interest and Tungeni holds the remaining 30% in the exploration tenements.
For
per
sona
l use
onl
y
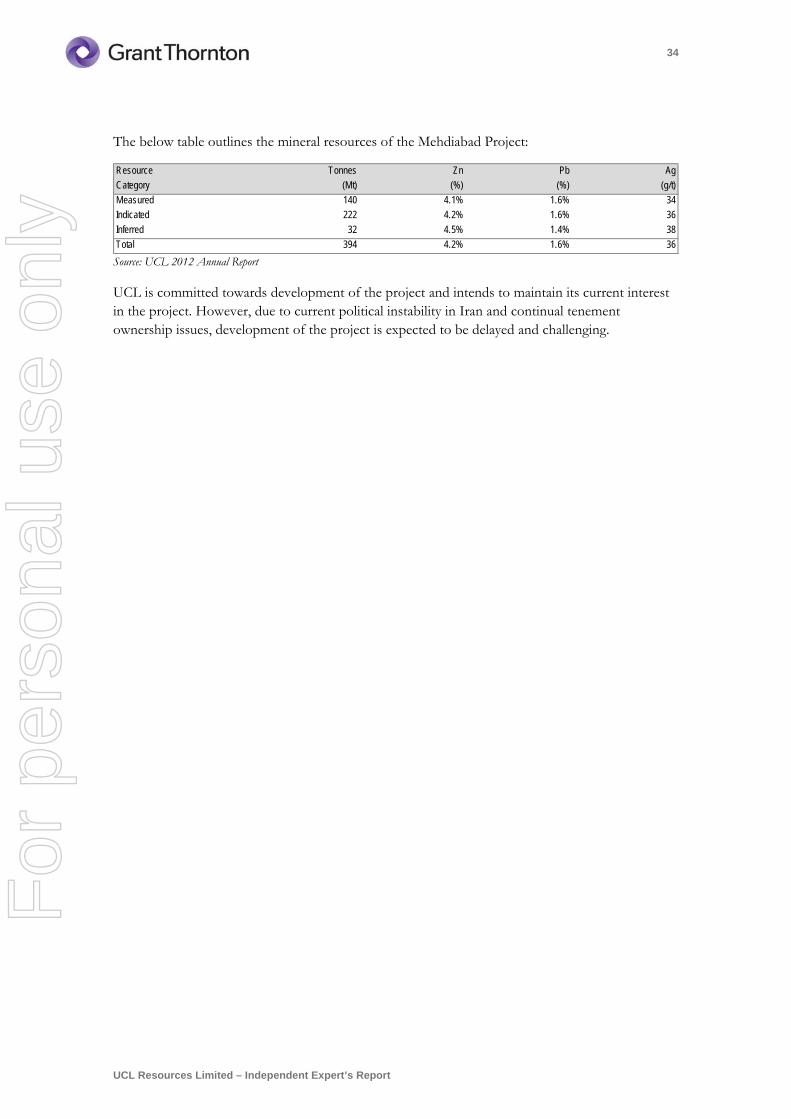
34
UCL Resources Limited – Independent Expert’s Report
The below table outlines the mineral resources of the Mehdiabad Project:
Source: UCL 2012 Annual Report
UCL is committed towards development of the project and intends to maintain its current interest in the project. However, due to current political instability in Iran and continual tenement ownership issues, development of the project is expected to be delayed and challenging.
Resource Tonnes Zn Pb Ag
Category (Mt) (%) (%) (g/t)
Measured 140 4.1% 1.6% 34
Indicated 222 4.2% 1.6% 36
Inferred 32 4.5% 1.4% 38
Total 394 4.2% 1.6% 36
For
per
sona
l use
onl
y
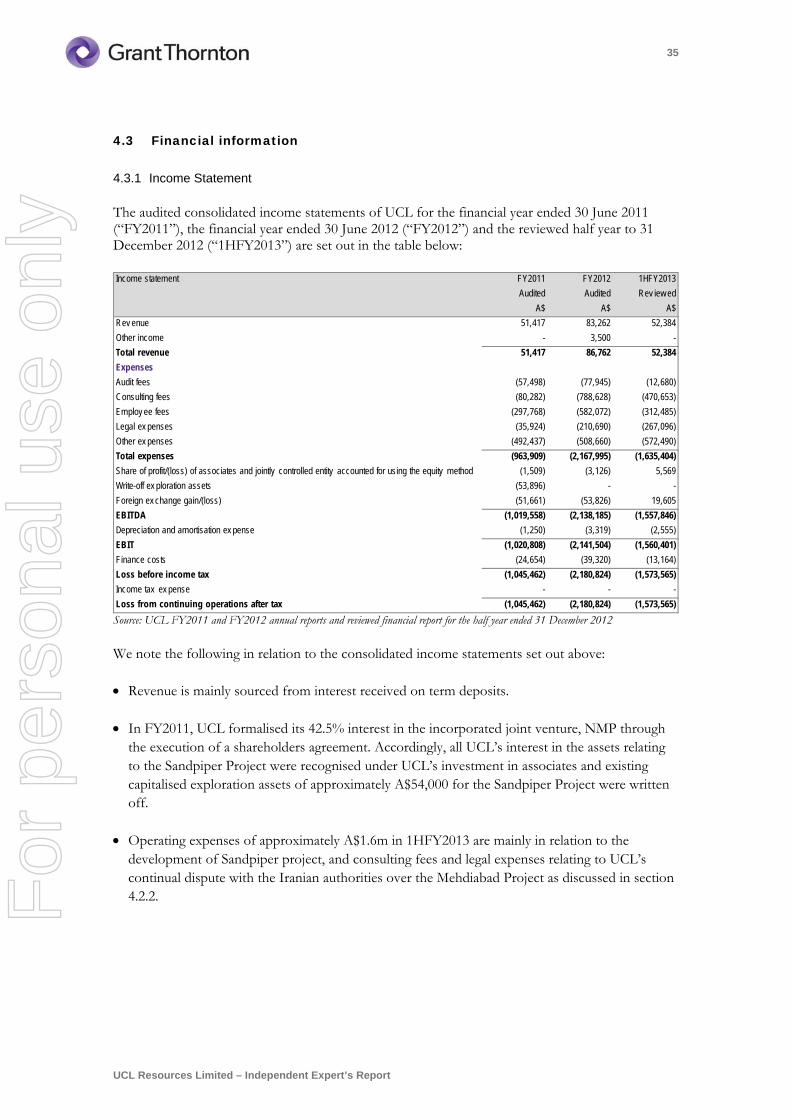
35
UCL Resources Limited – Independent Expert’s Report
4.3 Financial information
4.3.1 Income Statement
The audited consolidated income statements of UCL for the financial year ended 30 June 2011 (“FY2011”), the financial year ended 30 June 2012 (“FY2012”) and the reviewed half year to 31 December 2012 (“1HFY2013”) are set out in the table below:
Source: UCL FY2011 and FY2012 annual reports and reviewed financial report for the half year ended 31 December 2012
We note the following in relation to the consolidated income statements set out above:
Revenue is mainly sourced from interest received on term deposits.
In FY2011, UCL formalised its 42.5% interest in the incorporated joint venture, NMP through the execution of a shareholders agreement. Accordingly, all UCL’s interest in the assets relating to the Sandpiper Project were recognised under UCL’s investment in associates and existing capitalised exploration assets of approximately A$54,000 for the Sandpiper Project were written off.
Operating expenses of approximately A$1.6m in 1HFY2013 are mainly in relation to the development of Sandpiper project, and consulting fees and legal expenses relating to UCL’s continual dispute with the Iranian authorities over the Mehdiabad Project as discussed in section 4.2.2.
Income statement FY2011 FY2012 1HFY2013
Audited Audited Rev iew ed
A$ A$ A$
Rev enue 51,417 83,262 52,384
Other income - 3,500 -
Total revenue 51,417 86,762 52,384
Expenses
Audit fees (57,498) (77,945) (12,680)
Consulting fees (80,282) (788,628) (470,653)
Employ ee fees (297,768) (582,072) (312,485)
Legal ex penses (35,924) (210,690) (267,096)
Other ex penses (492,437) (508,660) (572,490)
Total expenses (963,909) (2,167,995) (1,635,404)
Share of profit/(loss) of associates and jointly controlled entity accounted for using the equity method (1,509) (3,126) 5,569
Write-off ex ploration assets (53,896) - -
Foreign ex change gain/(loss) (51,661) (53,826) 19,605
EBITDA (1,019,558) (2,138,185) (1,557,846)
Depreciation and amortisation ex pense (1,250) (3,319) (2,555)
EBIT (1,020,808) (2,141,504) (1,560,401)
Finance costs (24,654) (39,320) (13,164)
Loss before income tax (1,045,462) (2,180,824) (1,573,565)
Income tax ex pense - - -
Loss from continuing operations after tax (1,045,462) (2,180,824) (1,573,565)
For
per
sona
l use
onl
y
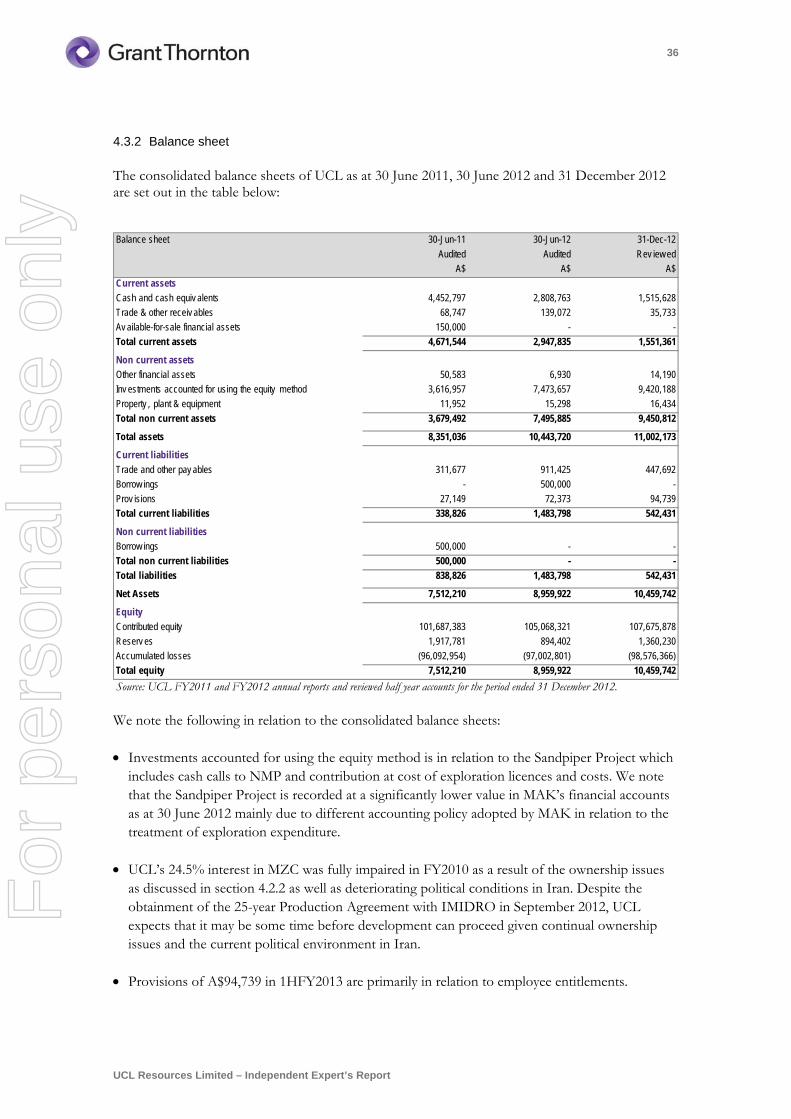
36
UCL Resources Limited – Independent Expert’s Report
4.3.2 Balance sheet
The consolidated balance sheets of UCL as at 30 June 2011, 30 June 2012 and 31 December 2012 are set out in the table below:
Source: UCL FY2011 and FY2012 annual reports and reviewed half year accounts for the period ended 31 December 2012.
We note the following in relation to the consolidated balance sheets:
Investments accounted for using the equity method is in relation to the Sandpiper Project which includes cash calls to NMP and contribution at cost of exploration licences and costs. We note that the Sandpiper Project is recorded at a significantly lower value in MAK’s financial accounts as at 30 June 2012 mainly due to different accounting policy adopted by MAK in relation to the treatment of exploration expenditure.
UCL’s 24.5% interest in MZC was fully impaired in FY2010 as a result of the ownership issues as discussed in section 4.2.2 as well as deteriorating political conditions in Iran. Despite the obtainment of the 25-year Production Agreement with IMIDRO in September 2012, UCL expects that it may be some time before development can proceed given continual ownership issues and the current political environment in Iran.
Provisions of A$94,739 in 1HFY2013 are primarily in relation to employee entitlements.
Balance sheet 30-Jun-11 30-Jun-12 31-Dec-12
Audited Audited Rev iew ed
A$ A$ A$
Current assets
Cash and cash equiv alents 4,452,797 2,808,763 1,515,628
Trade & other receiv ables 68,747 139,072 35,733
Av ailable-for-sale financial assets 150,000 - -
Total current assets 4,671,544 2,947,835 1,551,361
Non current assets
Other financial assets 50,583 6,930 14,190
Inv estments accounted for using the equity method 3,616,957 7,473,657 9,420,188
Property , plant & equipment 11,952 15,298 16,434
Total non current assets 3,679,492 7,495,885 9,450,812
Total assets 8,351,036 10,443,720 11,002,173
Current liabilities
Trade and other pay ables 311,677 911,425 447,692
Borrow ings - 500,000 -
Prov isions 27,149 72,373 94,739
Total current liabilities 338,826 1,483,798 542,431
Non current liabilities
Borrow ings 500,000 - -
Total non current liabilities 500,000 - -
Total liabilities 838,826 1,483,798 542,431
Net Assets 7,512,210 8,959,922 10,459,742
Equity
Contributed equity 101,687,383 105,068,321 107,675,878
Reserv es 1,917,781 894,402 1,360,230
Accumulated losses (96,092,954) (97,002,801) (98,576,366)
Total equity 7,512,210 8,959,922 10,459,742
For
per
sona
l use
onl
y
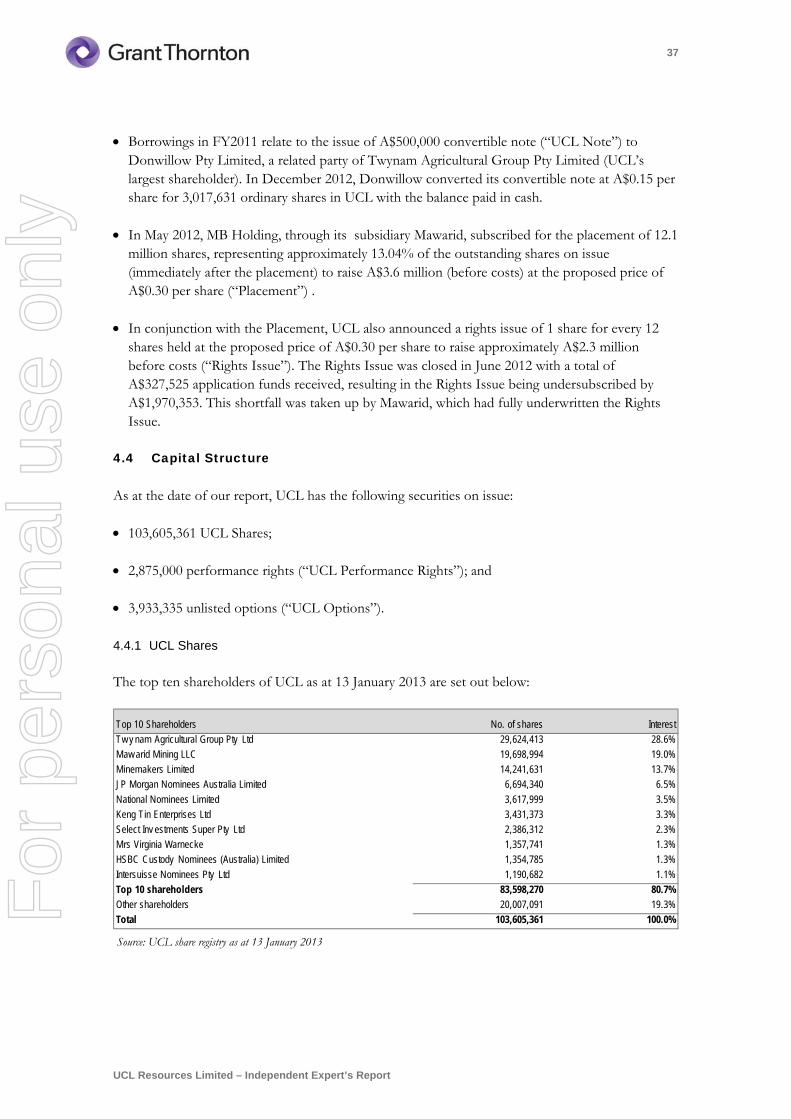
37
UCL Resources Limited – Independent Expert’s Report
Borrowings in FY2011 relate to the issue of A$500,000 convertible note (“UCL Note”) to Donwillow Pty Limited, a related party of Twynam Agricultural Group Pty Limited (UCL’s largest shareholder). In December 2012, Donwillow converted its convertible note at A$0.15 per share for 3,017,631 ordinary shares in UCL with the balance paid in cash.
In May 2012, MB Holding, through its subsidiary Mawarid, subscribed for the placement of 12.1 million shares, representing approximately 13.04% of the outstanding shares on issue (immediately after the placement) to raise A$3.6 million (before costs) at the proposed price of A$0.30 per share (“Placement”) .
In conjunction with the Placement, UCL also announced a rights issue of 1 share for every 12 shares held at the proposed price of A$0.30 per share to raise approximately A$2.3 million before costs (“Rights Issue”). The Rights Issue was closed in June 2012 with a total of A$327,525 application funds received, resulting in the Rights Issue being undersubscribed by A$1,970,353. This shortfall was taken up by Mawarid, which had fully underwritten the Rights Issue.
4.4 Capital Structure
As at the date of our report, UCL has the following securities on issue:
103,605,361 UCL Shares;
2,875,000 performance rights (“UCL Performance Rights”); and
3,933,335 unlisted options (“UCL Options”).
4.4.1 UCL Shares
The top ten shareholders of UCL as at 13 January 2013 are set out below:
Source: UCL share registry as at 13 January 2013
Top 10 Shareholders No. of shares Interest
Tw y nam Agricultural Group Pty Ltd 29,624,413 28.6%
Maw arid Mining LLC 19,698,994 19.0%
Minemakers Limited 14,241,631 13.7%
JP Morgan Nominees Australia Limited 6,694,340 6.5%
National Nominees Limited 3,617,999 3.5%
Keng Tin Enterprises Ltd 3,431,373 3.3%
Select Inv estments Super Pty Ltd 2,386,312 2.3%
Mrs Virginia Warnecke 1,357,741 1.3%
HSBC Custody Nominees (Australia) Limited 1,354,785 1.3%
Intersuisse Nominees Pty Ltd 1,190,682 1.1%
Top 10 shareholders 83,598,270 80.7%
Other shareholders 20,007,091 19.3%
Total 103,605,361 100.0%For
per
sona
l use
onl
y
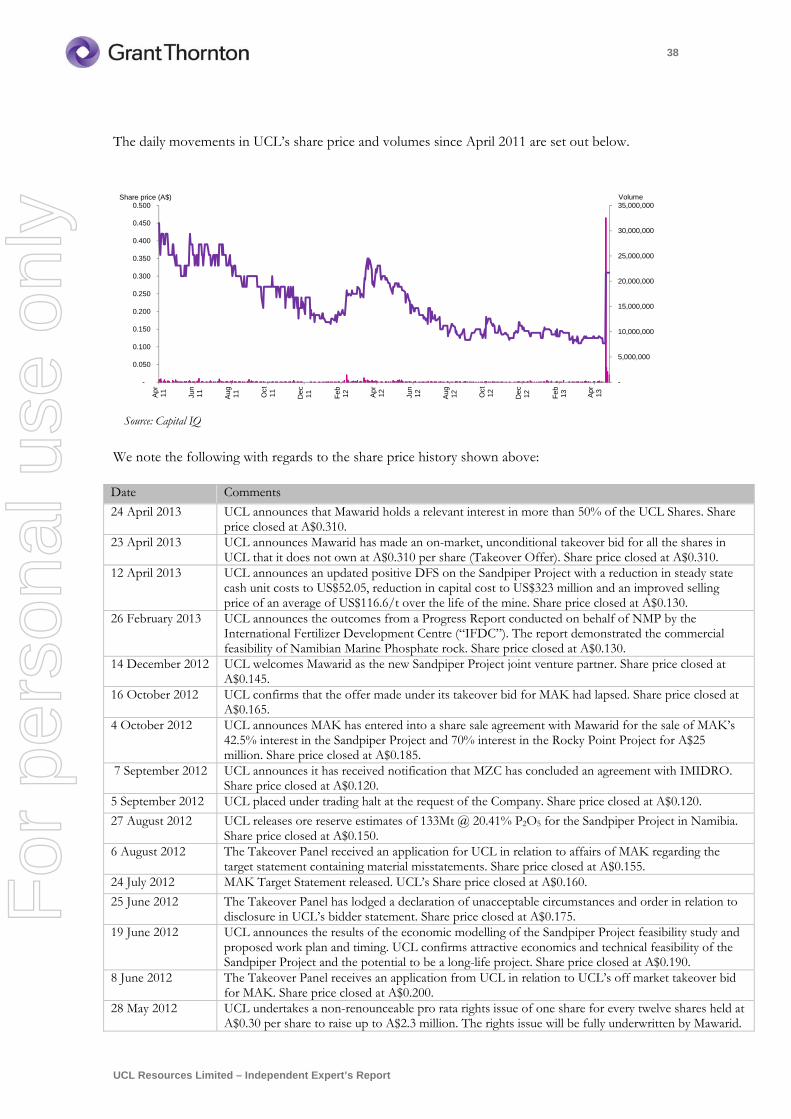
38
UCL Resources Limited – Independent Expert’s Report
The daily movements in UCL’s share price and volumes since April 2011 are set out below.
Source: Capital IQ
We note the following with regards to the share price history shown above:
Date Comments
24 April 2013 UCL announces that Mawarid holds a relevant interest in more than 50% of the UCL Shares. Share price closed at A$0.310.
23 April 2013 UCL announces Mawarid has made an on-market, unconditional takeover bid for all the shares in UCL that it does not own at A$0.310 per share (Takeover Offer). Share price closed at A$0.310.
12 April 2013 UCL announces an updated positive DFS on the Sandpiper Project with a reduction in steady state cash unit costs to US$52.05, reduction in capital cost to US$323 million and an improved selling price of an average of US$116.6/t over the life of the mine. Share price closed at A$0.130.
26 February 2013 UCL announces the outcomes from a Progress Report conducted on behalf of NMP by the International Fertilizer Development Centre (“IFDC”). The report demonstrated the commercial feasibility of Namibian Marine Phosphate rock. Share price closed at A$0.130.
14 December 2012 UCL welcomes Mawarid as the new Sandpiper Project joint venture partner. Share price closed at A$0.145.
16 October 2012 UCL confirms that the offer made under its takeover bid for MAK had lapsed. Share price closed at A$0.165.
4 October 2012 UCL announces MAK has entered into a share sale agreement with Mawarid for the sale of MAK’s42.5% interest in the Sandpiper Project and 70% interest in the Rocky Point Project for A$25 million. Share price closed at A$0.185.
7 September 2012 UCL announces it has received notification that MZC has concluded an agreement with IMIDRO. Share price closed at A$0.120.
5 September 2012 UCL placed under trading halt at the request of the Company. Share price closed at A$0.120.
27 August 2012 UCL releases ore reserve estimates of 133Mt @ 20.41% P2O5 for the Sandpiper Project in Namibia. Share price closed at A$0.150.
6 August 2012 The Takeover Panel received an application for UCL in relation to affairs of MAK regarding the target statement containing material misstatements. Share price closed at A$0.155.
24 July 2012 MAK Target Statement released. UCL’s Share price closed at A$0.160.
25 June 2012 The Takeover Panel has lodged a declaration of unacceptable circumstances and order in relation to disclosure in UCL’s bidder statement. Share price closed at A$0.175.
19 June 2012 UCL announces the results of the economic modelling of the Sandpiper Project feasibility study and proposed work plan and timing. UCL confirms attractive economics and technical feasibility of the Sandpiper Project and the potential to be a long-life project. Share price closed at A$0.190.
8 June 2012 The Takeover Panel receives an application from UCL in relation to UCL’s off market takeover bid for MAK. Share price closed at A$0.200.
28 May 2012 UCL undertakes a non-renounceable pro rata rights issue of one share for every twelve shares held at A$0.30 per share to raise up to A$2.3 million. The rights issue will be fully underwritten by Mawarid.
-
5,000,000
10,000,000
15,000,000
20,000,000
25,000,000
30,000,000
35,000,000
Apr 11 Jun 11 Aug 11 Oct
11 Dec 11 Feb 12 Apr 12 Jun 12 Aug 12 Oct
12 Dec 12 Feb 13 Apr 13
-
0.050
0.100
0.150
0.200
0.250
0.300
0.350
0.400
0.450
0.500Share price (A$) Volume
For
per
sona
l use
onl
y
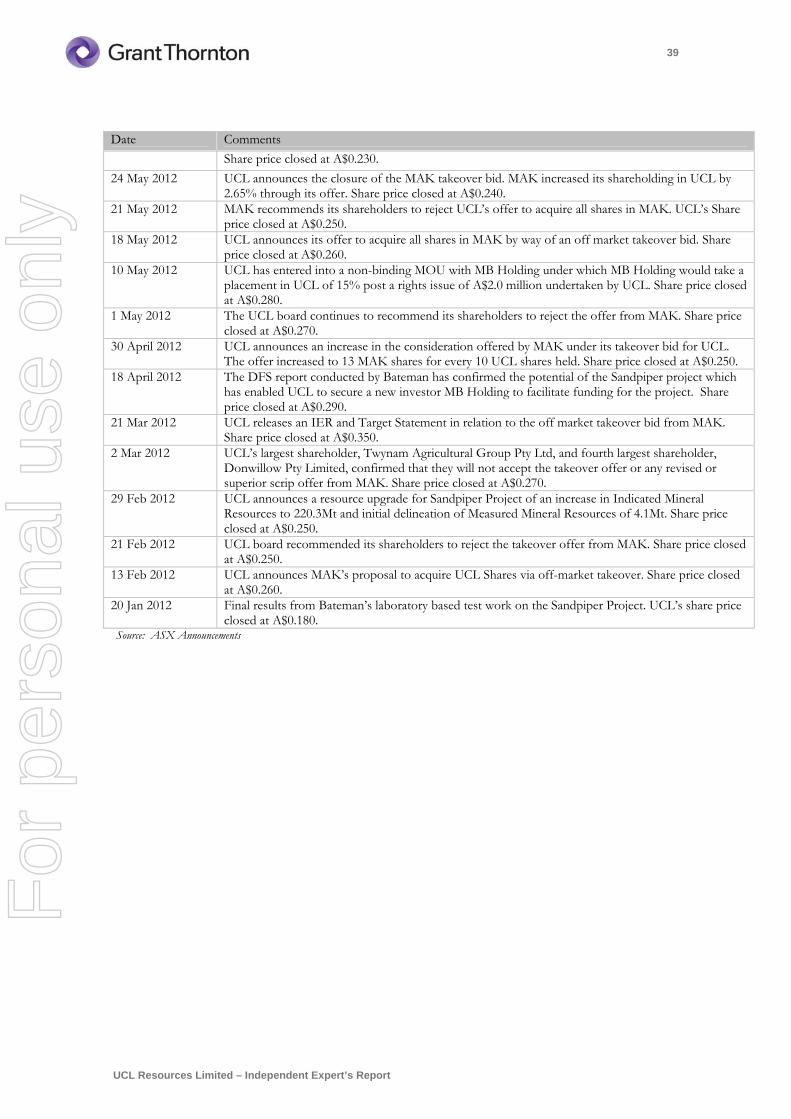
39
UCL Resources Limited – Independent Expert’s Report
Date Comments
Share price closed at A$0.230.
24 May 2012 UCL announces the closure of the MAK takeover bid. MAK increased its shareholding in UCL by 2.65% through its offer. Share price closed at A$0.240.
21 May 2012 MAK recommends its shareholders to reject UCL’s offer to acquire all shares in MAK. UCL’s Share price closed at A$0.250.
18 May 2012 UCL announces its offer to acquire all shares in MAK by way of an off market takeover bid. Share price closed at A$0.260.
10 May 2012 UCL has entered into a non-binding MOU with MB Holding under which MB Holding would take a placement in UCL of 15% post a rights issue of A$2.0 million undertaken by UCL. Share price closed at A$0.280.
1 May 2012 The UCL board continues to recommend its shareholders to reject the offer from MAK. Share price closed at A$0.270.
30 April 2012 UCL announces an increase in the consideration offered by MAK under its takeover bid for UCL. The offer increased to 13 MAK shares for every 10 UCL shares held. Share price closed at A$0.250.
18 April 2012 The DFS report conducted by Bateman has confirmed the potential of the Sandpiper project which has enabled UCL to secure a new investor MB Holding to facilitate funding for the project. Share price closed at A$0.290.
21 Mar 2012 UCL releases an IER and Target Statement in relation to the off market takeover bid from MAK. Share price closed at A$0.350.
2 Mar 2012 UCL’s largest shareholder, Twynam Agricultural Group Pty Ltd, and fourth largest shareholder, Donwillow Pty Limited, confirmed that they will not accept the takeover offer or any revised or superior scrip offer from MAK. Share price closed at A$0.270.
29 Feb 2012 UCL announces a resource upgrade for Sandpiper Project of an increase in Indicated Mineral Resources to 220.3Mt and initial delineation of Measured Mineral Resources of 4.1Mt. Share price closed at A$0.250.
21 Feb 2012 UCL board recommended its shareholders to reject the takeover offer from MAK. Share price closed at A$0.250.
13 Feb 2012 UCL announces MAK’s proposal to acquire UCL Shares via off-market takeover. Share price closed at A$0.260.
20 Jan 2012 Final results from Bateman’s laboratory based test work on the Sandpiper Project. UCL’s share price closed at A$0.180.
Source: ASX Announcements
For
per
sona
l use
onl
y
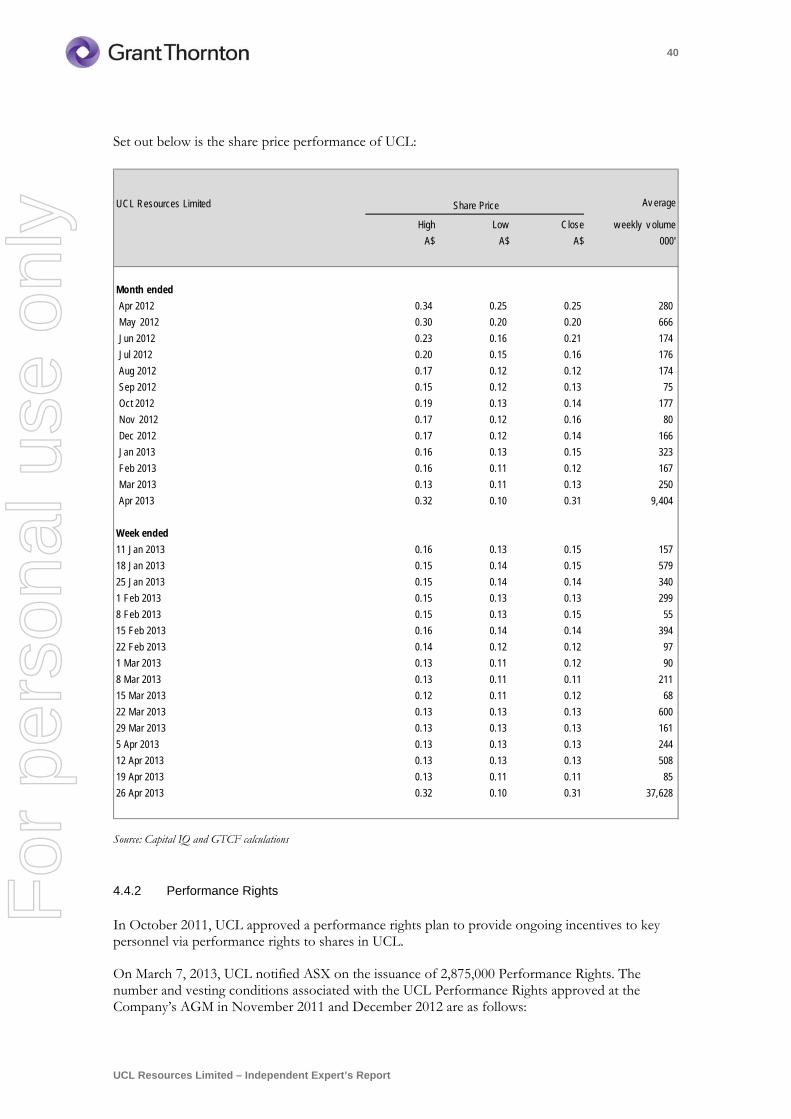
40
UCL Resources Limited – Independent Expert’s Report
Set out below is the share price performance of UCL:
Source: Capital IQ and GTCF calculations
4.4.2 Performance Rights
In October 2011, UCL approved a performance rights plan to provide ongoing incentives to key personnel via performance rights to shares in UCL.
On March 7, 2013, UCL notified ASX on the issuance of 2,875,000 Performance Rights. The number and vesting conditions associated with the UCL Performance Rights approved at the Company’s AGM in November 2011 and December 2012 are as follows:
Av erage
High Low Close w eekly v olume
A$ A$ A$ 000'
Month ended
Apr 2012 29 30/04/2012 0.34 0.25 0.25 280
May 2012 30 31/05/2012 0.30 0.20 0.20 666
Jun 2012 29 30/06/2012 0.23 0.16 0.21 174
Jul 2012 30 31/07/2012 0.20 0.15 0.16 176
Aug 2012 30 31/08/2012 0.17 0.12 0.12 174
Sep 2012 29 30/09/2012 0.15 0.12 0.13 75
Oct 2012 30 31/10/2012 0.19 0.13 0.14 177
Nov 2012 29 30/11/2012 0.17 0.12 0.16 80
Dec 2012 30 31/12/2012 0.17 0.12 0.14 166
Jan 2013 30 31/01/2013 0.16 0.13 0.15 323
Feb 2013 27 28/02/2013 0.16 0.11 0.12 167
Mar 2013 30 31/03/2013 0.13 0.11 0.13 250
Apr 2013 29 30/04/2013 0.32 0.10 0.31 9,404
Week ended
11 Jan 2013 0.16 0.13 0.15 157
18 Jan 2013 0.15 0.14 0.15 579
25 Jan 2013 0.15 0.14 0.14 340
1 Feb 2013 0.15 0.13 0.13 299
8 Feb 2013 0.15 0.13 0.15 55
15 Feb 2013 0.16 0.14 0.14 394
22 Feb 2013 0.14 0.12 0.12 97
1 Mar 2013 0.13 0.11 0.12 90
8 Mar 2013 0.13 0.11 0.11 211
15 Mar 2013 0.12 0.11 0.12 68
22 Mar 2013 0.13 0.13 0.13 600
29 Mar 2013 0.13 0.13 0.13 161
5 Apr 2013 0.13 0.13 0.13 244
12 Apr 2013 0.13 0.13 0.13 508
19 Apr 2013 0.13 0.11 0.11 85
26 Apr 2013 0.32 0.10 0.31 37,628
UCL Resources Limited Share Price
For
per
sona
l use
onl
y
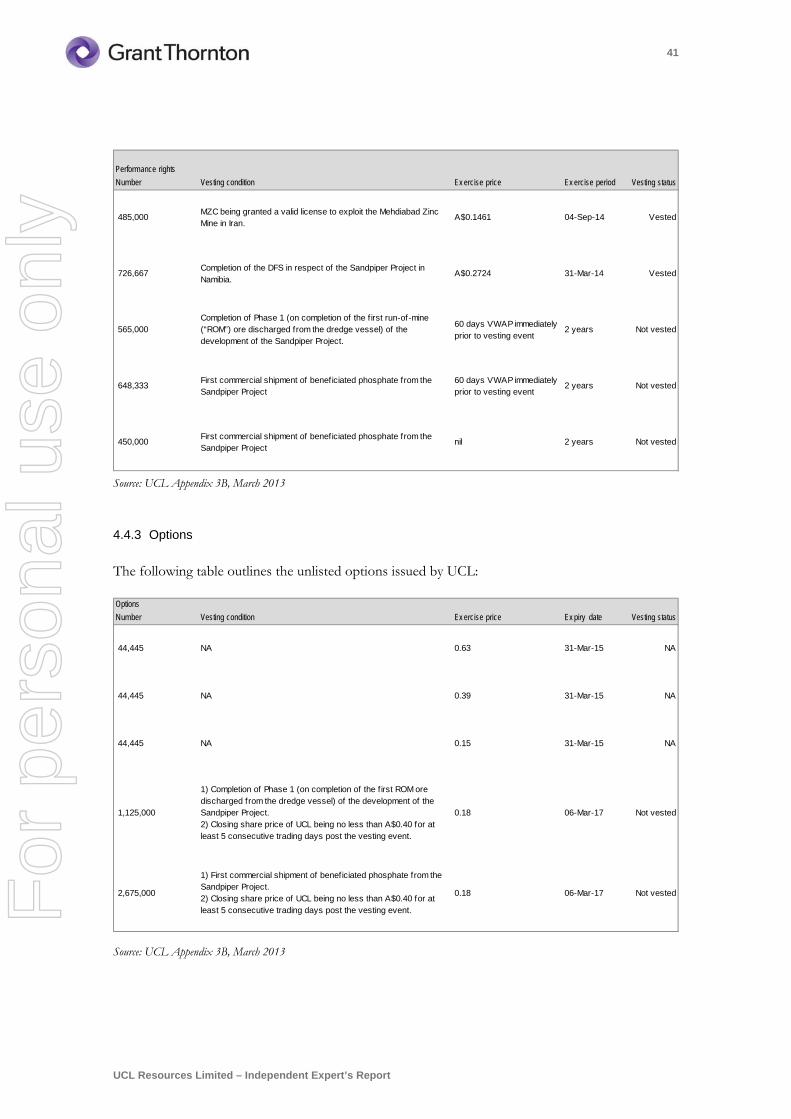
41
UCL Resources Limited – Independent Expert’s Report
Source: UCL Appendix 3B, March 2013
4.4.3 Options
The following table outlines the unlisted options issued by UCL:
Source: UCL Appendix 3B, March 2013
Number Vesting condition Ex ercise price Ex ercise period Vesting status
485,000 MZC being granted a valid license to exploit the Mehdiabad Zinc Mine in Iran.
A$0.1461 04-Sep-14 Vested
726,667 Completion of the DFS in respect of the Sandpiper Project in Namibia.
A$0.2724 31-Mar-14 Vested
565,000Completion of Phase 1 (on completion of the f irst run-of-mine (“ROM”) ore discharged from the dredge vessel) of the development of the Sandpiper Project.
60 days VWAP immediately prior to vesting event
2 years Not vested
648,333 First commercial shipment of beneficiated phosphate from the Sandpiper Project
60 days VWAP immediately prior to vesting event
2 years Not vested
450,000 First commercial shipment of beneficiated phosphate from the Sandpiper Project
nil 2 years Not vested
Performance rights
Number Vesting condition Ex ercise price Ex piry date Vesting status
44,445 NA 0.63 31-Mar-15 NA
44,445 NA 0.39 31-Mar-15 NA
44,445 NA 0.15 31-Mar-15 NA
1,125,000
1) Completion of Phase 1 (on completion of the f irst ROM ore discharged from the dredge vessel) of the development of the Sandpiper Project. 2) Closing share price of UCL being no less than A$0.40 for at least 5 consecutive trading days post the vesting event.
0.18 06-Mar-17 Not vested
2,675,000
1) First commercial shipment of beneficiated phosphate from the Sandpiper Project.2) Closing share price of UCL being no less than A$0.40 for at least 5 consecutive trading days post the vesting event.
0.18 06-Mar-17 Not vested
Options
For
per
sona
l use
onl
y
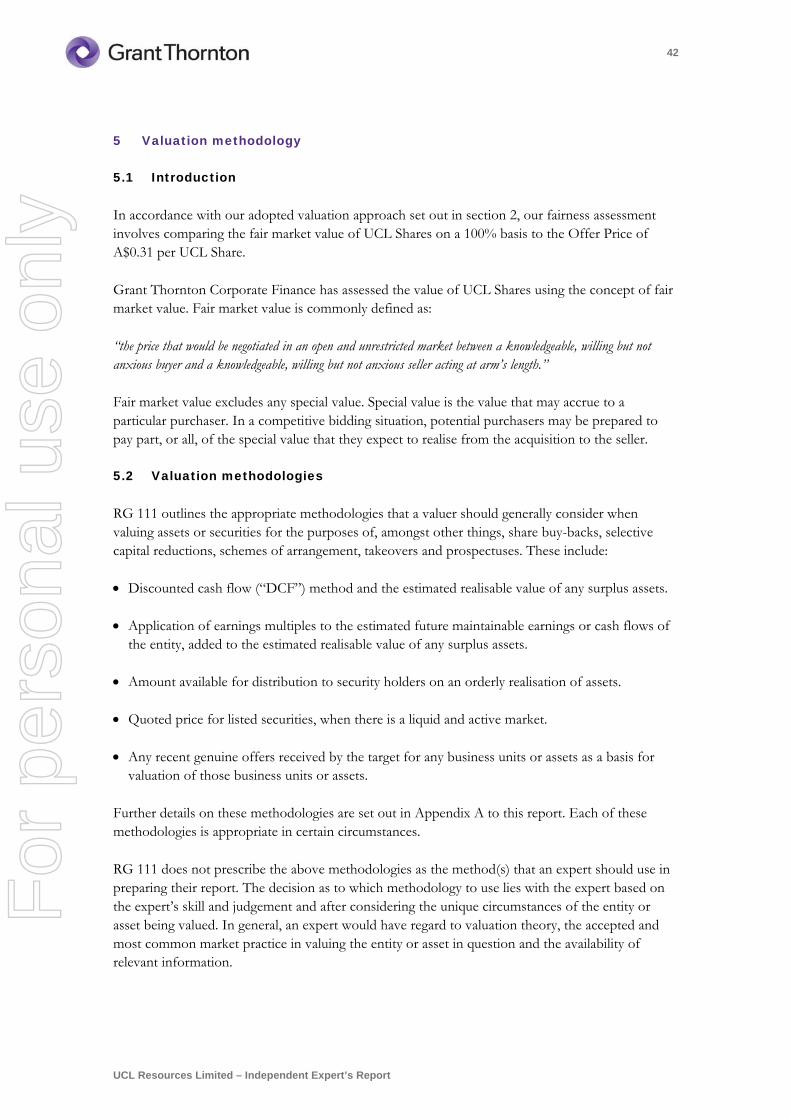
42
UCL Resources Limited – Independent Expert’s Report
5 Valuation methodology
5.1 Introduction
In accordance with our adopted valuation approach set out in section 2, our fairness assessment involves comparing the fair market value of UCL Shares on a 100% basis to the Offer Price of A$0.31 per UCL Share.
Grant Thornton Corporate Finance has assessed the value of UCL Shares using the concept of fair market value. Fair market value is commonly defined as:
“the price that would be negotiated in an open and unrestricted market between a knowledgeable, willing but not anxious buyer and a knowledgeable, willing but not anxious seller acting at arm’s length.”
Fair market value excludes any special value. Special value is the value that may accrue to a particular purchaser. In a competitive bidding situation, potential purchasers may be prepared to pay part, or all, of the special value that they expect to realise from the acquisition to the seller.
5.2 Valuation methodologies
RG 111 outlines the appropriate methodologies that a valuer should generally consider when valuing assets or securities for the purposes of, amongst other things, share buy-backs, selective capital reductions, schemes of arrangement, takeovers and prospectuses. These include:
Discounted cash flow (“DCF”) method and the estimated realisable value of any surplus assets.
Application of earnings multiples to the estimated future maintainable earnings or cash flows of the entity, added to the estimated realisable value of any surplus assets.
Amount available for distribution to security holders on an orderly realisation of assets.
Quoted price for listed securities, when there is a liquid and active market.
Any recent genuine offers received by the target for any business units or assets as a basis for valuation of those business units or assets.
Further details on these methodologies are set out in Appendix A to this report. Each of these methodologies is appropriate in certain circumstances.
RG 111 does not prescribe the above methodologies as the method(s) that an expert should use in preparing their report. The decision as to which methodology to use lies with the expert based on the expert’s skill and judgement and after considering the unique circumstances of the entity or asset being valued. In general, an expert would have regard to valuation theory, the accepted and most common market practice in valuing the entity or asset in question and the availability of relevant information.
For
per
sona
l use
onl
y
43
UCL Resources Limited – Independent Expert’s Report
5.3 Selected valuation methodology
Grant Thornton Corporate Finance has selected the market value of net assets and the see through value of UCL implied in the Sandpiper Transaction as the primary methodologies to assess UCL’s equity value in relation to the Takeover Offer. The market value of net assets is based on the sum of parts of UCL’s operating and exploration assets, and other assets and liabilities as set out in UCL’s reviewed balance sheet as at 31 December 2012.
The market value of UCL’s key asset being the Sandpiper Project was assessed using the DCF valuation method, given that:
Management of UCL has prepared long-term cash flow forecasts in relation to these assets based on the current level of ore reserves.
UCL has recently completed a DFS in relation to the Sandpiper Project.
Grant Thornton Corporate Finance has engaged Snowden to independently review the technical assumptions in relation to the long term forecast.
The DCF method is the most appropriate approach in valuing assets with a finite life such as mineral assets due to the depletion of ore reserves over time.
The DCF method is the most appropriate approach in reflecting the significant level of capital and time required for the development of mineral assets.
The DCF method is one of the most commonly used methodologies for the valuation of mineral assets.
In our assessment of the market value of net assets of UCL, we have:
Relied on Snowden’s Report with regards to the reasonableness of the technical operating assumptions for the Sandpiper Project.
Relied on Snowden’s assessment of the value of other exploration assets held by UCL and resources not included in the DFS.
Assessed the value of the other assets and liabilities of UCL.
Assessed the appropriate discount rates, phosphate prices and exchange rates to apply to the forecast cash flows.
Considered the market value of other securities on issue such as options and performance rights.
Deducted costs associated with the Takeover Offer.
Prior to reaching our valuation conclusions, we have considered the reasonableness of our valuation having regard to the market approach, specifically a rule of thumb valuation methodology based on a multiple of resources.
For
per
sona
l use
onl
y
44
UCL Resources Limited – Independent Expert’s Report
In addition, we have also considered the quoted share price of UCL and recent capital raisings undertaken by UCL.
5.3.1 Independent technical specialist
For the purpose of this report, Grant Thornton Corporate Finance has engaged Snowden to review and express an opinion on the reasonableness of the technical assumptions included in the DFS financial model provided to Grant Thornton Corporate Finance by UCL Management, and prepare a valuation of the exploration, development and mining assets of UCL not covered by the DFS financial model which was completed in accordance with the VALMIN Code20.
A copy of Snowden’s report is included as Appendix F to this report.
20 The VALMIN Code is binding on members of the Australasian Institute of Mining and Metallurgy when preparing public independent expert reports required by the Corporations Act concerning mineral and petroleum assets and securities. The purpose of the VALMIN Code is to provide a set of fundamental principles and supporting recommendations regarding good professional practice to assist those involved in the preparation of independent expert reports that are public and required for the assessment and/or valuation of mineral and petroleum assets and securities so that the resulting reports will be reliable, thorough, understandable and include all the material information required by investors and their advisers when making investment decisions.
For
per
sona
l use
onl
y
45
UCL Resources Limited – Independent Expert’s Report
6 Valuation assessment of UCL
As discussed in section 5.3, we have used the following methodologies to assess UCL’s equity value in relation to the Takeover Offer.
Market value of net assets;
See through value of UCL based on the Sandpiper Transaction.
6.1 Market value of net assets approach
In assessing the fair market value of UCL based on the market value of net assets approach, Grant Thornton Corporate Finance has aggregated the following:
Market value of UCL’s 42.5% interest in NMP i.e. Sandpiper Project;
Market value of UCL’s 24.5% interest in Mehdiabad Project;
Value of other assets (net of liabilities) as at the date of this report;
Deducted net present value of corporate overheads; and
Deducted costs associated with the Takeover Offer.
6.1.1 Sandpiper Project
For the purpose of our valuation of UCL’s 42.5% interest in the Sandpiper Project, we have assessed the fair market value of UCL interest in NMP based on the DCF methodology.
Management of UCL have provided the DFS financial model (“Financial Model”) in relation to the Sandpiper Project. The Financial Model is based on an operational plan of 23 years until 2035 having regard to the current level of ore reserves and it does not take into account potential extension of the life of mine based on current and future exploration or other existing resources. The market value of the exploration potential and resources not included in the DFS has been estimated separately by Snowden.
Grant Thornton Corporate Finance has engaged Snowden, to review and express an opinion on the reasonableness of the technical assumptions included in the Financial Model in relation to the reserves, production profile, ore grades, operating and capital expenditure for the Sandpiper Project.
Based on Snowden’s review of the Financial Model, Grant Thornton Corporate Finance has assessed the net present value of the Sandpiper Project using ungeared, nominal and post-tax cash flows, having regard to our assessment of the future phosphate prices, economic factors and discount rate.
Grant Thornton Corporate Finance has assessed UCL’s interest in the market value of the Sandpiper Project between A$54.5 million and A$66.2 million on a control basis. Our valuation assessment of the Sandpiper Project is before any dilutionary impact for future capital raising
For
per
sona
l use
onl
y
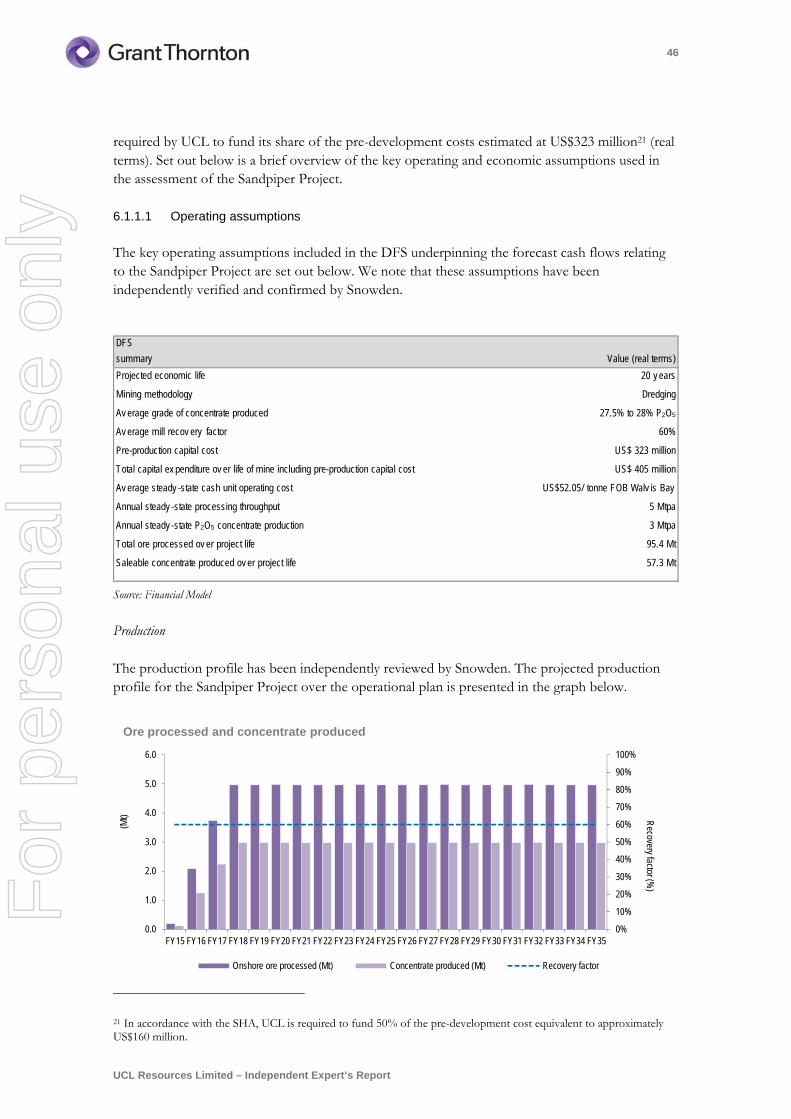
46
UCL Resources Limited – Independent Expert’s Report
required by UCL to fund its share of the pre-development costs estimated at US$323 million21 (real terms). Set out below is a brief overview of the key operating and economic assumptions used in the assessment of the Sandpiper Project.
6.1.1.1 Operating assumptions
The key operating assumptions included in the DFS underpinning the forecast cash flows relating to the Sandpiper Project are set out below. We note that these assumptions have been independently verified and confirmed by Snowden.
Source: Financial Model
Production
The production profile has been independently reviewed by Snowden. The projected production profile for the Sandpiper Project over the operational plan is presented in the graph below.
21 In accordance with the SHA, UCL is required to fund 50% of the pre-development cost equivalent to approximately US$160 million.
DFS
summary
Projected economic life 20 y ears
Mining methodology Dredging
Av erage grade of concentrate produced 27.5% to 28% P2O5
Av erage mill recov ery factor 60%
Pre-production capital cost US$ 323 million
Total capital ex penditure ov er life of mine including pre-production capital cost US$ 405 million
Av erage steady -state cash unit operating cost US$52.05/ tonne FOB Walv is Bay
Annual steady -state processing throughput 5 Mtpa
Annual steady -state P2O5 concentrate production 3 Mtpa
Total ore processed ov er project life 95.4 Mt
Saleable concentrate produced ov er project life 57.3 Mt
Value (real terms)
0%
10%
20%
30%
40%
50%
60%
70%
80%
90%
100%
0.0
1.0
2.0
3.0
4.0
5.0
6.0
FY15 FY16 FY17 FY18 FY19 FY20 FY21 FY22 FY23 FY24 FY25 FY26 FY27 FY28 FY29 FY30 FY31 FY32 FY33 FY34 FY35
Recovery factor (%
)
(Mt)
Ore processed and concentrate produced
Onshore ore processed (Mt) Concentrate produced (Mt) Recovery factor
For
per
sona
l use
onl
y
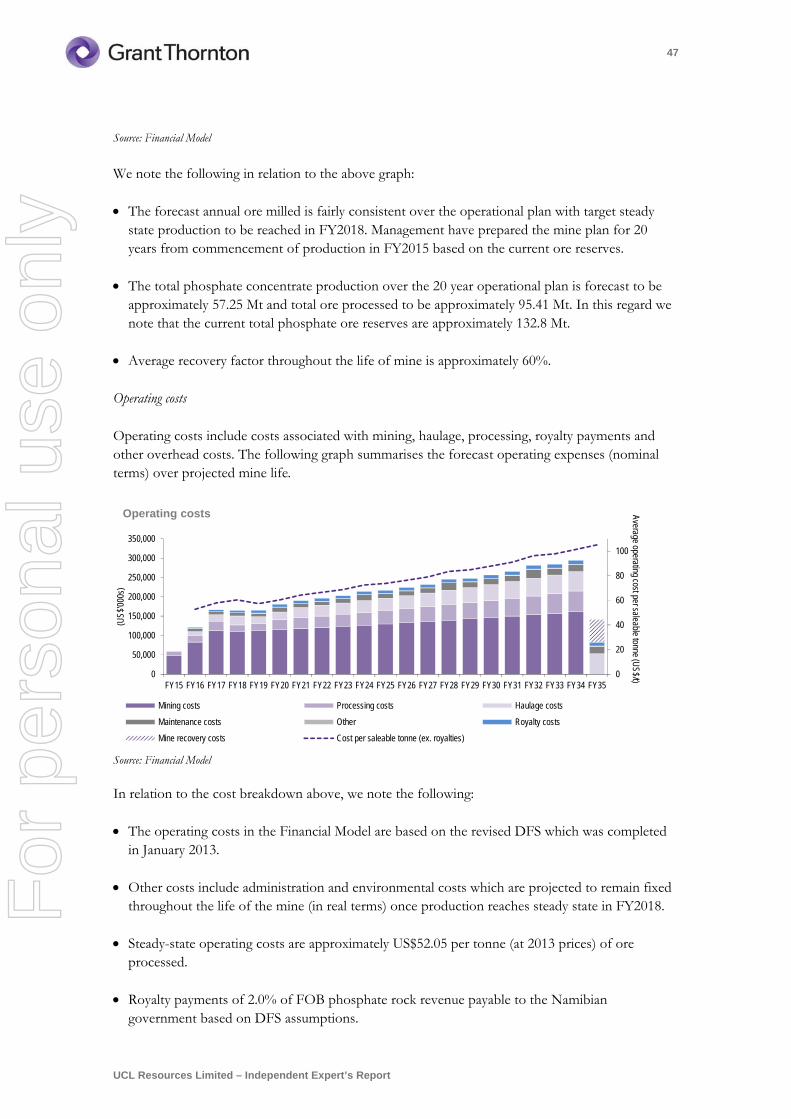
47
UCL Resources Limited – Independent Expert’s Report
Source: Financial Model
We note the following in relation to the above graph:
The forecast annual ore milled is fairly consistent over the operational plan with target steady state production to be reached in FY2018. Management have prepared the mine plan for 20 years from commencement of production in FY2015 based on the current ore reserves.
The total phosphate concentrate production over the 20 year operational plan is forecast to be approximately 57.25 Mt and total ore processed to be approximately 95.41 Mt. In this regard we note that the current total phosphate ore reserves are approximately 132.8 Mt.
Average recovery factor throughout the life of mine is approximately 60%.
Operating costs
Operating costs include costs associated with mining, haulage, processing, royalty payments and other overhead costs. The following graph summarises the forecast operating expenses (nominal terms) over projected mine life.
Source: Financial Model In relation to the cost breakdown above, we note the following:
The operating costs in the Financial Model are based on the revised DFS which was completed in January 2013.
Other costs include administration and environmental costs which are projected to remain fixed throughout the life of the mine (in real terms) once production reaches steady state in FY2018.
Steady-state operating costs are approximately US$52.05 per tonne (at 2013 prices) of ore processed.
Royalty payments of 2.0% of FOB phosphate rock revenue payable to the Namibian government based on DFS assumptions.
0
20
40
60
80
100
0
50,000
100,000
150,000
200,000
250,000
300,000
350,000
FY15 FY16 FY17 FY18 FY19 FY20 FY21 FY22 FY23 FY24 FY25 FY26 FY27 FY28 FY29 FY30 FY31 FY32 FY33 FY34 FY35
Average operating cost per saleable tonne (US$/t)
(US$
'000
s)
Operating costs
Mining costs Processing costs Haulage costs
Maintenance costs Other Royalty costs
Mine recovery costs Cost per saleable tonne (ex. royalties)
For
per
sona
l use
onl
y
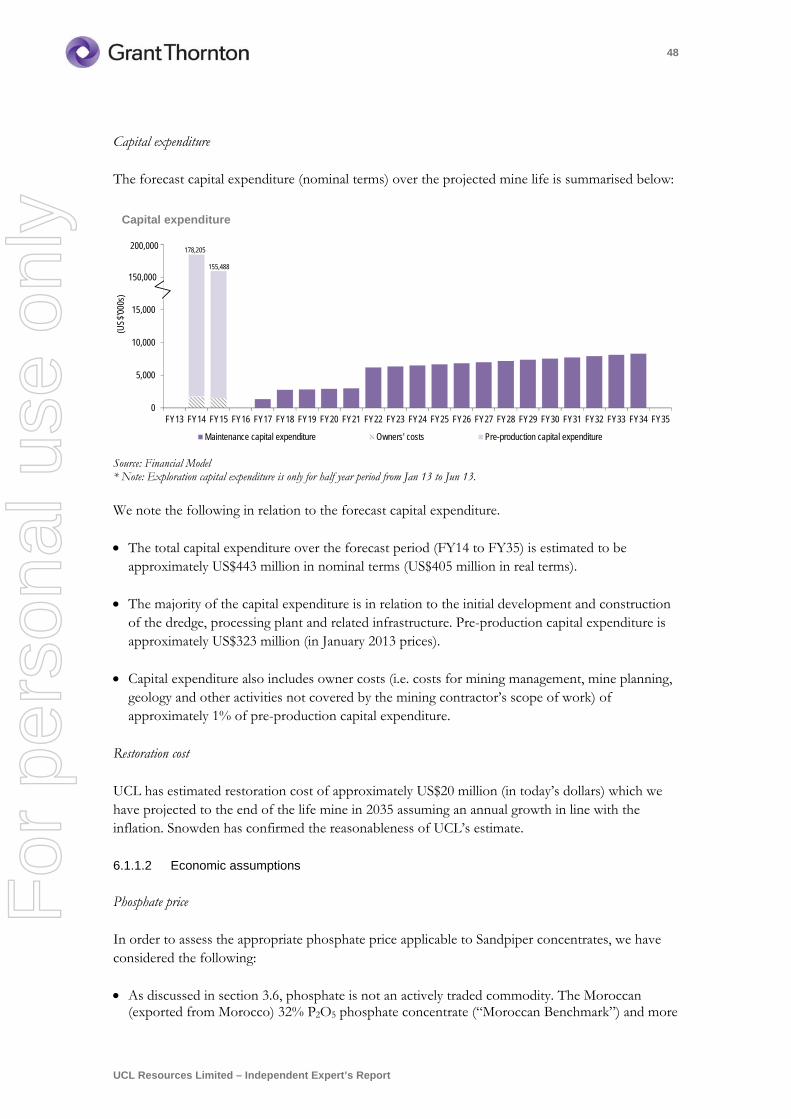
48
UCL Resources Limited – Independent Expert’s Report
Capital expenditure
The forecast capital expenditure (nominal terms) over the projected mine life is summarised below:
Source: Financial Model * Note: Exploration capital expenditure is only for half year period from Jan 13 to Jun 13. We note the following in relation to the forecast capital expenditure.
The total capital expenditure over the forecast period (FY14 to FY35) is estimated to be approximately US$443 million in nominal terms (US$405 million in real terms).
The majority of the capital expenditure is in relation to the initial development and construction of the dredge, processing plant and related infrastructure. Pre-production capital expenditure is approximately US$323 million (in January 2013 prices).
Capital expenditure also includes owner costs (i.e. costs for mining management, mine planning, geology and other activities not covered by the mining contractor’s scope of work) of approximately 1% of pre-production capital expenditure.
Restoration cost
UCL has estimated restoration cost of approximately US$20 million (in today’s dollars) which we have projected to the end of the life mine in 2035 assuming an annual growth in line with the inflation. Snowden has confirmed the reasonableness of UCL’s estimate.
6.1.1.2 Economic assumptions
Phosphate price
In order to assess the appropriate phosphate price applicable to Sandpiper concentrates, we have considered the following:
As discussed in section 3.6, phosphate is not an actively traded commodity. The Moroccan (exported from Morocco) 32% P2O5 phosphate concentrate (“Moroccan Benchmark”) and more
0
5,000
10,000
15,000
20,000
25,000
FY13 FY14 FY15 FY16 FY17 FY18 FY19 FY20 FY21 FY22 FY23 FY24 FY25 FY26 FY27 FY28 FY29 FY30 FY31 FY32 FY33 FY34 FY35
(US$
'000
s)
Capital expenditure
Maintenance capital expenditure Owners' costs Pre-production capital expenditure
150,000
178,205
155,488
200,000
For
per
sona
l use
onl
y
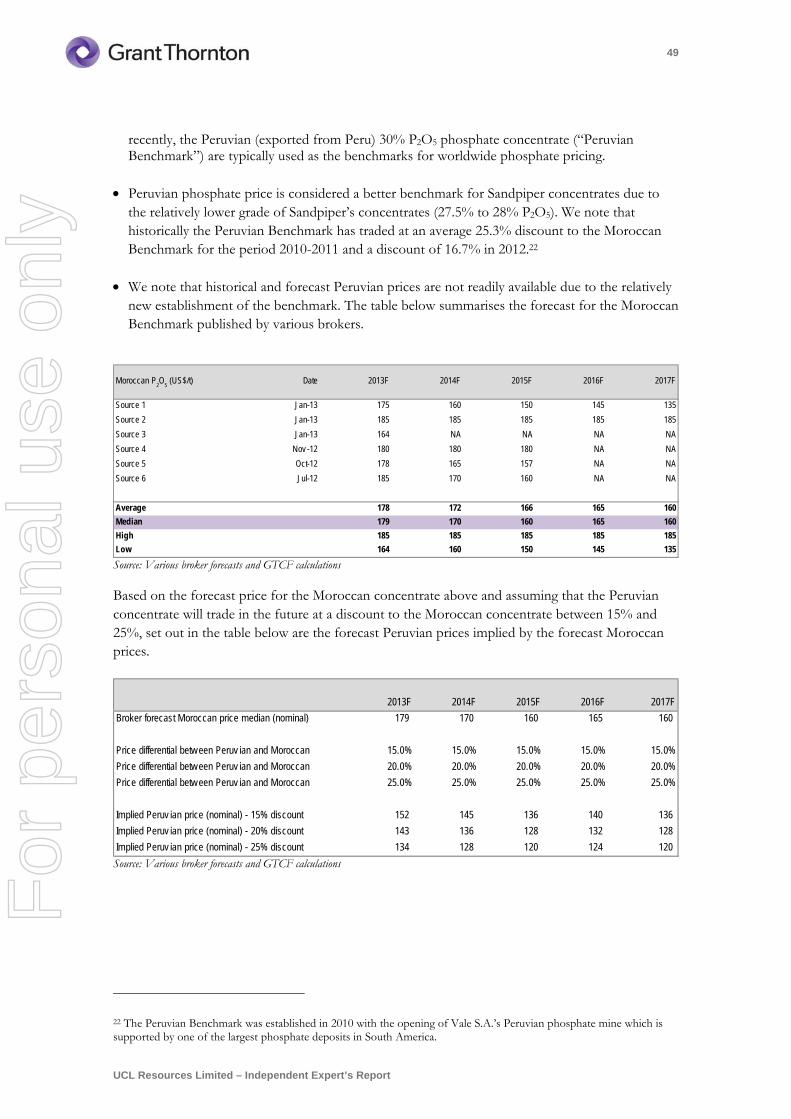
49
UCL Resources Limited – Independent Expert’s Report
recently, the Peruvian (exported from Peru) 30% P2O5 phosphate concentrate (“Peruvian Benchmark”) are typically used as the benchmarks for worldwide phosphate pricing.
Peruvian phosphate price is considered a better benchmark for Sandpiper concentrates due to the relatively lower grade of Sandpiper’s concentrates (27.5% to 28% P2O5). We note that historically the Peruvian Benchmark has traded at an average 25.3% discount to the Moroccan Benchmark for the period 2010-2011 and a discount of 16.7% in 2012.22
We note that historical and forecast Peruvian prices are not readily available due to the relatively new establishment of the benchmark. The table below summarises the forecast for the Moroccan Benchmark published by various brokers.
Source: Various broker forecasts and GTCF calculations
Based on the forecast price for the Moroccan concentrate above and assuming that the Peruvian concentrate will trade in the future at a discount to the Moroccan concentrate between 15% and 25%, set out in the table below are the forecast Peruvian prices implied by the forecast Moroccan prices.
Source: Various broker forecasts and GTCF calculations
22 The Peruvian Benchmark was established in 2010 with the opening of Vale S.A.’s Peruvian phosphate mine which is supported by one of the largest phosphate deposits in South America.
Moroccan P2O
5 (US$/t) Date 2013F 2014F 2015F 2016F 2017F
Source 1 Jan-13 175 160 150 145 135
Source 2 Jan-13 185 185 185 185 185
Source 3 Jan-13 164 NA NA NA NA
Source 4 Nov -12 180 180 180 NA NA
Source 5 Oct-12 178 165 157 NA NA
Source 6 Jul-12 185 170 160 NA NA
Average 178 172 166 165 160
Median 179 170 160 165 160
High 185 185 185 185 185
Low 164 160 150 145 135
2013F 2014F 2015F 2016F 2017F
Broker forecast Moroccan price median (nominal) 179 170 160 165 160
Price differential betw een Peruv ian and Moroccan 15.0% 15.0% 15.0% 15.0% 15.0%
Price differential betw een Peruv ian and Moroccan 20.0% 20.0% 20.0% 20.0% 20.0%
Price differential betw een Peruv ian and Moroccan 25.0% 25.0% 25.0% 25.0% 25.0%
Implied Peruv ian price (nominal) - 15% discount 152 145 136 140 136
Implied Peruv ian price (nominal) - 20% discount 143 136 128 132 128
Implied Peruv ian price (nominal) - 25% discount 134 128 120 124 120
For
per
sona
l use
onl
y
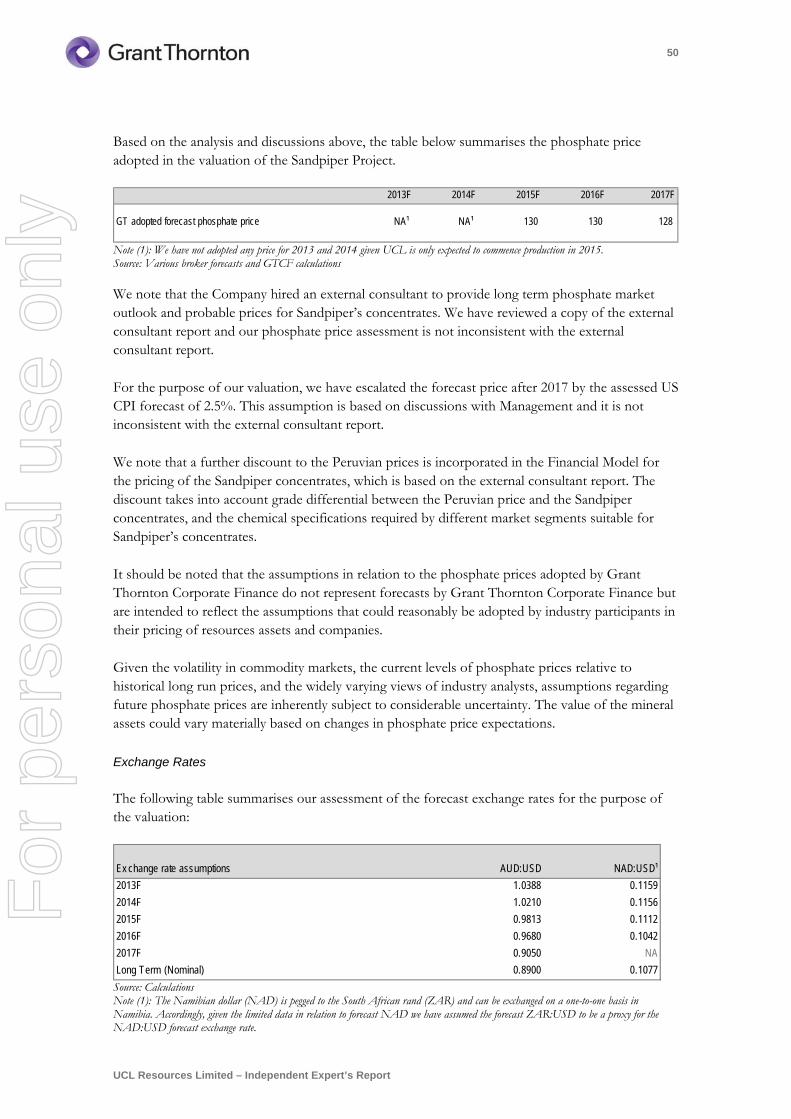
50
UCL Resources Limited – Independent Expert’s Report
Based on the analysis and discussions above, the table below summarises the phosphate price adopted in the valuation of the Sandpiper Project.
Note (1): We have not adopted any price for 2013 and 2014 given UCL is only expected to commence production in 2015. Source: Various broker forecasts and GTCF calculations
We note that the Company hired an external consultant to provide long term phosphate market outlook and probable prices for Sandpiper’s concentrates. We have reviewed a copy of the external consultant report and our phosphate price assessment is not inconsistent with the external consultant report.
For the purpose of our valuation, we have escalated the forecast price after 2017 by the assessed US CPI forecast of 2.5%. This assumption is based on discussions with Management and it is not inconsistent with the external consultant report.
We note that a further discount to the Peruvian prices is incorporated in the Financial Model for the pricing of the Sandpiper concentrates, which is based on the external consultant report. The discount takes into account grade differential between the Peruvian price and the Sandpiper concentrates, and the chemical specifications required by different market segments suitable for Sandpiper’s concentrates.
It should be noted that the assumptions in relation to the phosphate prices adopted by Grant Thornton Corporate Finance do not represent forecasts by Grant Thornton Corporate Finance but are intended to reflect the assumptions that could reasonably be adopted by industry participants in their pricing of resources assets and companies.
Given the volatility in commodity markets, the current levels of phosphate prices relative to historical long run prices, and the widely varying views of industry analysts, assumptions regarding future phosphate prices are inherently subject to considerable uncertainty. The value of the mineral assets could vary materially based on changes in phosphate price expectations.
Exchange Rates
The following table summarises our assessment of the forecast exchange rates for the purpose of the valuation:
Source: Calculations Note (1): The Namibian dollar (NAD) is pegged to the South African rand (ZAR) and can be exchanged on a one-to-one basis in Namibia. Accordingly, given the limited data in relation to forecast NAD we have assumed the forecast ZAR:USD to be a proxy for the NAD:USD forecast exchange rate.
2013F 2014F 2015F 2016F 2017F
GT adopted forecast phosphate price NA¹ NA¹ 130 130 128
AUD:USD NAD:USD¹
2013F 1.0388 0.1159
2014F 1.0210 0.1156
2015F 0.9813 0.1112
2016F 0.9680 0.1042
2017F 0.9050 NA
Long Term (Nominal) 0.8900 0.1077
Ex change rate assumptions
For
per
sona
l use
onl
y
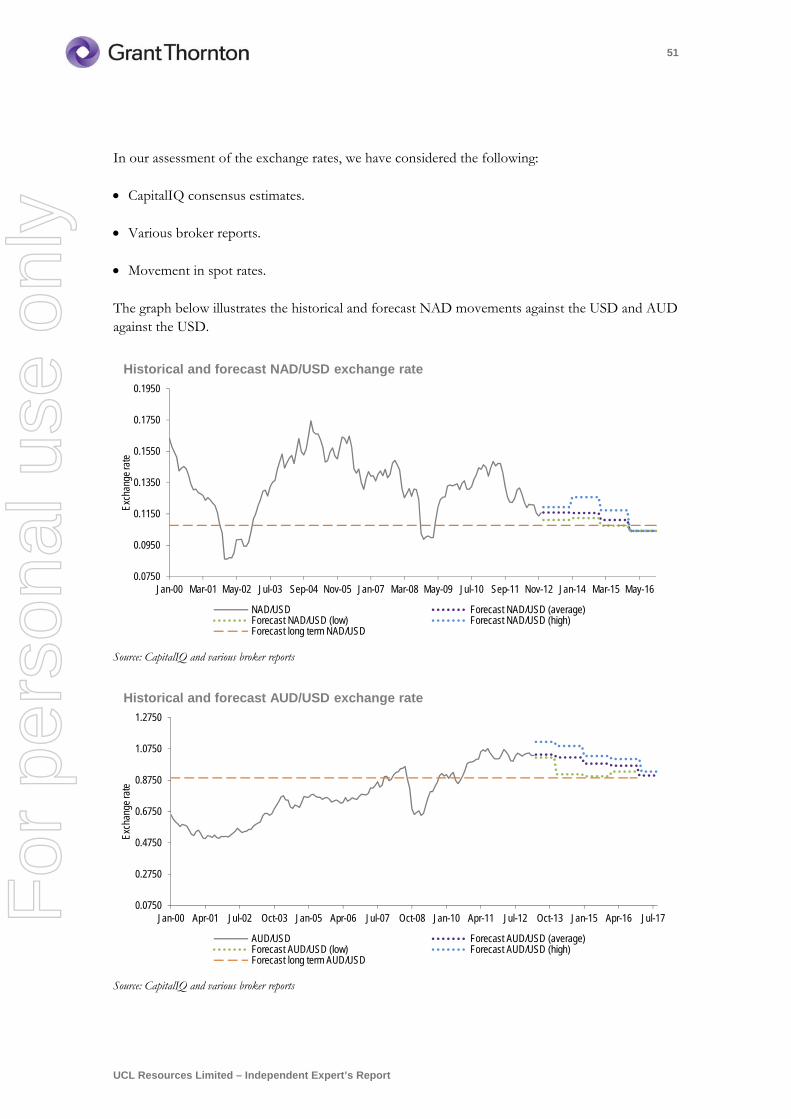
51
UCL Resources Limited – Independent Expert’s Report
In our assessment of the exchange rates, we have considered the following:
CapitalIQ consensus estimates.
Various broker reports.
Movement in spot rates.
The graph below illustrates the historical and forecast NAD movements against the USD and AUD against the USD.
Source: CapitalIQ and various broker reports
Source: CapitalIQ and various broker reports
0.0750
0.0950
0.1150
0.1350
0.1550
0.1750
0.1950
Jan-00 Mar-01 May-02 Jul-03 Sep-04 Nov-05 Jan-07 Mar-08 May-09 Jul-10 Sep-11 Nov-12 Jan-14 Mar-15 May-16
Exch
ange
rate
Historical and forecast NAD/USD exchange rate
NAD/USD Forecast NAD/USD (average)Forecast NAD/USD (low) Forecast NAD/USD (high)Forecast long term NAD/USD
0.0750
0.2750
0.4750
0.6750
0.8750
1.0750
1.2750
Jan-00 Apr-01 Jul-02 Oct-03 Jan-05 Apr-06 Jul-07 Oct-08 Jan-10 Apr-11 Jul-12 Oct-13 Jan-15 Apr-16 Jul-17
Exch
ange
rate
Historical and forecast AUD/USD exchange rate
AUD/USD Forecast AUD/USD (average)Forecast AUD/USD (low) Forecast AUD/USD (high)Forecast long term AUD/USD
For
per
sona
l use
onl
y
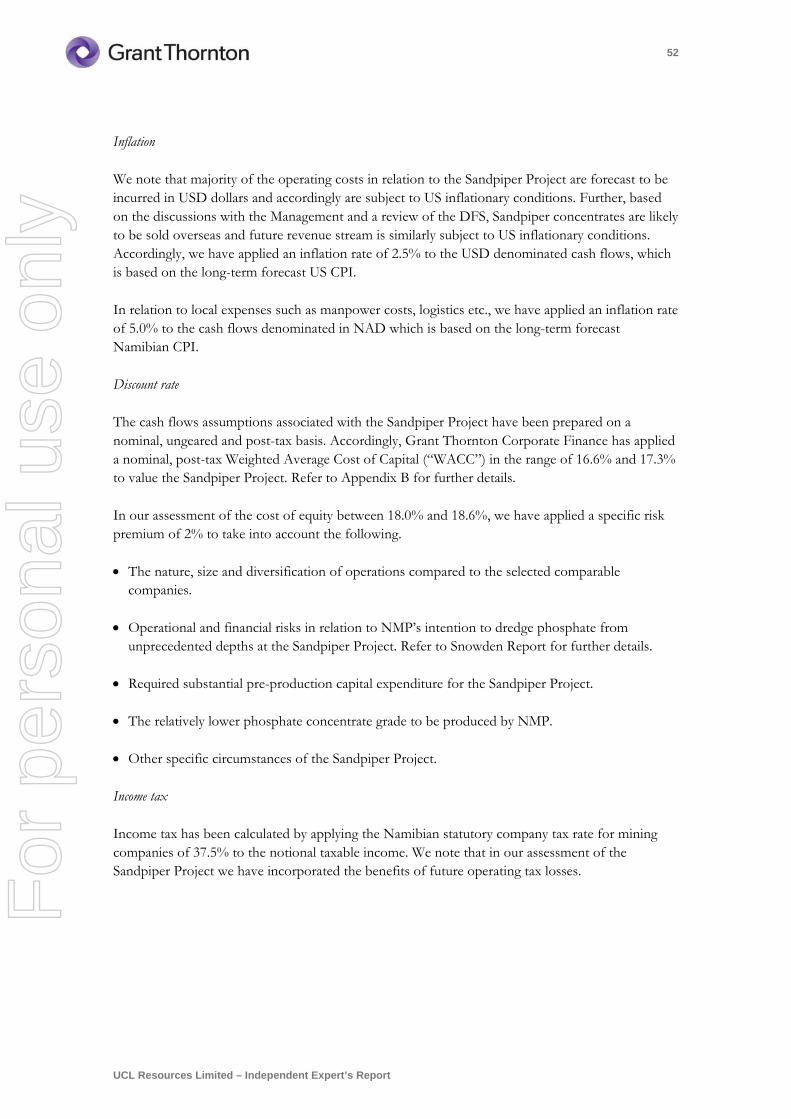
52
UCL Resources Limited – Independent Expert’s Report
Inflation
We note that majority of the operating costs in relation to the Sandpiper Project are forecast to be incurred in USD dollars and accordingly are subject to US inflationary conditions. Further, based on the discussions with the Management and a review of the DFS, Sandpiper concentrates are likely to be sold overseas and future revenue stream is similarly subject to US inflationary conditions. Accordingly, we have applied an inflation rate of 2.5% to the USD denominated cash flows, which is based on the long-term forecast US CPI.
In relation to local expenses such as manpower costs, logistics etc., we have applied an inflation rate of 5.0% to the cash flows denominated in NAD which is based on the long-term forecast Namibian CPI.
Discount rate
The cash flows assumptions associated with the Sandpiper Project have been prepared on a nominal, ungeared and post-tax basis. Accordingly, Grant Thornton Corporate Finance has applied a nominal, post-tax Weighted Average Cost of Capital (“WACC”) in the range of 16.6% and 17.3% to value the Sandpiper Project. Refer to Appendix B for further details.
In our assessment of the cost of equity between 18.0% and 18.6%, we have applied a specific risk premium of 2% to take into account the following.
The nature, size and diversification of operations compared to the selected comparable companies.
Operational and financial risks in relation to NMP’s intention to dredge phosphate from unprecedented depths at the Sandpiper Project. Refer to Snowden Report for further details.
Required substantial pre-production capital expenditure for the Sandpiper Project.
The relatively lower phosphate concentrate grade to be produced by NMP.
Other specific circumstances of the Sandpiper Project.
Income tax
Income tax has been calculated by applying the Namibian statutory company tax rate for mining companies of 37.5% to the notional taxable income. We note that in our assessment of the Sandpiper Project we have incorporated the benefits of future operating tax losses.
For
per
sona
l use
onl
y
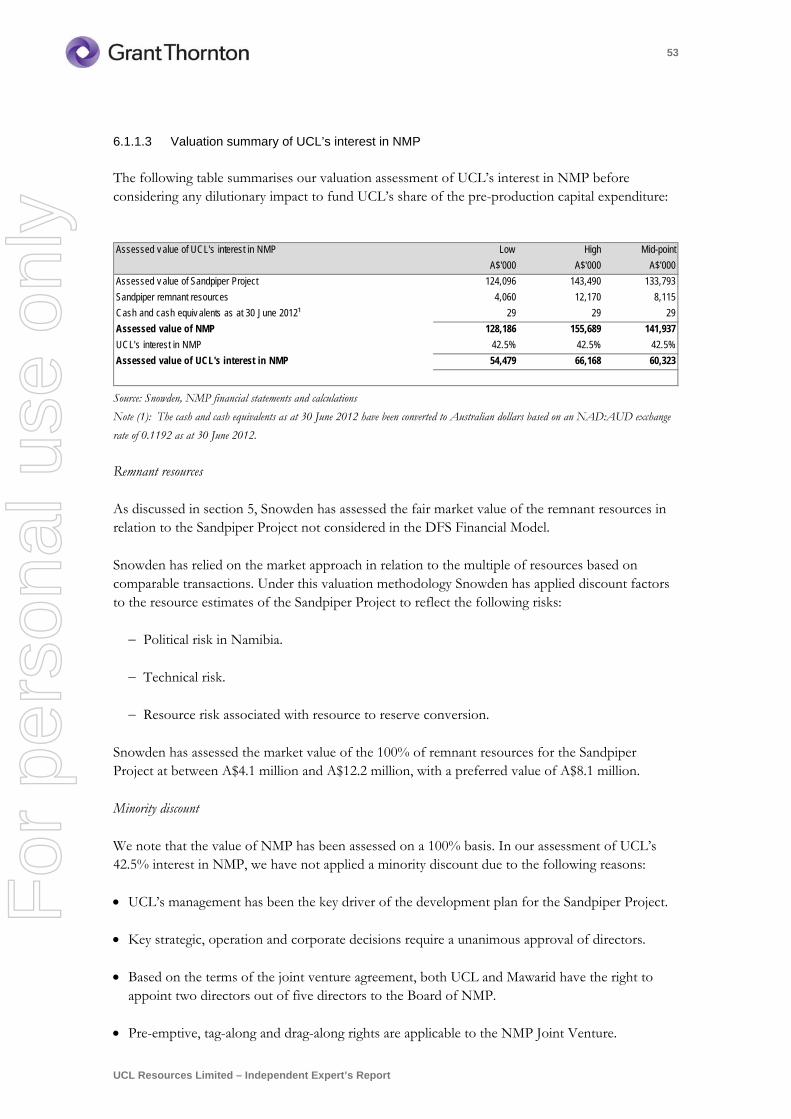
53
UCL Resources Limited – Independent Expert’s Report
6.1.1.3 Valuation summary of UCL’s interest in NMP
The following table summarises our valuation assessment of UCL’s interest in NMP before considering any dilutionary impact to fund UCL’s share of the pre-production capital expenditure:
Source: Snowden, NMP financial statements and calculations
Note (1): The cash and cash equivalents as at 30 June 2012 have been converted to Australian dollars based on an NAD:AUD exchange
rate of 0.1192 as at 30 June 2012.
Remnant resources
As discussed in section 5, Snowden has assessed the fair market value of the remnant resources in relation to the Sandpiper Project not considered in the DFS Financial Model.
Snowden has relied on the market approach in relation to the multiple of resources based on comparable transactions. Under this valuation methodology Snowden has applied discount factors to the resource estimates of the Sandpiper Project to reflect the following risks:
Political risk in Namibia.
Technical risk.
Resource risk associated with resource to reserve conversion.
Snowden has assessed the market value of the 100% of remnant resources for the Sandpiper Project at between A$4.1 million and A$12.2 million, with a preferred value of A$8.1 million.
Minority discount
We note that the value of NMP has been assessed on a 100% basis. In our assessment of UCL’s 42.5% interest in NMP, we have not applied a minority discount due to the following reasons:
UCL’s management has been the key driver of the development plan for the Sandpiper Project.
Key strategic, operation and corporate decisions require a unanimous approval of directors.
Based on the terms of the joint venture agreement, both UCL and Mawarid have the right to appoint two directors out of five directors to the Board of NMP.
Pre-emptive, tag-along and drag-along rights are applicable to the NMP Joint Venture.
Assessed v alue of UCL's interest in NMP Low High Mid-point
A$'000 A$'000 A$'000
Assessed v alue of Sandpiper Project 124,096 143,490 133,793
Sandpiper remnant resources 4,060 12,170 8,115
Cash and cash equiv alents as at 30 June 2012¹ 29 29 29
Assessed value of NMP 128,186 155,689 141,937
UCL's interest in NMP 42.5% 42.5% 42.5%
Assessed value of UCL's interest in NMP 54,479 66,168 60,323
For
per
sona
l use
onl
y
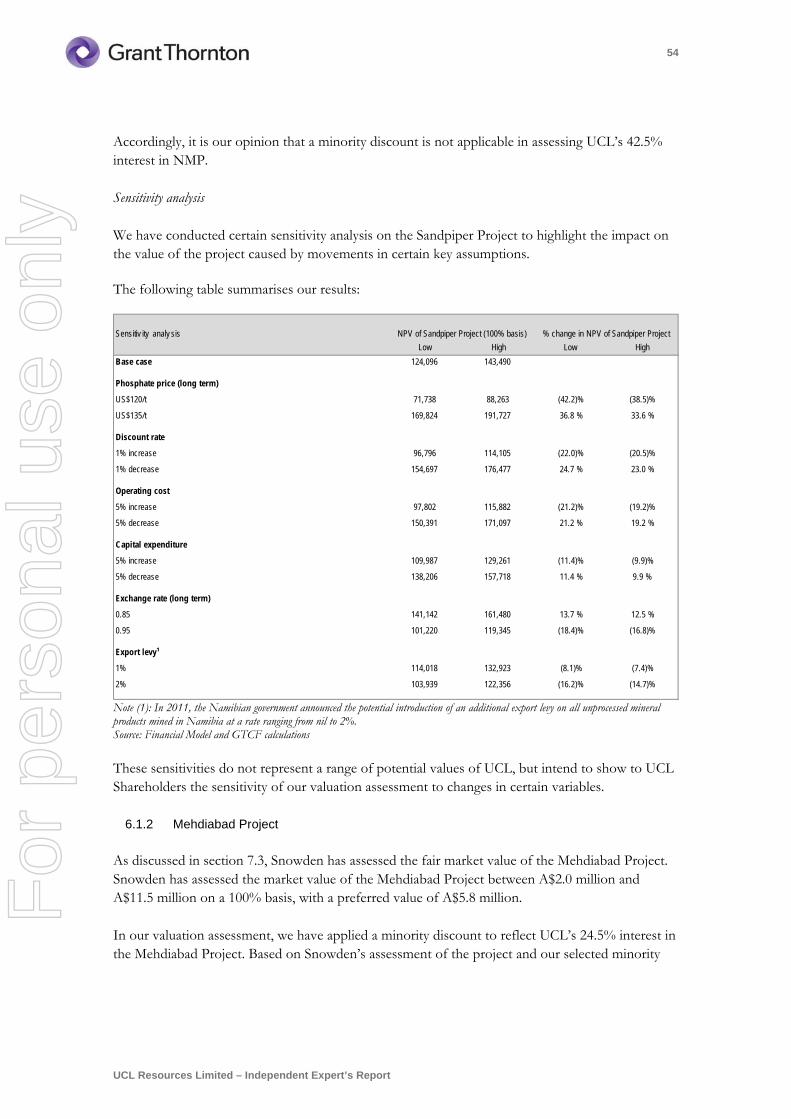
54
UCL Resources Limited – Independent Expert’s Report
Accordingly, it is our opinion that a minority discount is not applicable in assessing UCL’s 42.5% interest in NMP.
Sensitivity analysis
We have conducted certain sensitivity analysis on the Sandpiper Project to highlight the impact on the value of the project caused by movements in certain key assumptions.
The following table summarises our results:
Note (1): In 2011, the Namibian government announced the potential introduction of an additional export levy on all unprocessed mineral products mined in Namibia at a rate ranging from nil to 2%. Source: Financial Model and GTCF calculations These sensitivities do not represent a range of potential values of UCL, but intend to show to UCL Shareholders the sensitivity of our valuation assessment to changes in certain variables.
6.1.2 Mehdiabad Project
As discussed in section 7.3, Snowden has assessed the fair market value of the Mehdiabad Project. Snowden has assessed the market value of the Mehdiabad Project between A$2.0 million and A$11.5 million on a 100% basis, with a preferred value of A$5.8 million.
In our valuation assessment, we have applied a minority discount to reflect UCL’s 24.5% interest in the Mehdiabad Project. Based on Snowden’s assessment of the project and our selected minority
Sensitiv ity analy sis
Low High Low High
Base case 124,096 143,490
Phosphate price (long term)
US$120/t 71,738 88,263 (42.2)% (38.5)%
US$135/t 169,824 191,727 36.8 % 33.6 %
Discount rate
1% increase 96,796 114,105 (22.0)% (20.5)%
1% decrease 154,697 176,477 24.7 % 23.0 %
Operating cost
5% increase 97,802 115,882 (21.2)% (19.2)%
5% decrease 150,391 171,097 21.2 % 19.2 %
Capital expenditure
5% increase 109,987 129,261 (11.4)% (9.9)%
5% decrease 138,206 157,718 11.4 % 9.9 %
Exchange rate (long term)
0.85 141,142 161,480 13.7 % 12.5 %
0.95 101,220 119,345 (18.4)% (16.8)%
Export levy¹
1% 114,018 132,923 (8.1)% (7.4)%
2% 103,939 122,356 (16.2)% (14.7)%
NPV of Sandpiper Project (100% basis) % change in NPV of Sandpiper Project
For
per
sona
l use
onl
y
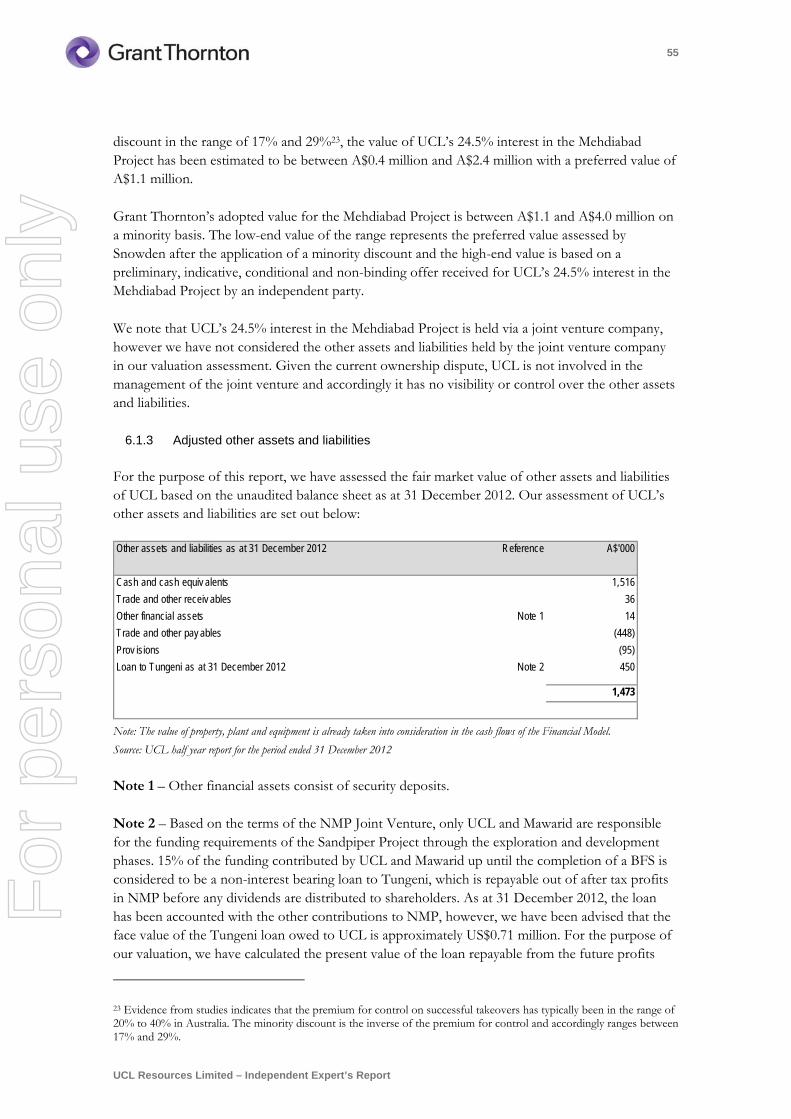
55
UCL Resources Limited – Independent Expert’s Report
discount in the range of 17% and 29%23, the value of UCL’s 24.5% interest in the Mehdiabad Project has been estimated to be between A$0.4 million and A$2.4 million with a preferred value of A$1.1 million.
Grant Thornton’s adopted value for the Mehdiabad Project is between A$1.1 and A$4.0 million on a minority basis. The low-end value of the range represents the preferred value assessed by Snowden after the application of a minority discount and the high-end value is based on a preliminary, indicative, conditional and non-binding offer received for UCL’s 24.5% interest in the Mehdiabad Project by an independent party.
We note that UCL’s 24.5% interest in the Mehdiabad Project is held via a joint venture company, however we have not considered the other assets and liabilities held by the joint venture company in our valuation assessment. Given the current ownership dispute, UCL is not involved in the management of the joint venture and accordingly it has no visibility or control over the other assets and liabilities.
6.1.3 Adjusted other assets and liabilities
For the purpose of this report, we have assessed the fair market value of other assets and liabilities of UCL based on the unaudited balance sheet as at 31 December 2012. Our assessment of UCL’s other assets and liabilities are set out below:
Note: The value of property, plant and equipment is already taken into consideration in the cash flows of the Financial Model.
Source: UCL half year report for the period ended 31 December 2012
Note 1 – Other financial assets consist of security deposits.
Note 2 – Based on the terms of the NMP Joint Venture, only UCL and Mawarid are responsible for the funding requirements of the Sandpiper Project through the exploration and development phases. 15% of the funding contributed by UCL and Mawarid up until the completion of a BFS is considered to be a non-interest bearing loan to Tungeni, which is repayable out of after tax profits in NMP before any dividends are distributed to shareholders. As at 31 December 2012, the loan has been accounted with the other contributions to NMP, however, we have been advised that the face value of the Tungeni loan owed to UCL is approximately US$0.71 million. For the purpose of our valuation, we have calculated the present value of the loan repayable from the future profits
23 Evidence from studies indicates that the premium for control on successful takeovers has typically been in the range of 20% to 40% in Australia. The minority discount is the inverse of the premium for control and accordingly ranges between 17% and 29%.
Other assets and liabilities as at 31 December 2012 Reference A$'000
Cash and cash equiv alents 1,516
Trade and other receiv ables 36
Other financial assets Note 1 14
Trade and other pay ables (448)
Prov isions (95)
Loan to Tungeni as at 31 December 2012 Note 2 450
1,473
For
per
sona
l use
onl
y
56
UCL Resources Limited – Independent Expert’s Report
and converted it to Australian dollars based on the long term AUD:USD exchange rate of 0.8924. We have assessed the net present value of the loan to Tungeni at A$0.45 million.
6.1.4 Value of UCL Options
UCL currently has 3,933,335 UCL Options on issue with different exercise prices. The value of the UCL Options has been determined using the binomial option pricing model.
We have assessed the total value of the UCL Options having regard to the following key assumptions:
Underlying share price of 11.0 cents as at 22 April 2013.
Risk free rate of 3.50%, based on the average yield of Australian Government Bonds with a comparable life to the UCL Options.
Assessed volatility over the life of options in the range of 100% to 120%25.
We also note that 3.8 million UCL Options are subject to the following non-market vesting conditions:
1,125,000 UCL Options vesting upon completion of Phase 1 (on completion of the first run-of-mine (“ROM”) ore discharged from the dredge vessel) of the development of the Sandpiper Project, and the closing share price of UCL being no less than A$0.40 for at least 5 consecutive trading days post the vesting event. UCL Management has advised that the Phase 1 of the development of the Sandpiper Project is expected to be completed in 2014.
2,675,000 UCL Options vesting upon the first commercial shipment of beneficiated phosphate from the Sandpiper Project, and the closing share price of UCL being no less than A$0.40 for at least 5 consecutive trading days post the vesting event. Management of UCL have advised that first commercial shipment of beneficiated phosphate is expected to be completed in last quarter of 2015.
Based on the above, we have assessed the value of UCL Options to be in the range of A$0.26 million to A$0.30 million.
6.1.5 Performance Rights
As discussed in section 4.4.2, UCL currently has approximately 2.9 million performance rights on issue. We have assessed the fair market value of the UCL Performance Rights using the binomial option pricing model.
We also note that UCL Performance Rights are subject to the following non-market vesting conditions:
24 Based on various broker forecasts. 25 Based on the historical price volatilities of selected comparable companies.
For
per
sona
l use
onl
y
57
UCL Resources Limited – Independent Expert’s Report
485,000 UCL Performance Rights approved, vesting upon MZC being granted a valid license to exploit the Mehdiabad Zinc Mine in Iran. In September 2012, MZC entered into a 25-year production agreement with IMIDRO which will enable MZC to develop an operation at the Mehdiabad Project with an estimated target production of up to 200,000 tonnes of zinc ingots and concentrate per annum. As a result, the UCL Performance Rights have vested with an expiry date on the 4 September 2014 at an exercise price of A$0.1461.
889,334 UCL Performance Rights approved, vesting upon the completion of the DFS in respect of the Sandpiper Project in Namibia. We note that the DFS was completed in March 2012 and the UCL Performance Rights have vested with an expiry date on the 31 March 2014 at an exercise price of A$0.2724.
323,334 UCL Performance Rights approved, vesting upon the completion of Phase 1 (on completion of the first run-of-mine (“ROM”) ore discharged from the dredge vessel) of the development of the Sandpiper Project. UCL Management has advised that the Phase 1 of the development of the Sandpiper Project is expected to be completed in 2014.
727,668 UCL Performance Rights approved, vesting upon the first commercial shipment of beneficiated phosphate from the Sandpiper Project. Management of UCL have advised that first commercial shipment of beneficiated phosphate is expected to be completed in last quarter of 2015.
Based on the above, we have assessed the value of UCL Performance Rights to be in the range of A$0.15 million and A$0.16 million.
6.1.6 Taxation losses
UCL has approximately A$16.4 million net accumulated tax losses as at 30 June 2012 which could potentially be used to offset against future taxable income. However, the amount has not been recognised as an asset for financial reporting purposes as it does not satisfy the recognition criteria under the relevant accounting standards.
For valuation purposes, unutilised tax losses may have a value as the hypothetical purchaser of a company can use the tax losses to offset against future taxable income, subject to satisfying certain taxation rules.
With respect to the potential utilisation of tax losses by UCL, Grant Thornton Corporate Finance notes that:
UCL does not currently generate any material earnings or positive cash flows.
UCL’s mineral assets are either at the development stage or exploration stage.
UCL expects to commence production at the Sandpiper Project in last quarter of 2015.
Given the existing uncertainty over the ability of UCL to utilise its existing tax losses, it is unlikely that a hypothetical purchaser would place any material value on unutilised tax losses. Furthermore,
For
per
sona
l use
onl
y
58
UCL Resources Limited – Independent Expert’s Report
any future transactions may lead to uncertainty in relation to UCL being able to meet the specific Australian Taxation Office (“ATO”) requirements in order to utilise the tax losses.
Accordingly, Grant Thornton Corporate Finance has not included a value for the existing tax losses in our assessment of UCL.
6.1.7 Capitalised corporate overheads
UCL incurs on-going corporate costs which are not directly related to the exploration and exploitation of its mining assets. These costs are associated with maintaining offices, the executive management teams, finance and corporate administration. We have excluded from the capitalised value of corporate overheads costs associated with maintaining a listing status such as annual listing fees, registry fees and non-Executive Directors’ fees as we have valued UCL on a 100% basis in accordance with the requirements of RG 111.
Based on the discussions with Management, annual corporate overheads excluding those associated with maintaining a listed status and one-off expenses have been assessed in the range of A$600,000 to A$700,000 per annum on a pre-tax basis.
We have assessed the capitalised value of the corporate overheads to be between A$3.6 million and A$3.7 million having regard to the net present value of future corporate overheads using a discount rate between 16.6% and 17.3%. Refer to Appendix B for further details on discount rate.
6.1.8 Costs associated with the Takeover Offer
For the purpose of the valuation, Grant Thornton Corporate Finance has taken into consideration costs associated with the Takeover Offer payable by UCL. Management of UCL has advised that the estimated transaction costs to be incurred by UCL are approximately A$650,000 irrespective of whether the Takeover Offer is completed or otherwise. These costs are not included in the cash balance as at 31 December 2012.
6.1.9 Dilutionary impact of fund raising
The pre-production capital expenditure required for the Sandpiper Project has been estimated to be approximately US$333.7 million in nominal terms (US$323 million in real terms) in the DFS. Based on discussions with Management and the terms of the joint venture, UCL is required to provide 50% of the funding for the pre-production capital expenditure26 (approximately US$166.9 million).
We understand that UCL is currently in discussions with equity and debt providers in relation to the funding of the Sandpiper Project. Based on the preliminary discussions held by UCL with financiers, a review of similar projects and the current market conditions, we are of the opinion that the pre-production capital expenditure of the Sandpiper Project can be funded through 50% debt and 50% equity. Accordingly, UCL will need to provide approximately US$83.4 million in equity contributions to NMP over the next 6 to 12 months.
26 Includes 50% of Tungeni’s obligation.
For
per
sona
l use
onl
y
59
UCL Resources Limited – Independent Expert’s Report
RG 111 specifically states that the funding requirements of a target company should be taken into consideration when assessing the fair value of the target securities.
Based on discussions with the Directors of UCL, we understand that they are considering and reviewing different options for the equity funding component of the Sandpiper Project including a private placement with one or more strategic investors and/or a rights issue.
In relation to the potential issue price for the private placement and rights issue, and the related dilutionary impact for existing UCL Shareholders, we note the following:
In May 2012, UCL completed a share placement (Placement) to Mawarid to raise approximately A$3.64 million via the issue of approximately 12.1 million shares at an issue price of A$0.30 per share. The Placement price of A$0.30 per share represented a premium of approximately 11.1% to the UCL share price 1-day prior the announcement of the Placement of A$0.27 per share. However, we note that UCL share price increased by 36.8 % to A$0.26 shortly before the Placement as a result of the unsolicited takeover offer announced by Minemakers on 13 February 2012. The Placement price represented a premium of 63.2% compared to the share price of UCL before 13 February 2012. This placement price may provide an indication of the intrinsic value that strategic investors may be prepared to pay for UCL. However, we note that the Placement was only in relation to A$3.64 million.
In June 2012, UCL undertook a rights issue to raise approximately A$2.30 million at an issue price of A$0.30 per share. The rights issue closed with only a total of A$327,525 application funds received. This may provide an indication that retail shareholders may not be prepared to support future capital raisings of the company at or around A$0.30 per share.
The see through value of UCL based on the Sandpiper Transaction is around A$0.25 per share. Given the limited liquidity of the UCL share price, this may provide external objective support for the capital raising price.
The current share price of UCL is A$0.31 in line with the Offer Price.
Based on the above discussions and analysis, in our assessment of the dilutionary impact of the required equity raising of US$83.4 million (approximately A$80.3 million based on forecast AUD:USD exchange rates27) we have assumed a placement/rights issue price between A$0.20 and A$0.30. We note that we have estimated transaction costs of approximately A$10 million28 for the debt and equity raisings which we have added in our calculation of the dilutionary impact (i.e. a total equity raising of approximately A$90 million).
27 2013 forecast AUD:USD exchange rate of 1.0388 28 The estimated transaction costs of A$10 million is based on a 6% brokerage fee on equity component plus commissions and fees on debt raising.
For
per
sona
l use
onl
y
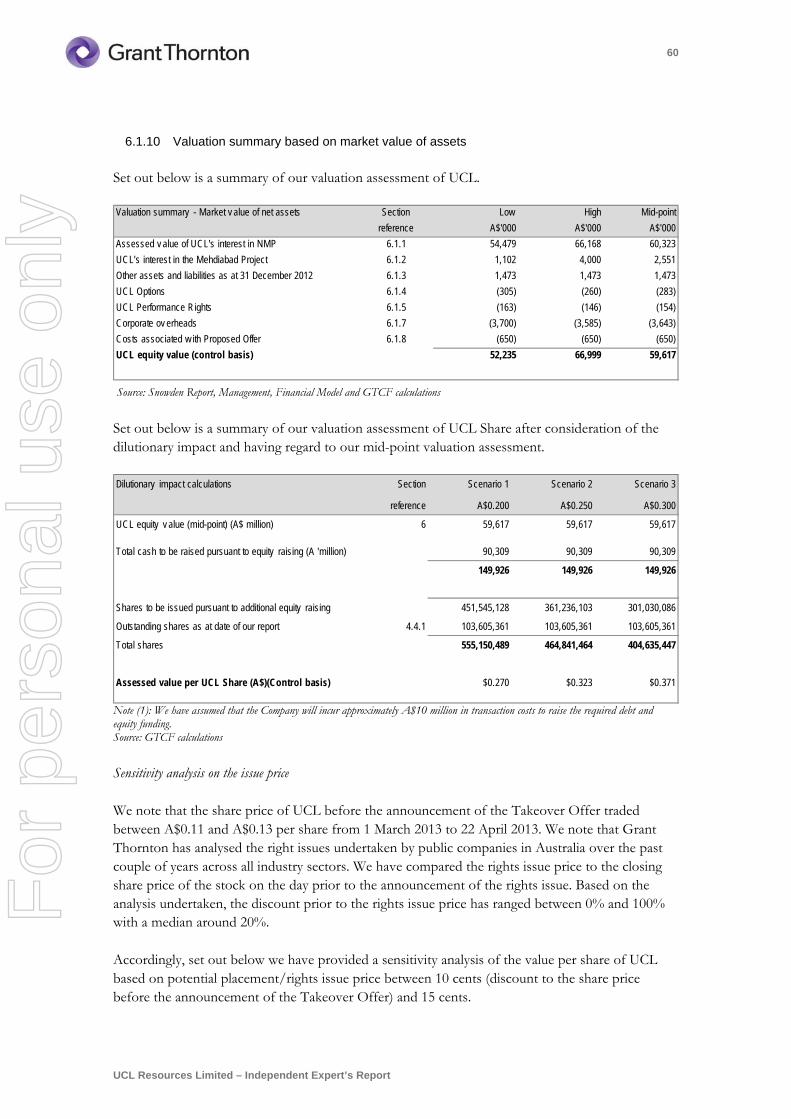
60
UCL Resources Limited – Independent Expert’s Report
6.1.10 Valuation summary based on market value of assets
Set out below is a summary of our valuation assessment of UCL.
Source: Snowden Report, Management, Financial Model and GTCF calculations
Set out below is a summary of our valuation assessment of UCL Share after consideration of the dilutionary impact and having regard to our mid-point valuation assessment.
Note (1): We have assumed that the Company will incur approximately A$10 million in transaction costs to raise the required debt and equity funding. Source: GTCF calculations Sensitivity analysis on the issue price
We note that the share price of UCL before the announcement of the Takeover Offer traded between A$0.11 and A$0.13 per share from 1 March 2013 to 22 April 2013. We note that Grant Thornton has analysed the right issues undertaken by public companies in Australia over the past couple of years across all industry sectors. We have compared the rights issue price to the closing share price of the stock on the day prior to the announcement of the rights issue. Based on the analysis undertaken, the discount prior to the rights issue price has ranged between 0% and 100% with a median around 20%.
Accordingly, set out below we have provided a sensitivity analysis of the value per share of UCL based on potential placement/rights issue price between 10 cents (discount to the share price before the announcement of the Takeover Offer) and 15 cents.
Valuation summary - Market v alue of net assets Section Low High Mid-point
reference A$'000 A$'000 A$'000
Assessed v alue of UCL's interest in NMP 6.1.1 54,479 66,168 60,323
UCL's interest in the Mehdiabad Project 6.1.2 1,102 4,000 2,551
Other assets and liabilities as at 31 December 2012 6.1.3 1,473 1,473 1,473
UCL Options 6.1.4 (305) (260) (283)
UCL Performance Rights 6.1.5 (163) (146) (154)
Corporate ov erheads 6.1.7 (3,700) (3,585) (3,643)
Costs associated w ith Proposed Offer 6.1.8 (650) (650) (650)
UCL equity value (control basis) 52,235 66,999 59,617
Dilutionary impact calculations Section Scenario 1 Scenario 2 Scenario 3
reference A$0.200 A$0.250 A$0.300
UCL equity v alue (mid-point) (A$ million) 6 59,617 59,617 59,617
Total cash to be raised pursuant to equity raising (A 'million) 90,309 90,309 90,309
149,926 149,926 149,926
Shares to be issued pursuant to additional equity raising 451,545,128 361,236,103 301,030,086
Outstanding shares as at date of our report 4.4.1 103,605,361 103,605,361 103,605,361
Total shares 555,150,489 464,841,464 404,635,447
Assessed value per UCL Share (A$)(Control basis) $0.270 $0.323 $0.371
For
per
sona
l use
onl
y
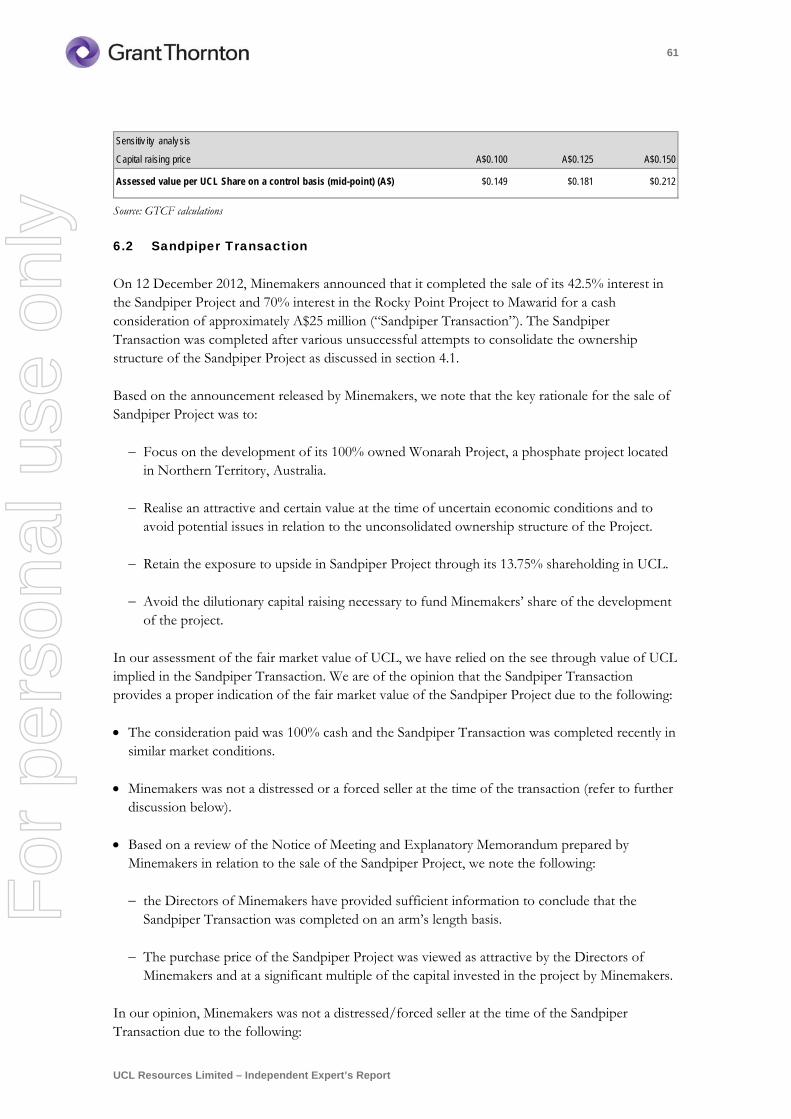
61
UCL Resources Limited – Independent Expert’s Report
Source: GTCF calculations
6.2 Sandpiper Transaction
On 12 December 2012, Minemakers announced that it completed the sale of its 42.5% interest in the Sandpiper Project and 70% interest in the Rocky Point Project to Mawarid for a cash consideration of approximately A$25 million (“Sandpiper Transaction”). The Sandpiper Transaction was completed after various unsuccessful attempts to consolidate the ownership structure of the Sandpiper Project as discussed in section 4.1.
Based on the announcement released by Minemakers, we note that the key rationale for the sale of Sandpiper Project was to:
Focus on the development of its 100% owned Wonarah Project, a phosphate project located in Northern Territory, Australia.
Realise an attractive and certain value at the time of uncertain economic conditions and to avoid potential issues in relation to the unconsolidated ownership structure of the Project.
Retain the exposure to upside in Sandpiper Project through its 13.75% shareholding in UCL.
Avoid the dilutionary capital raising necessary to fund Minemakers’ share of the development of the project.
In our assessment of the fair market value of UCL, we have relied on the see through value of UCL implied in the Sandpiper Transaction. We are of the opinion that the Sandpiper Transaction provides a proper indication of the fair market value of the Sandpiper Project due to the following:
The consideration paid was 100% cash and the Sandpiper Transaction was completed recently in similar market conditions.
Minemakers was not a distressed or a forced seller at the time of the transaction (refer to further discussion below).
Based on a review of the Notice of Meeting and Explanatory Memorandum prepared by Minemakers in relation to the sale of the Sandpiper Project, we note the following:
the Directors of Minemakers have provided sufficient information to conclude that the Sandpiper Transaction was completed on an arm’s length basis.
The purchase price of the Sandpiper Project was viewed as attractive by the Directors of Minemakers and at a significant multiple of the capital invested in the project by Minemakers.
In our opinion, Minemakers was not a distressed/forced seller at the time of the Sandpiper Transaction due to the following:
Sensitiv ity analy sis
Capital raising price A$0.100 A$0.125 A$0.150
Assessed value per UCL Share on a control basis (mid-point) (A$) $0.149 $0.181 $0.212
For
per
sona
l use
onl
y
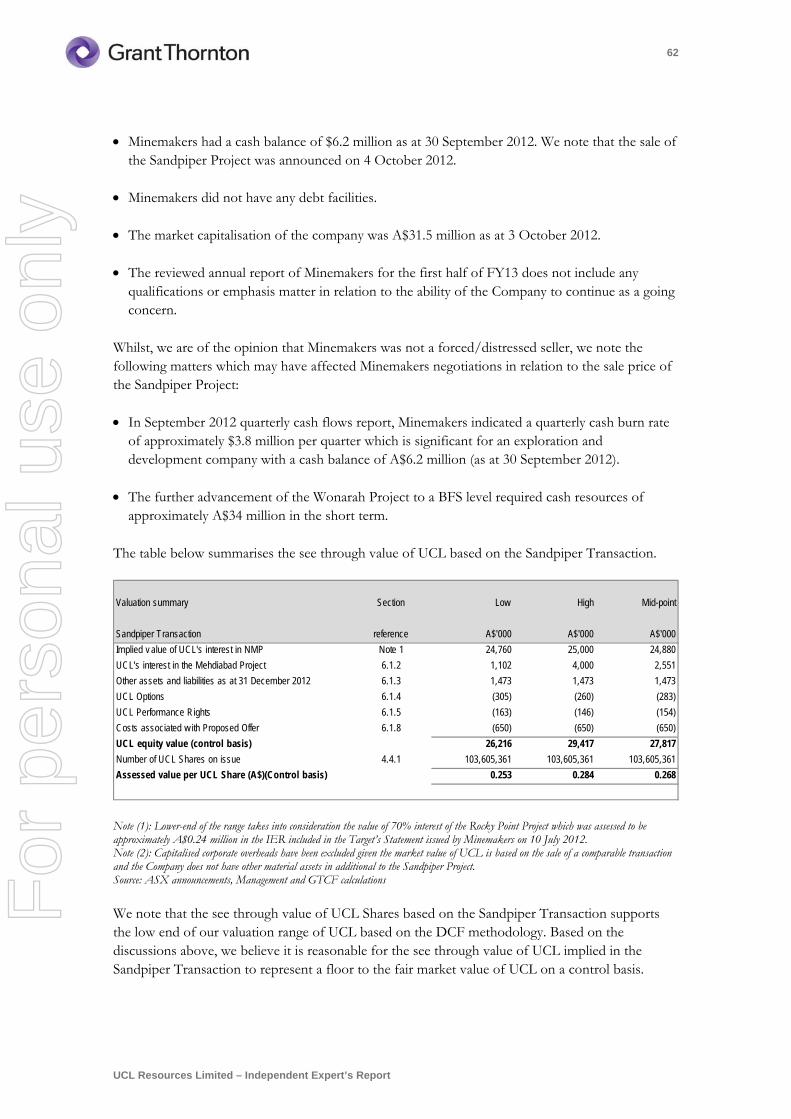
62
UCL Resources Limited – Independent Expert’s Report
Minemakers had a cash balance of $6.2 million as at 30 September 2012. We note that the sale of the Sandpiper Project was announced on 4 October 2012.
Minemakers did not have any debt facilities.
The market capitalisation of the company was A$31.5 million as at 3 October 2012.
The reviewed annual report of Minemakers for the first half of FY13 does not include any qualifications or emphasis matter in relation to the ability of the Company to continue as a going concern.
Whilst, we are of the opinion that Minemakers was not a forced/distressed seller, we note the following matters which may have affected Minemakers negotiations in relation to the sale price of the Sandpiper Project:
In September 2012 quarterly cash flows report, Minemakers indicated a quarterly cash burn rate of approximately $3.8 million per quarter which is significant for an exploration and development company with a cash balance of A$6.2 million (as at 30 September 2012).
The further advancement of the Wonarah Project to a BFS level required cash resources of approximately A$34 million in the short term.
The table below summarises the see through value of UCL based on the Sandpiper Transaction.
Note (1): Lower-end of the range takes into consideration the value of 70% interest of the Rocky Point Project which was assessed to be approximately A$0.24 million in the IER included in the Target’s Statement issued by Minemakers on 10 July 2012. Note (2): Capitalised corporate overheads have been excluded given the market value of UCL is based on the sale of a comparable transaction and the Company does not have other material assets in additional to the Sandpiper Project. Source: ASX announcements, Management and GTCF calculations We note that the see through value of UCL Shares based on the Sandpiper Transaction supports the low end of our valuation range of UCL based on the DCF methodology. Based on the discussions above, we believe it is reasonable for the see through value of UCL implied in the Sandpiper Transaction to represent a floor to the fair market value of UCL on a control basis.
Valuation summary Section Low High Mid-point
Sandpiper Transaction reference A$'000 A$'000 A$'000
Implied v alue of UCL's interest in NMP Note 1 24,760 25,000 24,880
UCL's interest in the Mehdiabad Project 6.1.2 1,102 4,000 2,551
Other assets and liabilities as at 31 December 2012 6.1.3 1,473 1,473 1,473
UCL Options 6.1.4 (305) (260) (283)
UCL Performance Rights 6.1.5 (163) (146) (154)
Costs associated w ith Proposed Offer 6.1.8 (650) (650) (650)
UCL equity value (control basis) 26,216 29,417 27,817
Number of UCL Shares on issue 4.4.1 103,605,361 103,605,361 103,605,361
Assessed value per UCL Share (A$)(Control basis) 0.253 0.284 0.268
For
per
sona
l use
onl
y
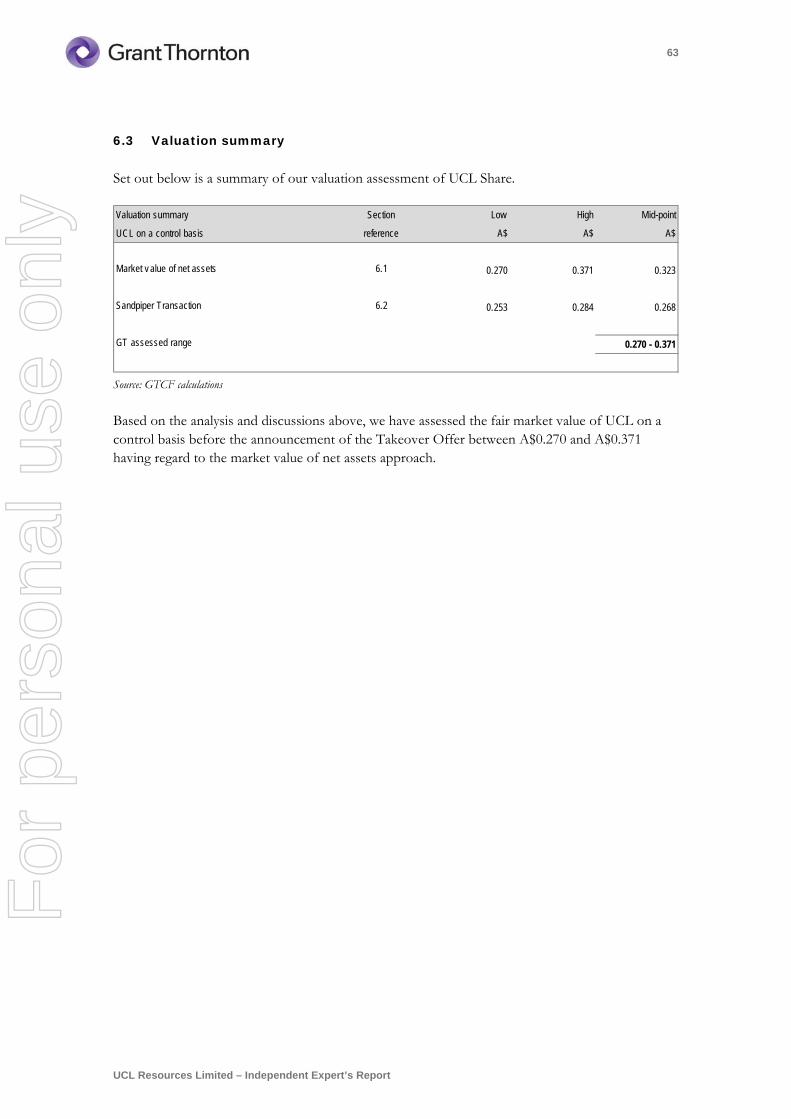
63
UCL Resources Limited – Independent Expert’s Report
6.3 Valuation summary
Set out below is a summary of our valuation assessment of UCL Share.
Source: GTCF calculations
Based on the analysis and discussions above, we have assessed the fair market value of UCL on a control basis before the announcement of the Takeover Offer between A$0.270 and A$0.371 having regard to the market value of net assets approach.
Valuation summary Section Low High Mid-point
UCL on a control basis reference A$ A$ A$
Market v alue of net assets 6.1 0.270 0.371 0.323
Sandpiper Transaction 6.2 0.253 0.284 0.268
GT assessed range 0.270 - 0.371
For
per
sona
l use
onl
y
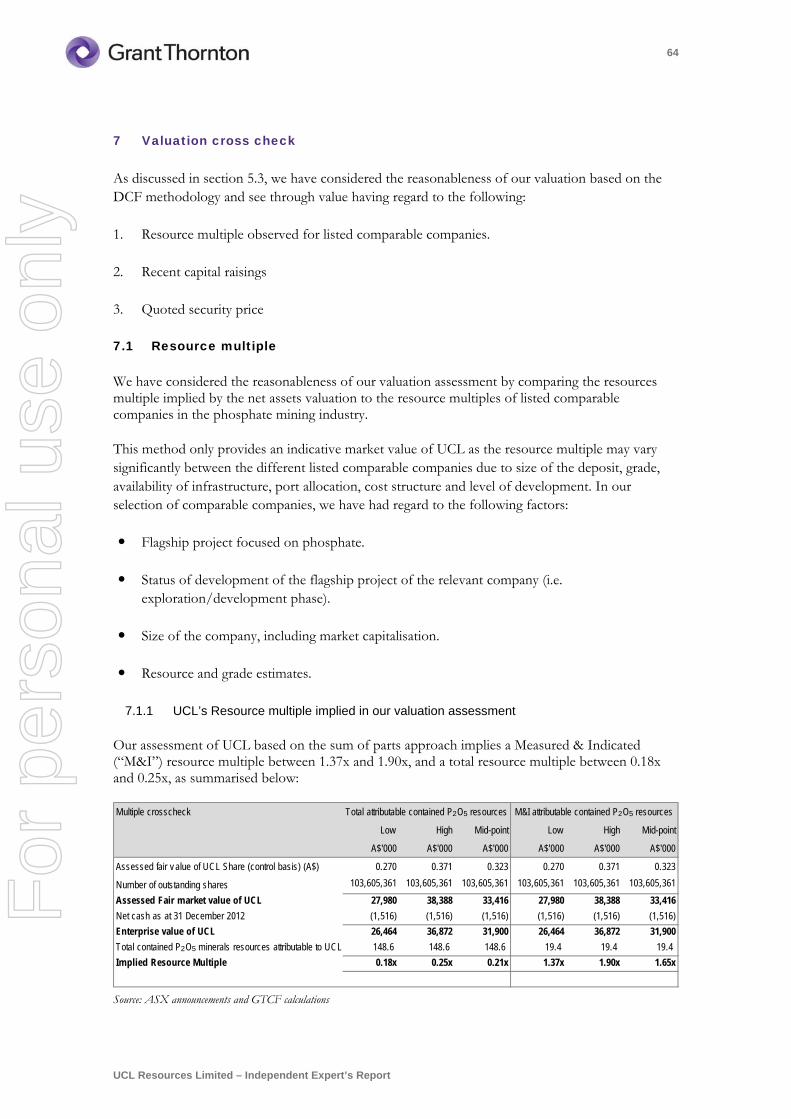
64
UCL Resources Limited – Independent Expert’s Report
7 Valuation cross check
As discussed in section 5.3, we have considered the reasonableness of our valuation based on the DCF methodology and see through value having regard to the following:
1. Resource multiple observed for listed comparable companies.
2. Recent capital raisings
3. Quoted security price
7.1 Resource multiple
We have considered the reasonableness of our valuation assessment by comparing the resources multiple implied by the net assets valuation to the resource multiples of listed comparable companies in the phosphate mining industry.
This method only provides an indicative market value of UCL as the resource multiple may vary significantly between the different listed comparable companies due to size of the deposit, grade, availability of infrastructure, port allocation, cost structure and level of development. In our selection of comparable companies, we have had regard to the following factors:
Flagship project focused on phosphate.
Status of development of the flagship project of the relevant company (i.e. exploration/development phase).
Size of the company, including market capitalisation.
Resource and grade estimates.
7.1.1 UCL’s Resource multiple implied in our valuation assessment
Our assessment of UCL based on the sum of parts approach implies a Measured & Indicated (“M&I”) resource multiple between 1.37x and 1.90x, and a total resource multiple between 0.18x and 0.25x, as summarised below:
Source: ASX announcements and GTCF calculations
Low High Mid-point Low High Mid-point
A$'000 A$'000 A$'000 A$'000 A$'000 A$'000
Assessed fair v alue of UCL Share (control basis) (A$) 0.270 0.371 0.323 0.270 0.371 0.323
Number of outstanding shares 103,605,361 103,605,361 103,605,361 103,605,361 103,605,361 103,605,361
Assessed Fair market value of UCL 27,980 38,388 33,416 27,980 38,388 33,416
Net cash as at 31 December 2012 (1,516) (1,516) (1,516) (1,516) (1,516) (1,516)
Enterprise value of UCL 26,464 36,872 31,900 26,464 36,872 31,900
Total contained P2O5 minerals resources attributable to UCL 148.6 148.6 148.6 19.4 19.4 19.4
Implied Resource Multiple 0.18x 0.25x 0.21x 1.37x 1.90x 1.65x
Multiple crosscheck Total attributable contained P2O5 resources M&I attributable contained P2O5 resources
For
per
sona
l use
onl
y
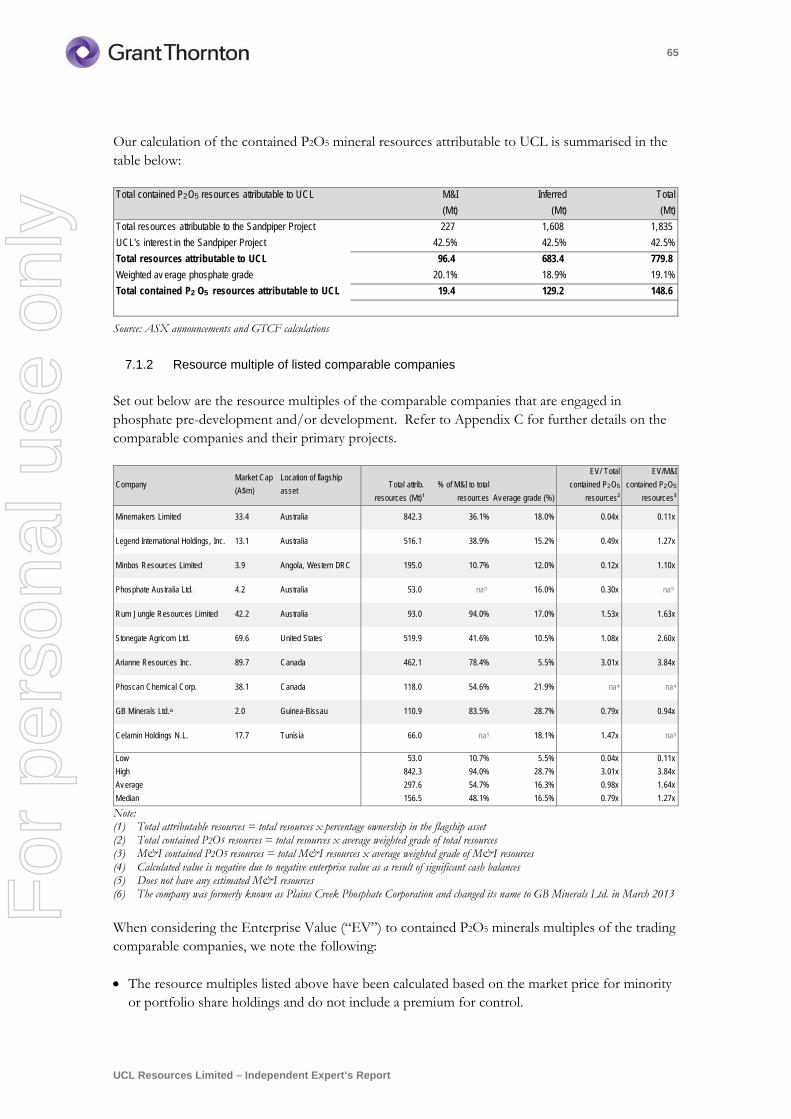
65
UCL Resources Limited – Independent Expert’s Report
Our calculation of the contained P2O5 mineral resources attributable to UCL is summarised in the table below:
Source: ASX announcements and GTCF calculations
7.1.2 Resource multiple of listed comparable companies
Set out below are the resource multiples of the comparable companies that are engaged in phosphate pre-development and/or development. Refer to Appendix C for further details on the comparable companies and their primary projects.
Note: (1) Total attributable resources = total resources x percentage ownership in the flagship asset (2) Total contained P2O5 resources = total resources x average weighted grade of total resources (3) M&I contained P2O5 resources = total M&I resources x average weighted grade of M&I resources (4) Calculated value is negative due to negative enterprise value as a result of significant cash balances (5) Does not have any estimated M&I resources (6) The company was formerly known as Plains Creek Phosphate Corporation and changed its name to GB Minerals Ltd. in March 2013
When considering the Enterprise Value (“EV”) to contained P2O5 minerals multiples of the trading comparable companies, we note the following:
The resource multiples listed above have been calculated based on the market price for minority or portfolio share holdings and do not include a premium for control.
M&I Inferred Total
(Mt) (Mt) (Mt)
Total resources attributable to the Sandpiper Project 227 1,608 1,835
UCL's interest in the Sandpiper Project 42.5% 42.5% 42.5%
Total resources attributable to UCL 96.4 683.4 779.8
Weighted av erage phosphate grade 20.1% 18.9% 19.1%
Total contained P2 O5 resources attributable to UCL 19.4 129.2 148.6
Total contained P2O5 resources attributable to UCL
CompanyMarket Cap
(A$m)
Location of flagship
assetTotal attrib.
resources (Mt)¹
% of M&I to total
resources Av erage grade (%)
EV/ Total
contained P2O5
resources²
EV/M&I
contained P2O5
resources³
Minemakers Limited 33.4 Australia 842.3 36.1% 18.0% 0.04x 0.11x
Legend International Holdings, Inc. 13.1 Australia 516.1 38.9% 15.2% 0.49x 1.27x
Minbos Resources Limited 3.9 Angola, Western DRC 195.0 10.7% 12.0% 0.12x 1.10x
Phosphate Australia Ltd. 4.2 Australia 53.0 na⁵ 16.0% 0.30x na⁵
Rum Jungle Resources Limited 42.2 Australia 93.0 94.0% 17.0% 1.53x 1.63x
Stonegate Agricom Ltd. 69.6 United States 519.9 41.6% 10.5% 1.08x 2.60x
Arianne Resources Inc. 89.7 Canada 462.1 78.4% 5.5% 3.01x 3.84x
Phoscan Chemical Corp. 38.1 Canada 118.0 54.6% 21.9% na⁴ na⁴
GB Minerals Ltd.⁶ 2.0 Guinea-Bissau 110.9 83.5% 28.7% 0.79x 0.94x
Celamin Holdings N.L. 17.7 Tunisia 66.0 na⁵ 18.1% 1.47x na⁵
Low 53.0 10.7% 5.5% 0.04x 0.11x
High 842.3 94.0% 28.7% 3.01x 3.84x
Av erage 297.6 54.7% 16.3% 0.98x 1.64x
Median 156.5 48.1% 16.5% 0.79x 1.27x
For
per
sona
l use
onl
y
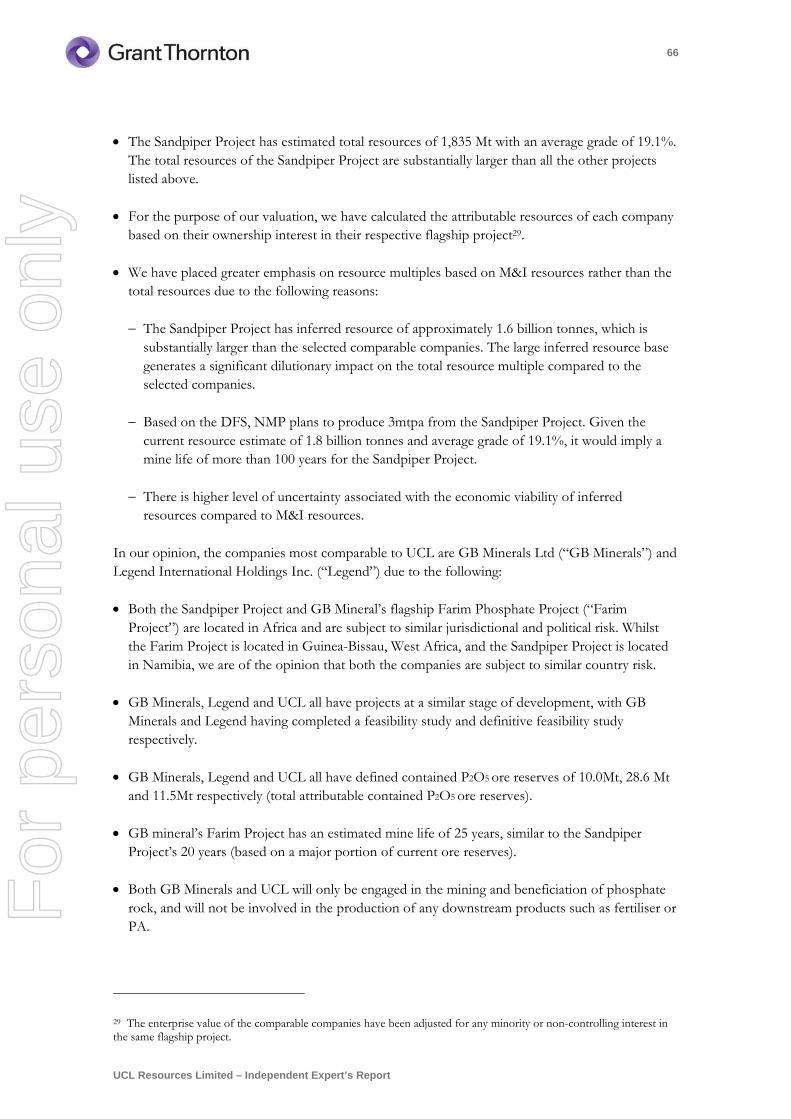
66
UCL Resources Limited – Independent Expert’s Report
The Sandpiper Project has estimated total resources of 1,835 Mt with an average grade of 19.1%. The total resources of the Sandpiper Project are substantially larger than all the other projects listed above.
For the purpose of our valuation, we have calculated the attributable resources of each company based on their ownership interest in their respective flagship project29.
We have placed greater emphasis on resource multiples based on M&I resources rather than the total resources due to the following reasons:
The Sandpiper Project has inferred resource of approximately 1.6 billion tonnes, which is substantially larger than the selected comparable companies. The large inferred resource base generates a significant dilutionary impact on the total resource multiple compared to the selected companies.
Based on the DFS, NMP plans to produce 3mtpa from the Sandpiper Project. Given the current resource estimate of 1.8 billion tonnes and average grade of 19.1%, it would imply a mine life of more than 100 years for the Sandpiper Project.
There is higher level of uncertainty associated with the economic viability of inferred resources compared to M&I resources.
In our opinion, the companies most comparable to UCL are GB Minerals Ltd (“GB Minerals”) and Legend International Holdings Inc. (“Legend”) due to the following:
Both the Sandpiper Project and GB Mineral’s flagship Farim Phosphate Project (“Farim Project”) are located in Africa and are subject to similar jurisdictional and political risk. Whilst the Farim Project is located in Guinea-Bissau, West Africa, and the Sandpiper Project is located in Namibia, we are of the opinion that both the companies are subject to similar country risk.
GB Minerals, Legend and UCL all have projects at a similar stage of development, with GB Minerals and Legend having completed a feasibility study and definitive feasibility study respectively.
GB Minerals, Legend and UCL all have defined contained P2O5 ore reserves of 10.0Mt, 28.6 Mt and 11.5Mt respectively (total attributable contained P2O5 ore reserves).
GB mineral’s Farim Project has an estimated mine life of 25 years, similar to the Sandpiper Project’s 20 years (based on a major portion of current ore reserves).
Both GB Minerals and UCL will only be engaged in the mining and beneficiation of phosphate rock, and will not be involved in the production of any downstream products such as fertiliser or PA.
29 The enterprise value of the comparable companies have been adjusted for any minority or non-controlling interest in the same flagship project.
For
per
sona
l use
onl
y
67
UCL Resources Limited – Independent Expert’s Report
Whilst GB Minerals and Legend are considered the most comparable companies, we also note the following differences:
Both GB Minerals and Legend hold 100% interest in their flagship projects and are expecting to develop in-land, open-pit mines adopting either open cast dredges or conventional open pit mining, whereas the Sandpiper Project is located offshore and will undertake a dredging extraction process.
Legend’s phosphate project, Paradise Project is located in Australia.
Both GB Minerals and Legend have a target phosphate concentrate grading of 33% P2O5, while the Sandpiper Project is expected to produce phosphate concentrates with a relatively lower grading but higher reactivity of 27.5% to 28% P2O5. This will likely result in different target product markets and different prices for phosphate rock produced. In addition, we note that unlike UCL and GB Minerals, Legend is a vertically integrated company and will also be constructing fertiliser production plants ($1,323.5 million incorporated in pre-production capital expenditure) to produce MAP and DAP from phosphate rock mined.
Legend’s flagship project is estimated to require significantly higher pre-production capital expenditure of US$1,776.0 million and GB Minerals’ flagship is estimated to require significantly lower pre-production capital expenditure of US$165.8 million compared to the Sandpiper Project.
Operating costs for the projects of GB Minerals and Legend of US$65/t and US$77/t are relatively higher than the estimated steady state operating cost for the Sandpiper Project of US$52/t of phosphate rock produced.
Before reaching our conclusion in relation to the implied M&I resource multiple, we have reviewed the liquidity of GB Minerals’ and Legend’s shares to ensure the market capitalisation is a fair representation of the underlying market value.
As set out in Appendix D, the liquidity of GM Minerals and Legend shares are limited and accordingly, the M&I Resource multiple may not necessarily represent market value. Furthermore, most of the comparable companies are at exploration/pre-development phase and are subject to low levels of trading and hence low liquidity levels.
In summary, whilst the implied M&I resource multiple of UCL on a control basis in the range of 1.37 times to 1.90 times does not appear unreasonable compared with the M&I resource multiples of GB Minerals and Legend of 0.94 times and 1.27 times on a minority basis30 respectively, we note that we cannot draw definitive conclusions due to the limited liquidity of GB Minerals’ and Legend’s share prices which may undermine the reliability of the trading price.
30 Evidence from studies indicates that premiums for control on successful takeovers have frequently been in the range of 20% to 40% and that the premiums vary significantly from transaction to transaction. In addition, It is also noted that the Sandpiper Project has substantially large inferred resource base compared to the Farim Project, which may provide UCL with a significant greater growth potential in the future.
For
per
sona
l use
onl
y
68
UCL Resources Limited – Independent Expert’s Report
7.2 Recent placement/rights issue
We have tested our valuation assessment of UCL with UCL’s capital raisings in May and June 2012 as summarised below:
In May 2012, UCL completed a share placement (Placement) to Mawarid to raise approximately A$3.64 million via the issue of approximately 12.1 million shares at an issue price of A$0.30 per share.
In conjunction with the Placement to provide UCL shareholders with an opportunity to participate in the issue on an equal basis with Mawarid, UCL undertook a 1 for 12 non-renounceable rights issue (Rights Issue) to raise approximately A$2.30 million at an issue price of A$0.30 per share in June 2012. The Rights Issue was fully underwritten by Mawarid.
Whilst these capital raisings were undertaken almost 12 months ago, we are of the opinion that we should consider and review them as part of the Takeover Offer given Mawarid acquired a relevant interest in UCL of 19.5%.
In relation to the Placement and Rights Issue price of A$0.30 per share, we note the following:
The Placement price of A$0.30 per share represented a premium of approximately 11.1% to the UCL share price 1-day prior the announcement of the Placement of A$0.27 per share. However, we note that UCL share price increased by 36.8 % as a result of the unsolicited takeover offer announced by Minemakers on 13 February 2012. The Placement price represents a premium of 63.2% compared to the share price of UCL before 13 February 2012.
The Rights Issue closed with only a total of A$327,525 application funds received, resulting in the Rights Issue being undersubscribed by A$1,970,353. This shortfall was taken up by Mawarid, which had fully underwritten the Rights Issue. Mawarid’s interest in UCL increased from 13.04% before the Rights Issue to 19.58% after the Rights Issue.
We believe that the Placement price of A$0.30 paid by Mawarid incorporated a degree of premium for control due to the following:
It was in line with the value of UCL implied in the initial takeover offer made by Minemakers in February 2012 of 9 Minemakers shares for every 10 UCL shares.
It was at a premium of 7.14% to the value of UCL implied in the improved takeover offer made by Minemakers in May 2012 of 13 Minemakers shares for every 10 UCL shares31.
Subsequent to the Placement and Rights Issue, Mawarid completed the acquisition of Minemakers’ 42.5% interest in the Sandpiper Project and 70% in the Rocky Point Project for a
31 Minemakers share price materially reduced from A$0.35 on 3 February 2012 to A$0.215 on 7 May 2012, a decrease of approximately 38.6%.
For
per
sona
l use
onl
y
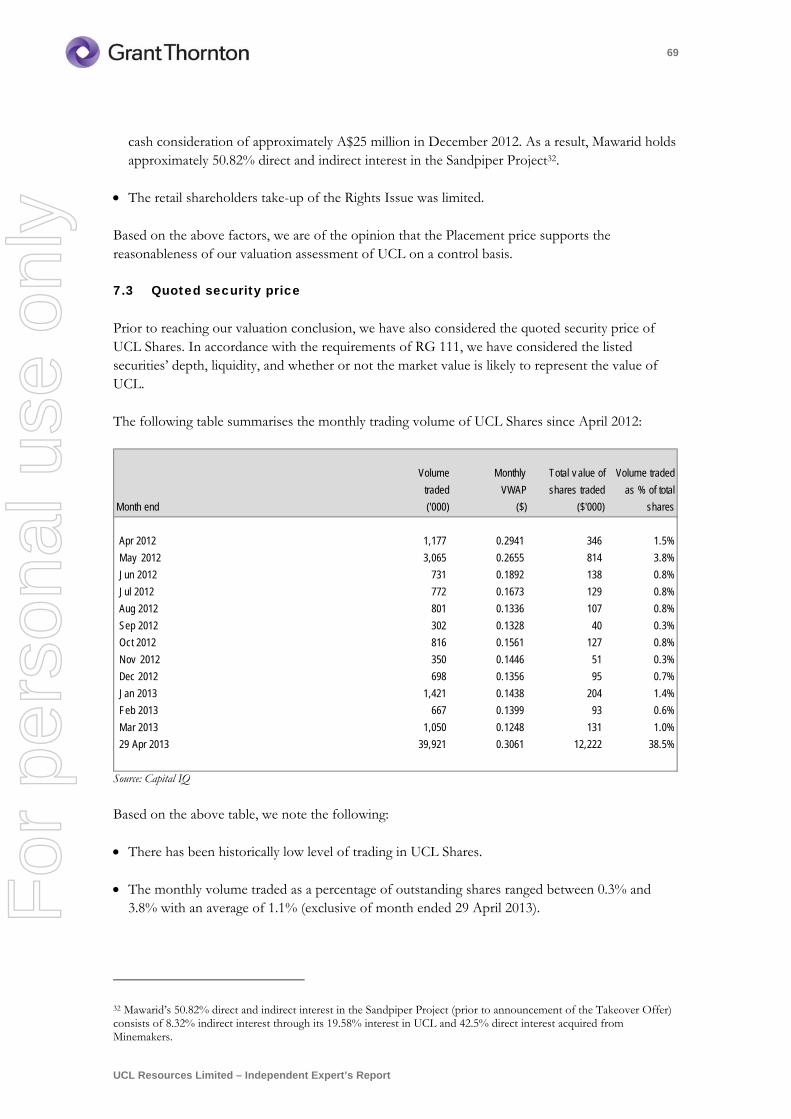
69
UCL Resources Limited – Independent Expert’s Report
cash consideration of approximately A$25 million in December 2012. As a result, Mawarid holds approximately 50.82% direct and indirect interest in the Sandpiper Project32.
The retail shareholders take-up of the Rights Issue was limited.
Based on the above factors, we are of the opinion that the Placement price supports the reasonableness of our valuation assessment of UCL on a control basis.
7.3 Quoted security price
Prior to reaching our valuation conclusion, we have also considered the quoted security price of UCL Shares. In accordance with the requirements of RG 111, we have considered the listed securities’ depth, liquidity, and whether or not the market value is likely to represent the value of UCL.
The following table summarises the monthly trading volume of UCL Shares since April 2012:
Source: Capital IQ
Based on the above table, we note the following:
There has been historically low level of trading in UCL Shares.
The monthly volume traded as a percentage of outstanding shares ranged between 0.3% and 3.8% with an average of 1.1% (exclusive of month ended 29 April 2013).
32 Mawarid’s 50.82% direct and indirect interest in the Sandpiper Project (prior to announcement of the Takeover Offer) consists of 8.32% indirect interest through its 19.58% interest in UCL and 42.5% direct interest acquired from Minemakers.
Month end
Volume
traded
('000)
Monthly
VWAP
($)
Total v alue of
shares traded
($'000)
Volume traded
as % of total
shares
Apr 2012 1,177 0.2941 346 1.5%
May 2012 3,065 0.2655 814 3.8%
Jun 2012 731 0.1892 138 0.8%
Jul 2012 772 0.1673 129 0.8%
Aug 2012 801 0.1336 107 0.8%
Sep 2012 302 0.1328 40 0.3%
Oct 2012 816 0.1561 127 0.8%
Nov 2012 350 0.1446 51 0.3%
Dec 2012 698 0.1356 95 0.7%
Jan 2013 1,421 0.1438 204 1.4%
Feb 2013 667 0.1399 93 0.6%
Mar 2013 1,050 0.1248 131 1.0%
29 Apr 2013 39,921 0.3061 12,222 38.5%
For
per
sona
l use
onl
y

70
UCL Resources Limited – Independent Expert’s Report
UCL Shares have been volatile over the past year with the minimum and maximum monthly VWAP price varying between 12.48 cents and 29.41 cents between April 2012 and March 2013.
Based on the above, we note that the liquidity of UCL shares is extremely low and accordingly, the trading share price of UCL may not be reflective of market value. As a result, we have not relied on the quoted security price of UCL for our valuation assessment.
For
per
sona
l use
onl
y
71
UCL Resources Limited – Independent Expert’s Report
8 Sources of information, disclaimer and consents
8.1 Sources of information
In preparing this report Grant Thornton Corporate Finance has used various sources of information, including:
UCL’s draft Target’s Statement dated on or around the date of this report. Mawarid’s Bidders Statement dated 23 April 2013. Annual reports of UCL for FY10, FY11 and FY12. Half year accounts for UCL for the period ended 31 December 2012. UCL’s share register. Snowden’s Report. UCL website. NMP website. Releases and announcements by UCL to the ASX. Various broker reports. Capital IQ. Mergermarket. Discussions with UCL Management. Other publicly available information.
For
per
sona
l use
onl
y
72
UCL Resources Limited – Independent Expert’s Report
8.2 Qualifications and independence
Grant Thornton Corporate Finance Pty Ltd holds Australian Financial Service Licence number 247140 under the Corporations Act and its authorised representatives are qualified to provide this report.
Grant Thornton Corporate Finance provides a full range of corporate finance services and has advised on numerous takeovers, corporate valuations, acquisitions, and restructures. Prior to accepting this engagement, Grant Thornton Corporate Finance considered its independence with respect to UCL and all other parties involved in the Takeover Offer with reference to the ASIC Regulatory Guide 112 “Independence of experts” and APES 110 “Code of Ethics for Professional Accountants” issued by the Accounting Professional and Ethical Standard Board. We have concluded that there are no conflicts of interest with respect to UCL, its shareholders and all other parties involved in the Takeover Offer.
Grant Thornton Corporate Finance and its related entities do not have at the date of this report, and have not had within the previous two years, any shareholding in or other relationship with UCL or its associated entities that could reasonably be regarded as capable of affecting its ability to provide an unbiased opinion in relation to the Takeover Offer.
Grant Thornton Corporate Finance has no involvement with, or interest in the outcome of the Takeover Offer, other than the preparation of this report.
Grant Thornton Corporate Finance will receive a fee based on commercial rates for the preparation of this report. This fee is not contingent on the outcome of the Takeover Offer. Grant Thornton Corporate Finance’s out of pocket expenses in relation to the preparation of the report will be reimbursed. Grant Thornton Corporate Finance will receive no other benefit for the preparation of this report.
We note that Grant Thornton Corporate Finance was appointed as an independent expert by UCL in February 2012 in relation to off-market takeover offer made by Minemakers. In our opinion, the above engagement does not impact on our ability to provide an independent and unbiased opinion in the context of the Takeover Offer. In our opinion, Grant Thornton Corporate Finance is independent of UCL, its Directors and all other parties involved in the Takeover Offer.
8.3 Limitations and reliance on information
This report and opinion is based on economic, market and other conditions prevailing at the date of this report. Such conditions can change significantly over relatively short periods of time.
Grant Thornton Corporate Finance has prepared this report on the basis of financial and other information provided by UCL and publicly available information. Grant Thornton Corporate Finance has considered and relied upon this information. Grant Thornton Corporate Finance has no reason to believe that any information supplied was false or that any material information has been withheld. Grant Thornton Corporate Finance has evaluated the information provided by UCL and other experts through inquiry, analysis and review, and nothing has come to our attention to indicate the information provided was materially misstated or would not afford reasonable grounds upon which to base our report. Nothing in this report should be taken to imply that Grant
For
per
sona
l use
onl
y
73
UCL Resources Limited – Independent Expert’s Report
Thornton Corporate Finance has audited any information supplied to us, or has in any way carried out an audit on the books of accounts or other records of UCL.
This report has been prepared to assist the directors of UCL in advising UCL Shareholders in relation to the Takeover Offer. This report should not be used for any other purpose. In particular, it is not intended that this report should be used for any purpose other than as an expression of Grant Thornton Corporate Finance’s opinion as to whether the Takeover Offer is fair and reasonable to UCL Shareholders.
UCL has indemnified Grant Thornton Corporate Finance, its affiliated companies and their respective officers and employees, who may be involved in or in any way associated with the performance of services contemplated by our engagement letter, against any and all losses, claims, damages and liabilities arising out of or related to the performance of those services whether by reason of their negligence or otherwise, excepting gross negligence and wilful misconduct, and which arise from reliance on information provided by UCL, which UCL knew or should have known to be false and/or reliance on information, which was material information UCL had in its possession and which UCL knew or should have known to be material and which UCL did not provide to Grant Thornton Corporate Finance. UCL will reimburse any indemnified party for all expenses (including without limitation, legal expenses) on a full indemnity basis as they are incurred.
8.4 Consents
Grant Thornton Corporate Finance consents to the issuing of this report in the form and context in which it is included in the Target’s Statement to be sent to UCL Shareholders. Neither the whole nor part of this report nor any reference thereto may be included in or with or attached to any other document, resolution, letter or statement without the prior written consent of Grant Thornton Corporate Finance as to the form and content in which it appears.
For
per
sona
l use
onl
y
74
UCL Resources Limited – Independent Expert’s Report
Appendix A – Valuation methodologies
Capitalisation of future maintainable earnings
The capitalisation of future maintainable earnings multiplied by appropriate earnings multiple is a suitable valuation method for businesses that are expected to trade profitably into the foreseeable future. Maintainable earnings are the assessed sustainable profits that can be derived by a company’s business and excludes any abnormal or “one off” profits or losses.
This approach involves a review of the multiples at which shares in listed companies in the same industry sector trade on the share market. These multiples give an indication of the price payable by portfolio investors for the acquisition of a parcel shareholding in the company.
Discounted future cash flows
An analysis of the net present value of forecast cash flows or DCF is a valuation technique based on the premise that the value of the business is the present value of its future cash flows. This technique is particularly suited to a business with a finite life. In applying this method, the expected level of future cash flows are discounted by an appropriate discount rate based on the weighted average cost of capital. The cost of equity capital, being a component of the Weighted Average Cost of Capital (“WACC”), is estimated using the Capital Asset Pricing Model.
Predicting future cash flows is a complex exercise requiring assumptions as to the future direction of the company, growth rates, operating and capital expenditure and numerous other factors. An application of this method generally requires cash flow forecasts for a minimum of five years.
Orderly realisation of assets
The amount that would be distributed to shareholders on an orderly realisation of assets is based on the assumption that a company is liquidated with the funds realised from the sale of its assets, after payment of all liabilities, including realisation costs and taxation charges that arise, being distributed to shareholders.
Market value of quoted securities
Market value is the price per issued share as quoted on the ASX or other recognised securities exchange. The share market price would, prima facie, constitute the market value of the shares of a publicly traded company, although such market price usually reflects the price paid for a minority holding or small parcel of shares, and does not reflect the market value offering control to the acquirer.
For
per
sona
l use
onl
y
75
UCL Resources Limited – Independent Expert’s Report
Comparable market transactions
The comparable transactions method is the value of similar assets established through comparative transactions to which is added the realisable value of surplus assets. The comparable transactions method uses similar or comparative transactions to establish a value for the current transaction.
Comparable transactions methodology involves applying multiples extracted from the market transaction price of similar assets to the equivalent assets and earnings of the company.
The risk attached to this valuation methodology is that in many cases, the relevant transactions contain features that are unique to that transaction and it is often difficult to establish sufficient detail of all the material factors that contributed to the transaction price.
For
per
sona
l use
onl
y
76
UCL Resources Limited – Independent Expert’s Report
Appendix B – Discount rate
Introduction
We have assessed a range of nominal, post-tax WACC.
The WACC represents the average rates of return required by providers of debt and equity capital to compensate for the time value of money and the perceived risk or uncertainty of the cash flows, weighted in proportion to the market value of the debt and equity capital provided.
We have used the Capital Asset Pricing Model (“CAPM”), which is commonly used by practitioners to calculate the WACC, however we note that the selection of an appropriate discount rate is ultimately a matter of professional judgment.
Under a classical tax system, the nominal WACC is calculated as follows:
ED
ERt1
EDD
RWACC ed
Where:
Re = the required rate of return on equity capital; E = the market value of equity capital; D = the market value of debt capital; Rd = the required rate of return on debt capital; and t = the statutory corporate tax rate. WACC inputs
In our assessment of the required rate of return on equity capital, we have observed the global financial markets and adopted the US market as a proxy due to the following:
Demand and supply for phosphate is driven by global forces and markets.
Majority of the costs are forecast be incurred in US$.
Phosphate is traded in US$.
A component of the phosphate produced by UCL will be exported.
Required rate of return on equity capital
The CAPM assumes that an investor holds a large portfolio comprising risk-free and risky investments. The total risk of an investment comprises systematic risk and specific risk. Systematic risk is the variability in an investment’s expected return that relates to general movements in capital markets (such as the share market) while specific risk is the variability that relates to matters that are specific to the investment being valued.
For
per
sona
l use
onl
y
77
UCL Resources Limited – Independent Expert’s Report
The CAPM assumes that specific risk can be avoided by holding investments as part of a large and well-diversified portfolio and that the investor will only require a rate of return sufficient to compensate for the additional, non-diversifiable systematic risk that the investment brings to the portfolio. Diversification cannot eliminate the systematic risk due to economy-wide factors that are assumed to affect all securities in a similar fashion. Accordingly, whilst investors can eliminate specific risk by diversifying their portfolio, they will seek to be compensated for the non-diversifiable systematic risk by way of a risk premium on the expected return. The extent of this compensation depends on the extent to which the company’s returns are correlated with the market as a whole. The greater the systematic risk faced by investors, the larger the required return on capital will be demanded by investors.
The systematic risk is measured by the investment’s beta. The beta is a measure of the co-variance of the expected returns of the investment with the expected returns on a hypothetical portfolio comprising all investments in the market - it is a measure of the investment’s relative risk.
A risk-free investment has a beta of zero and the market portfolio has a beta of one. The greater the non-diversifiable risk of an investment, the higher the beta of the investment.
The CAPM assumes that the return required by an investor in respect of an investment will be a combination of the risk-free rate of return and a premium for systematic risk, which is measured by multiplying the beta of the investment by the return earned on the market portfolio in excess of the risk-free rate.
Under the CAPM, the required nominal rate of return on equity (Re) is estimated as follows:
fmefe RRRR
Where:
Rf = risk free rate βe = expected equity beta of the investment (Rm – Rf) = market risk premium
Risk Free Rate
We have adopted a risk free rate of 3.7% based on the 10 year average of the 10 year US Government Bonds' yield. We selected the 10 year average due to high volatility in global equity markets over the past several years and subsequently, the potential distortion possible with recent quantitative easing.
Market Risk Premium
The market risk premium represents the additional return an investor expects to receive to compensate for additional risk associated with investing in equities as opposed to assets on which a risk free rate of return is earned.
For
per
sona
l use
onl
y
78
UCL Resources Limited – Independent Expert’s Report
The expected return of the market in excess of the risk-free rate, termed the long horizon equity risk premium, has been estimated based on an historical study of mean actual returns as published in Stocks, Bonds, Bills and Inflation® Valuation Edition 2012 Yearbook, (Morningstar, Inc., 2012).
An adjusted long horizon equity risk premium of 5.8% has been utilised based on current research indicating that the actual long horizon risk premium is approximately 100 basis points less than that indicated by the Ibbotson full period data.
Beta
The beta measures the expected relative risk of the equity in a company. The choice of the beta requires judgement and necessarily involves subjective assessment as it is subject to measurement issues and a high degree of variation.
An equity beta includes the effect of gearing on equity returns and reflects the riskiness of returns to equity holders. However, an asset beta excludes the impact of gearing and reflects the riskiness of returns on the asset, rather than returns to equity holders. Asset betas can be compared across asset classes independent of the impact of the financial structure adopted by the owners of the business.
Equity betas are typically calculated from historical data. These are then used as a proxy for the future which assumes that the relative risk of the past will continue into the future. Therefore, there is no right equity beta and it is important not to simply apply historical equity betas when calculating the cost of equity.
For the purpose of this report, we have had regard to the observed betas (equity betas) of pre-production companies engaged in phosphate exploration and development activities.
For
per
sona
l use
onl
y
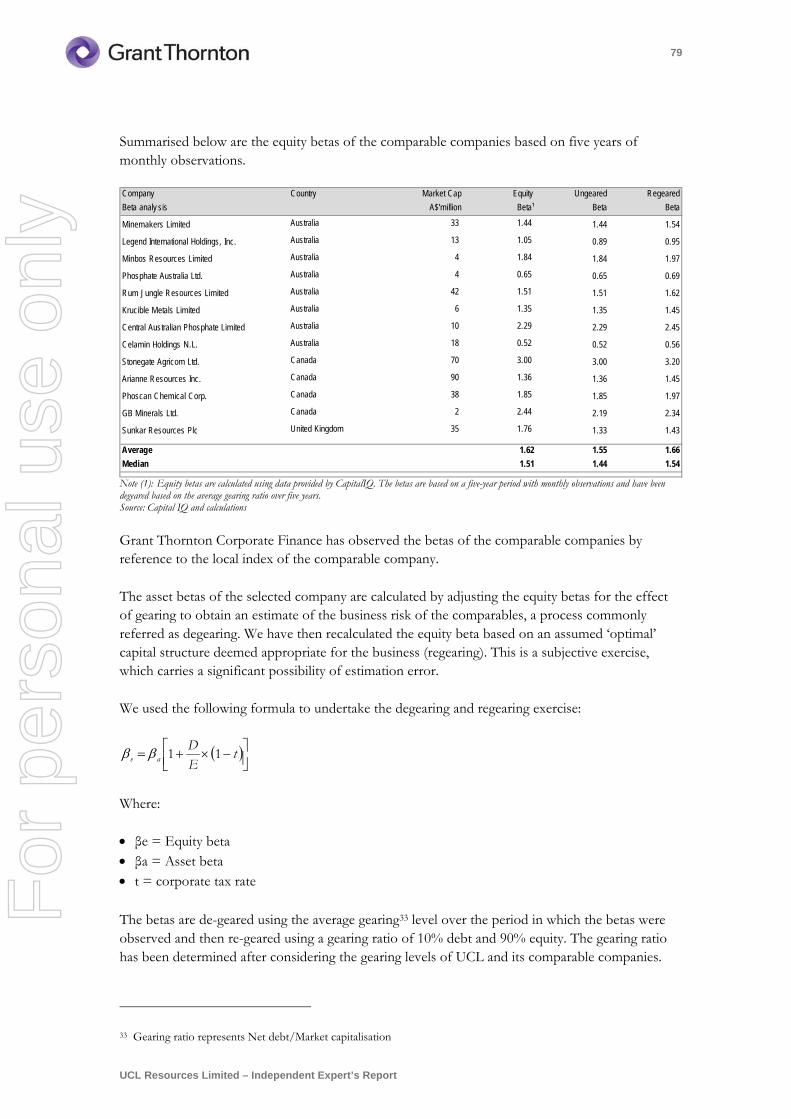
79
UCL Resources Limited – Independent Expert’s Report
Summarised below are the equity betas of the comparable companies based on five years of monthly observations.
Note (1): Equity betas are calculated using data provided by CapitalIQ. The betas are based on a five-year period with monthly observations and have been degeared based on the average gearing ratio over five years. Source: Capital IQ and calculations
Grant Thornton Corporate Finance has observed the betas of the comparable companies by reference to the local index of the comparable company.
The asset betas of the selected company are calculated by adjusting the equity betas for the effect of gearing to obtain an estimate of the business risk of the comparables, a process commonly referred as degearing. We have then recalculated the equity beta based on an assumed ‘optimal’ capital structure deemed appropriate for the business (regearing). This is a subjective exercise, which carries a significant possibility of estimation error.
We used the following formula to undertake the degearing and regearing exercise:
t
ED
ae 11
Where:
βe = Equity beta βa = Asset beta t = corporate tax rate
The betas are de-geared using the average gearing33 level over the period in which the betas were observed and then re-geared using a gearing ratio of 10% debt and 90% equity. The gearing ratio has been determined after considering the gearing levels of UCL and its comparable companies.
33 Gearing ratio represents Net debt/Market capitalisation
Company Country Market Cap Equity Ungeared Regeared
Beta analy sis A$'million Beta¹ Beta Beta
Minemakers Limited Australia 33 1.44 1.44 1.54
Legend International Holdings, Inc. Australia 13 1.05 0.89 0.95
Minbos Resources Limited Australia 4 1.84 1.84 1.97
Phosphate Australia Ltd. Australia 4 0.65 0.65 0.69
Rum Jungle Resources Limited Australia 42 1.51 1.51 1.62
Krucible Metals Limited Australia 6 1.35 1.35 1.45
Central Australian Phosphate Limited Australia 10 2.29 2.29 2.45
Celamin Holdings N.L. Australia 18 0.52 0.52 0.56
Stonegate Agricom Ltd. Canada 70 3.00 3.00 3.20
Arianne Resources Inc. Canada 90 1.36 1.36 1.45
Phoscan Chemical Corp. Canada 38 1.85 1.85 1.97
GB Minerals Ltd. Canada 2 2.44 2.19 2.34
Sunkar Resources Plc United Kingdom 35 1.76 1.33 1.43
Average 1.62 1.55 1.66
Median 1.51 1.44 1.54
For
per
sona
l use
onl
y
80
UCL Resources Limited – Independent Expert’s Report
It should be noted that the above betas are drawn from the actual and observed historic relationship between risk and returns. From these actual results, the expected relationship is estimated generally on the basis of extrapolating past results. Despite the arbitrary nature of the calculations it is important to assess their commercial reasonableness. That is, to assess how closely the observed relationship is likely to deviate from the expected relationship.
Consequently, while measured equity betas of the listed comparable companies provide useful benchmarks against which the equity beta used in estimating the cost of equity for the pre-development assets, the selection of an unsystematic equity beta requires a level of judgement.
For the purposes of this valuation, we have selected a beta range of between 1.60 and 1.70 to calculate the required rate of return on equity capital for UCL.
Specific risk premium
Specific risk premium represents the additional return an investor expects to receive to compensate for country, size and project related risks not reflected in the beta of the observed comparable companies.
In assessing the appropriate specific risk premium to be applied, we have considered the following:
Country risk premium. Professor Aswath Damodaran of Stern School of Business at New York University refers to a potential country risk premium for Namibia of 3.0%.
The nature, size and diversification of operations compared to the selected comparable companies.
Operational and financial risks in relation to NMP’s intention to dredge phosphate from unprecedented depths at the Sandpiper Project.
Required substantial pre-production capital expenditure for the Sandpiper Project.
The relatively lower phosphate concentrate grade to be produced by NMP.
Other specific circumstances of the Sandpiper Project.
Based on the above, we have adopted a specific risk premium of 5% (including a country risk premium of 3%). We note that the selection of the specific risk premium involves a certain level of professional judgement and as a result, the total specific risk premium is not fully quantifiable with analytical data.
Cost of Debt
For the purposes of estimating the cost of debt, Grant Thornton Corporate Finance has considered the following:
The margin implicit in corporate bond yields over the US Government bond yields.
For
per
sona
l use
onl
y
81
UCL Resources Limited – Independent Expert’s Report
The debt ratings of comparable companies, in particular, Moody’s BAA credit ratings.
Cost of debt achievable for an equivalent business in the industry.
Expectations on the yield curve.
Based on the above, Grant Thornton Corporate Finance has adopted a cost of debt in the range of 7.0% to 9.0%. We note that we have adopted a target capital structure of 90% equity based on the basket of comparable companies.
Capital Structure
When forming a view on the gearing ratio used to calculate the WACC, Grant Thornton Corporate Finance has considered the gearing ratio which a hypothetical purchaser of the business would adopt in order to generate a balanced return given the inherent risks associated with debt financing. Factors which a hypothetical purchaser may consider include the return to shareholders after interest payments, and the ability of the businesses to raise external debt.
In determining the appropriate capital structure for the purpose of this report, we have had regard to UCL’s capital structure and the average gearing ratio of comparable companies.
For the purpose of the valuation of UCL, Grant Thornton Corporate Finance has adopted a debt-to-enterprise ratio of 10% debt and 90% equity.
For
per
sona
l use
onl
y
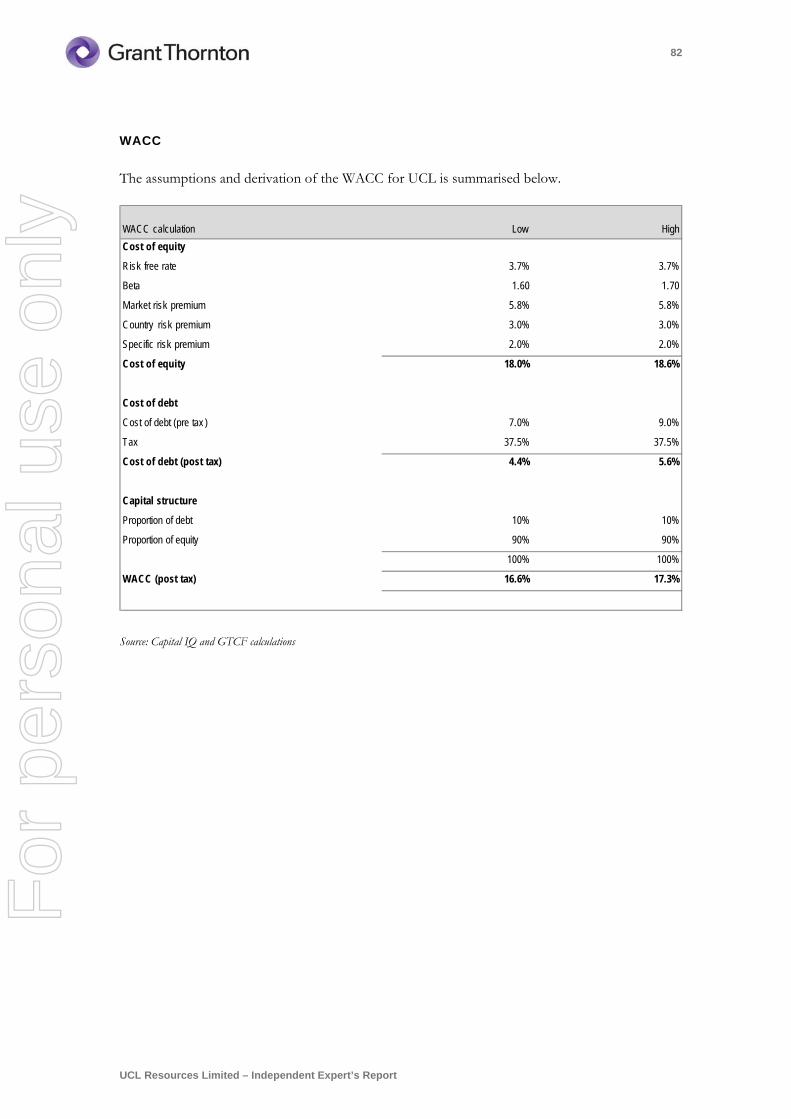
82
UCL Resources Limited – Independent Expert’s Report
WACC
The assumptions and derivation of the WACC for UCL is summarised below.
Source: Capital IQ and GTCF calculations
WACC calculation Low High
Cost of equity
Risk free rate 3.7% 3.7%
Beta 1.60 1.70
Market risk premium 5.8% 5.8%
Country risk premium 3.0% 3.0%
Specific risk premium 2.0% 2.0%
Cost of equity 18.0% 18.6%
Cost of debt
Cost of debt (pre tax ) 7.0% 9.0%
Tax 37.5% 37.5%
Cost of debt (post tax) 4.4% 5.6%
Capital structure
Proportion of debt 10% 10%
Proportion of equity 90% 90%
100% 100%
WACC (post tax) 16.6% 17.3%
For
per
sona
l use
onl
y
83
UCL Resources Limited – Independent Expert’s Report
Appendix C – Comparable companies
Descriptions
Arianne Resources Inc - together with its subsidiaries, engages in the acquisition, exploration, appraisal, development, and mining of mineral properties primarily in Canada and Mexico. It explores for precious metals, including gold and silver; base metals; and industrial minerals, such as rare earth elements. The company primarily holds interest in the Lac à Paul phosphorus-titanium project located to the north of the Saguenay–Lac-Saint-Jean region, Québec, Canada. Arianne Resources Inc. was founded in 1997 and is headquartered in Chicoutimi, Canada.
Celamin Holdings N.L. - together with its subsidiaries, engages in the exploration and development of resource projects primarily in Tunisia and Algeria, North Africa. The company primarily holds 80% working interest in the Chaketma Phosphate project located in Tunisia. It also owns 80% working interest in the Bir El Afou Phosphate project; and 50% working interests in the El Haouria, Oued Maden, and Sidi Driss projects containing lead and zinc metals located in Tunisia, as well as has farm in agreement for the Oued El Kebir project containing lead, zinc, and silver ores located in Algeria. The company was formerly known as Victorian Gold Mines NL and changed its name to Celamin Holdings NL in October 2010. Celamin Holdings NL was incorporated in 2009 and is based in South Melbourne, Australia.
Legend International Holdings, Inc. - an exploration stage mining company, engages in the exploration, development, and mining of base metal properties in Australia. The company’s principal property includes the Paradise South phosphate project located to the north west of Mt Isa in north-western Queensland. Its landholdings for prospective phosphate, diamonds, and base metals are in Queensland and the Northern Territory. The company was formerly known as Sundew International, Inc. and changed its name to Legend International Holdings, Inc. in March 2003. Legend International Holdings, Inc. was founded in 2001 and is headquartered in Melbourne, Australia.
Minbos Resources Limited - together with its subsidiaries, engages in the exploration and development of phosphate and potash bearing ore in Angola and the Democratic Republic of Congo. The company, through a joint venture agreement, holds a 50% interest in the Cabinda project that comprises the Mongo Tando prospect in the west and the Cacata prospect in the east with an area of approximately 200,000 hectares in Angola. It also holds exploration licenses and applications hosting the Kanzi and Fundu-Nzobe prospects with an area of approximately 200,000 hectares in the Dominican Republic of Congo. The company was founded in 2009 and is based in West Perth, Australia.
Minemakers Limited - engages in the exploration, evaluation, and development of mineral deposits in Australia. It primarily explores for phosphate and salt. The company principally holds a 100% interest in the Wonarah Rock Phosphate project located in the Northern Territory, Australia. Minemakers Limited is based in West Perth, Australia. In December 2012 Minemakers announced it had completed the sale of its 42.5% interest in the Sandpiper Project and 70% interest in the Rocky Point Project in Namibia to Mawarid for approximately $A25 million.
Phoscan Chemical Corp. - a development-stage company, engages in acquiring, exploring, and developing mineral and natural resource properties. It holds a 100% interest in the Martison Phosphate project consisting of phosphate deposits located near Hearst, Ontario, Canada. The company was formerly known as MCK Mining Corp. and changed its name to Phoscan Chemical Corp. in July 2006. Phoscan Chemical Corp. was founded in 1994 and is based in Toronto, Canada.
Phosphate Australia Limited - engages in the acquisition, exploration, and development of phosphate, iron, and uranium properties in Australia. The company was formerly known as
For
per
sona
l use
onl
y
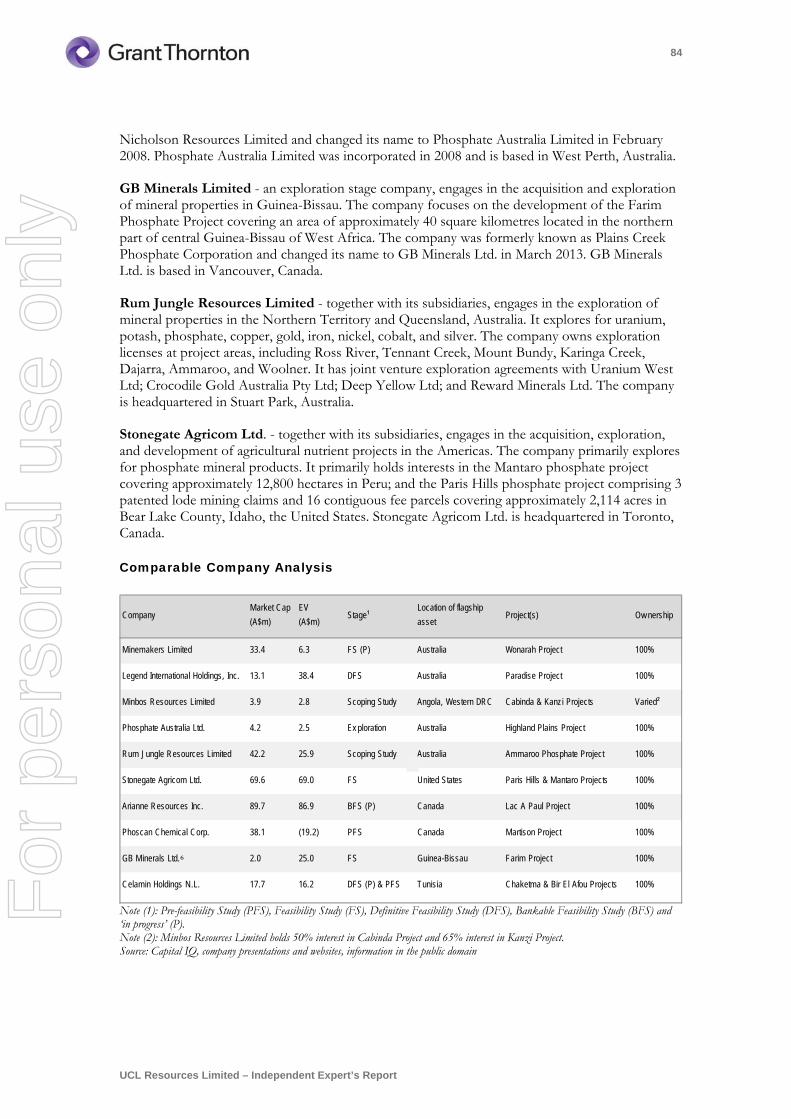
84
UCL Resources Limited – Independent Expert’s Report
Nicholson Resources Limited and changed its name to Phosphate Australia Limited in February 2008. Phosphate Australia Limited was incorporated in 2008 and is based in West Perth, Australia.
GB Minerals Limited - an exploration stage company, engages in the acquisition and exploration of mineral properties in Guinea-Bissau. The company focuses on the development of the Farim Phosphate Project covering an area of approximately 40 square kilometres located in the northern part of central Guinea-Bissau of West Africa. The company was formerly known as Plains Creek Phosphate Corporation and changed its name to GB Minerals Ltd. in March 2013. GB Minerals Ltd. is based in Vancouver, Canada.
Rum Jungle Resources Limited - together with its subsidiaries, engages in the exploration of mineral properties in the Northern Territory and Queensland, Australia. It explores for uranium, potash, phosphate, copper, gold, iron, nickel, cobalt, and silver. The company owns exploration licenses at project areas, including Ross River, Tennant Creek, Mount Bundy, Karinga Creek, Dajarra, Ammaroo, and Woolner. It has joint venture exploration agreements with Uranium West Ltd; Crocodile Gold Australia Pty Ltd; Deep Yellow Ltd; and Reward Minerals Ltd. The company is headquartered in Stuart Park, Australia.
Stonegate Agricom Ltd. - together with its subsidiaries, engages in the acquisition, exploration, and development of agricultural nutrient projects in the Americas. The company primarily explores for phosphate mineral products. It primarily holds interests in the Mantaro phosphate project covering approximately 12,800 hectares in Peru; and the Paris Hills phosphate project comprising 3 patented lode mining claims and 16 contiguous fee parcels covering approximately 2,114 acres in Bear Lake County, Idaho, the United States. Stonegate Agricom Ltd. is headquartered in Toronto, Canada.
Comparable Company Analysis
Note (1): Pre-feasibility Study (PFS), Feasibility Study (FS), Definitive Feasibility Study (DFS), Bankable Feasibility Study (BFS) and ‘in progress’ (P). Note (2): Minbos Resources Limited holds 50% interest in Cabinda Project and 65% interest in Kanzi Project. Source: Capital IQ, company presentations and websites, information in the public domain
CompanyMarket Cap
(A$m)
EV
(A$m)Stage¹
Location of flagship
assetProject(s) Ow nership
Minemakers Limited 33.4 6.3 FS (P) Australia Wonarah Project 100%
Legend International Holdings, Inc. 13.1 38.4 DFS Australia Paradise Project 100%
Minbos Resources Limited 3.9 2.8 Scoping Study Angola, Western DRC Cabinda & Kanzi Projects Varied²
Phosphate Australia Ltd. 4.2 2.5 Ex ploration Australia Highland Plains Project 100%
Rum Jungle Resources Limited 42.2 25.9 Scoping Study Australia Ammaroo Phosphate Project 100%
Stonegate Agricom Ltd. 69.6 69.0 FS United States Paris Hills & Mantaro Projects 100%
Arianne Resources Inc. 89.7 86.9 BFS (P) Canada Lac A Paul Project 100%
Phoscan Chemical Corp. 38.1 (19.2) PFS Canada Martison Project 100%
GB Minerals Ltd.⁶ 2.0 25.0 FS Guinea-Bissau Farim Project 100%
Celamin Holdings N.L. 17.7 16.2 DFS (P) & PFS Tunisia Chaketma & Bir El Afou Projects 100%For
per
sona
l use
onl
y
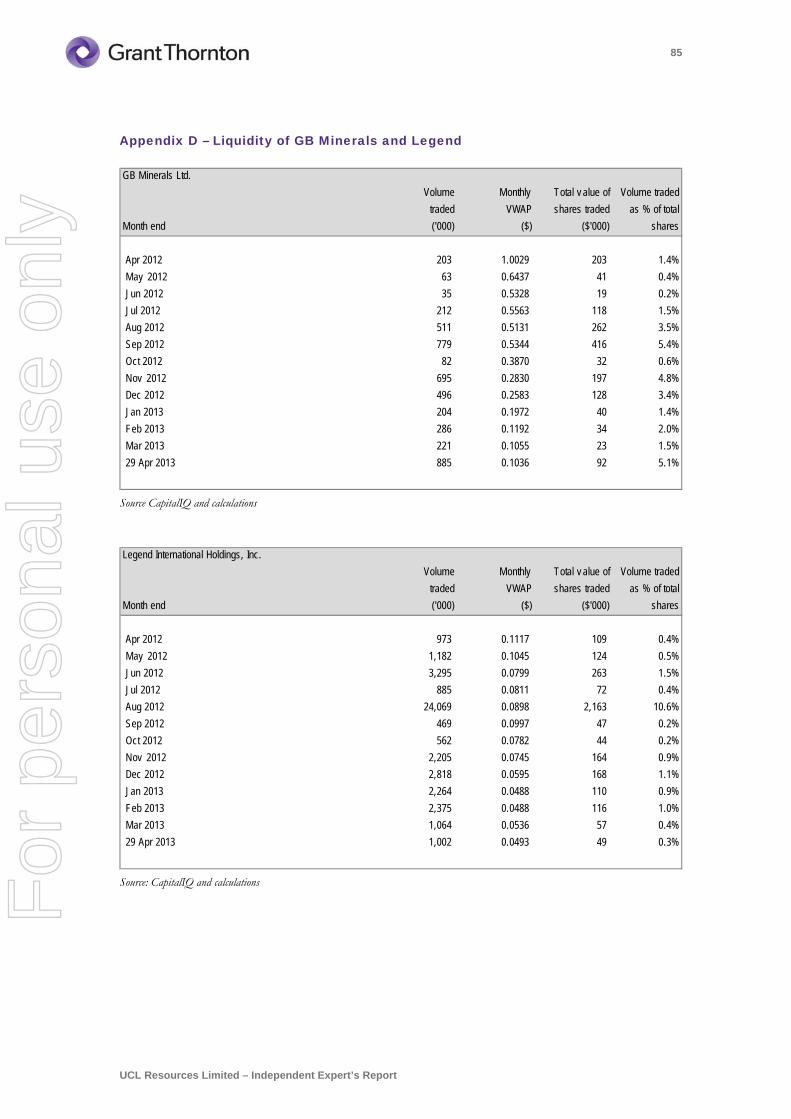
85
UCL Resources Limited – Independent Expert’s Report
Appendix D – Liquidity of GB Minerals and Legend
Source CapitalIQ and calculations
Source: CapitalIQ and calculations
GB Minerals Ltd.
Month end
Volume
traded
('000)
Monthly
VWAP
($)
Total v alue of
shares traded
($'000)
Volume traded
as % of total
shares
Apr 2012 203 1.0029 203 1.4%
May 2012 63 0.6437 41 0.4%
Jun 2012 35 0.5328 19 0.2%
Jul 2012 212 0.5563 118 1.5%
Aug 2012 511 0.5131 262 3.5%
Sep 2012 779 0.5344 416 5.4%
Oct 2012 82 0.3870 32 0.6%
Nov 2012 695 0.2830 197 4.8%
Dec 2012 496 0.2583 128 3.4%
Jan 2013 204 0.1972 40 1.4%
Feb 2013 286 0.1192 34 2.0%
Mar 2013 221 0.1055 23 1.5%
29 Apr 2013 885 0.1036 92 5.1%
Legend International Holdings, Inc.
Month end
Volume
traded
('000)
Monthly
VWAP
($)
Total v alue of
shares traded
($'000)
Volume traded
as % of total
shares
Apr 2012 973 0.1117 109 0.4%
May 2012 1,182 0.1045 124 0.5%
Jun 2012 3,295 0.0799 263 1.5%
Jul 2012 885 0.0811 72 0.4%
Aug 2012 24,069 0.0898 2,163 10.6%
Sep 2012 469 0.0997 47 0.2%
Oct 2012 562 0.0782 44 0.2%
Nov 2012 2,205 0.0745 164 0.9%
Dec 2012 2,818 0.0595 168 1.1%
Jan 2013 2,264 0.0488 110 0.9%
Feb 2013 2,375 0.0488 116 1.0%
Mar 2013 1,064 0.0536 57 0.4%
29 Apr 2013 1,002 0.0493 49 0.3%
For
per
sona
l use
onl
y
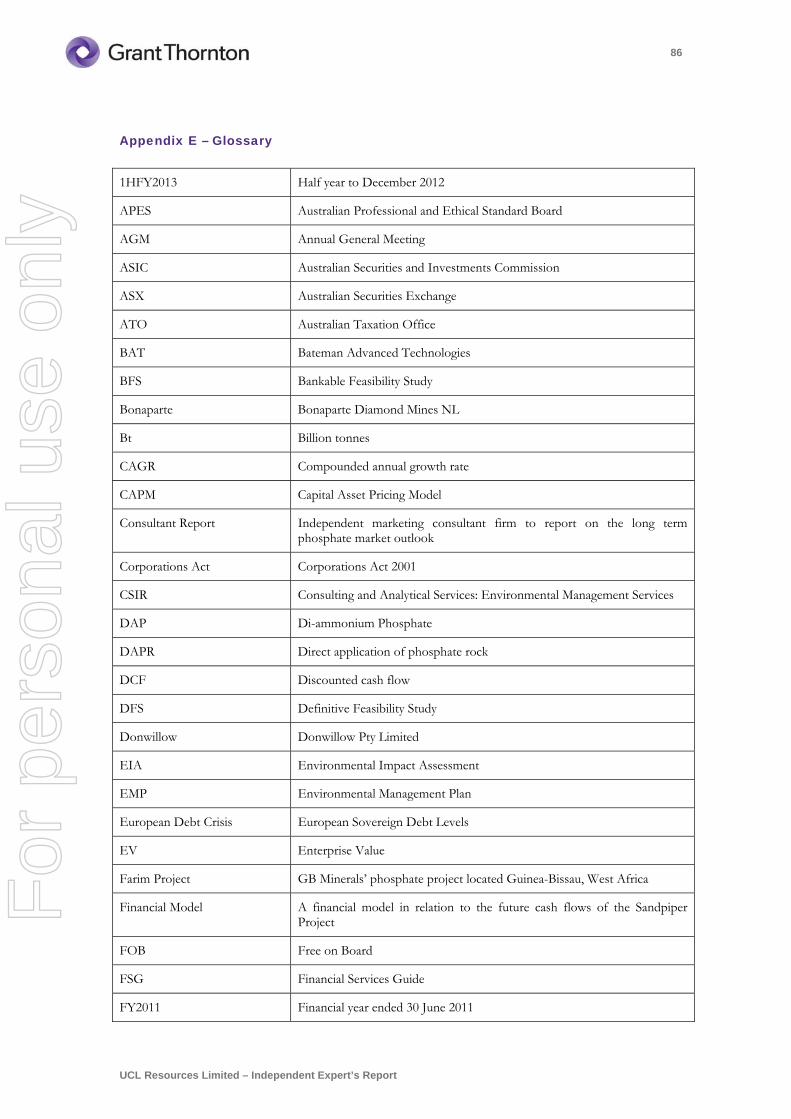
86
UCL Resources Limited – Independent Expert’s Report
Appendix E – Glossary
1HFY2013 Half year to December 2012
APES Australian Professional and Ethical Standard Board
AGM Annual General Meeting
ASIC Australian Securities and Investments Commission
ASX Australian Securities Exchange
ATO Australian Taxation Office
BAT Bateman Advanced Technologies
BFS Bankable Feasibility Study
Bonaparte Bonaparte Diamond Mines NL
Bt Billion tonnes
CAGR Compounded annual growth rate
CAPM Capital Asset Pricing Model
Consultant Report Independent marketing consultant firm to report on the long term phosphate market outlook
Corporations Act Corporations Act 2001
CSIR Consulting and Analytical Services: Environmental Management Services
DAP Di-ammonium Phosphate
DAPR Direct application of phosphate rock
DCF Discounted cash flow
DFS Definitive Feasibility Study
Donwillow Donwillow Pty Limited
EIA Environmental Impact Assessment
EMP Environmental Management Plan
European Debt Crisis European Sovereign Debt Levels
EV Enterprise Value
Farim Project GB Minerals’ phosphate project located Guinea-Bissau, West Africa
Financial Model A financial model in relation to the future cash flows of the Sandpiper Project
FOB Free on Board
FSG Financial Services Guide
FY2011 Financial year ended 30 June 2011
For
per
sona
l use
onl
y
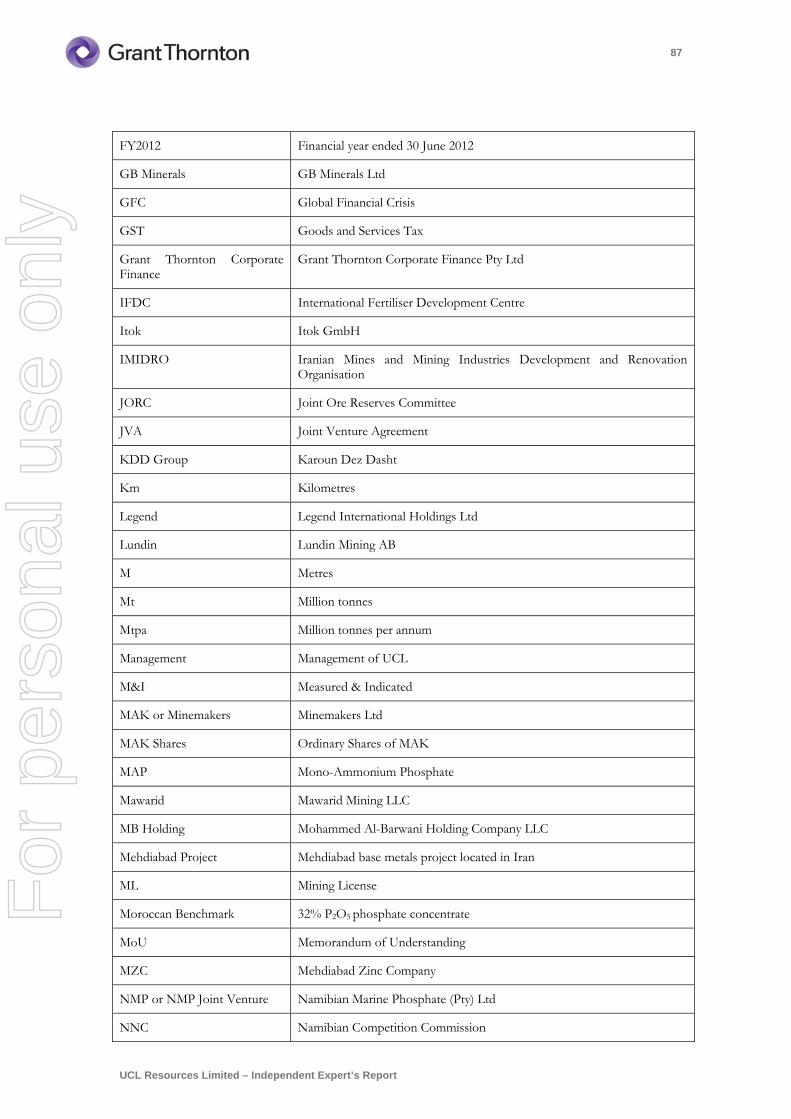
87
UCL Resources Limited – Independent Expert’s Report
FY2012 Financial year ended 30 June 2012
GB Minerals GB Minerals Ltd
GFC Global Financial Crisis
GST Goods and Services Tax
Grant Thornton Corporate Finance
Grant Thornton Corporate Finance Pty Ltd
IFDC International Fertiliser Development Centre
Itok Itok GmbH
IMIDRO Iranian Mines and Mining Industries Development and Renovation Organisation
JORC Joint Ore Reserves Committee
JVA Joint Venture Agreement
KDD Group Karoun Dez Dasht
Km Kilometres
Legend Legend International Holdings Ltd
Lundin Lundin Mining AB
M Metres
Mt Million tonnes
Mtpa Million tonnes per annum
Management Management of UCL
M&I Measured & Indicated
MAK or Minemakers Minemakers Ltd
MAK Shares Ordinary Shares of MAK
MAP Mono-Ammonium Phosphate
Mawarid Mawarid Mining LLC
MB Holding Mohammed Al-Barwani Holding Company LLC
Mehdiabad Project Mehdiabad base metals project located in Iran
ML Mining License
Moroccan Benchmark 32% P2O5 phosphate concentrate
MoU Memorandum of Understanding
MZC Mehdiabad Zinc Company
NMP or NMP Joint Venture Namibian Marine Phosphate (Pty) Ltd
NNC Namibian Competition Commission
For
per
sona
l use
onl
y
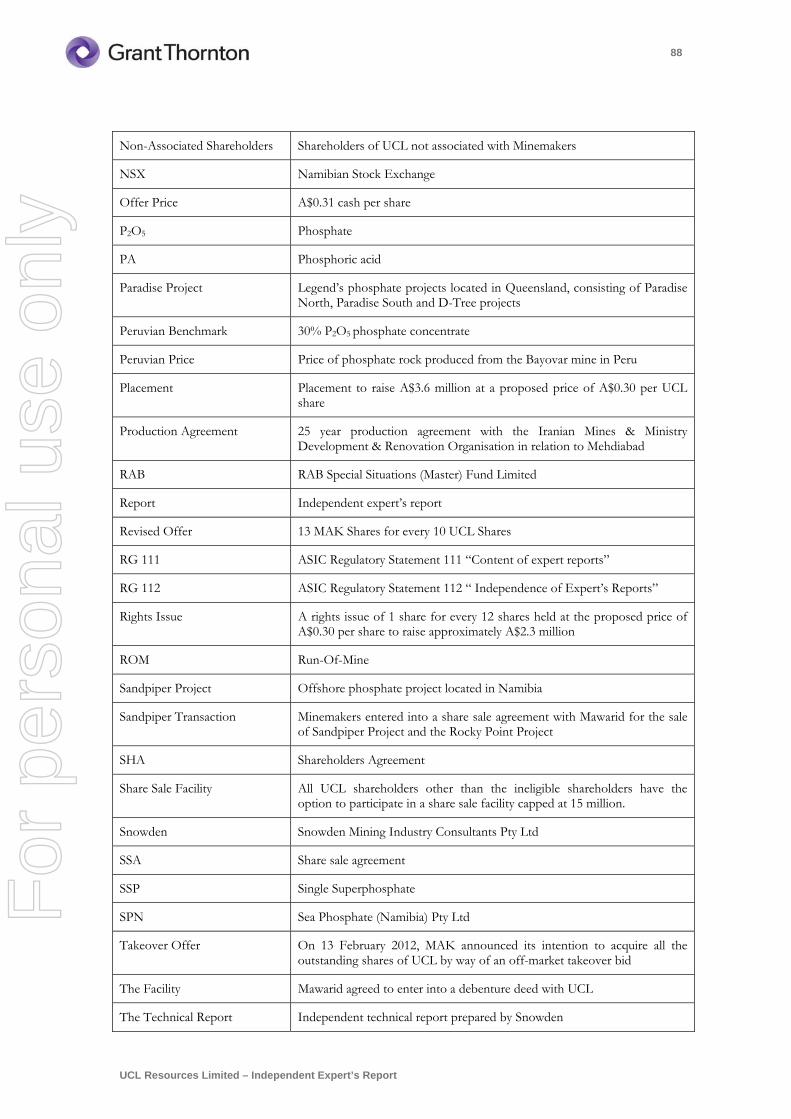
88
UCL Resources Limited – Independent Expert’s Report
Non-Associated Shareholders Shareholders of UCL not associated with Minemakers
NSX Namibian Stock Exchange
Offer Price A$0.31 cash per share
P2O5 Phosphate
PA Phosphoric acid
Paradise Project Legend’s phosphate projects located in Queensland, consisting of Paradise North, Paradise South and D-Tree projects
Peruvian Benchmark 30% P2O5 phosphate concentrate
Peruvian Price Price of phosphate rock produced from the Bayovar mine in Peru
Placement Placement to raise A$3.6 million at a proposed price of A$0.30 per UCL share
Production Agreement 25 year production agreement with the Iranian Mines & Ministry Development & Renovation Organisation in relation to Mehdiabad
RAB RAB Special Situations (Master) Fund Limited
Report Independent expert’s report
Revised Offer 13 MAK Shares for every 10 UCL Shares
RG 111 ASIC Regulatory Statement 111 “Content of expert reports”
RG 112 ASIC Regulatory Statement 112 “ Independence of Expert’s Reports”
Rights Issue A rights issue of 1 share for every 12 shares held at the proposed price of A$0.30 per share to raise approximately A$2.3 million
ROM Run-Of-Mine
Sandpiper Project Offshore phosphate project located in Namibia
Sandpiper Transaction Minemakers entered into a share sale agreement with Mawarid for the sale of Sandpiper Project and the Rocky Point Project
SHA Shareholders Agreement
Share Sale Facility All UCL shareholders other than the ineligible shareholders have the option to participate in a share sale facility capped at 15 million.
Snowden Snowden Mining Industry Consultants Pty Ltd
SSA Share sale agreement
SSP Single Superphosphate
SPN Sea Phosphate (Namibia) Pty Ltd
Takeover Offer On 13 February 2012, MAK announced its intention to acquire all the outstanding shares of UCL by way of an off-market takeover bid
The Facility Mawarid agreed to enter into a debenture deed with UCL
The Technical Report Independent technical report prepared by Snowden
For
per
sona
l use
onl
y
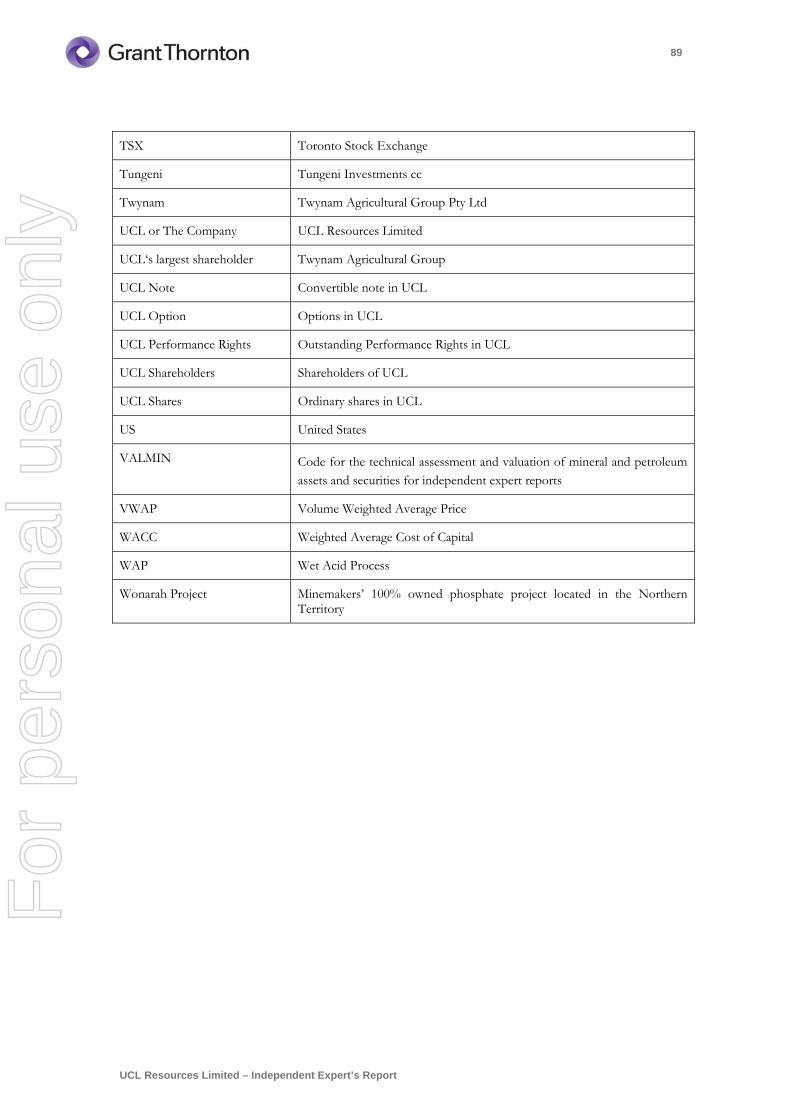
89
UCL Resources Limited – Independent Expert’s Report
TSX Toronto Stock Exchange
Tungeni Tungeni Investments cc
Twynam Twynam Agricultural Group Pty Ltd
UCL or The Company UCL Resources Limited
UCL‘s largest shareholder Twynam Agricultural Group
UCL Note Convertible note in UCL
UCL Option Options in UCL
UCL Performance Rights Outstanding Performance Rights in UCL
UCL Shareholders Shareholders of UCL
UCL Shares Ordinary shares in UCL
US United States
VALMIN Code for the technical assessment and valuation of mineral and petroleum assets and securities for independent expert reports
VWAP Volume Weighted Average Price
WACC Weighted Average Cost of Capital
WAP Wet Acid Process
Wonarah Project Minemakers’ 100% owned phosphate project located in the Northern Territory
For
per
sona
l use
onl
y

90
UCL Resources Limited – Independent Expert’s Report
Appendix F – Snowden Report
For
per
sona
l use
onl
y
87 Colin Street West Perth WA 6005
PO Box 77 West Perth WA 6872 Telephone +61 8 9213 9213 Facsimile +61 8 9322 2576 [email protected]
www.snowdengroup.com
Perth, Brisbane, Johannesburg, Vancouver, Calgary, Belo Horizonte, Oxford
Snowden Mining Industry Consultants Pty Ltd ABN 99 085 319 562 130430_Final_AU4095_UCL_ValuationReport.docx Page 1
30 April 2013 The Directors UCL Resources Limited Suite 2, Level 2 Watson House 300 George Street SYDNEY NSW 2000 Dear Sirs
INDEPENDENT VALUATION OF UCL RESOURCES LIMITED MINERAL ASSETS
Based on instructions from UCL Resources Limited (“UCL”), Grant Thornton Corporate Finance Pty Ltd (“Grant Thornton”) requested Snowden Mining Industry Consultants Pty Ltd (“Snowden”) to provide an independent technical report (“the Technical Report”) for inclusion in an Independent Expert‟s Report in relation to a proposed on market transaction involving UCL. Snowden previously prepared an independent technical report in March 2012.
In January 2013 UCL updated a definitive feasibility study (DFS) of the Sandpiper Project in Namibia, originally dated April 2012, and prepared a cash flow model. Snowden was requested to review the DFS and financial model and prepare an independent valuation of the exploration and mineral resource assets (Mineral Assets) of the Sandpiper Project (exclusive of ore reserves) and the Mehdiabad Project in Iran. Snowden was requested to:
undertake a high level technical review of the DFS,
review the assumptions of the cash flow model,
review the reasonableness of the assumptions made in the DFS with regards to recovery of phosphate material from the seabed,
review the mineral resource and ore reserve estimates,
review the metallurgical processing option selected and the associated process design criteria,
review the capital and operating cost estimates,
undertake a mineral asset valuation of the mineral resources at Sandpiper (not considered in the DFS),
undertake a mineral asset valuation of Iranian base metal Project, and
identify any concerns or fatal flaws of the DFS.
The following mineral assets are owned by UCL and were evaluated:
Sandpiper Phosphate Project in Namibia (42.5% interest)
Mehdiabad Zinc-Lead-Silver Project in Iran (24.5% interest).
For
per
sona
l use
onl
y
FINAL
130430_Final_AU4095_UCL_ValuationReport.docx Page 2
For the specific purpose of this report, Snowden was provided with information by UCL (in a Data Room) relating to the Sandpiper and Mehdiabad projects. A visit to Cape Town, South Africa was undertaken in early 2012 to inspect drill cores from the Sandpiper Project and the laboratory that prepared and analysed the samples. No other site visits were made by Snowden in 2012 or during 2013.
Snowden has reviewed the geology and Mineral Resources of the Sandpiper Project and considers the resource estimates to be reasonable in terms of tonnes and grade and have “reasonable prospects for economic recovery” under the JORC Code, 2004.
Snowden has reviewed the dredging information in the DFS and consider it to be complete for a feasibility study. Snowden considers that the reserves should be classified as Probable Ore Reserves, until such time as the dredging technology of the proposed “Jack-knife” dredge has been proven to depths of 225 m below sea level. Snowden considers that the proposed dredging contract should form part of the feasibility study as well as the document titled “PS NAM-PA-13 002-FJ-AA.pdf” and dated April 17, 2013.
Snowden has reviewed the proposed processing of phosphate material on shore at Walvis Bay and considers the DFS study in relation to proposed processing has been carried out to feasibility level study and is acceptable. Although the concentrate will be relatively low grade (about 27.5% P2O5) compared to the preferred supplier grade of 30% P2O5 the phosphate marketing research company, CUR Strategies, considers that the product is marketable as a blend for fertiliser production and has potential as direct feed for Namibia agriculture.
Snowden has reviewed the DFS and the underlying cash flows projections and assumptions. Snowden concludes that it is appropriate for Grant Thornton Corporate Finance to rely on the cash flows projections included in the DFS for the purpose of assessing the fair market value of the Sandpiper Project. However, the mining (dredging costs) are based on assumptions of successful dredging at depth without technical proof, which have been guaranteed by the proposed dredging contractor (Jan de Nul). Snowden has not seen the nature of the guarantee or whether it imposes penalties for underperformance in terms of ore recovery, production rates or dredging costs. This currently represents a financial risk.
Snowden considers that recovery of phosphate material from 225 m below sea level is feasible, but considers that the classification of Proved Reserves maybe somewhat optimistic until such time as the dredging at this depth has been proven to be economic.
At this stage UCL need to prove that the dredging operation would be viable at depths of 225 m below sea level and that the capital and operating costs of dredging at those depths are within the 10 to 15% accuracy range. For normal land based projects this is usually done by pilot plant testwork, etc. In this case the cost of fitting an existing dredge to efficiently recover phosphate at that depth is relatively small compared to the overall project cost and the value of the reserve.
Snowden notes that a restoration liability of US$20 million has been allocated for rehabilitation of the process plant and surrounding infrastructure. Snowden is not aware of any environmental liabilities associated with dredging the sea floor. Snowden is aware that the provision for decommissioning and restoration of the phosphate process and mining facilities of the phosphate mine on Christmas Island, managed by Phosphate Resources Limited is A$8.1 million (2012 annual report). Snowden considers that the restoration liability of US$20 million for the Sandpiper Project is appropriate.
Snowden has not independently verified the ownership and legal standing of the mineral tenements which are the subject of this valuation and is not qualified to make legal representations in this regard. Snowden has not attempted to re-establish the legal status of the tenements with respect to joint venture agreements, heritage or potential environmental and land access restrictions. Snowden is not qualified to make legal representations in this regard and therefore specifically disclaims responsibility for these aspects for the purpose of this review. F
or p
erso
nal u
se o
nly
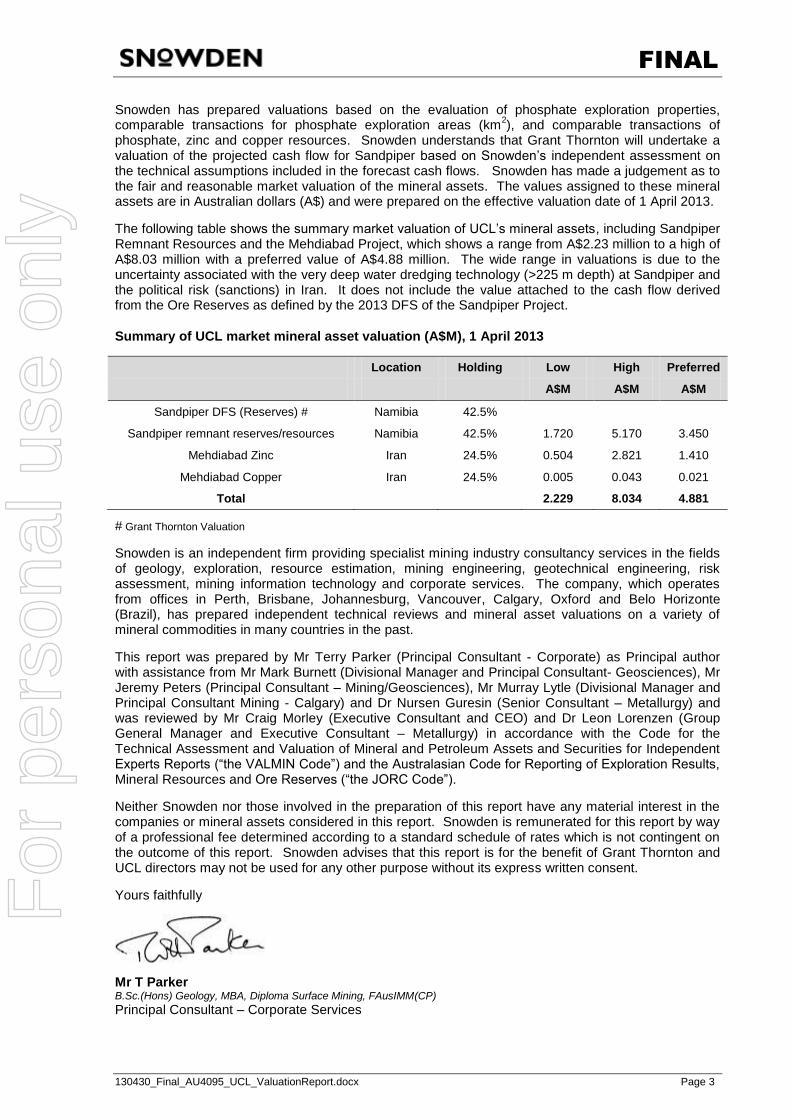
FINAL
130430_Final_AU4095_UCL_ValuationReport.docx Page 3
Snowden has prepared valuations based on the evaluation of phosphate exploration properties, comparable transactions for phosphate exploration areas (km2), and comparable transactions of phosphate, zinc and copper resources. Snowden understands that Grant Thornton will undertake a valuation of the projected cash flow for Sandpiper based on Snowden‟s independent assessment on the technical assumptions included in the forecast cash flows. Snowden has made a judgement as to the fair and reasonable market valuation of the mineral assets. The values assigned to these mineral assets are in Australian dollars (A$) and were prepared on the effective valuation date of 1 April 2013.
The following table shows the summary market valuation of UCL‟s mineral assets, including Sandpiper Remnant Resources and the Mehdiabad Project, which shows a range from A$2.23 million to a high of A$8.03 million with a preferred value of A$4.88 million. The wide range in valuations is due to the uncertainty associated with the very deep water dredging technology (>225 m depth) at Sandpiper and the political risk (sanctions) in Iran. It does not include the value attached to the cash flow derived from the Ore Reserves as defined by the 2013 DFS of the Sandpiper Project.
Summary of UCL market mineral asset valuation (A$M), 1 April 2013
Location Holding Low High Preferred
A$M A$M A$M
Sandpiper DFS (Reserves) # Namibia 42.5%
Sandpiper remnant reserves/resources Namibia 42.5% 1.720 5.170 3.450
Mehdiabad Zinc Iran 24.5% 0.504 2.821 1.410
Mehdiabad Copper Iran 24.5% 0.005 0.043 0.021
Total 2.229 8.034 4.881
# Grant Thornton Valuation
Snowden is an independent firm providing specialist mining industry consultancy services in the fields of geology, exploration, resource estimation, mining engineering, geotechnical engineering, risk assessment, mining information technology and corporate services. The company, which operates from offices in Perth, Brisbane, Johannesburg, Vancouver, Calgary, Oxford and Belo Horizonte (Brazil), has prepared independent technical reviews and mineral asset valuations on a variety of mineral commodities in many countries in the past.
This report was prepared by Mr Terry Parker (Principal Consultant - Corporate) as Principal author with assistance from Mr Mark Burnett (Divisional Manager and Principal Consultant- Geosciences), Mr Jeremy Peters (Principal Consultant – Mining/Geosciences), Mr Murray Lytle (Divisional Manager and Principal Consultant Mining - Calgary) and Dr Nursen Guresin (Senior Consultant – Metallurgy) and was reviewed by Mr Craig Morley (Executive Consultant and CEO) and Dr Leon Lorenzen (Group General Manager and Executive Consultant – Metallurgy) in accordance with the Code for the Technical Assessment and Valuation of Mineral and Petroleum Assets and Securities for Independent Experts Reports (“the VALMIN Code”) and the Australasian Code for Reporting of Exploration Results, Mineral Resources and Ore Reserves (“the JORC Code”).
Neither Snowden nor those involved in the preparation of this report have any material interest in the companies or mineral assets considered in this report. Snowden is remunerated for this report by way of a professional fee determined according to a standard schedule of rates which is not contingent on the outcome of this report. Snowden advises that this report is for the benefit of Grant Thornton and UCL directors may not be used for any other purpose without its express written consent.
Yours faithfully
Mr T Parker B.Sc.(Hons) Geology, MBA, Diploma Surface Mining, FAusIMM(CP) Principal Consultant – Corporate Services
For
per
sona
l use
onl
y
FINAL
130430_Final_AU4095_UCL_ValuationReport.docx Page 4
TABLE OF CONTENTS
1. INTRODUCTION.......................................................................................................................... 9
1.1 PURPOSE OF REPORT ................................................................................................ 9
1.2 DISCLAIMER ................................................................................................................. 9
1.3 VALMIN CODE 2005 ................................................................................................... 10
1.4 RESPONSIBILITY ........................................................................................................ 10
1.5 VALUATION DATE ...................................................................................................... 10
1.6 INDEPENDENCE ......................................................................................................... 10
1.7 SITE VISIT ................................................................................................................... 11
1.8 TECHNICAL DISCUSSIONS ....................................................................................... 11
1.9 HERITAGE AND ENVIRONMENTAL LIABILITIES ..................................................... 11
2. SANDPIPER PROJECT JV ....................................................................................................... 11
2.1 LOCATION AND ACCESS .......................................................................................... 11
2.2 BACKGROUND TO SANDPIPER PROJECT .............................................................. 12
2.3 TENEMENTS ............................................................................................................... 13
2.4 GEOLOGY ................................................................................................................... 15
2.5 MINERALISATION ....................................................................................................... 15
2.6 EXPLORATION ............................................................................................................ 15
2.6.1 Drilling ........................................................................................................... 15 2.6.2 Core sampling ............................................................................................... 17 2.6.3 Laboratory ..................................................................................................... 18
2.7 MINERAL RESOURCES ............................................................................................. 19
2.7.1 Resource Classification ................................................................................ 20 2.7.2 Mineral Resource statement ......................................................................... 21
2.8 QUALIFIED PERSON CONCLUSIONS....................................................................... 21
2.9 EXPLORATION POTENTIAL ....................................................................................... 22
2.10 MINING ........................................................................................................................ 22
2.10.1 Ore Reserves ................................................................................................ 22 2.10.2 Remnant Resources and reserves ............................................................... 23 2.10.3 Dredging study history .................................................................................. 23 2.10.4 Dredging reports ........................................................................................... 24 2.10.5 Mining Concept (Dredge Plan) ..................................................................... 24 2.10.6 Phosphate production ................................................................................... 26 2.10.7 Mechanical availability of the dredge ............................................................ 26 2.10.8 Grade control measures ............................................................................... 26 2.10.9 Discussion ..................................................................................................... 27 2.10.10 Additional comments on dredging (April 2013) ............................................. 27 2.10.11 Dredging Agreements ................................................................................... 27 2.10.12 Conclusion .................................................................................................... 28
2.11 PROCESSING ............................................................................................................. 28
2.11.1 Scoping Study Level Metallurgical Test Work .............................................. 28 2.11.5 Project Processing Risks .............................................................................. 39
2.12 CAPEX AND OPEX...................................................................................................... 40
2.13 ENVIRONMENTAL STUDIES ...................................................................................... 43
2.13.1 Environmental Impact Assessment .............................................................. 43 2.13.2 Mine Closure and Restoration ...................................................................... 45
3. MEHDIABAD PROJECT ........................................................................................................... 45
3.1 OWNERSHIP ............................................................................................................... 45
3.2 LOCATION AND ACCESS .......................................................................................... 45
For
per
sona
l use
onl
y
FINAL
130430_Final_AU4095_UCL_ValuationReport.docx Page 5
3.3 TENEMENTS ............................................................................................................... 46
3.4 GEOLOGY ................................................................................................................... 46
3.5 EXPLORATION ............................................................................................................ 46
3.6 RESOURCES ............................................................................................................... 46
3.7 FEASIBILTY STUDIES ................................................................................................ 47
3.7.1 Geotechnical ................................................................................................. 47 3.7.2 Hydrology ...................................................................................................... 47 3.7.3 Mining ........................................................................................................... 47 3.7.4 Summary ....................................................................................................... 48
3.8 EXPLORATION POTENTIAL ....................................................................................... 48
3.9 BACKGROUND AND FUTURE DEVELOPMENT ....................................................... 48
3.9.1 Purported termination ................................................................................... 48 3.9.2 EFIC Claim .................................................................................................... 48 3.9.3 Dispute .......................................................................................................... 48 3.9.4 Sanctions ...................................................................................................... 49 3.9.5 UCL Valuation ............................................................................................... 49
3.10 SNOWDEN ASSESSMENT ......................................................................................... 49
4. OVERVIEW OF COMMODITY MARKETS (2013) .................................................................... 50
4.1 PHOSPHATE ............................................................................................................... 50
4.1.1 Phosphate Uses............................................................................................ 50 4.1.2 Phosphate Prices .......................................................................................... 50 4.1.3 Future phosphate supply and deman ........................................................... 51
4.2 WORLD PHOSPHATE RESERVES ............................................................................ 52
4.3 WORLD PHOSPHATE ................................................................................................. 52
4.4 AUSTRALIAN PHOSPHATE DEPOSITS .................................................................... 52
4.5 NAMIBIAN PHOSPHATE ............................................................................................. 53
4.5.1 Phosphate Rock Trade: Phosphoric Acid ..................................................... 53 4.5.2 Expected Price of Namphos Phosphate Rock .............................................. 53
4.6 ZINC PRICE ................................................................................................................. 53
4.7 COPPER PRICE .......................................................................................................... 54
5. VALUATION CONSIDERATIONS ............................................................................................ 55
5.1 FAIR MARKET VALUE OF MINERAL ASSETS .......................................................... 55
5.2 METHODS OF VALUING MINERAL ASSETS ............................................................ 55
5.2.1 Mineral assets in the exploration stage ........................................................ 55 5.2.2 Mineral assets with Mineral Resources and Ore Reserves .......................... 56
5.3 SNOWDEN‟S VALUATION METHODOLOGY ............................................................ 57
6. RECENT COMPARABLE TRANSACTIONS ............................................................................ 57
6.1 COMPARABLE TRANSACTIONS (PHOSPHATE) ..................................................... 57
6.1.1 The Bayóvar Phosphate Mine ...................................................................... 58 6.1.2 Wonarah (Minemakers) ................................................................................ 58 6.1.3 Sandpiper Project ......................................................................................... 59 6.1.4 Central Australian Phosphate ....................................................................... 59 6.1.5 Farim Phosphate project ............................................................................... 60 6.1.6 Korella Phosphate project ............................................................................. 60
6.2 SNOWDEN COMMENT ON TRANSACTIONS ........................................................... 60
6.3 PHOSPHATE EXPLORATION TRANSACTIONS ....................................................... 61
6.4 COMPARABLE TRANSACTIONS (ZINC) ................................................................... 61
6.5 COMPARABLE TRANSACTIONS (COPPER) ............................................................ 62
7. VALUATION .............................................................................................................................. 62
For
per
sona
l use
onl
y
FINAL
130430_Final_AU4095_UCL_ValuationReport.docx Page 6
7.1 SANDPIPER ................................................................................................................. 62
7.1.1 Reserves Valuation ....................................................................................... 62 7.1.2 Remaining Resources and Reserve Valuation ............................................. 62 7.1.3 Exploration Area Valuation model ................................................................ 63
7.2 MEHDIABAD PROJECT .............................................................................................. 64
7.2.1 Zinc Project ................................................................................................... 64 7.2.2 Copper Project .............................................................................................. 66
8. VALUATION SUMMARY .......................................................................................................... 68
9. DECLARATIONS BY SNOWDEN MINING INDUSTRY CONSULTANTS PTY LTD .............. 69
9.1 INDEPENDENCE ......................................................................................................... 69
9.2 QUALIFICATIONS ....................................................................................................... 69
9.3 DISCLAIMER ............................................................................................................... 70
10. BIBLIOGRAPHY........................................................................................................................ 71
For
per
sona
l use
onl
y
FINAL
130430_Final_AU4095_UCL_ValuationReport.docx Page 7
LIST OF TABLES
Table 2.1 Sandpiper tenements (Annels, 2012)........................................................................... 14 Table 2.2 Measured Mineral Resources (ML 170 - ITMA), April 2012 (UCL) .............................. 21 Table 2.3 Indicated Mineral Resources (all licence areas) .......................................................... 21 Table 2.4 Inferred Mineral Resources (all licence areas) ............................................................ 21 Table 2.5 Ore Reserves within ITMA, ML 170 (UCL, 2012) ........................................................ 23 Table 2.6 Remnant Resources (outside of DFS mining area) ..................................................... 23 Table 2.7 Basic design criteria ..................................................................................................... 35 Table 2.8 Breakdown of capital cost estimate.............................................................................. 41 Table 2.9 Breakdown of operating cost estimate (Jan 2013) ....................................................... 42 Table 3.1 Mehdiabad Project mineral resources (2006) .............................................................. 47 Table 3.2 Mehdiabad Copper Resource ...................................................................................... 47 Table 6.1 Phosphate resource comparable transactions A$:US$ 1.045 ..................................... 58 Table 6.2 Sandpiper Mineral Resources (April 2012) .................................................................. 59 Table 6.3 Phosphate exploration project transactions (2010- 2013) ........................................... 61 Table 7.1 Sandpiper Project resources and reserves (external to ITMA-DFS) ........................... 62 Table 7.2 Sandpiper Project, resource discount factors .............................................................. 63 Table 7.3 Sandpiper Project valuation of mineral assets (US$M) ............................................... 63 Table 7.4 Sandpiper Project valuation of mineral assets (A$M) .................................................. 63 Table 7.5 Sandpiper Project valuation UCL share (42.5%) A$M ................................................. 63 Table 7.6 Sandpiper Project valuation based on exploration area (A$M) ................................... 64 Table 7.7 UCL share of Sandpiper Project (42.5%) based on exploration area .......................... 64 Table 7.8 Mehdiabad Zinc Project mineral resources (2006) ...................................................... 64 Table 7.9 Mehdiabad Zinc Project zinc equivalent Mt ................................................................. 65 Table 7.10 Mehdiabad Zinc Project discounted Zn Equiv Mt based on 100% of project .............. 65 Table 7.11 Mehdiabad Zinc Project discounted valuation range based on 24.5% of project
(US$M) ......................................................................................................................... 65 Table 7.12 Mehdiabad Zinc Project valuation range (A$M), UCL 24.5% ...................................... 66 Table 7.13 Mehdiabad Copper Project resources ......................................................................... 66 Table 7.14 Mehdiabad Copper Project discounted Cu equiv tonnes based on 100% of
project ........................................................................................................................... 66 Table 7.15 Mehdiabad Copper Project, discounted valuation range of UCL 24.5% of the
project (US$) ................................................................................................................ 67 Table 7.16 Mehdiabad Copper Project valuation (A$M) ................................................................ 67 Table 7.17 Risk assessment .......................................................................................................... 68 Table 8.1 Summary of UCL market mineral asset valuation (A$) ................................................ 68
For
per
sona
l use
onl
y
FINAL
130430_Final_AU4095_UCL_ValuationReport.docx Page 8
LIST OF FIGURES
Figure 2.1 Namibia ........................................................................................................................ 11 Figure 2.2 Location of Sandpiper Project ...................................................................................... 12 Figure 2.3 NMP Licenses with ML170 Sandpiper Project Area (Blue outline). ............................. 13 Figure 2.4 Resource Area and Initial Target Mining Area (ITMA) ................................................. 14 Figure 2.5 Map showing drill holes and a portion of the ITMA ...................................................... 16 Figure 2.6 Core recovered from the vibracorer ............................................................................. 17 Figure 2.7 Sandpiper Phosphate Project resource blocks ............................................................ 20 Figure 2.8 Peace in Africa dredge ................................................................................................. 25 Figure 2.9 Simplified process block flow diagram ......................................................................... 36 Figure 3.1 Location of Mehdiabad Project in Iran ......................................................................... 45 Figure 3.2 Regional location plan of Mehdiabad Project ............................................................... 46 Figure 4.1 Rock phosphate prices (2008 to 2013) ........................................................................ 51 Figure 4.2 Rock Phosphate Monthly Price (2012-2013) ............................................................... 51 Figure 4.3 One year zinc price, (2012-2013) ................................................................................. 54 Figure 4.4 One year copper price (2012-2013) ............................................................................. 54
For
per
sona
l use
onl
y
FINAL
130430_Final_AU4095_UCL_ValuationReport.docx Page 9
1. INTRODUCTION
1.1 PURPOSE OF REPORT
Based on instructions from UCL Resources Limited (“UCL”), Grant Thornton Corporate Finance Pty Ltd (“Grant Thornton”) requested Snowden Mining Industry Consultants Pty Ltd (“Snowden”) to provide an update of an independent technical report (“the Technical Report”) produced in March 2012 for inclusion in an Independent Expert‟s Report in relation to a proposed on market transaction involving UCL.
In January 2013 UCL updated a definitive feasibility study (DFS) originally dated April 2012 and prepared a financial cash flow model. Snowden was requested to review the DFS and cash flow model and prepare an independent valuation of the exploration and mineral resource assets (Mineral Assets) of the Sandpiper Project in Namibia (exclusive of ore reserves) and the Mehdiabad Project in Iran. Snowden was specifically requested to:
undertake a high level technical review of the DFS,
review the assumptions of the cash flow model,
review the reasonableness of the assumptions made in the report with regards to recovery of phosphate material from the seabed,
review the mineral resource and ore reserve estimates,
review the metallurgical processing option selected and the associated process design criteria,
review the capital and operating cost estimates
undertake a mineral asset valuation of mineral resources (not considered in DFS)
undertake a mineral asset valuation of Iranian base metal Project
identify any concerns or fatal flaws of the DFS.
The following mineral assets are owned by UCL:
Sandpiper Phosphate Project in Namibia (42.5% interest)
Mehdiabad Zinc-Lead-Silver Project in Iran (24.5% interest).
Snowden was provided information by UCL (in a Data Room) relating to the Sandpiper and Mehdiabad projects. A site visit was carried out to Cape Town, South Africa in early 2012 to inspect drill cores from the Sandpiper Project and the laboratory that prepared and analysed the samples. No other site visits were made by Snowden in 2012 or in 2013.
1.2 DISCLAIMER
Snowden has not independently verified the ownership and legal standing of the mineral tenements which are the subject of this valuation and is not qualified to make legal representations in this regard. Snowden has not attempted to re-establish the legal status of the tenements with respect to joint venture agreements, heritage or potential environmental and land access restrictions. Snowden is not qualified to make legal representations in this regard and therefore specifically disclaims responsibility for these aspects for the purpose of this review.
Snowden has relied on the accuracy and completeness of the technical documentation supplied to it by UCL. Snowden has made all reasonable enquiries into the material aspects of the projects and makes no warranty or representation as to the accuracy or completeness of the information provided. Furthermore, Snowden accepts no responsibility for the information or statements, opinions, or matters expressed or implied arising out of, contained in, or derived from information contained in this report, unless specifically disclosed by Snowden.
This report is provided subject to the following assumptions and qualifications:
For
per
sona
l use
onl
y

FINAL
130430_Final_AU4095_UCL_ValuationReport.docx Page 10
UCL has made available to Snowden all material information in its possession or known to it in relation to the technical, development, mining and financial aspects of the project areas, that it has not withheld any material information and that the information provided is accurate and up to date in all material respects
all reports and other technical documents provided by UCL correctly and accurately record the results of all geological and other technical activities and test work conducted to date in relation to the project areas and accurately record advice from any relevant technical experts
all of the information provided by UCL pertaining to project areas or its history or future intentions, financial forecasting or the effect of relevant agreements is correct and accurate in all material respects.
In relation to the above qualifications, Snowden did not undertake any independent enquiries or audits to verify that the assumptions are correct and gives no representation that they are correct. Snowden has not carried out any type of audit of UCL‟s records to verify that all material documentation has been provided or is publically available. Snowden has, however, endeavoured, by making reasonable enquiry of UCL, to ensure that all material information in the possession of UCL has been fully disclosed to Snowden. By accepting this report, UCL has agreed to indemnify Snowden from any liability arising from Snowden‟s reliance upon information provided or not provided to it.
1.3 VALMIN CODE 2005
This valuation has been prepared in accordance with the “Code for the Technical Assessment and Valuation of Mineral and Petroleum Assets and Securities for Independent Expert Reports” (The VALMIN Code 2005). Compliance with the Code is obligatory to all members of the Australasian Institute of Mining and Metallurgy (“AusIMM”), the Mineral Industry Consultants Association (“MICA”) and the Australian Institute of Geoscientists (“A.I.G.”) who are involved in independent technical and valuation reports.
1.4 RESPONSIBILITY
This report was prepared by Mr Terry Parker (Principal Consultant - Corporate) as Principal author with assistance from Mr Mark Burnett (Divisional Manager and Principal Consultant- Geosciences), Mr Jeremy Peters (Principal Consultant – Mining/Geosciences), Mr Murray Lytle (Divisional Manager and Principal Consultant Mining - Calgary) and Dr Nursen Guresin (Senior Consultant – Metallurgy) and was reviewed by Mr Craig Morley (Executive Consultant and CEO) and Dr Leon Lorenzen (Group General Manager and Executive Consultant – Metallurgy) in accordance with the Code for the Technical Assessment and Valuation of Mineral and Petroleum Assets and Securities for Independent Experts Reports (“the VALMIN Code”) and the Australasian Code for Reporting of Exploration Results, Mineral Resources and Ore Reserves, 2004 edition (“the JORC Code”).
Mr Parker is a geologist with over 42 years relevant experience in mining and exploration geological roles and a member (Fellow) of the AusIMM. He has the appropriate qualifications, expertise and experience to undertake this valuation, as required by the Code for the Technical Assessment and Valuation of Mineral and Petroleum Assets and Securities, 2005 (“VALMIN Code”).
Dr Leon Lorenzen (Executive Consultant and Group General Manager – Metallurgy) and Mr Craig Morley (Executive Consultant and CEO) undertook the peer review on the report to ensure it complies with the guidelines as laid down by both the VALMIN Code and the JORC Code.
1.5 VALUATION DATE
The opinions expressed and conclusions drawn with respect to this valuation are appropriate at the valuation date of 1 April 2013 which reflects the timing associated with the collection of information for this report. The valuation is only valid for this date and may change with time in response to variations in economic, market, legal or political conditions in addition to ongoing exploration results.
1.6 INDEPENDENCE
At the date of valuation Mr Parker, Dr Lorenzen, Mr Morley and Snowden had no association with UCL, or its individual employees, or any interest in the securities of UCL, which could be regarded as affecting the ability to give an independent unbiased valuation. Snowden will be paid a fee for its valuation based on a standard schedule of rates for professional services, plus any expenses incurred. The fee is not contingent on the results of the valuation.
For
per
sona
l use
onl
y
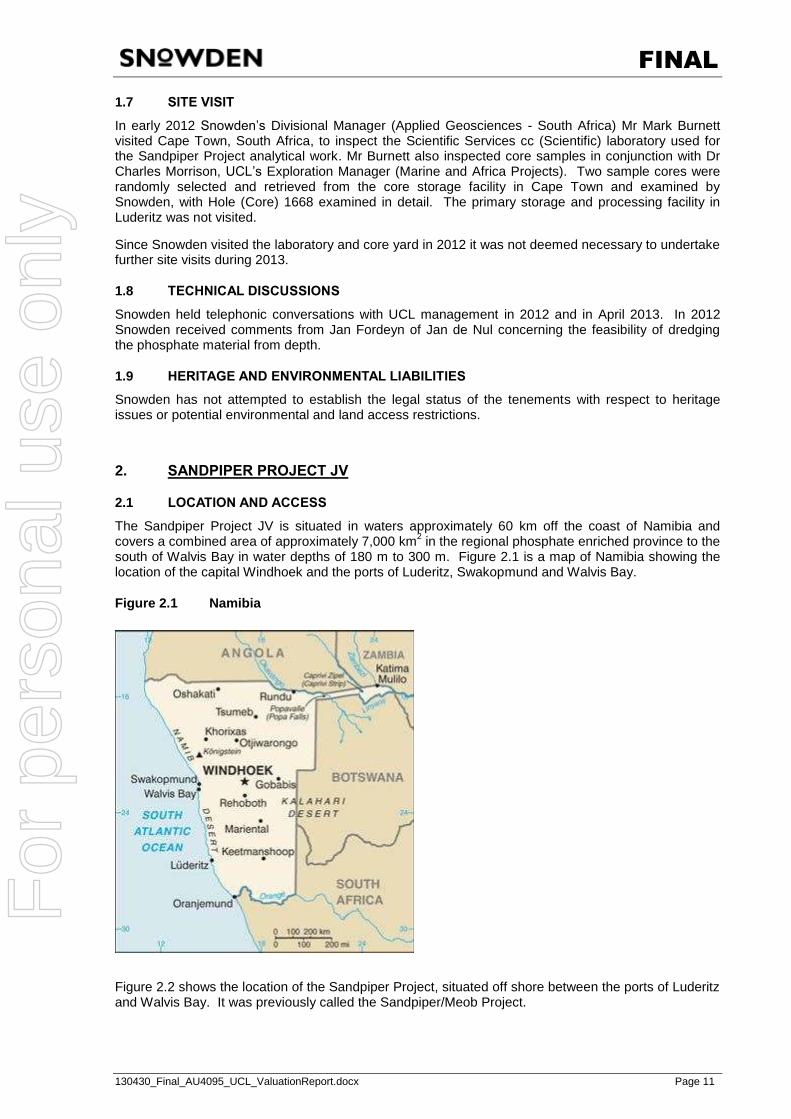
FINAL
130430_Final_AU4095_UCL_ValuationReport.docx Page 11
1.7 SITE VISIT
In early 2012 Snowden‟s Divisional Manager (Applied Geosciences - South Africa) Mr Mark Burnett visited Cape Town, South Africa, to inspect the Scientific Services cc (Scientific) laboratory used for the Sandpiper Project analytical work. Mr Burnett also inspected core samples in conjunction with Dr Charles Morrison, UCL‟s Exploration Manager (Marine and Africa Projects). Two sample cores were randomly selected and retrieved from the core storage facility in Cape Town and examined by Snowden, with Hole (Core) 1668 examined in detail. The primary storage and processing facility in Luderitz was not visited.
Since Snowden visited the laboratory and core yard in 2012 it was not deemed necessary to undertake further site visits during 2013.
1.8 TECHNICAL DISCUSSIONS
Snowden held telephonic conversations with UCL management in 2012 and in April 2013. In 2012 Snowden received comments from Jan Fordeyn of Jan de Nul concerning the feasibility of dredging the phosphate material from depth.
1.9 HERITAGE AND ENVIRONMENTAL LIABILITIES
Snowden has not attempted to establish the legal status of the tenements with respect to heritage issues or potential environmental and land access restrictions.
2. SANDPIPER PROJECT JV
2.1 LOCATION AND ACCESS
The Sandpiper Project JV is situated in waters approximately 60 km off the coast of Namibia and covers a combined area of approximately 7,000 km2 in the regional phosphate enriched province to the south of Walvis Bay in water depths of 180 m to 300 m. Figure 2.1 is a map of Namibia showing the location of the capital Windhoek and the ports of Luderitz, Swakopmund and Walvis Bay.
Figure 2.1 Namibia
Figure 2.2 shows the location of the Sandpiper Project, situated off shore between the ports of Luderitz and Walvis Bay. It was previously called the Sandpiper/Meob Project.
For
per
sona
l use
onl
y
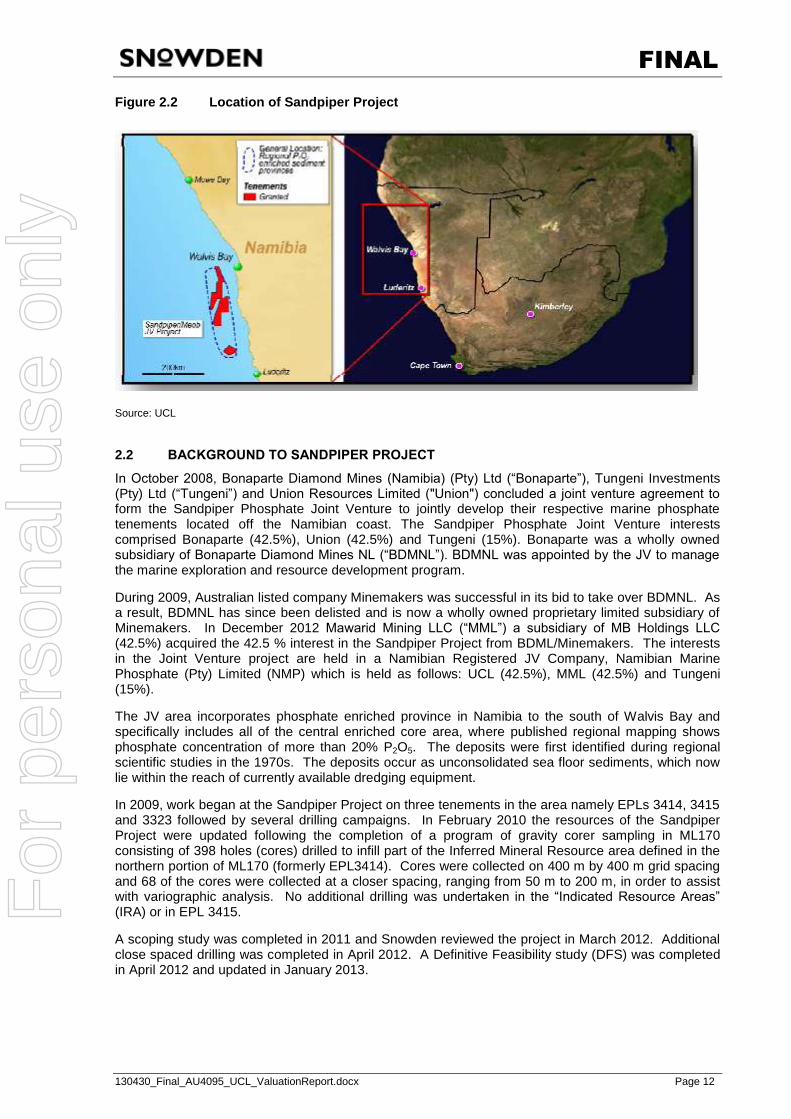
FINAL
130430_Final_AU4095_UCL_ValuationReport.docx Page 12
Figure 2.2 Location of Sandpiper Project
Source: UCL
2.2 BACKGROUND TO SANDPIPER PROJECT
In October 2008, Bonaparte Diamond Mines (Namibia) (Pty) Ltd (“Bonaparte”), Tungeni Investments (Pty) Ltd (“Tungeni”) and Union Resources Limited ("Union") concluded a joint venture agreement to form the Sandpiper Phosphate Joint Venture to jointly develop their respective marine phosphate tenements located off the Namibian coast. The Sandpiper Phosphate Joint Venture interests comprised Bonaparte (42.5%), Union (42.5%) and Tungeni (15%). Bonaparte was a wholly owned subsidiary of Bonaparte Diamond Mines NL (“BDMNL”). BDMNL was appointed by the JV to manage the marine exploration and resource development program.
During 2009, Australian listed company Minemakers was successful in its bid to take over BDMNL. As a result, BDMNL has since been delisted and is now a wholly owned proprietary limited subsidiary of Minemakers. In December 2012 Mawarid Mining LLC (“MML”) a subsidiary of MB Holdings LLC (42.5%) acquired the 42.5 % interest in the Sandpiper Project from BDML/Minemakers. The interests in the Joint Venture project are held in a Namibian Registered JV Company, Namibian Marine Phosphate (Pty) Limited (NMP) which is held as follows: UCL (42.5%), MML (42.5%) and Tungeni (15%).
The JV area incorporates phosphate enriched province in Namibia to the south of Walvis Bay and specifically includes all of the central enriched core area, where published regional mapping shows phosphate concentration of more than 20% P2O5. The deposits were first identified during regional scientific studies in the 1970s. The deposits occur as unconsolidated sea floor sediments, which now lie within the reach of currently available dredging equipment.
In 2009, work began at the Sandpiper Project on three tenements in the area namely EPLs 3414, 3415 and 3323 followed by several drilling campaigns. In February 2010 the resources of the Sandpiper Project were updated following the completion of a program of gravity corer sampling in ML170 consisting of 398 holes (cores) drilled to infill part of the Inferred Mineral Resource area defined in the northern portion of ML170 (formerly EPL3414). Cores were collected on 400 m by 400 m grid spacing and 68 of the cores were collected at a closer spacing, ranging from 50 m to 200 m, in order to assist with variographic analysis. No additional drilling was undertaken in the “Indicated Resource Areas” (IRA) or in EPL 3415.
A scoping study was completed in 2011 and Snowden reviewed the project in March 2012. Additional close spaced drilling was completed in April 2012. A Definitive Feasibility study (DFS) was completed in April 2012 and updated in January 2013.
For
per
sona
l use
onl
y
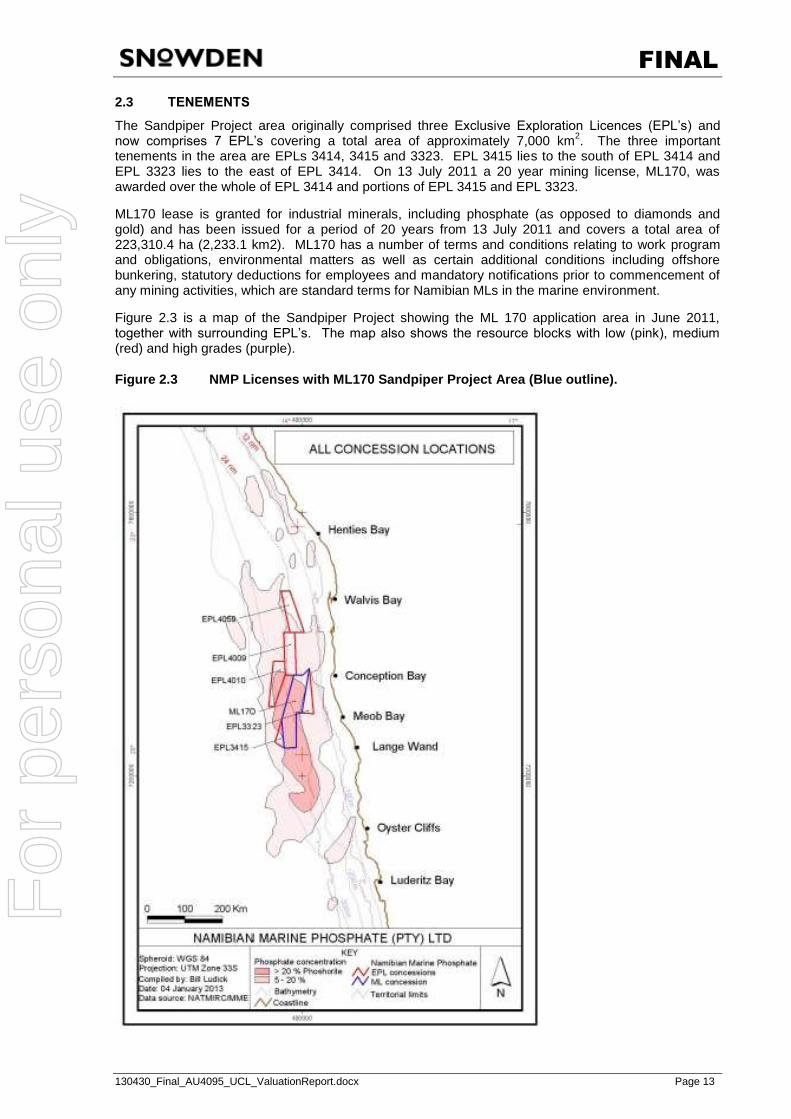
FINAL
130430_Final_AU4095_UCL_ValuationReport.docx Page 13
2.3 TENEMENTS
The Sandpiper Project area originally comprised three Exclusive Exploration Licences (EPL‟s) and now comprises 7 EPL‟s covering a total area of approximately 7,000 km2. The three important tenements in the area are EPLs 3414, 3415 and 3323. EPL 3415 lies to the south of EPL 3414 and EPL 3323 lies to the east of EPL 3414. On 13 July 2011 a 20 year mining license, ML170, was awarded over the whole of EPL 3414 and portions of EPL 3415 and EPL 3323.
ML170 lease is granted for industrial minerals, including phosphate (as opposed to diamonds and gold) and has been issued for a period of 20 years from 13 July 2011 and covers a total area of 223,310.4 ha (2,233.1 km2). ML170 has a number of terms and conditions relating to work program and obligations, environmental matters as well as certain additional conditions including offshore bunkering, statutory deductions for employees and mandatory notifications prior to commencement of any mining activities, which are standard terms for Namibian MLs in the marine environment.
Figure 2.3 is a map of the Sandpiper Project showing the ML 170 application area in June 2011, together with surrounding EPL‟s. The map also shows the resource blocks with low (pink), medium (red) and high grades (purple).
Figure 2.3 NMP Licenses with ML170 Sandpiper Project Area (Blue outline).
For
per
sona
l use
onl
y
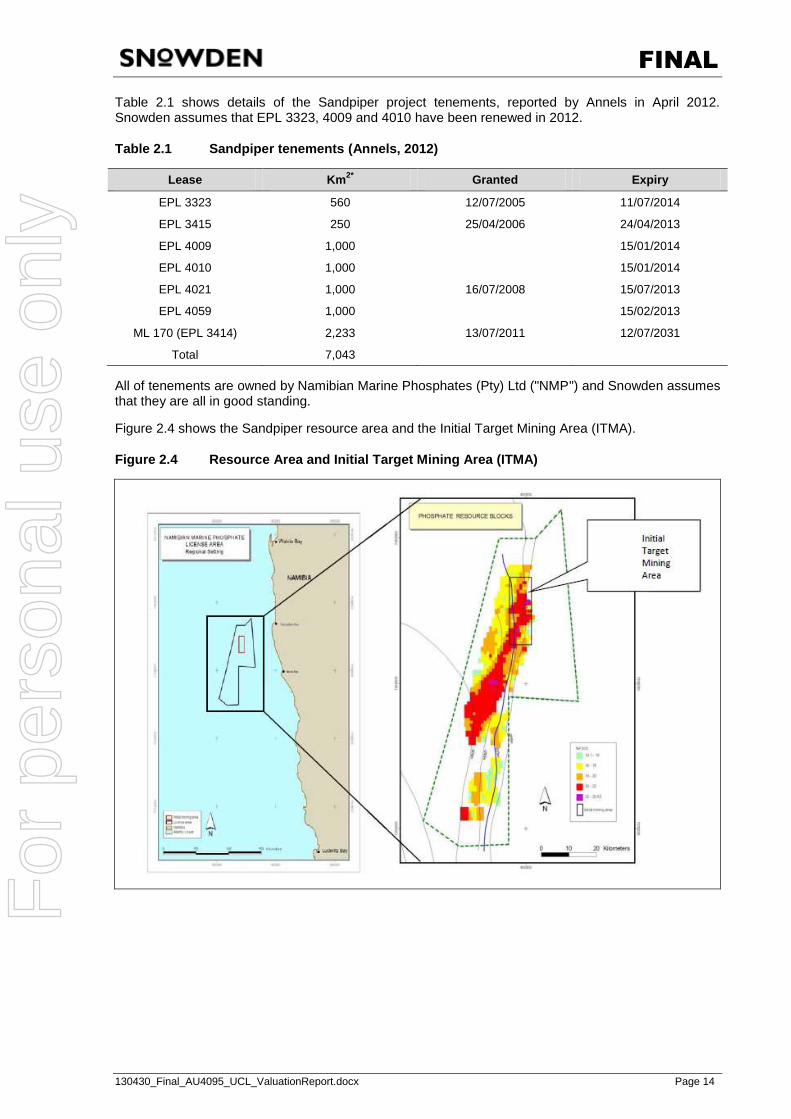
FINAL
130430_Final_AU4095_UCL_ValuationReport.docx Page 14
Table 2.1 shows details of the Sandpiper project tenements, reported by Annels in April 2012. Snowden assumes that EPL 3323, 4009 and 4010 have been renewed in 2012.
Table 2.1 Sandpiper tenements (Annels, 2012)
Lease Km2* Granted Expiry
EPL 3323 560 12/07/2005 11/07/2014
EPL 3415 250 25/04/2006 24/04/2013
EPL 4009 1,000 15/01/2014
EPL 4010 1,000 15/01/2014
EPL 4021 1,000 16/07/2008 15/07/2013
EPL 4059 1,000 15/02/2013
ML 170 (EPL 3414) 2,233 13/07/2011 12/07/2031
Total 7,043
All of tenements are owned by Namibian Marine Phosphates (Pty) Ltd ("NMP") and Snowden assumes that they are all in good standing.
Figure 2.4 shows the Sandpiper resource area and the Initial Target Mining Area (ITMA).
Figure 2.4 Resource Area and Initial Target Mining Area (ITMA)
For
per
sona
l use
onl
y
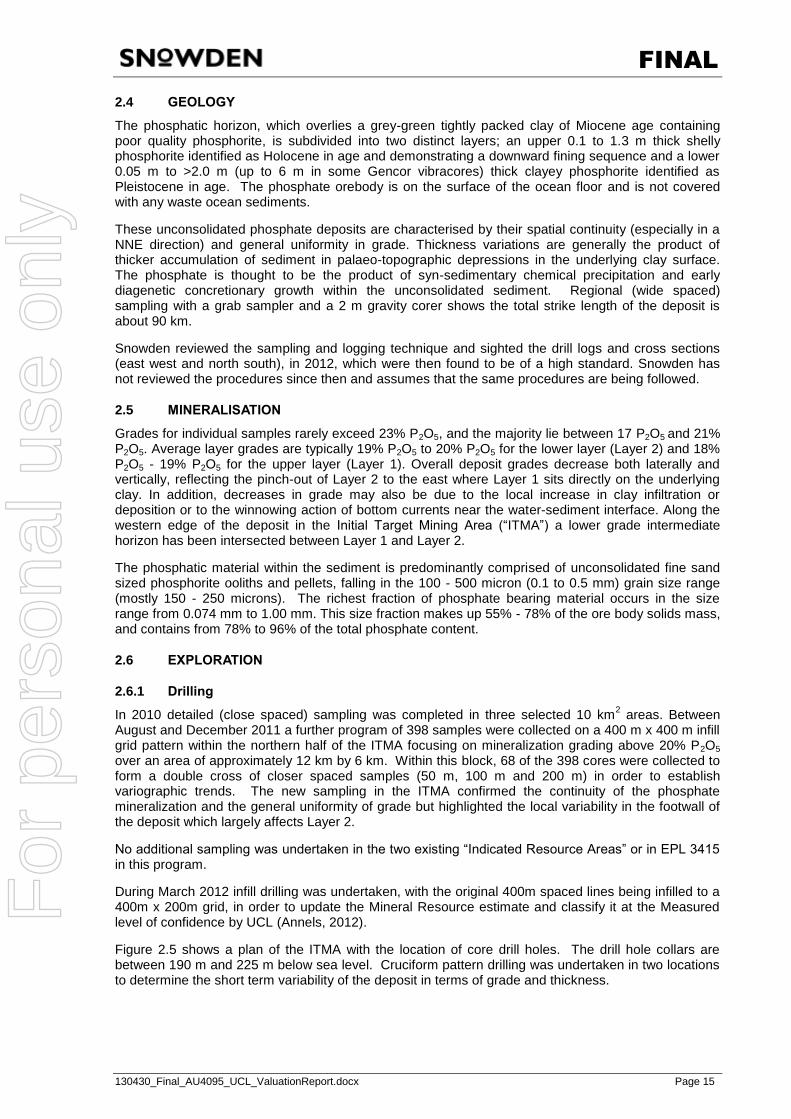
FINAL
130430_Final_AU4095_UCL_ValuationReport.docx Page 15
2.4 GEOLOGY
The phosphatic horizon, which overlies a grey-green tightly packed clay of Miocene age containing poor quality phosphorite, is subdivided into two distinct layers; an upper 0.1 to 1.3 m thick shelly phosphorite identified as Holocene in age and demonstrating a downward fining sequence and a lower 0.05 m to >2.0 m (up to 6 m in some Gencor vibracores) thick clayey phosphorite identified as Pleistocene in age. The phosphate orebody is on the surface of the ocean floor and is not covered with any waste ocean sediments.
These unconsolidated phosphate deposits are characterised by their spatial continuity (especially in a NNE direction) and general uniformity in grade. Thickness variations are generally the product of thicker accumulation of sediment in palaeo-topographic depressions in the underlying clay surface. The phosphate is thought to be the product of syn-sedimentary chemical precipitation and early diagenetic concretionary growth within the unconsolidated sediment. Regional (wide spaced) sampling with a grab sampler and a 2 m gravity corer shows the total strike length of the deposit is about 90 km.
Snowden reviewed the sampling and logging technique and sighted the drill logs and cross sections (east west and north south), in 2012, which were then found to be of a high standard. Snowden has not reviewed the procedures since then and assumes that the same procedures are being followed.
2.5 MINERALISATION
Grades for individual samples rarely exceed 23% P2O5, and the majority lie between 17 P2O5 and 21% P2O5. Average layer grades are typically 19% P2O5 to 20% P2O5 for the lower layer (Layer 2) and 18% P2O5 - 19% P2O5 for the upper layer (Layer 1). Overall deposit grades decrease both laterally and vertically, reflecting the pinch-out of Layer 2 to the east where Layer 1 sits directly on the underlying clay. In addition, decreases in grade may also be due to the local increase in clay infiltration or deposition or to the winnowing action of bottom currents near the water-sediment interface. Along the western edge of the deposit in the Initial Target Mining Area (“ITMA”) a lower grade intermediate horizon has been intersected between Layer 1 and Layer 2.
The phosphatic material within the sediment is predominantly comprised of unconsolidated fine sand sized phosphorite ooliths and pellets, falling in the 100 - 500 micron (0.1 to 0.5 mm) grain size range (mostly 150 - 250 microns). The richest fraction of phosphate bearing material occurs in the size range from 0.074 mm to 1.00 mm. This size fraction makes up 55% - 78% of the ore body solids mass, and contains from 78% to 96% of the total phosphate content.
2.6 EXPLORATION
2.6.1 Drilling
In 2010 detailed (close spaced) sampling was completed in three selected 10 km2 areas. Between August and December 2011 a further program of 398 samples were collected on a 400 m x 400 m infill grid pattern within the northern half of the ITMA focusing on mineralization grading above 20% P2O5 over an area of approximately 12 km by 6 km. Within this block, 68 of the 398 cores were collected to form a double cross of closer spaced samples (50 m, 100 m and 200 m) in order to establish variographic trends. The new sampling in the ITMA confirmed the continuity of the phosphate mineralization and the general uniformity of grade but highlighted the local variability in the footwall of the deposit which largely affects Layer 2.
No additional sampling was undertaken in the two existing “Indicated Resource Areas” or in EPL 3415 in this program.
During March 2012 infill drilling was undertaken, with the original 400m spaced lines being infilled to a 400m x 200m grid, in order to update the Mineral Resource estimate and classify it at the Measured level of confidence by UCL (Annels, 2012).
Figure 2.5 shows a plan of the ITMA with the location of core drill holes. The drill hole collars are between 190 m and 225 m below sea level. Cruciform pattern drilling was undertaken in two locations to determine the short term variability of the deposit in terms of grade and thickness.
For
per
sona
l use
onl
y
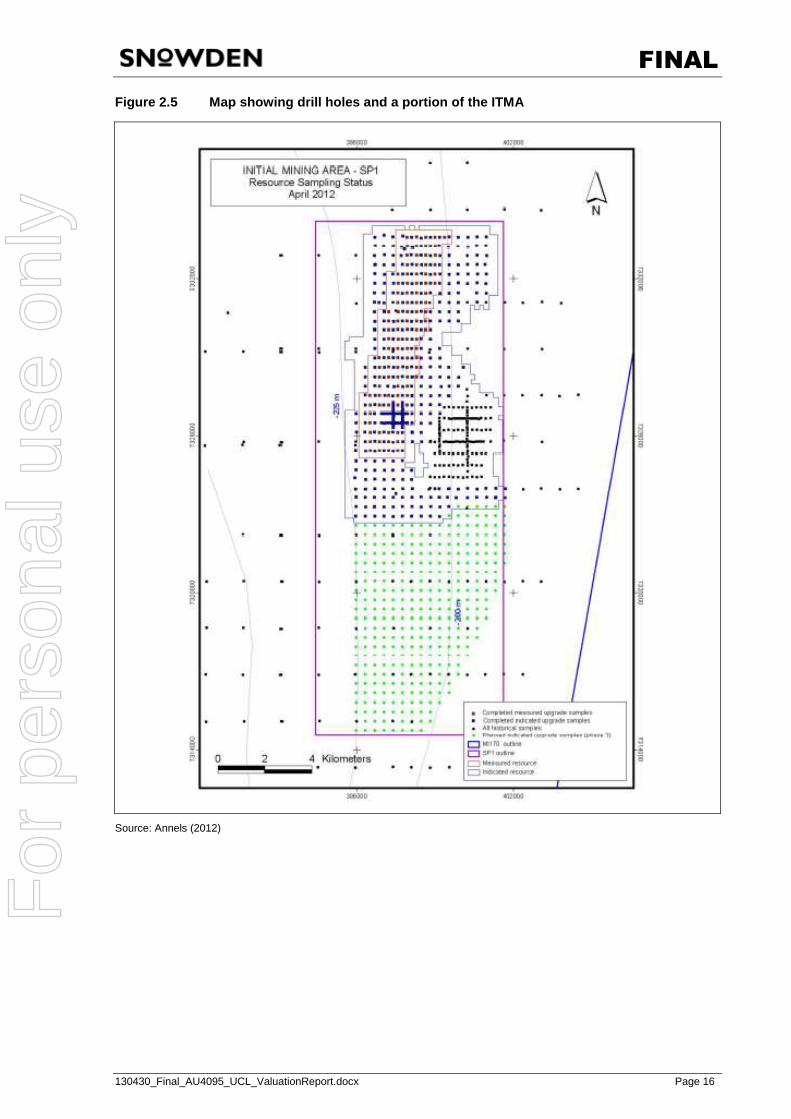
FINAL
130430_Final_AU4095_UCL_ValuationReport.docx Page 16
Figure 2.5 Map showing drill holes and a portion of the ITMA
Source: Annels (2012)
For
per
sona
l use
onl
y
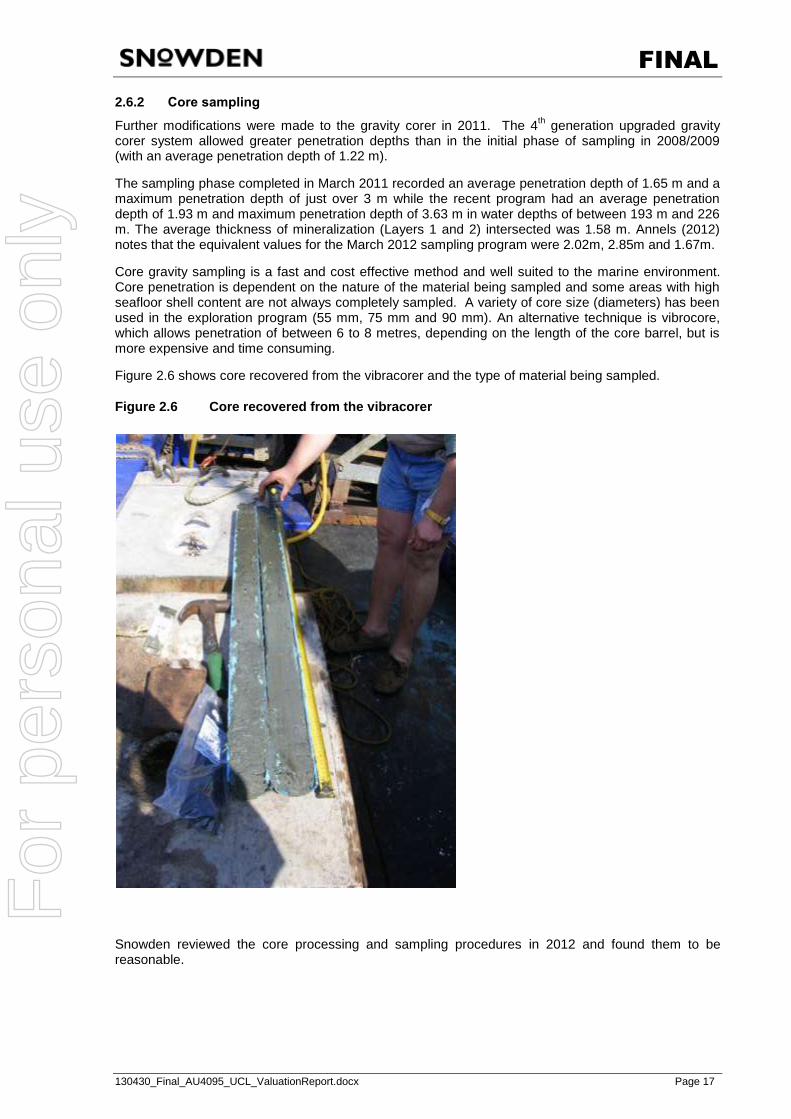
FINAL
130430_Final_AU4095_UCL_ValuationReport.docx Page 17
2.6.2 Core sampling
Further modifications were made to the gravity corer in 2011. The 4th generation upgraded gravity corer system allowed greater penetration depths than in the initial phase of sampling in 2008/2009 (with an average penetration depth of 1.22 m).
The sampling phase completed in March 2011 recorded an average penetration depth of 1.65 m and a maximum penetration depth of just over 3 m while the recent program had an average penetration depth of 1.93 m and maximum penetration depth of 3.63 m in water depths of between 193 m and 226 m. The average thickness of mineralization (Layers 1 and 2) intersected was 1.58 m. Annels (2012) notes that the equivalent values for the March 2012 sampling program were 2.02m, 2.85m and 1.67m.
Core gravity sampling is a fast and cost effective method and well suited to the marine environment. Core penetration is dependent on the nature of the material being sampled and some areas with high seafloor shell content are not always completely sampled. A variety of core size (diameters) has been used in the exploration program (55 mm, 75 mm and 90 mm). An alternative technique is vibrocore, which allows penetration of between 6 to 8 metres, depending on the length of the core barrel, but is more expensive and time consuming.
Figure 2.6 shows core recovered from the vibracorer and the type of material being sampled.
Figure 2.6 Core recovered from the vibracorer
Snowden reviewed the core processing and sampling procedures in 2012 and found them to be reasonable.
For
per
sona
l use
onl
y
FINAL
130430_Final_AU4095_UCL_ValuationReport.docx Page 18
2.6.3 Laboratory
Scientific Services cc (Scientific) is an independent assay laboratory that has been engaged to undertake sample preparation and analysis of the drill cores. Snowden has not visited the laboratory since the visit in February 2012 and cannot comment on the current laboratory procedures, although they are assumed to be unchanged.
When visited in 2012 Snowden observed that the assay results were entered and processed manually, which is not ideal but Snowden considers that the lack of a Laboratory Information System (LIMS) is not a serious issue, however should be implemented. Minor contamination was noted during the pulverisation step of the sample preparation process, but this was not considered to be a serious problem, however steps should be taken to improve the process by e.g. the use of vacuum cleaning rather than compressed air cleaning. Snowden observed sub sampling by scooping, when weighing out pulp for fusion, which is not considered to be best practice, but the practice was consistent.
Sample analysis is undertaken using X-ray fluorescence (XRF) using a Phillips X‟unique II with a PW 1510 sample changer. The room that the machine is located in is not climate controlled, which may not be ideal. The machine is calibrated daily, in the morning, using PanAnalytical‟s Super Q software. Pre prepared blanks and CRM‟s are inserted at a rate of 1 in 30. Snowden believes that the insertion of pre made materials is not optimal and that the blanks and CRM‟s should be processed in the same manner as the field samples in order to detect any contamination in the process. It is not clear from Annels‟ 2012 report if this procedure has been rectified.
UCL submits field duplicate samples on a regular basis (1 in 15 cores are submitted as field duplicates) with an additional 10% of all samples submitted are sent to an umpire laboratory, ALS Chemix. Snowden has not reviewed these results and is not in a position to comment on the accuracy and precision of UCL‟s results.
Major elements including phosphorus, silica iron and aluminium are routinely analysed and organic carbon is determined, in part, by loss on ignition. The following minor elements, considered to be contaminants, are only analysed by exception: chlorine, fluorine, cadmium, uranium, mercury and thorium.
The most recent report by Annels (2012) no longer indicates if these elements are still being analysed.
Scientific participates as a free invited laboratory in Geostats Pty Ltd‟s bi-annual round robin and has achieved acceptable results to date. The laboratory is also ISO accredited, with the most recent audit been completed on 7 March 2012, Snowden is not aware of any updates since this audit nor has had site of the results of any later round robins.
Snowden considers that Scientific employs industry accepted standards for the sample preparation and analytical processes. Snowden cannot currently comment if the overall the analytical results are to industry standard.
QAQC protocols
UCL submits field duplicate samples on a regular basis (1 in 15 cores are submitted as field duplicates) with an additional 10% of all samples sent to an umpire laboratory, ALS Chemix.
Pre-prepared blanks and CRM‟s are inserted at a rate of 1 in 30.
QA/QC protocols include the following:
Close spaced drilling to test the reproducibility of sample data at a specific location.
Duplicate sampling and analysis of core to determine the combined sampling and analytical precision.
Repeat analysis of samples in the laboratory to determine the analytical precision. This procedure is undertaken by the laboratory.
Repeat analysis of „blind‟ samples previously analysed by the laboratory but re-submitted with new numbers.
Analysis of commercially available accredited standards with each batch of routine samples to determine analytical accuracy.
For
per
sona
l use
onl
y
FINAL
130430_Final_AU4095_UCL_ValuationReport.docx Page 19
Analysis of blanks to monitor potential contamination in the sample preparation process.
Analysis of a selected batch of samples covering the normal assay range at an internationally accredited assay laboratory (referee laboratory).
UCL reported that results are very satisfactory and there is no evidence of any systematic bias. Intra- and inter-laboratory comparisons all indicated repeatability of results to a precision of better than 5%.
2.7 MINERAL RESOURCES
A recently completed resource development drilling program of gravity core sampling in the northern half of the initial 8 km x 20 km target recovery area has resulted in an upgraded mineral resource estimate (Annels, 2012). The sampling program has delineated sufficient resources in the Indicated Resource category to support a 20 year mine development plan for the Definitive Feasibility Study (“DFS”).
Within the sampled area, the previous 109.5 million tonnes (Mt) Inferred Resource estimate has been replaced by estimates of 104.95 Mt Indicated Resource and 60.08Mt Measured Resource (as dry tonnes). It increased penetration from the previous 1.45m to 1.93m depth in the recent program. Phosphate mineralization is generally still open at depth to the west and south of this newly tested resource area.
Two dimensional (2D) Inverse Distance Weighting to the power of 3 (ID3) methods were used to interpolate thicknesses, grade, metal accumulations, specific gravities and moisture content for 200 m N-S x 200 m E-W blocks. Extrapolation was constrained by the search parameters, which were controlled by examination of the distribution and trends of data, the numbers of samples captured and by the results of recent geostatistical studies. Indicated and Measured Mineral Resources were estimated by Annels (2012) for the ITMA in ML170 using combined assay and thickness data for Layers 1 and 2.
New specific gravity (SG) or density data for the two layers in the deposit were used to produce regression equations to determine a combined SG for each intersection using both P2O5 values and core lengths. A similar approach was used for the “dry to wet” ratios. The resultant values were used for both Indicated and Measured Mineral Resources.
For the Inferred Mineral Resources, volumes were converted into wet tonnes using a density of 1.68 tonnes/m3 and a factor of 75% to convert wet to dry tonnes.
Figure 2.7 is a map of the Sandpiper resource blocks showing block grades.
For
per
sona
l use
onl
y
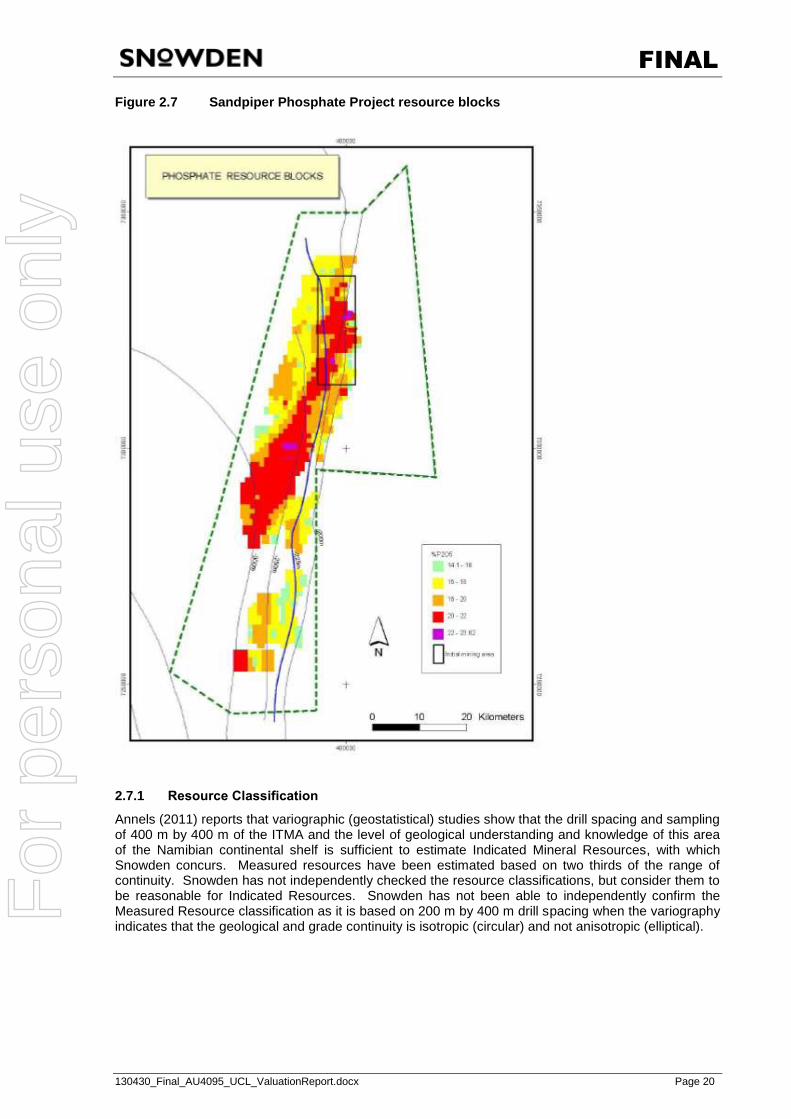
FINAL
130430_Final_AU4095_UCL_ValuationReport.docx Page 20
Figure 2.7 Sandpiper Phosphate Project resource blocks
2.7.1 Resource Classification
Annels (2011) reports that variographic (geostatistical) studies show that the drill spacing and sampling of 400 m by 400 m of the ITMA and the level of geological understanding and knowledge of this area of the Namibian continental shelf is sufficient to estimate Indicated Mineral Resources, with which Snowden concurs. Measured resources have been estimated based on two thirds of the range of continuity. Snowden has not independently checked the resource classifications, but consider them to be reasonable for Indicated Resources. Snowden has not been able to independently confirm the Measured Resource classification as it is based on 200 m by 400 m drill spacing when the variography indicates that the geological and grade continuity is isotropic (circular) and not anisotropic (elliptical). F
or p
erso
nal u
se o
nly
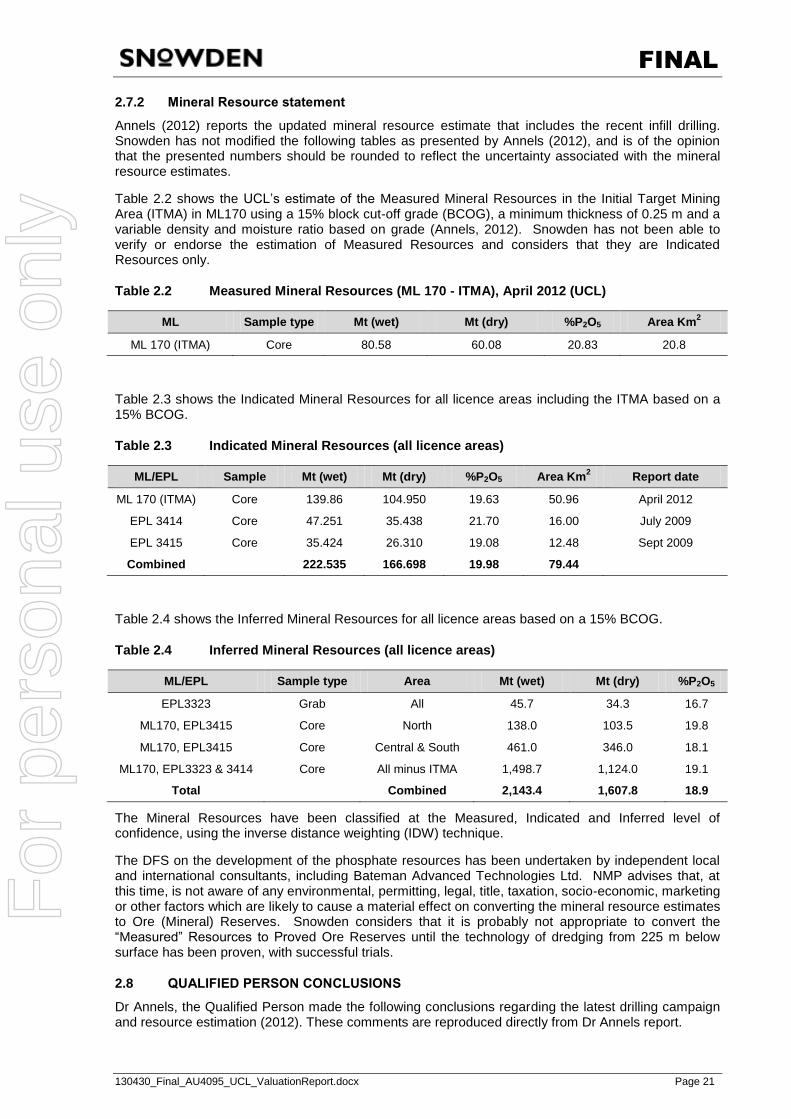
FINAL
130430_Final_AU4095_UCL_ValuationReport.docx Page 21
2.7.2 Mineral Resource statement
Annels (2012) reports the updated mineral resource estimate that includes the recent infill drilling. Snowden has not modified the following tables as presented by Annels (2012), and is of the opinion that the presented numbers should be rounded to reflect the uncertainty associated with the mineral resource estimates.
Table 2.2 shows the UCL‟s estimate of the Measured Mineral Resources in the Initial Target Mining Area (ITMA) in ML170 using a 15% block cut-off grade (BCOG), a minimum thickness of 0.25 m and a variable density and moisture ratio based on grade (Annels, 2012). Snowden has not been able to verify or endorse the estimation of Measured Resources and considers that they are Indicated Resources only.
Table 2.2 Measured Mineral Resources (ML 170 - ITMA), April 2012 (UCL)
ML Sample type Mt (wet) Mt (dry) %P2O5 Area Km2
ML 170 (ITMA) Core 80.58 60.08 20.83 20.8
Table 2.3 shows the Indicated Mineral Resources for all licence areas including the ITMA based on a 15% BCOG.
Table 2.3 Indicated Mineral Resources (all licence areas)
ML/EPL Sample Mt (wet) Mt (dry) %P2O5 Area Km2 Report date
ML 170 (ITMA) Core 139.86 104.950 19.63 50.96 April 2012
EPL 3414 Core 47.251 35.438 21.70 16.00 July 2009
EPL 3415 Core 35.424 26.310 19.08 12.48 Sept 2009
Combined
222.535 166.698 19.98 79.44
Table 2.4 shows the Inferred Mineral Resources for all licence areas based on a 15% BCOG.
Table 2.4 Inferred Mineral Resources (all licence areas)
ML/EPL Sample type Area Mt (wet) Mt (dry) %P2O5
EPL3323 Grab All 45.7 34.3 16.7
ML170, EPL3415 Core North 138.0 103.5 19.8
ML170, EPL3415 Core Central & South 461.0 346.0 18.1
ML170, EPL3323 & 3414 Core All minus ITMA 1,498.7 1,124.0 19.1
Total Combined 2,143.4 1,607.8 18.9
The Mineral Resources have been classified at the Measured, Indicated and Inferred level of confidence, using the inverse distance weighting (IDW) technique.
The DFS on the development of the phosphate resources has been undertaken by independent local and international consultants, including Bateman Advanced Technologies Ltd. NMP advises that, at this time, is not aware of any environmental, permitting, legal, title, taxation, socio-economic, marketing or other factors which are likely to cause a material effect on converting the mineral resource estimates to Ore (Mineral) Reserves. Snowden considers that it is probably not appropriate to convert the “Measured” Resources to Proved Ore Reserves until the technology of dredging from 225 m below surface has been proven, with successful trials.
2.8 QUALIFIED PERSON CONCLUSIONS
Dr Annels, the Qualified Person made the following conclusions regarding the latest drilling campaign and resource estimation (2012). These comments are reproduced directly from Dr Annels report.
For
per
sona
l use
onl
y
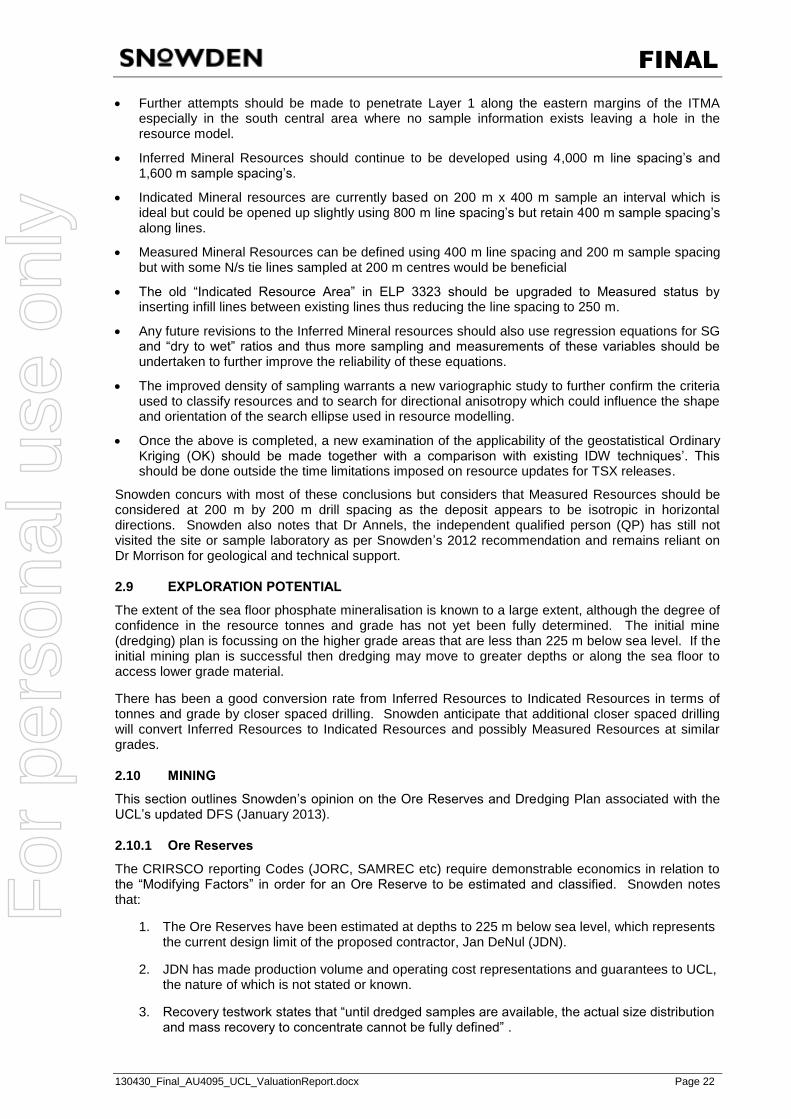
FINAL
130430_Final_AU4095_UCL_ValuationReport.docx Page 22
Further attempts should be made to penetrate Layer 1 along the eastern margins of the ITMA especially in the south central area where no sample information exists leaving a hole in the resource model.
Inferred Mineral Resources should continue to be developed using 4,000 m line spacing‟s and 1,600 m sample spacing‟s.
Indicated Mineral resources are currently based on 200 m x 400 m sample an interval which is ideal but could be opened up slightly using 800 m line spacing‟s but retain 400 m sample spacing‟s along lines.
Measured Mineral Resources can be defined using 400 m line spacing and 200 m sample spacing but with some N/s tie lines sampled at 200 m centres would be beneficial
The old “Indicated Resource Area” in ELP 3323 should be upgraded to Measured status by inserting infill lines between existing lines thus reducing the line spacing to 250 m.
Any future revisions to the Inferred Mineral resources should also use regression equations for SG and “dry to wet” ratios and thus more sampling and measurements of these variables should be undertaken to further improve the reliability of these equations.
The improved density of sampling warrants a new variographic study to further confirm the criteria used to classify resources and to search for directional anisotropy which could influence the shape and orientation of the search ellipse used in resource modelling.
Once the above is completed, a new examination of the applicability of the geostatistical Ordinary Kriging (OK) should be made together with a comparison with existing IDW techniques‟. This should be done outside the time limitations imposed on resource updates for TSX releases.
Snowden concurs with most of these conclusions but considers that Measured Resources should be considered at 200 m by 200 m drill spacing as the deposit appears to be isotropic in horizontal directions. Snowden also notes that Dr Annels, the independent qualified person (QP) has still not visited the site or sample laboratory as per Snowden‟s 2012 recommendation and remains reliant on Dr Morrison for geological and technical support.
2.9 EXPLORATION POTENTIAL
The extent of the sea floor phosphate mineralisation is known to a large extent, although the degree of confidence in the resource tonnes and grade has not yet been fully determined. The initial mine (dredging) plan is focussing on the higher grade areas that are less than 225 m below sea level. If the initial mining plan is successful then dredging may move to greater depths or along the sea floor to access lower grade material.
There has been a good conversion rate from Inferred Resources to Indicated Resources in terms of tonnes and grade by closer spaced drilling. Snowden anticipate that additional closer spaced drilling will convert Inferred Resources to Indicated Resources and possibly Measured Resources at similar grades.
2.10 MINING
This section outlines Snowden‟s opinion on the Ore Reserves and Dredging Plan associated with the UCL‟s updated DFS (January 2013).
2.10.1 Ore Reserves
The CRIRSCO reporting Codes (JORC, SAMREC etc) require demonstrable economics in relation to the “Modifying Factors” in order for an Ore Reserve to be estimated and classified. Snowden notes that:
1. The Ore Reserves have been estimated at depths to 225 m below sea level, which represents the current design limit of the proposed contractor, Jan DeNul (JDN).
2. JDN has made production volume and operating cost representations and guarantees to UCL, the nature of which is not stated or known.
3. Recovery testwork states that “until dredged samples are available, the actual size distribution and mass recovery to concentrate cannot be fully defined” .
For
per
sona
l use
onl
y
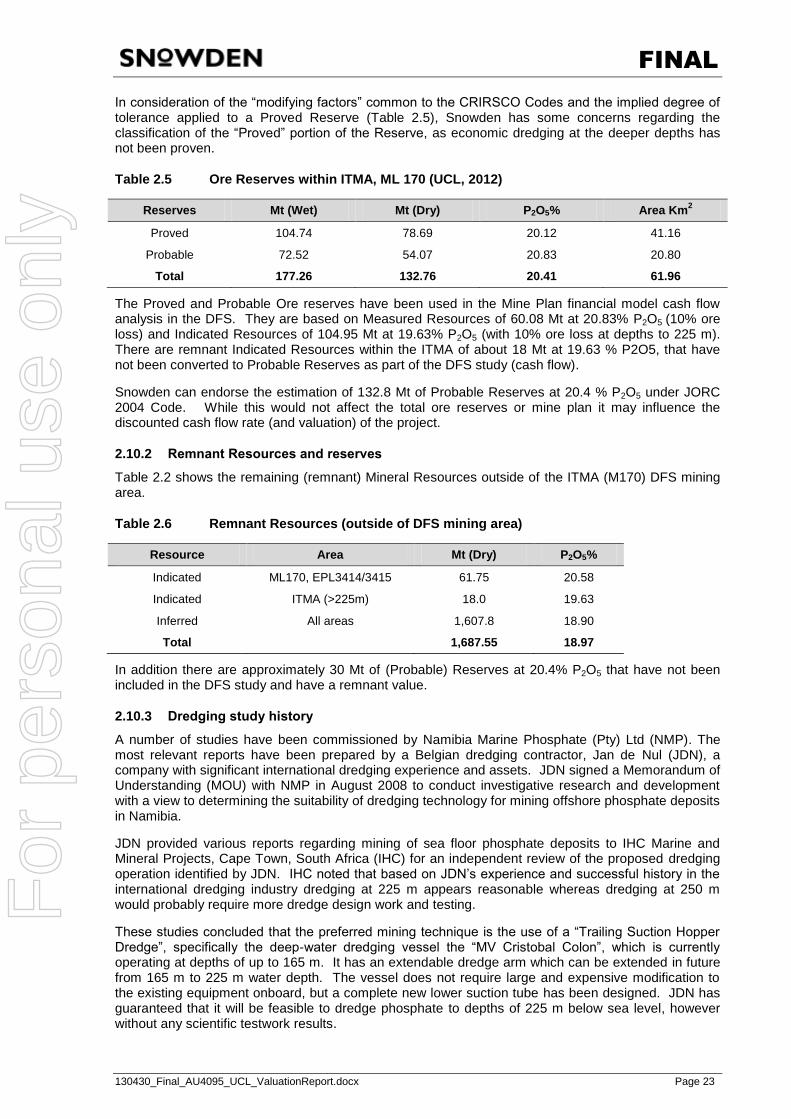
FINAL
130430_Final_AU4095_UCL_ValuationReport.docx Page 23
In consideration of the “modifying factors” common to the CRIRSCO Codes and the implied degree of tolerance applied to a Proved Reserve (Table 2.5), Snowden has some concerns regarding the classification of the “Proved” portion of the Reserve, as economic dredging at the deeper depths has not been proven.
Table 2.5 Ore Reserves within ITMA, ML 170 (UCL, 2012)
Reserves Mt (Wet) Mt (Dry) P2O5% Area Km2
Proved 104.74 78.69 20.12 41.16
Probable 72.52 54.07 20.83 20.80
Total 177.26 132.76 20.41 61.96
The Proved and Probable Ore reserves have been used in the Mine Plan financial model cash flow analysis in the DFS. They are based on Measured Resources of 60.08 Mt at 20.83% P2O5 (10% ore loss) and Indicated Resources of 104.95 Mt at 19.63% P2O5 (with 10% ore loss at depths to 225 m). There are remnant Indicated Resources within the ITMA of about 18 Mt at 19.63 % P2O5, that have not been converted to Probable Reserves as part of the DFS study (cash flow).
Snowden can endorse the estimation of 132.8 Mt of Probable Reserves at 20.4 % P2O5 under JORC 2004 Code. While this would not affect the total ore reserves or mine plan it may influence the discounted cash flow rate (and valuation) of the project.
2.10.2 Remnant Resources and reserves
Table 2.2 shows the remaining (remnant) Mineral Resources outside of the ITMA (M170) DFS mining area.
Table 2.6 Remnant Resources (outside of DFS mining area)
Resource Area Mt (Dry) P2O5%
Indicated ML170, EPL3414/3415 61.75 20.58
Indicated ITMA (>225m) 18.0 19.63
Inferred All areas 1,607.8 18.90
Total 1,687.55 18.97
In addition there are approximately 30 Mt of (Probable) Reserves at 20.4% P2O5 that have not been included in the DFS study and have a remnant value.
2.10.3 Dredging study history
A number of studies have been commissioned by Namibia Marine Phosphate (Pty) Ltd (NMP). The most relevant reports have been prepared by a Belgian dredging contractor, Jan de Nul (JDN), a company with significant international dredging experience and assets. JDN signed a Memorandum of Understanding (MOU) with NMP in August 2008 to conduct investigative research and development with a view to determining the suitability of dredging technology for mining offshore phosphate deposits in Namibia.
JDN provided various reports regarding mining of sea floor phosphate deposits to IHC Marine and Mineral Projects, Cape Town, South Africa (IHC) for an independent review of the proposed dredging operation identified by JDN. IHC noted that based on JDN‟s experience and successful history in the international dredging industry dredging at 225 m appears reasonable whereas dredging at 250 m would probably require more dredge design work and testing.
These studies concluded that the preferred mining technique is the use of a “Trailing Suction Hopper Dredge”, specifically the deep-water dredging vessel the “MV Cristobal Colon”, which is currently operating at depths of up to 165 m. It has an extendable dredge arm which can be extended in future from 165 m to 225 m water depth. The vessel does not require large and expensive modification to the existing equipment onboard, but a complete new lower suction tube has been designed. JDN has guaranteed that it will be feasible to dredge phosphate to depths of 225 m below sea level, however without any scientific testwork results.
For
per
sona
l use
onl
y
FINAL
130430_Final_AU4095_UCL_ValuationReport.docx Page 24
The submerged dredge pumps mounted on the suction pipe are considered by JDN to be very simple and robust and JDN has extensive experience with them. JDN currently has five 6.5 MW submerged pumps mounted on the suction pipe in operation in their dredging fleet (the size intended to be used on the skid). All submerged pumps used in the dredging fleet are electrically driven. The dredging vessels equipped with underwater pumps have two main heavy fuel oil (HFO) engines directly coupled to the propellers and generators.
JDN also executed a feasibility study for dredging phosphate sands up between 225 m and 300 m deep and developed the towed sled (with submerged dredge pump) system on the dredging vessel called the “Skid concept”. The skid mounted pump is not limited by cavitation, but by available power. In the range of 200 m to 300 m water depth, it is estimated that the production of the skid mounted pump will be higher than the suction pipe mounted pump. JDN has confirmation from the manufacturers that the skid mounted pump and motor are not different from the existing suction pipe mounted pump, which is also an electrically driven submerged pump, apart from some minor adjustments such as the internal oil pressure compensation. The dredge pump and jet pump on the skid will be powered by two umbilicals, each estimated at delivering about 4.5 MW.
2.10.4 Dredging reports
Snowden has examined a number of the dredging reports provide by UCL, including:
Mining System Scoping Study Report, IHC Marine and Mineral Projects, 31 August 2010, Cape Town (a review of Jan de Nul‟s work to that date).
Project Assessment Report, Jan de Nul, 21 March 2009.
Project Assessment Report, Jan de Nul, 1 February 2010.
Namibian Marine Phosphate Mining, Mining System Scoping Study Report, IHC Merwede, 31 August 2010.
Deepwater Feasibility Study, Jan de Nul, 15 January 2012 (the most recent in a series of studies).
Hazard Identification Study, „Foldable suction pie‟, Jan de Nul Group n.v. (Det Norske Veritas), 2 July 2012.
Sandpiper Moeb Marine Phosphate Project Definitive Feasibility Study, updated January 2013.
Sandpiper Phosphate Project, Maximum Working Depth, Jan de Nul, 9 March 2013.
UCL comments on Snowden dredging memorandum.
PS NAM-PA-13 002-FJ-A.pdf.
2.10.5 Mining Concept (Dredge Plan)
The mining method being proposed for the Sandpiper phosphate deposit is to dredge the phosphate ore from the sea floor at a depth of between 200 m and 300 m below sea level with the initial dredging campaign mining to a depth of 225 m below sea level. The phosphate material is unconsolidated and contained in three layers with the lower containing poor quality phosphorite and tightly packed Miocene clays forming a competent footwall. The phosphate orebody is on the surface of the ocean floor and is not covered with any waste ocean sediments. Therefore, there is no dilution from any overlying sediments.
The dredging of the sea floor for minerals off the Namibian coast is not new. The De Beers Group has been dredge mining diamonds in Namibia (through Debmarine Namibia) since 2007. However, the depth of dredging for diamonds by De Beers does not exceed 140 m. Currently the available dredges have a reach not exceeding 165 m below sea level.
For
per
sona
l use
onl
y

FINAL
130430_Final_AU4095_UCL_ValuationReport.docx Page 25
A number of studies have been commissioned by NMP to find ways to dredge at depths greater than 165 m, the most relevant of which was prepared by the Belgian dredging contractor, Jan de Nul (JDN). JDN guarantees that the proposed solution will work but, as yet, Snowden has not observed written detail on the nature of the guarantee or scientific or practical proof. JDN is suggesting the use of its largest dredge, the Cristobal Colon with a custom dredge arm and an extended suction pipe to recover the material from depths below 165 m. Figure 2.8 is a photograph of the Peace in Africa used by De Beers to dredge for diamonds. This dredge deploys a crawler rather than a trailing arm and carries
fully contained screening, dense media separation (“DMS”) and X ray process plant and with no
hopper transport facility. The Cristobal Colon is a trailing suction hopper dredge (“TSHD”) with a somewhat different configuration.
Figure 2.8 Peace in Africa dredge
JDN in 2011 initiated a design of an extension of the suction pipe - also called the “Jack-knife”- which allows to dredge up to 225 m deep.
Snowden notes that no design criteria were provided for review in the DFS. A draft report by JDN dated 9 March 2013 on “Maximum Working Depth” was later provided to Snowden showing the proposed Jack-knife design which has been designed to dredge phosphate from depths of 165 m to 225 m. JDN proposes to mount a powerful pump 30 m below surface to create the negative pressure required to draw up the slurry through a 1 meter diameter pipe.
Previously (2012) UCL noted that:
Because the pump production is limited by cavitation, deeper dredging depth will result in less slurry density and lower production. However in the DFS, JDN have applied conservative estimates of production levels.
The estimated production is calculated for the maximum dredging depth of 225 m. The resource intended to be dredged/mined with the suction tube mounted dredge pump is between 180 m to 225 m.
The reason to limit the maximum dredging depth of the extended suction pipe to 225 m is:
a. mechanical - the design of a longer suction pipe and fitting it on deck becomes difficult
b. hydraulic – the impact of the cavitation limit on the production becomes too important. The only way to solve the cavitation limit is moving the pump further down under the sea level surface.
For
per
sona
l use
onl
y

FINAL
130430_Final_AU4095_UCL_ValuationReport.docx Page 26
JDN considers the bearing force of the crawler system employed by De Beers to be too high to allow the efficient movement of the extraction tool. Snowden was advised by UCL that bearing force is only one of the factors negating the use of crawlers in this application. Others include:
Complexity of machine (experience shows significantly increased maintenance and down time, compared to other systems).
Complexity of operation.
Capital cost of manufacture (crawler, LARS, heave compensation, cable, delivery hose and umbilical handling.
Vessel conversion costs.
Lower production rates.
UCL noted that the position of the dredge head with the extended arm is determined by tried and tested, commonly used techniques using GPS and offsets. UCL noted that the various dredging options (TSHD, crawler, drill ship, conventional air lift) were discussed and reviewed by IHC Marine DFS who also concluded that the extended dredge arm is the preferred recovery method. According to JDN (UCL) the extended dredge arm option involves significantly lower capital build costs for the “extraction tool”, minimal vessel conversion (and costs related thereto) and offers the least technical risk.
2.10.6 Phosphate production
The mine plan is for 20 years with the ramp up to full production over a 3 year period and thereafter production parameters are maintained.
Snowden was provided a complete mass balance of the slurry flow from the suction head to the plant feed pond. Snowden notes that the two main factors identified which will affect the smooth extraction of the phosphate resource are wave heights and fog. Wave heights that can negatively affect the production are those over 3 m. Information gathered suggest that for 75% of the year, wave heights are less than 3 m, and in 95% of the year they are less than 4 m. Snowden considers that JDN has made adequate provision for this by allowing 55 hours of down time per week.
2.10.7 Mechanical availability of the dredge
JDN has made provision for mechanical down time of 13 hours. Snowden believes that this is adequate since part of the 55 hours of weather downtime could be available for maintenance and repair should the need arise.
2.10.8 Grade control measures
A dredge control system will be installed on the dredge to control over-dredging and thereby reduce dilution. A thickness of 40 cm of material will be left on top of the bedrock to minimise footwall dilution, which appears to be adequate. Snowden notes that there are no overlying sediments and therefore no hangingwall dilution.
Snowden understands that geology of the diamondiferous deposits being mined by De Beers is different from the Sandpiper phosphate deposits in terms of grain size variability (from clay through sands to cobbles and boulders) resting on an uneven footwall (erosion surface unconformity). In addition diamond mining requires meticulous clean-up of the footwall interface as the economic mineral (diamond) occurs as a low grade placer deposit with patchy distribution displaying a marked nugget effect.
Snowden did not note any information on the accuracy of the bathymetry measurements used to determine the elevation of the sea floor. UCL responded that modern bathymetric mapping techniques are very accurate and are fundamental to offshore dredging requirements in the off shore oil, engineering and construction businesses. The information was not available in the DFS, but subsequent reports by JDN in April 2013 indicate that the accuracy of the position is estimated to be less than 20 cm in all directions including depth.
For
per
sona
l use
onl
y
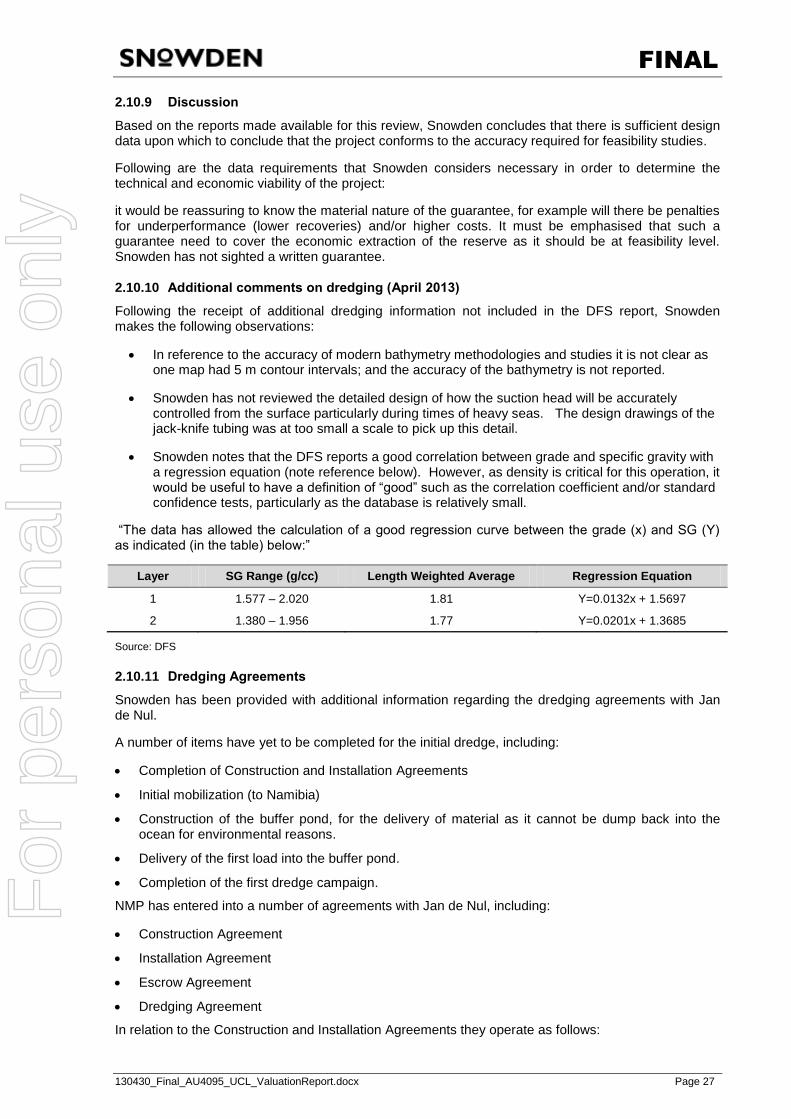
FINAL
130430_Final_AU4095_UCL_ValuationReport.docx Page 27
2.10.9 Discussion
Based on the reports made available for this review, Snowden concludes that there is sufficient design data upon which to conclude that the project conforms to the accuracy required for feasibility studies.
Following are the data requirements that Snowden considers necessary in order to determine the technical and economic viability of the project:
it would be reassuring to know the material nature of the guarantee, for example will there be penalties for underperformance (lower recoveries) and/or higher costs. It must be emphasised that such a guarantee need to cover the economic extraction of the reserve as it should be at feasibility level. Snowden has not sighted a written guarantee.
2.10.10 Additional comments on dredging (April 2013)
Following the receipt of additional dredging information not included in the DFS report, Snowden makes the following observations:
In reference to the accuracy of modern bathymetry methodologies and studies it is not clear as one map had 5 m contour intervals; and the accuracy of the bathymetry is not reported.
Snowden has not reviewed the detailed design of how the suction head will be accurately controlled from the surface particularly during times of heavy seas. The design drawings of the jack-knife tubing was at too small a scale to pick up this detail.
Snowden notes that the DFS reports a good correlation between grade and specific gravity with a regression equation (note reference below). However, as density is critical for this operation, it would be useful to have a definition of “good” such as the correlation coefficient and/or standard confidence tests, particularly as the database is relatively small.
“The data has allowed the calculation of a good regression curve between the grade (x) and SG (Y) as indicated (in the table) below:”
Layer SG Range (g/cc) Length Weighted Average Regression Equation
1 1.577 – 2.020 1.81 Y=0.0132x + 1.5697
2 1.380 – 1.956 1.77 Y=0.0201x + 1.3685
Source: DFS
2.10.11 Dredging Agreements
Snowden has been provided with additional information regarding the dredging agreements with Jan de Nul.
A number of items have yet to be completed for the initial dredge, including:
Completion of Construction and Installation Agreements
Initial mobilization (to Namibia)
Construction of the buffer pond, for the delivery of material as it cannot be dump back into the ocean for environmental reasons.
Delivery of the first load into the buffer pond.
Completion of the first dredge campaign.
NMP has entered into a number of agreements with Jan de Nul, including:
Construction Agreement
Installation Agreement
Escrow Agreement
Dredging Agreement
In relation to the Construction and Installation Agreements they operate as follows:
For
per
sona
l use
onl
y
FINAL
130430_Final_AU4095_UCL_ValuationReport.docx Page 28
There is a work program which has specific milestones
Each milestone requires a contribution from NMP
The contributions from NMP are placed into escrow and can only be drawn down by Jan de Nul upon the completion of the delivery of the first load into the buffer pond.
The Dredging Contract has a number of terms, the commercial terms of which include:
Performance guarantees, which equate to around 25% of the Dredging Contract value.
Liquidated damages are still being negotiated and NMP is looking for a very high percentage, given the reliance on Jan de Nul.
Dredging costs for year 1 and mechanisms for year two and beyond.
Variables, including weather, compaction, maintenance etc. which have been set on the conservative side, given Jan de Nul‟s experience having previously dredged off the coast of Namibia.
2.10.12 Conclusion
From the review of the proposed mining/dredging operation, Snowden concludes that the DFS is sufficient to conclude that the project, while not devoid of risk, will be technically viable using the proposed dredging process. It is encouraging that there are other apparently successful dredging operations in the region of the phosphate beds by De Beers for diamonds. However, the proposed operation is at a greater depth and will use a technique that is different to the De Beers dredging operation.
Snowden considers that the technology and efficient dredging of phosphate from depths to 225 m below sea level has not been “proven” and classifying the reserves as Probable Ore Reserves may be more appropriate. However, In view of JDN‟s guarantee and reassurance, and some proof with regards to technical and economic viability that it is feasible and economic to dredge the phosphate from those depths, and subject to appropriate financial guarantees then the classification of Proved Reserves may be acceptable. It appears from the section above (2.10.11) that these assurances will be in place soon.
2.11 PROCESSING
The metallurgical test work to generate engineering design data was conducted at laboratory scale for the Scoping Study (SS) and progressed to pilot scale for the Definitive Feasibility Study (DFS).
Bateman Advanced Technologies (BAT) undertook the majority of the testing in their Research Centre in Katzrin, Israel, and supervised gravity testing by Studien Gesellschaft für Eisenerz-Aufbereitung (SGA) in Germany. Two pilot tests were undertaken at MINTEK in Johannesburg, South Africa. Samples were sent to ArrMaz Specialty Chemicals for scoping flotation tests. The characterization and flotation tests were repeated by KemWorks in Florida, USA. Yara International (Yara) conducted some tests to assess suitability of the Sandpiper concentrate to phosphoric acid production. Yara was founded in Norway in 1905, and has a worldwide presence with sales to 150 countries. It is the world‟s leading chemical company that converts energy, natural minerals and nitrogen into agricultural (fertilizers) and industrial products.
2.11.1 Scoping Study Level Metallurgical Test Work
The scoping study level test program was designed to verify whether it would be possible to beneficiate the marine phosphate and establish the extent of possible enrichment.
The main goals of this program of beneficiation test work were:
To determine whether crushing, grinding, scrubbing and attrition would encourage the liberation of clay-like carbonaceous shell type gangue from valuable apatite/francolite and that a low grade rejectable size fraction could be produced as a result.
To establish whether sufficiently rich concentrate can be produced from this low grade ROM material.
To optimize the most effective beneficiation process including an assessment of the beneficiation potential of the phosphate ore body.
For
per
sona
l use
onl
y
FINAL
130430_Final_AU4095_UCL_ValuationReport.docx Page 29
Evaluation of the concentrate produced for potential conversion into wet process phosphoric acid and fertilizer. This was a desk top assessment based on submitted assay of the concentrate to a WPA/fertilizer licensor.
The scoping study incorporated two phases of test work. The first phase investigated seven samples while a bulk sample was used for the second phase investigations. These samples were collected under the supervision of geologists by a sampling spear which was able to collect sub-samples of the three distinct layers of the ore deposit from the seabed. These two phases were completed in October 2010.
Phase 1 tests were performed on discrete Layer 1 and 2 samples. A sample of Layer 3 was also included. The test work consisted of sample characterization by sizing, attrition tests, and heavy liquid separation. The Phase 2 testwork was performed on a bulk sample, which represented mainly Layer 1 (see paragraph 2012 Pilot test Work, Bulk sampling). The testwork included characterization by size, heavy media separation, attrition and calcination.
Phase 1
In the first phase, two distinct phosphate regions were found, two richer top layers assaying 17 - 22% P2O5 and a third deeper layer assaying around 3% P2O5. The richer layers were used for testing and the trials showed that concentrate assaying 27% P2O5 could be produced following a beneficiation process that incorporated the following stages:
size classification
attrition
desliming
gravity separation (heavy liquid).
The third and deepest layer was extremely fine grained and when subjected to the size separation a concentrate assaying 24% P2O5 was achieved for the target size fraction of 150 to 500 micron at a weight recovery of 6%. The remaining 94% was discarded as fine reject being finer than 150 microns.
The main conclusions from the phase 1 of the test work are summarised below:
The phosphate is primarily carbonaceous with some silica and organic matter present.
The results indicate that the samples from the upper two layers can be blended as they are quite similar in grade and gangue material distribution.
In the third layer, approximately 10% of the ore contains 85% of the phosphate. The remainders are slimes which are very low in P2O5.
The blended marine phosphate from layers 1 and 2 assayed 18.2% P2O5, 2.08% Al2O3, 3.36% Fe2O3 and 1.27% MgO.
The phosphate contains appreciable organic matter (4 - 5% TOC).
The marine phosphate contains borderline concentrations of MgO (0.8 - 1.6%), Al2O3 (0.9% to 3%) and Fe2O3 (2.2% to 3.9%).
The -1 +0.074 mm size fraction makes up 55% to 78% of the ore and contains 78% to 96% of the phosphate, dependant on the subsample. Separation of this size fraction enriches the feed from 15 - 16% to 23 - 24% P2O5.
Both coarse and fine fractions can be rejected with minor losses of phosphate. The combined reject represents 22 - 45% of the ROM.
The phosphate show selective disintegration and slimes production during attrition. This phenomenon is relatively consistent and it is most effective during the first five minutes of the process after which the effect become constant.
The attritioned slimes results in P2O5 enrichment, generally less than 1% were achieved.
After thirty minutes of attrition the sample was beneficiated from 22.2% P2O5 to 26.1% P2O5.
In terms of Fe removal, attrition achieved removal of up to 8% of the Fe from layer 1 and up to 30% of the overall iron oxide from layer 2. This trend also applies to Mg, Al and insoluble matter.
For
per
sona
l use
onl
y
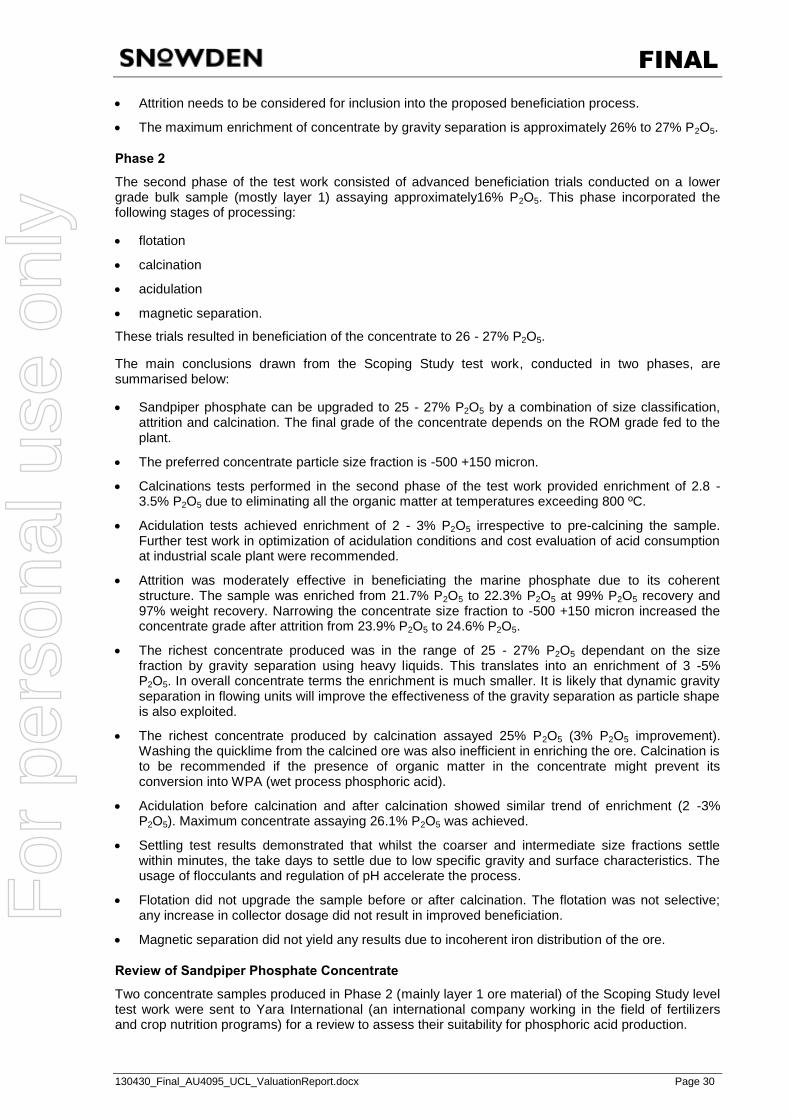
FINAL
130430_Final_AU4095_UCL_ValuationReport.docx Page 30
Attrition needs to be considered for inclusion into the proposed beneficiation process.
The maximum enrichment of concentrate by gravity separation is approximately 26% to 27% P2O5.
Phase 2
The second phase of the test work consisted of advanced beneficiation trials conducted on a lower grade bulk sample (mostly layer 1) assaying approximately16% P2O5. This phase incorporated the following stages of processing:
flotation
calcination
acidulation
magnetic separation.
These trials resulted in beneficiation of the concentrate to 26 - 27% P2O5.
The main conclusions drawn from the Scoping Study test work, conducted in two phases, are summarised below:
Sandpiper phosphate can be upgraded to 25 - 27% P2O5 by a combination of size classification, attrition and calcination. The final grade of the concentrate depends on the ROM grade fed to the plant.
The preferred concentrate particle size fraction is -500 +150 micron.
Calcinations tests performed in the second phase of the test work provided enrichment of 2.8 - 3.5% P2O5 due to eliminating all the organic matter at temperatures exceeding 800 ºC.
Acidulation tests achieved enrichment of 2 - 3% P2O5 irrespective to pre-calcining the sample. Further test work in optimization of acidulation conditions and cost evaluation of acid consumption at industrial scale plant were recommended.
Attrition was moderately effective in beneficiating the marine phosphate due to its coherent structure. The sample was enriched from 21.7% P2O5 to 22.3% P2O5 at 99% P2O5 recovery and 97% weight recovery. Narrowing the concentrate size fraction to -500 +150 micron increased the concentrate grade after attrition from 23.9% P2O5 to 24.6% P2O5.
The richest concentrate produced was in the range of 25 - 27% P2O5 dependant on the size fraction by gravity separation using heavy liquids. This translates into an enrichment of 3 -5% P2O5. In overall concentrate terms the enrichment is much smaller. It is likely that dynamic gravity separation in flowing units will improve the effectiveness of the gravity separation as particle shape is also exploited.
The richest concentrate produced by calcination assayed 25% P2O5 (3% P2O5 improvement). Washing the quicklime from the calcined ore was also inefficient in enriching the ore. Calcination is to be recommended if the presence of organic matter in the concentrate might prevent its conversion into WPA (wet process phosphoric acid).
Acidulation before calcination and after calcination showed similar trend of enrichment (2 -3% P2O5). Maximum concentrate assaying 26.1% P2O5 was achieved.
Settling test results demonstrated that whilst the coarser and intermediate size fractions settle within minutes, the take days to settle due to low specific gravity and surface characteristics. The usage of flocculants and regulation of pH accelerate the process.
Flotation did not upgrade the sample before or after calcination. The flotation was not selective; any increase in collector dosage did not result in improved beneficiation.
Magnetic separation did not yield any results due to incoherent iron distribution of the ore.
Review of Sandpiper Phosphate Concentrate
Two concentrate samples produced in Phase 2 (mainly layer 1 ore material) of the Scoping Study level test work were sent to Yara International (an international company working in the field of fertilizers and crop nutrition programs) for a review to assess their suitability for phosphoric acid production.
For
per
sona
l use
onl
y
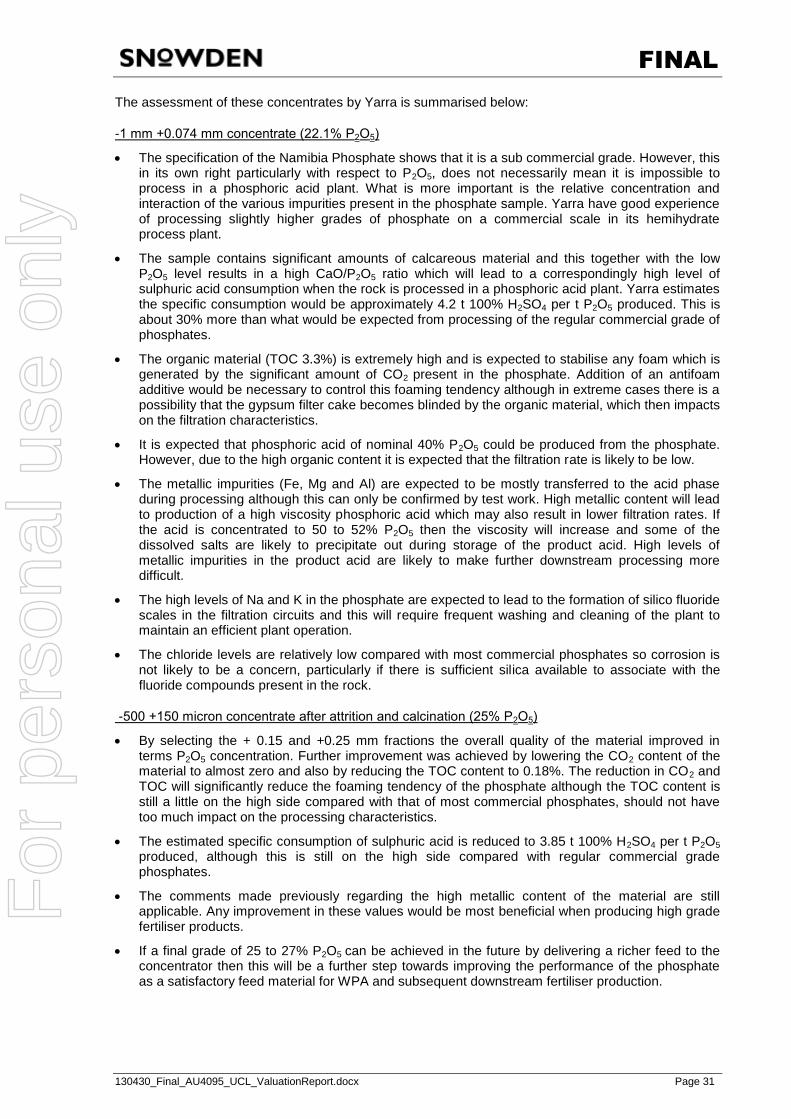
FINAL
130430_Final_AU4095_UCL_ValuationReport.docx Page 31
The assessment of these concentrates by Yarra is summarised below:
-1 mm +0.074 mm concentrate (22.1% P2O5)
The specification of the Namibia Phosphate shows that it is a sub commercial grade. However, this in its own right particularly with respect to P2O5, does not necessarily mean it is impossible to process in a phosphoric acid plant. What is more important is the relative concentration and interaction of the various impurities present in the phosphate sample. Yarra have good experience of processing slightly higher grades of phosphate on a commercial scale in its hemihydrate process plant.
The sample contains significant amounts of calcareous material and this together with the low P2O5 level results in a high CaO/P2O5 ratio which will lead to a correspondingly high level of sulphuric acid consumption when the rock is processed in a phosphoric acid plant. Yarra estimates the specific consumption would be approximately 4.2 t 100% H2SO4 per t P2O5 produced. This is about 30% more than what would be expected from processing of the regular commercial grade of phosphates.
The organic material (TOC 3.3%) is extremely high and is expected to stabilise any foam which is generated by the significant amount of CO2 present in the phosphate. Addition of an antifoam additive would be necessary to control this foaming tendency although in extreme cases there is a possibility that the gypsum filter cake becomes blinded by the organic material, which then impacts on the filtration characteristics.
It is expected that phosphoric acid of nominal 40% P2O5 could be produced from the phosphate. However, due to the high organic content it is expected that the filtration rate is likely to be low.
The metallic impurities (Fe, Mg and Al) are expected to be mostly transferred to the acid phase during processing although this can only be confirmed by test work. High metallic content will lead to production of a high viscosity phosphoric acid which may also result in lower filtration rates. If the acid is concentrated to 50 to 52% P2O5 then the viscosity will increase and some of the dissolved salts are likely to precipitate out during storage of the product acid. High levels of metallic impurities in the product acid are likely to make further downstream processing more difficult.
The high levels of Na and K in the phosphate are expected to lead to the formation of silico fluoride scales in the filtration circuits and this will require frequent washing and cleaning of the plant to maintain an efficient plant operation.
The chloride levels are relatively low compared with most commercial phosphates so corrosion is not likely to be a concern, particularly if there is sufficient silica available to associate with the fluoride compounds present in the rock.
-500 +150 micron concentrate after attrition and calcination (25% P2O5)
By selecting the + 0.15 and +0.25 mm fractions the overall quality of the material improved in terms P2O5 concentration. Further improvement was achieved by lowering the CO2 content of the material to almost zero and also by reducing the TOC content to 0.18%. The reduction in CO2 and TOC will significantly reduce the foaming tendency of the phosphate although the TOC content is still a little on the high side compared with that of most commercial phosphates, should not have too much impact on the processing characteristics.
The estimated specific consumption of sulphuric acid is reduced to 3.85 t 100% H2SO4 per t P2O5 produced, although this is still on the high side compared with regular commercial grade phosphates.
The comments made previously regarding the high metallic content of the material are still applicable. Any improvement in these values would be most beneficial when producing high grade fertiliser products.
If a final grade of 25 to 27% P2O5 can be achieved in the future by delivering a richer feed to the concentrator then this will be a further step towards improving the performance of the phosphate as a satisfactory feed material for WPA and subsequent downstream fertiliser production.
For
per
sona
l use
onl
y
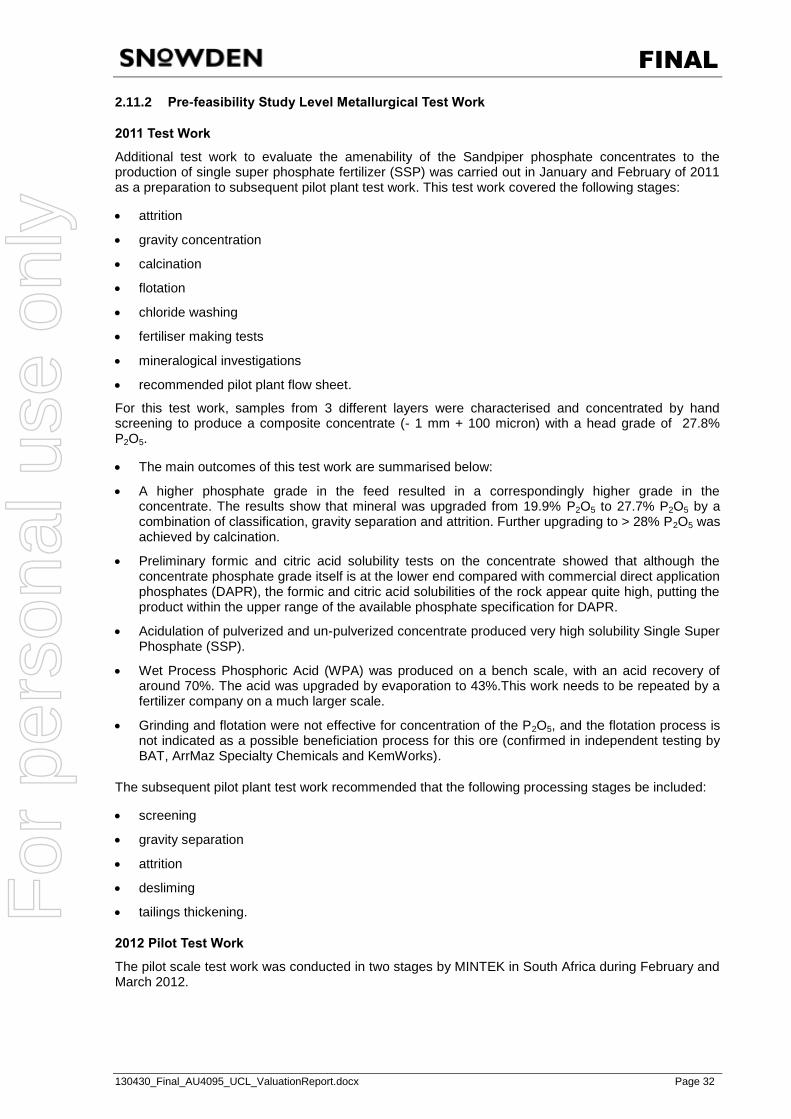
FINAL
130430_Final_AU4095_UCL_ValuationReport.docx Page 32
2.11.2 Pre-feasibility Study Level Metallurgical Test Work
2011 Test Work
Additional test work to evaluate the amenability of the Sandpiper phosphate concentrates to the production of single super phosphate fertilizer (SSP) was carried out in January and February of 2011 as a preparation to subsequent pilot plant test work. This test work covered the following stages:
attrition
gravity concentration
calcination
flotation
chloride washing
fertiliser making tests
mineralogical investigations
recommended pilot plant flow sheet.
For this test work, samples from 3 different layers were characterised and concentrated by hand screening to produce a composite concentrate (- 1 mm + 100 micron) with a head grade of 27.8% P2O5.
The main outcomes of this test work are summarised below:
A higher phosphate grade in the feed resulted in a correspondingly higher grade in the concentrate. The results show that mineral was upgraded from 19.9% P2O5 to 27.7% P2O5 by a combination of classification, gravity separation and attrition. Further upgrading to > 28% P2O5 was achieved by calcination.
Preliminary formic and citric acid solubility tests on the concentrate showed that although the concentrate phosphate grade itself is at the lower end compared with commercial direct application phosphates (DAPR), the formic and citric acid solubilities of the rock appear quite high, putting the product within the upper range of the available phosphate specification for DAPR.
Acidulation of pulverized and un-pulverized concentrate produced very high solubility Single Super Phosphate (SSP).
Wet Process Phosphoric Acid (WPA) was produced on a bench scale, with an acid recovery of around 70%. The acid was upgraded by evaporation to 43%.This work needs to be repeated by a fertilizer company on a much larger scale.
Grinding and flotation were not effective for concentration of the P2O5, and the flotation process is not indicated as a possible beneficiation process for this ore (confirmed in independent testing by BAT, ArrMaz Specialty Chemicals and KemWorks).
The subsequent pilot plant test work recommended that the following processing stages be included:
screening
gravity separation
attrition
desliming
tailings thickening.
2012 Pilot Test Work
The pilot scale test work was conducted in two stages by MINTEK in South Africa during February and March 2012.
For
per
sona
l use
onl
y
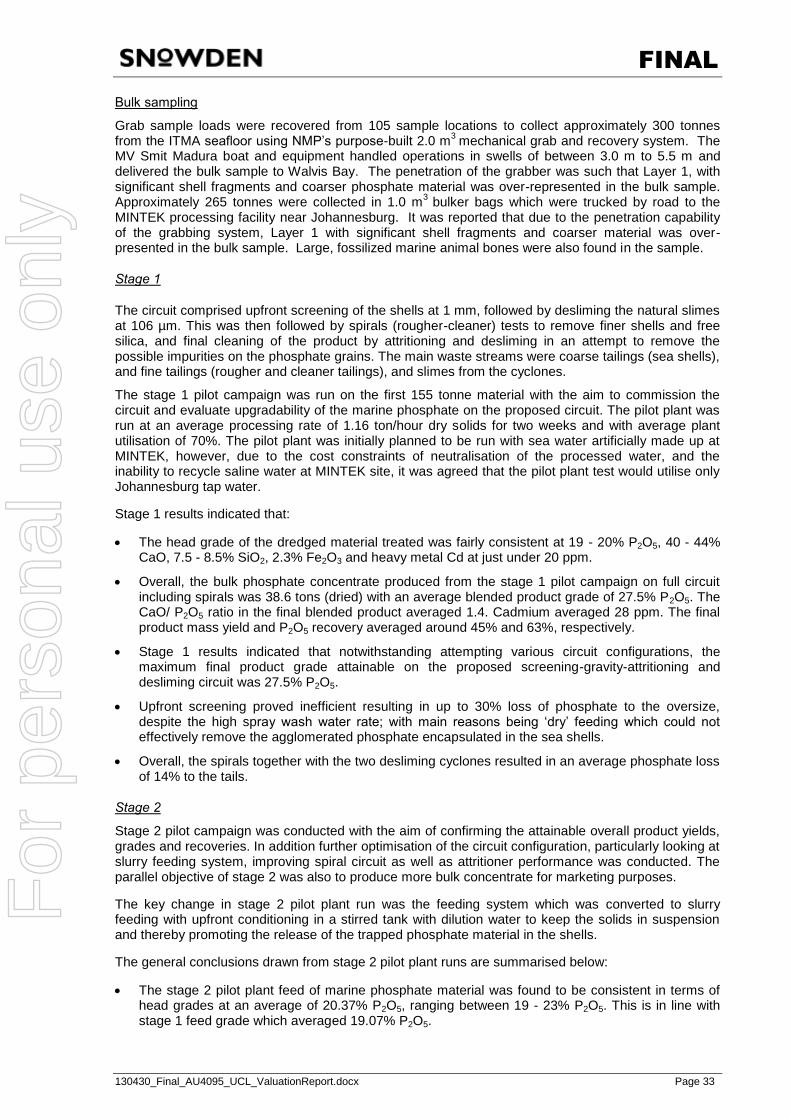
FINAL
130430_Final_AU4095_UCL_ValuationReport.docx Page 33
Bulk sampling
Grab sample loads were recovered from 105 sample locations to collect approximately 300 tonnes from the ITMA seafloor using NMP‟s purpose-built 2.0 m3
mechanical grab and recovery system. The MV Smit Madura boat and equipment handled operations in swells of between 3.0 m to 5.5 m and delivered the bulk sample to Walvis Bay. The penetration of the grabber was such that Layer 1, with significant shell fragments and coarser phosphate material was over-represented in the bulk sample. Approximately 265 tonnes were collected in 1.0 m3
bulker bags which were trucked by road to the MINTEK processing facility near Johannesburg. It was reported that due to the penetration capability of the grabbing system, Layer 1 with significant shell fragments and coarser material was over-presented in the bulk sample. Large, fossilized marine animal bones were also found in the sample.
Stage 1
The circuit comprised upfront screening of the shells at 1 mm, followed by desliming the natural slimes at 106 µm. This was then followed by spirals (rougher-cleaner) tests to remove finer shells and free silica, and final cleaning of the product by attritioning and desliming in an attempt to remove the possible impurities on the phosphate grains. The main waste streams were coarse tailings (sea shells), and fine tailings (rougher and cleaner tailings), and slimes from the cyclones.
The stage 1 pilot campaign was run on the first 155 tonne material with the aim to commission the circuit and evaluate upgradability of the marine phosphate on the proposed circuit. The pilot plant was run at an average processing rate of 1.16 ton/hour dry solids for two weeks and with average plant utilisation of 70%. The pilot plant was initially planned to be run with sea water artificially made up at MINTEK, however, due to the cost constraints of neutralisation of the processed water, and the inability to recycle saline water at MINTEK site, it was agreed that the pilot plant test would utilise only Johannesburg tap water.
Stage 1 results indicated that:
The head grade of the dredged material treated was fairly consistent at 19 - 20% P2O5, 40 - 44% CaO, 7.5 - 8.5% SiO2, 2.3% Fe2O3 and heavy metal Cd at just under 20 ppm.
Overall, the bulk phosphate concentrate produced from the stage 1 pilot campaign on full circuit including spirals was 38.6 tons (dried) with an average blended product grade of 27.5% P2O5. The CaO/ P2O5 ratio in the final blended product averaged 1.4. Cadmium averaged 28 ppm. The final product mass yield and P2O5 recovery averaged around 45% and 63%, respectively.
Stage 1 results indicated that notwithstanding attempting various circuit configurations, the maximum final product grade attainable on the proposed screening-gravity-attritioning and desliming circuit was 27.5% P2O5.
Upfront screening proved inefficient resulting in up to 30% loss of phosphate to the oversize, despite the high spray wash water rate; with main reasons being „dry‟ feeding which could not effectively remove the agglomerated phosphate encapsulated in the sea shells.
Overall, the spirals together with the two desliming cyclones resulted in an average phosphate loss of 14% to the tails.
Stage 2
Stage 2 pilot campaign was conducted with the aim of confirming the attainable overall product yields, grades and recoveries. In addition further optimisation of the circuit configuration, particularly looking at slurry feeding system, improving spiral circuit as well as attritioner performance was conducted. The parallel objective of stage 2 was also to produce more bulk concentrate for marketing purposes.
The key change in stage 2 pilot plant run was the feeding system which was converted to slurry feeding with upfront conditioning in a stirred tank with dilution water to keep the solids in suspension and thereby promoting the release of the trapped phosphate material in the shells.
The general conclusions drawn from stage 2 pilot plant runs are summarised below:
The stage 2 pilot plant feed of marine phosphate material was found to be consistent in terms of head grades at an average of 20.37% P2O5, ranging between 19 - 23% P2O5. This is in line with stage 1 feed grade which averaged 19.07% P2O5.
For
per
sona
l use
onl
y
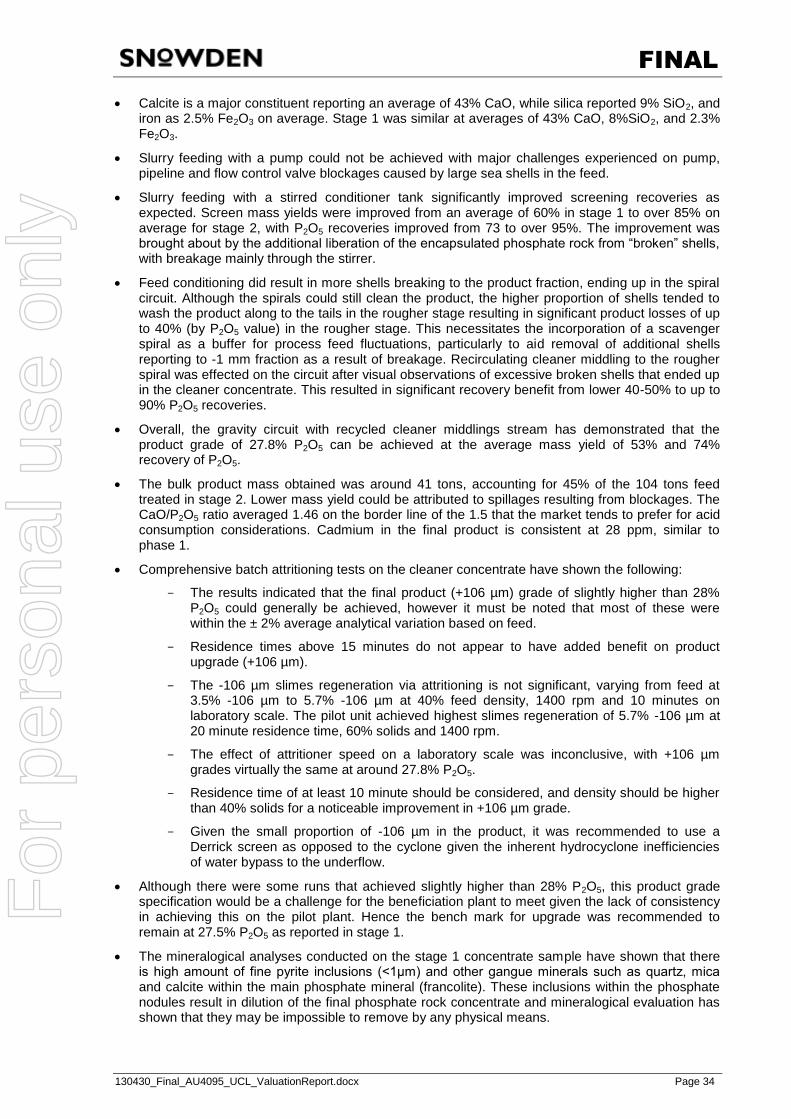
FINAL
130430_Final_AU4095_UCL_ValuationReport.docx Page 34
Calcite is a major constituent reporting an average of 43% CaO, while silica reported 9% SiO2, and iron as 2.5% Fe2O3 on average. Stage 1 was similar at averages of 43% CaO, 8%SiO2, and 2.3% Fe2O3.
Slurry feeding with a pump could not be achieved with major challenges experienced on pump, pipeline and flow control valve blockages caused by large sea shells in the feed.
Slurry feeding with a stirred conditioner tank significantly improved screening recoveries as expected. Screen mass yields were improved from an average of 60% in stage 1 to over 85% on average for stage 2, with P2O5 recoveries improved from 73 to over 95%. The improvement was brought about by the additional liberation of the encapsulated phosphate rock from “broken” shells, with breakage mainly through the stirrer.
Feed conditioning did result in more shells breaking to the product fraction, ending up in the spiral circuit. Although the spirals could still clean the product, the higher proportion of shells tended to wash the product along to the tails in the rougher stage resulting in significant product losses of up to 40% (by P2O5 value) in the rougher stage. This necessitates the incorporation of a scavenger spiral as a buffer for process feed fluctuations, particularly to aid removal of additional shells reporting to -1 mm fraction as a result of breakage. Recirculating cleaner middling to the rougher spiral was effected on the circuit after visual observations of excessive broken shells that ended up in the cleaner concentrate. This resulted in significant recovery benefit from lower 40-50% to up to 90% P2O5 recoveries.
Overall, the gravity circuit with recycled cleaner middlings stream has demonstrated that the product grade of 27.8% P2O5 can be achieved at the average mass yield of 53% and 74% recovery of P2O5.
The bulk product mass obtained was around 41 tons, accounting for 45% of the 104 tons feed treated in stage 2. Lower mass yield could be attributed to spillages resulting from blockages. The CaO/P2O5 ratio averaged 1.46 on the border line of the 1.5 that the market tends to prefer for acid consumption considerations. Cadmium in the final product is consistent at 28 ppm, similar to phase 1.
Comprehensive batch attritioning tests on the cleaner concentrate have shown the following:
- The results indicated that the final product (+106 µm) grade of slightly higher than 28% P2O5 could generally be achieved, however it must be noted that most of these were within the ± 2% average analytical variation based on feed.
- Residence times above 15 minutes do not appear to have added benefit on product upgrade (+106 µm).
- The -106 µm slimes regeneration via attritioning is not significant, varying from feed at 3.5% -106 µm to 5.7% -106 µm at 40% feed density, 1400 rpm and 10 minutes on laboratory scale. The pilot unit achieved highest slimes regeneration of 5.7% -106 µm at 20 minute residence time, 60% solids and 1400 rpm.
- The effect of attritioner speed on a laboratory scale was inconclusive, with +106 µm grades virtually the same at around 27.8% P2O5.
- Residence time of at least 10 minute should be considered, and density should be higher than 40% solids for a noticeable improvement in +106 µm grade.
- Given the small proportion of -106 µm in the product, it was recommended to use a Derrick screen as opposed to the cyclone given the inherent hydrocyclone inefficiencies of water bypass to the underflow.
Although there were some runs that achieved slightly higher than 28% P2O5, this product grade specification would be a challenge for the beneficiation plant to meet given the lack of consistency in achieving this on the pilot plant. Hence the bench mark for upgrade was recommended to remain at 27.5% P2O5 as reported in stage 1.
The mineralogical analyses conducted on the stage 1 concentrate sample have shown that there is high amount of fine pyrite inclusions (<1μm) and other gangue minerals such as quartz, mica and calcite within the main phosphate mineral (francolite). These inclusions within the phosphate nodules result in dilution of the final phosphate rock concentrate and mineralogical evaluation has shown that they may be impossible to remove by any physical means.
For
per
sona
l use
onl
y
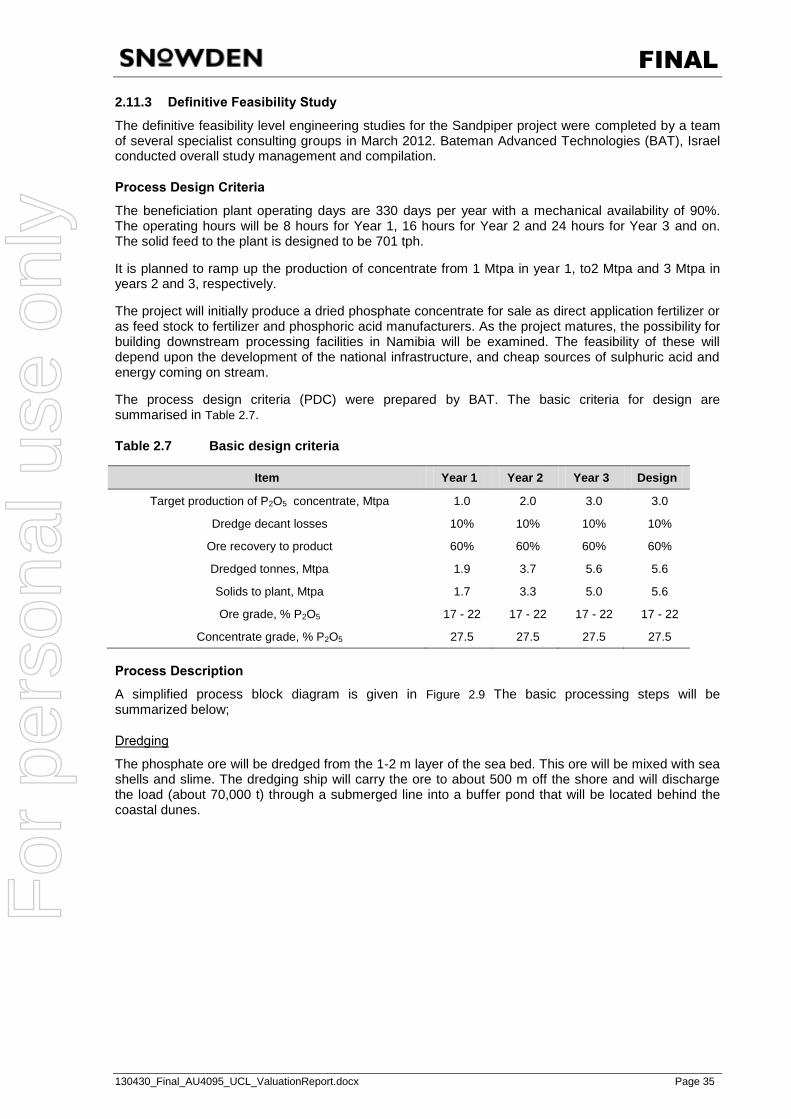
FINAL
130430_Final_AU4095_UCL_ValuationReport.docx Page 35
2.11.3 Definitive Feasibility Study
The definitive feasibility level engineering studies for the Sandpiper project were completed by a team of several specialist consulting groups in March 2012. Bateman Advanced Technologies (BAT), Israel conducted overall study management and compilation.
Process Design Criteria
The beneficiation plant operating days are 330 days per year with a mechanical availability of 90%. The operating hours will be 8 hours for Year 1, 16 hours for Year 2 and 24 hours for Year 3 and on. The solid feed to the plant is designed to be 701 tph.
It is planned to ramp up the production of concentrate from 1 Mtpa in year 1, to2 Mtpa and 3 Mtpa in years 2 and 3, respectively.
The project will initially produce a dried phosphate concentrate for sale as direct application fertilizer or as feed stock to fertilizer and phosphoric acid manufacturers. As the project matures, the possibility for building downstream processing facilities in Namibia will be examined. The feasibility of these will depend upon the development of the national infrastructure, and cheap sources of sulphuric acid and energy coming on stream.
The process design criteria (PDC) were prepared by BAT. The basic criteria for design are summarised in Table 2.7.
Table 2.7 Basic design criteria
Item Year 1 Year 2 Year 3 Design
Target production of P2O5 concentrate, Mtpa 1.0 2.0 3.0 3.0
Dredge decant losses 10% 10% 10% 10%
Ore recovery to product 60% 60% 60% 60%
Dredged tonnes, Mtpa 1.9 3.7 5.6 5.6
Solids to plant, Mtpa 1.7 3.3 5.0 5.6
Ore grade, % P2O5 17 - 22 17 - 22 17 - 22 17 - 22
Concentrate grade, % P2O5 27.5 27.5 27.5 27.5
Process Description
A simplified process block diagram is given in Figure 2.9 The basic processing steps will be summarized below;
Dredging
The phosphate ore will be dredged from the 1-2 m layer of the sea bed. This ore will be mixed with sea shells and slime. The dredging ship will carry the ore to about 500 m off the shore and will discharge the load (about 70,000 t) through a submerged line into a buffer pond that will be located behind the coastal dunes.
For
per
sona
l use
onl
y
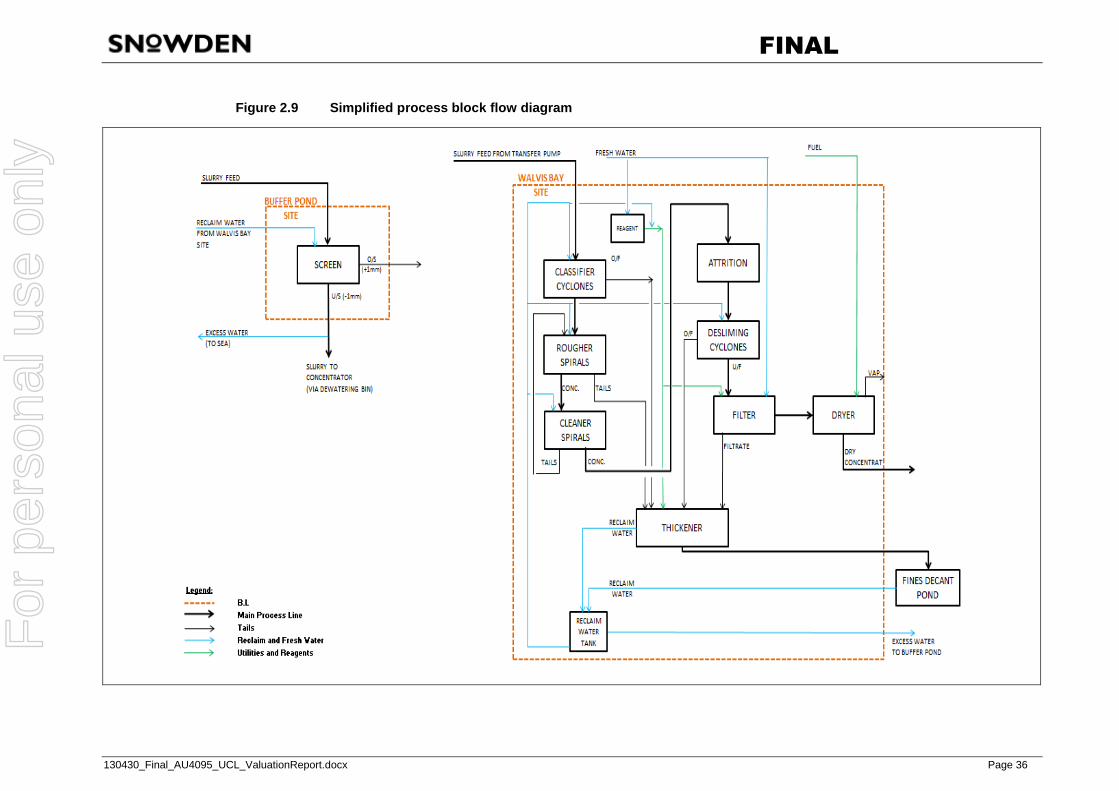
FINAL
130430_Final_AU4095_UCL_ValuationReport.docx Page 36
Figure 2.9 Simplified process block flow diagram
For
per
sona
l use
onl
y
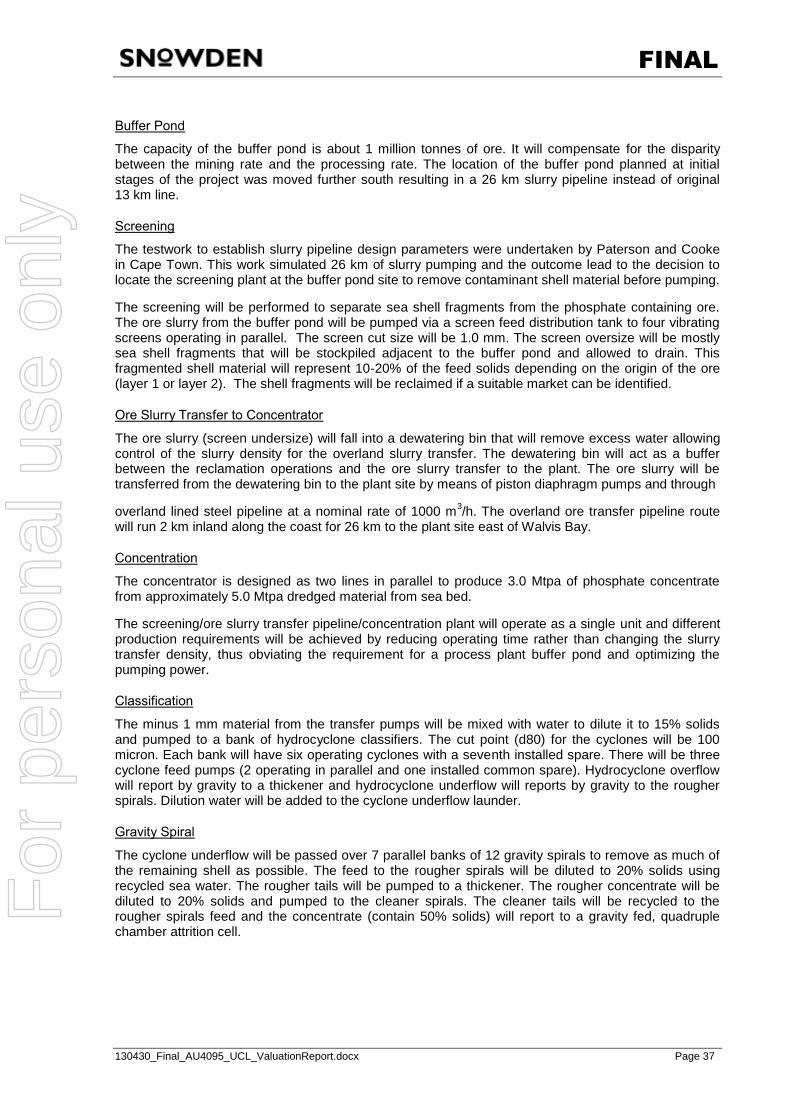
FINAL
130430_Final_AU4095_UCL_ValuationReport.docx Page 37
Buffer Pond
The capacity of the buffer pond is about 1 million tonnes of ore. It will compensate for the disparity between the mining rate and the processing rate. The location of the buffer pond planned at initial stages of the project was moved further south resulting in a 26 km slurry pipeline instead of original 13 km line.
Screening
The testwork to establish slurry pipeline design parameters were undertaken by Paterson and Cooke in Cape Town. This work simulated 26 km of slurry pumping and the outcome lead to the decision to locate the screening plant at the buffer pond site to remove contaminant shell material before pumping.
The screening will be performed to separate sea shell fragments from the phosphate containing ore. The ore slurry from the buffer pond will be pumped via a screen feed distribution tank to four vibrating screens operating in parallel. The screen cut size will be 1.0 mm. The screen oversize will be mostly sea shell fragments that will be stockpiled adjacent to the buffer pond and allowed to drain. This fragmented shell material will represent 10-20% of the feed solids depending on the origin of the ore (layer 1 or layer 2). The shell fragments will be reclaimed if a suitable market can be identified.
Ore Slurry Transfer to Concentrator
The ore slurry (screen undersize) will fall into a dewatering bin that will remove excess water allowing control of the slurry density for the overland slurry transfer. The dewatering bin will act as a buffer between the reclamation operations and the ore slurry transfer to the plant. The ore slurry will be transferred from the dewatering bin to the plant site by means of piston diaphragm pumps and through
overland lined steel pipeline at a nominal rate of 1000 m3/h. The overland ore transfer pipeline route will run 2 km inland along the coast for 26 km to the plant site east of Walvis Bay.
Concentration
The concentrator is designed as two lines in parallel to produce 3.0 Mtpa of phosphate concentrate from approximately 5.0 Mtpa dredged material from sea bed.
The screening/ore slurry transfer pipeline/concentration plant will operate as a single unit and different production requirements will be achieved by reducing operating time rather than changing the slurry transfer density, thus obviating the requirement for a process plant buffer pond and optimizing the pumping power.
Classification
The minus 1 mm material from the transfer pumps will be mixed with water to dilute it to 15% solids and pumped to a bank of hydrocyclone classifiers. The cut point (d80) for the cyclones will be 100 micron. Each bank will have six operating cyclones with a seventh installed spare. There will be three cyclone feed pumps (2 operating in parallel and one installed common spare). Hydrocyclone overflow will report by gravity to a thickener and hydrocyclone underflow will reports by gravity to the rougher spirals. Dilution water will be added to the cyclone underflow launder.
Gravity Spiral
The cyclone underflow will be passed over 7 parallel banks of 12 gravity spirals to remove as much of the remaining shell as possible. The feed to the rougher spirals will be diluted to 20% solids using recycled sea water. The rougher tails will be pumped to a thickener. The rougher concentrate will be diluted to 20% solids and pumped to the cleaner spirals. The cleaner tails will be recycled to the rougher spirals feed and the concentrate (contain 50% solids) will report to a gravity fed, quadruple chamber attrition cell.
For
per
sona
l use
onl
y
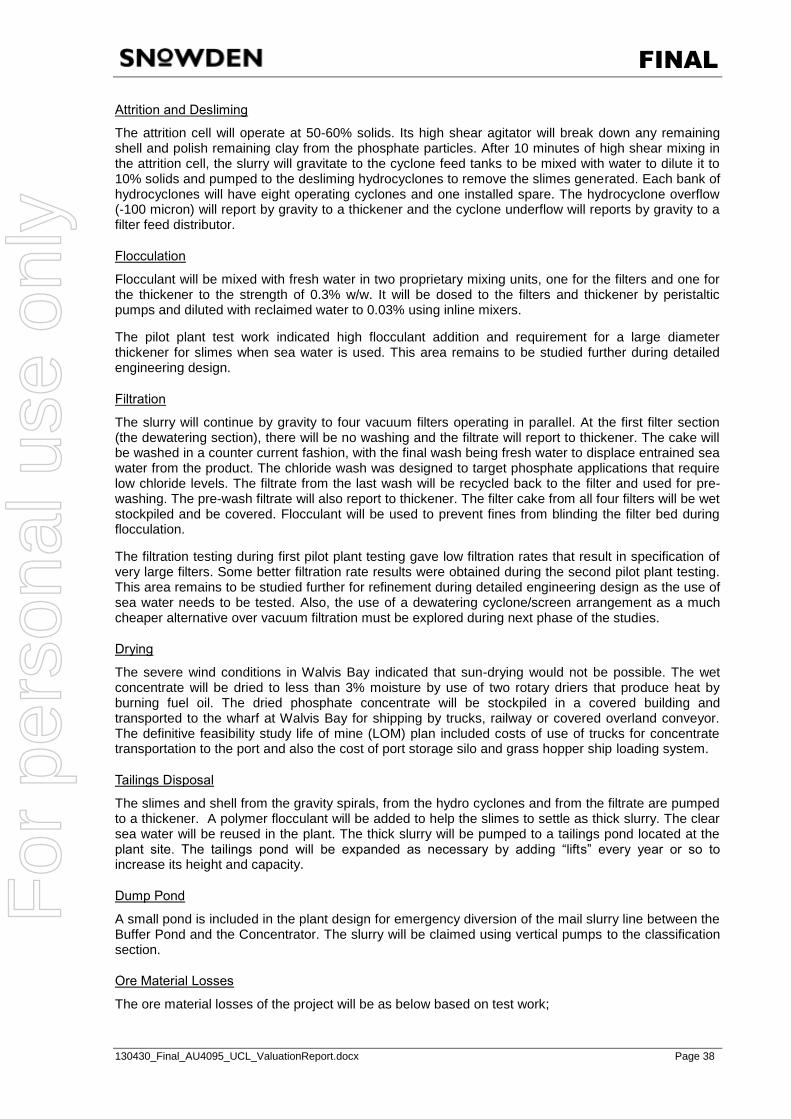
FINAL
130430_Final_AU4095_UCL_ValuationReport.docx Page 38
Attrition and Desliming
The attrition cell will operate at 50-60% solids. Its high shear agitator will break down any remaining shell and polish remaining clay from the phosphate particles. After 10 minutes of high shear mixing in the attrition cell, the slurry will gravitate to the cyclone feed tanks to be mixed with water to dilute it to 10% solids and pumped to the desliming hydrocyclones to remove the slimes generated. Each bank of hydrocyclones will have eight operating cyclones and one installed spare. The hydrocyclone overflow (-100 micron) will report by gravity to a thickener and the cyclone underflow will reports by gravity to a filter feed distributor.
Flocculation
Flocculant will be mixed with fresh water in two proprietary mixing units, one for the filters and one for the thickener to the strength of 0.3% w/w. It will be dosed to the filters and thickener by peristaltic pumps and diluted with reclaimed water to 0.03% using inline mixers.
The pilot plant test work indicated high flocculant addition and requirement for a large diameter thickener for slimes when sea water is used. This area remains to be studied further during detailed engineering design.
Filtration
The slurry will continue by gravity to four vacuum filters operating in parallel. At the first filter section (the dewatering section), there will be no washing and the filtrate will report to thickener. The cake will be washed in a counter current fashion, with the final wash being fresh water to displace entrained sea water from the product. The chloride wash was designed to target phosphate applications that require low chloride levels. The filtrate from the last wash will be recycled back to the filter and used for pre-washing. The pre-wash filtrate will also report to thickener. The filter cake from all four filters will be wet stockpiled and be covered. Flocculant will be used to prevent fines from blinding the filter bed during flocculation.
The filtration testing during first pilot plant testing gave low filtration rates that result in specification of very large filters. Some better filtration rate results were obtained during the second pilot plant testing. This area remains to be studied further for refinement during detailed engineering design as the use of sea water needs to be tested. Also, the use of a dewatering cyclone/screen arrangement as a much cheaper alternative over vacuum filtration must be explored during next phase of the studies.
Drying
The severe wind conditions in Walvis Bay indicated that sun-drying would not be possible. The wet concentrate will be dried to less than 3% moisture by use of two rotary driers that produce heat by burning fuel oil. The dried phosphate concentrate will be stockpiled in a covered building and transported to the wharf at Walvis Bay for shipping by trucks, railway or covered overland conveyor. The definitive feasibility study life of mine (LOM) plan included costs of use of trucks for concentrate transportation to the port and also the cost of port storage silo and grass hopper ship loading system.
Tailings Disposal
The slimes and shell from the gravity spirals, from the hydro cyclones and from the filtrate are pumped to a thickener. A polymer flocculant will be added to help the slimes to settle as thick slurry. The clear sea water will be reused in the plant. The thick slurry will be pumped to a tailings pond located at the plant site. The tailings pond will be expanded as necessary by adding “lifts” every year or so to increase its height and capacity.
Dump Pond
A small pond is included in the plant design for emergency diversion of the mail slurry line between the Buffer Pond and the Concentrator. The slurry will be claimed using vertical pumps to the classification section.
Ore Material Losses
The ore material losses of the project will be as below based on test work;
For
per
sona
l use
onl
y
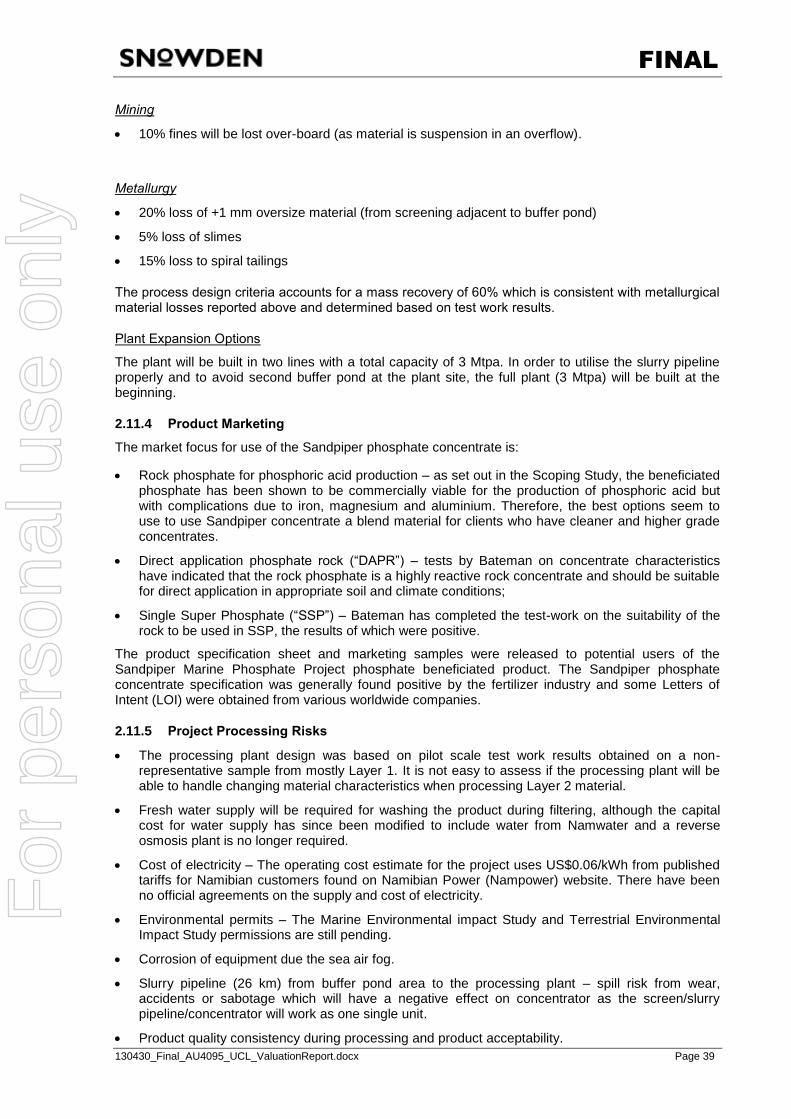
FINAL
130430_Final_AU4095_UCL_ValuationReport.docx Page 39
Mining
10% fines will be lost over-board (as material is suspension in an overflow).
Metallurgy
20% loss of +1 mm oversize material (from screening adjacent to buffer pond)
5% loss of slimes
15% loss to spiral tailings
The process design criteria accounts for a mass recovery of 60% which is consistent with metallurgical material losses reported above and determined based on test work results.
Plant Expansion Options
The plant will be built in two lines with a total capacity of 3 Mtpa. In order to utilise the slurry pipeline properly and to avoid second buffer pond at the plant site, the full plant (3 Mtpa) will be built at the beginning.
2.11.4 Product Marketing
The market focus for use of the Sandpiper phosphate concentrate is:
Rock phosphate for phosphoric acid production – as set out in the Scoping Study, the beneficiated phosphate has been shown to be commercially viable for the production of phosphoric acid but with complications due to iron, magnesium and aluminium. Therefore, the best options seem to use to use Sandpiper concentrate a blend material for clients who have cleaner and higher grade concentrates.
Direct application phosphate rock (“DAPR”) – tests by Bateman on concentrate characteristics have indicated that the rock phosphate is a highly reactive rock concentrate and should be suitable for direct application in appropriate soil and climate conditions;
Single Super Phosphate (“SSP”) – Bateman has completed the test-work on the suitability of the rock to be used in SSP, the results of which were positive.
The product specification sheet and marketing samples were released to potential users of the Sandpiper Marine Phosphate Project phosphate beneficiated product. The Sandpiper phosphate concentrate specification was generally found positive by the fertilizer industry and some Letters of Intent (LOI) were obtained from various worldwide companies.
2.11.5 Project Processing Risks
The processing plant design was based on pilot scale test work results obtained on a non-representative sample from mostly Layer 1. It is not easy to assess if the processing plant will be able to handle changing material characteristics when processing Layer 2 material.
Fresh water supply will be required for washing the product during filtering, although the capital cost for water supply has since been modified to include water from Namwater and a reverse osmosis plant is no longer required.
Cost of electricity – The operating cost estimate for the project uses US$0.06/kWh from published tariffs for Namibian customers found on Namibian Power (Nampower) website. There have been no official agreements on the supply and cost of electricity.
Environmental permits – The Marine Environmental impact Study and Terrestrial Environmental Impact Study permissions are still pending.
Corrosion of equipment due the sea air fog.
Slurry pipeline (26 km) from buffer pond area to the processing plant – spill risk from wear, accidents or sabotage which will have a negative effect on concentrator as the screen/slurry pipeline/concentrator will work as one single unit.
Product quality consistency during processing and product acceptability.
For
per
sona
l use
onl
y
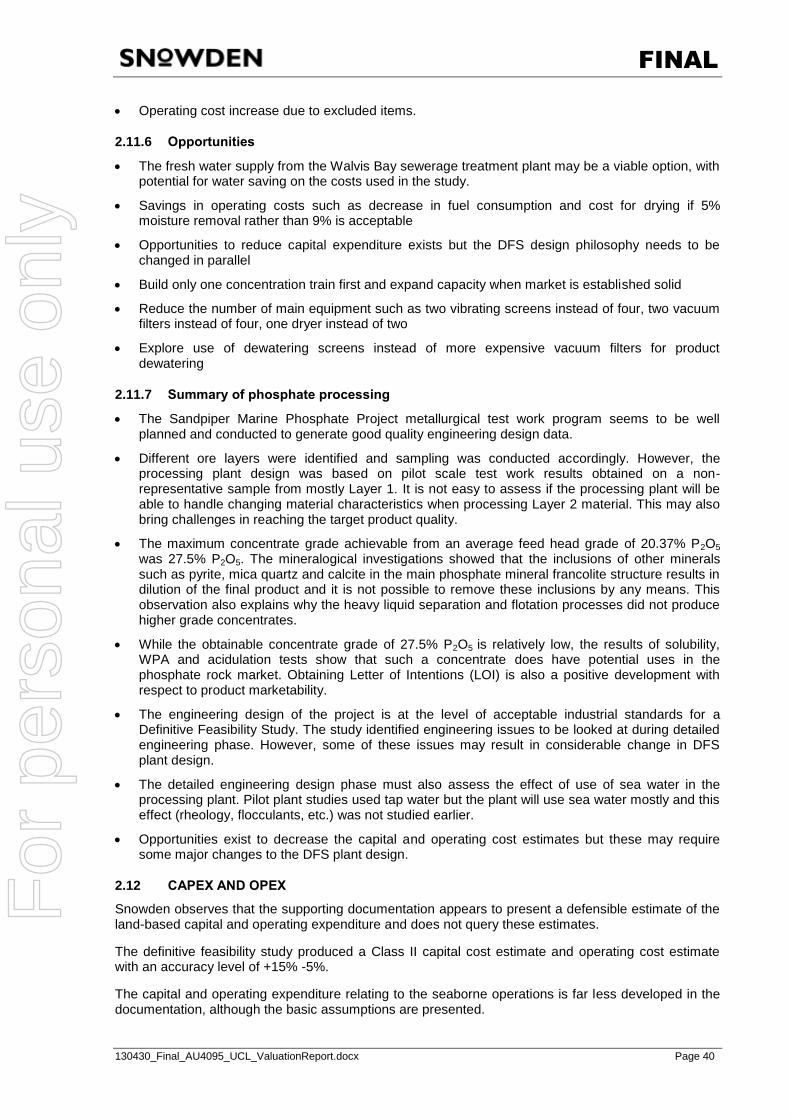
FINAL
130430_Final_AU4095_UCL_ValuationReport.docx Page 40
Operating cost increase due to excluded items.
2.11.6 Opportunities
The fresh water supply from the Walvis Bay sewerage treatment plant may be a viable option, with potential for water saving on the costs used in the study.
Savings in operating costs such as decrease in fuel consumption and cost for drying if 5% moisture removal rather than 9% is acceptable
Opportunities to reduce capital expenditure exists but the DFS design philosophy needs to be changed in parallel
Build only one concentration train first and expand capacity when market is established solid
Reduce the number of main equipment such as two vibrating screens instead of four, two vacuum filters instead of four, one dryer instead of two
Explore use of dewatering screens instead of more expensive vacuum filters for product dewatering
2.11.7 Summary of phosphate processing
The Sandpiper Marine Phosphate Project metallurgical test work program seems to be well planned and conducted to generate good quality engineering design data.
Different ore layers were identified and sampling was conducted accordingly. However, the processing plant design was based on pilot scale test work results obtained on a non-representative sample from mostly Layer 1. It is not easy to assess if the processing plant will be able to handle changing material characteristics when processing Layer 2 material. This may also bring challenges in reaching the target product quality.
The maximum concentrate grade achievable from an average feed head grade of 20.37% P2O5 was 27.5% P2O5. The mineralogical investigations showed that the inclusions of other minerals such as pyrite, mica quartz and calcite in the main phosphate mineral francolite structure results in dilution of the final product and it is not possible to remove these inclusions by any means. This observation also explains why the heavy liquid separation and flotation processes did not produce higher grade concentrates.
While the obtainable concentrate grade of 27.5% P2O5 is relatively low, the results of solubility, WPA and acidulation tests show that such a concentrate does have potential uses in the phosphate rock market. Obtaining Letter of Intentions (LOI) is also a positive development with respect to product marketability.
The engineering design of the project is at the level of acceptable industrial standards for a Definitive Feasibility Study. The study identified engineering issues to be looked at during detailed engineering phase. However, some of these issues may result in considerable change in DFS plant design.
The detailed engineering design phase must also assess the effect of use of sea water in the processing plant. Pilot plant studies used tap water but the plant will use sea water mostly and this effect (rheology, flocculants, etc.) was not studied earlier.
Opportunities exist to decrease the capital and operating cost estimates but these may require some major changes to the DFS plant design.
2.12 CAPEX AND OPEX
Snowden observes that the supporting documentation appears to present a defensible estimate of the land-based capital and operating expenditure and does not query these estimates.
The definitive feasibility study produced a Class II capital cost estimate and operating cost estimate with an accuracy level of +15% -5%.
The capital and operating expenditure relating to the seaborne operations is far less developed in the documentation, although the basic assumptions are presented.
For
per
sona
l use
onl
y
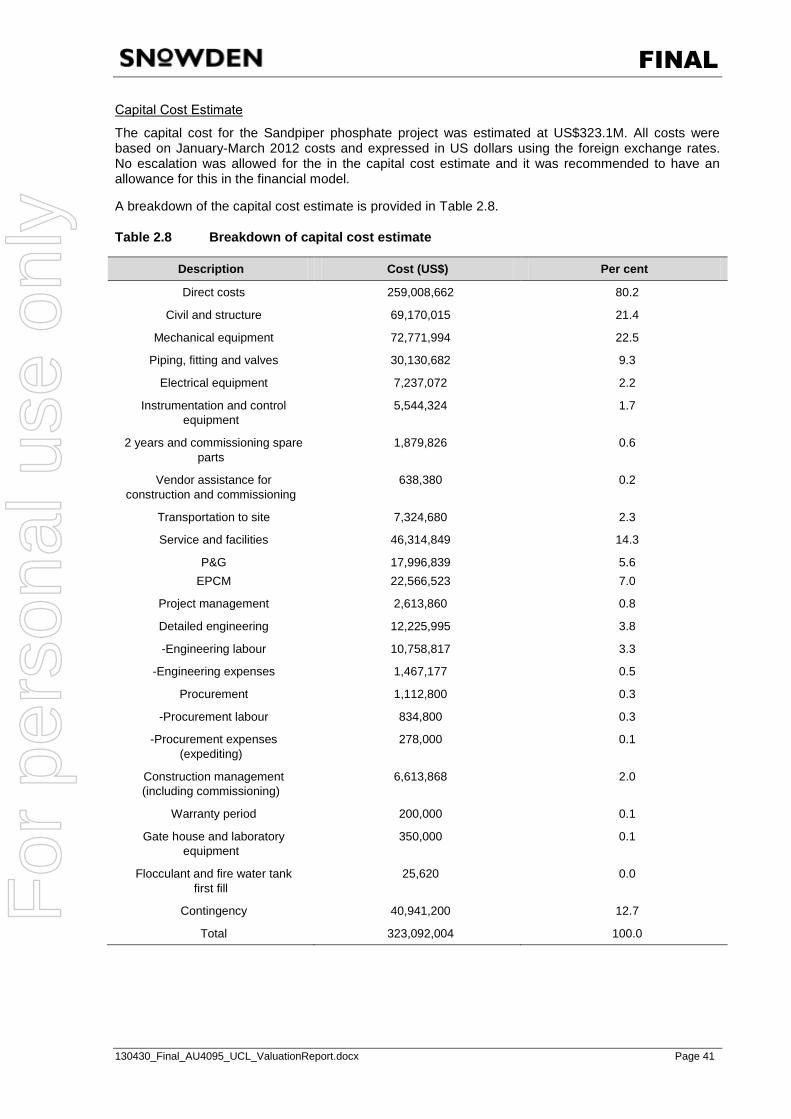
FINAL
130430_Final_AU4095_UCL_ValuationReport.docx Page 41
Capital Cost Estimate
The capital cost for the Sandpiper phosphate project was estimated at US$323.1M. All costs were based on January-March 2012 costs and expressed in US dollars using the foreign exchange rates. No escalation was allowed for the in the capital cost estimate and it was recommended to have an allowance for this in the financial model.
A breakdown of the capital cost estimate is provided in Table 2.8.
Table 2.8 Breakdown of capital cost estimate
Description Cost (US$) Per cent
Direct costs 259,008,662 80.2
Civil and structure 69,170,015 21.4
Mechanical equipment 72,771,994 22.5
Piping, fitting and valves 30,130,682 9.3
Electrical equipment 7,237,072 2.2
Instrumentation and control equipment
5,544,324 1.7
2 years and commissioning spare parts
1,879,826 0.6
Vendor assistance for construction and commissioning
638,380 0.2
Transportation to site 7,324,680 2.3
Service and facilities 46,314,849 14.3
P&G EPCM
17,996,839 22,566,523
5.6 7.0
Project management 2,613,860 0.8
Detailed engineering 12,225,995 3.8
-Engineering labour 10,758,817 3.3
-Engineering expenses 1,467,177 0.5
Procurement 1,112,800 0.3
-Procurement labour 834,800 0.3
-Procurement expenses (expediting)
278,000 0.1
Construction management (including commissioning)
6,613,868 2.0
Warranty period 200,000 0.1
Gate house and laboratory equipment
350,000 0.1
Flocculant and fire water tank first fill
25,620 0.0
Contingency 40,941,200 12.7
Total 323,092,004 100.0
For
per
sona
l use
onl
y
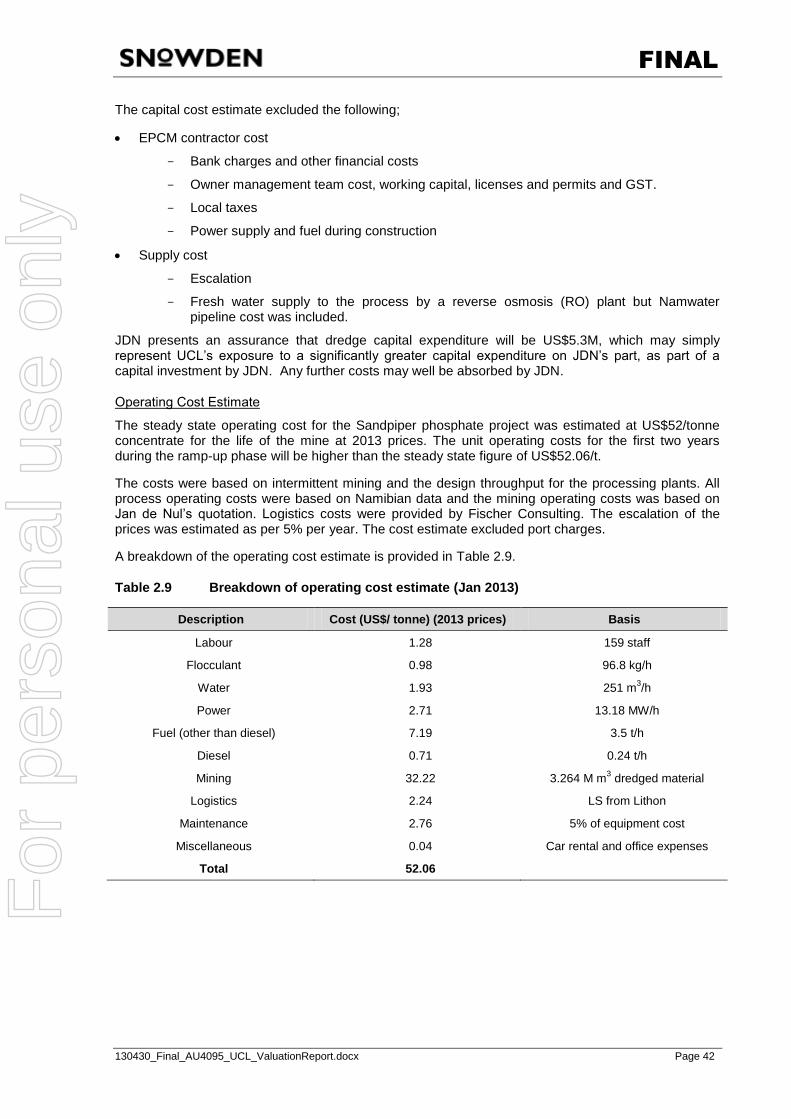
FINAL
130430_Final_AU4095_UCL_ValuationReport.docx Page 42
The capital cost estimate excluded the following;
EPCM contractor cost
- Bank charges and other financial costs
- Owner management team cost, working capital, licenses and permits and GST.
- Local taxes
- Power supply and fuel during construction
Supply cost
- Escalation
- Fresh water supply to the process by a reverse osmosis (RO) plant but Namwater pipeline cost was included.
JDN presents an assurance that dredge capital expenditure will be US$5.3M, which may simply represent UCL‟s exposure to a significantly greater capital expenditure on JDN‟s part, as part of a capital investment by JDN. Any further costs may well be absorbed by JDN.
Operating Cost Estimate
The steady state operating cost for the Sandpiper phosphate project was estimated at US$52/tonne concentrate for the life of the mine at 2013 prices. The unit operating costs for the first two years during the ramp-up phase will be higher than the steady state figure of US$52.06/t.
The costs were based on intermittent mining and the design throughput for the processing plants. All process operating costs were based on Namibian data and the mining operating costs was based on Jan de Nul‟s quotation. Logistics costs were provided by Fischer Consulting. The escalation of the prices was estimated as per 5% per year. The cost estimate excluded port charges.
A breakdown of the operating cost estimate is provided in Table 2.9.
Table 2.9 Breakdown of operating cost estimate (Jan 2013)
Description Cost (US$/ tonne) (2013 prices) Basis
Labour 1.28 159 staff
Flocculant 0.98 96.8 kg/h
Water 1.93 251 m3/h
Power 2.71 13.18 MW/h
Fuel (other than diesel) 7.19 3.5 t/h
Diesel 0.71 0.24 t/h
Mining 32.22 3.264 M m3 dredged material
Logistics 2.24 LS from Lithon
Maintenance 2.76 5% of equipment cost
Miscellaneous 0.04 Car rental and office expenses
Total 52.06
For
per
sona
l use
onl
y
FINAL
130430_Final_AU4095_UCL_ValuationReport.docx Page 43
The following are excluded from the OPEX calculation:
Water treatment
Sewage treatment
Municipal taxes
Income/ company tax
Port charges (logistics only)
Mobilisation and demobilisation costs.
Staffing
The operating cost estimate allowed for 159 staff for the Sandpiper project.
The operating mining cost attached to the dredge (mining) is less well developed in relation to unit productivity and Snowden does not consider that the figure of $32.22/tonne (January 2013 prices) in Table 2.9 is sufficiently supported to allow the estimation of Reserves to a CRIRSCO standard.
Snowden does not dispute the mining-related operating costs as such, but comments that in relation to a valuation or Reserve estimate, the degree of engineering tolerance or sensitivity accorded to these estimates has not been discussed in detail and this discounts confidence in a Reserve estimate and hence valuation.
2.13 ENVIRONMENTAL STUDIES
2.13.1 Environmental Impact Assessment
In accordance with the terms of the granted Mining Licence (“ML 170”) and in compliance with the Namibian Environmental Management Act (No. 7 of 2007) (“the Act”), the Environmental Impact Assessment (”EIA”) and the Environmental Management Plan (“EMP”) were lodged on 12 January 2012 at the Namibian Ministries of Mines and Energy and Environment and Tourism. The Act although established in 2007 only came into effect with the promulgation of the Regulations, which occurred on the 6th February 2012. Further compliance requirements include the Equator Principles as well as the International Finance Corporation (IFC) Standards. These standards prescribe social and environmental compliance requirements for the Corporation to consider financing a project.
The key issues addressed in the EIA:
Governance
The EIA process
Biogeochemical impacts
Benthic impacts
Marine fauna – flora impacts
Cumulative impacts
Socio-economic impacts
Project impacts.
The EIA also included the full reports and findings of the four independent specialist studies that were undertaken to address the specific potential impacts on:
Fish and fisheries and seabirds and marine mammals
Water column dynamics
Macrobenthos
Jellyfish.
The draft report concluded:
For
per
sona
l use
onl
y
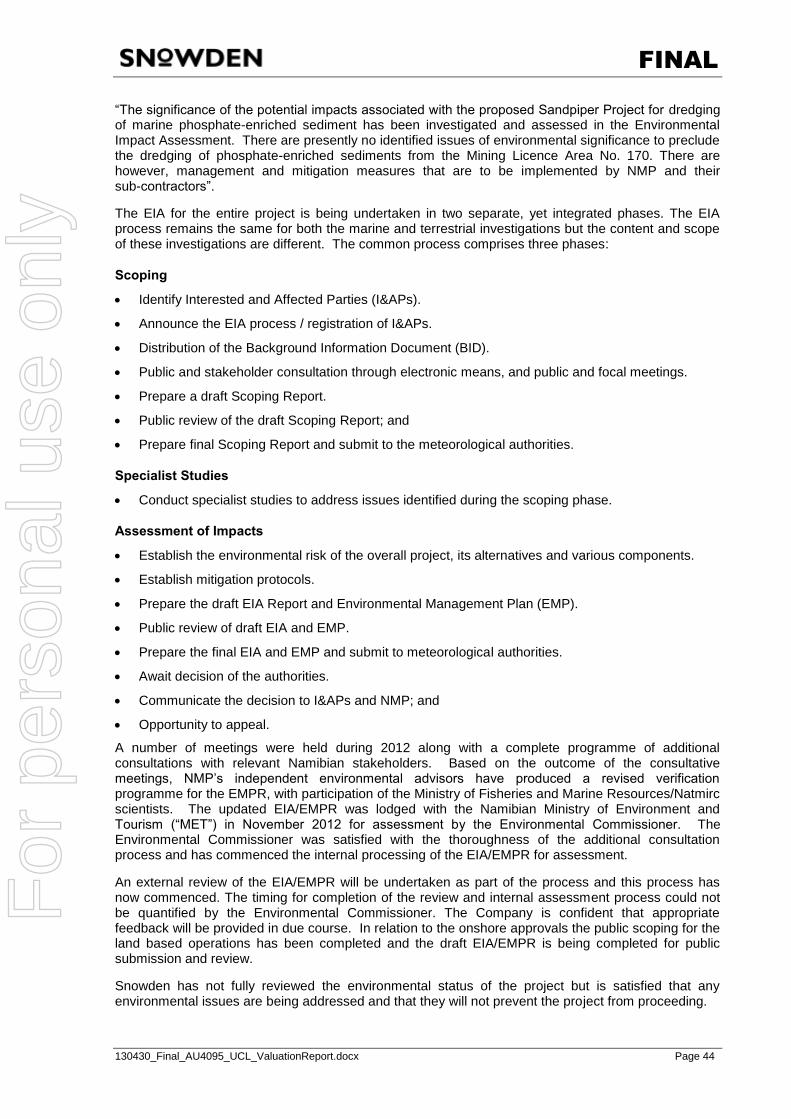
FINAL
130430_Final_AU4095_UCL_ValuationReport.docx Page 44
“The significance of the potential impacts associated with the proposed Sandpiper Project for dredging of marine phosphate-enriched sediment has been investigated and assessed in the Environmental Impact Assessment. There are presently no identified issues of environmental significance to preclude the dredging of phosphate-enriched sediments from the Mining Licence Area No. 170. There are however, management and mitigation measures that are to be implemented by NMP and their sub-contractors”.
The EIA for the entire project is being undertaken in two separate, yet integrated phases. The EIA process remains the same for both the marine and terrestrial investigations but the content and scope of these investigations are different. The common process comprises three phases:
Scoping
Identify Interested and Affected Parties (I&APs).
Announce the EIA process / registration of I&APs.
Distribution of the Background Information Document (BID).
Public and stakeholder consultation through electronic means, and public and focal meetings.
Prepare a draft Scoping Report.
Public review of the draft Scoping Report; and
Prepare final Scoping Report and submit to the meteorological authorities.
Specialist Studies
Conduct specialist studies to address issues identified during the scoping phase.
Assessment of Impacts
Establish the environmental risk of the overall project, its alternatives and various components.
Establish mitigation protocols.
Prepare the draft EIA Report and Environmental Management Plan (EMP).
Public review of draft EIA and EMP.
Prepare the final EIA and EMP and submit to meteorological authorities.
Await decision of the authorities.
Communicate the decision to I&APs and NMP; and
Opportunity to appeal.
A number of meetings were held during 2012 along with a complete programme of additional consultations with relevant Namibian stakeholders. Based on the outcome of the consultative meetings, NMP‟s independent environmental advisors have produced a revised verification programme for the EMPR, with participation of the Ministry of Fisheries and Marine Resources/Natmirc scientists. The updated EIA/EMPR was lodged with the Namibian Ministry of Environment and Tourism (“MET”) in November 2012 for assessment by the Environmental Commissioner. The Environmental Commissioner was satisfied with the thoroughness of the additional consultation process and has commenced the internal processing of the EIA/EMPR for assessment.
An external review of the EIA/EMPR will be undertaken as part of the process and this process has now commenced. The timing for completion of the review and internal assessment process could not be quantified by the Environmental Commissioner. The Company is confident that appropriate feedback will be provided in due course. In relation to the onshore approvals the public scoping for the land based operations has been completed and the draft EIA/EMPR is being completed for public submission and review.
Snowden has not fully reviewed the environmental status of the project but is satisfied that any environmental issues are being addressed and that they will not prevent the project from proceeding.
For
per
sona
l use
onl
y
FINAL
130430_Final_AU4095_UCL_ValuationReport.docx Page 45
2.13.2 Mine Closure and Restoration
Snowden note that a restoration liability of US$20 million has been allocated for rehabilitation of the process plant and surrounding infrastructure at mine closure. Snowden is not aware of any environmental liabilities associated with dredging the sea floor. Snowden is aware that the provision for decommissioning and restoration of the phosphate process and mining facilities of the phosphate mine on Christmas Island, managed by Phosphate Resources Limited is A$8.1 million (2012 annual report). Snowden considers that the restoration liability of US$20 million for the Sandpiper Project is appropriate.
3. MEHDIABAD PROJECT
3.1 OWNERSHIP
The Mehdiabad zinc project is owned by Mehdiabad Zinc Company (MZC) an Iranian registered joint stock company, which has three shareholders and voting shares as follows:
1. The Iranian Government Company (IMPASCO, now IMIDRO) 50%,
2. Itok GmbH 25.5%
3. UCL, formerly Union Capital Limited 24.5%.
UCL was nominated as the Project Supervisor for the project.
3.2 LOCATION AND ACCESS
Figure 3.1 shows the location of the Mehdiabad Project in central Iran.
Figure 3.1 Location of Mehdiabad Project in Iran
For
per
sona
l use
onl
y

FINAL
130430_Final_AU4095_UCL_ValuationReport.docx Page 46
Source: UCL
Figure 3.2 shows the regional location of the project, approximately 85-km southeast of the city of Yazd and approximately 550 km southeast of Tehran. The project site lies within the Mehriz district of Yazd province. The Mehriz district is divided into two regions and encompasses three cities and seven rural districts. There are four villages nearby, Mehdiabad, Bahadoran, Aliabad and Karimabad.
Figure 3.2 Regional location plan of Mehdiabad Project
Source: UCL
Access into the area is via the Tehran Bandor Abbas highway and the Yazd Bafg road.
3.3 TENEMENTS
The area of the Mehdiabad Project is approximately 276 km2. No details of tenements have been provided to Snowden.
3.4 GEOLOGY
The project is located in early Cretaceous carbonate Taft Formation rocks, in a synformal half-graben structure.
3.5 EXPLORATION
The Mehdiabad zinc deposit has been explored by various parties since the 1960‟s. Exploration activities have included over 52,000 m of mostly diamond drilling, more than half of which has been completed by the UCL led joint venture. UCL has to date invested in excess of US$16.8 million on exploration and feasibility activities relating to the project up until December 2006.
3.6 RESOURCES
Table 3.1 shows the latest mineral resources at the Mehdiabad Project in 2006.
For
per
sona
l use
onl
y
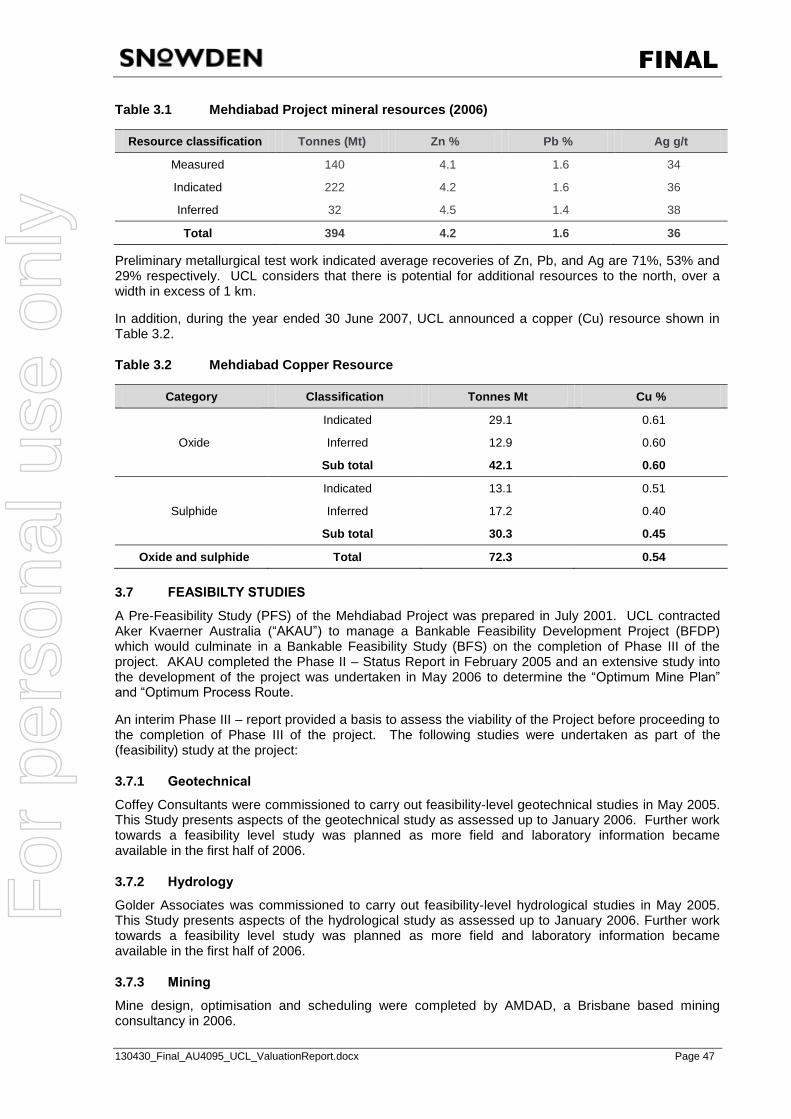
FINAL
130430_Final_AU4095_UCL_ValuationReport.docx Page 47
Table 3.1 Mehdiabad Project mineral resources (2006)
Resource classification Tonnes (Mt) Zn % Pb % Ag g/t
Measured 140 4.1 1.6 34
Indicated 222 4.2 1.6 36
Inferred 32 4.5 1.4 38
Total 394 4.2 1.6 36
Preliminary metallurgical test work indicated average recoveries of Zn, Pb, and Ag are 71%, 53% and 29% respectively. UCL considers that there is potential for additional resources to the north, over a width in excess of 1 km.
In addition, during the year ended 30 June 2007, UCL announced a copper (Cu) resource shown in Table 3.2.
Table 3.2 Mehdiabad Copper Resource
Category Classification Tonnes Mt Cu %
Oxide
Indicated 29.1 0.61
Inferred 12.9 0.60
Sub total 42.1 0.60
Sulphide
Indicated 13.1 0.51
Inferred 17.2 0.40
Sub total 30.3 0.45
Oxide and sulphide Total 72.3 0.54
3.7 FEASIBILTY STUDIES
A Pre-Feasibility Study (PFS) of the Mehdiabad Project was prepared in July 2001. UCL contracted Aker Kvaerner Australia (“AKAU”) to manage a Bankable Feasibility Development Project (BFDP) which would culminate in a Bankable Feasibility Study (BFS) on the completion of Phase III of the project. AKAU completed the Phase II – Status Report in February 2005 and an extensive study into the development of the project was undertaken in May 2006 to determine the “Optimum Mine Plan” and “Optimum Process Route.
An interim Phase III – report provided a basis to assess the viability of the Project before proceeding to the completion of Phase III of the project. The following studies were undertaken as part of the (feasibility) study at the project:
3.7.1 Geotechnical
Coffey Consultants were commissioned to carry out feasibility-level geotechnical studies in May 2005. This Study presents aspects of the geotechnical study as assessed up to January 2006. Further work towards a feasibility level study was planned as more field and laboratory information became available in the first half of 2006.
3.7.2 Hydrology
Golder Associates was commissioned to carry out feasibility-level hydrological studies in May 2005. This Study presents aspects of the hydrological study as assessed up to January 2006. Further work towards a feasibility level study was planned as more field and laboratory information became available in the first half of 2006.
3.7.3 Mining
Mine design, optimisation and scheduling were completed by AMDAD, a Brisbane based mining consultancy in 2006.
For
per
sona
l use
onl
y
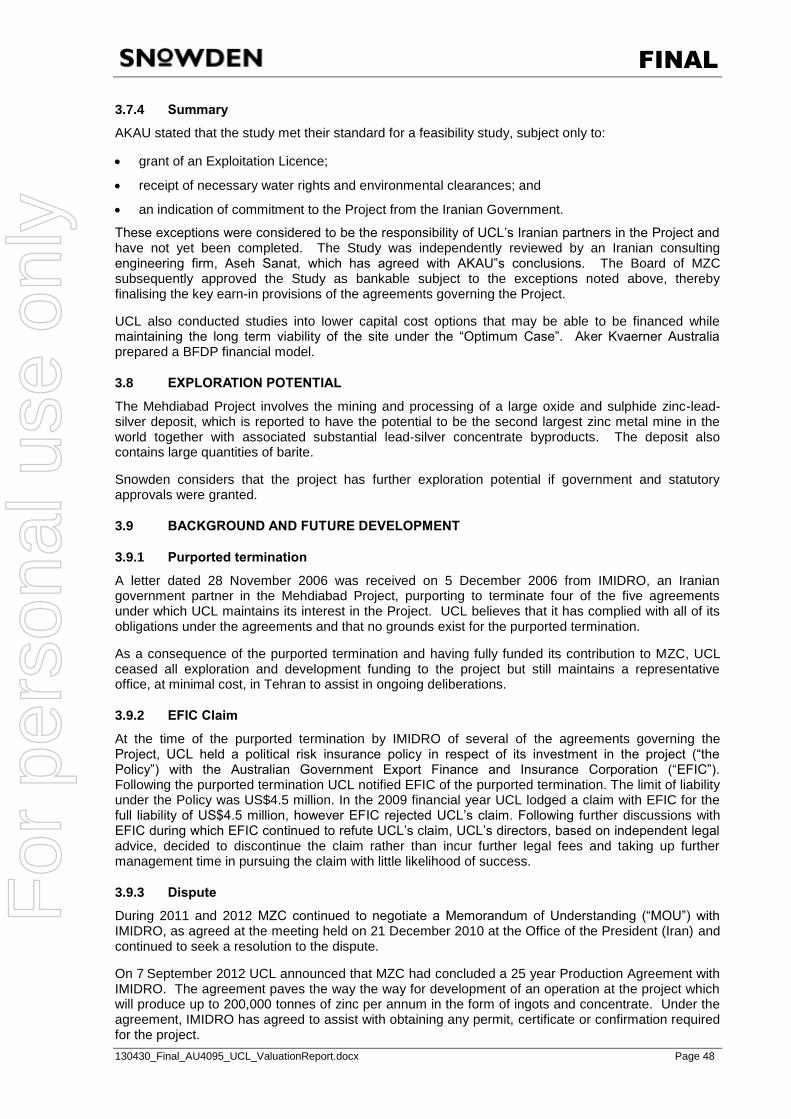
FINAL
130430_Final_AU4095_UCL_ValuationReport.docx Page 48
3.7.4 Summary
AKAU stated that the study met their standard for a feasibility study, subject only to:
grant of an Exploitation Licence;
receipt of necessary water rights and environmental clearances; and
an indication of commitment to the Project from the Iranian Government.
These exceptions were considered to be the responsibility of UCL‟s Iranian partners in the Project and have not yet been completed. The Study was independently reviewed by an Iranian consulting engineering firm, Aseh Sanat, which has agreed with AKAU‟s conclusions. The Board of MZC subsequently approved the Study as bankable subject to the exceptions noted above, thereby finalising the key earn-in provisions of the agreements governing the Project.
UCL also conducted studies into lower capital cost options that may be able to be financed while maintaining the long term viability of the site under the “Optimum Case”. Aker Kvaerner Australia prepared a BFDP financial model.
3.8 EXPLORATION POTENTIAL
The Mehdiabad Project involves the mining and processing of a large oxide and sulphide zinc-lead-silver deposit, which is reported to have the potential to be the second largest zinc metal mine in the world together with associated substantial lead-silver concentrate byproducts. The deposit also contains large quantities of barite.
Snowden considers that the project has further exploration potential if government and statutory approvals were granted.
3.9 BACKGROUND AND FUTURE DEVELOPMENT
3.9.1 Purported termination
A letter dated 28 November 2006 was received on 5 December 2006 from IMIDRO, an Iranian government partner in the Mehdiabad Project, purporting to terminate four of the five agreements under which UCL maintains its interest in the Project. UCL believes that it has complied with all of its obligations under the agreements and that no grounds exist for the purported termination.
As a consequence of the purported termination and having fully funded its contribution to MZC, UCL ceased all exploration and development funding to the project but still maintains a representative office, at minimal cost, in Tehran to assist in ongoing deliberations.
3.9.2 EFIC Claim
At the time of the purported termination by IMIDRO of several of the agreements governing the Project, UCL held a political risk insurance policy in respect of its investment in the project (“the Policy”) with the Australian Government Export Finance and Insurance Corporation (“EFIC”). Following the purported termination UCL notified EFIC of the purported termination. The limit of liability under the Policy was US$4.5 million. In the 2009 financial year UCL lodged a claim with EFIC for the full liability of US$4.5 million, however EFIC rejected UCL‟s claim. Following further discussions with EFIC during which EFIC continued to refute UCL‟s claim, UCL‟s directors, based on independent legal advice, decided to discontinue the claim rather than incur further legal fees and taking up further management time in pursuing the claim with little likelihood of success.
3.9.3 Dispute
During 2011 and 2012 MZC continued to negotiate a Memorandum of Understanding (“MOU”) with IMIDRO, as agreed at the meeting held on 21 December 2010 at the Office of the President (Iran) and continued to seek a resolution to the dispute.
On 7 September 2012 UCL announced that MZC had concluded a 25 year Production Agreement with IMIDRO. The agreement paves the way the way for development of an operation at the project which will produce up to 200,000 tonnes of zinc per annum in the form of ingots and concentrate. Under the agreement, IMIDRO has agreed to assist with obtaining any permit, certificate or confirmation required for the project.
For
per
sona
l use
onl
y
FINAL
130430_Final_AU4095_UCL_ValuationReport.docx Page 49
3.9.4 Sanctions
The UN, the European Union (EU) and the United States have imposed financial (trade and banking) sanctions against Iran over the controversies around the Iranian nuclear program. These sanctions which have been described as the toughest EU sanctions imposed against any other country by European officials were last strengthened on 15 October 2012 by the EU Council.
Not all countries have agreed to the sanctions and in December, 2012, Turkey said it would keep buying natural gas from Iran regardless of Western sanctions. Iran and Turkey resumed their trade of gold for natural gas in February 2013 circumventing the sanctions.
On February 6, 2013, the US Treasury Department announced new sanctions targeting Iranian oil revenues. The sanctions prevent Iran from gaining access to earnings garnered from its crude exports. The sanctions severely affect Iran's ability to export oil and carry out international financial transactions. The European Union and the United States view sanctions against the Iranian banking sector as a crucial component of economic pressure designed to force Tehran to scale back the nuclear work, which they suspect has covert military goals. Iran denies it seeks a nuclear weapons capability and says its work is for medical research and generating electricity.
The General Court of the EU has argued that the EU has failed to provide sufficient evidence the banks are involved in financing the nuclear programme, potentially eroding Europe's sanctions efforts. The EU governments are likely to appeal the rulings regarding Bank Mellat and Bank Saderat. Bank Mellat was formed through the merger of 10 banks in 1980 and boasts 1,800 branches in Iran as well as branches in Turkey, South Korea, London and Dubai. It has also appealed to the British Supreme Court to overturn a ban on its operations. More than 30 cases are still pending at the General Court, including ones filed by the Central Bank of Iran and the National Iranian Oil Company (NIOC).
The sanctions have increased the uncertainty of attracting foreign investment into the country. UCL remains committed to the development of the Mehdiabad Project but given the current political environment in Iran, it may be some time before the development of the Project can proceed. Nevertheless, given the quality of the resource and the possibility of an improving political situation in Iran, sometime in the future, UCL believes that it is worth maintaining an interest in the Project.
3.9.5 UCL Valuation
In December 2009 UCL Directors decided to impair the book value of UCL‟s expenditure on exploration at the project which was US$16.8 million) in accordance with applicable accounting standards to reflect the perceived uncertainty surrounding the project, although this did not constitute the writing off of the expenditure. The impairment did not change the strategy of UCL in its continued efforts to achieve a positive outcome for the Project.
3.10 SNOWDEN ASSESSMENT
Snowden has not fully reviewed the feasibility study or the mineral resource estimation of the Mehdiabad Project but considers that they have been carried out by well-known professional organisations. In Snowden‟s opinion the project has potential to be economically exploited but is obviously restricted by Western sanctions against Iran. Considering the investment of US$16.8 million and the recent agreement with IMIDRO, Snowden considers that the project has a value although this is seriously impaired due to the political risk.
In light of the new agreement Snowden considers that the disputation risk has decreased, but at the same time the political risk has increased and the zinc and copper prices have fallen by 5 to 10% since the previous valuation in March 2012.
For
per
sona
l use
onl
y

FINAL
130430_Final_AU4095_UCL_ValuationReport.docx Page 50
4. OVERVIEW OF COMMODITY MARKETS (2013)
4.1 PHOSPHATE
4.1.1 Phosphate Uses
Phosphate rock is used for the manufacture of high analysis mono-ammonium phosphate (MAP) and di-ammonium phosphate (DAP) fertiliser products for agriculture. There are currently no alternative sources of phosphate nutrient other than to mine/dredge guano, sedimentary (phosphorite) or igneous (carbonatite/foskorite) deposits. There is no substitute for phosphate in agriculture.
Phosphate rock is a general term referring to rock with high concentrations of phosphate minerals. It is the major resource mined to produce chemical fertilisers for the agriculture sector and 90% of phosphate rock goes towards this purpose. Plants require three major nutrients for life – nitrogen (N), potassium (K) and phosphorous (P). Phosphorous is used in the control of energy transfer and storage at the cellular level as well as playing an important role in metabolic processes.
Phosphorous is also used in animal feed supplements, food preservatives, in baking flour, pharmaceuticals, anti-corrosion agents, cosmetics, fungicides, insecticides, detergents, ceramics, water treatment and metallurgy.
The most common source of phosphate rock is phosphorite, which is a marine sedimentary deposit. The other source is guano, which is the accumulation of bird or bat excrement. The most common phosphate minerals belong to the apatite group, Ca5(F,Cl,OH)(PO4)3, with main minerals being collophane, francolite and dahlite.
DAP and MAP fertilisers have different ratios of phosphorous and nitrogen, and have slightly different applications. Both products are generally produced as granules with a diameter of between 2-4 mm. DAP (20% P and 18% N) is used for broad-acre products such as cereal, legume, fodder and horticultural crops as well as for dairy and newly established pastures. MAP (22% P and 10% N) assists with early crop growth and enhances phosphorous uptake in broad-acre crops. Ideally, phosphate rock for fertiliser production will contain approximately 30% phosphorus pentoxide (P2O5), around 5% calcium carbonate and less than 4% iron and aluminium oxides. Almost 90% of world consumption of phosphate is used for fertilizer.
4.1.2 Phosphate Prices
Peruvian rock phosphate is being used as the basis for the price estimates on the Namibian Sandpiper Project. The price for a given type of rock phosphate depends on phosphorus content and is also influenced by the levels of other elements that may be considered contaminants by fertiliser manufacturers.
Figure 4.1 shows rock phosphate prices from 2008 to 2013. From a low of US$40 per tonne in 2005, traded phosphate prices of over US$400 per tonne were reached in 2008, dipping back to US$120/tonne in 2012.
For
per
sona
l use
onl
y
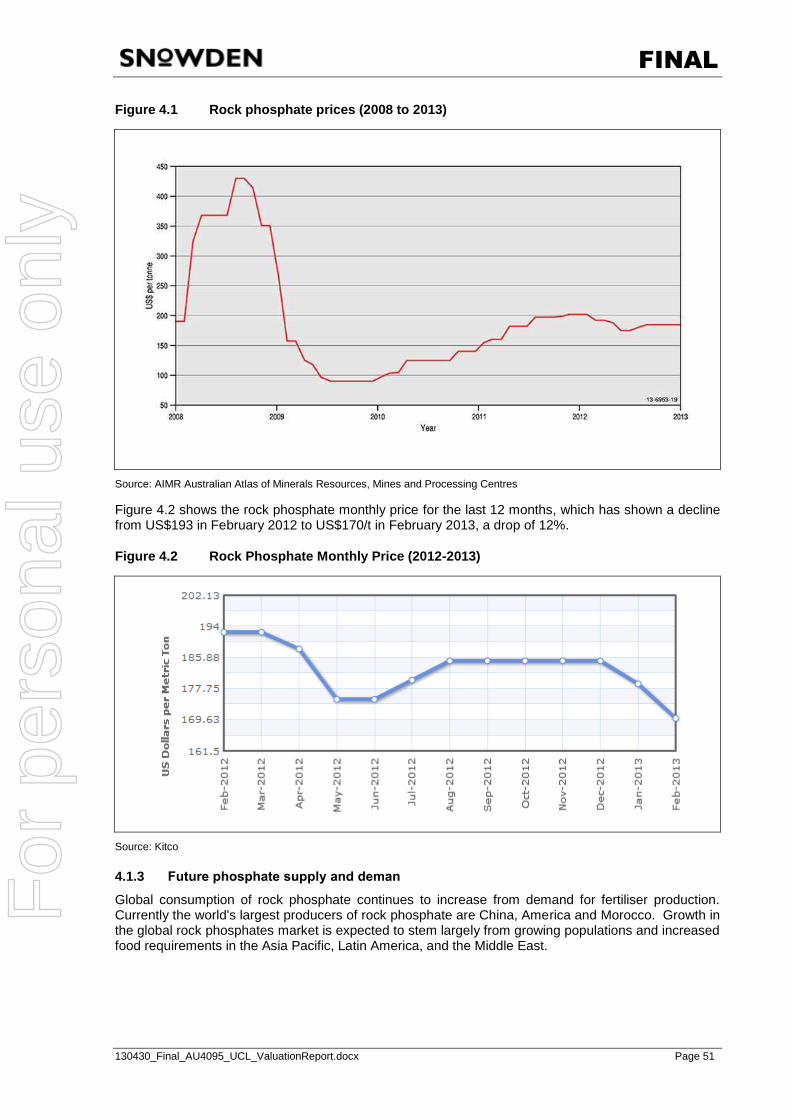
FINAL
130430_Final_AU4095_UCL_ValuationReport.docx Page 51
Figure 4.1 Rock phosphate prices (2008 to 2013)
Source: AIMR Australian Atlas of Minerals Resources, Mines and Processing Centres
Figure 4.2 shows the rock phosphate monthly price for the last 12 months, which has shown a decline from US$193 in February 2012 to US$170/t in February 2013, a drop of 12%.
Figure 4.2 Rock Phosphate Monthly Price (2012-2013)
Source: Kitco
4.1.3 Future phosphate supply and deman
Global consumption of rock phosphate continues to increase from demand for fertiliser production. Currently the world's largest producers of rock phosphate are China, America and Morocco. Growth in the global rock phosphates market is expected to stem largely from growing populations and increased food requirements in the Asia Pacific, Latin America, and the Middle East.
For
per
sona
l use
onl
y
FINAL
130430_Final_AU4095_UCL_ValuationReport.docx Page 52
Morocco is the dominant player in internationally traded rock phosphate markets with about 45% market share. International prices for rock phosphate, strongly influenced by Morocco, remained relatively stable for about three decades until 2005. Global consumption of rock phosphate started to grow from 2003 after a stable period and prices started to rise from 2005. Drivers for this growth are the need for the growing economies of India and China, in particular, to increase their agricultural productivity through increased fertiliser application and the move to increase biofuel production.
As a result of the global recession, fertilizer sales are currently below agricultural requirements. The forecast period to 2021, with strong crop prices and a trend towards more balanced fertilizer applications are expected to boost phosphate rock demand at an annual rate of more than 2%.
Chinese production has continued to grow in recent years, raising the country's share of global production to 40% in 2011. New mines are to be commissioned in Peru and Saudi Arabia and further expansions have been outlined for Africa, Europe, South America, the Middle East, Russia, Asia and Australia over the medium term to meet expected demand.
4.2 WORLD PHOSPHATE RESERVES
4.3 WORLD PHOSPHATE
World phosphate rock reserves are at 15 billion tonnes, mostly in the North African and Mediterranean region, but also in China, Southern Africa (Phalaborwa), Florida (USA) and Brazil. China (36%) and Morocco (32%) hold large proportions of global rock phosphate resources. By comparison Australia‟s phosphate resource base is estimated at <1% of global resources.
4.4 AUSTRALIAN PHOSPHATE DEPOSITS
The majority of Australia‟s phosphate reserves lie within the sedimentary Georgina Basin located in northwest Queensland and northeast Northern Territory. There are a number of phosphate projects in Australia waiting to be developed that will compete with the Namibian Sandpiper project.
Australia‟s commercial resources of phosphate are in Queensland at Phosphate Hill, 140 km southeast of Mount Isa and on the remote offshore territory of Christmas Island in the Indian Ocean. Phosphate Hill is a world-class rock phosphate resource that is close to the surface and easy to access and mine. Christmas Island is a source of quality rock phosphate which is exported to the Asia–Pacific region with products used widely as direct application fertiliser in the palm oil sector of the region.
Australia‟s total Economic Demonstrated Resources (EDR) of phosphate rock in 2011 was 945.4 million tonnes (Mt), compared with 492.1 Mt in 2010. Upgrades at Paradise South (QLD), Wonarah (NT) and Mt Weld (WA) account for the bulk of the increase.
Australia has a total demonstrated resource of 1,390 Mt, of which 445 Mt (32%) is classified as paramarginal. All of the phosphate occurrences in Queensland and the Northern Territory occur as phosphorites in the Georgina Basin, which hosts 89% of Australia‟s demonstrated resources. The remaining 11% occurs at Christmas Island and in Western Australia within carbonatite at Mount Weld and at the Balla Balla magnetite deposit.
About 1,646 Mt (90%) of Australia‟s Inferred Mineral Resources for phosphate, which total 1,813 Mt, also occurs in the Georgina Basin. The remainder occurs in WA, mostly at the Mount Weld deposit but small amounts (less than 5 Mt) occur also at Balla Balla and Cummins Range.
Australia‟s EDR of phosphate occur at:
Phosphate Hill (Qld) – average grade 23.9% P2O5,
Paradise South (Qld) – average grade 11.0% P2O5,
Paradise North (QLD) – average grade 28.4% P2O5,
Wonarah (NT) – average grade 18.2% P2O5,
Nolans Bore (NT) – average grade 13.5% P2O5,
Ammarroo (NT) – average grade 16.4% P2O5,
Mt Weld (WA) – average grade 14.3 % P2O5, and
For
per
sona
l use
onl
y
FINAL
130430_Final_AU4095_UCL_ValuationReport.docx Page 53
Christmas Island – figures not publically available.
4.5 NAMIBIAN PHOSPHATE
The Namibian off shore deposits can be classified as recent sedimentary deposits. Snowden understands that Namphos phosphate rock concentrate has not been fully vetted as to its applicability for production of phosphoric acid (PWA). However, it is anticipated that it would be suitable, particularly as a blended feedstock. The world market for phosphate rock purchased for phosphoric acid production is quite large at roughly 24 Mt. Assuming that Namphos would find potential buyers in 25% of this market (6 Mt) a blend rate of just 20% Namphos concentrate, would equate to sales volumes of 1.2 Mtpa at today‟s levels of consumption.
Attaining this level of sales will not be simple, due to the low phosphate concentrate grade and relatively high levels of certain undesirable impurities. However, it is quite plausible that a higher rate of market penetration is achievable as well.
4.5.1 Phosphate Rock Trade: Phosphoric Acid
This is the largest market for imported phosphate rock. Testing to date indicates that the rock will be suitable for phosphoric acid production, particularly as a blended feedstock. Issues are:
The concentrate grade at 27.5 P2O5 to 28% P2O5 is lower than some buyers prefer (ideally 30% P2O5).
Certain impurities are undesirable.
It will be a lower-price alternative for those looking to diversify supplies, particularly as a blend (e.g. the minority component of a 4:1 blend).
4.5.2 Expected Price of Namphos Phosphate Rock
CRU has reviewed the potential market for Namibian phosphate and calculated the expected pricing of a new entrant to the phosphate rock industry. This takes into account the chemical specifications of the product and adjusts the expected pricing based on current producers. CRU selected one primary benchmark, the Bayovar 30% P2O5 rock exported from Peru as a comparison.
The analysis suggests that Sandpiper rock would trade at anywhere from a 5-10% discount against the Bayovar benchmark on sales as DA rock and SSP, with the latter type of sale requiring the larger discount. On sales to the PWA market, CRU expects a discount of 20-32.5% versus the Bayovar benchmark.
4.6 ZINC PRICE
The zinc price has had a volatile previous 12 months and has fallen from USS$0.90/lb in March 2012 to US$0.86/lb in March 2013, a fall of 4% reflecting uncertainties in the global economy (Figure 4.3).
For
per
sona
l use
onl
y
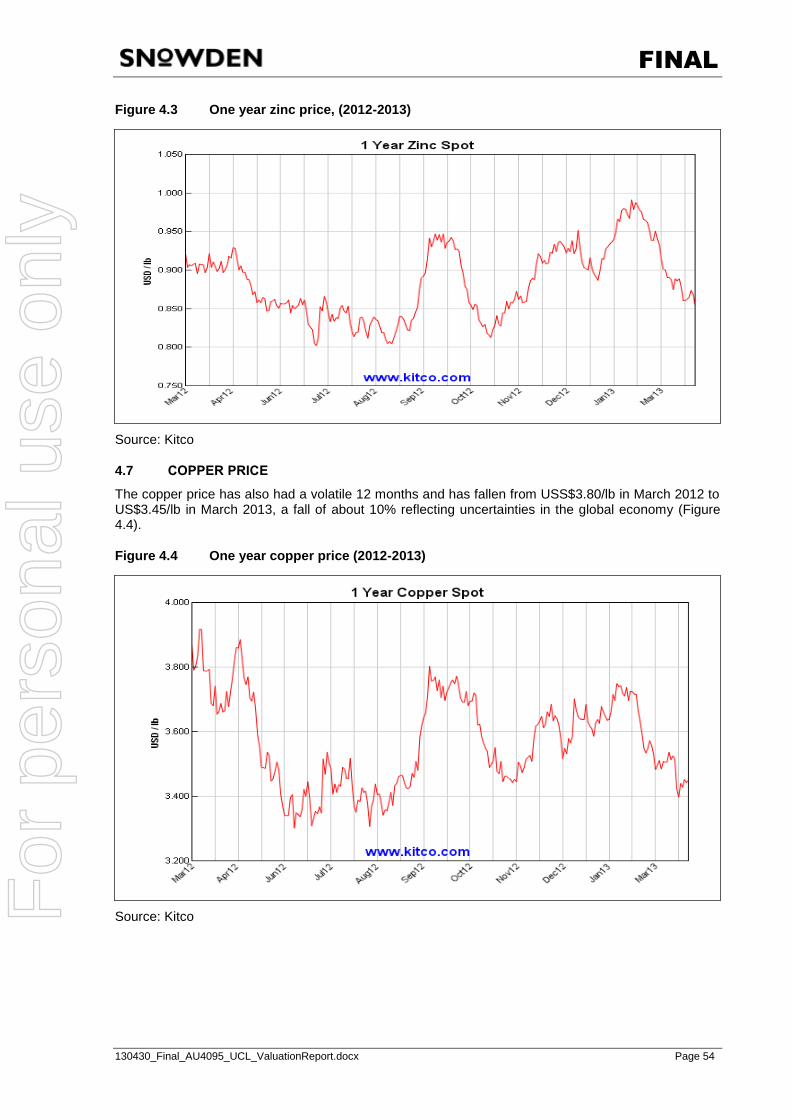
FINAL
130430_Final_AU4095_UCL_ValuationReport.docx Page 54
Figure 4.3 One year zinc price, (2012-2013)
Source: Kitco
4.7 COPPER PRICE
The copper price has also had a volatile 12 months and has fallen from USS$3.80/lb in March 2012 to US$3.45/lb in March 2013, a fall of about 10% reflecting uncertainties in the global economy (Figure 4.4).
Figure 4.4 One year copper price (2012-2013)
Source: Kitco For
per
sona
l use
onl
y
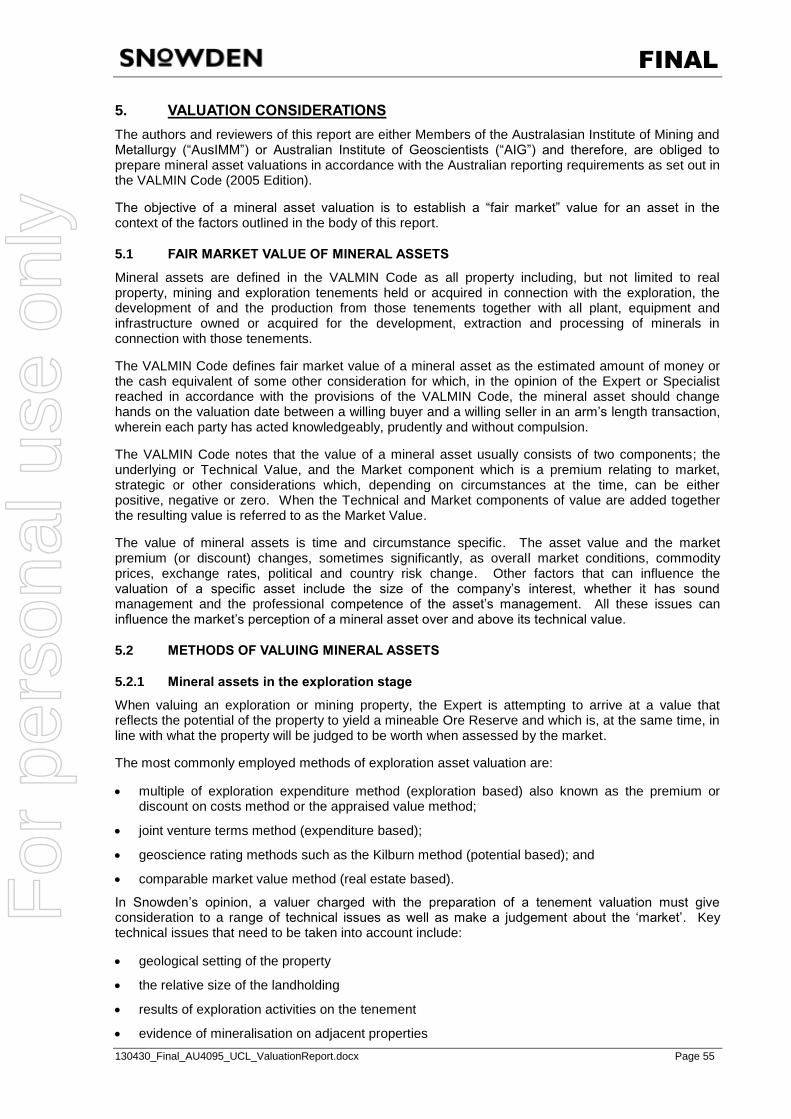
FINAL
130430_Final_AU4095_UCL_ValuationReport.docx Page 55
5. VALUATION CONSIDERATIONS The authors and reviewers of this report are either Members of the Australasian Institute of Mining and Metallurgy (“AusIMM”) or Australian Institute of Geoscientists (“AIG”) and therefore, are obliged to prepare mineral asset valuations in accordance with the Australian reporting requirements as set out in the VALMIN Code (2005 Edition).
The objective of a mineral asset valuation is to establish a “fair market” value for an asset in the context of the factors outlined in the body of this report.
5.1 FAIR MARKET VALUE OF MINERAL ASSETS
Mineral assets are defined in the VALMIN Code as all property including, but not limited to real property, mining and exploration tenements held or acquired in connection with the exploration, the development of and the production from those tenements together with all plant, equipment and infrastructure owned or acquired for the development, extraction and processing of minerals in connection with those tenements.
The VALMIN Code defines fair market value of a mineral asset as the estimated amount of money or the cash equivalent of some other consideration for which, in the opinion of the Expert or Specialist reached in accordance with the provisions of the VALMIN Code, the mineral asset should change hands on the valuation date between a willing buyer and a willing seller in an arm‟s length transaction, wherein each party has acted knowledgeably, prudently and without compulsion.
The VALMIN Code notes that the value of a mineral asset usually consists of two components; the underlying or Technical Value, and the Market component which is a premium relating to market, strategic or other considerations which, depending on circumstances at the time, can be either positive, negative or zero. When the Technical and Market components of value are added together the resulting value is referred to as the Market Value.
The value of mineral assets is time and circumstance specific. The asset value and the market premium (or discount) changes, sometimes significantly, as overall market conditions, commodity prices, exchange rates, political and country risk change. Other factors that can influence the valuation of a specific asset include the size of the company‟s interest, whether it has sound management and the professional competence of the asset‟s management. All these issues can influence the market‟s perception of a mineral asset over and above its technical value.
5.2 METHODS OF VALUING MINERAL ASSETS
5.2.1 Mineral assets in the exploration stage
When valuing an exploration or mining property, the Expert is attempting to arrive at a value that reflects the potential of the property to yield a mineable Ore Reserve and which is, at the same time, in line with what the property will be judged to be worth when assessed by the market.
The most commonly employed methods of exploration asset valuation are:
multiple of exploration expenditure method (exploration based) also known as the premium or discount on costs method or the appraised value method;
joint venture terms method (expenditure based);
geoscience rating methods such as the Kilburn method (potential based); and
comparable market value method (real estate based).
In Snowden‟s opinion, a valuer charged with the preparation of a tenement valuation must give consideration to a range of technical issues as well as make a judgement about the „market‟. Key technical issues that need to be taken into account include:
geological setting of the property
the relative size of the landholding
results of exploration activities on the tenement
evidence of mineralisation on adjacent properties
For
per
sona
l use
onl
y
FINAL
130430_Final_AU4095_UCL_ValuationReport.docx Page 56
proximity to existing production facilities of the property.
In addition to these technical issues the Expert has to take particular note of the market‟s demand for the type of property being valued.
It is Snowden‟s opinion that the market may pay a premium over the technical value for high quality mineral assets (i.e. assets that hold defined resources that are likely to be mined profitably in the short-term or projects that are believed to have the potential to develop into mining operations in the short term even though no resources have been defined). On the other hand exploration tenements that have no defined attributes apart from interesting geology or a „good address‟ may well trade at a discount to technical value. Deciding upon the level of discount or premium is entirely a matter of the Expert‟s professional judgement. This judgement must of course take account of the commodity potential of the tenement, the proximity of an asset to an established processing facility and the size of the land holding.
5.2.2 Mineral assets with Mineral Resources and Ore Reserves
Where Mineral Resources and/or Ore Reserves have been defined, Snowden‟s approach is to excise them from the mineral property and to value them separately on a value per resource tonne / metal unit basis or on the basis of a discounted cash flow (“DCF”). The value of the exploration potential of the remainder of the property can then be assessed. Where appropriate, discounts are applied to the estimated contained metal to represent uncertainty in the information.
In Snowden‟s opinion, an Expert charged with the preparation of a development or production project valuation must give consideration to a range of technical issues as well as make a judgement about the „market‟. Key technical issues that need to be taken into account include:
confidence in the Mineral Resource / Ore Reserve estimate
metallurgical characteristics
difficulty and cost of extraction
economies of scale
proximity of and access to supporting infrastructure.
Discounted cash flow analysis
A DCF analysis determines the Technical Value of a project by approximating the value if it were developed under the prevailing economic conditions.
Once a Mineral Resource has been assessed for mining by considering revenues and operating costs, the economically viable component of the resource becomes the Ore Reserve. When this is scheduled for mining, and the capital costs and tax regime are considered, the net present value (“NPV”) of the project is established by discounting future annual cash flows using an appropriate discount rate.
The resulting ‟classical‟ NPV has several recognised deficiencies linked to the fact that the approach assumes a static approach to investment decision making, however the NPV represents a fundamental approach to valuing a proposed or on-going mining operation and is widely used within the mining industry.
Comparable market transaction value
When the economic viability of a resource has not been determined by studies, then a comparable market transaction value approach can be applied. The comparable market transaction value approach for resources is a similar process to that for exploration property however a dollar value per resource tonne / metal in the ground is determined.
As no two mineral assets are the same, the Expert must be cognisant of the quality of the assets in the comparable transactions, with specific reference to:
the grade of the resource
the metallurgical qualities of the resource
For
per
sona
l use
onl
y
FINAL
130430_Final_AU4095_UCL_ValuationReport.docx Page 57
the proximity to infrastructure such as an existing mill, roads, rail, power, water, skilled work force, equipment, etc.
likely operating and capital costs
the amount of pre-strip (for open pits) or development (for underground mines) necessary
the likely ore to waste ratio (for open pits)
the size of the tenement covering the mineral asset
the overall confidence in the resource.
5.3 SNOWDEN’S VALUATION METHODOLOGY
In completing the valuation of the Sandpiper remnant resources Snowden has reviewed global phosphate projects, the phosphate market and available previous transactions involving phosphate projects. Similarly in valuing the Mehdiabad Project Snowden has reviewed recent transactions for zinc and copper projects.
Snowden has applied a number of valuation approaches including, comparable transactions for phosphate exploration areas (km2), and comparable transactions of phosphate, zinc and copper resources.
Snowden has prepared the valuation in this report based on various techniques and made a judgement as to the fair and reasonable market valuation of the mineral assets. The values assigned to these mineral assets are in Australian dollars (A$) and were prepared on the effective valuation date of 1 April 2013.
Snowden has based its valuation of the mineral assets upon information provided by UCL and in the public domain.
As part of the valuation process Snowden has reviewed the:
exploration activity and mineral potential of the projects and mineral tenements
costs associated with mineral exploration
recent transactions of similar commodities in Australia and overseas.
Snowden has also based the valuation of UCL Mineral Assets on discussions with UCL key technical staff.
6. RECENT COMPARABLE TRANSACTIONS
6.1 COMPARABLE TRANSACTIONS (PHOSPHATE)
Table 6.1 shows transactions within the last three years for phosphate resources and reserves.
For
per
sona
l use
onl
y

FINAL
130430_Final_AU4095_UCL_ValuationReport.docx Page 58
Table 6.1 Phosphate resource comparable transactions A$:US$ 1.045
Project Name
Deposit & Location Acquirer Acquiree Date Resource Share A$M US$:A$ US$M
US$/ t
P2O5
Korella Deposit
Georgina Basin QLD
Daton Group
Australia
Krucible Metals
Mar 2013
8.3 Mt at 27.3% P2O5
# 100% 12.00 1.045 11.48 5.06
Farim Project
Guinea Bissau
Plains Creek
phosphate
GB Minerals AG
Feb 2013
110.9 Mt at 28.68%
P2O5 50.1% - - 6.53 0.82
Arganara Georgina Basin NT
Rum Jungle Resources
Central Australian Phosphate
Feb 2013
310 Mt at 15% P2O5
100% 12.70 1.034 12.28 0.26
Sandpiper Project
Marine Namibia
Mawarid Mining
Minemakers Limited
Dec 2012
1,835 Mt at 19.1% P2O5
42.5% 25.00 1.054 23.72 0.16
Wonarah Georgina Basin NT NMDC % Minemakers
Limited Mar 2012
832.7 Mt at 17.9% P2O5
50.0% 15.0 1.040 14.42 0.19
Bayovar Mine & Peru
Mitsui Mosaic
MVM Resources
Apr 2010
230.9 Mt at 17.2% P2O5
60% - - 660 27.7
# includes 13.72 Mt at 0.07% Yttrium. & = Operating Mine % NMDC not completed acquisition (assumed A$15M)
6.1.1 The Bayóvar Phosphate Mine
Resources
The Bayóvar Phosphate open pit mine is located in the Sechura desert in Piura, Peru. It has Mineral Resources of 230.9 Mt at 17.2 % P2O5 and an Ore Reserve base of 238 Mt P2O5. The project was owned by Vale in 2005 and production commenced in July 2010. The mine has an estimated life of 27 years and is capable of producing 3.9 million tonnes per annum (Mtpa) of phosphate concentrate with a minimum grade of 29% P2O5. The project includes a phosphate concentrating plant and a 32 km highway to the port.
Valuation
In July 2010 Vale sold minority stakes in the project to Mosaic (35%) and Mitsui (25%) for US$660 M retaining control of the project with a 40% stake. This gave a value of the resources at the mine of approximately US$27.7/t P2O5. The high value probably reflects the completion of a positive feasibility study with Proved Reserves.
6.1.2 Wonarah (Minemakers)
Resources
The Wonarah Rock Phosphate project occurs east of Tennant Creek in the Northern Territory of Australia and is 100% owned by Minemakers Limited. The Mineral Inventory for the entire phosphate deposit is 1,734 Mt @ 12.2% P2O5 at a 10% P2O5 cut-off. The Mineral Resources based on a 15% cut-off are as follows:
Measured category: 78 Mt at 20.8% P2O5
Indicated category: 222 Mt at 17.5% P2O5
Inferred category: 542 Mt at 18% P2O5.
Total Resources: 842 Mt at 18.1% P2O5.
Mineralisation is hosted by the lowermost sedimentary units of the Georgina Basin which also hosts the producing mine at Phosphate Hill to the east in the Mt Isa district of Queensland.
For
per
sona
l use
onl
y
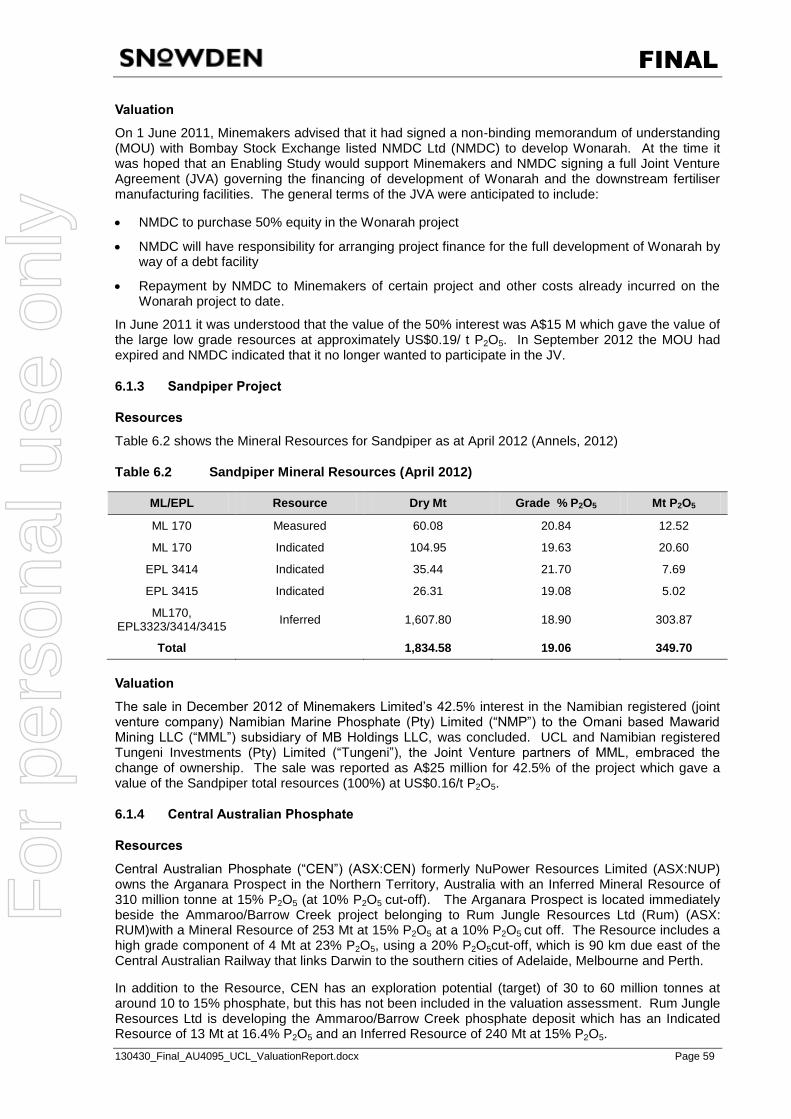
FINAL
130430_Final_AU4095_UCL_ValuationReport.docx Page 59
Valuation
On 1 June 2011, Minemakers advised that it had signed a non-binding memorandum of understanding (MOU) with Bombay Stock Exchange listed NMDC Ltd (NMDC) to develop Wonarah. At the time it was hoped that an Enabling Study would support Minemakers and NMDC signing a full Joint Venture Agreement (JVA) governing the financing of development of Wonarah and the downstream fertiliser manufacturing facilities. The general terms of the JVA were anticipated to include:
NMDC to purchase 50% equity in the Wonarah project
NMDC will have responsibility for arranging project finance for the full development of Wonarah by way of a debt facility
Repayment by NMDC to Minemakers of certain project and other costs already incurred on the Wonarah project to date.
In June 2011 it was understood that the value of the 50% interest was A$15 M which gave the value of the large low grade resources at approximately US$0.19/ t P2O5. In September 2012 the MOU had expired and NMDC indicated that it no longer wanted to participate in the JV.
6.1.3 Sandpiper Project
Resources
Table 6.2 shows the Mineral Resources for Sandpiper as at April 2012 (Annels, 2012)
Table 6.2 Sandpiper Mineral Resources (April 2012)
ML/EPL Resource Dry Mt Grade % P2O5 Mt P2O5
ML 170 Measured 60.08 20.84 12.52
ML 170 Indicated 104.95 19.63 20.60
EPL 3414 Indicated 35.44 21.70 7.69
EPL 3415 Indicated 26.31 19.08 5.02
ML170, EPL3323/3414/3415 Inferred 1,607.80 18.90 303.87
Total 1,834.58 19.06 349.70
Valuation
The sale in December 2012 of Minemakers Limited‟s 42.5% interest in the Namibian registered (joint venture company) Namibian Marine Phosphate (Pty) Limited (“NMP”) to the Omani based Mawarid Mining LLC (“MML”) subsidiary of MB Holdings LLC, was concluded. UCL and Namibian registered Tungeni Investments (Pty) Limited (“Tungeni”), the Joint Venture partners of MML, embraced the change of ownership. The sale was reported as A$25 million for 42.5% of the project which gave a value of the Sandpiper total resources (100%) at US$0.16/t P2O5.
6.1.4 Central Australian Phosphate
Resources
Central Australian Phosphate (“CEN”) (ASX:CEN) formerly NuPower Resources Limited (ASX:NUP) owns the Arganara Prospect in the Northern Territory, Australia with an Inferred Mineral Resource of 310 million tonne at 15% P2O5 (at 10% P2O5 cut-off). The Arganara Prospect is located immediately beside the Ammaroo/Barrow Creek project belonging to Rum Jungle Resources Ltd (Rum) (ASX: RUM)with a Mineral Resource of 253 Mt at 15% P2O5 at a 10% P2O5 cut off. The Resource includes a high grade component of 4 Mt at 23% P2O5, using a 20% P2O5cut-off, which is 90 km due east of the Central Australian Railway that links Darwin to the southern cities of Adelaide, Melbourne and Perth.
In addition to the Resource, CEN has an exploration potential (target) of 30 to 60 million tonnes at around 10 to 15% phosphate, but this has not been included in the valuation assessment. Rum Jungle Resources Ltd is developing the Ammaroo/Barrow Creek phosphate deposit which has an Indicated Resource of 13 Mt at 16.4% P2O5 and an Inferred Resource of 240 Mt at 15% P2O5.
For
per
sona
l use
onl
y
FINAL
130430_Final_AU4095_UCL_ValuationReport.docx Page 60
Valuation
In February 2013 Rum offered one of its own shares, along with 20c in cash, for every 20 Central Australian Phosphate (CEN) shares held, valuing the takeover target at around A$12.7 million. The offer represents a 43.3% premium to the closing price of Central Australian Phosphate‟s shares on February 12, and a 34.4% premium to a recent rights issue. The offer has yet to be accepted, but currently gives a value of the phosphate resources of at least US$0.26/t P2O5 assuming a higher offer is made in future.
6.1.5 Farim Phosphate project
Resources
The Farim Phosphate Project is located in the northern part of central Guinea-Bissau, West Africa, approximately 25 km south of the Senegal border, approximately 5 km west of the town of Farim and some 120 km north of Bissau, the capital. The Project consists of a high grade sedimentary phosphate deposit which extends over a known surface area of approximately 40 km2.
The Farim phosphate deposit occurs within the Middle Eocene sedimentary basin that extends from Morocco in the north through Mauritania, Senegal, Guinea-Bissau and into Guinea to the south, which hosts a number of important phosphate deposits and accounts for almost 25% of world production.
The Farim phosphate project is owned by Plains Creek Phosphate Corp contains Measured Resources of 64.6 Mt at 29.11% P2O5, Indicated Resources of 28.1 Mt at 27.68 P2O5 and Inferred resources of 18.3 Mt at 28.66% P2O5. The deposit has total Proved and Probable Ore Reserves of 33.0 Mt at 30.4% P2O5. A feasibility study in December 2012 indicated a simple 25 year mining and beneficiation plan at a rate of 1 Mtpa beneficiated phosphate rock concentrate.
Valuation
Plains Creek entered into a Share Purchase Agreement to acquire 100% of the shareholding of GB Minerals AG of Switzerland which in turn owns 100% of the mineral rights to the Farim Phosphate project. Plains Creek acquired a 50.1% interest in the project in March 2011 and has the right to acquire the remaining 49.9% interest through staged payments. This gave a value of the (high grade) phosphate resource at about $0.82/t P2O5.
6.1.6 Korella Phosphate project
Resources
Krucible Metals Ltd (“Krucible”) (ASX: KRB) owns the Korella Phosphate Project and prospective phosphate tenements south of Mt Isa in Western Queensland, Australia. In September 2009 Krucible announced an Inferred Mineral Resource of 5.0 Mt at 30.8% P2O5, surrounded by lower grade mineralisation, which was later upgraded to an Inferred Resource of 8.3 Mt at 27.3% P2O5. The Korella Project has a valuable rare earth (Yttrium) enriched layer overlying the high grade phosphate and the tenements also contain rare-earths, copper and gold.
Valuation
On 21 March 2013 Krucible Metals Ltd (ASX: KRB) sold the phosphate bearing tenements to Daton Group Australia (“Daton”) (ASX:DTG) for A$12.0 M, including mining lease 90209, and all other mineral rights on the tenements. This gives a value of the high grade phosphate resources at US$5.06/t P2O5. The relatively high value probably reflects the high grade of the phosphate deposit and the presence of rare earths (Yttrium) and is probably not a useful comparison.
The tenement package comprises 13 granted EPM‟s (Exploration Permits for Minerals) for a total of 1,147 sub blocks (approx. 3,693 km2), 100% owned by Krucible Metals Ltd. This gives a value to the tenements of approximately A$3,250/km2, which is considered a more useful comparison for a large tenement holding.
6.2 SNOWDEN COMMENT ON TRANSACTIONS
This value compares with other large low grade phosphate resources at Wonarah in the Northern Territory (Minemakers Ltd) and Arganara in Queensland (Central Australian Phosphate (previously NuPower) and Rum Jungle).
For
per
sona
l use
onl
y
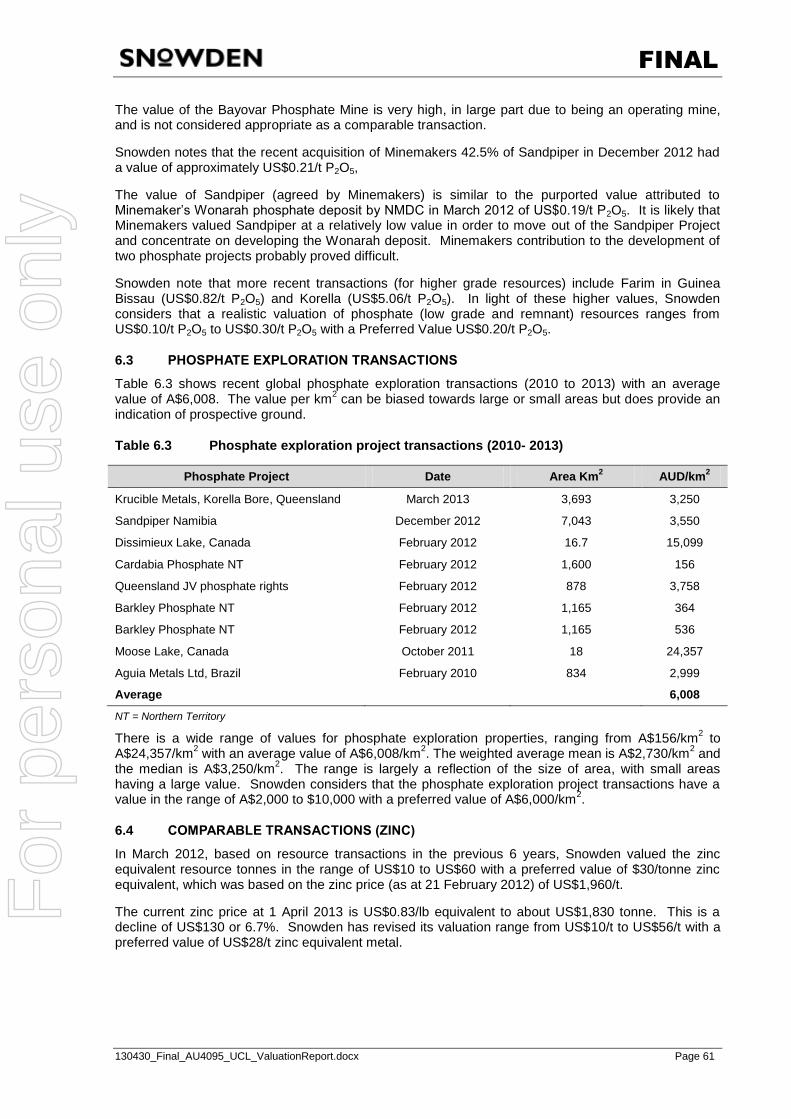
FINAL
130430_Final_AU4095_UCL_ValuationReport.docx Page 61
The value of the Bayovar Phosphate Mine is very high, in large part due to being an operating mine, and is not considered appropriate as a comparable transaction.
Snowden notes that the recent acquisition of Minemakers 42.5% of Sandpiper in December 2012 had a value of approximately US$0.21/t P2O5,
The value of Sandpiper (agreed by Minemakers) is similar to the purported value attributed to Minemaker‟s Wonarah phosphate deposit by NMDC in March 2012 of US$0.19/t P2O5. It is likely that Minemakers valued Sandpiper at a relatively low value in order to move out of the Sandpiper Project and concentrate on developing the Wonarah deposit. Minemakers contribution to the development of two phosphate projects probably proved difficult.
Snowden note that more recent transactions (for higher grade resources) include Farim in Guinea Bissau (US$0.82/t P2O5) and Korella (US$5.06/t P2O5). In light of these higher values, Snowden considers that a realistic valuation of phosphate (low grade and remnant) resources ranges from US$0.10/t P2O5 to US$0.30/t P2O5 with a Preferred Value US$0.20/t P2O5.
6.3 PHOSPHATE EXPLORATION TRANSACTIONS
Table 6.3 shows recent global phosphate exploration transactions (2010 to 2013) with an average value of A$6,008. The value per km2 can be biased towards large or small areas but does provide an indication of prospective ground.
Table 6.3 Phosphate exploration project transactions (2010- 2013)
Phosphate Project Date Area Km2 AUD/km2
Krucible Metals, Korella Bore, Queensland March 2013 3,693 3,250
Sandpiper Namibia December 2012 7,043 3,550
Dissimieux Lake, Canada February 2012 16.7 15,099
Cardabia Phosphate NT February 2012 1,600 156
Queensland JV phosphate rights February 2012 878 3,758
Barkley Phosphate NT February 2012 1,165 364
Barkley Phosphate NT February 2012 1,165 536
Moose Lake, Canada October 2011 18 24,357
Aguia Metals Ltd, Brazil February 2010 834 2,999
Average 6,008
NT = Northern Territory
There is a wide range of values for phosphate exploration properties, ranging from A$156/km2 to A$24,357/km2 with an average value of A$6,008/km2. The weighted average mean is A$2,730/km2 and the median is A$3,250/km2. The range is largely a reflection of the size of area, with small areas having a large value. Snowden considers that the phosphate exploration project transactions have a value in the range of A$2,000 to $10,000 with a preferred value of A$6,000/km2.
6.4 COMPARABLE TRANSACTIONS (ZINC)
In March 2012, based on resource transactions in the previous 6 years, Snowden valued the zinc equivalent resource tonnes in the range of US$10 to US$60 with a preferred value of $30/tonne zinc equivalent, which was based on the zinc price (as at 21 February 2012) of US$1,960/t.
The current zinc price at 1 April 2013 is US$0.83/lb equivalent to about US$1,830 tonne. This is a decline of US$130 or 6.7%. Snowden has revised its valuation range from US$10/t to US$56/t with a preferred value of US$28/t zinc equivalent metal.
For
per
sona
l use
onl
y
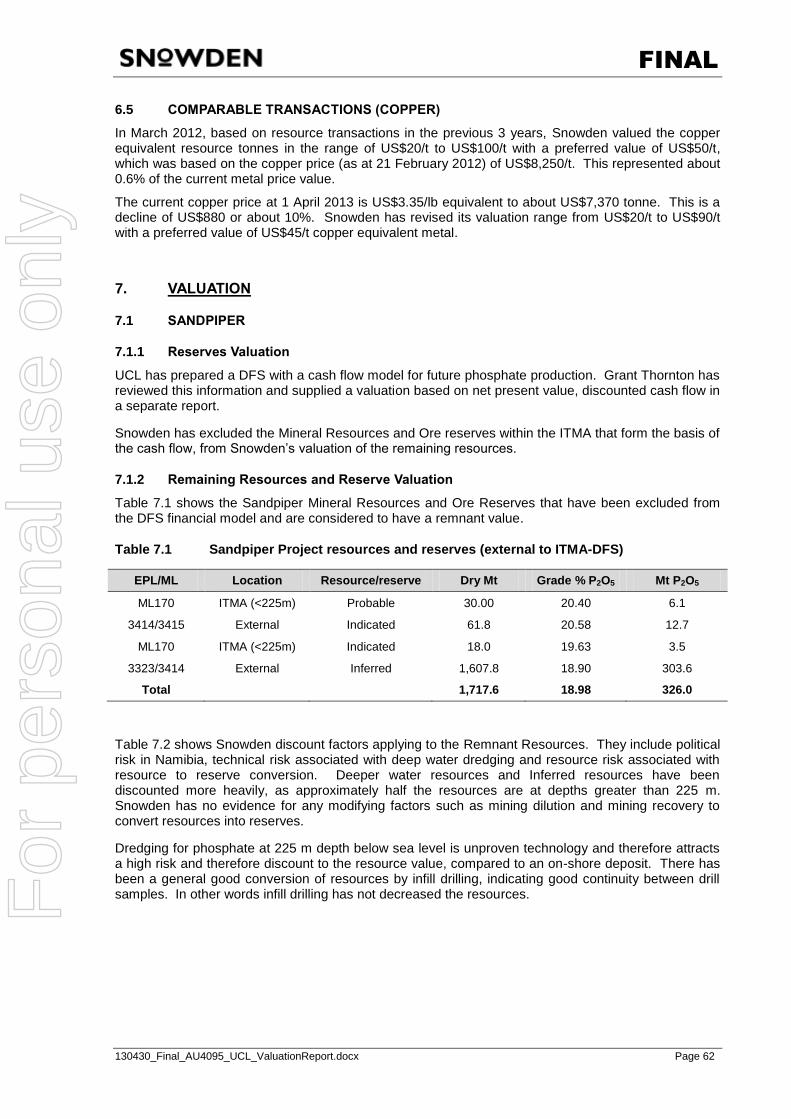
FINAL
130430_Final_AU4095_UCL_ValuationReport.docx Page 62
6.5 COMPARABLE TRANSACTIONS (COPPER)
In March 2012, based on resource transactions in the previous 3 years, Snowden valued the copper equivalent resource tonnes in the range of US$20/t to US$100/t with a preferred value of US$50/t, which was based on the copper price (as at 21 February 2012) of US$8,250/t. This represented about 0.6% of the current metal price value.
The current copper price at 1 April 2013 is US$3.35/lb equivalent to about US$7,370 tonne. This is a decline of US$880 or about 10%. Snowden has revised its valuation range from US$20/t to US$90/t with a preferred value of US$45/t copper equivalent metal.
7. VALUATION
7.1 SANDPIPER
7.1.1 Reserves Valuation
UCL has prepared a DFS with a cash flow model for future phosphate production. Grant Thornton has reviewed this information and supplied a valuation based on net present value, discounted cash flow in a separate report.
Snowden has excluded the Mineral Resources and Ore reserves within the ITMA that form the basis of the cash flow, from Snowden‟s valuation of the remaining resources.
7.1.2 Remaining Resources and Reserve Valuation
Table 7.1 shows the Sandpiper Mineral Resources and Ore Reserves that have been excluded from the DFS financial model and are considered to have a remnant value.
Table 7.1 Sandpiper Project resources and reserves (external to ITMA-DFS)
EPL/ML Location Resource/reserve Dry Mt Grade % P2O5 Mt P2O5
ML170 ITMA (<225m) Probable 30.00 20.40 6.1
3414/3415 External Indicated 61.8 20.58 12.7
ML170 ITMA (<225m) Indicated 18.0 19.63 3.5
3323/3414 External Inferred 1,607.8 18.90 303.6
Total 1,717.6 18.98 326.0
Table 7.2 shows Snowden discount factors applying to the Remnant Resources. They include political risk in Namibia, technical risk associated with deep water dredging and resource risk associated with resource to reserve conversion. Deeper water resources and Inferred resources have been discounted more heavily, as approximately half the resources are at depths greater than 225 m. Snowden has no evidence for any modifying factors such as mining dilution and mining recovery to convert resources into reserves.
Dredging for phosphate at 225 m depth below sea level is unproven technology and therefore attracts a high risk and therefore discount to the resource value, compared to an on-shore deposit. There has been a general good conversion of resources by infill drilling, indicating good continuity between drill samples. In other words infill drilling has not decreased the resources. F
or p
erso
nal u
se o
nly
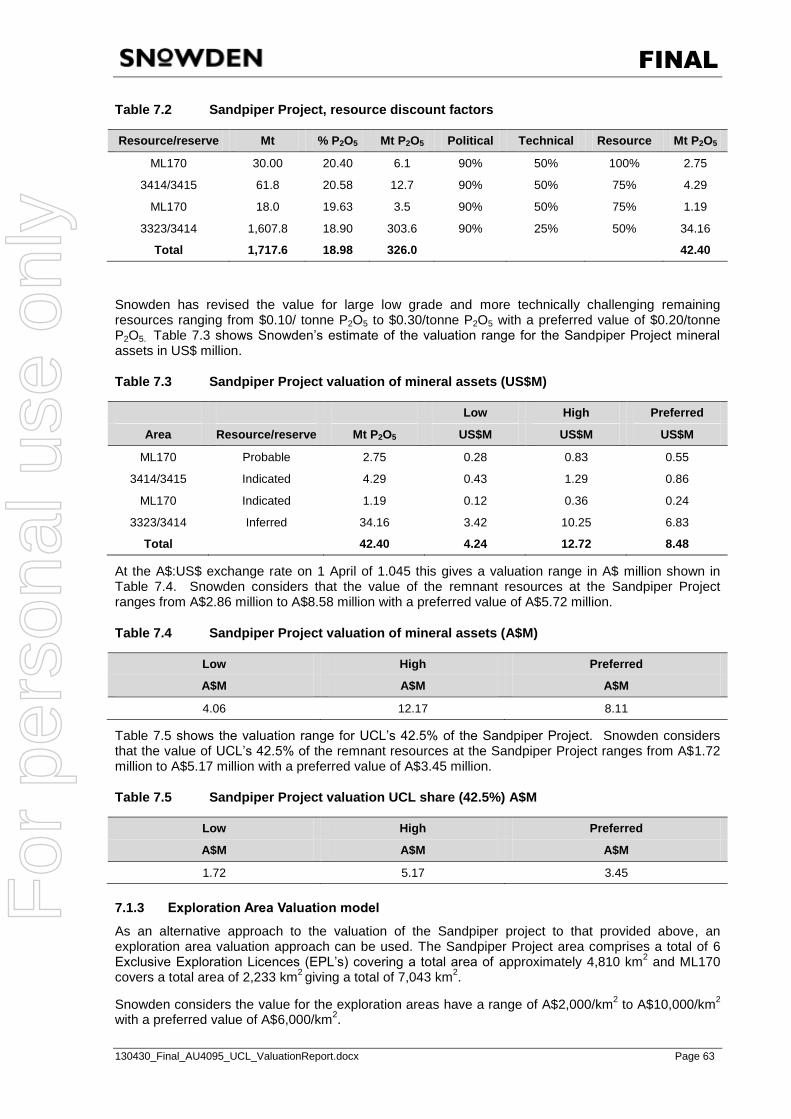
FINAL
130430_Final_AU4095_UCL_ValuationReport.docx Page 63
Table 7.2 Sandpiper Project, resource discount factors
Resource/reserve Mt % P2O5 Mt P2O5 Political Technical Resource Mt P2O5
ML170 30.00 20.40 6.1 90% 50% 100% 2.75
3414/3415 61.8 20.58 12.7 90% 50% 75% 4.29
ML170 18.0 19.63 3.5 90% 50% 75% 1.19
3323/3414 1,607.8 18.90 303.6 90% 25% 50% 34.16
Total 1,717.6 18.98 326.0 42.40
Snowden has revised the value for large low grade and more technically challenging remaining resources ranging from $0.10/ tonne P2O5 to $0.30/tonne P2O5 with a preferred value of $0.20/tonne P2O5. Table 7.3 shows Snowden‟s estimate of the valuation range for the Sandpiper Project mineral assets in US$ million.
Table 7.3 Sandpiper Project valuation of mineral assets (US$M)
Low High Preferred
Area Resource/reserve Mt P2O5 US$M US$M US$M
ML170 Probable 2.75 0.28 0.83 0.55
3414/3415 Indicated 4.29 0.43 1.29 0.86
ML170 Indicated 1.19 0.12 0.36 0.24
3323/3414 Inferred 34.16 3.42 10.25 6.83
Total 42.40 4.24 12.72 8.48
At the A$:US$ exchange rate on 1 April of 1.045 this gives a valuation range in A$ million shown in Table 7.4. Snowden considers that the value of the remnant resources at the Sandpiper Project ranges from A$2.86 million to A$8.58 million with a preferred value of A$5.72 million.
Table 7.4 Sandpiper Project valuation of mineral assets (A$M)
Low High Preferred
A$M A$M A$M
4.06 12.17 8.11
Table 7.5 shows the valuation range for UCL‟s 42.5% of the Sandpiper Project. Snowden considers that the value of UCL‟s 42.5% of the remnant resources at the Sandpiper Project ranges from A$1.72 million to A$5.17 million with a preferred value of A$3.45 million.
Table 7.5 Sandpiper Project valuation UCL share (42.5%) A$M
Low High Preferred
A$M A$M A$M
1.72 5.17 3.45
7.1.3 Exploration Area Valuation model
As an alternative approach to the valuation of the Sandpiper project to that provided above, an exploration area valuation approach can be used. The Sandpiper Project area comprises a total of 6 Exclusive Exploration Licences (EPL‟s) covering a total area of approximately 4,810 km2 and ML170 covers a total area of 2,233 km2 giving a total of 7,043 km2.
Snowden considers the value for the exploration areas have a range of A$2,000/km2 to A$10,000/km2 with a preferred value of A$6,000/km2.
For
per
sona
l use
onl
y
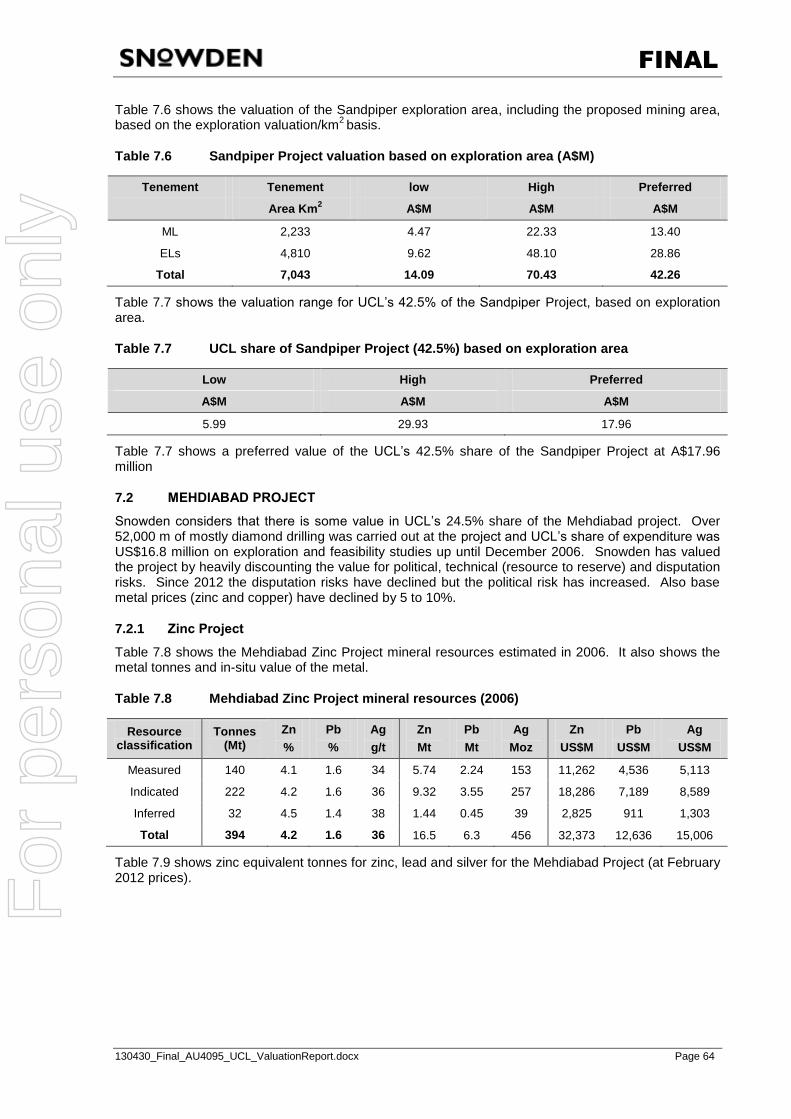
FINAL
130430_Final_AU4095_UCL_ValuationReport.docx Page 64
Table 7.6 shows the valuation of the Sandpiper exploration area, including the proposed mining area, based on the exploration valuation/km2 basis.
Table 7.6 Sandpiper Project valuation based on exploration area (A$M)
Tenement Tenement low High Preferred
Area Km2 A$M A$M A$M
ML 2,233 4.47 22.33 13.40
ELs 4,810 9.62 48.10 28.86
Total 7,043 14.09 70.43 42.26
Table 7.7 shows the valuation range for UCL‟s 42.5% of the Sandpiper Project, based on exploration area.
Table 7.7 UCL share of Sandpiper Project (42.5%) based on exploration area
Low High Preferred
A$M A$M A$M
5.99 29.93 17.96
Table 7.7 shows a preferred value of the UCL‟s 42.5% share of the Sandpiper Project at A$17.96 million
7.2 MEHDIABAD PROJECT
Snowden considers that there is some value in UCL‟s 24.5% share of the Mehdiabad project. Over 52,000 m of mostly diamond drilling was carried out at the project and UCL‟s share of expenditure was US$16.8 million on exploration and feasibility studies up until December 2006. Snowden has valued the project by heavily discounting the value for political, technical (resource to reserve) and disputation risks. Since 2012 the disputation risks have declined but the political risk has increased. Also base metal prices (zinc and copper) have declined by 5 to 10%.
7.2.1 Zinc Project
Table 7.8 shows the Mehdiabad Zinc Project mineral resources estimated in 2006. It also shows the metal tonnes and in-situ value of the metal.
Table 7.8 Mehdiabad Zinc Project mineral resources (2006)
Resource classification
Tonnes (Mt)
Zn %
Pb %
Ag g/t
Zn Mt
Pb Mt
Ag Moz
Zn US$M
Pb US$M
Ag US$M
Measured 140 4.1 1.6 34 5.74 2.24 153 11,262 4,536 5,113
Indicated 222 4.2 1.6 36 9.32 3.55 257 18,286 7,189 8,589
Inferred 32 4.5 1.4 38 1.44 0.45 39 2,825 911 1,303
Total 394 4.2 1.6 36 16.5 6.3 456 32,373 12,636 15,006
Table 7.9 shows zinc equivalent tonnes for zinc, lead and silver for the Mehdiabad Project (at February 2012 prices). F
or p
erso
nal u
se o
nly
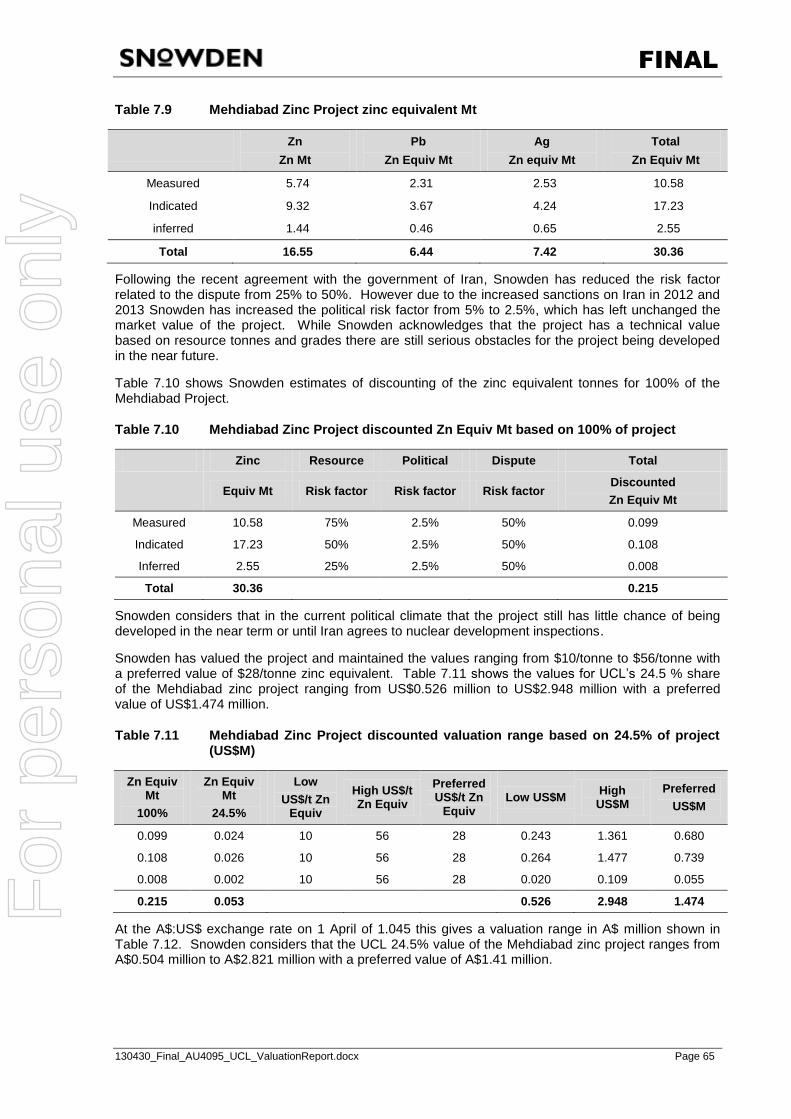
FINAL
130430_Final_AU4095_UCL_ValuationReport.docx Page 65
Table 7.9 Mehdiabad Zinc Project zinc equivalent Mt
Zn
Zn Mt Pb
Zn Equiv Mt Ag
Zn equiv Mt Total
Zn Equiv Mt
Measured 5.74 2.31 2.53 10.58
Indicated 9.32 3.67 4.24 17.23
inferred 1.44 0.46 0.65 2.55
Total 16.55 6.44 7.42 30.36
Following the recent agreement with the government of Iran, Snowden has reduced the risk factor related to the dispute from 25% to 50%. However due to the increased sanctions on Iran in 2012 and 2013 Snowden has increased the political risk factor from 5% to 2.5%, which has left unchanged the market value of the project. While Snowden acknowledges that the project has a technical value based on resource tonnes and grades there are still serious obstacles for the project being developed in the near future.
Table 7.10 shows Snowden estimates of discounting of the zinc equivalent tonnes for 100% of the Mehdiabad Project.
Table 7.10 Mehdiabad Zinc Project discounted Zn Equiv Mt based on 100% of project
Zinc Resource Political Dispute Total
Equiv Mt Risk factor Risk factor Risk factor
Discounted Zn Equiv Mt
Measured 10.58 75% 2.5% 50% 0.099
Indicated 17.23 50% 2.5% 50% 0.108
Inferred 2.55 25% 2.5% 50% 0.008
Total 30.36 0.215
Snowden considers that in the current political climate that the project still has little chance of being developed in the near term or until Iran agrees to nuclear development inspections.
Snowden has valued the project and maintained the values ranging from $10/tonne to $56/tonne with a preferred value of $28/tonne zinc equivalent. Table 7.11 shows the values for UCL‟s 24.5 % share of the Mehdiabad zinc project ranging from US$0.526 million to US$2.948 million with a preferred value of US$1.474 million.
Table 7.11 Mehdiabad Zinc Project discounted valuation range based on 24.5% of project (US$M)
Zn Equiv Mt
100%
Zn Equiv Mt
24.5%
Low US$/t Zn
Equiv
High US$/t Zn Equiv
Preferred US$/t Zn
Equiv Low US$M High
US$M Preferred
US$M
0.099 0.024 10 56 28 0.243 1.361 0.680
0.108 0.026 10 56 28 0.264 1.477 0.739
0.008 0.002 10 56 28 0.020 0.109 0.055
0.215 0.053 0.526 2.948 1.474
At the A$:US$ exchange rate on 1 April of 1.045 this gives a valuation range in A$ million shown in Table 7.12. Snowden considers that the UCL 24.5% value of the Mehdiabad zinc project ranges from A$0.504 million to A$2.821 million with a preferred value of A$1.41 million.
For
per
sona
l use
onl
y
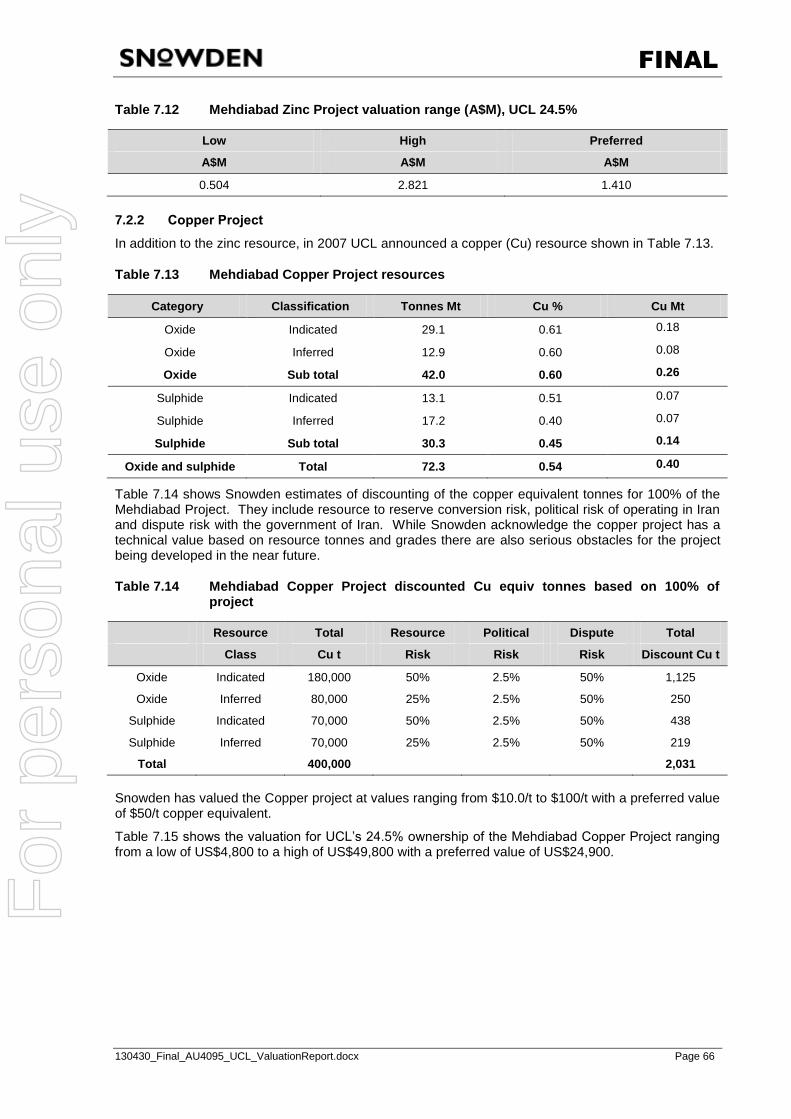
FINAL
130430_Final_AU4095_UCL_ValuationReport.docx Page 66
Table 7.12 Mehdiabad Zinc Project valuation range (A$M), UCL 24.5%
Low High Preferred
A$M A$M A$M
0.504 2.821 1.410
7.2.2 Copper Project
In addition to the zinc resource, in 2007 UCL announced a copper (Cu) resource shown in Table 7.13.
Table 7.13 Mehdiabad Copper Project resources
Category Classification Tonnes Mt Cu % Cu Mt
Oxide Indicated 29.1 0.61 0.18
Oxide Inferred 12.9 0.60 0.08
Oxide Sub total 42.0 0.60 0.26
Sulphide Indicated 13.1 0.51 0.07
Sulphide Inferred 17.2 0.40 0.07
Sulphide Sub total 30.3 0.45 0.14
Oxide and sulphide Total 72.3 0.54 0.40
Table 7.14 shows Snowden estimates of discounting of the copper equivalent tonnes for 100% of the Mehdiabad Project. They include resource to reserve conversion risk, political risk of operating in Iran and dispute risk with the government of Iran. While Snowden acknowledge the copper project has a technical value based on resource tonnes and grades there are also serious obstacles for the project being developed in the near future.
Table 7.14 Mehdiabad Copper Project discounted Cu equiv tonnes based on 100% of project
Resource Total Resource Political Dispute Total
Class Cu t Risk Risk Risk Discount Cu t
Oxide Indicated 180,000 50% 2.5% 50% 1,125
Oxide Inferred 80,000 25% 2.5% 50% 250
Sulphide Indicated 70,000 50% 2.5% 50% 438
Sulphide Inferred 70,000 25% 2.5% 50% 219
Total 400,000 2,031
Snowden has valued the Copper project at values ranging from $10.0/t to $100/t with a preferred value of $50/t copper equivalent.
Table 7.15 shows the valuation for UCL‟s 24.5% ownership of the Mehdiabad Copper Project ranging from a low of US$4,800 to a high of US$49,800 with a preferred value of US$24,900.
For
per
sona
l use
onl
y
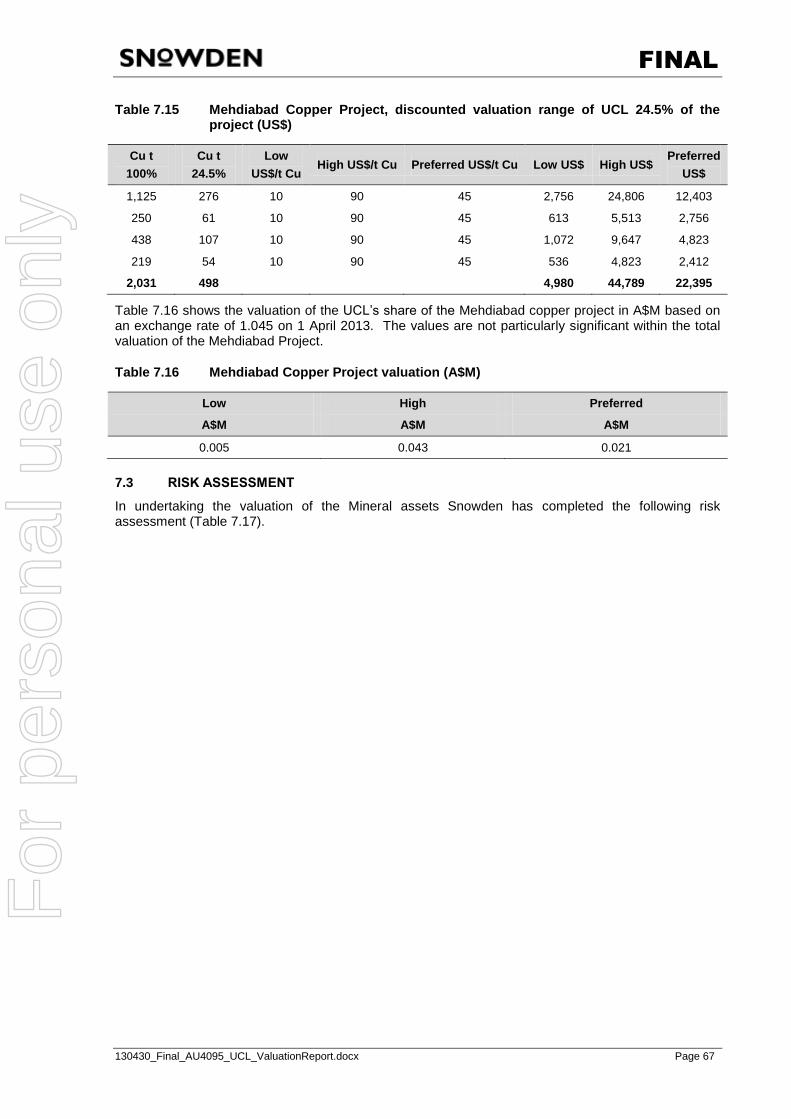
FINAL
130430_Final_AU4095_UCL_ValuationReport.docx Page 67
Table 7.15 Mehdiabad Copper Project, discounted valuation range of UCL 24.5% of the project (US$)
Cu t 100%
Cu t 24.5%
Low US$/t Cu
High US$/t Cu Preferred US$/t Cu Low US$ High US$ Preferred
US$
1,125 276 10 90 45 2,756 24,806 12,403
250 61 10 90 45 613 5,513 2,756
438 107 10 90 45 1,072 9,647 4,823
219 54 10 90 45 536 4,823 2,412
2,031 498 4,980 44,789 22,395
Table 7.16 shows the valuation of the UCL‟s share of the Mehdiabad copper project in A$M based on an exchange rate of 1.045 on 1 April 2013. The values are not particularly significant within the total valuation of the Mehdiabad Project.
Table 7.16 Mehdiabad Copper Project valuation (A$M)
Low High Preferred
A$M A$M A$M
0.005 0.043 0.021
7.3 RISK ASSESSMENT
In undertaking the valuation of the Mineral assets Snowden has completed the following risk assessment (Table 7.17).
For
per
sona
l use
onl
y
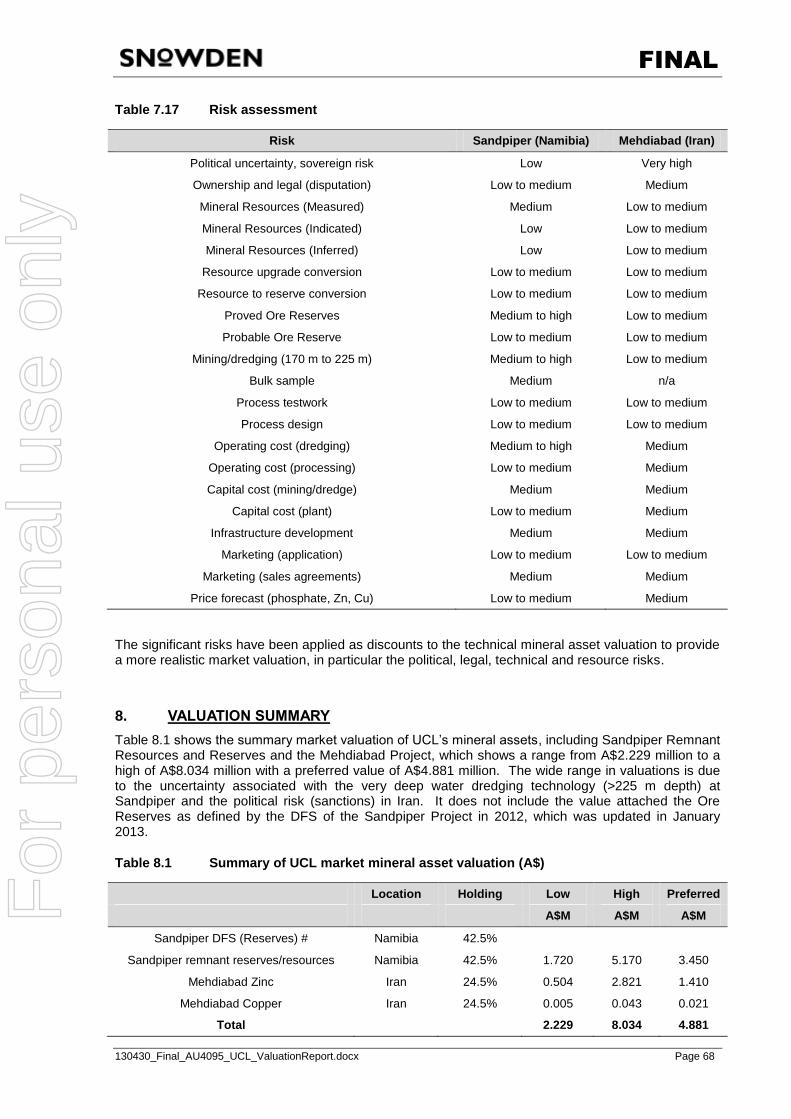
FINAL
130430_Final_AU4095_UCL_ValuationReport.docx Page 68
Table 7.17 Risk assessment
Risk Sandpiper (Namibia) Mehdiabad (Iran)
Political uncertainty, sovereign risk Low Very high
Ownership and legal (disputation) Low to medium Medium
Mineral Resources (Measured) Medium Low to medium
Mineral Resources (Indicated) Low Low to medium
Mineral Resources (Inferred) Low Low to medium
Resource upgrade conversion Low to medium Low to medium
Resource to reserve conversion Low to medium Low to medium
Proved Ore Reserves Medium to high Low to medium
Probable Ore Reserve Low to medium Low to medium
Mining/dredging (170 m to 225 m) Medium to high Low to medium
Bulk sample Medium n/a
Process testwork Low to medium Low to medium
Process design Low to medium Low to medium
Operating cost (dredging) Medium to high Medium
Operating cost (processing) Low to medium Medium
Capital cost (mining/dredge) Medium Medium
Capital cost (plant) Low to medium Medium
Infrastructure development Medium Medium
Marketing (application) Low to medium Low to medium
Marketing (sales agreements) Medium Medium
Price forecast (phosphate, Zn, Cu) Low to medium Medium
The significant risks have been applied as discounts to the technical mineral asset valuation to provide a more realistic market valuation, in particular the political, legal, technical and resource risks.
8. VALUATION SUMMARY Table 8.1 shows the summary market valuation of UCL‟s mineral assets, including Sandpiper Remnant Resources and Reserves and the Mehdiabad Project, which shows a range from A$2.229 million to a high of A$8.034 million with a preferred value of A$4.881 million. The wide range in valuations is due to the uncertainty associated with the very deep water dredging technology (>225 m depth) at Sandpiper and the political risk (sanctions) in Iran. It does not include the value attached the Ore Reserves as defined by the DFS of the Sandpiper Project in 2012, which was updated in January 2013.
Table 8.1 Summary of UCL market mineral asset valuation (A$)
Location Holding Low High Preferred
A$M A$M A$M
Sandpiper DFS (Reserves) # Namibia 42.5%
Sandpiper remnant reserves/resources Namibia 42.5% 1.720 5.170 3.450
Mehdiabad Zinc Iran 24.5% 0.504 2.821 1.410
Mehdiabad Copper Iran 24.5% 0.005 0.043 0.021
Total 2.229 8.034 4.881
For
per
sona
l use
onl
y
FINAL
130430_Final_AU4095_UCL_ValuationReport.docx Page 69
# Grant Thornton Valuation
Snowden notes that the market capitalisation of UCL at the end of March 2013 was A$13 million, coming off a high of A$20 million in 2012. The decrease in value of the company is considered to be due to the reduced price which is related to reduced demand and increased production, the relatively high risk associated with the Sandpiper Project and uncertainties over the Iranian Project. There is also increasing competition from other large phosphate deposits planning to come on stream throughout the world, including Saudi Arabia, Africa and Australia.
9. DECLARATIONS BY SNOWDEN MINING INDUSTRY CONSULTANTS PTY LTD
9.1 INDEPENDENCE
Snowden Mining Industry Consultants Pty Ltd is an independent firm of consultants providing a comprehensive range of specialist technical and financial services to the mining industry in Australia and overseas, through offices in Perth, Brisbane, Johannesburg, Oxford, Vancouver, Calgary and Belo Horizonte (Brazil). Our corporate services include technical audits, project reviews, valuations, independent expert reports, project management plans and corporate advice.
This report was prepared by Mr Terry Parker (Principal Consultant - Corporate) as Principal author with assistance from Mr Mark Burnett (Divisional Manager and Principal Consultant- Geosciences), Mr Jeremy Peters (Principal Consultant – Mining/Geosciences), Mr Murray Lytle (Divisional Manager and Principal Consultant Mining - Calgary) and Dr Nursen Guresin (Senior Consultant – Metallurgy).
Mr Parker is a geologist with over 42 years relevant experience in mining and exploration geological roles and a member (Fellow) of the AusIMM. He has the appropriate qualifications, expertise and experience to undertake this valuation, as required by the Code for the Technical Assessment and Valuation of Mineral and Petroleum Assets and Securities, 2005 (“VALMIN Code”).
Dr Leon Lorenzen (Executive Consultant and Group General Manager – Metallurgy) and Mr Craig Morley (Executive Consultant and CEO) undertook the peer review on the report to ensure it complies with the guidelines as laid down by both the Valmin Code and The Australasian Code for Reporting of Exploration results, Mineral resources and Ore Reserves (JORC 2004).
This report has been prepared independently and the authors do not hold any interest in any of the entities, their related parties, or in any of the mineral properties which are the subject of this report. Fees for the preparation of this report are being charged at Snowden‟s standard rates, whilst expenses are being reimbursed at cost. Payment of fees and expenses is in no way contingent upon the conclusions drawn in this report.
9.2 QUALIFICATIONS
Mr Terry Parker has 42 years‟ experience as a geologist working in Africa, the Middle East and Australia for Anglo American, Rio Tinto, Barrack Mines and Simcoa Operations Pty Ltd. He has worked in exploration and mining for gold, base metals and industrial minerals. He has a Diploma in Surface Mining, Quarry Manager Certificate (WA) and an MBA specialising in mineral economics. He has consulted to the mining industry worldwide for 16 years, including Snowden in Perth (1995 to 1999 and 2010 to 2012) and Snowden in Johannesburg, South Africa (2008 to 2010). He has consulted on a wide range of commodities, including phosphate and participated in numerous technical audits, valuations, independent geologist reports (IGR‟s) and competent person‟s reports (CPR‟s). He has more than five years‟ experience in exploration and mining of bulk commodity and industrial minerals.
Mr Murray Lytle is a fluently bilingual (Spanish, English) mining engineer with over 30 years‟ experience in mining operations, engineering, project management and executive direction of mining and resource companies. Over 10 of those years have been as a consultant to projects in many parts of the world. Murray is a Qualified Person with experience writing Canadian NI 43-101 stock exchange reports.
For
per
sona
l use
onl
y
FINAL
130430_Final_AU4095_UCL_ValuationReport.docx Page 70
Mr Jeremy Peters is a Mining Engineer and Geologist with some 20 years‟ open pit and underground mining experience in gold and base metal mines. He holds Registered Mine Manager certificates for WA and NT. He has significant exploration and mining experience to the level of Exploration Manager and Registered Mine Manager in iron ore, gold, base metals, nickel and industrial minerals in the Pilbara, Yilgarn, Northern Territory, Tasmania and Far North Queensland of Australia. He has undertaken exploration in Papua New Guinea and consulted internationally in both mining and geology in the Mediterranean, Russia, North America, the Philippines and North Africa.
Dr Nursen Guresin is a Metallurgical and Materials Engineer with over 20 years‟ experience in physical, hydrometallurgical and pyro-metallurgical treatment of ores. Her experience covers a wide range of mineral commodities such as gold, silver, nickel, copper, zinc, lead, iron ore, antimony, tungsten, uranium, coal, phosphate and a wide range of traditional or novel processes applied to these commodities.
Mr Mark Burnett Mark has 19 years of experience in mine geology and mineral resource estimation. He specialises in Mineral Resource Management in a production environment and has specific expertises in geological modelling, resource estimation, mine planning, technical reviews and audits, due diligences and grade control. Since joining Snowden in 2007, Mark has worked on various deposit and mineralisation types, including shear zone hosted gold, uranium (granite and calcrete hosted), coal (thermal and metallurgical), phosphate, (sedimentary and hard rock) and base metals.
Mr Craig Morley has a geological background with mining experience underground on Australia‟s Golden Mile in Kalgoorlie as well as in a number of senior positions across Australian Underground and Open Pit operations. Since joining Snowden in 1997 he has consulted on mining and exploration projects throughout Australia, Africa, India, Papua New Guinea, Indonesia, South America, and Canada. His experience ranges from project valuation to mining software systems and databases, across a wide range of commodities. He has completed an MBA and is a Fellow of the Australasian Institute of Mining and Metallurgy. Craig is the CEO of Snowden Mining Industry Consultants and leads a multidisciplinary team with offices in Australia, South Africa, Canada, Brazil and the UK.
Dr Leon Lorenzen has more than 28 years in-depth experience in mineral processing, electrochemistry, reactive systems, hydrometallurgy, waste treatment and biofuels particularly with regard to application of these technologies in the process industries. This includes mainly the metallurgical and mineral processing industries where he spent most of his early career as mineral processing engineer and more recently as Innovation Project Manager, Research Manager and Metallurgical Manager. He also consulted widely for the petrochemical industry and agricultural industry. Throughout his career, Leon has been called upon to act as a consultant on many occasions. He has been a consultant and research manager since 1991, to a range of clients within mainly Africa, Australia and internationally. His range of consultation experience covers all aspects expected from a professional executive consultant. Apart from his practical experience he has published very widely (more than 75 publications) in the chemical engineering and metallurgical engineering literature and presented his work at international forums (more than 200 presentations) over the last 28 years.
9.3 DISCLAIMER
Snowden has relied on the accuracy and completeness of the technical documentation supplied to it by UCL. Snowden has made all reasonable enquiries into the material aspects of the project and makes no warranty or representation as to the accuracy or completeness of the information provided. Furthermore, Snowden accepts no responsibility for the information or statements, opinions, or matters expressed or implied arising out of, contained in, or derived from information contained in this report, unless specifically disclosed by Snowden.
For
per
sona
l use
onl
y
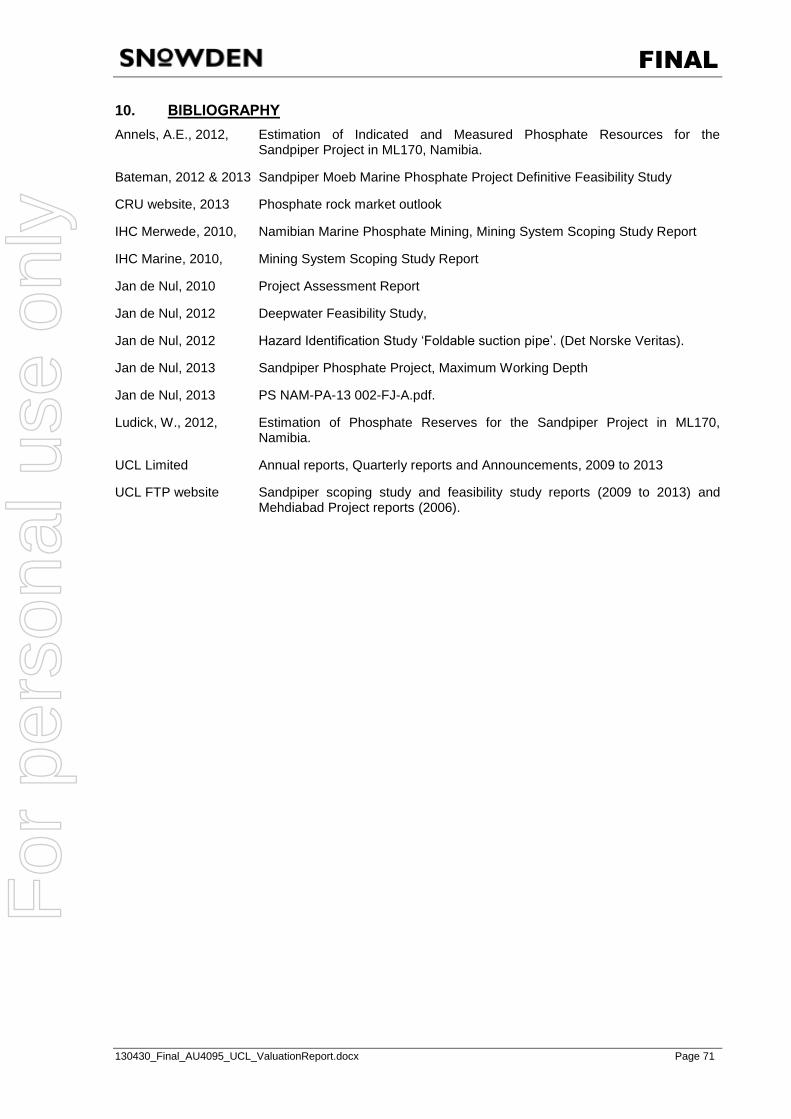
FINAL
130430_Final_AU4095_UCL_ValuationReport.docx Page 71
10. BIBLIOGRAPHY Annels, A.E., 2012, Estimation of Indicated and Measured Phosphate Resources for the
Sandpiper Project in ML170, Namibia.
Bateman, 2012 & 2013 Sandpiper Moeb Marine Phosphate Project Definitive Feasibility Study
CRU website, 2013 Phosphate rock market outlook
IHC Merwede, 2010, Namibian Marine Phosphate Mining, Mining System Scoping Study Report
IHC Marine, 2010, Mining System Scoping Study Report
Jan de Nul, 2010 Project Assessment Report
Jan de Nul, 2012 Deepwater Feasibility Study,
Jan de Nul, 2012 Hazard Identification Study „Foldable suction pipe‟. (Det Norske Veritas).
Jan de Nul, 2013 Sandpiper Phosphate Project, Maximum Working Depth
Jan de Nul, 2013 PS NAM-PA-13 002-FJ-A.pdf.
Ludick, W., 2012, Estimation of Phosphate Reserves for the Sandpiper Project in ML170, Namibia.
UCL Limited Annual reports, Quarterly reports and Announcements, 2009 to 2013
UCL FTP website Sandpiper scoping study and feasibility study reports (2009 to 2013) and Mehdiabad Project reports (2006).
For
per
sona
l use
onl
y
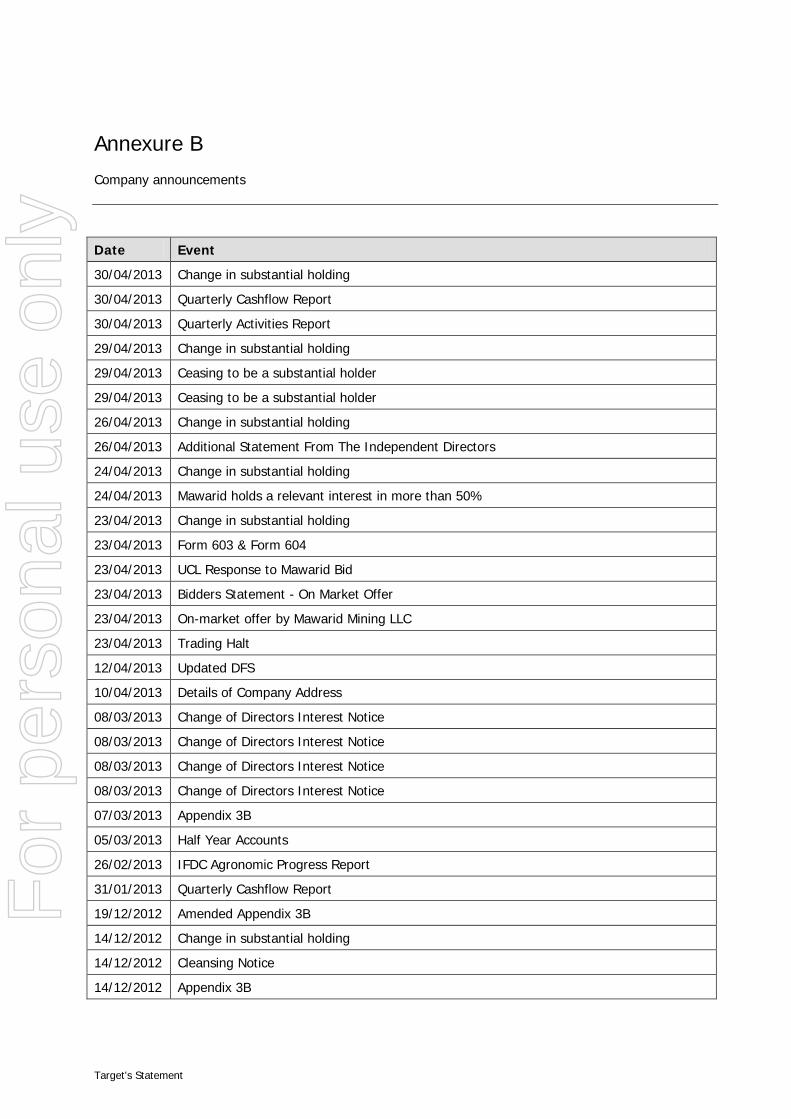
Target's Statement
Annexure B
Company announcements
Date Event
30/04/2013 Change in substantial holding
30/04/2013 Quarterly Cashflow Report
30/04/2013 Quarterly Activities Report
29/04/2013 Change in substantial holding
29/04/2013 Ceasing to be a substantial holder
29/04/2013 Ceasing to be a substantial holder
26/04/2013 Change in substantial holding
26/04/2013 Additional Statement From The Independent Directors
24/04/2013 Change in substantial holding
24/04/2013 Mawarid holds a relevant interest in more than 50%
23/04/2013 Change in substantial holding
23/04/2013 Form 603 & Form 604
23/04/2013 UCL Response to Mawarid Bid
23/04/2013 Bidders Statement - On Market Offer
23/04/2013 On-market offer by Mawarid Mining LLC
23/04/2013 Trading Halt
12/04/2013 Updated DFS
10/04/2013 Details of Company Address
08/03/2013 Change of Directors Interest Notice
08/03/2013 Change of Directors Interest Notice
08/03/2013 Change of Directors Interest Notice
08/03/2013 Change of Directors Interest Notice
07/03/2013 Appendix 3B
05/03/2013 Half Year Accounts
26/02/2013 IFDC Agronomic Progress Report
31/01/2013 Quarterly Cashflow Report
19/12/2012 Amended Appendix 3B
14/12/2012 Change in substantial holding
14/12/2012 Cleansing Notice
14/12/2012 Appendix 3B
For
per
sona
l use
onl
y
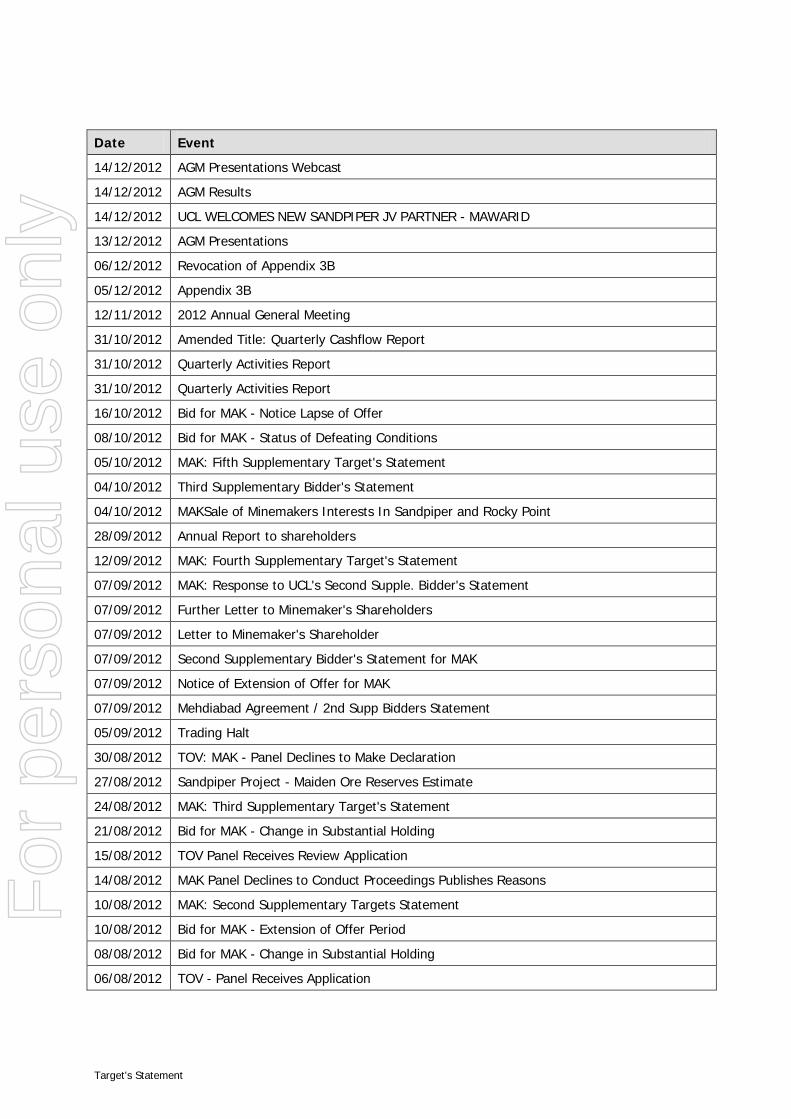
Target's Statement
Date Event
14/12/2012 AGM Presentations Webcast
14/12/2012 AGM Results
14/12/2012 UCL WELCOMES NEW SANDPIPER JV PARTNER - MAWARID
13/12/2012 AGM Presentations
06/12/2012 Revocation of Appendix 3B
05/12/2012 Appendix 3B
12/11/2012 2012 Annual General Meeting
31/10/2012 Amended Title: Quarterly Cashflow Report
31/10/2012 Quarterly Activities Report
31/10/2012 Quarterly Activities Report
16/10/2012 Bid for MAK - Notice Lapse of Offer
08/10/2012 Bid for MAK - Status of Defeating Conditions
05/10/2012 MAK: Fifth Supplementary Target's Statement
04/10/2012 Third Supplementary Bidder's Statement
04/10/2012 MAKSale of Minemakers Interests In Sandpiper and Rocky Point
28/09/2012 Annual Report to shareholders
12/09/2012 MAK: Fourth Supplementary Target's Statement
07/09/2012 MAK: Response to UCL's Second Supple. Bidder's Statement
07/09/2012 Further Letter to Minemaker's Shareholders
07/09/2012 Letter to Minemaker's Shareholder
07/09/2012 Second Supplementary Bidder's Statement for MAK
07/09/2012 Notice of Extension of Offer for MAK
07/09/2012 Mehdiabad Agreement / 2nd Supp Bidders Statement
05/09/2012 Trading Halt
30/08/2012 TOV: MAK - Panel Declines to Make Declaration
27/08/2012 Sandpiper Project - Maiden Ore Reserves Estimate
24/08/2012 MAK: Third Supplementary Target's Statement
21/08/2012 Bid for MAK - Change in Substantial Holding
15/08/2012 TOV Panel Receives Review Application
14/08/2012 MAK Panel Declines to Conduct Proceedings Publishes Reasons
10/08/2012 MAK: Second Supplementary Targets Statement
10/08/2012 Bid for MAK - Extension of Offer Period
08/08/2012 Bid for MAK - Change in Substantial Holding
06/08/2012 TOV - Panel Receives Application
For
per
sona
l use
onl
y
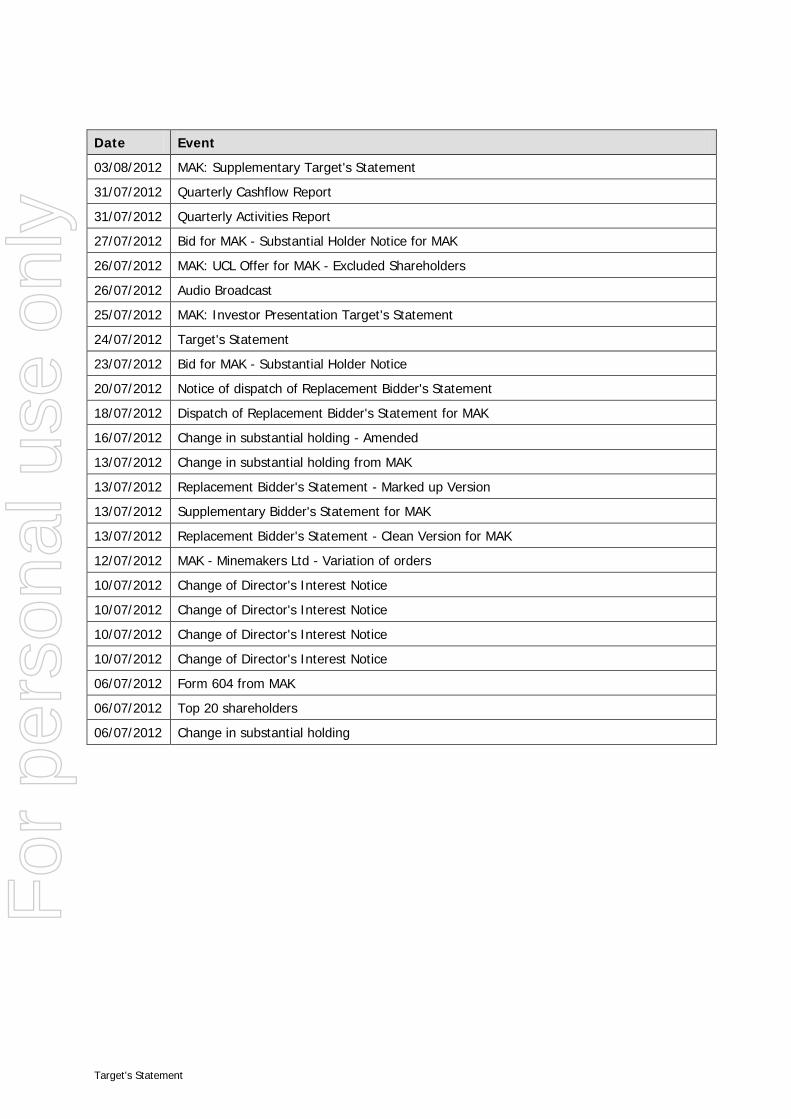
Target's Statement
Date Event
03/08/2012 MAK: Supplementary Target's Statement
31/07/2012 Quarterly Cashflow Report
31/07/2012 Quarterly Activities Report
27/07/2012 Bid for MAK - Substantial Holder Notice for MAK
26/07/2012 MAK: UCL Offer for MAK - Excluded Shareholders
26/07/2012 Audio Broadcast
25/07/2012 MAK: Investor Presentation Target's Statement
24/07/2012 Target's Statement
23/07/2012 Bid for MAK - Substantial Holder Notice
20/07/2012 Notice of dispatch of Replacement Bidder's Statement
18/07/2012 Dispatch of Replacement Bidder's Statement for MAK
16/07/2012 Change in substantial holding - Amended
13/07/2012 Change in substantial holding from MAK
13/07/2012 Replacement Bidder's Statement - Marked up Version
13/07/2012 Supplementary Bidder's Statement for MAK
13/07/2012 Replacement Bidder's Statement - Clean Version for MAK
12/07/2012 MAK - Minemakers Ltd - Variation of orders
10/07/2012 Change of Director's Interest Notice
10/07/2012 Change of Director's Interest Notice
10/07/2012 Change of Director's Interest Notice
10/07/2012 Change of Director's Interest Notice
06/07/2012 Form 604 from MAK
06/07/2012 Top 20 shareholders
06/07/2012 Change in substantial holding
For
per
sona
l use
onl
y