Embed Size (px)
Citation preview
Independent component analysis for preprocessing optical signals in
support of multi-user communication
Federica Avetaa, Hazem H. Refaia, Peter LoPrestib, Sarah A. Tedderc, Bryan L. Schoenholzc
aDepartment of Electrical Engineering, University of Oklahoma, Tulsa, USA
bDepartment of Electrical Engineering, University of Tulsa, Tulsa, USA cNASA Glenn Research Center, Cleveland, Ohio, USA
ABSTRACT
Free Space Optical (FSO) communication is widely recognized for its powerful features, especially when compared to
other wireless technologies utilized in point-to-point communication links. Although current literature focuses primarily
on point-to-point transmission, multi-user FSO systems are beginning to draw significant attention. The primary
objective in a multi-user communication system is to estimate individually transmitted signals from received signals,
namely Blind Source Separation (BSS). A solution to the BSS problem in an FSO multi-user communication link is
proposed. A multi-point FSO system composed of two independent transmitters operating at different wavelengths and a
dual path fiber bundle receiver was used. The FastICA algorithm was exploited for multi-user detection. Experimental
results demonstrate that this method can separate original transmitted signals from their received mixtures. Effects of
signal power, data rate, misalignment error, and turbulence severity on signal separation are also explored to define the
working range for achieving best performance.
Keywords: BSS, ICA, FSO, FastICA
1. INTRODUCTION
Wireless communications have benefitted tremendously from recent technological improvements and enjoyed rapid
growth. Consequently, increasing usage and higher demand for wireless traffic are causing a critical need for increased
bandwidth and capacity. Optical wireless communication (OWC) proves promising for high speed and broadband
connection1 and it offers several advantages over current RF (radio frequency) technology. In particular, Free Space
Optical (FSO) technology has a large optical bandwidth available (e.g. order of THz), allowing much higher data rates
(e.g. actual transmission rate up to 10 Gbps). FSO systems use a highly directional beam with very narrow beam
divergence, offering high security against interception and eavesdropping while also adding robustness to
electromagnetic interference. Furthermore, FSO is a license-free technology requiring less power and mass, which makes
the communication system quickly and easily deployable at a low initial set up cost2.
The increasing demand of mobile platforms and high-speed communication between them requires considerable
improvement over current FSO system designs. Emerging FSO transceivers incorporate different designs (e.g., fiber-
bundle) to enlarge the transceiver’s field of view (FOV)3. While an increased viewer angle reduces errors due to
misalignment between transmitter and receiver, and mitigates the effects of atmospheric turbulence, the wide aperture is
at risk of receiving several optical signals simultaneously. This potential drawback can be leveraged, however, to
implement a FSO multi-point communication link in which users transmit various signals that mix in a propagation
medium and are collected by receivers. Although FSO has enjoyed widespread notoriety in fixed and point-to-point
communication links, its use for multi-user scenarios is limited in current literature4.
Blind Source Separation (BSS) estimates source signals from observed mixtures sans information about the mixing
process and original signals5. Independent Component Analysis (ICA) is the most widely used method for performing
BSS, as it is an unsupervised technique relying on simple assumptions based on signal statistical properties6. Statistically
independent sources are assumed with one Gaussian distribution, at most. ICA is widely used in robotics, biomedical
signal processing, speech processing, and wireless communication. In RF wireless communication, ICA has been used
for wireless sensor networks (WSNs), cognitive radio networks (CRNs), multiple input and multiple output systems
(MIMO), and code division multiple access (CDMA)7. This paper extends the use of ICA in OWC for multi-user
detection in a multi-point system. FastICA, a well-known ICA algorithm, estimates directions for maximizing the
1
https://ntrs.nasa.gov/search.jsp?R=20180004685 2020-04-08T14:39:23+00:00Z

component’s non-Gaussianity by utilizing negentropy or kurtosis as measure of non-Gaussianity. In particular, the
FastICA algorithm is often used in real-world applications due to its high performance and fast convergence.
The FastICA algorithm was leveraged for multiuser detection on a multi-user optical system composed of two
independent optical transmitters operating at 1310 nm and 1550 nm wavelength, two identical receivers (i.e.,
photodetectors), and a free-space turbulence simulation box. After proof of concept for signal separation11, effects of
signal power, data rate, misalignment, turbulence severity on signal separation, and signal demodulation were analyzed.
The balance of this paper is organized as follows. Section 2 describes the ICA statistical method and briefly introduces
the FastICA algorithm used in this work. Section 3 describes the experimental setup and data collection. Section 4 details
the results and offers analyses. Finally, Section 5 concludes the paper and states possible future work.
2. INDEPENDENT COMPONENT ANALYSIS: FASTICA
2.1 Independent Component analysis
The ICA model assumes N transmitters that transmit signals s1(t), s2(t), …, sN(t) and M receivers that observe signals
x1(t), x2(t), …, xM(t), which are linear and instantaneous mixtures of the original sources. Therefore, the ICA model can
be written as follows6:
x = As (1)
where x=[x1, x2, …, xM]T is the observed mixtures vector; s=[s1, s2, …, sN]T is the unknown source signals vector; and
is the m x n unknown mixing matrix. The problem becomes estimating the original components and the matrix by
knowing only the mixed received signals. The model is based on three assumptions. First, original source signals si
should be statistically independent. Second, original sources with only one exception should not have Gaussian
probability distribution, allowing an estimate for mixing matrix . Notably, higher order statistics (HOS) are always zero
for Gaussian distribution. However, these distributions are considered unknown. Third, for simplicity, the mixing matrix
is assumed nonsingular and square (i.e. the number of transmitter is equal to the number of receivers).
When estimating the mixing matrix, its inverse A-1=W is computed, where W represents the un-mixing matrix.
Accordingly, independent components are retrieved, as follows:
s = Wx (2)
This solution is characterized by some ambiguities. The scale ambiguity states that determining independent component
variances is impossible; thus, ambiguities in component magnitude and sign. Given that si and A are unknown, any scalar
multiplied in sources si can be deleted by dividing for respective column ai of A by the same scalar αi:
x =
i
iii
i
sa
1 (3)
Permutation ambiguity states that determining the order of the independent components is impossible. In fact, in Eq. 3 it
is possible to change the order of the terms and to consider any independent component as the first one. Moreover, Eq. 1
can be rewritten, as follows:
x = AP-1Ps (4)
where is the permutation matrix and is its inverse. Thus, elements of are the original independent components in
another order, and is a new unknown mixing matrix. It is important to know that although these ambiguities don’t
represent a crucial problem in the instantaneous ICA model, the affect must be considered and solved for in other
applications (e.g., in convolutive mixtures of source signals where time delays are involved during the mixing process)12.
2.2 FastICA algorithm
The FastICA algorithm is an HOS method for BSS solution that aims to estimate directions for maximizing the non-
Gaussianity of the original components by using a fixed-point iteration scheme. Accordingly, negentropy J is utilized as
a quantitative measure of non-Gaussianity of a random variable13:
J(y) = H(ygauss)-H(y) (5)
2

where H is the differential entropy; y is a random vector; and ygauss is a Gaussian random vector with the same
covariance of y. Since Gaussian variables have the largest entropy among all random variables of equal variance,
negentropy will be zero for variables with Gaussian distributions and non-negative for other distributions. Due to
difficulties associated with computing negentropy, because it requires knowledge of probability distribution function of
the data, approximations were used and were based on non-linear functions G and it is expressed as follows:
J(y) ∝ [E{G(y)-E{G(v)}]2 (6)
where v is a Gaussian variable of zero mean and unit variance, and G is a non-linear function.
The FastICA algorithm works on data requiring a two-step pre-processing. The first is centering (i.e., observed signal, x
is centered by subtracting its mean value). The second is whitening (i.e., centered signal should be linearly transformed
in a white vector whose covariance matrix is the identity matrix). This process lowers solution complexity due to the
reduced number of parameters (i.e.., from n2 to n(n-1)/2). The FastICA algorithm can be applied after pre-processing.
This one-unit algorithm aims to maximize negentropy in Eq. 6, evaluated in y=wTx. Hence, optimum E{G(wTx)} under
constraint E{(wTx)2} =||w||2=1 can be found using the Lagrange function. The final solution is expressed, as follows:
w = E{xg(wTx)}- E{g’(wTx)} w (7)
where g and g’ are the first and second order derivative of G function. This algorithm—compared to other methods—has
several advantages: it is extremely fast converging (e.g., cubic or at least quadratic); it possesses non-Gaussian
distribution; and its distribution estimation is not required.
3. EXPERIMENTAL SETUP
The FSO experimental setup used in the research reported in this paper is shown in Fig. 1.
Figure 1. Depiction of experimental setup
Two independent optical sources were used: a 1550 nm and 1310 nm fiber coupled laser diodes. These diodes were
driven by two independent pseudo-random bit sequences (PRBS) with 231–1 bits in length and various bit rates were
tested. The 1550 nm optical output was connected to a doped fiber optical amplifier, and the 1310 nm to a semiconductor
optical amplifier. The 1310 nm beam traveled parallel to the receiver’s optical axis, and the 1550 nm beam traveled at an
angle of 10 degrees relative to the receiver’s optical axis. This angled transmitter was mounted on a translational
platform for studying signal separation quality in the presence of misalignment errors. The turbulence box was equipped
with an electrical heater and a variable ventilation aperture to control atmospheric turbulence within the box. To
characterize turbulence, a beam profiler (e.g., Spiricon LT665-1550) was used to capture and analyze the beam shape
coming out of the 1550 nm laser diode. Fig. 2 shows two independent transmitters (left) and the fiber bundle based
receiver— a design reported in3 (right). The receiver is composed of a hexagonal array of small lenses (e.g., f=3 mm)
that couple the signal in an array of nineteen fibers (e.g., core diameter 400 μm). Outputs from the array are coupled
through lenses to the collecting area of two photodetectors. The mixed signal was received by the fiber bundle end point
and conveyed to two photodetectors via the fibers. Ten fibers of the bundle were coupled to photodetector one and nine
fibers coupled to photodetector two. A 10° wedge prism was placed in front of the receiving lens array to vary the angle
between the optical signals received by photodiode one and two. Each bundle efficiently collected light over a ±5° range
3

and experienced reduced coupling efficiency beyond this range. Transmitter beam diameters were adjusted such that
optical power coupled efficiently into one set of fibers and coupled inefficiently with a loss into the other set of fibers.
Figure 2. (left) Two independent transmitters and (right) the fiber-bundle receiver.
A National Instruments Virtual Bench, 4-channel oscilloscope was used to record data collected from the two
photodetectors and the transmitted PRBS. The beam profiler Spiricon LT665-1550, consists of a phosphor coated CCD
camera in the NIR wavelengths (i.e., 1440 nm-1605 nm) with an active area of 12.5 mm x 10 mm and pixel pitch of 50
μm. It has a USB 3.0 PC interface that allows the camera to be controlled by the analysis software BeamGage. The beam
profiler was used to compare the laser beam without turbulence with the beam in presence of turbulence.
4. RESULTS
In a previous work, the effectiveness of the FastICA algorithm for signal separation has been reported11. Here, detailed
analysis was performed to understand how signal power, data rate, misalignment errors, and atmospheric turbulence
affect the quality of the signal separation. Two parameters were used for performance evaluation: performance index (PI)
and signal interference ratio (SIR). PI is given by14:
PI =
N
k
pkp
N
i ikN
i
ipp
N
k ik
q
q
q
q
12
1
2
12
1
2
1
max
1
max
(8)
where q is the element of the matrix Q=WA. Given a good separation, PI is near zero. SIR is expressed as follows15:
SIR =
jk
kjjjyEyE
2
),(
2
),(log10
(9)
Eq. 9 indicates the amount of useful signal on the jth channel relative to other components considered as interfering
signals. Hence, a higher value of SIR for the jth channel is desired.
4.1 Power selection
Optical outputs from the two laser diodes were connected to a doped fiber optical amplifier (1550 nm) and to a
semiconductor optical amplifier (1310 nm). The first amplifier has a power range from 6 dBm to 14 dBm, and the second
one from 3 dBm to 15 dBm. To determine power values characterized with the best signal separation, all the power
levels were tested. Initially, 1550 nm output power was set to the highest value, as it was the angled transmitter. The
1310 nm output power range was explored with a step of 3 dBm. After determining the power value while guaranteeing
the lowest PI, the 1310 nm power level was fixed to that level, and the 1550 nm output power was set with step of 2
dBm. Power pair values were found to achieve optimal separation when set to 14 dBm for the 1550 nm transmitter and 9
dBm for the 1310 nm transmitter. These values correspond to the minimum PI measured (e.g., approximately 0.2). This
result is shown in Fig. 3:
1310 nm transmitter
1550 nm transmitter
photodetectors
fiber bundle
wedge prism
4

Figure 3. Power selection: Output power 1550 nm (blue line) and 1310 nm (orange line) versus Performance Index.
These optimum power values were used throughout the experimentation.
4.2 Data Rate
Data rate analysis was limited by the bandwidth of the photodetectors. Hence, testing was limited to 50 Hz – 400 Hz.
Fig. 4 shows results for performance index (PI) and signal interference ratio (SIR) versus data rate.
Figure 4. Performance evaluation: PI (blue line) and SIR (orange line) versus bit rate.
Fig.4 demonstrates how PI decreases and SIR increases up to 150 Hz, and then each trend changes, indicating that the
quality of signal separation increases with bit rate. In fact, quality performances most likely decrease, beyond 150 Hz,
due to slow speed photodetectors.
4.3 Misalignment
Misalignment either severs optical link, if severe, or reduces received optical power. A fiber bundle based receiver is
considered a promising design for mobile FSO communication primarily because the increased FOV reduces the effect
of misalignments on optical link. To test its effect a translational misalignment between the angled transmitter (1550 nm)
and the receiver was adjusted with step of 1 cm until the point at which there was complete misalignment. Fig. 5
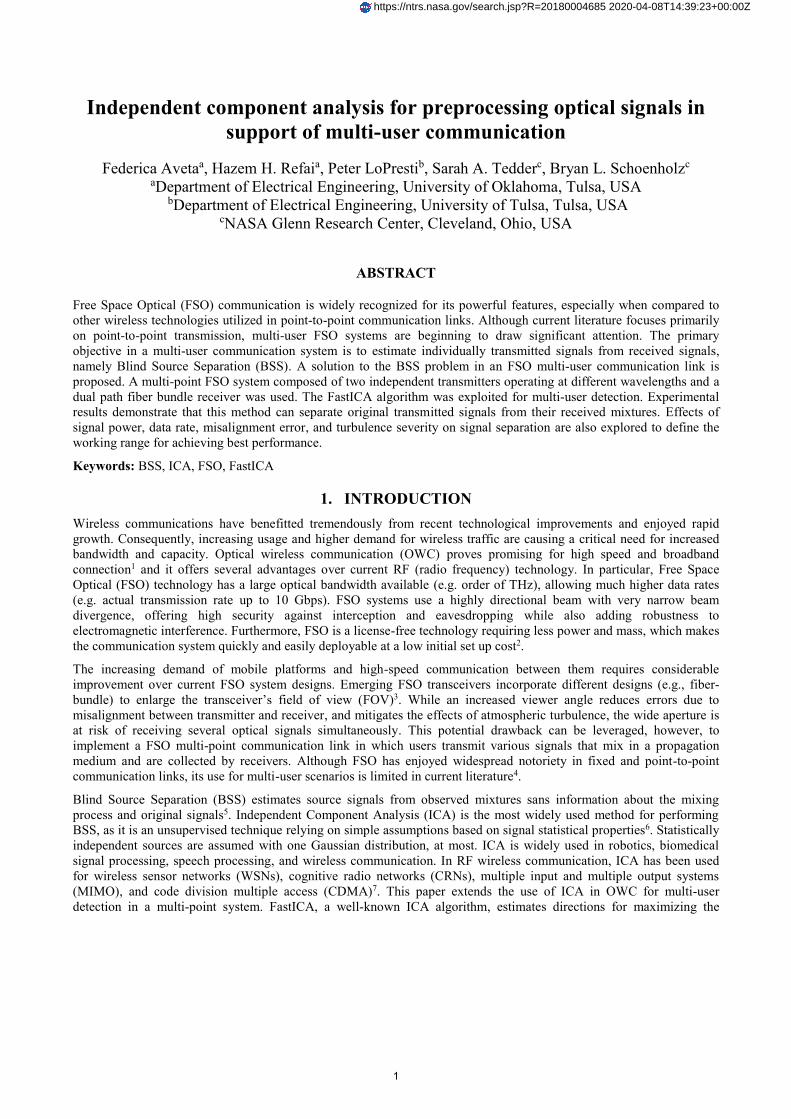
demonstrates separation resulting from a misalignment of 2 cm. Fig. 5 on the left illustrates the received mixed signals
from photodetector one (i.e., green line) and from photodetector two (i.e., cyan line). Fig. 5 on the middle and on the
right, represent the reconstructed source signals (i.e., blue lines) and the original transmitted signals (i.e., red lines).
Notably, although we get a particularly noisy received signal, the algorithm is able to separate the mixed signals. In fact,
both reconstructed signals have the same waveform as the original transmitted sources. Therefore, separation was
considered acceptable even under misalignment conditions (e.g. PI=0.0515 and SIR=18.9038).
5
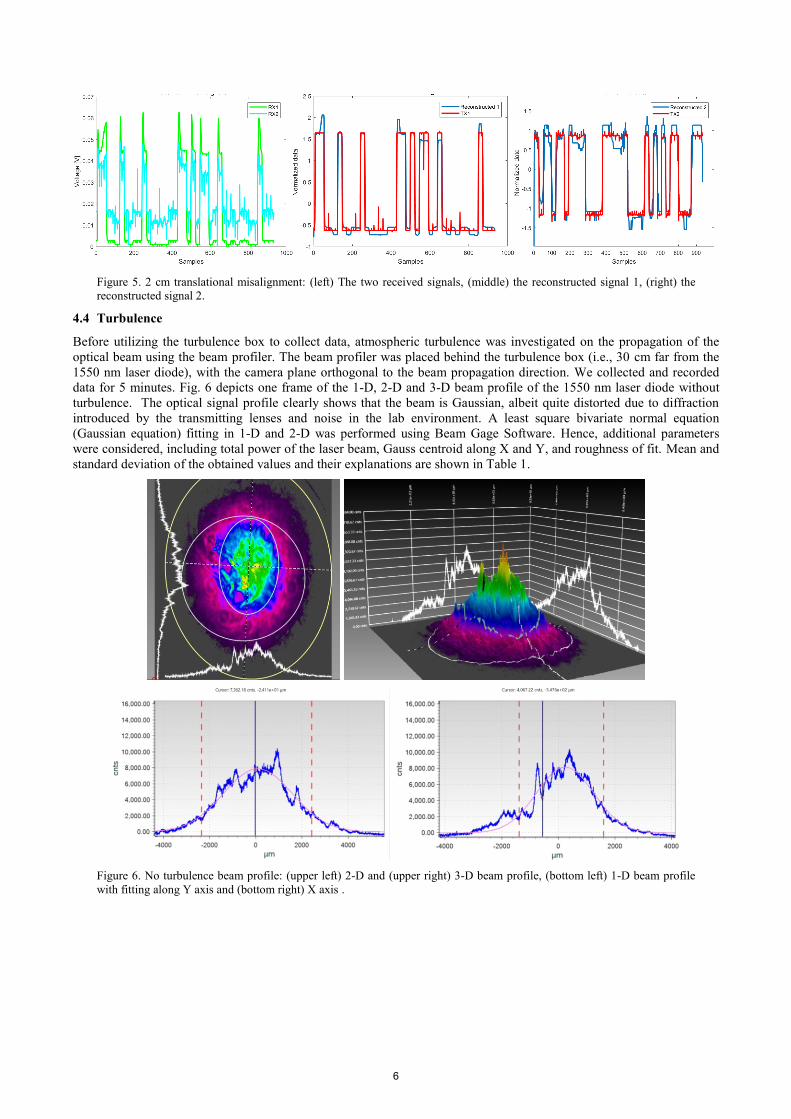
Figure 5. 2 cm translational misalignment: (left) The two received signals, (middle) the reconstructed signal 1, (right) the
reconstructed signal 2.
4.4 Turbulence
Before utilizing the turbulence box to collect data, atmospheric turbulence was investigated on the propagation of the
optical beam using the beam profiler. The beam profiler was placed behind the turbulence box (i.e., 30 cm far from the
1550 nm laser diode), with the camera plane orthogonal to the beam propagation direction. We collected and recorded
data for 5 minutes. Fig. 6 depicts one frame of the 1-D, 2-D and 3-D beam profile of the 1550 nm laser diode without
turbulence. The optical signal profile clearly shows that the beam is Gaussian, albeit quite distorted due to diffraction
introduced by the transmitting lenses and noise in the lab environment. A least square bivariate normal equation
(Gaussian equation) fitting in 1-D and 2-D was performed using Beam Gage Software. Hence, additional parameters
were considered, including total power of the laser beam, Gauss centroid along X and Y, and roughness of fit. Mean and
standard deviation of the obtained values and their explanations are shown in Table 1.
Figure 6. No turbulence beam profile: (upper left) 2-D and (upper right) 3-D beam profile, (bottom left) 1-D beam profile
with fitting along Y axis and (bottom right) X axis .
6
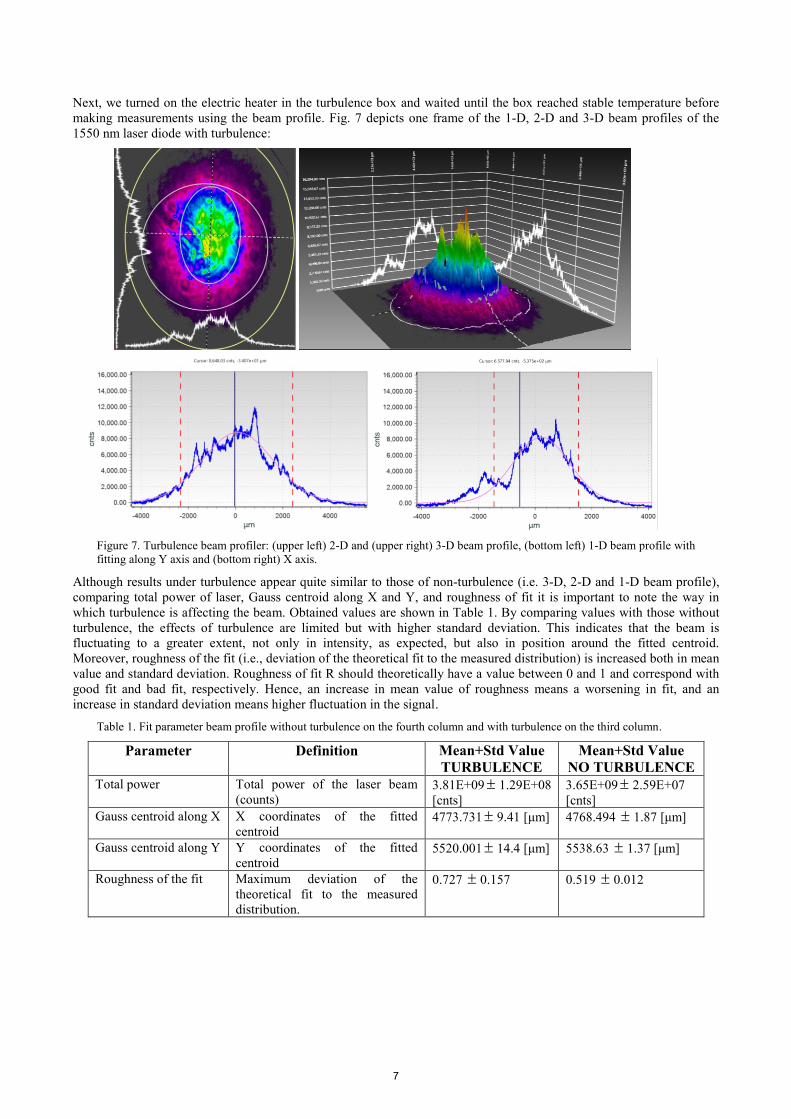
Next, we turned on the electric heater in the turbulence box and waited until the box reached stable temperature before
making measurements using the beam profile. Fig. 7 depicts one frame of the 1-D, 2-D and 3-D beam profiles of the
1550 nm laser diode with turbulence:
Figure 7. Turbulence beam profiler: (upper left) 2-D and (upper right) 3-D beam profile, (bottom left) 1-D beam profile with
fitting along Y axis and (bottom right) X axis.
Although results under turbulence appear quite similar to those of non-turbulence (i.e. 3-D, 2-D and 1-D beam profile),
comparing total power of laser, Gauss centroid along X and Y, and roughness of fit it is important to note the way in
which turbulence is affecting the beam. Obtained values are shown in Table 1. By comparing values with those without
turbulence, the effects of turbulence are limited but with higher standard deviation. This indicates that the beam is
fluctuating to a greater extent, not only in intensity, as expected, but also in position around the fitted centroid.
Moreover, roughness of the fit (i.e., deviation of the theoretical fit to the measured distribution) is increased both in mean
value and standard deviation. Roughness of fit R should theoretically have a value between 0 and 1 and correspond with
good fit and bad fit, respectively. Hence, an increase in mean value of roughness means a worsening in fit, and an
increase in standard deviation means higher fluctuation in the signal.
Table 1. Fit parameter beam profile without turbulence on the fourth column and with turbulence on the third column.
Parameter Definition Mean+Std Value
TURBULENCE
Mean+Std Value
NO TURBULENCE
Total power Total power of the laser beam
(counts) 3.81E+09 1.29E+08
[cnts]
3.65E+09 2.59E+07
[cnts]
Gauss centroid along X X coordinates of the fitted
centroid 4773.731 9.41 [μm] 4768.494 1.87 [μm]
Gauss centroid along Y Y coordinates of the fitted
centroid 5520.001 14.4 [μm] 5538.63 1.37 [μm]
Roughness of the fit Maximum deviation of the
theoretical fit to the measured
distribution.
0.727 0.157 0.519 0.012
7

Although the box introduced atmospheric turbulence, visible in the higher fluctuation of the laser beam, it can be
considered as a small turbulence level.
Figure 8. Turbulence case: (left) The two received signals, (middle) the reconstructed signal 1, (left) the reconstructed signal
2.
FastICA was again applied to test for signal separation under turbulence conditions. Fig. 8 illustrates one frame of the
collected data. The left graph shows the received mixed signals from photodetector one (i.e., green line) and from
photodetector two (i.e., cyan line) in the presence of turbulence; the middle and right graphs show the reconstructed
source signals (i.e., blue lines) and the original transmitted signals (i.e., red lines). Notably, signal separation was
acceptable even under turbulent conditions (e.g. PI=0.1916 and SIR=13.2916).
5. CONCLUSION
Independent Component Analysis (ICA) is an unsupervised signal processing technique widely used in wireless
communication for a variety of applications. In this work, the FastICA algorithm—one of the most widely used for blind
source separation—was employed for multi-user detection in an FSO communication link. The FSO system was
composed of two independent transmitters, a dual path fiber bundle receiver and a turbulence box, that simulated
atmospheric turbulence. Effects of varying power level, data rate, misalignment degree, and turbulence level were
investigated. After having determined the optimum value for transmitted power and data rate, ICA proved suitable for
source separation even in presence of translational misalignment and small atmospheric turbulence. Results confirm a
method that can be successfully implemented for FSO multi-user communication. Although higher turbulence levels
should be investigated in future work.
One of the most important conditions of ICA is that the number of receivers should equal the number of transmitters.
Unfortunately, real source separation problems do not always satisfy this constraint. In fact, the number of transmitters is
often greater than the number of receivers (i.e., an over-complete ICA). The algorithms used for over-complete ICA are
based on the guiding assumption that source signals are sparse16. Since this assumption doesn’t hold in our case,
overcomplete ICA algorithms cannot be used to solve our hypothetical problem. Hence, new techniques or algorithms
should be introduced to solve a multi-user communication problem when the number of transmitters is greater than the
number of receivers.
Furthermore, future work will extend results obtained with ICA in other applications. For example, the ICA algorithm
can be leveraged for sensing in a cognitive free space link. Although the number of source signals must be known to
perform the ICA algorithm, the number of users can change dynamically. Hence, receiver can be used to estimate the
number of users attempting to transmit information and several estimation techniques have been proposed7. This
proposed work warrants further exploration, despite the work detailed in this paper proves that the ICA algorithm is a
valuable and promising unsupervised technique to accomplish such a goal.
REFERENCES
[1] M. A. Khalighi and M. Uysal, “Survey on Free Space Optical Communication: A Communication Theory
Perspective,” IEEE Commun. Surv. Tutorials, vol. 16, no. 4, pp. 2231–2258, 2014.
[2] H. Kaushal and G. Kaddoum, “Optical communication in space: Challenges and mitigation techniques,” IEEE
8

Commun. Surv. Tutorials, vol. 19, no. 1, pp. 57–96, 2017.
[3] P. LoPresti, N. Hutchins, S. Kohrmann, M. F. Babelli, and H. H. Refai, “Wavelength dependence of a fiber-
bundle based FSO link,” in Globecom Workshops (GC Wkshps), 2014, 2014, pp. 493–498.
[4] T. Rakia, F. Gebali, H.-C. Yang, and M.-S. Alouini, “Throughput analysis of point-to-multi-point hybric
FSO/RF network,” in Communications (ICC), 2017 IEEE International Conference on, 2017, pp. 1–6.
[5] P. Comon and C. Jutten, Handbook of Blind Source Separation: Independent component analysis and
applications. Academic press, 2010.
[6] A. Hyvärinen and E. Oja, “Independent component analysis: algorithms and applications,” Neural networks, vol.
13, no. 4, pp. 411–430, 2000.
[7] Z. Uddin, A. Ahmad, M. Iqbal, and M. Naeem, “Applications of independent component analysis in wireless
communication systems,” Wirel. Pers. Commun., vol. 83, no. 4, pp. 2711–2737, 2015.
[8] T.-W. Lee, M. Girolami, and T. J. Sejnowski, “Independent component analysis using an extended infomax
algorithm for mixed subgaussian and supergaussian sources,” Neural Comput., vol. 11, no. 2, pp. 417–441, 1999.
[9] J. R. Hershey and P. A. Olsen, “Approximating the Kullback Leibler divergence between Gaussian mixture
models,” in Acoustics, Speech and Signal Processing, 2007. ICASSP 2007. IEEE International Conference on ,
2007, vol. 4, p. IV-317.
[10] D. N. Rutledge and D. J.-R. Bouveresse, “Independent components analysis with the JADE algorithm,” TrAC
Trends Anal. Chem., vol. 50, pp. 22–32, 2013.
[11] F. Aveta, H. H. Refai, and P. LoPresti, “Multi-user FSO communication link,” in 2017 Cognitive
Communications for Aerospace Applications Workshop (CCAA), 2017, pp. 1–5.
[12] P. Xie and S. L. Grant, “A Fast and Efficient Frequency-Domain Method for Convolutive Blind Source
Separation,” in 2008 IEEE Region 5 Conference, 2008, pp. 1–4.
[13] A. Hyvarinen, “Fast and robust fixed-point algorithms for independent component analysis,” IEEE Trans.
Neural Networks, vol. 10, no. 3, pp. 626–634, 1999.
[14] H. Kasturiwale and Z. Mizwan, “Comparison and Performance Analysis of various ICA Algorithms for ECG
signals,” Int. J. Eng. Res. Technol., vol. 3, no. 4, 2014.
[15] D. Vigliano, M. Scarpiniti, R. Parisi, and A. Uncini, “Flexible ICA approach to the nonlinear blind signal
separation in the complex domain,” in 2006 14th European Signal Processing Conference, 2006, pp. 1–5.
[16] G. R. Naik and D. K. Kumar, “An overview of independent component analysis and its applications,”
Informatica, vol. 35, no. 1, 2011.
9