Embed Size (px)
Citation preview
Independent Brewing Industry National Economic Evaluation A
Independent Brewing Industry National Economic Evaluation
Prepared for Independent Brewers Association
by Essential Economics Pty Ltd

AUTHORSHIP
Report stage Author Date Review Date
Draft reportJohn Noronha
Julie Lim20 January 2017 John Henshall 23 January 2017
Final report John Noronha 26 June 2017
DISCLAIMER
Every effort has been made to ensure the accuracy of the material and the integrity of the analysis presented in this
report. However, Essential Economics Pty Ltd accepts no liability for any actions taken on the basis of report contents.
CONTACT DETAILS
For further details please contact Essential Economics Pty Ltd at one of our offices:
96 Pelham Street
Carlton
Victoria 3053
Australia
PH +61 3 9347 5255
FAX +61 3 9347 5355
Level 26 / 44 Market Street
Sydney
New South Wales 2000
Australia
PH +61 2 9089 8654
EMAIL [email protected]
WEB www.essentialeconomics.com
ABN 92 079 850 427
Our Reference: 16174

Executive Summary ........................................................................................1
Introduction ....................................................................................................4
1 National Independent Brewing Industry Profile .................................6
1.1 Existing Industry Overview ................................................................................................................6
1.2 Location of Businesses .......................................................................................................................11
1.3 Industry Trend Analysis ......................................................................................................................12
1.4 Summary...................................................................................................................................................... 13
2 Economic Evaluation Framework .......................................................14
2.1 Industry Survey .......................................................................................................................................14
2.2 Brewer Typologies ................................................................................................................................. 15
2.3 Economic Indicators ............................................................................................................................ 15
2.4 Summary......................................................................................................................................................17
3 Economic Impact Analysis ...................................................................18
3.1 Capital Investment ................................................................................................................................18
3.2 Employment .............................................................................................................................................. 19
3.3 Wages ............................................................................................................................................................22
3.4 Production Volumes .............................................................................................................................22
3.5 Sales Volumes and Revenues .........................................................................................................23
3.6 Economic Output and Value Added ............................................................................................26
3.7 Excise Revenue to Government ....................................................................................................27
3.8 Impacts on the Visitor Economy...................................................................................................27
3.9 Conclusions ................................................................................................................................................30
4 Benchmarking Analysis .......................................................................31
4.1 Alcohol Excise Tax ..................................................................................................................................31
4.2 Government Funding Support in Other Countries ............................................................33
4.3 Conclusions ................................................................................................................................................35
5 Industry Constraints to Growth .........................................................36
5.1 Key Constraints .......................................................................................................................................36
5.2 Business Comments .............................................................................................................................39
5.3 Conclusions ................................................................................................................................................39
6 How Government Support Can Benefit Industry Development ........40
6.1 Key Potential Benefits .........................................................................................................................40
6.2 Business Comments .............................................................................................................................42
6.3 Potential Industry Excise Reforms ..............................................................................................43
6.4 Conclusions ................................................................................................................................................44
Independent Brewing Industry National Economic Evaluation
Contents
Independent Brewing Industry National Economic Evaluation 1
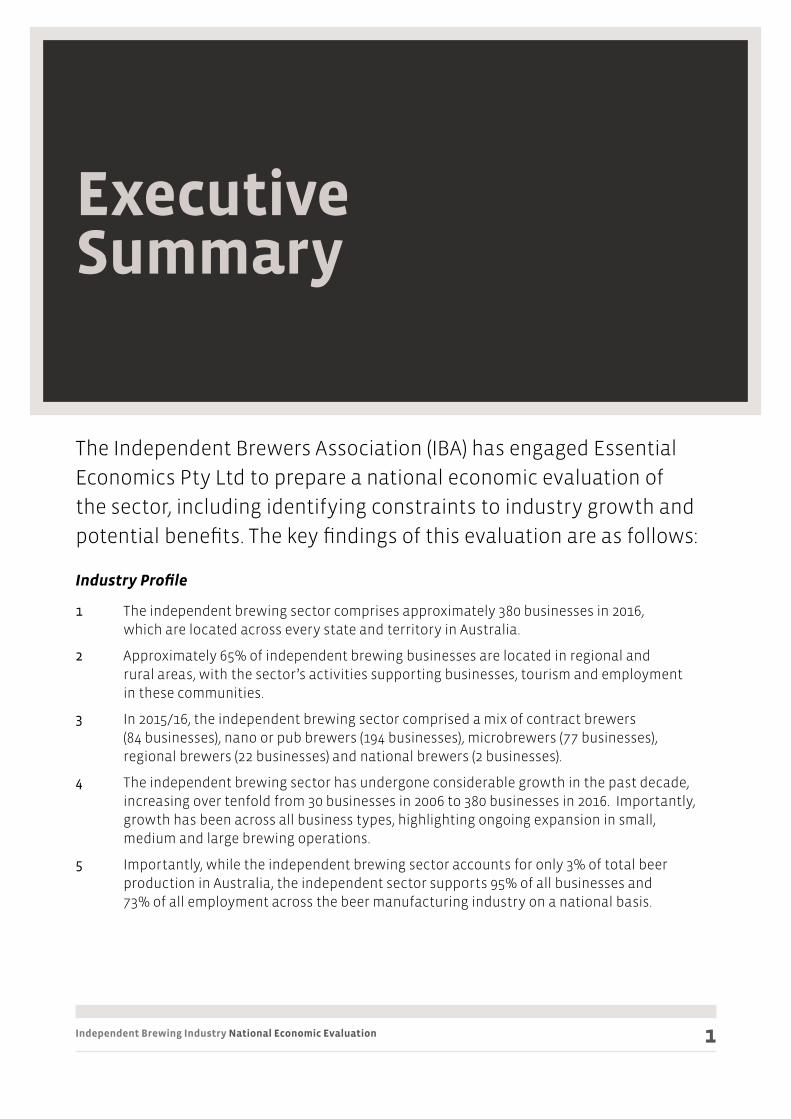
The Independent Brewers Association (IBA) has engaged Essential
Economics Pty Ltd to prepare a national economic evaluation of
the sector, including identifying constraints to industry growth and
potential benefits. The key findings of this evaluation are as follows:
Industry Profile
1 The independent brewing sector comprises approximately 380 businesses in 2016, which are located across every state and territory in Australia.
2 Approximately 65% of independent brewing businesses are located in regional and rural areas, with the sector’s activities supporting businesses, tourism and employment in these communities.
3 In 2015/16, the independent brewing sector comprised a mix of contract brewers (84 businesses), nano or pub brewers (194 businesses), microbrewers (77 businesses), regional brewers (22 businesses) and national brewers (2 businesses).
4 The independent brewing sector has undergone considerable growth in the past decade, increasing over tenfold from 30 businesses in 2006 to 380 businesses in 2016. Importantly, growth has been across all business types, highlighting ongoing expansion in small, medium and large brewing operations.
5 Importantly, while the independent brewing sector accounts for only 3% of total beer production in Australia, the independent sector supports 95% of all businesses and 73% of all employment across the beer manufacturing industry on a national basis.
Executive Summary
Independent Brewing Industry National Economic Evaluation 2
Economic Impact Analysis
In 2015/16, the Australian independent brewing sector:
6 Invested $105 million in plant, machinery, vehicles and other capital items to support business operations, which provided flow-on business and employment benefits in other sectors of the economy.
7 Employed 2,390 Full Time Equivalent (FTE) workers, with the sector’s activities supporting a further 17,210 FTE jobs in the wider economy across a range of sectors.
8 Paid approximately $90 million directly in wages, thereby supporting businesses and jobs in locations where independent brewing workers live through local spending benefits.
9 Produced 59 million litres of beer, generating $275 million in sales revenues.
10 Generated $740 million in economic output, $300 million of which was value-added output.
11 Contributed $74 million in excise duty to the Federal Government.
12 Continued to support the visitor economy through investment in tourism infrastructure and events/activities, providing direct and indirect visitor spending benefits to the communities in which independent brewing businesses are located, including many regional (ie regional cities/country towns) and rural (remote) areas.
Benchmarking Analysis
13 Australia has one of the highest alcohol excise tax rates in the world (54c per standard drink of alcohol), and excise rates are considerably higher than in comparable countries such as Canada (37c), New Zealand (26c), USA (28c) and the UK (35c).
14 Relatively modest specific funding is currently available in Australia to support the growth of the independent brewing sector. In other countries, grants are available to assist with buildings, plant and machinery and access to markets. However, in recent times the state of Victoria has recognised the potential for the independent brewing industry to create jobs in rural and regional areas, particularly in tourism and hospitality. The Victorian Government in 2016-7 has committed almost $4 million from its Regional Tourism Infrastructure Fund to the following projects:
– $1.5 million towards the Holgate Group Historic Hotel and Brewery Discovery Centre expansion
– $1.49 million towards the relocation and expansion of the Forrest Brewing Company; and
– $500,000 towards the development of the Australian Craft Beer Centre of Excellence in Ballarat
Executive Summary

Independent Brewing Industry National Economic Evaluation 3
Constraints to Industry Growth
Key constraints to industry growth, as identified though the IBA Annual Survey 2016, are:
15 High excise rates compared to other alcohol products, and especially when benchmarked against other countries.
16 Cash flow issues, often relating to the scale and timing of excise payments.
17 Access to markets, especially difficulty securing taps and shelf space for some brewers.
18 Planning delays relating to council permits, liquor licencing, and taxation matters which negatively impact (especially in time delays) on business planning and operations.
19 High freight, logistics and distribution costs, recognising many establishments are located in regional and rural areas therefore requiring long travel distances to get product to major markets.
Potential Benefits of Government Support
Potential benefits from government policy and funding support, as identified though the IBA Annual Survey 2016, are:
20 Increased employment generation across a wide range of activities such as brewing, sales, marketing etc.
21 Uplift in capital investment for infrastructure associated with plant and machinery, cellar doors, brewpubs etc.
22 Increase in production levels and improved brewing efficiencies.
23 Improved product quality and increased product range.
24 Better efficiencies in the distribution of product to market.
25 New investment in energy efficient technologies which will increase business viability and improve environmental outcomes.
Potential Excise Reforms
26 Potential government support to assist the independent brewing industry includes a range of excise reforms such as:
– increasing the brewery tax refund, to allow operators to reduce costs and reinvest in their business
– indexing the brewery tax refund to ensure the refund aligns with the timing and level of increases in excise rates
– extending the excise settlement period to allow businesses to better manage cash flow
– bringing the excise rate on 30 litre kegs of beer into line with the rate applied to 50 litre kegs, which will improve workplace health and safety outcomes, reduce shipping costs and allow greater flexibility in supplying smaller venues.
Executive Summary
Independent Brewing Industry National Economic Evaluation 4
Background
The Independent Brewers Association (IBA) has engaged Essential Economics Pty Ltd to prepare a national economic evaluation of the sector.
The IBA is a national body, which represents the Australian independent brewing industry. An Independent Brewer produces less than 40 million litres per annum, and has no more than 20% ownership by any other brewer that produces more than 40 million litres.
The independent brewing industry is a strong growth sector expanding over the past decade from just 30 businesses in 2006 to approximately 380 businesses in 2016.
This tenfold increase in business growth, which has been achieved with little government support, has led to a situation where independent brewing businesses account for approximately 95% of the total number of Australian brewers, highlighting the importance to the economy of this small business driven sector.
In order to continue to grow the independent brewing sector in line with similar examples overseas, improved government support is required in terms of current tax settings with regard to lowering excise levels and providing subsidies similar to those assisting small wine producers under the Wine Equalisation Tax (WET) rebate.
Importantly, the 2016 Federal Budget announced a proposed amendment to the WET rebate, based on a reduction in the rebate (over two years) from the current level of $500,000 per entity to $350,000 per entity. This change to WET rebate will save the Federal Government a significant amount of revenue over four years, and the IBA are advocating for a proportion of these savings to be diverted to supporting independent brewers. This availability of funds would improve the ability of independent brewers to invest in their businesses and generate additional growth outcomes in their local economies (which are principally regional areas).
Introduction
Independent Brewing Industry National Economic Evaluation 5
Objective
The objectives of this report are:
• To prepare a robust economic evaluation of Australia’s independent brewing industry which clearly shows the economic importance and value of the independent brewing sector to national, regional and local economies
• To identify existing constraints to industry growth
• To highlight potential business and industry benefits arising from government support.
This Report
This report contains the following chapters:
1 National Independent Brewing Industry – Provides an overview of the industry, including location of businesses, business mix by brewer type, profiles of the sector in each state and territory, and industry growth trends.
2 Economic Evaluation Framework – Presents the methodology used to evaluate the economic impacts of the sector. The framework includes capital investment, employment, production values, sales revenues, gross and value-added output, excise tax revenues accruing to government, and visitor economy impacts.
3 Economic Impact Analysis – Provides national aggregate-level economic impact assessment of key economic indicators based on the Evaluation Framework.
4 Benchmarking Analysis – Compares Australian alcohol excise rates against rates levied in other countries and highlights government support initiatives for the independent brewing industry in other countries.
5 Industry Constraints to Growth – Highlights barriers to growth from a business and industry perspective, based on stakeholder feedback.
6 How Government Support Can Benefit Industry Development – Presents stakeholder feedback on potential uses/benefits of government financial support to assist in growth businesses and the industry more generally, and identifies potential government excise reforms to support industry investment, output and employment.
Introduction
Independent Brewing Industry National Economic Evaluation 6
1.1 Existing Industry Overview
Businesses by Type
The IBA defines brewers as follows:
• Contract brewer – Brewers that do not own a brewery or have an excise licence.
• Nano or pub brewer – Small-scale independent breweries with volumes of up to 49,999 litres per annum (pa).
• Microbrewer – Small-scale independent breweries with volumes of 50,000-299,999 litres pa.
• Regional brewer – Independent breweries that have a strong regional base with volumes of 300,000-4,999,999 litres pa.
• National brewer – Independent breweries with a strong presence in all markets with volumes of 5 million-40 million litres pa.
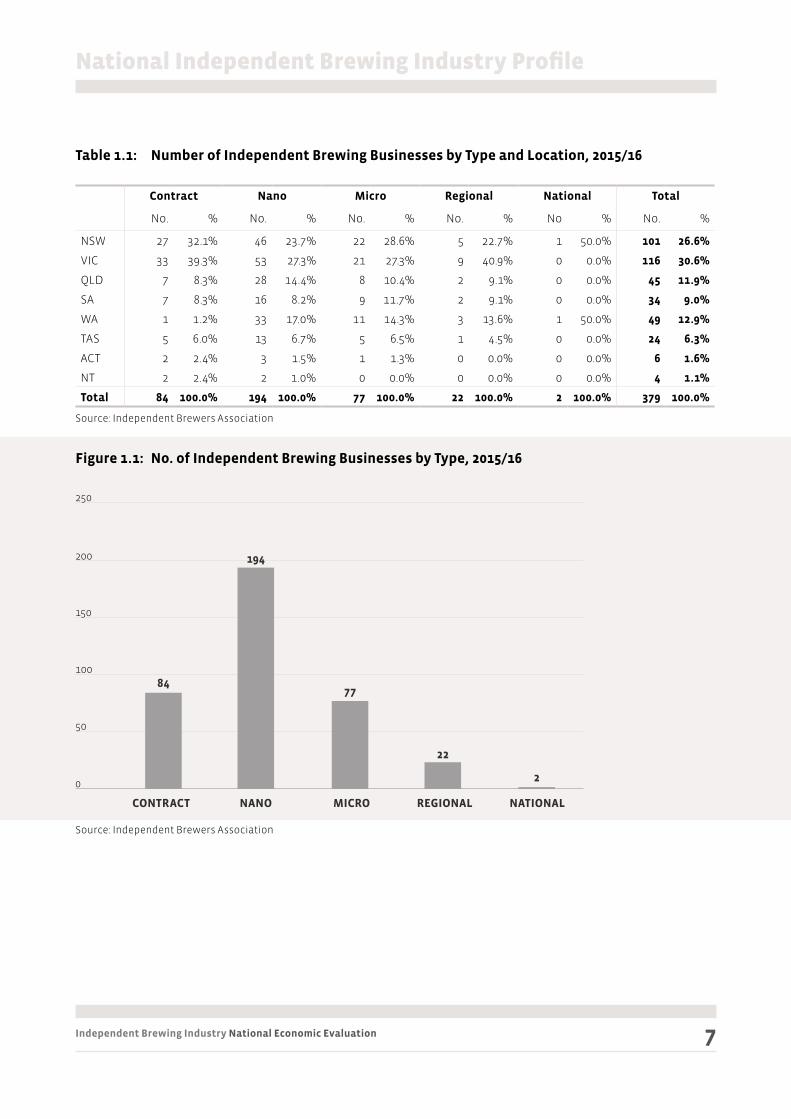
A total of 379 independent brewing businesses were in operation across Australia in 2015/16. As Table 1.1 and Figure 1.1 show, these businesses comprised 84 contract brewers (or 22% of businesses), 194 nano brewers (51%), 77 micro brewers (20%), 16 regional brewers (6%) and two national brewers (1%).
Victoria (31% of businesses) and NSW (27%) are hosts to approximately six out of ten independent brewing businesses across Australia, with WA (13%) and Queensland (12%) being other important national industry locations.
1 National Independent Brewing Industry Profile
Independent Brewing Industry National Economic Evaluation 7
Table 1.1: Number of Independent Brewing Businesses by Type and Location, 2015/16
Contract Nano Micro Regional National Total
No. % No. % No. % No. % No % No. %
NSW 27 32.1% 46 23.7% 22 28.6% 5 22.7% 1 50.0% 101 26.6%
VIC 33 39.3% 53 27.3% 21 27.3% 9 40.9% 0 0.0% 116 30.6%
QLD 7 8.3% 28 14.4% 8 10.4% 2 9.1% 0 0.0% 45 11.9%
SA 7 8.3% 16 8.2% 9 11.7% 2 9.1% 0 0.0% 34 9.0%
WA 1 1.2% 33 17.0% 11 14.3% 3 13.6% 1 50.0% 49 12.9%
TAS 5 6.0% 13 6.7% 5 6.5% 1 4.5% 0 0.0% 24 6.3%
ACT 2 2.4% 3 1.5% 1 1.3% 0 0.0% 0 0.0% 6 1.6%
NT 2 2.4% 2 1.0% 0 0.0% 0 0.0% 0 0.0% 4 1.1%
Total 84 100.0% 194 100.0% 77 100.0% 22 100.0% 2 100.0% 379 100.0%
Source: Independent Brewers Association
Figure 1.1: No. of Independent Brewing Businesses by Type, 2015/16
Source: Independent Brewers Association
National Independent Brewing Industry Profile
0
50
100
150
200
250
84
CONTRACT
194
NANO
77
MICRO
22
REGIONAL
2
NATIONAL

Independent Brewing Industry National Economic Evaluation 8
0
5
10
15
20
25
30
35
40
45%
32%
39%
8% 8%
1%
6%
2% 2%
NSW VIC QLD SA WA Tas ACT NT
Contract
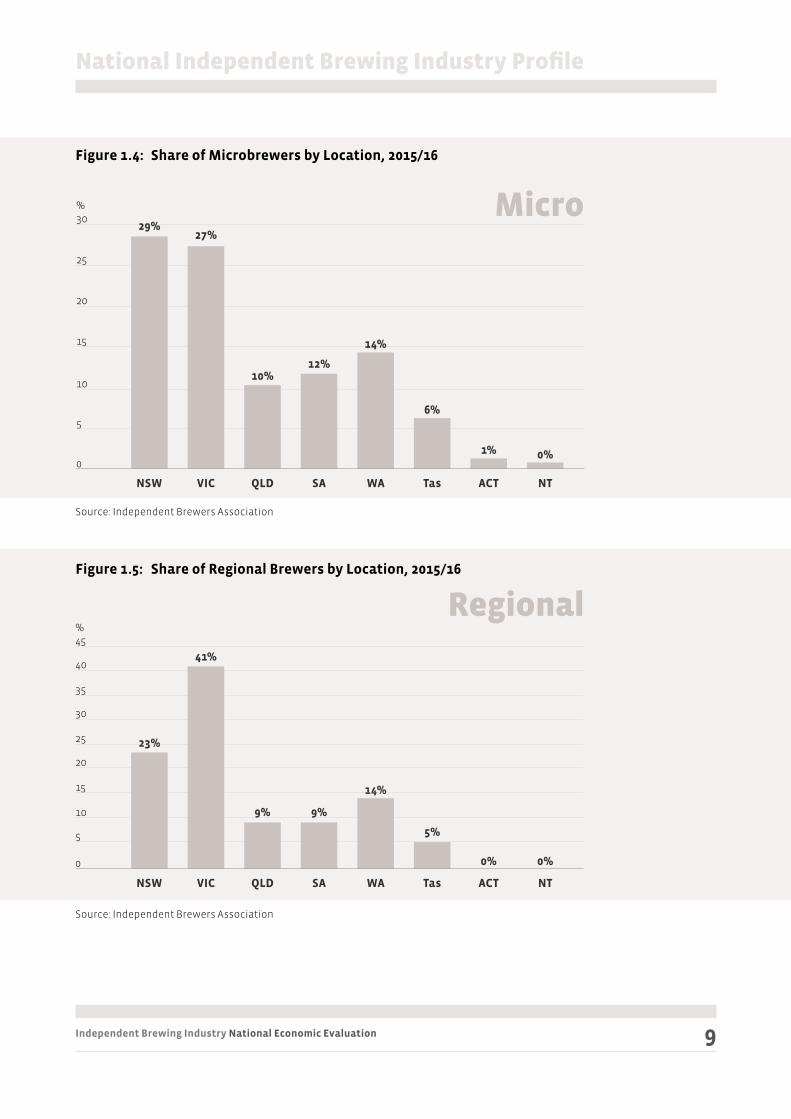
Figures 1.2 to 1.6 provide the share of businesses by state and territory based on business type, while Figure 1.7 provides an overview of business mix for each state and territory.
Figure 1.2: Share of Contract Brewers by Location, 2015/16
Source: Independent Brewers Association
Figure 1.3: Share of Nano Brewers by Location, 2015/16
Source: Independent Brewers Association
National Independent Brewing Industry Profile
0
5
10
15
20
25
30%
24%
27%
14%
8%
17%
7%
2%1%
NSW VIC QLD SA WA Tas ACT NT
Nano
Independent Brewing Industry National Economic Evaluation 9
Figure 1.4: Share of Microbrewers by Location, 2015/16
Source: Independent Brewers Association
Figure 1.5: Share of Regional Brewers by Location, 2015/16
Source: Independent Brewers Association
National Independent Brewing Industry Profile
0
5
10
15
20
25
30%
23%
29%
41%
27%
9%
10%
9%
12%
14%
14%
5%
6%
0%
1%
0%
0%
NSW
NSW
VIC
VIC
QLD
QLD
SA
SA
WA
WA
Tas
Tas
ACT
ACT
NT
NT
Regional
Micro
0
5
10
15
20
25
30
35
40
45%

Independent Brewing Industry National Economic Evaluation 10
Figure 1.6: Share of National Brewers by Location, 2015/16
Source: Independent Brewers Association
Figure 1.7: Independent Brewing Business Mix by Location, 2015/16
Source: Independent Brewers Association
National Independent Brewing Industry Profile
50%
0% 0% 0%
50%
0% 0% 0%
NSW VIC QLD SA WA Tas ACT NT
National
0
10
20
30
40
60
50
%
0 10 20 30 40 50
National
Regional
Micr0
Nano
Contract
1
5
22
48
27
0 5
0.5
10
1
15
1.5
25
2.5
35
National
Regional
Micr0
Nano
Contract
1
3
12
33
1
0 5 10 15 25 30
National
Regional
Micr0
Nano
Contract
20
0
2
8
28
7
0 3.5
National
Regional
Micr0
Nano
Contract
0
0
1
3
2
0 10 20 30 5040 60
National
Regional
Micr0
Nano
Contract
0
9
21
53
33
0 2 4 6 108 12 14
National
Regional
Micr0
Nano
Contract
0
1
5
13
5
0 5 10 15 20
National
Regional
Micr0
Nano
Contract
0
2
9
16
7
0 0.5 1 1.5 2 2.5
National
Regional
Micr0
Nano
Contract
0
0
0
2
2
NSW VIC
QLD SA
WA TAS
ACT NT
20
2
30
3
Independent Brewing Industry National Economic Evaluation 11
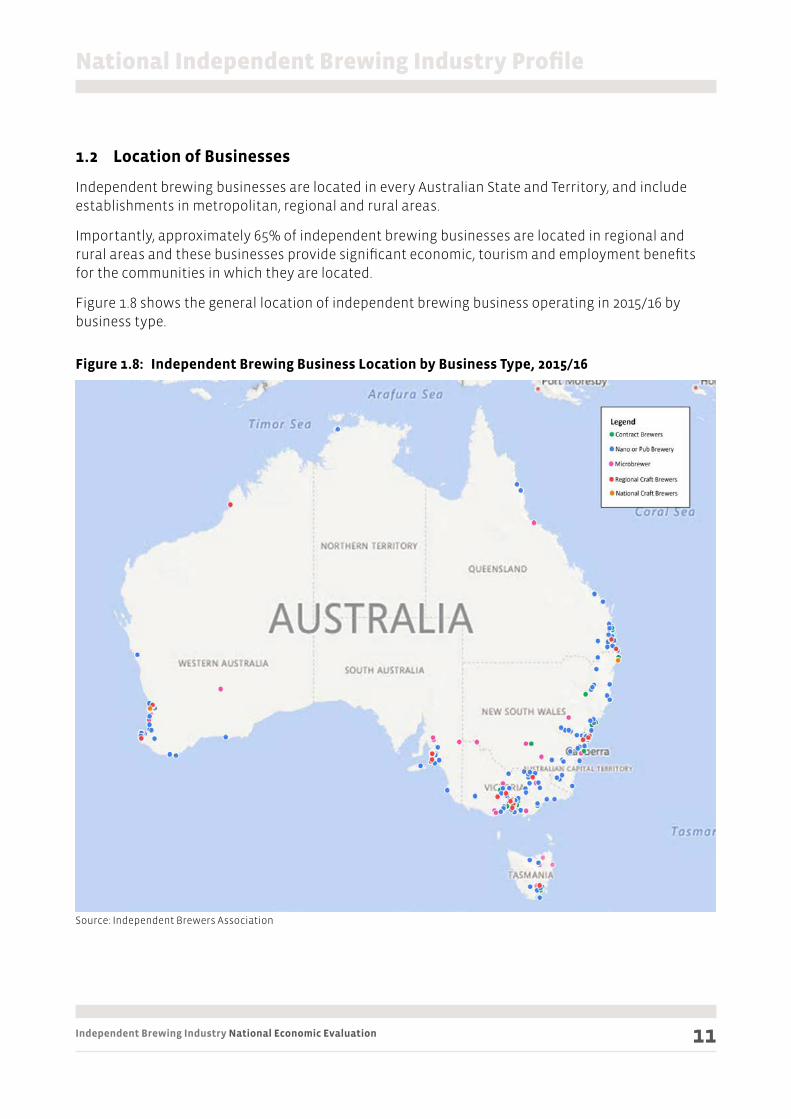
1.2 Location of Businesses
Independent brewing businesses are located in every Australian State and Territory, and include establishments in metropolitan, regional and rural areas.
Importantly, approximately 65% of independent brewing businesses are located in regional and rural areas and these businesses provide significant economic, tourism and employment benefits for the communities in which they are located.
Figure 1.8 shows the general location of independent brewing business operating in 2015/16 by business type.
Figure 1.8: Independent Brewing Business Location by Business Type, 2015/16
Source: Independent Brewers Association
National Independent Brewing Industry Profile
Independent Brewing Industry National Economic Evaluation 12
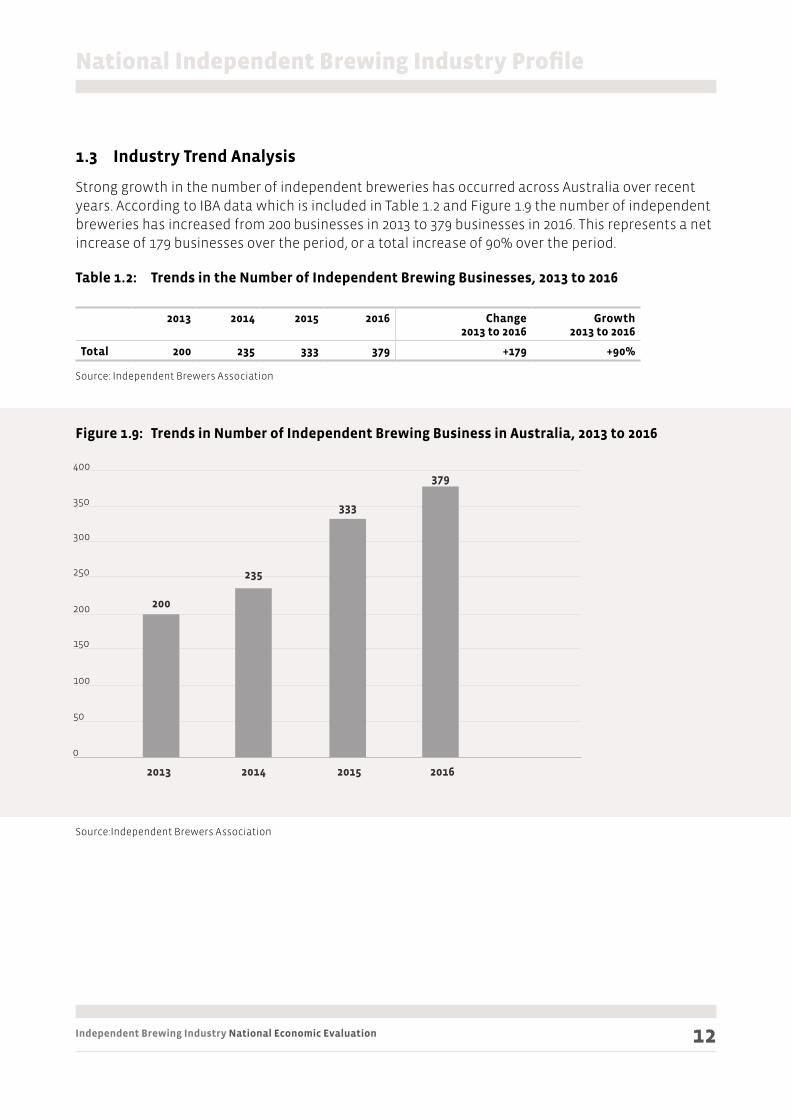
1.3 Industry Trend Analysis
Strong growth in the number of independent breweries has occurred across Australia over recent years. According to IBA data which is included in Table 1.2 and Figure 1.9 the number of independent breweries has increased from 200 businesses in 2013 to 379 businesses in 2016. This represents a net increase of 179 businesses over the period, or a total increase of 90% over the period.
Table 1.2: Trends in the Number of Independent Brewing Businesses, 2013 to 2016
2013 2014 2015 2016 Change2013 to 2016
Growth2013 to 2016
Total 200 235 333 379 +179 +90%
Source: Independent Brewers Association
Figure 1.9: Trends in Number of Independent Brewing Business in Australia, 2013 to 2016
Source:Independent Brewers Association
National Independent Brewing Industry Profile
0
50
200
150
100
250
300
400
350
200
2013
235
2014
333
2015
379
2016
Independent Brewing Industry National Economic Evaluation 13
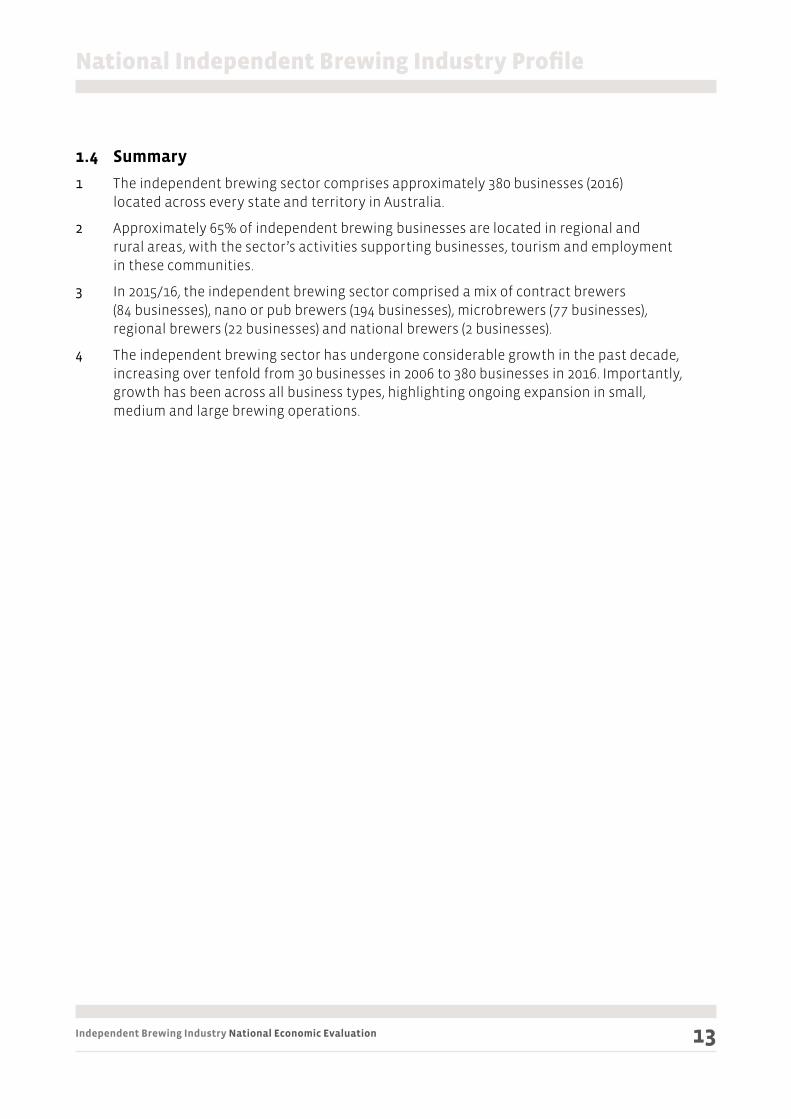
1.4 Summary
1 The independent brewing sector comprises approximately 380 businesses (2016) located across every state and territory in Australia.
2 Approximately 65% of independent brewing businesses are located in regional and rural areas, with the sector’s activities supporting businesses, tourism and employment in these communities.
3 In 2015/16, the independent brewing sector comprised a mix of contract brewers (84 businesses), nano or pub brewers (194 businesses), microbrewers (77 businesses), regional brewers (22 businesses) and national brewers (2 businesses).
4 The independent brewing sector has undergone considerable growth in the past decade, increasing over tenfold from 30 businesses in 2006 to 380 businesses in 2016. Importantly, growth has been across all business types, highlighting ongoing expansion in small, medium and large brewing operations.
National Independent Brewing Industry Profile
Independent Brewing Industry National Economic Evaluation 14
This Chapter provides a summary of the framework used to evaluate
the economic impacts of the independent brewing industry.
2.1 Industry Survey
A business survey of the independent brewing industry (IBA Annual Survey 2016) was undertaken by Survey Matters in November and December 2016. The survey was fully completed by 116 respondents out of a circulation of 325 businesses, and this represents a 32% response rate.
The survey collected 2015/16 data for the following:
• Length of time operating
• Beer sales by volume
• Sales revenues
• Employment levels
• Operating expenditures
• Capital expenditures
• Constraints to growth
• Areas for future investment
Data from the IBA Annual Survey 2016 has been weighted to reflect response rates by business types, and mean values have been derived which are used to provide estimates for the whole industry. The weighted IBA Annual Survey 2016 results, shown in Table 2.1, underpin a range of economic indicators to be assessed in the evaluation. The completed responses will also be used to pro-rata information by typology to generate national aggregated estimates.
For business confidentiality purposes, regional/national brewer data has been combined in this analysis.
2 Economic Evaluation Framework
Independent Brewing Industry National Economic Evaluation 15
2.2 Brewer Typologies
For the purposes of this evaluation the following brewer typologies, as used in the IBA Annual Survey 2016, have been applied:
• Contract – brewers that do not own a brewery or have an excise licence
• Nano or pub brewers – production of less than 50,000 litres per year
• Micro brewer – production of between 50,000 – 299,999 litres of beer per year
• Regional / National brewer – production of between 300,000 – 4,999,999 litres (regional) and 5 million – 40 million litres (national) of beer per year.
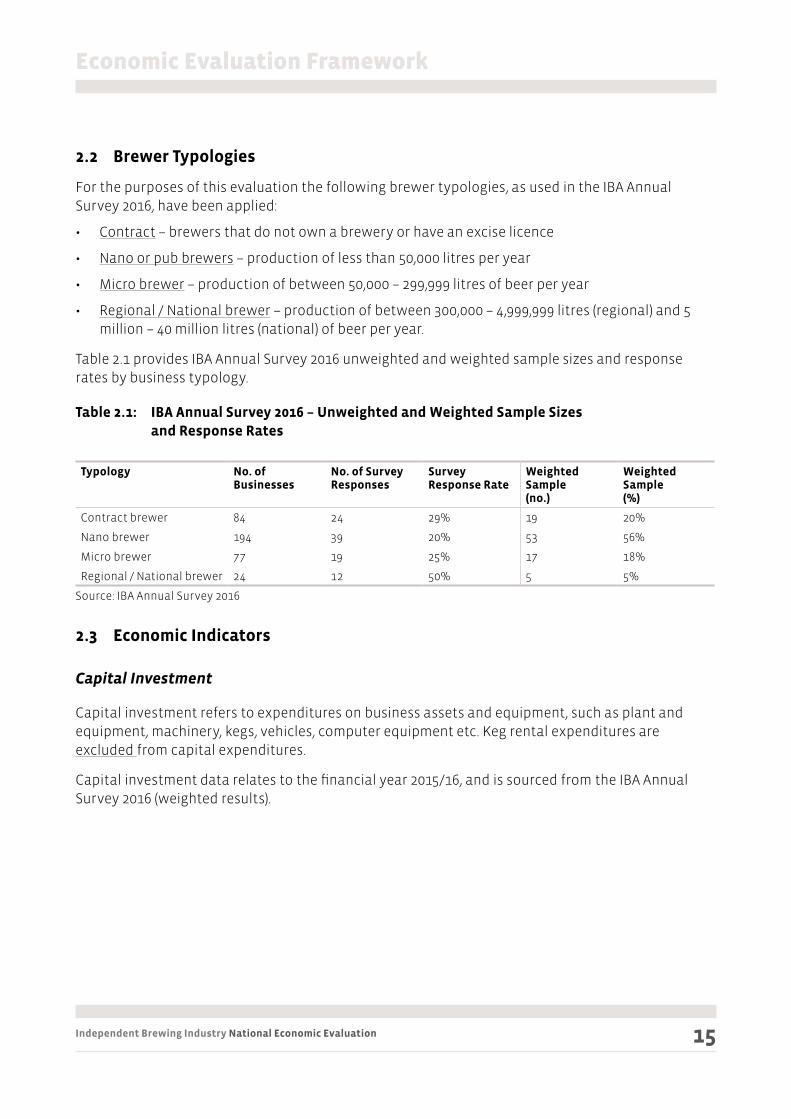
Table 2.1 provides IBA Annual Survey 2016 unweighted and weighted sample sizes and response rates by business typology.
Table 2.1: IBA Annual Survey 2016 – Unweighted and Weighted Sample Sizes and Response Rates
Typology No. of Businesses
No. of Survey Responses
SurveyResponse Rate
Weighted Sample(no.)
Weighted Sample(%)
Contract brewer 84 24 29% 19 20%
Nano brewer 194 39 20% 53 56%
Micro brewer 77 19 25% 17 18%
Regional / National brewer 24 12 50% 5 5%
Source: IBA Annual Survey 2016
2.3 Economic Indicators
Capital Investment
Capital investment refers to expenditures on business assets and equipment, such as plant and equipment, machinery, kegs, vehicles, computer equipment etc. Keg rental expenditures are excluded from capital expenditures.
Capital investment data relates to the financial year 2015/16, and is sourced from the IBA Annual Survey 2016 (weighted results).
Economic Evaluation Framework

Independent Brewing Industry National Economic Evaluation 16
Employment
Direct employment is based on the Full Time Equivalent (FTE) number of workers employed by the business. This includes full-time, part-time and causal staff converted into FTE staff based on a 35-hour working week
Direct employment data relates to the financial year 2015/16, and is sourced from the IBA Annual Survey 2016 (weighted results).
Multiplier (or flow-on) operational employment represents jobs supported indirectly through the activities of independent brewing businesses. This includes jobs associated with the supply chain (growers, ingredients, packaging, transportation, wholesaling, retailing etc), as well as jobs supported by employees’ wage spending and other consumption effects in the economy.
ABS Australian National Accounts Input-Output Multipliers (Cat.No.5237.0) provide multiplier ratios for selected industry sectors. These tables show an industry-standard multiplier for beer and malt (which most closely resembles independent brewing activities) of 8.5, that is, for every 1 direct job created in the industry a further 7.5 jobs are generated indirectly in the wider economy.
The SA Centre for Economic Studies report Economic Impacts Associated with proposed changes to Beer Excise, 2014 estimates an employment multiplier (industrial plus consumption) for the independent brewing sector of 7.9, that is, for every 1 direct job created in the industry a further 6.9 jobs are generated indirectly in the wider economy.
For the purposes of this study the average of these two multipliers of 8.2 has been applied to the independent brewing sector.
Sales Volumes
SALES VOLUMES REL ATE TO SALES OF BEER AND ARE DESCRIBED IN TERMS OF:
• Pack split: draft and pack sales as measured in litres.
• Sales channel: retail, wholesale (Australia) and wholesale (export) as measured in litres.
Direct employment data relates to the financial year 2015/16, and is sourced from the IBA Annual Survey 2016 (weighted results).
Sales Revenues
SALES REVENUES REL ATE TO INCOME DERIVED FROM THE SALES OF BEER AND ARE DESCRIBED IN
TERMS OF SALES REVENUE BY SALES CHANNEL AND BUSINESS T YPE.
Sales revenue data relates to the financial year 2015/16, and is sourced from the IBA Annual Survey 2016 (weighted results).
Economic Evaluation Framework
Independent Brewing Industry National Economic Evaluation 17
Economic Output and Value Added
Economic output and value added is derived from information contained in IBISWorld Industry Report OD5071 Craft Beer Production in Australia, July 2016. The report indicates output of approximately $310,000 per job for the craft beer sector and value-added output of approximately $125,000 per job for the craft beer sector (2015/16).
The above IBISWorld estimates have been used to estimate economic output and value-added for this evaluation.
Excise Revenues to Government
Alcohol excise revenue for 2015/16 been calculated for the IBA by the ATO, and this data is used in the evaluation.
Impacts on the Visitor Economy
Impacts for the visitor economy associated with independent brewing establishments and operations are described, but not quantified.
2.4 Summary
The Economic Evaluation Framework guides the Economic Evaluation and includes methodologies to quantify key industry factors, such as capital investment, employment, economic output, production and excise tax receipts.
Economic Evaluation Framework
Independent Brewing Industry National Economic Evaluation 18
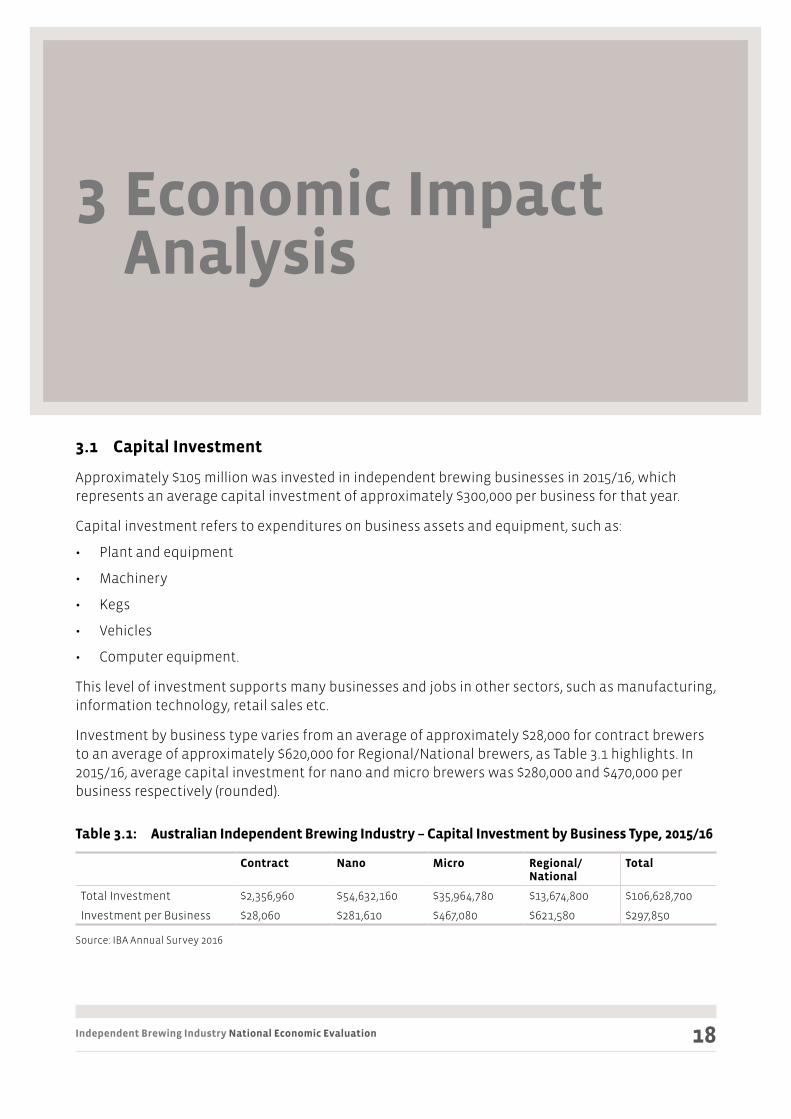
3.1 Capital Investment
Approximately $105 million was invested in independent brewing businesses in 2015/16, which represents an average capital investment of approximately $300,000 per business for that year.
Capital investment refers to expenditures on business assets and equipment, such as:
• Plant and equipment
• Machinery
• Kegs
• Vehicles
• Computer equipment.
This level of investment supports many businesses and jobs in other sectors, such as manufacturing, information technology, retail sales etc.
Investment by business type varies from an average of approximately $28,000 for contract brewers to an average of approximately $620,000 for Regional/National brewers, as Table 3.1 highlights. In 2015/16, average capital investment for nano and micro brewers was $280,000 and $470,000 per business respectively (rounded).
Table 3.1: Australian Independent Brewing Industry – Capital Investment by Business Type, 2015/16
Contract Nano Micro Regional/National
Total
Total Investment $2,356,960 $54,632,160 $35,964,780 $13,674,800 $106,628,700
Investment per Business $28,060 $281,610 $467,080 $621,580 $297,850
Source: IBA Annual Survey 2016
3 Economic Impact Analysis
Independent Brewing Industry National Economic Evaluation 19
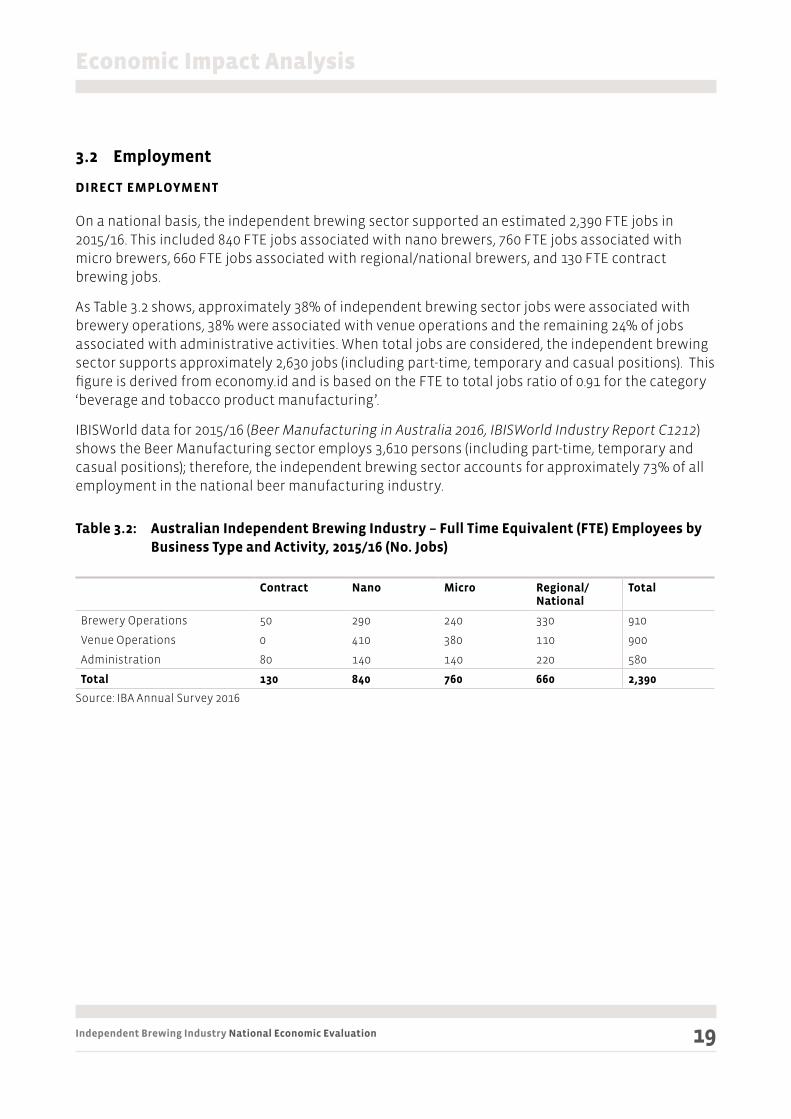
3.2 Employment
DIRECT EMPLOYMENT
On a national basis, the independent brewing sector supported an estimated 2,390 FTE jobs in 2015/16. This included 840 FTE jobs associated with nano brewers, 760 FTE jobs associated with micro brewers, 660 FTE jobs associated with regional/national brewers, and 130 FTE contract brewing jobs.
As Table 3.2 shows, approximately 38% of independent brewing sector jobs were associated with brewery operations, 38% were associated with venue operations and the remaining 24% of jobs associated with administrative activities. When total jobs are considered, the independent brewing sector supports approximately 2,630 jobs (including part-time, temporary and casual positions). This figure is derived from economy.id and is based on the FTE to total jobs ratio of 0.91 for the category ‘beverage and tobacco product manufacturing’.
IBISWorld data for 2015/16 (Beer Manufacturing in Australia 2016, IBISWorld Industry Report C1212) shows the Beer Manufacturing sector employs 3,610 persons (including part-time, temporary and casual positions); therefore, the independent brewing sector accounts for approximately 73% of all employment in the national beer manufacturing industry.
Table 3.2: Australian Independent Brewing Industry – Full Time Equivalent (FTE) Employees by Business Type and Activity, 2015/16 (No. Jobs)
Contract Nano Micro Regional/National
Total
Brewery Operations 50 290 240 330 910
Venue Operations 0 410 380 110 900
Administration 80 140 140 220 580
Total 130 840 760 660 2,390
Source: IBA Annual Survey 2016
Economic Impact Analysis

Independent Brewing Industry National Economic Evaluation 20
Figures 3.1 and 3.2 provide further information on employment in the independent brewing sector by job type and by business type.
Figure 3.1: Australian Independent Brewing Industry – Full Time Equivalent (FTE) by Activity, 2015/16
Source: IBA Annual Survey 2016
Figure 3.2: Australian Independent Brewing Industry – Full Time Equivalent (FTE) by Business Type, 2015/16
Source: IBA Annual Survey 2016
Economic Impact Analysis
Administration24%
Regional/National28%
Venue Operations38%
Nano35%
BreweryOperations38%
Micro32%
Contract5%
Independent Brewing Industry National Economic Evaluation 21
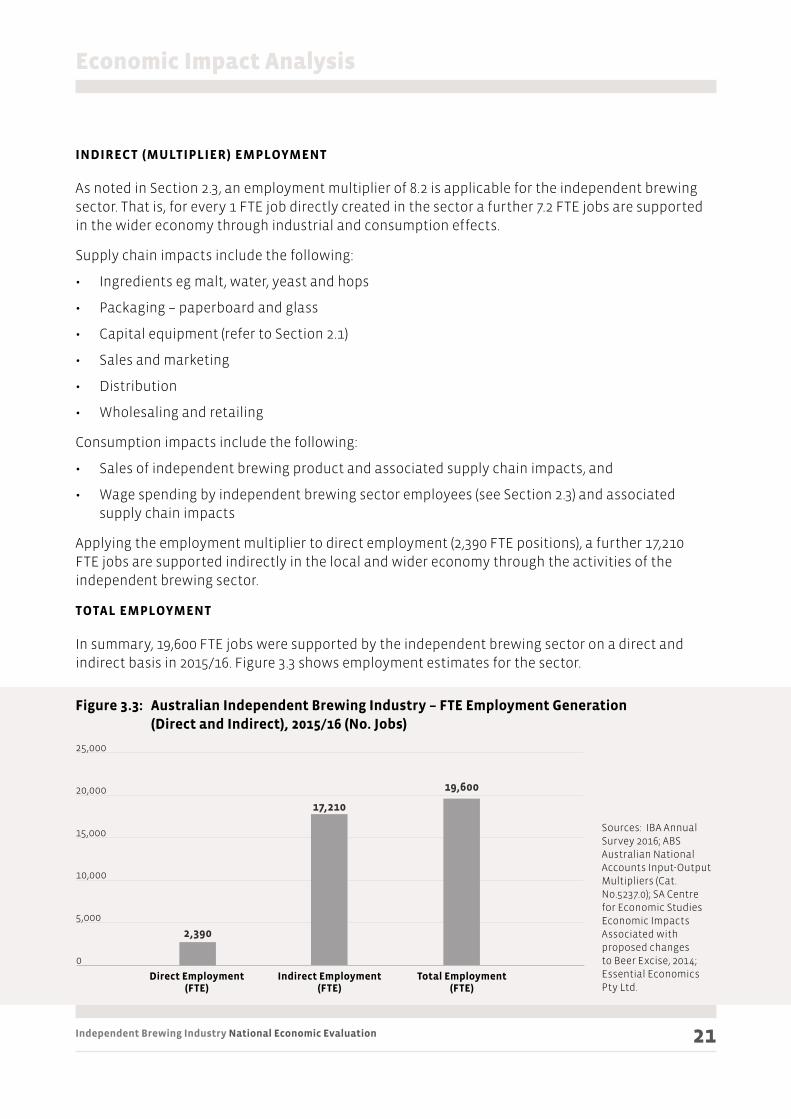
INDIRECT (MULTIPLIER) EMPLOYMENT
As noted in Section 2.3, an employment multiplier of 8.2 is applicable for the independent brewing sector. That is, for every 1 FTE job directly created in the sector a further 7.2 FTE jobs are supported in the wider economy through industrial and consumption effects.
Supply chain impacts include the following:
• Ingredients eg malt, water, yeast and hops
• Packaging – paperboard and glass
• Capital equipment (refer to Section 2.1)
• Sales and marketing
• Distribution
• Wholesaling and retailing
Consumption impacts include the following:
• Sales of independent brewing product and associated supply chain impacts, and
• Wage spending by independent brewing sector employees (see Section 2.3) and associated supply chain impacts
Applying the employment multiplier to direct employment (2,390 FTE positions), a further 17,210 FTE jobs are supported indirectly in the local and wider economy through the activities of the independent brewing sector.
TOTAL EMPLOYMENT
In summary, 19,600 FTE jobs were supported by the independent brewing sector on a direct and indirect basis in 2015/16. Figure 3.3 shows employment estimates for the sector.
Figure 3.3: Australian Independent Brewing Industry – FTE Employment Generation (Direct and Indirect), 2015/16 (No. Jobs)
Sources: IBA Annual Survey 2016; ABS Australian National Accounts Input-Output Multipliers (Cat.No.5237.0); SA Centre for Economic Studies Economic Impacts Associated with proposed changes to Beer Excise, 2014; Essential Economics Pty Ltd.
Economic Impact Analysis
0
5,000
10,000
15,000
20,000
25,000
2,390
Direct Employment (FTE)
17,210
Indirect Employment (FTE)
19,600
Total Employment (FTE)
Independent Brewing Industry National Economic Evaluation 22
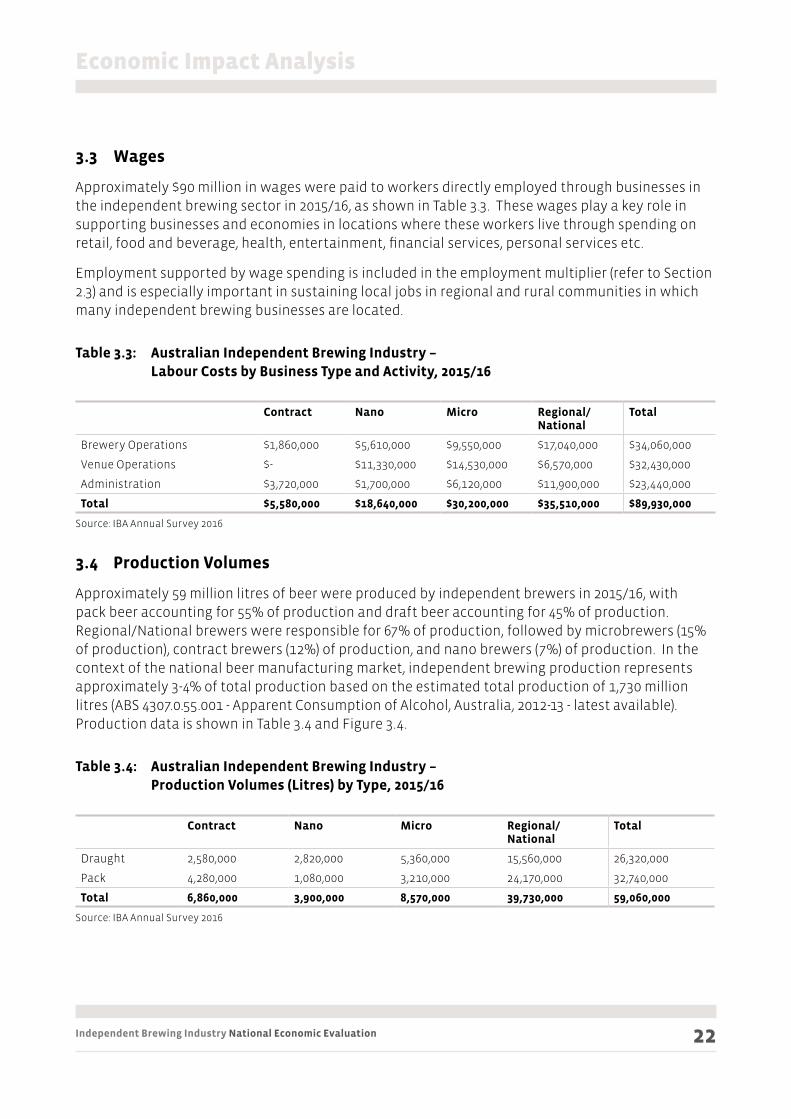
3.3 Wages
Approximately $90 million in wages were paid to workers directly employed through businesses in the independent brewing sector in 2015/16, as shown in Table 3.3. These wages play a key role in supporting businesses and economies in locations where these workers live through spending on retail, food and beverage, health, entertainment, financial services, personal services etc.
Employment supported by wage spending is included in the employment multiplier (refer to Section 2.3) and is especially important in sustaining local jobs in regional and rural communities in which many independent brewing businesses are located.
Table 3.3: Australian Independent Brewing Industry – Labour Costs by Business Type and Activity, 2015/16
Contract Nano Micro Regional/National
Total
Brewery Operations $1,860,000 $5,610,000 $9,550,000 $17,040,000 $34,060,000
Venue Operations $- $11,330,000 $14,530,000 $6,570,000 $32,430,000
Administration $3,720,000 $1,700,000 $6,120,000 $11,900,000 $23,440,000
Total $5,580,000 $18,640,000 $30,200,000 $35,510,000 $89,930,000
Source: IBA Annual Survey 2016
3.4 Production Volumes
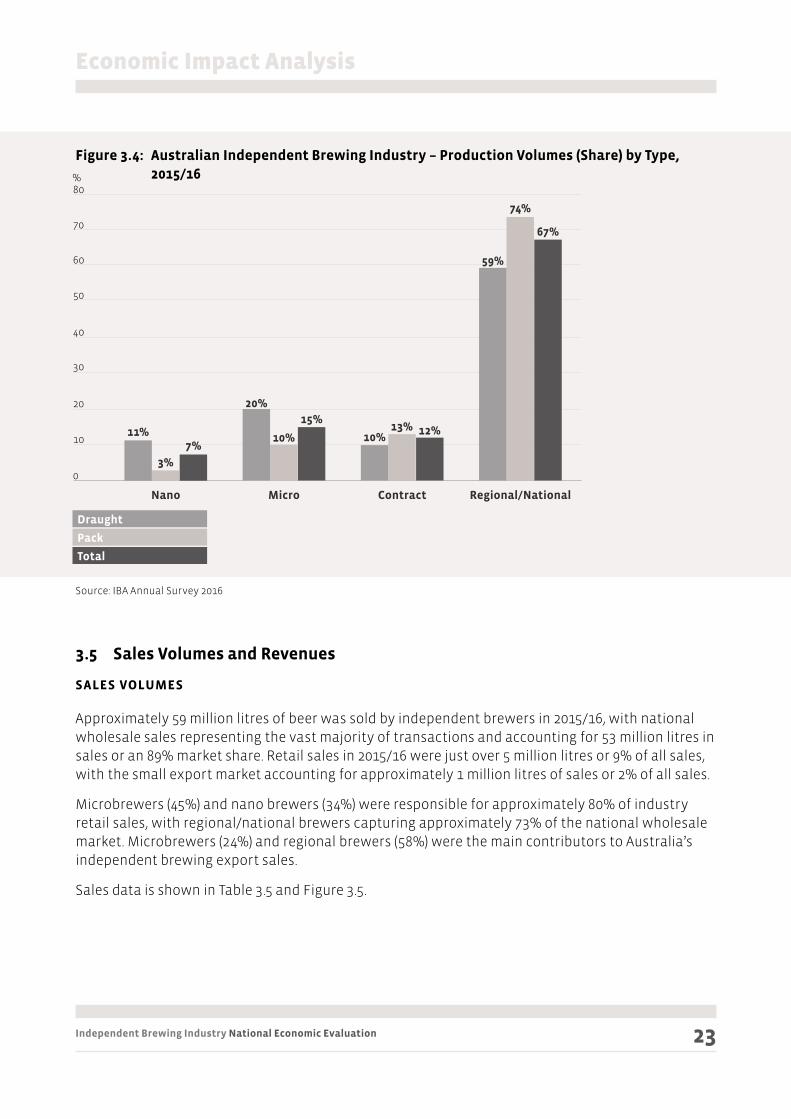
Approximately 59 million litres of beer were produced by independent brewers in 2015/16, with pack beer accounting for 55% of production and draft beer accounting for 45% of production. Regional/National brewers were responsible for 67% of production, followed by microbrewers (15% of production), contract brewers (12%) of production, and nano brewers (7%) of production. In the context of the national beer manufacturing market, independent brewing production represents approximately 3-4% of total production based on the estimated total production of 1,730 million litres (ABS 4307.0.55.001 - Apparent Consumption of Alcohol, Australia, 2012-13 - latest available). Production data is shown in Table 3.4 and Figure 3.4.
Table 3.4: Australian Independent Brewing Industry – Production Volumes (Litres) by Type, 2015/16
Contract Nano Micro Regional/National
Total
Draught 2,580,000 2,820,000 5,360,000 15,560,000 26,320,000
Pack 4,280,000 1,080,000 3,210,000 24,170,000 32,740,000
Total 6,860,000 3,900,000 8,570,000 39,730,000 59,060,000
Source: IBA Annual Survey 2016
Economic Impact Analysis
Independent Brewing Industry National Economic Evaluation 23
Figure 3.4: Australian Independent Brewing Industry – Production Volumes (Share) by Type, 2015/16
Source: IBA Annual Survey 2016
3.5 Sales Volumes and Revenues
SALES VOLUMES
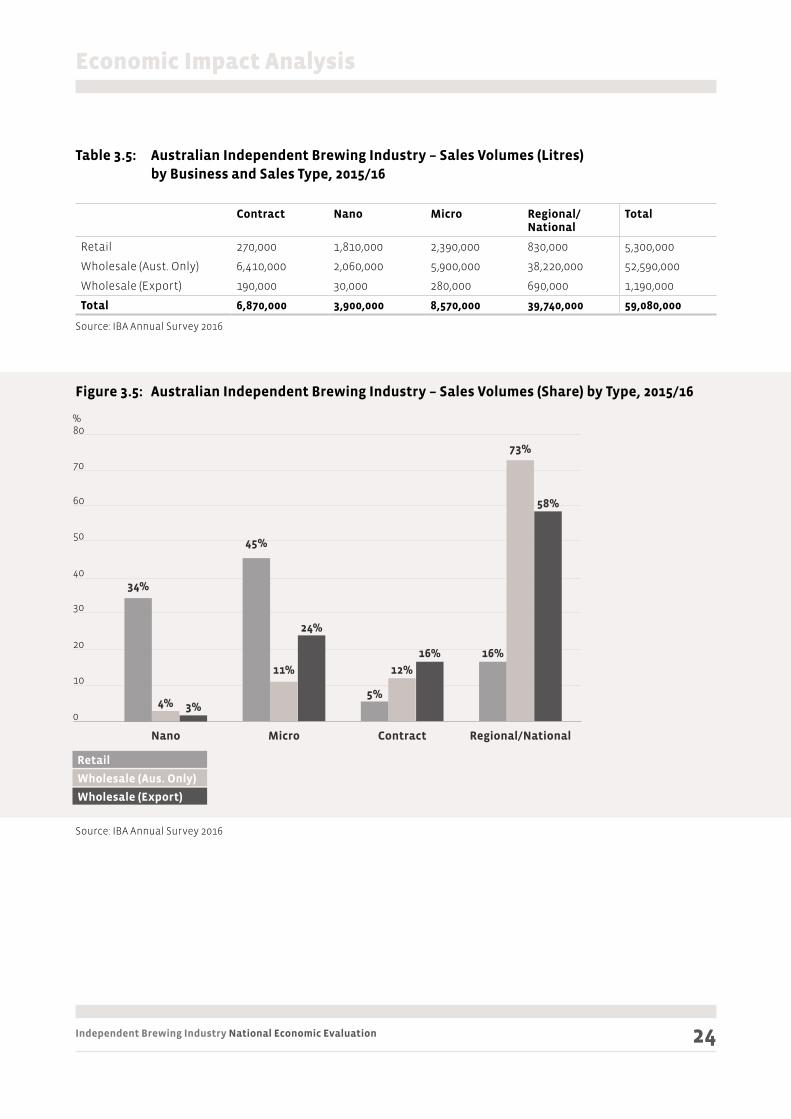
Approximately 59 million litres of beer was sold by independent brewers in 2015/16, with national wholesale sales representing the vast majority of transactions and accounting for 53 million litres in sales or an 89% market share. Retail sales in 2015/16 were just over 5 million litres or 9% of all sales, with the small export market accounting for approximately 1 million litres of sales or 2% of all sales.
Microbrewers (45%) and nano brewers (34%) were responsible for approximately 80% of industry retail sales, with regional/national brewers capturing approximately 73% of the national wholesale market. Microbrewers (24%) and regional brewers (58%) were the main contributors to Australia’s independent brewing export sales.
Sales data is shown in Table 3.5 and Figure 3.5.
80
Economic Impact Analysis
0
10
40
30
20
50
60
70
Nano Micro Contract
59%
74%
67%
10%13% 12%
20%
10%
15%11%
3%
7%
Regional/National
%
Draught
Pack
Total
Independent Brewing Industry National Economic Evaluation 24
Table 3.5: Australian Independent Brewing Industry – Sales Volumes (Litres) by Business and Sales Type, 2015/16
Contract Nano Micro Regional/National
Total
Retail 270,000 1,810,000 2,390,000 830,000 5,300,000
Wholesale (Aust. Only) 6,410,000 2,060,000 5,900,000 38,220,000 52,590,000
Wholesale (Export) 190,000 30,000 280,000 690,000 1,190,000
Total 6,870,000 3,900,000 8,570,000 39,740,000 59,080,000
Source: IBA Annual Survey 2016
Figure 3.5: Australian Independent Brewing Industry – Sales Volumes (Share) by Type, 2015/16
Source: IBA Annual Survey 2016
Economic Impact Analysis
0
10
40
30
20
50
60
70
80
Nano Micro Contract
16%
73%
58%
5%
12%
16%
45%
11%
24%
34%
4% 3%
Regional/National
%
Retail
Wholesale (Aus. Only)
Wholesale (Export)
Independent Brewing Industry National Economic Evaluation 25
SALES REVENUES
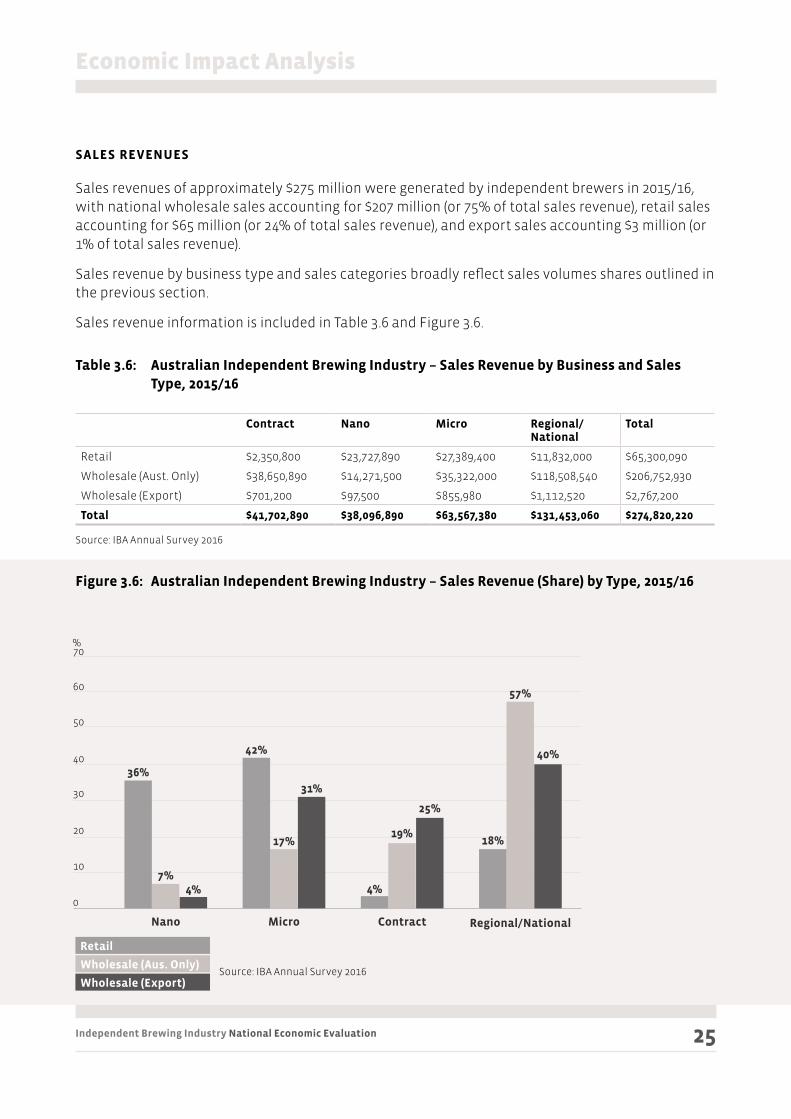
Sales revenues of approximately $275 million were generated by independent brewers in 2015/16, with national wholesale sales accounting for $207 million (or 75% of total sales revenue), retail sales accounting for $65 million (or 24% of total sales revenue), and export sales accounting $3 million (or 1% of total sales revenue).
Sales revenue by business type and sales categories broadly reflect sales volumes shares outlined in the previous section.
Sales revenue information is included in Table 3.6 and Figure 3.6.
Table 3.6: Australian Independent Brewing Industry – Sales Revenue by Business and Sales Type, 2015/16
Contract Nano Micro Regional/National
Total
Retail $2,350,800 $23,727,890 $27,389,400 $11,832,000 $65,300,090
Wholesale (Aust. Only) $38,650,890 $14,271,500 $35,322,000 $118,508,540 $206,752,930
Wholesale (Export) $701,200 $97,500 $855,980 $1,112,520 $2,767,200
Total $41,702,890 $38,096,890 $63,567,380 $131,453,060 $274,820,220
Source: IBA Annual Survey 2016
Figure 3.6: Australian Independent Brewing Industry – Sales Revenue (Share) by Type, 2015/16
Source: IBA Annual Survey 2016
Economic Impact Analysis
0
10
40
30
20
50
60
70
Nano Micro Contract
18%
57%
40%
4%
19%
25%
42%
17%
31%
36%
7%4%
Regional/National
%
Retail
Wholesale (Aus. Only)
Wholesale (Export)
Independent Brewing Industry National Economic Evaluation 26
3.6 Economic Output and Value Added
ECONOMIC OUTPUT
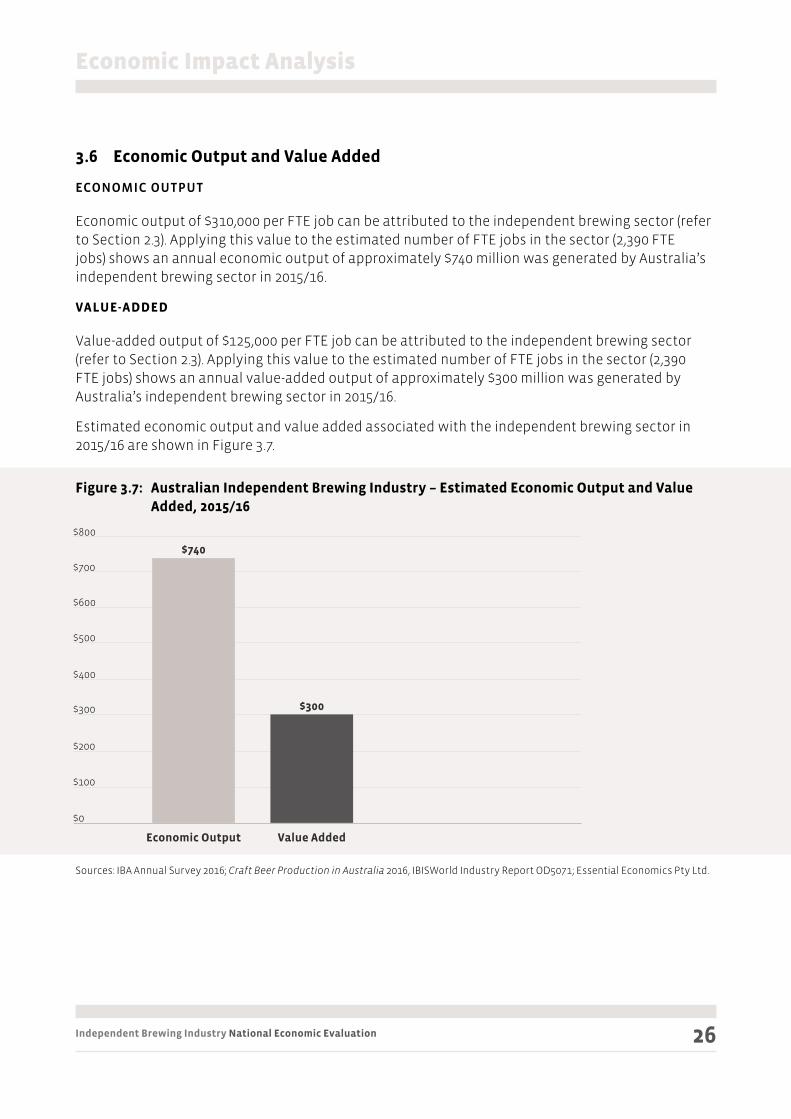
Economic output of $310,000 per FTE job can be attributed to the independent brewing sector (refer to Section 2.3). Applying this value to the estimated number of FTE jobs in the sector (2,390 FTE jobs) shows an annual economic output of approximately $740 million was generated by Australia’s independent brewing sector in 2015/16.
VALUE-ADDED
Value-added output of $125,000 per FTE job can be attributed to the independent brewing sector (refer to Section 2.3). Applying this value to the estimated number of FTE jobs in the sector (2,390 FTE jobs) shows an annual value-added output of approximately $300 million was generated by Australia’s independent brewing sector in 2015/16.
Estimated economic output and value added associated with the independent brewing sector in 2015/16 are shown in Figure 3.7.
Figure 3.7: Australian Independent Brewing Industry – Estimated Economic Output and Value Added, 2015/16
Sources: IBA Annual Survey 2016; Craft Beer Production in Australia 2016, IBISWorld Industry Report OD5071; Essential Economics Pty Ltd.
Economic Impact Analysis
$0
$100
$400
$300
$200
$500
$600
$700
$800
$300
$740
Value AddedEconomic Output
Independent Brewing Industry National Economic Evaluation 27
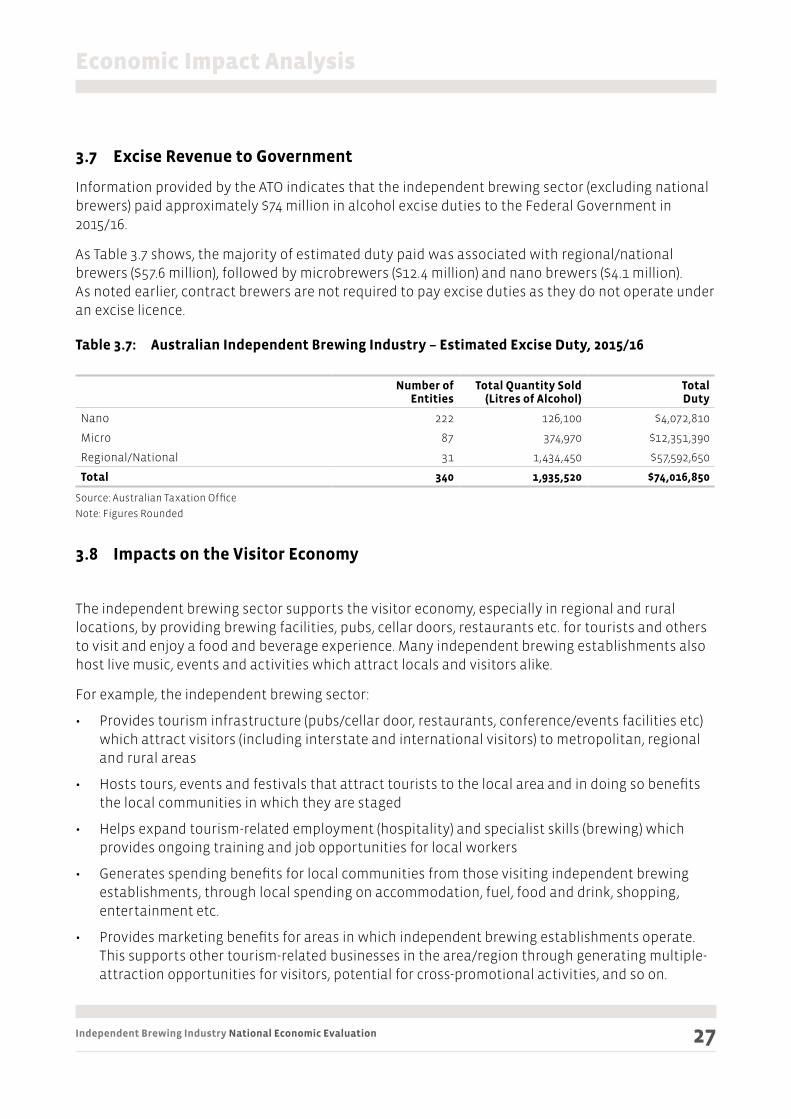
3.7 Excise Revenue to Government
Information provided by the ATO indicates that the independent brewing sector (excluding national brewers) paid approximately $74 million in alcohol excise duties to the Federal Government in 2015/16.
As Table 3.7 shows, the majority of estimated duty paid was associated with regional/national brewers ($57.6 million), followed by microbrewers ($12.4 million) and nano brewers ($4.1 million). As noted earlier, contract brewers are not required to pay excise duties as they do not operate under an excise licence.
Table 3.7: Australian Independent Brewing Industry – Estimated Excise Duty, 2015/16
Number ofEntities
Total Quantity Sold(Litres of Alcohol)
TotalDuty
Nano 222 126,100 $4,072,810
Micro 87 374,970 $12,351,390
Regional/National 31 1,434,450 $57,592,650
Total 340 1,935,520 $74,016,850
Source: Australian Taxation Office
Note: Figures Rounded
3.8 Impacts on the Visitor Economy
The independent brewing sector supports the visitor economy, especially in regional and rural locations, by providing brewing facilities, pubs, cellar doors, restaurants etc. for tourists and others to visit and enjoy a food and beverage experience. Many independent brewing establishments also host live music, events and activities which attract locals and visitors alike.
For example, the independent brewing sector:
• Provides tourism infrastructure (pubs/cellar door, restaurants, conference/events facilities etc) which attract visitors (including interstate and international visitors) to metropolitan, regional and rural areas
• Hosts tours, events and festivals that attract tourists to the local area and in doing so benefits the local communities in which they are staged
• Helps expand tourism-related employment (hospitality) and specialist skills (brewing) which provides ongoing training and job opportunities for local workers
• Generates spending benefits for local communities from those visiting independent brewing establishments, through local spending on accommodation, fuel, food and drink, shopping, entertainment etc.
• Provides marketing benefits for areas in which independent brewing establishments operate. This supports other tourism-related businesses in the area/region through generating multiple-attraction opportunities for visitors, potential for cross-promotional activities, and so on.
Economic Impact Analysis

Independent Brewing Industry National Economic Evaluation 28
As the independent brewing sector continues to expand and as facilities and products become more established and better branded, it is likely independent brewing businesses will attract increasingly higher numbers of visitors in a manner similar to the tourism success of wine cellar doors across many regions of Australia.
The following short case studies highlight the benefits independent brewing businesses initiate in the visitor economy.
THE HIGH COUNTRY BREWERY TRAIL
The High Country Brewery Trail (HCBT) was established in 2010 by four breweries located in Victoria’s north-east and has been widely recognised as a highly successful collaborative tourism project generating significant media recognition.
The project garnered support for its establishment from the local tourism organisation, Tourism North East, through a contribution to printing of a guide. That support continues through the continued help with guide publication, managing much of its communications and hosting information on its website.
Bridge Road Brewers, located in Beechworth was established in 2005 by Ben Kraus. The brewery is now a significant employer in the Beechworth area and was a driving force behind the HCBT.
“Our venue, along with others in the region, has developed a significant brewery destination and industry, when previously no such sector existed. Initially our industry leveraged off visitors already in the region, but has grown to be a significant drawcard for visitors coming to Victoria’s High Country,” Kraus said.
“This has been made possible through our collaborative approach to marketing through development of The High Country Brewery Trail.”
Tourism North East has not quantified the impact of High Country Brewery Trail visitors but its figures show that domestic visitor numbers to the region have increased over the period from 2012 to 2016 by 5.9%. Across that same period the number of visitors to the region for non-ski activities grew by 29.8%.
THE GREAT AUSTRALASIAN BEER SPECTAPULAR
The Great Australasian Beer Spectapular (GABS) is a stunning example of the positive impact of independent brewing sector on the visitor economy. Starting as a small event that attracted 2,000 people to The Local Taphouse in St Kilda in 2011, the festival is now held in three locations in two countries with a total attendance of 32,000.
GABS quickly grew out of its St Kilda birthplace and moved to the Royal Exhibition Building in Carlton in 2012. A Sydney version of the event was added in 2015 and 2016 saw the idea was exported to New Zealand for an event in Auckland.
In 2017 the organisers expect 35,000 attendees across the three events with $2.5 million to be spent in the Australian economy.
Economic Impact Analysis
Independent Brewing Industry National Economic Evaluation 29
INDEPENDENT BREWING TOURISM BOOSTING ECONOMIES IN RURAL AUSTRALIA.
Smiling Samoyed Brewery is located in Myponga, South Australia (pop. 500). Established by wife and husband team Kate Henning and Simon Dunstone in 2012, the brewery is now an important fixture in the tourism economy of the Fleurieu Peninsula, South Australia’s most visited region with over 3 million visitors annually.
According to Fleurieu Peninsula Tourism Executive Officer Miranda Lang, Smiling Samoyed are champions of tourism for a number of reasons.
“They produce quality beer, they are active and supportive within the community and their brewery is family friendly, offers delicious regional food, stunning scenery and easy access”
Kate Henning said that their business, which employs 18 people in a mix of full time, part time and casual roles, continues to grow especially in the busy summer months.
“This January saw us turn over five times more than our first January. Our brewery is located on the path to popular holiday destinations however most of our visitors specifically travel from Adelaide to visit us,”
“Our experience is that the majority of our visitors are intrastate visitors (85%) – predominantly on day trips from Adelaide with interstate (10%) and international visitors (5%) as well. We are currently open 3 days per week but expect to open 7 days per week within the next 12 months. We expect that this will increase the interstate and international component of our visitors who are not as tied to weekends as intrastate tourists.”
In Tasmania data collected by Tourism Tasmania shows that of the 1.2 million visitors to the Apple Isle surveyed in 15/16, more than 141 000 visited a brewery during their stay. This was an increase of 14.6% on the previous year.
In Railton (pop. 900), Catherine Stark and Willie Simpson have been operating Seven Sheds Brewery, Meadery and Hop Garden, since 2008. Outside of themselves the brewery employs one permanent part timer and four casuals in the brewery and at their cellar door.
According to Catherine Stark, cellar door sales account for 30% of their annual turnover. Seven Sheds keep track of the visitor’s origins and in 2015/16, found that more than half of them (55%) came from interstate, 10% came from overseas, with the balance being from Tasmania.
Economic Impact Analysis
Independent Brewing Industry National Economic Evaluation 30
3.9 Conclusions
In 2015/16, the Australian independent brewing sector:
27 Invested $105 million in plant, machinery, vehicles and other capital items to support business operations, which provided flow-on business and employment benefits in other sectors of the economy.
28 Employed 2,390 Full Time Equivalent (FTE) workers and the sector’s activities supported a further 17,210 FTE jobs in the local and wider economy across a range of sectors.
29 Paid approximately $90 million directly in wages, thereby supporting businesses and jobs in locations where independent brewing workers live through local spending benefits.
30 Produced 59 million litres of beer, generating $275 million in sales revenues.
31 Generated $740 million in economic output, of which $300 million was value-added output.
32 Contributed $74 million in excise duty to the Federal Government
33 Supported for 95% of all businesses and 65% of all employment across the total beer manufacturing industry nationally.
34 Continued to support the visitor economy through investment in tourism infrastructure and events/activities/co-promotion with tourism agencies, thus providing direct and indirect visitor spending benefits (through retail, accommodation etc expenditures) to the communities in which independent brewing businesses are located, including many regional and rural areas.
Economic Impact Analysis
Independent Brewing Industry National Economic Evaluation 31
4.1 Alcohol Excise Tax
Australia has one of the highest alcohol excise tax rates in the world, and excise rates are considerably higher than in comparable countries such as Canada, New Zealand, USA and the UK.
Research undertaken by Adelaide University’s School of Economics (Excise Taxes on Wines, Beers and Spirits: An Updated International Comparison, 2014) provides comparative excise rates based on a litre of beer containing 5% alcohol by volume (based on 2012 prices).
As Table 4.1 and Figure 4.1 highlight, Australia’s wholesale tax of 54 cents per standard drink is high relative to other nations and compares with 37 cents in Canada, 35 cents in the UK, 28 cents in USA, 26 cents in New Zealand and 17 cents in Japan. In the Adelaide University study, only Norway (89 cents) and Israel (69 cents) had higher excise tax rates.
4 Benchmarking Analysis

Independent Brewing Industry National Economic Evaluation 32
Table 4.1: Excise Taxes on Alcoholic Beverages per Standard Drink of Alcohol (1) for Beer, 2012
Pre-tax price per litre(Australian Dollars)
Excise tax per litre(Australian Cents)
Excise tax per Litre Difference from Australia
(Australian Cents)
Australia $2.00 54 -
Canada $2.00 37 -17
France $2.00 4 -50
Germany $2.00 23 -31
Ireland $2.00 25 -29
Israel $2.00 69 +15
Italy $2.00 9 -45
Japan $2.00 17 -37
Korea $2.00 47 -7
Mexico $2.00 13 -41
Netherlands $2.00 9 -45
New Zealand $2.00 26 -28
Norway $2.00 89 +35
South Africa $2.00 9 -45
Spain $2.00 16 -38
Switzerland $2.00 22 -32
Turkey $2.00 32 -22
UK $2.00 35 -19
USA $2.00 28 -26
Source: Excise Taxes on Wines, Beers and Spirits: An Updated International Comparison, School of Economics, University of Adelaide, 2014
Note: (1) One standard drink in Australia is 12.5 ml of pure alcohol, and so is equivalent to 250ml of beer at 5% alcohol
Figure 4.1: Comparison of Excise Tax per Litre of Beer (Australian Cents) for Selected Countries, 2012
Source: Excise Taxes on Wines, Beers and Spirits: An Updated International Comparison, School of Economics, University of Adelaide, 2014
Benchmarking Analysis
0
10
40
30
20
60
80
100
90
70
50
89%
4%9%9%9%
13%16%17%22%23%
25%26%28%32%
35%37%
47%
54%
69%
No
rwa
y
Isra
el
Au
stra
lia
Ko
rea
Ca
na
da
UK
Turk
ey
US
A
New
Zea
lan
d
Irel
an
d
Ger
ma
ny
Swit
zerl
an
d
Jap
an
Spa
in
Me
xic
o
Ita
ly
Net
her
lan
ds
So
uth
Afi
ca
Fra
nce

Independent Brewing Industry National Economic Evaluation 33
4.2 Government Funding Support in Other Countries
Minimal specific funding support is currently available in most of Australia to support the growth of the independent brewing sector.
In recent times the state of Victoria has recognised the potential for the craft beer industry to create jobs in rural and regional areas, particularly in tourism and hospitality. The Victorian Government in 2016-7 has committed almost $4 million from its Regional Tourism Infrastructure Fund to the following projects:
• $1.5 million towards the Holgate Group Historic Hotel and Brewery Discovery Centre expansion
• $1.49 million towards the relocation and expansion of the Forrest Brewing Company; and
• $500,000 towards the development of the Australian Craft Beer Centre of Excellence in Ballarat
The new Australian Craft Beer Centre of Excellence will include a craft brewery, a beer tasting and bar area, a teaching space and a function area which will attract a broad range of visitors.
A key feature of the Centre will be the ‘brew space’, where small brewers will be able to receive advice on how to improve their brewing technique, develop their business and test the market which will help niche brewers expand.
The Australian Craft Beer Centre of Excellence is working closely with Ballarat-headquartered Federation University to develop suitable training courses to be delivered through the Centre.
In contrast, some other countries provide industry grants and other incentives to support and develop the sector.
For example, the government of Ontario in Canada supports the independent brewing industry through the funding for the Ontario Microbrewery Strategy. This strategy will provide $1.4 million (Canadian dollars) over two years in marketing support to complement the brewers’ successful launch in grocery stores.
The UK supports small breweries with their Small Breweries Relief Scheme, with reductions starting at 50% for production of 5,000 hectolitres or less. All breweries that produce less than 60,000 hectolitres of beer in a year are also entitled to a reduced duty rate.
The New York State Government has a range of measures to support small breweries by cutting the cost of doing business, rolling back red tape, and promoting products through the Governor’s Taste NY program. The New York State Government website has outlined a number of actions that have supported and are supporting small breweries since 2012, and these include the following:
• The 2015-16 state budget included expansions of tax exemptions for tastings conducted by New York breweries, lowering costs for hundreds of producers and allowing them to better market their products and reinvest in their businesses.
• The 2014 Craft New York Act, which reduced the costs and increases the annual production cap for farm breweries and micro-breweries from 60,000 barrels to 75,000.
• The 2014 Craft Beverage Grant programs—a USD 2 million Craft Beverage Marketing and Promotion Grant Program and a USD 1 million Craft Beverage Industry Tourism Promotion Grant.
Benchmarking Analysis

Independent Brewing Industry National Economic Evaluation 34
• The first Wine, Beer, and Spirits Summit, in 2012, gave manufacturers the ability to sell bottles when they are conducting tastings, eliminated duplicative licenses and reduced licensing fees. The second Wine, Beer, Spirits, and Cider Summit, in 2014, resulted in the elimination of paperwork for beverage manufacturers while reducing costs and regulations on farm wineries.
• The 2013 One-Stop Shop to provide beverage producers with a single point of contact on state regulations, licensing, incentives, and other issues.
• The 2013 Farm Cidery law, which fostered the speedy development of the hard cider segment of the beverage industry, leading to 480% growth in the number of cideries from 2011 to 2014.
• The 2012 legislation that allowed farm distilleries to sell their products for the first time at the Great New York State Fair, at recognised county fairs, and not-for-profit farmers markets.
• Successful efforts by the New York State Liquor Authority to speed up the process of reviewing new manufacturing licenses. The review time was cut in half, from 83 days in 2010 to 38 days in 2014.
• The promotional efforts of the Governor’s Taste NY program, which has brought the consumer sampling of New York beverages and other products to major events across the state and which makes those products available at special stores in Thruway rest stops and New York City area airports.
• The creation of a USD 350,000 fund to support research into hops and malting barley, crops that are essential to the growth of the craft beer industry
Since the 2012 passage of New York Farm Brewery legislation and with continued support from the Governor, the number of craft breweries has more than doubled from 2012 to 2015, from 95 breweries in 2012 and 207 in January, 2015. Craft beer production is up 54% from 2011 to 2013, to 859,500 barrels.
Consequently, craft beer accounts for 6,552 direct industry jobs in the State of New York, while supporting another 4,800 jobs in related industries. It is responsible for more than USD 2.9 billion in direct and indirect revenue within the state, and another USD 554 million in direct and indirect wages, making up the nearly USD 3.5 billion in total economic impact on the state.
Tourists and New Yorkers alike are flocking to craft breweries and brewpubs. Their visits support more than 3,000 jobs that pay more than $77 million in annual wages and generate more than USD 450 million in revenue.
The US Congress has drafted the Craft Beverage Modernisation and Tax Reform Act which aims to reduce excise taxes, compliance burdens, and regulations on breweries, cideries, wineries, and distilleries. For example, tax provisions in the Act for small breweries would mean that any domestic breweries producing less than 2 million barrels a year would only pay 20% of the standard rate.
In addition, the US Brewers Association receives funding from the United States Department of Agriculture in the form of grants. In 2013, the Brewers Association was awarded USD 458,000 from the Market Access Program and another USD 46,000 from the Emerging Markets Program.
Benchmarking Analysis
Independent Brewing Industry National Economic Evaluation 35
4.3 Conclusions
Australia has one of the highest alcohol excise tax rates in the world, with rates well in excess of Canada, New Zealand, USA and the UK.
In addition to this disparity, only relatively small specific funding is available to support growth in the independent brewing sector in Australia – although recent investment in Victoria is noted, and this is in contrast with other countries where specific grants/financial support are available.
Benchmarking Analysis
Independent Brewing Industry National Economic Evaluation 36
5.1 Key Constraints
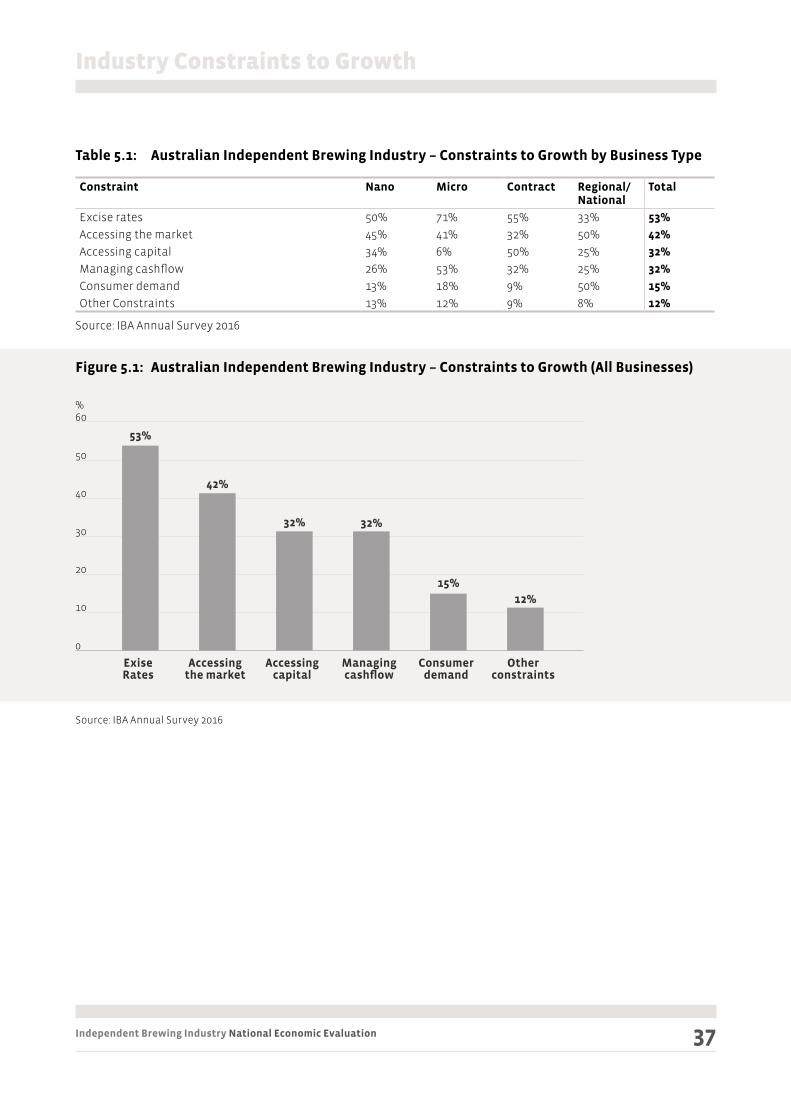
Existing excise rates were the key constraint to growth identified on an industry-wide basis, according to the IBA Annual Survey 2016, with 53% of business identifying this factor. As Table 5.1 and Figure 5.1 highlight, other important constraint factors were associated with accessing the market (42% of businesses regarding this as a growth constraint), accessing capital (32%) and managing cashflow (also 32%) as key growth constraints for their business.
Growth constraints vary depending on business type. For example, excessive excise rates are the major constraint for 71% of microbrewers, whereas only 33% of regional/national brewers regard this factor as the major business growth constraint. Microbrewers also regarded managing cash flow (53%) as a major constraint.
In contrast, regional/national brewers regard accessing the market and consumer demand (both 50%) as the key growth constraints for their businesses.
Key growth constraints for contract brewers were excise rates (55%) and accessing capital (50%), while the main growth constrains identified by nano brewers were excise rates (50%) and accessing the market (45%).
Figure 5.2 presents a summary of growth constraints by business type.
5 Industry Constraints to Growth
Independent Brewing Industry National Economic Evaluation 37
Table 5.1: Australian Independent Brewing Industry – Constraints to Growth by Business Type
Constraint Nano Micro Contract Regional/National
Total
Excise rates 50% 71% 55% 33% 53%
Accessing the market 45% 41% 32% 50% 42%
Accessing capital 34% 6% 50% 25% 32%
Managing cashflow 26% 53% 32% 25% 32%
Consumer demand 13% 18% 9% 50% 15%
Other Constraints 13% 12% 9% 8% 12%
Source: IBA Annual Survey 2016
Figure 5.1: Australian Independent Brewing Industry – Constraints to Growth (All Businesses)
Source: IBA Annual Survey 2016
Industry Constraints to Growth
0
10
20
30
40
60%
50
53%
Exise Rates
32%
Managing cashflow
42%
Accessing the market
15%
Consumer demand
32%
Accessing capital
12%
Other constraints

Independent Brewing Industry National Economic Evaluation 38
Figure 5.2: Australian Independent Brewing Industry – Constraints to Growth (by Business Type)
Source: IBA Annual Survey 2016
Industry Constraints to Growth
10
20
30
40
80%
50
60
70
Exise Rates
Managing cashflow
Accessing the market
Consumer demand
Accessing capital
Other constraints
Nano
Micro
Contract
Regional
0

Independent Brewing Industry National Economic Evaluation 39
5.2 Business Comments
A summary of specific comments made by independent brewing businesses relating to growth constraints is presented as follows:
• “Cashflow and excise go hand in hand. Having to pay excise up-front before moving the beer is making it very difficult for us to expand”.
• “Managing cashflow demand with regard to excise payment terms and balancing that with selling beer on credit terms is quite difficult for a brewing business”.
• “Brewers who own premises should receive excise relief due to their committed infrastructure investment”.
• “Distribution is a major issue, as most of the common distributor models don’t work well with the geographical diversity of Australia. The only real solution is to put people on the ground, but is very costly for independent breweries”.
• “Excise rates are a major constraint. Rates should be line with that of other countries such as USA & Canada, with no ‘penalties’ for packaging in containers less than 48 litres”.
• “Freight and logistics costs are too high”.
• “Red tape is an issue - Council, Licensing and ATO delays relating to licence approval, caused our business to open 7 months after planned”.
• “Access to the market is a major constraint; especially tap contracts and supply/shelf contracts”.
• “Timing of excise payments presents a cashflow burden as payment terms from customers don’t reflect the excise payment cycle”.
5.3 Conclusions
Key constraints to growth for the independent brewing sector are summarised as follows:
1 High excise payments, especially when benchmarked against other countries.
2 Cash flow issues, often relating to the scale and timing of excise payments.
3 Access to markets, especially difficulty securing taps and shelf space for some brewers.
4 Planning delays relating to council permits, liquor licencing, and taxation matters which negatively impact on business planning and operations.
5 High freight, logistics and distribution costs, recognising that many establishments are located in regional and rural areas and therefore require long travel distances to get product to major markets.
Industry Constraints to Growth
Independent Brewing Industry National Economic Evaluation 40
6.1 Key Potential Benefits
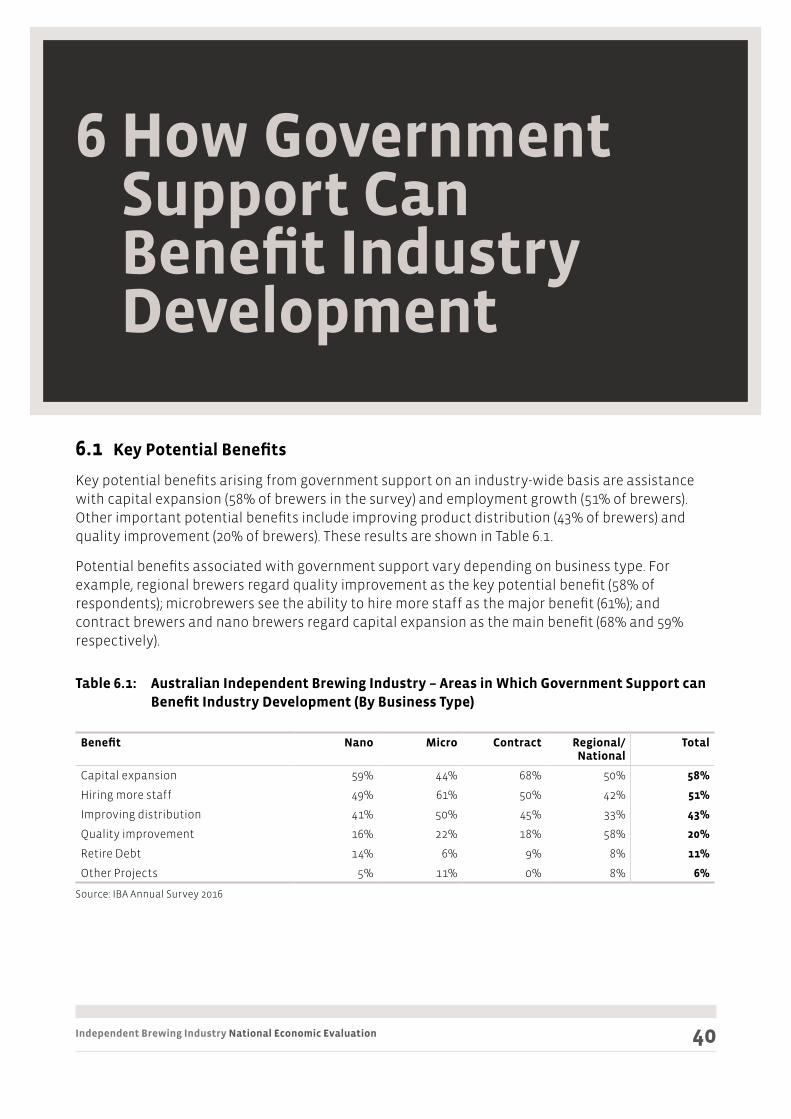
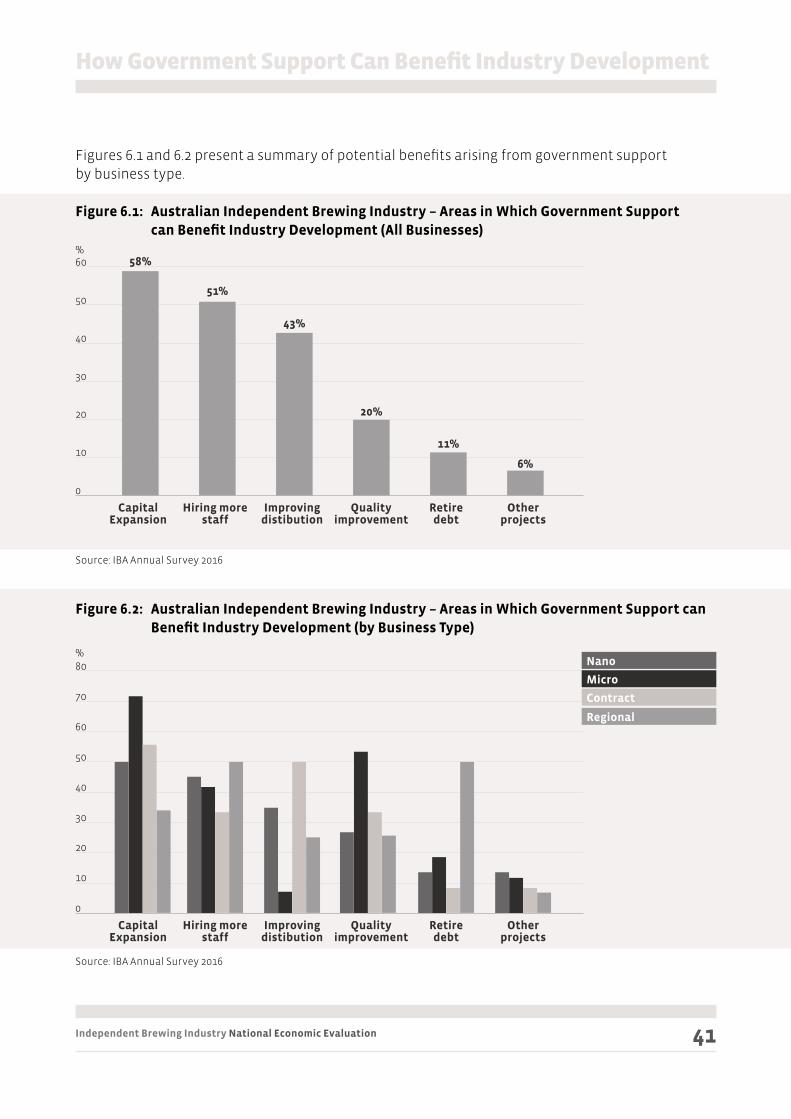
Key potential benefits arising from government support on an industry-wide basis are assistance with capital expansion (58% of brewers in the survey) and employment growth (51% of brewers). Other important potential benefits include improving product distribution (43% of brewers) and quality improvement (20% of brewers). These results are shown in Table 6.1.
Potential benefits associated with government support vary depending on business type. For example, regional brewers regard quality improvement as the key potential benefit (58% of respondents); microbrewers see the ability to hire more staff as the major benefit (61%); and contract brewers and nano brewers regard capital expansion as the main benefit (68% and 59% respectively).
Table 6.1: Australian Independent Brewing Industry – Areas in Which Government Support can Benefit Industry Development (By Business Type)
Benefit Nano Micro Contract Regional/National
Total
Capital expansion 59% 44% 68% 50% 58%
Hiring more staff 49% 61% 50% 42% 51%
Improving distribution 41% 50% 45% 33% 43%
Quality improvement 16% 22% 18% 58% 20%
Retire Debt 14% 6% 9% 8% 11%
Other Projects 5% 11% 0% 8% 6%
Source: IBA Annual Survey 2016
6 How Government Support Can Benefit Industry Development
Independent Brewing Industry National Economic Evaluation 41
Figures 6.1 and 6.2 present a summary of potential benefits arising from government support by business type.
Figure 6.1: Australian Independent Brewing Industry – Areas in Which Government Support can Benefit Industry Development (All Businesses)
Source: IBA Annual Survey 2016
Figure 6.2: Australian Independent Brewing Industry – Areas in Which Government Support can Benefit Industry Development (by Business Type)
Source: IBA Annual Survey 2016
How Government Support Can Benefit Industry Development
0
10
20
30
40
60%
50
58%
Capital Expansion
20%
Quality improvement
51%
Hiring more staff
11%
Retire debt
43%
Improving distibution
6%
Other projects
0
10
20
30
40
80%
50
60
70
Nano
Micro
Contract
Regional
Capital Expansion
Quality improvement
Hiring more staff
Retire debt
Improving distibution
Other projects
Independent Brewing Industry National Economic Evaluation 42
6.2 Business Comments
A summary of specific comments made by independent brewing businesses relating to how government support could help their business is presented as follows:
• “Excise relief equal to winemakers would immediately see our business employ two additional full time staff”.
• “Government support through excise relief would allow us to build our own operation, and employ more people”.
• “Open own brewpub, employ staff and invest in brand development”.
• “Investment in quality assurance equipment and staff to ensure consistency and product longevity, which will increase consumer confidence in independent brewing”.
• “Hire more people to get better distribution and access to the market; expand our brewery operation, in particular packaging equipment and warehousing facilities”.
• “Employ more people, mostly in sales, but some at cellar door for increased service and tourism offerings. Basically, we would reinvest better margins, into job and tourism creation”.
• “Allow us to pay a sales rep in the major capital cities. It would also enable us to put a labelling system on our bottling line and purchase a new brew house”.
• “Enable quality improvement, increased employment, wider distribution and potential export market opportunities”.
• “Move from back shed operation to larger premises and open a cellar door”.
• “Extra funding would improve efficiency of production and cash flow management”.
• “Strengthen quality control and enable quality improvement through hiring additional staff”.
• “Infrastructure and amenities to improve our customer experience, as this would encourage customers to stay longer and spend more at our cellar door and at our events bars. Better ambience, smarter presentation, broader appeal in our retail and food service offerings, more socially-inclusive”.
• “Hire additional staff for branding and marketing”.
• “Purchase further fermenters and invest in packaging equipment, as well as hiring additional staff”.
• “Purchase new efficient equipment and increase production scale”.
• “Keen to invest in energy-efficient and renewable-sourced energy for the brewing process”.
• “Capital expansion and hiring of more brewing staff”.
How Government Support Can Benefit Industry Development
Independent Brewing Industry National Economic Evaluation 43
6.3 Potential Industry Excise Reforms
INCREASING THE LEVEL OF THE BREWERY REFUND TO BE ON PAR WITH THE WET REBATE
RECEIVED BY WINERIES
As part of the 2012-13 Budget, the Federal Government extended the microbreweries excise refund scheme by increasing the maximum refund amount from $10,000 to $30,000 and removing the production eligibility threshold of 30,000 litres of beer.
However, this fell well short of concessions currently available to the wine industry. If the excise refund was increased to a maximum of $350,000 to bring it in line with the maximum WET rebate available to wineries, this would be likely to have considerable benefits for the independent brewing sector and the Australian economy in terms of increased investment, output and employment growth.
INDEXING THE BREWERY REFUND SO THAT IT KEEPS UP WITH THE INCREASES IN EXCISE
At present excise rates on alcohol are indexed twice a year in line with the consumer price index – generally on 1 February and 1 August.
This effectively decreases the amount of the brewery refund, which is not indexed in the same manner.
Reform in this area could include indexing refund levels each 6 months as per excise rates and/or providing a one off increase in the refund to take into account the effective decrease in its value since it came into being in 2012, due to lack of alignment with indexation of excise rates.
CHANGING THE EXCISE SETTLEMENT PERIOD
At present breweries are required to settle their excise on a weekly basis, unless they are eligible for the small business entity concessions which enable them to apply for a monthly settlement period.
Reform should include options for the excise settlement period be extended to allow breweries the choice of weekly, monthly or quarterly settlement which better reflect their business operating environment, particularly cash flows.
A FAIR DEAL ON THE EXCISE RATE FOR 30 LITRE KEGS
At present there is a differential excise rate for beer in 50 litre and 30 litre kegs, with no apparent public policy basis for this.
For beer of 3.5% alcohol by volume in a container of over 48 litres the excise rate is $34.21 per litre of alcohol. The same beer in a 30 litre keg would attract an excise rate of $48.57, a difference of $14.36.
Lowering the excise rate on 30 litre kegs would not only remove this anomaly but would help deal with workplace health and safety issues associated with handling full 50 litre kegs that weigh approximately 65 kilograms.
Reducing the excise rate on 30 litre kegs would enable brewers to take advantage of plastic one way kegs that lower shipping costs and remove the risk of lost kegs, while also allowing breweries to supply beer to more venues such as restaurants where slower turnover makes 50 litre kegs uneconomical.
How Government Support Can Benefit Industry Development
Independent Brewing Industry National Economic Evaluation 44
6.4 Conclusions
Key potential benefits anticipated to flow as a result of Government support for the independent brewing sector are identified as follows:
35 Increased employment generation across a wide range of activities such as brewing, sales, marketing etc.
36 Uplift in capital investment for infrastructure associated with plant and machinery, cellar doors, brewpubs etc.
37 Increase in production levels and improved brewing efficiencies.
38 Improved product quality and increased product range.
39 Better efficiencies in the distribution of product to market.
40 New investment in energy efficient technologies which will increase business viability and improve environmental outcomes.
41 Potential government support to assist the independent brewing industry includes a range of excise reforms such as:
– increasing the brewery tax refund, to allow operators to reduce costs and reinvest in their business
– indexing the brewery tax refund to ensure the refund aligns with increases in excise rates
– extending the excise settlement period to allow business to better manage cash flow
– lowering the excise rate on 30 litre kegs, which will improve workplace health and safety outcomes, reduce shipping costs and allow greater flexibility in supplying smaller hospitality venues.
How Government Support Can Benefit Industry Development