Embed Size (px)
Citation preview

College of Medicine | College of Social Work | Florida State University
Independent Assessment of the
Florida Statewide Medicaid Managed
Care Long-term Care Program
Research Report:
Accessibility and Utilization of LTC Services
Deliverable 12
Prepared for Florida Medicaid
MED 186 | August 29, 2018

1
Florida Medicaid Long-term Care Program
Accessibility and Utilization of LTC Services
Research Report
(SFYs 2014-2015, 2015-2016, and 2016-2017)
Executive Summary
The Independent Assessment of the Florida Statewide Medicaid Managed Care Long-term Care (LTC)
Program examined the accessibility and utilization of long-term care services during state fiscal years 2014-
2015, 2015-2016, and 2016-2017. The evaluation team in concert with the Agency identified key issues of
importance to policy makers and LTC stakeholders. They developed two research questions to guide this
evaluation:
1. Have there been changes in the accessibility of services for enrollees over time?
2. What are the levels of service utilization for enrollees prior to transitioning into the nursing facility?
The analyst on the evaluation team used quantitative methods for analysis of Agency-provided
administrative data. The main findings are as follows.
Over time, increasingly higher proportions of LTC enrollees have received the following services:
adult companion care, adult day health care, home delivered meals, homemaker, medical
equipment and supplies, personal care, personal emergency response, respite care, and
transportation. However, the trend in the level of service use intensity—as measured in units of
service—received under each of these categories remains unknown.
The proportion of home and community-based enrollees residing in assisted living facilities is
decreasing, while the proportion receiving home-based services is increasing.
Greater need for help with bathing and dressing activities of daily living appear to be associated
with higher levels of utilization for adult companion care, homemaker, and personal care services.
Use of adult companion care services, regular receipt of home delivered meals, and personal
emergency response systems are associated with higher odds of transitioning from home-based
settings into nursing facilities.
Missing services is related to the likelihood of transitioning into a nursing facility. Additional analysis
is needed to determine if this relationship results from missing services due to hospitalization or
sudden onset of a significant illness, new diagnosis, or other adverse event.

2
Report Prepared By
Co- Principal Investigator
Henry J. Carretta, PhD
Lead Quantitative Analyst
Kelsey Houser, MA
Data Manager
Glenn Mitchell, PhD
Project Manager
Michael P. Smith, MA, MPA
Project Support
Karen Geletko, MPH
Principal Investigator
Leslie M. Beitsch, MD, JD
3
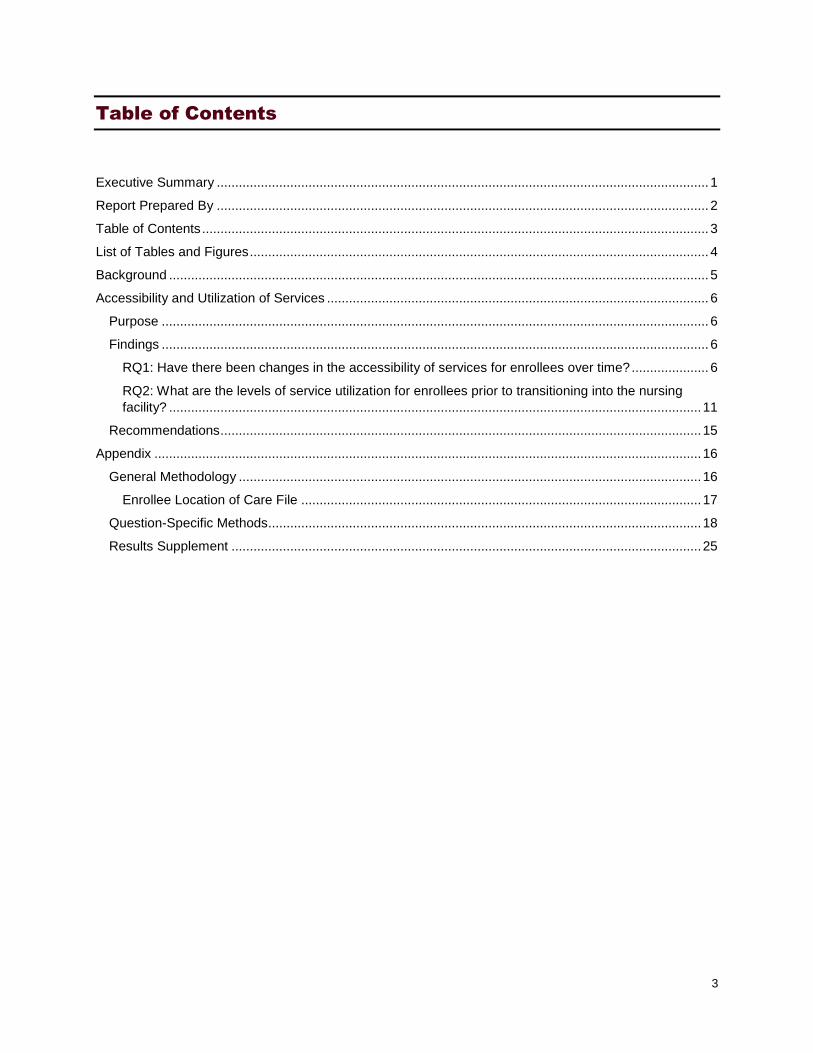
Table of Contents
Executive Summary ...................................................................................................................................... 1
Report Prepared By ...................................................................................................................................... 2
Table of Contents .......................................................................................................................................... 3
List of Tables and Figures ............................................................................................................................. 4
Background ................................................................................................................................................... 5
Accessibility and Utilization of Services ........................................................................................................ 6
Purpose ..................................................................................................................................................... 6
Findings ..................................................................................................................................................... 6
RQ1: Have there been changes in the accessibility of services for enrollees over time? ..................... 6
RQ2: What are the levels of service utilization for enrollees prior to transitioning into the nursing
facility? ................................................................................................................................................. 11
Recommendations ................................................................................................................................... 15
Appendix ..................................................................................................................................................... 16
General Methodology .............................................................................................................................. 16
Enrollee Location of Care File ............................................................................................................. 17
Question-Specific Methods...................................................................................................................... 18
Results Supplement ................................................................................................................................ 25
4
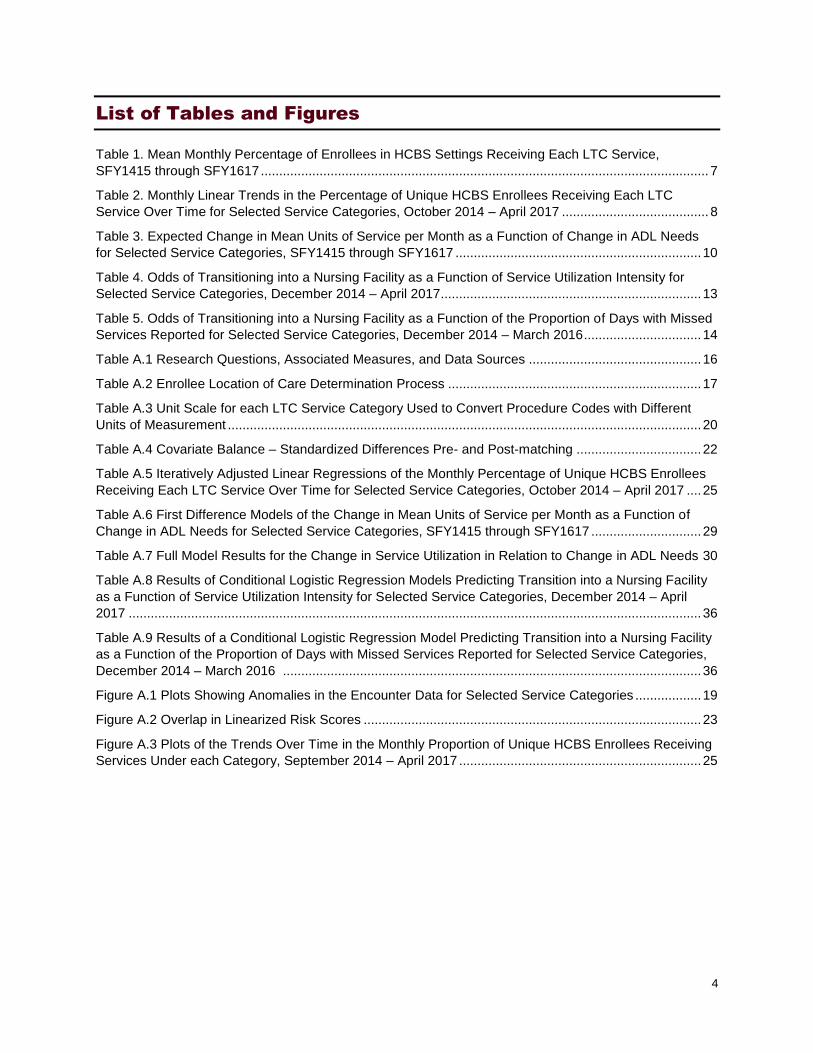
List of Tables and Figures
Table 1. Mean Monthly Percentage of Enrollees in HCBS Settings Receiving Each LTC Service,
SFY1415 through SFY1617 .......................................................................................................................... 7
Table 2. Monthly Linear Trends in the Percentage of Unique HCBS Enrollees Receiving Each LTC
Service Over Time for Selected Service Categories, October 2014 – April 2017 ........................................ 8
Table 3. Expected Change in Mean Units of Service per Month as a Function of Change in ADL Needs
for Selected Service Categories, SFY1415 through SFY1617 ................................................................... 10
Table 4. Odds of Transitioning into a Nursing Facility as a Function of Service Utilization Intensity for
Selected Service Categories, December 2014 – April 2017 ....................................................................... 13
Table 5. Odds of Transitioning into a Nursing Facility as a Function of the Proportion of Days with Missed
Services Reported for Selected Service Categories, December 2014 – March 2016 ................................ 14
Table A.1 Research Questions, Associated Measures, and Data Sources ............................................... 16
Table A.2 Enrollee Location of Care Determination Process ..................................................................... 17
Table A.3 Unit Scale for each LTC Service Category Used to Convert Procedure Codes with Different
Units of Measurement ................................................................................................................................. 20
Table A.4 Covariate Balance – Standardized Differences Pre- and Post-matching .................................. 22
Table A.5 Iteratively Adjusted Linear Regressions of the Monthly Percentage of Unique HCBS Enrollees
Receiving Each LTC Service Over Time for Selected Service Categories, October 2014 – April 2017 .... 25
Table A.6 First Difference Models of the Change in Mean Units of Service per Month as a Function of
Change in ADL Needs for Selected Service Categories, SFY1415 through SFY1617 .............................. 29
Table A.7 Full Model Results for the Change in Service Utilization in Relation to Change in ADL Needs 30
Table A.8 Results of Conditional Logistic Regression Models Predicting Transition into a Nursing Facility
as a Function of Service Utilization Intensity for Selected Service Categories, December 2014 – April
2017 ............................................................................................................................................................ 36
Table A.9 Results of a Conditional Logistic Regression Model Predicting Transition into a Nursing Facility
as a Function of the Proportion of Days with Missed Services Reported for Selected Service Categories,
December 2014 – March 2016 .................................................................................................................. 36
Figure A.1 Plots Showing Anomalies in the Encounter Data for Selected Service Categories .................. 19
Figure A.2 Overlap in Linearized Risk Scores ............................................................................................ 23
Figure A.3 Plots of the Trends Over Time in the Monthly Proportion of Unique HCBS Enrollees Receiving
Services Under each Category, September 2014 – April 2017 .................................................................. 25

5
Background
In 2011, the Florida Legislature voted to move most Medicaid recipients, including those receiving long-
term care (LTC) services, into a managed care system. Specifically, House Bill 7107 created Section 409
of Florida Statutes to establish a statewide long-term care managed care program for Medicaid recipients
who are (a) 65 years of age or older, or age 18 or older and eligible for Medicaid by reason of a disability;
and (b) determined to require nursing facility (NF) level of care.1 The Florida Agency for Health Care
Administration (AHCA), hereafter referred to as “the Agency,” subsequently submitted a 1915(b) and
1915(c) waiver application to the Centers for Medicare and Medicaid Services (CMS) requesting to
implement the Florida Long-term Care Managed Care Program. The Agency received approval for both
waivers from CMS on February 1, 2013 and began administering the program in partnership with the
Department of Elder Affairs (DOEA).
The Agency used a staggered rollout schedule to successively introduce the program in eleven
regions of the state starting in August 2013 and concluding in March 2014. Approximately 83,000 Medicaid
recipients were moved from the previous multi-waiver, mixed reimbursement system2 directed by the state
to a managed care model using capitated payments to private managed care plans. In addition,
approximately 100,000 new3 Medicaid recipients have been enrolled since the state implemented the
program. The Legislature directed the Agency to adjust managed care plan capitated rates annually to
provide an incentive to shift services from nursing facilities to home and community-based settings. Seven4
managed care plans were contracted by the Agency to provide LTC services to nearly all Medicaid
recipients who met the financial qualifications and level of care requirements. Each of the state’s eleven
regions has at least two managed care plans offering services to enrollees.
Per federal waiver requirements, the Agency contracted with Florida State University (FSU) to
conduct annual independent assessments of the LTC Program. The evaluation team at FSU has previously
examined access to care, quality of care, and cost of care in separate comprehensive reports for state fiscal
1 The following waiver participants were permitted to voluntarily transition into the program if they were also receiving long-term care services and met LTC program criteria: Developmental Disabilities, Model, Traumatic Brain and Spinal Injury, Project AIDS Care, Adult Cystic Fibrosis, and Familial Dysautonomia Waiver participants as well as those receiving services under the Program of All-Inclusive Care for the Elderly. All other eligible Medicaid recipients of LTC services in the pre-LTC era were required to transition into the program. This population included those meeting eligibility requirements who were receiving services under any of the five waivers described in footnote 2 below as well as those receiving Medicaid funded long-term nursing facility care. 2 Pre-LTC reimbursement systems for waivers required to transition by law were structured as follows: the Aged & Disabled Adult waiver used a fee-for-service reimbursement system; the Nursing Home Diversion waiver used a risk-adjusted, capitated monthly rate system; the Assisted Living for the Elderly waiver used a mixed system, with assisted living services reimbursed at a daily rate, case management services reimbursed at a monthly rate, and incontinence supplies reimbursed at a monthly use-based rate; the Channeling for the Frail Elder waiver used a contracted per-person daily rate. 3 For the purposes of this report anyone who enrolled in the LTC program starting in August 2013 through June 2017 and did not receive LTC services through Florida Medicaid prior to August 2013 is designated a “new” enrollee. 4 In September 2013 Humana received regulatory approval to acquire American Eldercare, Inc. The plans officially merged in July 2015, after which there were only six LTC plans in operation in the state.

6
years (SFYs5) 2013-2014 and 2014-2015. The evaluation period for this special research report is SFYs
2014-2015, 2015-2016, and 2016-2017, and the topic is limited to accessibility and utilization of services.
Accessibility and Utilization of Services
Purpose
This inaugural special research report focuses on accessibility and utilization of services. The evaluation
team and the Agency identified key issues of importance to policy makers and LTC stakeholders related to
access and utilization. Together they then developed two research questions (RQs):
1. Have there been changes in the accessibility of services for enrollees over time?
2. What are the levels of service utilization for enrollees prior to transitioning into the nursing facility?
The evaluation team addressed these questions using strictly quantitative methods for analysis of Agency-
provided administrative data. Unless otherwise indicated, the evaluation team presents findings for
SFY1415, SFY1516, and SFY1617. The Appendix to this report provides more detailed information on the
methodology and data sources.
Findings
RQ1: Have there been changes in the accessibility of services for enrollees over time?
As more and more enrollees shift out of nursing facilities and into home and community-based settings,
one major area of concern is possible downstream effects on the accessibility of services. Newly
transitioned enrollees should not impact the accessibility of services for enrollees already residing in their
homes/communities, and newly transitioned enrollees should experience levels of accessibility comparable
to those experienced by enrollees who are already receiving home and community-based services (HCBS).
Relatedly, service utilization should track in accordance with need. While enrollees must have equal access
to services, administrative data for enrollees with greater needs should indicate higher levels of utilization.
The analysis for RQ1 responds to these concerns by assessing changes in service utilization over time and
exploring the relationship between service utilization and enrollees’ activities of daily living (ADL) needs.
I. Trends in service utilization over time
Because the primary intent of the LTC Program is to shift enrollees out of nursing facilities and into home
and community-based settings, the number of enrollees receiving HCBS should increase over time.
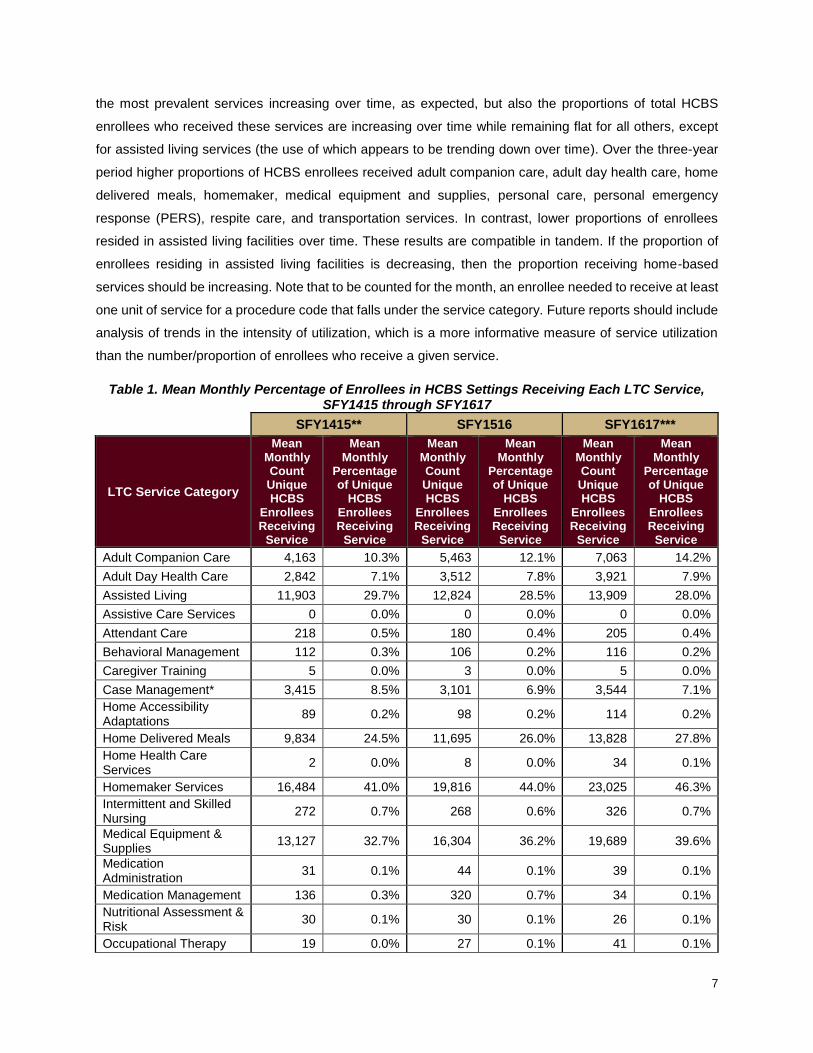
Accordingly, Table 1 (columns 2, 4, and 6) shows the absolute counts of enrollees receiving HCBS increase
over time for many—including the most widely used—service categories. Table 1 also presents the mean
monthly percentage of unique HCBS enrollees who received a given service in each of the three fiscal
years (columns 3, 5, and 7). The table shows that not only are absolute counts of enrollees who received
5 Hereafter, state fiscal years are denoted by SFY1415, SFY1516, and SFY1617. Each state fiscal year encompasses July through June of two consecutive calendar years.
7
the most prevalent services increasing over time, as expected, but also the proportions of total HCBS
enrollees who received these services are increasing over time while remaining flat for all others, except
for assisted living services (the use of which appears to be trending down over time). Over the three-year
period higher proportions of HCBS enrollees received adult companion care, adult day health care, home
delivered meals, homemaker, medical equipment and supplies, personal care, personal emergency
response (PERS), respite care, and transportation services. In contrast, lower proportions of enrollees
resided in assisted living facilities over time. These results are compatible in tandem. If the proportion of
enrollees residing in assisted living facilities is decreasing, then the proportion receiving home-based
services should be increasing. Note that to be counted for the month, an enrollee needed to receive at least
one unit of service for a procedure code that falls under the service category. Future reports should include
analysis of trends in the intensity of utilization, which is a more informative measure of service utilization
than the number/proportion of enrollees who receive a given service.
Table 1. Mean Monthly Percentage of Enrollees in HCBS Settings Receiving Each LTC Service, SFY1415 through SFY1617
SFY1415** SFY1516 SFY1617***
LTC Service Category
Mean Monthly Count Unique HCBS
Enrollees Receiving
Service
Mean Monthly
Percentage of Unique
HCBS Enrollees Receiving
Service
Mean Monthly Count Unique HCBS
Enrollees Receiving
Service
Mean Monthly
Percentage of Unique
HCBS Enrollees Receiving
Service
Mean Monthly Count Unique HCBS
Enrollees Receiving
Service
Mean Monthly
Percentage of Unique
HCBS Enrollees Receiving
Service
Adult Companion Care 4,163 10.3% 5,463 12.1% 7,063 14.2%
Adult Day Health Care 2,842 7.1% 3,512 7.8% 3,921 7.9%
Assisted Living 11,903 29.7% 12,824 28.5% 13,909 28.0%
Assistive Care Services 0 0.0% 0 0.0% 0 0.0%
Attendant Care 218 0.5% 180 0.4% 205 0.4%
Behavioral Management 112 0.3% 106 0.2% 116 0.2%
Caregiver Training 5 0.0% 3 0.0% 5 0.0%
Case Management* 3,415 8.5% 3,101 6.9% 3,544 7.1%
Home Accessibility Adaptations
89 0.2% 98 0.2% 114 0.2%
Home Delivered Meals 9,834 24.5% 11,695 26.0% 13,828 27.8%
Home Health Care Services
2 0.0% 8 0.0% 34 0.1%
Homemaker Services 16,484 41.0% 19,816 44.0% 23,025 46.3%
Intermittent and Skilled Nursing
272 0.7% 268 0.6% 326 0.7%
Medical Equipment & Supplies
13,127 32.7% 16,304 36.2% 19,689 39.6%
Medication Administration
31 0.1% 44 0.1% 39 0.1%
Medication Management 136 0.3% 320 0.7% 34 0.1%
Nutritional Assessment & Risk
30 0.1% 30 0.1% 26 0.1%
Occupational Therapy 19 0.0% 27 0.1% 41 0.1%

8
SFY1415** SFY1516 SFY1617***
LTC Service Category
Mean Monthly Count Unique HCBS
Enrollees Receiving
Service
Mean Monthly
Percentage of Unique
HCBS Enrollees Receiving
Service
Mean Monthly Count Unique HCBS
Enrollees Receiving
Service
Mean Monthly
Percentage of Unique
HCBS Enrollees Receiving
Service
Mean Monthly Count Unique HCBS
Enrollees Receiving
Service
Mean Monthly
Percentage of Unique
HCBS Enrollees Receiving
Service
Personal Care 16,871 42.0% 20,126 44.7% 23,191 46.7%
PERS 7,187 17.9% 8,330 18.5% 10,188 20.5%
Physical Therapy 53 0.1% 77 0.2% 112 0.2%
Respiratory Therapy 5 0.0% 6 0.0% 9 0.0%
Respite Care 3,591 8.9% 4,310 9.6% 4,886 9.8%
Speech Therapy 5 0.0% 7 0.0% 10 0.0%
Transportation 970 2.4% 1,662 3.7% 2,408 4.8%
Notes: The mean monthly count of HCBS enrollees in SFY1415 was 39,803, in SFY1516 was 45,027, and in SFY1617 was 50,295. Enrollees can receive multiple services each month; enrollee counts are unique within but not across service categories. Sources: AHCA’s LTC service category crosswalk, FSU created enrollee LOC file (see Appendix), LTC encounter records * Not an accurate representation of case management services received due to administrative challenges with reporting (most of the plans handle case management internally, thus, case management encounters are not reported by every plan). ** Excludes July 2014 and August 2014 (because AEC was a FFS-based plan and services appear underreported during these two months) ***Excludes May 2017 and June 2017 due to concerns over encounter run-out time (plans may not receive claims from providers for several months after a service has been provided).
While Table 1 provides an overview of service utilization over time, it is unclear whether those
results represent meaningful changes. The apparent trends should be tested for statistical significance.
Hence, Table 2 presents results of the tests of monthly trends in the proportion of HCBS enrollees who
received at least one unit of service. The table is limited to categories in which at least 1% of HCBS
enrollees received services on average each month. The results indicate that all monthly trends in the
proportion of unique HCBS enrollees receiving each service are statistically significant and positive, except
for the proportion residing in assisted living facilities, which trends down over time.6 Overall, the results do
not provide evidence that newly transitioned enrollees negatively affect the accessibility of HCBS.
Nevertheless, this metric is not a measure of individual-level service use intensity, which should be included
in future analysis.
Table 2. Monthly Linear Trends in the Percentage of Unique HCBS Enrollees Receiving Each LTC Service Over Time for Selected Service Categories, October 2014 – April 2017
LTC Service Category Monthly
trend
Adult Companion Care +0.17%
Adult Day Health Care +0.03%
Assisted Living -0.09%
6 See the Appendix for plots showing the actual trends and fitted regression lines. Analysis for a few categories is potentially confounded where reporting was inconsistent for some plans over time. The Appendix highlights these potential problem areas, although they appear unlikely to have altered the direction or interpretation of any of the trends. Data validation revealed some probable incompleteness in the encounter data toward the end of SFY1617. As a result, positive trends may be slightly underestimated. The only negative trend (for ALF) is not affected, as reporting toward the end of SFY1617 for assisted living services appears complete.

9
LTC Service Category Monthly
trend
Home Delivered Meals +0.14%
Homemaker Services +0.25%
Medical Equipment and Supplies +0.31%
Personal Care +0.22%
PERS +0.11%
Respite Care +0.03%
Transportation +0.10%
All trends significant at the p < .005 level Note: For full model results see the Appendix. Sources: AHCA’s LTC service category crosswalk, FSU created enrollee LOC file (see Appendix), LTC encounter records
II. Change in service utilization in relation to change in ADL needs
Ideally, enrollees’ service utilization levels track with their individual needs. Need for services is difficult to
measure, but a reasonable measure in the context of LTC services is enrollees’ activities of daily living
(ADL) needs. One would expect that changes in bathing, dressing, eating, toileting, transferring, or walking
abilities result in parallel changes in service needs, especially for enrollees who experience sudden, severe
ADL limitations. Therefore, the evaluation team developed statistical models designed to assess whether
service utilization escalates/declines for enrollees who experience changes in their ADL needs. These
models include a measure of service utilization that is more informative than previous measures the
evaluation team has used because it incorporates intensity of service use, expressed in units of service
(UOS) for each enrollee (as opposed to less informative binary7 measures of service use in a given month).
Note that this analysis excludes any enrollees who resided in assisted living facilities because ALFs provide
fairly comprehensive LTC services that are not measurable via encounter data. For instance, if a person
receives personal care services in an ALF, this service is not usually reported as a separate encounter.
Any attempt to measure changes for those who resided in an ALF and then moved into a home-based
setting, or vice versa, could overestimate changes in service utilization, regardless of any change in ADL
needs. This analysis also excludes all enrollees who are members of the UnitedHealthcare plan because
United’s encounter records did not align with the other plans’ data.
Based on each enrollee’s 701B comprehensive assessment8 and LTC encounter records, the
analyst calculated changes in ADL needs, the change in the intensity of service use within each service
category, and changes in relevant covariates between an established baseline and comparison period for
all qualifying9 enrollees. The analysis includes measures of four separate ADL needs: hygiene needs
7 Any amount of services received in the month (1) or no services received in the month (0) that fall under a given service category. 8 DOEA staff first perform these assessments to determine if Medicaid recipients who apply for LTC services meet the eligibility requirements, viz., require nursing facility level of care. Case managers are then supposed to complete assessments for home and community-based enrollees on at least an annual basis to track enrollees’ functional, health, and cognitive status as well as their existing support systems. 9 See Appendix.

10
(bathing and dressing combined), eating needs, toileting needs, and mobility needs (transferring and
walking combined). Each need is measured on a scale from 0-4, with 0 indicating “no assistance needed”
and 4 indicating “total assistance needed.”
The analyst then assessed the relationship between the change in mean units of service per 30-
days and the change in enrollees’ ADL needs for each of the nine service categories that met the above-
mentioned 1% utilization threshold. Table 3 presents the results. Changes in hygiene needs are positively
related to the change in service use intensity for three categories: adult companion care, homemaker, and
personal care services. Specifically, when holding other conditions related to service use (e.g., inpatient
days) constant, for every 1-point increase in an enrollee’s hygiene need score, their expected units of
service increased by about 9 minutes per month for adult companion care and homemaker services and
about 16 minutes per month for personal care services. Unexpectedly, changes in mobility needs were
negatively related to the use of personal emergency response systems. However, it is unlikely this
relationship is meaningful.10 Clearly, the magnitude of these relationships is quite small, which should call
into question the substantive significance (meaningfulness) of the results. However, because service
utilization intensity is measured separately for each category, their combined increase in service use
intensity may be meaningful. As difficult as it is to measure service needs, it is not possible to measure
enrollee preferences with the administrative data available to the evaluation team. Enrollee preferences
and unmeasurable (at least quantitatively) diversity in service needs also dictate the services enrollees
receive. Therefore, including measures of personal preferences and additional measures of service needs
would improve the analysis.
Table 3. Expected Change in Mean Units of Service per Month as a Function of Change in ADL Needs for Selected Service Categories, SFY1415 through SFY1617
LTC Service Category ADL Change Unit Type
Adult Companion Care
Hygiene +9.42 minutes*
Eating +5.62 minutes
Toileting +0.91 minutes
Mobility -4.06 minutes
Adult Day Health Care
Hygiene +4.12 minutes
Eating -7.72 minutes
Toileting +2.98 minutes
Mobility -13.70 minutes
Home Delivered Meals
Hygiene +0.06 meals
Eating +0.03 meals
Toileting -0.20 meals
Mobility -0.05 meals
10 Going from needing no help with mobility to total assistance with mobility would reduce the proportion of months with a PERS by 3%. For a full year, this represents a reduction in PERS services for 1/3 of a month, which is a meaningless quantity when an enrollee can either receive (1) or not receive (0) PERS services in a given month.

11
LTC Service Category ADL Change Unit Type
Homemaker Services
Hygiene +9.34 minutes*
Eating -3.94 minutes
Toileting +6.99 minutes
Mobility -7.46 minutes
Medical Equipment and
Supplies
Hygiene +0.32 items
Eating +0.50 items
Toileting -0.23 items
Mobility -0.24 items
Personal Care
Hygiene +16.07 minutes*
Eating +9.34 minutes
Toileting +11.16 minutes
Mobility -6.93 minutes
PERS11
Hygiene +0.10 % of months
Eating +0.19 % of months
Toileting -0.13 % of months
Mobility -0.38 % of months*
Respite Care
Hygiene +4.59 minutes
Eating +5.84 minutes
Toileting +6.52 minutes
Mobility +5.49 minutes
Transportation
Hygiene +0.05 trips
Eating -0.02 trips
Toileting -0.04 trips
Mobility -0.01 trips
*Significant at Bonferroni adjusted alpha level of 0.0014 Note: For full model results see the Appendix. Each model controls for changes in caregiver status (loss or gain), significant weight loss (5% bodyweight or more), health shocks (new amputation, cancer diagnosis, diabetes diagnosis, cardiac problems, kidney disease, liver disease, lung problems, Parkinson’s diagnosis, paralysis event(s), seizure event(s), stroke event(s), and/or tumor occurrences), aggregate changes in IADL needs, changes in the number of inpatient days between periods, percent change in the length of each period, changes in plan membership, changes in region of residence, and quarter of measurement. Sources: 701B Assessments, FSU created enrollee LOC file (see Appendix), AHCA’s LTC service category crosswalk, LTC encounter
records, FL Center inpatient data
RQ2: What are the levels of service utilization for enrollees prior to transitioning into the nursing facility?
The Agency specifically requested that the evaluation team investigate the relationship between service
utilization and enrollee transitions from home-based settings into nursing facilities. For the reasons detailed
above, this analysis includes enrollees who resided in home and community-based settings but excludes
those who resided in assisted living facilities (i.e., the included locations of care are personal, group, and
11 Since an enrollee can only receive one PERS UOS per month, PERS service use was measured differently than the other services. The analyst measured this service use as the proportion of months an enrollee had a PERS during each period.

12
adult family care homes). Understanding if enrollees who transition have markedly different levels of
utilization for any category of services prior to transitioning requires comparing their levels of service use
to levels for enrollees who remain in-home. This analysis is particularly complex, as those who transition
differ from those who remain in-home in many ways that are related to both service utilization and the
probability of transitioning. The evaluation team tried to mitigate these differences by matching enrollees
as described in the Appendix. Moreover, one may expect that the level of service use within each category
could be higher or lower for those who transition. Service use levels may be higher and merely associative
if those who transition happen to have greater service needs, while levels may be lower and causal if
transitioning into a nursing facility is more likely to occur when enrollees are not receiving the services they
need. If both scenarios hold, the differential effects of service use on those who transition relative to those
who do not may be negligible. With these complications in mind, the evaluation team examined the
relationship between service use intensity and transition. The evaluation team also performed a related
follow-up analysis examining the relationship between missed services rates for enrollees who transitioned
versus those who remained in-home. The analysis for RQ2 also excludes enrollees who are members of
the UnitedHealthcare plan. Additional criteria for inclusion and other methodological considerations are
detailed in the Appendix.
I. Comparison of the levels of service utilization for enrollees who transitioned into nursing
facilities versus levels for enrollees who remained in their homes
After matching12 enrollees who transferred into nursing facilities to those who remained in-home, the analyst
ran a conditional logistic regression model that predicts transition into a nursing facility for each of the nine
service categories that met the above-mentioned 1% utilization threshold. The models include an indicator
(Svc Received) for whether the enrollee received any services that fell under a given service category and
a measure of service use intensity (Intensity). Intensity was measured via the mean number of UOS per
30-days an enrollee received during the six-month observation period.13 The results in Table 4 suggest that
receiving adult companion care as well as having a personal emergency response system are related to
transitioning into a nursing facility. The odds of transitioning into a nursing facility for enrollees who receive
adult companion care services are 43% higher than the odds for enrollees who do not receive this service,
while the odds are 25% higher for those who have a personal emergency response system. However, there
is no relationship between service use intensity and the odds of transitioning for either of these services.
The fact that receiving these services but not the intensity of their use predicts transition could mean that
needing these services and/or personal preference for these services index some unmeasured factor(s)
that is associated with transition into nursing facilities. For example, needing an adult companion and/or
PERS may indicate inadequate caregiver support or loss of a caregiver that was not captured via an
12 The matching method is detailed in the Appendix, but to summarize, enrollees were matched on a score that predicts—independent of service utilization levels—the risk of transitioning into a nursing facility. Matched participants are more similar in observed characteristics and may also be more similar in unobserved and, therefore, uncontrollable characteristics. 13 PERS intensity not measured because only 1 unit of service allowed per month, and most enrollees with a personal emergency response system have it for all six observation months.

13
assessment record (due to differences in the timing of the loss versus the timing of the next 701B
assessment), although it should be noted that not all enrollees require a caregiver.
The results for home delivered meals are more complicated. In this case the intensity of services
is associated with the probability of transitioning. Of the enrollees who received at least one home delivered
meal per 30 days14, 4 out of 5 (78%) received at least 15 home delivered meals. The odds of transitioning
for those who received 15 home delivered meals are approximately equal to the odds for those who
received no home delivered meals (an odds ratio of 0.98 vs. 1, respectively). Conversely, the odds of
transitioning for those who received 30 home delivered meals are 22% higher than the odds for those who
received no meals.15 Like adult companion care and PERS, the regular need for meals could also indicate,
for those who require a caregiver, inadequate caregiver support or loss of a caregiver that was not captured
via an assessment record. In the case of the former, a caregiver who works full-time is unlike a caregiver
who does not work at all or only works part-time. The 701B assessment records procured by the evaluation
team do not contain this variable, but an enrollee whose caregiver works full-time may be more likely to
need services like adult companion care. In the case of the latter, the 701B assessment is repeated
annually, except in special circumstances. Loss of a caregiver in between assessments may not show up
in the data until the assessment is completed anew.
Table 4. Odds of Transitioning into a Nursing Facility as a Function of Service Utilization Intensity for Selected Service Categories, December 2014 – April 2017
LTC Service Category Measure Transition
Odds Ratio
Adult Companion Care Svc Received 1.43*
Intensity 1.00
Adult Day Health Care Svc Received 1.14
Intensity 1.00
Home Delivered Meals Svc Received 0.79
Intensity 1.01*
Homemaker Services Svc Received 1.21
Intensity 1.00
Medical Equipment and Supplies Svc Received 1.24
Intensity 1.00
Personal Care Svc Received 1.19
Intensity 1.00
PERS Svc Received 1.25*
Respite Care Svc Received 1.03
Intensity 1.00
Transportation Svc Received 1.02
Intensity 1.01
*Significant at Bonferroni adjusted alpha level of 0.0028 Note: For full model results see the Appendix.
Sources: 701B Assessments, FSU created enrollee LOC file (see Appendix), AHCA’s LTC service category crosswalk, LTC encounter records, FL Center inpatient data, enrollee eligibility data (for demographic information)
14 1,480 out of 3,384, so 44%, averaged at least one meal per 30 days (rounded to the nearest whole number). 15 11% of enrollees in the sample averaged at least 30 meals every 30 days.

14
The reader should note that a measure(s) of health status/risk, which is undoubtedly related to the
odds of transitioning into a nursing facility, could not be included in the models. The reason being, most
enrollees in the LTC program (upwards of 90%) are dually eligible for Medicare, and obtaining Medicare
claims data for calculating these measures is cost prohibitive. It is possible that poorer health status is
associated with receiving the services that were identified as positively related to transitioning into a nursing
facility. Future analysis should attempt to determine whether differences in health status (as well as
differences in the timing of 701B assessment records) may be partially driving the observed results.
II. Comparison of missed service rates for enrollees who transitioned into nursing facilities versus
rates for enrollees who remained in their homes
The analyst calculated missed service rates for each enrollee as the proportion of days in the six-month
period for which plan administrators reported the enrollee missed services, regardless of how many units
or types of service were missed. The model used for this analysis is the same as the model used for analysis
of RQ2.I, except the independent variable of interest is now the missed service rate. The results in Table 5
suggest that missing services is indeed related to the probability of transitioning into a nursing facility, even
after controlling for the number of inpatient days an enrollee experiences, which is especially necessary
because hospitalization is the most common reason for missing services. The maximum proportion of days
with missed services for an individual enrollee was 33.5%. Hence, it is both more informative and valid to
examine the effect of missing services at levels below this threshold. Accordingly, the odds of transitioning
into a nursing facility for enrollees who missed services in 5%, 10%, 20%, and 30% of their six-month period
are, respectively, 1.47, 2.15, 4.64, and 9.99 times higher than the odds for enrollees who did not miss any
services. In other words, missing services seems to be highly related to nursing facility transitions. But
additional analysis is necessary to confirm that this measure is not merely a proxy for the number of
inpatient days that enrollees experience, which often precede transition into a nursing facility. This
additional analysis is especially necessary because most plans appear to inconsistently report missed
services, and the most frequent reason for missing services is an inpatient event.16
Table 5. Odds of Transitioning into a Nursing Facility as a Function of the Proportion of Days with Missed Services Reported for Selected Service Categories, December 2014 – March 2016
Percentage of
days with
missed services
Transition
Odds Ratio
5% 1.47
10% 2.15
20% 4.64
30% 9.99
Sources: 701B Assessments, FSU created enrollee LOC file (see Appendix), AHCA’s LTC service category crosswalk,
FL Center inpatient data, enrollee eligibility data (for demographic information), Missed services reports
16 Inpatient events were identified by searching the explanation field in the Missed Services Reports for “hospital,” “inpatient,” and “acute care.”

15
Recommendations
What follows is a list of recommendations that, if implemented, would enhance analysis of the accessibility
and utilization of services under future evaluations.
1) Conduct additional analysis to determine if enrollees with less recent 701B assessment records
are driving the relationship between the use of certain services (adult companion care, regular
receipt of home delivered meals, and personal emergency response systems) and the odds of
transitioning into a nursing facility.
2) Conduct additional analysis to determine if health status/risk is partially determining the relationship
between the use of the abovementioned services and the odds of transitioning into a nursing facility.
3) Conduct additional analysis to determine if missing services is indeed related to transition or is
merely a proxy measure of hospitalization.
- Determine if any specific reason(s) for missing services (other than hospitalization) or
the type of service missed relates to enrollee transition into a nursing facility.
4) Create an overall measure of service use that may be used to determine if ADL needs are related
to service utilization in general. Adult companion care, adult day health care, homemaker, and
personal care services are potentially combinable owing to their measurement (quarter hour
increments) and conceptual similarities.

16
Appendix
General Methodology
The evaluation team used quantitative methods to measure associations between the explanatory and
outcome variables of interest. All data sources are retrospective data collected for administrative purposes
by the Agency, DOEA, and the seven managed care plans during SFY1415, SFY1516, and SFY1617. As
the design is either purely correlational (RQ1) or observational in nature (RQ2), the evaluation team
stresses that the results and subsequent interpretation do not imply any causal relationships. Significant
findings of interest to the Agency may call for further investigation that, where possible, better leverages
causal design strategies.
Each research question entailed multiple comparisons (hypothesis tests), so the analyst used a
Bonferroni correction to adjust the significance threshold for each group of models. The correction requires
dividing the standard alpha level of 0.05 by the number of tests conducted. It is a conservative approach to
mitigating the probabilistic increase in false positives that occurs when multiple hypotheses are tested at
once. Prominent statisticians17 argue that conservatism is a benefit; chiefly, it reduces the number of
spurious associations reported to stakeholders.
Analysis for each RQ relied on the measures and data sources outlined in Table A.1. Additional
detail about methods specific to individual RQs and measures follow this section.
Table A.1 Research Questions, Associated Measures, and Data Sources
RQ#
Research Question Measures Data Sources
1
Have there been changes in the accessibility of services for enrollees over time?
i. Trends in service utilization over time i. AHCA’s LTC service category crosswalk, FSU created LOC file, LTC encounter data
ii. Change in service utilization in relation to change in ADL needs
ii. AHCA’s LTC service category crosswalk, FSU created LOC file, LTC encounter data
2
What are the levels of service utilization for enrollees prior to transitioning into the nursing facility?
i. Comparison of the levels of service utilization for enrollees who transitioned into nursing facilities versus levels for enrollees who remained in their homes
i. AHCA’s LTC service category crosswalk, FSU created LOC file, Enrollee eligibility file (demographic data), LTC encounter data, 701B comprehensive assessments, FL Center inpatient data
17 E.g., Johnson, VE. Revised standards for statistical evidence. Proceedings of the National Academy of Sciences. 2013;70(2):19313-19317.
17
RQ#
Research Question Measures Data Sources
ii. Comparison of missed service rates for enrollees who transitioned into nursing facilities versus rates for enrollees who remained in their homes
ii. AHCA’s LTC service category crosswalk, FSU created LOC file, Enrollee eligibility file (demographic data), Missed Services reports, 701B comprehensive assessments, FL Center inpatient data
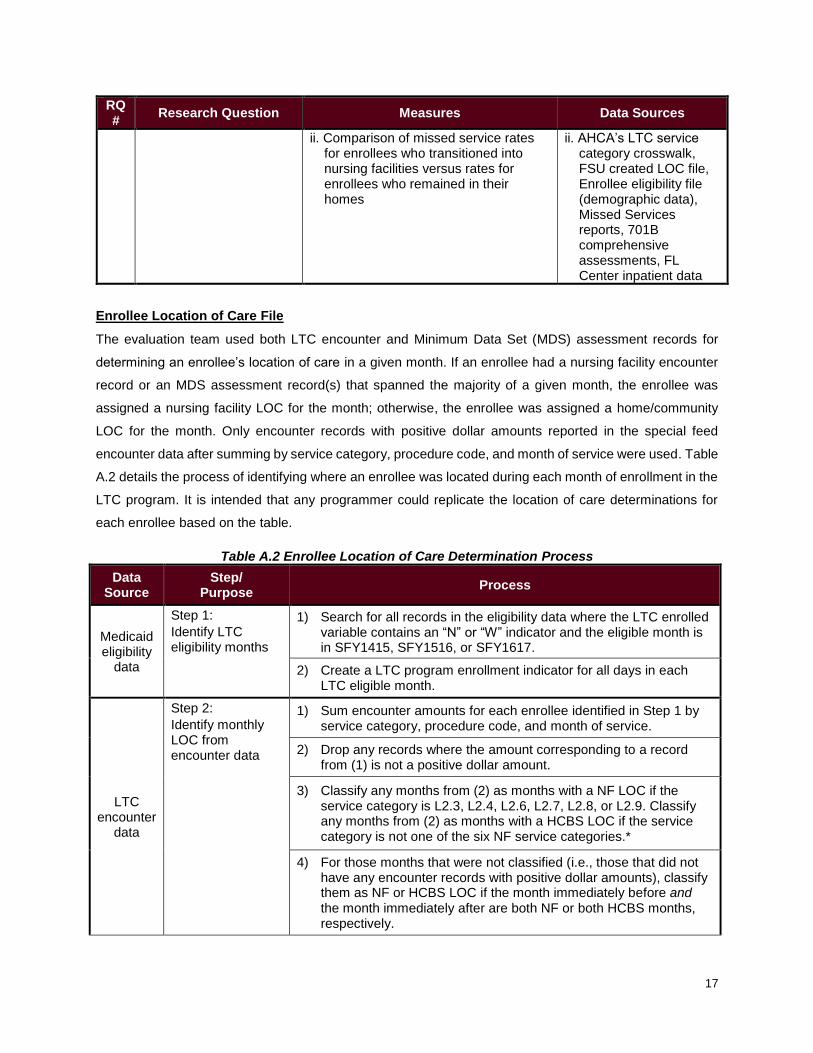
Enrollee Location of Care File
The evaluation team used both LTC encounter and Minimum Data Set (MDS) assessment records for
determining an enrollee’s location of care in a given month. If an enrollee had a nursing facility encounter
record or an MDS assessment record(s) that spanned the majority of a given month, the enrollee was
assigned a nursing facility LOC for the month; otherwise, the enrollee was assigned a home/community
LOC for the month. Only encounter records with positive dollar amounts reported in the special feed
encounter data after summing by service category, procedure code, and month of service were used. Table
A.2 details the process of identifying where an enrollee was located during each month of enrollment in the
LTC program. It is intended that any programmer could replicate the location of care determinations for
each enrollee based on the table.
Table A.2 Enrollee Location of Care Determination Process
Data Source
Step/ Purpose
Process
Medicaid eligibility
data
Step 1:
Identify LTC eligibility months
1) Search for all records in the eligibility data where the LTC enrolled variable contains an “N” or “W” indicator and the eligible month is in SFY1415, SFY1516, or SFY1617.
2) Create a LTC program enrollment indicator for all days in each LTC eligible month.
LTC encounter
data
Step 2:
Identify monthly LOC from encounter data
1) Sum encounter amounts for each enrollee identified in Step 1 by service category, procedure code, and month of service.
2) Drop any records where the amount corresponding to a record from (1) is not a positive dollar amount.
3) Classify any months from (2) as months with a NF LOC if the service category is L2.3, L2.4, L2.6, L2.7, L2.8, or L2.9. Classify any months from (2) as months with a HCBS LOC if the service category is not one of the six NF service categories.*
4) For those months that were not classified (i.e., those that did not have any encounter records with positive dollar amounts), classify them as NF or HCBS LOC if the month immediately before and the month immediately after are both NF or both HCBS months, respectively.

18
Data Source
Step/ Purpose
Process
5) Leave the remaining unclassified enrollment months as unknown LOC.
MDS data
Step 3: Identify which enrollees resided in a nursing facility each month based on MDS assessment records
1) Select MDS records for enrollees identified in Step 1.
2) Identify entry and discharge dates and reasons for each enrollee in (1).
3) Create indicators identifying temporary discharges and subsequent readmissions for those discharged with the expectation to return who subsequently returned from the same facility type for reasons 03, 04, 05, 06, 07, and 09.
4) For non-discharge records where there is not a subsequent assessment completed within 107 days, classify the record as a discharge.**
5) Create day-level NF LOC indicators for each day between an entry assessment and subsequent quarterly or discharge assessment (inclusive) that occurred within 107 days, between each quarterly assessment and subsequent quarterly or discharge assessment (inclusive) that occurred within 107 days, and between each temporary discharge and corresponding readmission record (inclusive) regardless of the amount of time that passed.
6) Merge (by enrollee-month) the indicators created in (5) with the LTC enrollment file created in Step 1.
7) Set any LTC enrollment months where the enrollee spent at least half of the days in that month in a NF as a NF LOC month.
Files from Steps 2 & 3
Step 4: Create final Location of Care file
1) Merge the resulting datasets from Step 2 and Step 3 by enrollee-month.
2) Set any month that received a NF LOC determination in Step 2 or Step 3 as a NF LOC month.
3) Set any months that did not receive a NF LOC in Step 2 or Step 3 as a HCBS LOC month
4) Output final Location of Care file.
* Due to differences in United’s encounter record reporting, the analyst is classifying whole months as NF/HCBS months to maintain consistency
across plans. **CMS requires facilities to complete an MDS assessment for residents every 90 days, with a 3-day grace period. The evaluation team allowed for an additional 2-week grace period until making the assumption that an enrollee no longer resided in a NF.
Question-Specific Methods
RQ1, Table 2
The plots showing the trend over time in the monthly proportion of unique HCBS enrollees receiving
services under each category indicate that a linear trend line suffices to model each relationship. However,
this simple trend analysis was complicated by the detection of positive serial correlation in the errors, the
presence of which can lead to overstating the statistical significance of the trend (by underestimating the
19
standard errors). Hence, the analyst used the iterative Yule Walker method to correct for serial correlation
in the error term, thereby producing valid test statistics for each trend estimate.
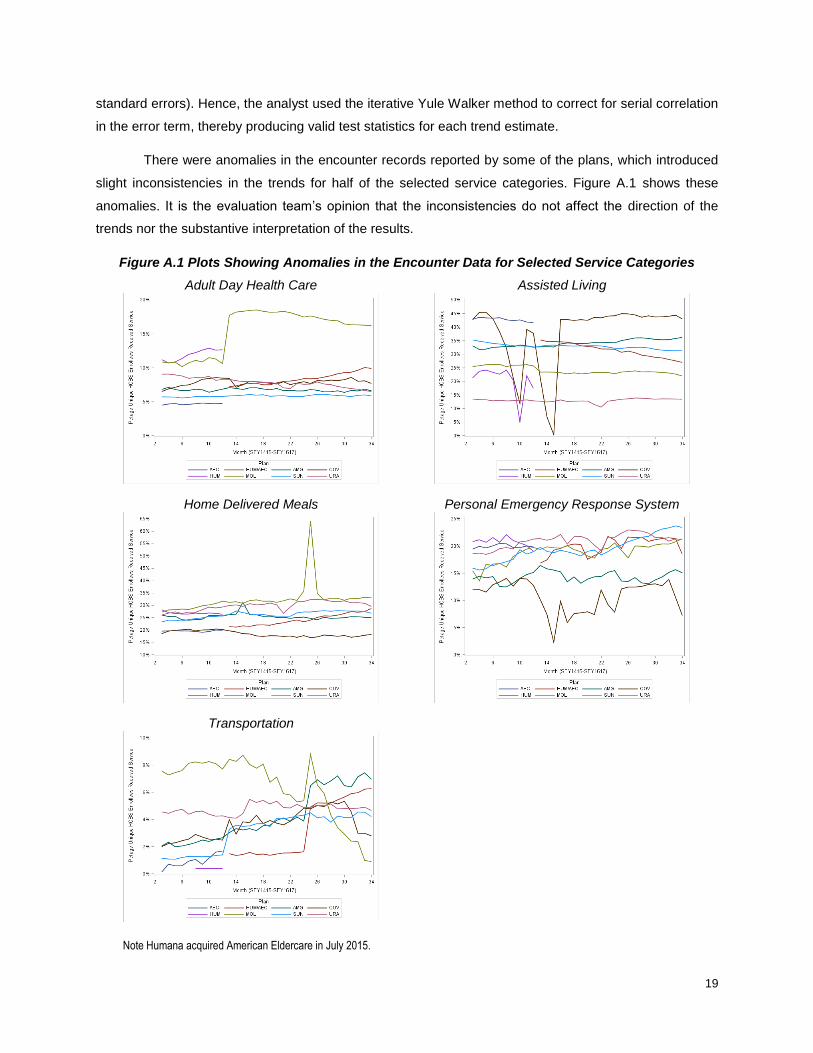
There were anomalies in the encounter records reported by some of the plans, which introduced
slight inconsistencies in the trends for half of the selected service categories. Figure A.1 shows these
anomalies. It is the evaluation team’s opinion that the inconsistencies do not affect the direction of the
trends nor the substantive interpretation of the results.
Figure A.1 Plots Showing Anomalies in the Encounter Data for Selected Service Categories
Adult Day Health Care
Assisted Living
Home Delivered Meals
Personal Emergency Response System
Transportation
Note Humana acquired American Eldercare in July 2015.

20
RQ1, Table 3
701B comprehensive assessments in DOEA’s Client Information and Registry Tracking System database
measure ADL needs for each activity on a scale of 0 to 4, where 0 corresponds to no help needed, 1
corresponds to no help needed but relies on assistive device(s), 2 corresponds to supervision needed, 3
corresponds to some physical assistance needed, and 4 corresponds to total physical assistance needed.
The analyst differenced these scores from the comparison and baseline periods for each enrollee to
compute the change in ADL scores separately for all four needs. Likewise, the analyst differenced the mean
units of service per 30-days between the two periods for each service category to produce the outcome
variables. The analyst also created several relevant covariates to control for other changes that may be
related to changes in service utilization.18 For example, the mean number of inpatient days per 30-days in
the comparison period minus the mean number of inpatient days per 30-days in the baseline period
provided the measure of the change in inpatient days for that covariate.
Measuring service utilization intensity is difficult when there are differing scales of units (e.g., per
hour, per diem, etc.) for procedure codes within each service category as well as when there are persistent
differences in the encounter records between plans. To address the former issue, the evaluation team
created a crosswalk that converts all procedure codes within a given category to the same unit scale (see
Table A.3). To address the latter issue, the evaluation team dropped enrollees who are members of the
UnitedHealthcare plan from this analysis.19
Table A.3 Unit Scale for each LTC Service Category Used to Convert Procedure Codes with Different Units of Measurement
LTC Service Category Unit Scale
Adult Companion Care quarter hour
Adult Day Health Care quarter hour
Home Delivered Meals per meal
Homemaker Services quarter hour
Medical Equipment and Supplies per item
Personal Care quarter hour
PERS per month (max 1)
Respite Care quarter hour
Transportation per trip
Note: 1 diem is considered 8 hours = 32 quarter hour increments
18 These include change in caregiver status indicators (loss or gain), a significant weight loss indicator (5% bodyweight or more), a health shock indicator (new amputation, cancer diagnosis, diabetes diagnosis, cardiac problems, kidney disease, liver disease, lung problems, Parkinson’s diagnosis, paralysis event(s), seizure event(s), stroke event(s), and/or tumor occurrences), the aggregate change in IADL needs, the change in the number of inpatient days per 30-day period, the percent change in the length of the comparison and baseline periods, a change in plan membership indicator, a change in region of residence indicator, and time period dummies. 19 Specifically, URA does not seem to report accurate units of service for 80-90% (depending on the SFY) of their encounter records in the special feed data, encompassing almost 100% of records categorized as HCBS. Moreover, the problem has worsened throughout the three fiscal years evaluated in the report.
21
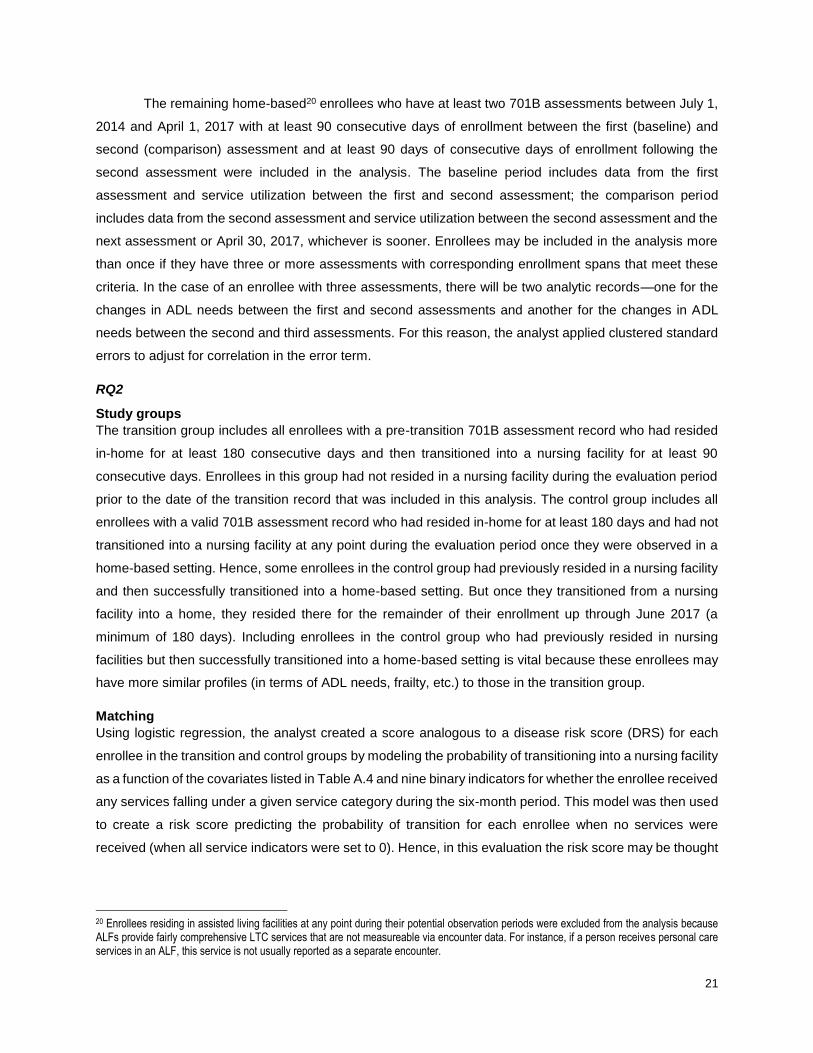
The remaining home-based20 enrollees who have at least two 701B assessments between July 1,
2014 and April 1, 2017 with at least 90 consecutive days of enrollment between the first (baseline) and
second (comparison) assessment and at least 90 days of consecutive days of enrollment following the
second assessment were included in the analysis. The baseline period includes data from the first
assessment and service utilization between the first and second assessment; the comparison period
includes data from the second assessment and service utilization between the second assessment and the
next assessment or April 30, 2017, whichever is sooner. Enrollees may be included in the analysis more
than once if they have three or more assessments with corresponding enrollment spans that meet these
criteria. In the case of an enrollee with three assessments, there will be two analytic records—one for the
changes in ADL needs between the first and second assessments and another for the changes in ADL
needs between the second and third assessments. For this reason, the analyst applied clustered standard
errors to adjust for correlation in the error term.
RQ2
Study groups
The transition group includes all enrollees with a pre-transition 701B assessment record who had resided
in-home for at least 180 consecutive days and then transitioned into a nursing facility for at least 90
consecutive days. Enrollees in this group had not resided in a nursing facility during the evaluation period
prior to the date of the transition record that was included in this analysis. The control group includes all
enrollees with a valid 701B assessment record who had resided in-home for at least 180 days and had not
transitioned into a nursing facility at any point during the evaluation period once they were observed in a
home-based setting. Hence, some enrollees in the control group had previously resided in a nursing facility
and then successfully transitioned into a home-based setting. But once they transitioned from a nursing
facility into a home, they resided there for the remainder of their enrollment up through June 2017 (a
minimum of 180 days). Including enrollees in the control group who had previously resided in nursing
facilities but then successfully transitioned into a home-based setting is vital because these enrollees may
have more similar profiles (in terms of ADL needs, frailty, etc.) to those in the transition group.
Matching
Using logistic regression, the analyst created a score analogous to a disease risk score (DRS) for each
enrollee in the transition and control groups by modeling the probability of transitioning into a nursing facility
as a function of the covariates listed in Table A.4 and nine binary indicators for whether the enrollee received
any services falling under a given service category during the six-month period. This model was then used
to create a risk score predicting the probability of transition for each enrollee when no services were
received (when all service indicators were set to 0). Hence, in this evaluation the risk score may be thought
20 Enrollees residing in assisted living facilities at any point during their potential observation periods were excluded from the analysis because ALFs provide fairly comprehensive LTC services that are not measureable via encounter data. For instance, if a person receives personal care services in an ALF, this service is not usually reported as a separate encounter.
22
of as the risk (probability) of transitioning into a nursing facility independent of service utilization.21 Enrollees
who transitioned were then 1:1 matched with enrollees who did not transition on the logit of the risk score
using a greedy matching algorithm. The logic of this process is that those with similar scores have a similar
risk of transitioning into nursing facilities based on demographic, caregiver, required level of care, and
health status22 factors. If enrollees are similar on these covariates, then other differences, i.e., the intensity
of service use or the frequency of missing services, could explain why one enrollee transitioned but the
other did not.
Prognostic scores, like the DRS, in retrospective case-control studies mimic propensity scores in
prospective observational studies.23 While matching is not necessary in observational studies of association
when the analyst can control for all posited observable confounders, matching may provide added value if
it also succeeds in balancing unobservable confounders. This possibility, nevertheless, is untestable owing
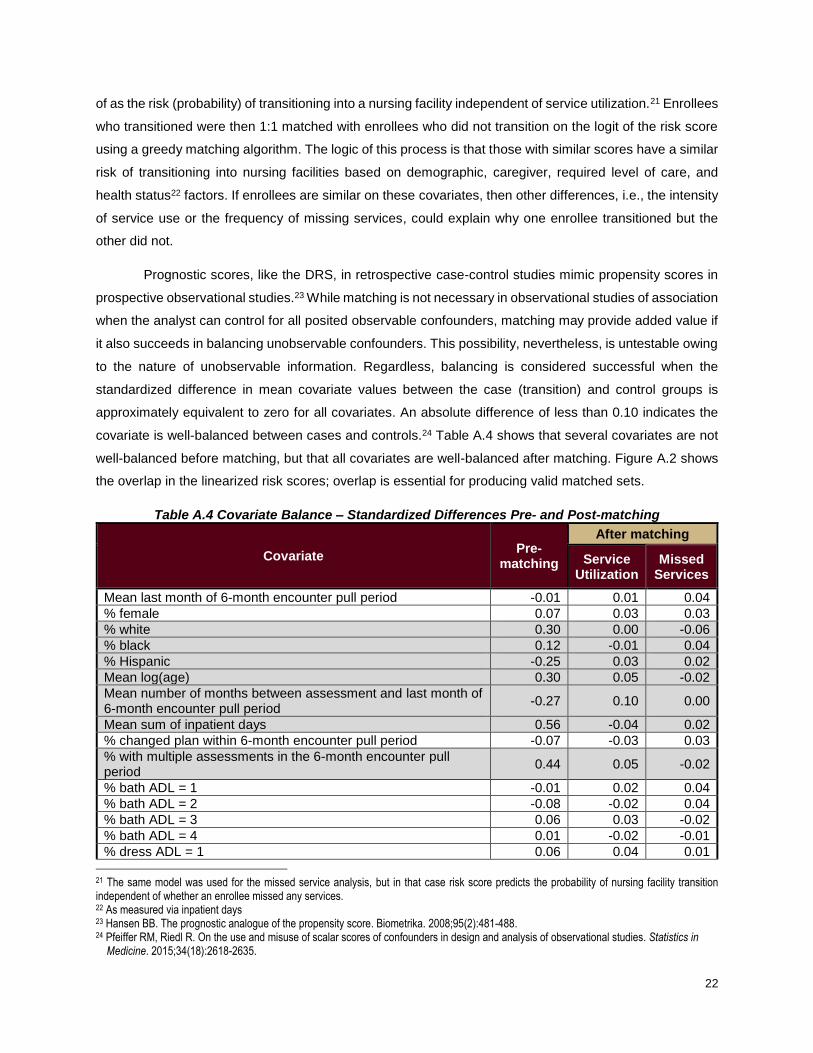
to the nature of unobservable information. Regardless, balancing is considered successful when the
standardized difference in mean covariate values between the case (transition) and control groups is
approximately equivalent to zero for all covariates. An absolute difference of less than 0.10 indicates the
covariate is well-balanced between cases and controls.24 Table A.4 shows that several covariates are not
well-balanced before matching, but that all covariates are well-balanced after matching. Figure A.2 shows
the overlap in the linearized risk scores; overlap is essential for producing valid matched sets.
Table A.4 Covariate Balance – Standardized Differences Pre- and Post-matching
Covariate Pre-
matching
After matching
Service Utilization
Missed Services
Mean last month of 6-month encounter pull period -0.01 0.01 0.04
% female 0.07 0.03 0.03
% white 0.30 0.00 -0.06
% black 0.12 -0.01 0.04
% Hispanic -0.25 0.03 0.02
Mean log(age) 0.30 0.05 -0.02
Mean number of months between assessment and last month of 6-month encounter pull period
-0.27 0.10 0.00
Mean sum of inpatient days 0.56 -0.04 0.02
% changed plan within 6-month encounter pull period -0.07 -0.03 0.03
% with multiple assessments in the 6-month encounter pull period
0.44 0.05 -0.02
% bath ADL = 1 -0.01 0.02 0.04
% bath ADL = 2 -0.08 -0.02 0.04
% bath ADL = 3 0.06 0.03 -0.02
% bath ADL = 4 0.01 -0.02 -0.01
% dress ADL = 1 0.06 0.04 0.01
21 The same model was used for the missed service analysis, but in that case risk score predicts the probability of nursing facility transition independent of whether an enrollee missed any services. 22 As measured via inpatient days 23 Hansen BB. The prognostic analogue of the propensity score. Biometrika. 2008;95(2):481-488. 24 Pfeiffer RM, Riedl R. On the use and misuse of scalar scores of confounders in design and analysis of observational studies. Statistics in Medicine. 2015;34(18):2618-2635.

23
% dress ADL = 2 -0.01 -0.01 0.04
% dress ADL = 3 0.03 0.01 -0.03
% dress ADL = 4 -0.04 -0.03 -0.01
% eat ADL = 1 0.14 -0.01 0.03
% eat ADL = 2 0.01 0.02 0.02
% eat ADL = 3 -0.02 0.01 0.04
% eat ADL = 4 -0.12 -0.06 -0.03
% toileting ADL = 1 0.05 0.00 0.03
% toileting ADL = 2 -0.02 0.03 -0.03
% toileting ADL = 3 0.06 0.00 0.02
% toileting ADL = 4 -0.07 -0.06 -0.02
% transferring ADL = 1 0.09 0.03 -0.04
% transferring ADL = 2 -0.04 0.00 -0.01
% transferring ADL = 3 0.04 -0.04 0.05
% transferring ADL = 4 -0.10 -0.06 -0.03
% walking ADL = 1 0.13 0.02 0.00
% walking ADL = 2 -0.03 0.02 -0.02
% walking ADL = 3 0.00 -0.02 0.01
% walking ADL = 4 -0.08 -0.05 0.00
% no months with primary caregiver -0.11 -0.03 0.02
% less than 6 months with primary caregiver 0.14 0.00 -0.04
Figure A.2 Overlap in Linearized Risk Scores
Service Utilization

24
Service Utilization – Zoomed In
Missed Services
25
Results Supplement
RQ1, Table 2
Full model results for RQ1, Table 2 are presented in Table A.5 below.
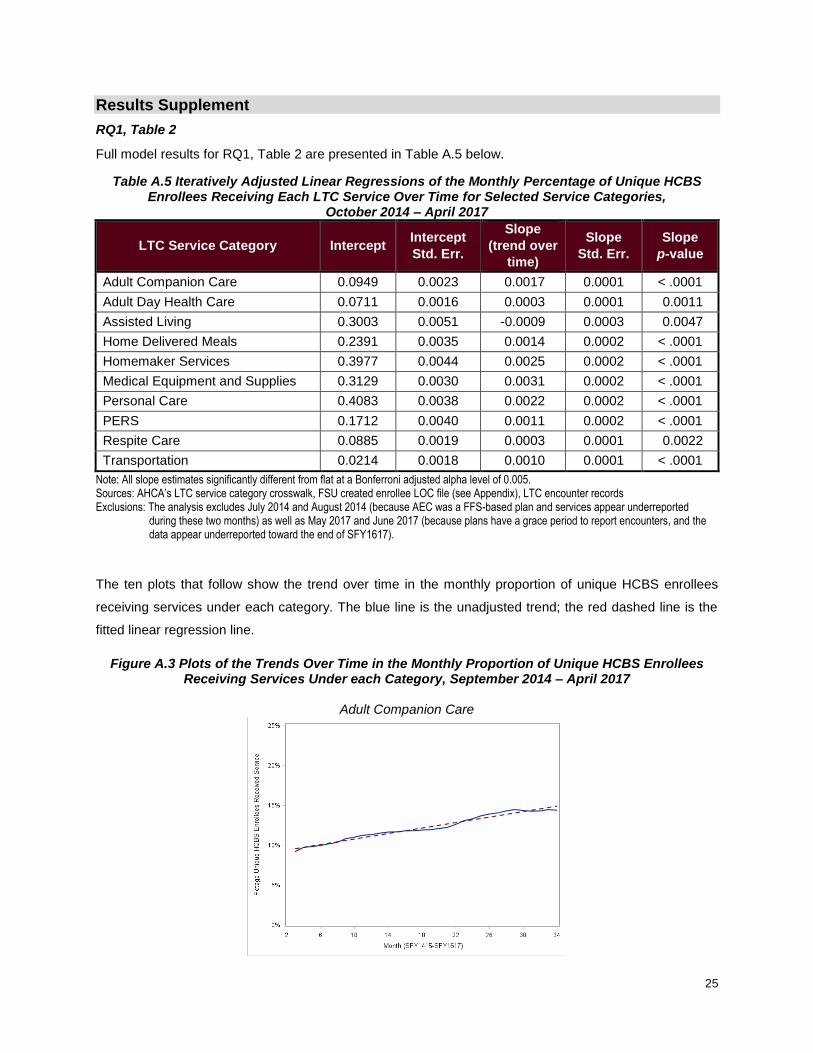
Table A.5 Iteratively Adjusted Linear Regressions of the Monthly Percentage of Unique HCBS Enrollees Receiving Each LTC Service Over Time for Selected Service Categories,
October 2014 – April 2017
LTC Service Category Intercept Intercept
Std. Err.
Slope
(trend over
time)
Slope
Std. Err.
Slope
p-value
Adult Companion Care 0.0949 0.0023 0.0017 0.0001 < .0001
Adult Day Health Care 0.0711 0.0016 0.0003 0.0001 0.0011
Assisted Living 0.3003 0.0051 -0.0009 0.0003 0.0047
Home Delivered Meals 0.2391 0.0035 0.0014 0.0002 < .0001
Homemaker Services 0.3977 0.0044 0.0025 0.0002 < .0001
Medical Equipment and Supplies 0.3129 0.0030 0.0031 0.0002 < .0001
Personal Care 0.4083 0.0038 0.0022 0.0002 < .0001
PERS 0.1712 0.0040 0.0011 0.0002 < .0001
Respite Care 0.0885 0.0019 0.0003 0.0001 0.0022
Transportation 0.0214 0.0018 0.0010 0.0001 < .0001
Note: All slope estimates significantly different from flat at a Bonferroni adjusted alpha level of 0.005. Sources: AHCA’s LTC service category crosswalk, FSU created enrollee LOC file (see Appendix), LTC encounter records Exclusions: The analysis excludes July 2014 and August 2014 (because AEC was a FFS-based plan and services appear underreported
during these two months) as well as May 2017 and June 2017 (because plans have a grace period to report encounters, and the data appear underreported toward the end of SFY1617).
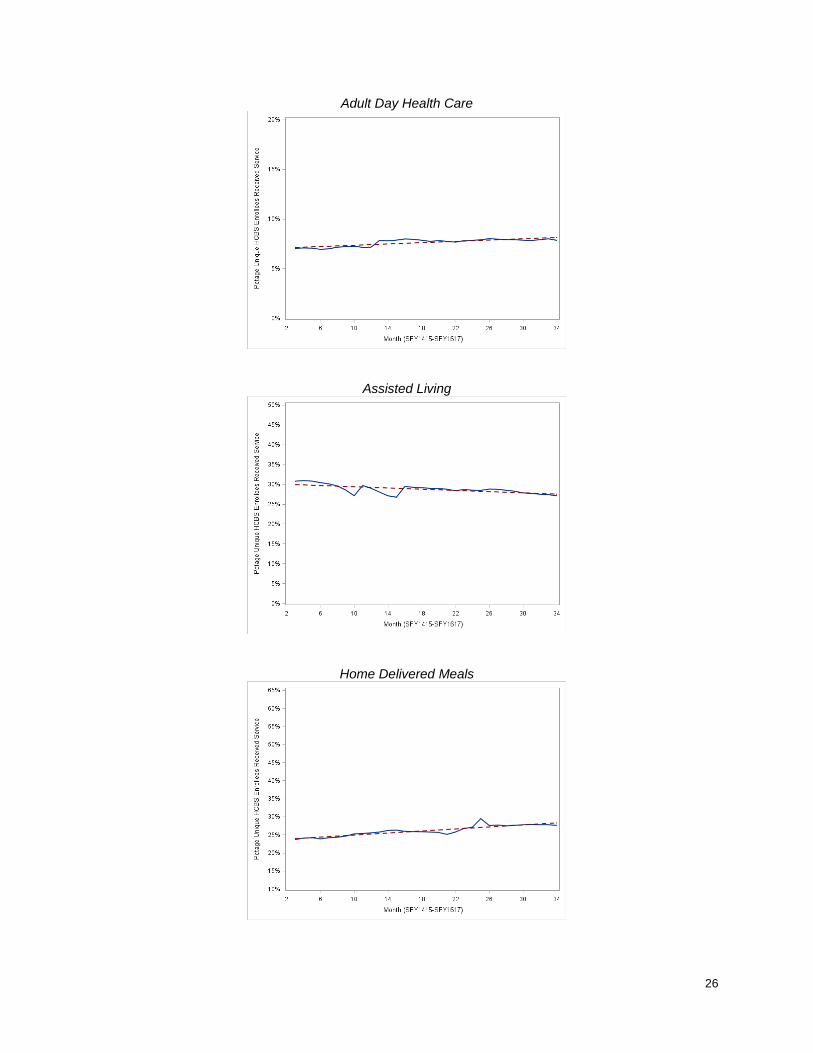
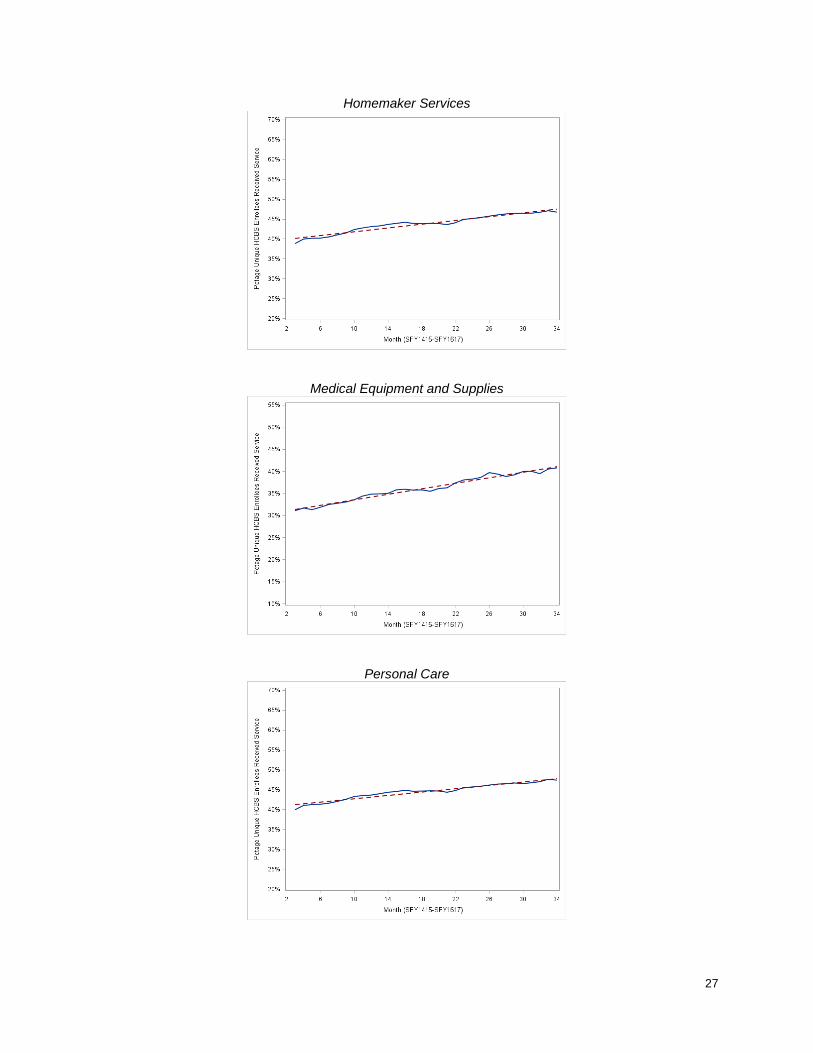
The ten plots that follow show the trend over time in the monthly proportion of unique HCBS enrollees
receiving services under each category. The blue line is the unadjusted trend; the red dashed line is the
fitted linear regression line.
Figure A.3 Plots of the Trends Over Time in the Monthly Proportion of Unique HCBS Enrollees Receiving Services Under each Category, September 2014 – April 2017
Adult Companion Care
26
Adult Day Health Care
Assisted Living
Home Delivered Meals
27
Homemaker Services
Medical Equipment and Supplies
Personal Care

28
Personal Emergency Response System
Respite Care
Transportation
29
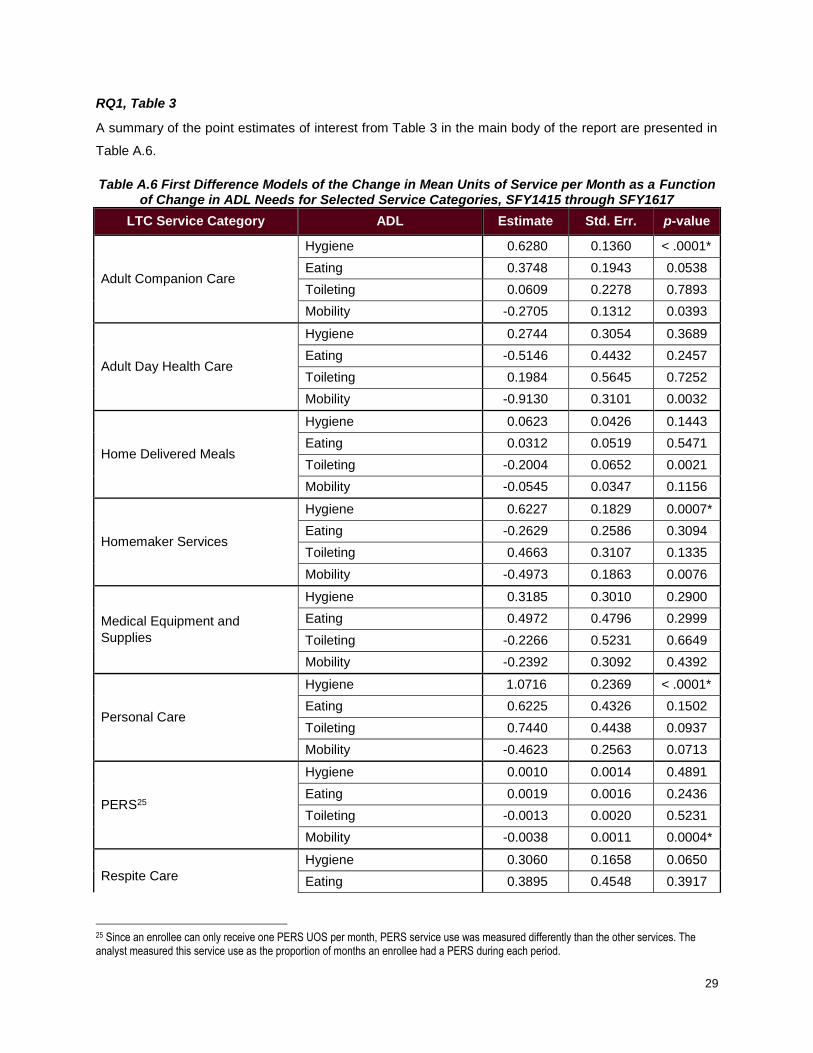
RQ1, Table 3
A summary of the point estimates of interest from Table 3 in the main body of the report are presented in
Table A.6.
Table A.6 First Difference Models of the Change in Mean Units of Service per Month as a Function of Change in ADL Needs for Selected Service Categories, SFY1415 through SFY1617
LTC Service Category ADL Estimate Std. Err. p-value
Adult Companion Care
Hygiene 0.6280 0.1360 < .0001*
Eating 0.3748 0.1943 0.0538
Toileting 0.0609 0.2278 0.7893
Mobility -0.2705 0.1312 0.0393
Adult Day Health Care
Hygiene 0.2744 0.3054 0.3689
Eating -0.5146 0.4432 0.2457
Toileting 0.1984 0.5645 0.7252
Mobility -0.9130 0.3101 0.0032
Home Delivered Meals
Hygiene 0.0623 0.0426 0.1443
Eating 0.0312 0.0519 0.5471
Toileting -0.2004 0.0652 0.0021
Mobility -0.0545 0.0347 0.1156
Homemaker Services
Hygiene 0.6227 0.1829 0.0007*
Eating -0.2629 0.2586 0.3094
Toileting 0.4663 0.3107 0.1335
Mobility -0.4973 0.1863 0.0076
Medical Equipment and
Supplies
Hygiene 0.3185 0.3010 0.2900
Eating 0.4972 0.4796 0.2999
Toileting -0.2266 0.5231 0.6649
Mobility -0.2392 0.3092 0.4392
Personal Care
Hygiene 1.0716 0.2369 < .0001*
Eating 0.6225 0.4326 0.1502
Toileting 0.7440 0.4438 0.0937
Mobility -0.4623 0.2563 0.0713
PERS25
Hygiene 0.0010 0.0014 0.4891
Eating 0.0019 0.0016 0.2436
Toileting -0.0013 0.0020 0.5231
Mobility -0.0038 0.0011 0.0004*
Respite Care
Hygiene 0.3060 0.1658 0.0650
Eating 0.3895 0.4548 0.3917
25 Since an enrollee can only receive one PERS UOS per month, PERS service use was measured differently than the other services. The analyst measured this service use as the proportion of months an enrollee had a PERS during each period.

30
LTC Service Category ADL Estimate Std. Err. p-value
Respite Care, cont. Toileting 0.4347 0.3133 0.1654
Mobility 0.3658 0.1818 0.0443
Transportation
Hygiene 0.0479 0.0228 0.0355
Eating -0.0150 0.0341 0.6585
Toileting -0.0371 0.0419 0.3763
Mobility -0.0127 0.0230 0.5793
*Significant at Bonferroni adjusted alpha level of 0.0014 Note: For full model results see the Appendix. Each model controls for changes in caregiver status (loss or gain), significant weight loss (5% bodyweight or more), health shocks (new amputation, cancer diagnosis, diabetes diagnosis, cardiac problems, kidney disease, liver disease, lung problems, Parkinson’s diagnosis, paralysis event(s), seizure event(s), stroke event(s), and/or tumor occurrences), aggregate changes in IADL needs, changes in the number of inpatient days between periods, percent change in the length of each period, changes in plan membership, changes in region of residence, and quarter of measurement. Sources: 701B Assessments, FSU created enrollee LOC file (see Appendix), AHCA’s LTC service category crosswalk, LTC encounter records, FL Center inpatient data
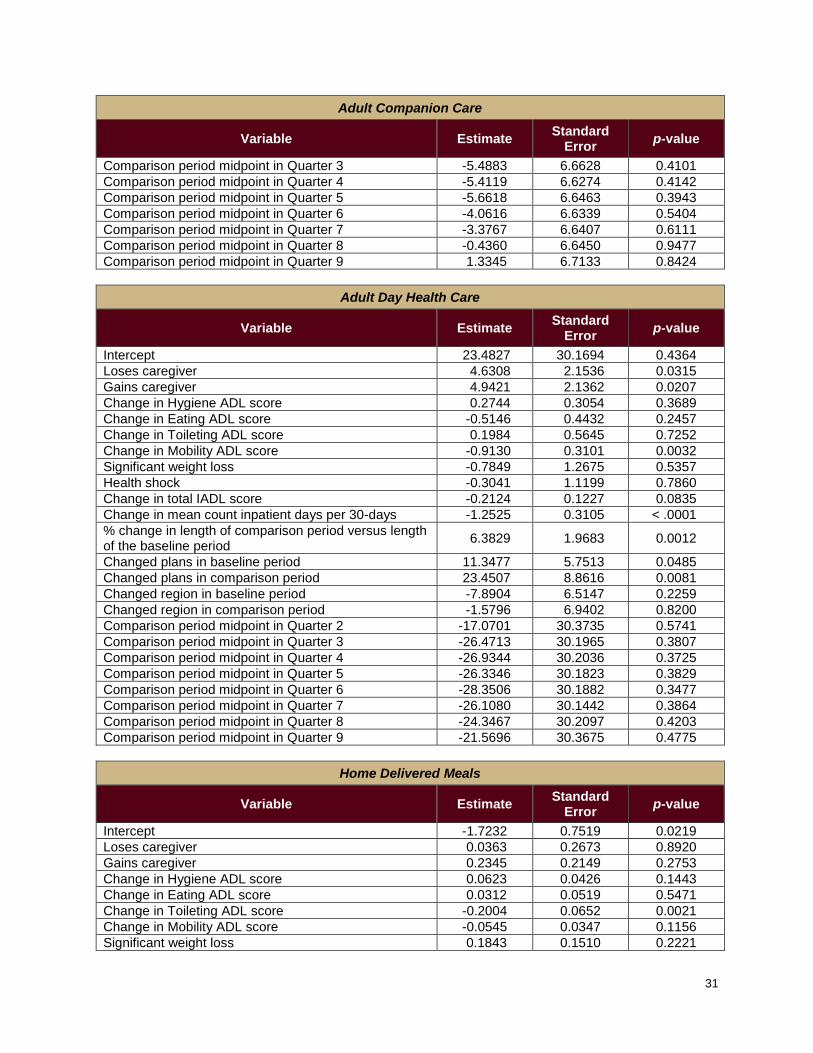
Full results for the nine models presented in Table 3 in the main body of the report follow. Each model
controlled for changes in caregiver status (loss or gain), significant weight loss (5% bodyweight or more),
health shocks (new amputation, cancer diagnosis, diabetes diagnosis, cardiac problems, kidney disease,
liver disease, lung problems, Parkinson’s diagnosis, paralysis event(s), seizure event(s), stroke event(s),
and/or tumor occurrences), aggregate changes in IADL needs, changes in the number of inpatient days
between periods, percent change in the length of each period, changes in plan membership, changes in
region of residence, and the quarter the comparison period midpoint fell in.
Table A.7 Full Model Results for the Change in Service Utilization in Relation to Change in ADL Needs
Adult Companion Care
Variable Estimate Standard
Error p-value
Intercept 5.6960 6.6181 0.3894
Loses caregiver 3.1855 1.1037 0.0039
Gains caregiver 1.6985 0.9185 0.0645
Change in Hygiene ADL score 0.6280 0.1360 < .0001
Change in Eating ADL score 0.3748 0.1943 0.0538
Change in Toileting ADL score 0.0609 0.2278 0.7893
Change in Mobility ADL score -0.2705 0.1312 0.0393
Significant weight loss 0.1441 0.5237 0.7832
Health shock 0.7633 0.5514 0.1662
Change in total IADL score 0.0438 0.0543 0.4204
Change in mean count inpatient days per 30-days -0.5347 0.1233 < .0001
% change in length of comparison period versus length of the baseline period
3.8348 0.7155 < .0001
Changed plans in baseline period 2.4120 2.0711 0.2442
Changed plans in comparison period -1.9966 2.1124 0.3446
Changed region in baseline period -0.2500 1.7336 0.8853
Changed region in comparison period 4.2306 3.0068 0.1594
Comparison period midpoint in Quarter 2 1.2047 7.3045 0.8690
31
Adult Companion Care
Variable Estimate Standard
Error p-value
Comparison period midpoint in Quarter 3 -5.4883 6.6628 0.4101
Comparison period midpoint in Quarter 4 -5.4119 6.6274 0.4142
Comparison period midpoint in Quarter 5 -5.6618 6.6463 0.3943
Comparison period midpoint in Quarter 6 -4.0616 6.6339 0.5404
Comparison period midpoint in Quarter 7 -3.3767 6.6407 0.6111
Comparison period midpoint in Quarter 8 -0.4360 6.6450 0.9477
Comparison period midpoint in Quarter 9 1.3345 6.7133 0.8424
Adult Day Health Care
Variable Estimate Standard
Error p-value
Intercept 23.4827 30.1694 0.4364
Loses caregiver 4.6308 2.1536 0.0315
Gains caregiver 4.9421 2.1362 0.0207
Change in Hygiene ADL score 0.2744 0.3054 0.3689
Change in Eating ADL score -0.5146 0.4432 0.2457
Change in Toileting ADL score 0.1984 0.5645 0.7252
Change in Mobility ADL score -0.9130 0.3101 0.0032
Significant weight loss -0.7849 1.2675 0.5357
Health shock -0.3041 1.1199 0.7860
Change in total IADL score -0.2124 0.1227 0.0835
Change in mean count inpatient days per 30-days -1.2525 0.3105 < .0001
% change in length of comparison period versus length of the baseline period
6.3829 1.9683 0.0012
Changed plans in baseline period 11.3477 5.7513 0.0485
Changed plans in comparison period 23.4507 8.8616 0.0081
Changed region in baseline period -7.8904 6.5147 0.2259
Changed region in comparison period -1.5796 6.9402 0.8200
Comparison period midpoint in Quarter 2 -17.0701 30.3735 0.5741
Comparison period midpoint in Quarter 3 -26.4713 30.1965 0.3807
Comparison period midpoint in Quarter 4 -26.9344 30.2036 0.3725
Comparison period midpoint in Quarter 5 -26.3346 30.1823 0.3829
Comparison period midpoint in Quarter 6 -28.3506 30.1882 0.3477
Comparison period midpoint in Quarter 7 -26.1080 30.1442 0.3864
Comparison period midpoint in Quarter 8 -24.3467 30.2097 0.4203
Comparison period midpoint in Quarter 9 -21.5696 30.3675 0.4775
Home Delivered Meals
Variable Estimate Standard
Error p-value
Intercept -1.7232 0.7519 0.0219
Loses caregiver 0.0363 0.2673 0.8920
Gains caregiver 0.2345 0.2149 0.2753
Change in Hygiene ADL score 0.0623 0.0426 0.1443
Change in Eating ADL score 0.0312 0.0519 0.5471
Change in Toileting ADL score -0.2004 0.0652 0.0021
Change in Mobility ADL score -0.0545 0.0347 0.1156
Significant weight loss 0.1843 0.1510 0.2221

32
Home Delivered Meals
Variable Estimate Standard
Error p-value
Health shock 0.3484 0.1368 0.0109
Change in total IADL score -0.0003 0.0172 0.9851
Change in mean count inpatient days per 30-days -0.3979 0.0476 < .0001
% change in length of comparison period versus length of the baseline period
1.6991 0.2155 < .0001
Changed plans in baseline period 0.8382 0.4999 0.0937
Changed plans in comparison period -1.3035 0.5967 0.0289
Changed region in baseline period 0.2811 0.5383 0.6015
Changed region in comparison period 0.4434 0.8182 0.5879
Comparison period midpoint in Quarter 2 -1.2239 1.3526 0.3656
Comparison period midpoint in Quarter 3 0.1301 0.7867 0.8686
Comparison period midpoint in Quarter 4 0.6557 0.7557 0.3856
Comparison period midpoint in Quarter 5 0.5749 0.7642 0.4519
Comparison period midpoint in Quarter 6 0.7739 0.7662 0.3125
Comparison period midpoint in Quarter 7 0.7059 0.7666 0.3572
Comparison period midpoint in Quarter 8 1.3131 0.7702 0.0883
Comparison period midpoint in Quarter 9 2.2419 0.8150 0.0060
Homemaker Services
Variable Estimate Standard
Error p-value
Intercept -21.4828 10.6766 0.0442
Loses caregiver 5.5882 1.3319 < .0001
Gains caregiver 5.2159 1.2454 < .0001
Change in Hygiene ADL score 0.6227 0.1829 0.0007
Change in Eating ADL score -0.2629 0.2586 0.3094
Change in Toileting ADL score 0.4663 0.3107 0.1335
Change in Mobility ADL score -0.4973 0.1863 0.0076
Significant weight loss 0.6792 0.7128 0.3406
Health shock 1.8830 0.6307 0.0028
Change in total IADL score 0.2690 0.0732 0.0002
Change in mean count inpatient days per 30-days -2.4867 0.2078 < .0001
% change in length of comparison period versus length of the baseline period
10.4062 1.0041 < .0001
Changed plans in baseline period 10.0223 2.5617 < .0001
Changed plans in comparison period -4.8881 2.7395 0.0744
Changed region in baseline period -2.1145 3.2020 0.5090
Changed region in comparison period 1.8090 4.2142 0.6677
Comparison period midpoint in Quarter 2 18.0715 11.4117 0.1133
Comparison period midpoint in Quarter 3 20.2115 10.7313 0.0597
Comparison period midpoint in Quarter 4 21.7500 10.6856 0.0418
Comparison period midpoint in Quarter 5 21.4400 10.7151 0.0454
Comparison period midpoint in Quarter 6 22.9042 10.6932 0.0322
Comparison period midpoint in Quarter 7 26.3216 10.6858 0.0138
Comparison period midpoint in Quarter 8 30.9659 10.7083 0.0038
Comparison period midpoint in Quarter 9 34.8533 10.7831 0.0012

33
Medical Equipment and Supplies
Variable Estimate Standard
Error p-value
Intercept 37.2002 48.1514 0.4398
Loses caregiver 1.7644 2.0670 0.3933
Gains caregiver 0.3001 1.9852 0.8798
Change in Hygiene ADL score 0.3185 0.3010 0.2900
Change in Eating ADL score 0.4972 0.4796 0.2999
Change in Toileting ADL score -0.2266 0.5231 0.6649
Change in Mobility ADL score -0.2392 0.3092 0.4392
Significant weight loss -2.3793 1.5367 0.1216
Health shock -3.7765 1.3656 0.0057
Change in total IADL score 0.2807 0.1274 0.0276
Change in mean count inpatient days per 30-days -3.2023 0.6750 < .0001
% change in length of comparison period versus length of the baseline period
8.6705 2.1635 < .0001
Changed plans in baseline period -7.9241 5.0132 0.1140
Changed plans in comparison period -17.2772 8.4311 0.0405
Changed region in baseline period -11.5070 5.3123 0.0303
Changed region in comparison period 3.7887 8.9140 0.6708
Comparison period midpoint in Quarter 2 -26.9597 48.6853 0.5798
Comparison period midpoint in Quarter 3 -29.6428 48.1980 0.5385
Comparison period midpoint in Quarter 4 -28.1461 48.1509 0.5589
Comparison period midpoint in Quarter 5 -27.6356 48.2030 0.5664
Comparison period midpoint in Quarter 6 -28.5584 48.1540 0.5531
Comparison period midpoint in Quarter 7 -35.6530 48.1609 0.4591
Comparison period midpoint in Quarter 8 -38.4868 48.1589 0.4242
Comparison period midpoint in Quarter 9 -44.0286 48.2576 0.3616
Personal Care
Variable Estimate Standard
Error p-value
Intercept -25.2404 7.1442 0.0004
Loses caregiver 2.3376 2.2512 0.2991
Gains caregiver 5.9525 1.6429 0.0003
Change in Hygiene ADL score 1.0716 0.2369 < .0001
Change in Eating ADL score 0.6225 0.4326 0.1502
Change in Toileting ADL score 0.7440 0.4438 0.0937
Change in Mobility ADL score -0.4623 0.2563 0.0713
Significant weight loss 1.9014 1.1423 0.0960
Health shock 3.0595 1.0199 0.0027
Change in total IADL score 0.0541 0.1064 0.6113
Change in mean count inpatient days per 30-days -2.6782 0.4064 < .0001
% change in length of comparison period versus length of the baseline period
12.0557 1.8163 < .0001
Changed plans in baseline period 7.4454 6.1763 0.2280
Changed plans in comparison period 0.8864 6.7313 0.8952
Changed region in baseline period 2.2807 4.4078 0.6049
Changed region in comparison period -2.1093 6.0071 0.7255
Comparison period midpoint in Quarter 2 19.1124 13.0631 0.1435
Comparison period midpoint in Quarter 3 22.4592 7.6386 0.0033
Comparison period midpoint in Quarter 4 24.1481 7.2303 0.0008

34
Personal Care
Variable Estimate Standard
Error p-value
Comparison period midpoint in Quarter 5 21.0833 7.2277 0.0035
Comparison period midpoint in Quarter 6 27.5940 7.1619 0.0001
Comparison period midpoint in Quarter 7 32.4883 7.2159 < .0001
Comparison period midpoint in Quarter 8 35.8148 7.2883 < .0001
Comparison period midpoint in Quarter 9 41.8753 7.5928 < .0001
Personal Emergency Response System
Variable Estimate Standard
Error p-value
Intercept 0.0429 0.0643 0.5041
Loses caregiver -0.0013 0.0087 0.8820
Gains caregiver 0.0059 0.0074 0.4237
Change in Hygiene ADL score 0.0010 0.0014 0.4891
Change in Eating ADL score 0.0019 0.0016 0.2436
Change in Toileting ADL score -0.0013 0.0020 0.5231
Change in Mobility ADL score -0.0038 0.0011 0.0004
Significant weight loss 0.0016 0.0044 0.7260
Health shock 0.0043 0.0041 0.2927
Change in total IADL score -0.0011 0.0005 0.0353
Change in mean count inpatient days per 30-days -0.0011 0.0013 0.3805
% change in length of comparison period versus length of the baseline period
0.0335 0.0074 < .0001
Changed plans in baseline period 0.0280 0.0144 0.0526
Changed plans in comparison period -0.0242 0.0195 0.2147
Changed region in baseline period -0.0105 0.0176 0.5496
Changed region in comparison period -0.0177 0.0275 0.5205
Comparison period midpoint in Quarter 2 -0.0435 0.0680 0.5226
Comparison period midpoint in Quarter 3 -0.0307 0.0646 0.6344
Comparison period midpoint in Quarter 4 -0.0422 0.0643 0.5117
Comparison period midpoint in Quarter 5 -0.0431 0.0642 0.5021
Comparison period midpoint in Quarter 6 -0.0512 0.0644 0.4266
Comparison period midpoint in Quarter 7 -0.0482 0.0644 0.4544
Comparison period midpoint in Quarter 8 -0.0496 0.0645 0.4415
Comparison period midpoint in Quarter 9 -0.0730 0.0651 0.2622
Respite Care
Variable Estimate Standard
Error p-value
Intercept -12.1752 6.6838 0.0685
Loses caregiver -0.8158 1.3781 0.5539
Gains caregiver 3.1762 1.2924 0.0140
Change in Hygiene ADL score 0.3060 0.1658 0.0650
Change in Eating ADL score 0.3895 0.4548 0.3917
Change in Toileting ADL score 0.4347 0.3133 0.1654
Change in Mobility ADL score 0.3658 0.1818 0.0443
Significant weight loss 2.6636 0.9268 0.0041
Health shock 1.7816 0.7841 0.0231
Change in total IADL score 0.0946 0.0623 0.1292

35
Respite Care
Variable Estimate Standard
Error p-value
Change in mean count inpatient days per 30-days -1.0290 0.2977 0.0005
% change in length of comparison period versus length of the baseline period
3.7694 1.1835 0.0015
Changed plans in baseline period 1.7532 2.4388 0.4722
Changed plans in comparison period 1.3169 3.6393 0.7175
Changed region in baseline period -4.6945 3.4239 0.1704
Changed region in comparison period -9.8241 8.6997 0.2588
Comparison period midpoint in Quarter 2 9.9880 7.6628 0.1924
Comparison period midpoint in Quarter 3 12.4331 6.8654 0.0702
Comparison period midpoint in Quarter 4 11.0234 6.7305 0.1015
Comparison period midpoint in Quarter 5 13.5777 6.6954 0.0426
Comparison period midpoint in Quarter 6 14.1522 6.7311 0.0355
Comparison period midpoint in Quarter 7 16.1556 6.7065 0.0160
Comparison period midpoint in Quarter 8 15.9612 6.7347 0.0178
Comparison period midpoint in Quarter 9 15.6170 6.9026 0.0237
Transportation
Variable Estimate Standard
Error p-value
Intercept -0.3805 0.1577 0.0158
Loses caregiver 0.2263 0.1577 0.1514
Gains caregiver 0.2811 0.1588 0.0767
Change in Hygiene ADL score 0.0479 0.0228 0.0355
Change in Eating ADL score -0.0150 0.0341 0.6585
Change in Toileting ADL score -0.0371 0.0419 0.3763
Change in Mobility ADL score -0.0127 0.0230 0.5793
Significant weight loss -0.1415 0.0872 0.1049
Health shock -0.1257 0.0824 0.1273
Change in total IADL score 0.0053 0.0086 0.5398
Change in mean count inpatient days per 30-days -0.0678 0.0134 < .0001
% change in length of comparison period versus length of the baseline period
0.2894 0.1019 0.0045
Changed plans in baseline period 0.7560 0.3399 0.0262
Changed plans in comparison period 1.2406 0.5277 0.0187
Changed region in baseline period -0.6627 0.1791 0.0002
Changed region in comparison period 0.0991 0.3426 0.7724
Comparison period midpoint in Quarter 2 1.5925 0.5550 0.0041
Comparison period midpoint in Quarter 3 1.0329 0.2046 < .0001
Comparison period midpoint in Quarter 4 1.3151 0.1754 < .0001
Comparison period midpoint in Quarter 5 1.1829 0.1695 < .0001
Comparison period midpoint in Quarter 6 0.8218 0.1815 < .0001
Comparison period midpoint in Quarter 7 0.8470 0.1744 < .0001
Comparison period midpoint in Quarter 8 0.8730 0.1777 < .0001
Comparison period midpoint in Quarter 9 0.9058 0.2191 < .0001
RQ2, Table 4
Full model results for RQ2, Table 4 are presented in Table A.8 below.

36
Table A.8 Results of Conditional Logistic Regression Models Predicting Transition into a Nursing Facility as a Function of Service Utilization Intensity for Selected Service Categories,
December 2014 – April 2017
LTC Service Category Measure Estimate Std. Err. p-value
Adult Companion Care Svc Received 0.3567 0.1069 0.0008*
Intensity -0.0001 0.0009 0.8693
Adult Day Health Care Svc Received 0.1274 0.1955 0.5148
Intensity 0.0001 0.0004 0.8310
Home Delivered Meals Svc Received -0.2385 0.1185 0.0441
Intensity 0.0146 0.0041 0.0004*
Homemaker Services Svc Received 0.1930 0.0904 0.0327
Intensity -0.0003 0.0008 0.7019
Medical Equipment and Supplies Svc Received 0.2161 0.0828 0.0090
Intensity -0.0006 0.0002 0.0087
Personal Care Svc Received 0.1711 0.0840 0.0417
Intensity -0.0009 0.0004 0.0174
PERS Svc Received 0.2201 0.0736 0.0028*
Respite Care Svc Received 0.0335 0.1073 0.7551
Intensity -0.0001 0.0006 0.8771
Transportation Svc Received 0.0243 0.1510 0.8720
Intensity 0.0051 0.0065 0.4345
*Significant at Bonferroni adjusted alpha level of 0.0028 Sources: 701B Assessments, FSU created enrollee LOC file (see Appendix), AHCA’s LTC service category crosswalk, LTC encounter records, FL Center inpatient data, enrollee eligibility data (for demographic information)
RQ2, Table 5
Full model results for RQ2, Table 5 are presented in Table A.9 below.
Table A.9 Results of a Conditional Logistic Regression Model Predicting Transition into a Nursing Facility as a Function of the Proportion of Days with Missed Services Reported
for Selected Service Categories, December 2014 – March 2016
Estimate Std. Err. p-value
7.6726 3.8607 0.0469
Sources: 701B Assessments, FSU created enrollee LOC file (see Appendix), AHCA’s LTC service category crosswalk,
FL Center inpatient data, enrollee eligibility data (for demographic information), Missed services reports