Embed Size (px)
Citation preview

Independence dayA special report on North America’s oil and gas boomA report from the Economist Intelligence Unit
TM
www.eiu.com

Independence dayA special report on North America’s oil and gas boom
© The Economist Intelligence Unit Limited 20121
ContentsEditor’s introduction 2
US energy security: Elusive independence 3
US shale oil: A tale of two revolutions 6
Canada’s tar sands: Sticky situation 9
US gas exports: Fluid markets 11
Canada gas exports: Contest at Kitimat 13
North American pipelines: New oil flows 16

Independence dayA special report on North America’s oil and gas boom
© The Economist Intelligence Unit Limited 20122
Ten years ago, if you told an American that by 2012 the US would produce more oil and gas than it could readily use, he might have questioned your sanity. Yet this is what is happening, driven by
advances in extracting oil and gas from shale rock. Across the northern border, meanwhile, Canada is busily tapping into its prodigious tar-sands resources. On both fronts, US energy supplies have begun to look more secure.
At the same time, gluts are building up. Pipeline infrastructure is under strain and the prices of gas and some types of oil have dropped. How much longer can the North American hydrocarbons boom last? What is the outlook for prices? How will surging petroleum production find its way from fields to the buyers who need it? Can the US achieve oil self-sufficiency, or even energy independence? These are among the questions addressed in this special report, which collects recent articles published by the Economist Intelligence Unit’s Energy Briefing & Forecasts service.
Martin AdamsEnergy EditorOctober 2012
Editor’s introduction
Independence dayA special report on North America’s oil and gas boom
© The Economist Intelligence Unit Limited 20123
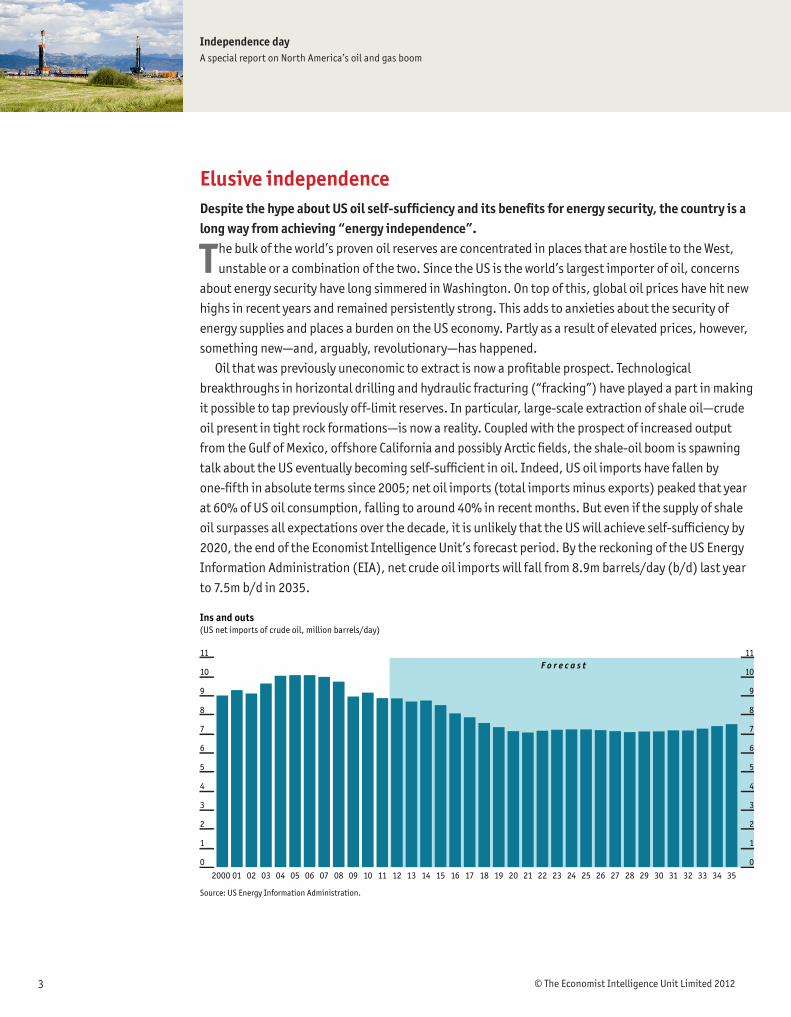
Elusive independenceDespite the hype about US oil self-sufficiency and its benefits for energy security, the country is a long way from achieving “energy independence”.
The bulk of the world’s proven oil reserves are concentrated in places that are hostile to the West, unstable or a combination of the two. Since the US is the world’s largest importer of oil, concerns
about energy security have long simmered in Washington. On top of this, global oil prices have hit new highs in recent years and remained persistently strong. This adds to anxieties about the security of energy supplies and places a burden on the US economy. Partly as a result of elevated prices, however, something new—and, arguably, revolutionary—has happened.
Oil that was previously uneconomic to extract is now a profitable prospect. Technological breakthroughs in horizontal drilling and hydraulic fracturing (“fracking”) have played a part in making it possible to tap previously off-limit reserves. In particular, large-scale extraction of shale oil—crude oil present in tight rock formations—is now a reality. Coupled with the prospect of increased output from the Gulf of Mexico, offshore California and possibly Arctic fields, the shale-oil boom is spawning talk about the US eventually becoming self-sufficient in oil. Indeed, US oil imports have fallen by one-fifth in absolute terms since 2005; net oil imports (total imports minus exports) peaked that year at 60% of US oil consumption, falling to around 40% in recent months. But even if the supply of shale oil surpasses all expectations over the decade, it is unlikely that the US will achieve self-sufficiency by 2020, the end of the Economist Intelligence Unit’s forecast period. By the reckoning of the US Energy Information Administration (EIA), net crude oil imports will fall from 8.9m barrels/day (b/d) last year to 7.5m b/d in 2035.
F o r e c a s t
Ins and outs (US net imports of crude oil, million barrels/day)
Source: US Energy Information Administration.
0
1
2
3
4
5
6
7
8
9
10
11
0
1
2
3
4
5
6
7
8
9
10
11
35343332313029282726252423222120191817161514131211100908070605040302012000

Independence dayA special report on North America’s oil and gas boom
© The Economist Intelligence Unit Limited 20124
Not so simplePoliticians of all stripes suggest that greater oil self-sufficiency will bring a host of economic and foreign-policy benefits. It is also portrayed as the bedrock of broader energy independence. This excitement is not justified.
A theoretical advantage of self-sufficiency, for any product, is that domestic supplies are usually cheaper than their imported substitutes. Transport costs are typically lower and there are no tariffs to take into account. So, if US industry pays less for its oil, this should administer a boost to US manufacturing, and thus to the wider economy. Cutting reliance on imported oil could also reduce the inflation risks stemming from the fact that international oil prices are beyond US policymakers’ control. This reasoning is overly simplistic.
Oil is a global good, easily transported (unlike gas). It is traded in a fungible market where prices are set internationally. Even if the US was awash with millions more barrels of oil, the price would not be determined independently of global prices. Arguably, if the US no longer needed to import oil, then the international price could fall. Yet this is by no means certain. Although the US is currently the world’s largest consumer, the appetite for oil in the developing world is likely to be more than large enough to fill any gap left by the loss of US demand. If, on the other hand, domestic prices dipped dramatically, US producers would seek more attractive markets for their goods abroad (it is illegal to sell US domestic crude overseas, but refined products can be freely traded, effectively making the ban porous). Exporting more petroleum products would cut effective domestic supplies, forcing up prices. This does not look like “independence”.
The US will therefore remain vulnerable to oil-price shocks, however robust its domestic supply. Hopes that greater US oil production will translate into less pricey petrol (gasoline), a boon to consumers, are similarly unfounded. Indeed, a recent study by the Associated Press found that there was no statistical correlation between the volume of home production and the prices motorists pay at the pump.
What of the other principal vaunted benefit of greater domestic oil production, that reduced reliance on overseas oil will allow the US to free itself of costly overseas projection of military power? If Washington does not need to guarantee stable production and transport of oil, could it not afford to abandon its expensive bases in the Middle East and scale down its other military forces?
Again, the assumptions underlying this assertion are too simplistic. Certainly, lower oil imports could help to persuade the US to lighten its footprint in the Middle East; it is, after all, already attempting a “pivot” of its forces towards Asia. But as this neatly illustrates, the US could not simply stop engaging with the world, even if it achieved far higher production of oil. As oil prices are set on global markets, safeguarding sea lanes will remain a priority. The US will seek to retain its position of influence and leadership, however much oil it produces.
This is not to say that the US would derive few advantages from increased self-sufficiency in oil. One major benefit would be seen in its current account. In the first seven months of 2012, the value of petroleum product imports, at US$252bn, accounted for 18% of the US import bill. Reducing oil imports could help to shrink the trade deficit. There would be an even greater benefit to the trade balance, meanwhile, if gushing US oil output led to more exports of higher-value refined petroleum

Independence dayA special report on North America’s oil and gas boom
© The Economist Intelligence Unit Limited 20125
products (the US became a net exporter of refined products in 2011, partly because of sluggish domestic demand). Improvements in the current-account position would reduce US borrowing needs and lead—all else equal—to a stronger dollar. Yet this is a more modest assessment of the usefulness of increased self-sufficiency in oil than what is commonly purveyed.
Special to this report

Independence dayA special report on North America’s oil and gas boom
© The Economist Intelligence Unit Limited 20126
A tale of two revolutionsThe US’s shale-gas boom has hit problems, but shale-oil output is experiencing runaway growth.
The boom in the extraction of gas caught in shale rock formations is by now a well-known story. In 2007 the US produced just 3.5bn cu ft/day of shale gas, less than 7% of the country’s total gas
output. But by 2010 (the most recent year for which data is available) shale-gas output grew to 14.6bn cu ft/d, or one-quarter of total gas production, according to the EIA. The expansion of shale-gas drilling prompted US dry-gas production to grow by one-fifth between 2007 and 2011. Moreover, the EIA argues that there is more growth to come, forecasting that shale gas will comprise 49% of total US gas output by 2035. Yet at the moment, shale-gas drillers are victims of their own success.
The boom in shale-gas output has caused a glut. Much more gas is being stored, while prices at the wellhead have slumped. Henry Hub spot prices have fallen from above US$13/million British thermal units (mBtu) in mid-2008 to around US$3/mBtu today. That is far short of a profitable level for most producers, which is around US$5/mBtu. This year, firms have suffered substantial write-downs on their shale gas-related assets. Yet shale gas’s travails have helped to spur another hydrocarbon boom.
Tight oil, plentiful supplyThe disparity between stubbornly high oil prices and persistently low natural-gas prices has sped a massive migration in the US drilling-rig count from gas to oil. As gas prices fall, investment is moving into shale oil (more properly, “tight oil”) and natural-gas liquids (NGLs). This is also driven by technological improvements and high oil prices. Shale oil is pricier to produce than conventional crude.
Between January 2009 and September 2012 the number of oil rotary rigs in operation in the US increased from 328 to 1,402, of which 82% were the horizontal variety. Over the same period, the number of natural-gas rigs has declined from 1,215 to 454. Shale oil has flowed most prodigiously
Flowing freely (Monthly Bakken oil production, million barrels)
Source: North Dakota Department of Mineral Resources.
12111009082007
0
2
4
6
8
10
12
14
16
18
20
0
2
4
6
8
10
12
14
16
18
20

Independence dayA special report on North America’s oil and gas boom
© The Economist Intelligence Unit Limited 20127
from the North Dakotan sections of the Bakken shale and increasingly from the Eagle Ford play in Texas during the past two years or so (the latter also churns out NGLs and “lease condensate”, another type of liquid recovered from gas). Shale oil will contribute about 0.7m b/d to total domestic supply this year, and is proving the main momentum behind US oil supply growth.
Admittedly, shale oil is not free from problems. It is expensive to extract, and the process uses vast amounts of water. The wells appear to have a short operational life, and are a blight on the landscape. Extraction techniques have also met with hostility from environmentalists—in particular, as with shale-gas production, there are concerns that the chemicals used in the “fracking” process could leak into underground aquifers. However, supporters make much of shale oil’s contribution to energy security, reducing the reliance on foreign supplies. As long as oil prices remain high in comparison to production costs, shale oil looks likely to receive investment—and we forecast that oil prices will stay high for several years. We have thus raised our US oil and natural-gas liquids production forecast: we now expect output to hit 10.5m b/d in 2017, up from 8.1m b/d last year.
Shale gas’s strange resilienceIf drilling momentum has swung towards liquids-rich shale plays and gas prices labour at low levels, this raises a puzzling question. Why have these troubles not yet fed through into a clear drop in gas production? True, several producers have announced cutbacks in drilling activity throughout the year in response to low prices. But industry players are not quitting the scene. According to EIA data, marketed gas production in the first half of 2012 was more than 6% higher than the same period a year earlier. In short, the bubble (if there is one) has yet to burst.
A closer examination reveals several factors at play. Technological improvements have cut costs, enabling producers to carry on drilling at lower prices. Indeed, some firms have no choice but to do so, since they must fulfil lease requirements. There are also companies that hedged their gas volumes by locking in higher prices than those that prevail now.
Bakken the game (US oil production, million barrels/day)
Source: Economist Intelligence Unit.
0
1
2
3
4
5
6
7
8
9
10
11
0
1
2
3
4
5
6
7
8
9
10
11
171615141312111009082007
F o r e c a s t

Independence dayA special report on North America’s oil and gas boom
© The Economist Intelligence Unit Limited 20128
The intervention of big industry players also plays a part. Oil majors and some national oil companies have undertaken joint ventures to finance exploration and production of shale gas. In other cases, big firms have gobbled up assets belonging to cash-strapped smaller players. Take Royal Dutch Shell’s September acquisition of Chesapeake’s unconventional oil and gas acreage, for instance, or the purchase by China’s Sinopec of stakes in shale assets owned by Devon Energy earlier this year. These players will be unwilling to scale back in a hurry, and are able to tough out today’s low prices. They can afford to invest in shale gas now in anticipation of long-term growth in global gas demand. Indeed, we forecast that global gas demand will continue to grow strongly, particularly thanks to Asian demand. Acquiring know-how in unconventional gas is another motivation. Some look forward to the day when the US starts exporting liquefied natural gas to Asia, where prices are relatively high thanks to the scarcity of local supplies.
Finally—and perhaps counter intuitively—drilling at “liquids-rich” plays is also doing its bit to keep US gas production ticking along. In the Bakken field, natural gas is commonly flared. But at Eagle Ford, Utica and other areas producing NGLs, lease condensate and lighter crude oils also produces gas, which keeps volumes up. At the same time, the shale-oil and NGL boom helps to mitigate the financial impact for producers at gassier, less profitable plays. Now, all they need is for gas prices to recover.
Originally published October 9th 2012

Independence dayA special report on North America’s oil and gas boom
© The Economist Intelligence Unit Limited 20129
Sticky situationThe financial underpinnings of new tar-sands mines are in question, although an influx of Chinese money could help.
A ttention surrounding the controversial proposed takeover of Nexen, a Canadian upstream oil and gas giant, by China National Offshore Oil Corporation (CNOOC), focuses mainly on the benefits for
the Chinese state-owned firm. Certainly, the US$15bn deal, which would be the largest-ever overseas takeover by a Chinese company, would bring CNOOC reserves in the Alberta oil sands and elsewhere, and precious expertise. Although currently under Canadian government review, the bid is attracting controversy. Opponents of the most recent in a series of Chinese oil-sands takeovers worry that Canada could lose control of its natural resources. Yet in some cases, bringing in Chinese cash could be the readiest way to sustain production growth.
Canadian producers are increasingly seeking joint ventures with Chinese firms in an effort to finance additional mines and secure markets for their product. A growing number are reining in ambitious expansion plans: tar-sands oil is among the most expensive varieties to produce, but prices for Albertan oil have tumbled. This is because of the surprising onslaught of production in the US, which is depressing prices and straining the continent’s pipeline infrastructure.
US oil output growth is being driven largely by the Bakken shale play in North Dakota: in June 2012 the state’s oil output was 71% higher than a year earlier, while the Bakken accounts for nine out of every ten barrels produced there. The resulting glut has driven down the US oil benchmark, West Texas Intermediate (WTI), to levels well below its European counterpart, Brent crude. Given the swelling competition from south of the border, Alberta’s Western Canadian Select (WCS) is even more steeply discounted. The differential between WCS and WTI averaged nearly US$20 in the second quarter of this year and stood at just over US$7 in mid-September. Admittedly, that is far narrower than the stratospheric levels reached in the first quarter (around US$27). This owes partly to reduced supply during maintenance at an “upgrader” (used to turn heavy oil into lighter crude suitable for making diesel or gasoline) belonging to Syncrude, a Canadian oil firm, and also to growing demand from US refineries for Canada’s cheap feedstock. The volatility itself is a problem, however, as it complicates companies’ investment decisions.
New investments at riskFor these reasons, plans to build new capital-intensive mines in Alberta are at risk. Because of the rising cost of construction in the oil sands, fresh mines are more vulnerable to price fluctuations than established ones. At its existing oil-tar project, for example, Royal Dutch Shell requires just US$30/b to make a profit, whereas at a more recent expansion it needs US$75/b. Indeed, Wood Mackenzie, a consultancy, found that new mines break even at about US$80/b, rising to US$100/b if an upgrader is installed. Yet prices for WCS, at C$85.77/b (US$88.04/b) on September 18th, and synthetic crude, at C$106.71/b (US$109.49/b), are worryingly close to these levels. More profitable opportunities are available elsewhere in North America.
Already, the low prices commanded by their products are forcing Canadian producers to shelve plans for new mines. Canadian Natural Resources will cut spending by almost US$700m this year, largely by

Independence dayA special report on North America’s oil and gas boom
© The Economist Intelligence Unit Limited 201210
rolling back plans to expand its Horizon oil sands project in northern Alberta. Instead, the company will focus capital on its thermal oil unit, which utilises the less expensive extraction method of steam-assisted gravity drainage. Suncor Energy is retreating from its plan to expand production to 1m b/d by 2020, compared with 321,000 b/d so far this year. In this case, it will review three new projects.
Chinese money wanted?What hope that pressure on Canadian tar-sands outfits will lift? There are grounds to think that the WTI-Brent differential will taper off somewhat, when two new pipelines begin transporting oil from the hub at Cushing to Texas refineries next year. However, WCS oil is likely to remain cheap until the northern leg of the Keystone XL pipeline is built. This would release a stronger flow of oil southwards into the US—if, that is, the government chooses to approve it at the third pass.
Given the uncertain outlook for tapping US demand, the incentive for oil-sands producers to try to gain access to Asia’s ravenous oil markets is clear. For this to happen, Canadian oil needs to reach the Pacific Rim. Hence the proposed Northern Gateway pipeline stretching from the oil sands to Canada’s west coast. Admittedly, this pipeline too is bedevilled with complexity: environmental groups and native peoples whose lands the planned link crosses are putting up opposition; it is far from certain to proceed. Nonetheless, China remains the most obvious extra source of demand for Albertan oil—and of funds to enable its extraction. As the US ramps up its own production, China could become an increasingly critical compensating source of demand for Canada’s oil-sands riches.
Originally published September 20th 2012

Independence dayA special report on North America’s oil and gas boom
© The Economist Intelligence Unit Limited 201211
Fluid marketsLow natural-gas prices threaten to dampen the “shale-gas revolution”, casting doubt on the prospects for US exports of liquefied natural gas.
W ith natural-gas prices in Asia nearly five times those in the US, the notion of selling large volumes of US gas overseas in the form of liquefied natural gas (LNG) appears to be what
Americans might call a “no-brainer”. Many observers certainly expect LNG exports to take off. The prospect of a flood of LNG sourced from shale gas would raise alarm bells for those such as Qatar, the LNG world’s largest player, and Australia, its rising star. Yet the advent of LNG from the US is far from a foregone conclusion. Much depends on the outlook for the production and price of US shale gas.
In short order, shale-gas drilling has swelled to provide one-third of all US natural-gas supplies, bringing with it manifold economic benefits. Many projections, most notably those of the EIA, assume that this revolution will roll on well into the future. But the price of gas in the US has plummeted to well below the mark at which shale-gas drilling is profitable.
Most shale-gas producers require prices of at least US$5/mBtu in order to break even in existing, low-cost plays. The break-even price is closer to US$8/mBtu in new, less productive plays. Except for a brief moment in June 2011, however, US gas spot prices (Henry Hub) have languished below the US$5 threshold since March 2010. For more than two years, in other words, nearly all “dry” gas production—that is, at wells not bearing NGLs—has been unprofitable.
Sustaining such loss-making endeavours demands constant infusions of capital. Some has come from joint-venture partners that have bought out leases from the wildcatters who pioneered the shale-gas dash; the rest has come from debt. It cannot come from cash flow. An analysis last year by Bernstein Research, a US-based research firm, found that capital expenditures on land acquisition and new drilling exceeded cash flow among 18 of the top shale-gas producers. The US gas industry as a whole now has to take on US$40bn in new debt each year just to maintain current output, according to Arthur Berman, a gas expert. This is taking a toll. The chief executive of ExxonMobil, Rex Tillerson, puts it succinctly: “we are all losing our shirts today [on natural gas],” he told an audience at the Council on Foreign Relations, a New York-based think tank. “We’re making no money. It’s all in the red.”
Getting wetterThe poor economics of gas production have turned the picture of US oil and gas drilling upside down. Producers focused on “dry” gas plays have become increasingly debt-laden, while those who hold leases in “wet” plays (formations rich in NGLs) have moved their rigs as quickly as possible to these more lucrative areas. In 2008, just as the shale boom was getting under way in earnest, 20% of rigs were drilling for oil and 80% were extracting gas. The reverse is true today.
There is a demand-side logic, too, supporting the idea that the expansion of shale-gas drilling could soon enter a lull. Domestic US gas demand, while growing, has lagged production substantially. Nearly all new demand is from the electricity sector, where the capacity to switch from coal to gas at will is limited. Construction of new gas-fired power plants, while unmistakably happening, takes years.
If not for the much higher prices commanded by NGLs for use mainly in the petrochemicals industry, a drop in shale-gas activity would have occurred by now: natural-gas production is inherently

Independence dayA special report on North America’s oil and gas boom
© The Economist Intelligence Unit Limited 201212
associated with NGL extraction, as liquids are gleaned by separating them from gas. Much gas now being produced is a nuisance product.
In search of balanceLNG shipments have the potential to remove some of the current glut of US gas—and to allow firms to benefit from prices in Asia of US$14/mBtu—but quite how much remains to be seen. North America’s first gas-liquefaction plant, which the US’s Cheniere Energy is now building at Sabine Pass, near the border between Louisiana and Texas, is due to go into operation by 2014-15. With an export capacity of 2.2bn cu ft/d, the facility will only use the equivalent of about 3% of current US dry-gas production. Should all gas export applications currently under review by the Department of Energy (DOE) be approved, LNG exports would be equal to roughly one-half of current US natural-gas consumption. But it might take a decade or more to reach that point.
After Sabine Pass enters service, the best guess currently is that further LNG terminals may not begin operations until at least 2017-18. Only Cheniere’s project has so far secured regulatory approval from the two main concerned government bodies, the DOE and the Federal Energy Regulatory Commission (FERC). Release of a DOE report on the economic implications of gas exports, which is expected to determine the fate of eight other applications to build LNG export facilities, has been postponed until after the November elections. Fears that exports would bring higher US gas prices, due to convergence with overseas markets, make the politics of LNG exports complicated.
The economics, meanwhile, are likely to worsen before they get better. One reason is that, as producers have shifted to wet plays, a glut of NGLs has emerged and liquids prices have fallen sharply. Ethane, which accounts for roughly 40% of a barrel NGLs, has lost most of its value since 2011. Some experts fear that producers could be forced to give it away in particularly congested delivery hubs if overproduction persists. As drillers are discouraged from extracting NGLs, gas volumes are also likely to be hit.
More fundamentally, US gas prices cannot be expected to stay at current levels, which are below the cost of production. For this reason, we expect a process of market-balancing to take effect. Low prices will now lead to a dip in gas production by 2013. Tighter supply will in turn stimulate price rises, encouraging a pick-up in production. This will eventually create an excess of gas that could be sold overseas.
Whether US policymakers will be keen to export much of the country’s endowment of still relatively cheap gas, however, is moot. On balance, it seems likely that the US will only be shipping a fairly modest amount of LNG even in the latter years of this decade. The likes of Qatar and Australia have little reason to panic yet.
Originally published July 20th 2012

Independence dayA special report on North America’s oil and gas boom
© The Economist Intelligence Unit Limited 201213
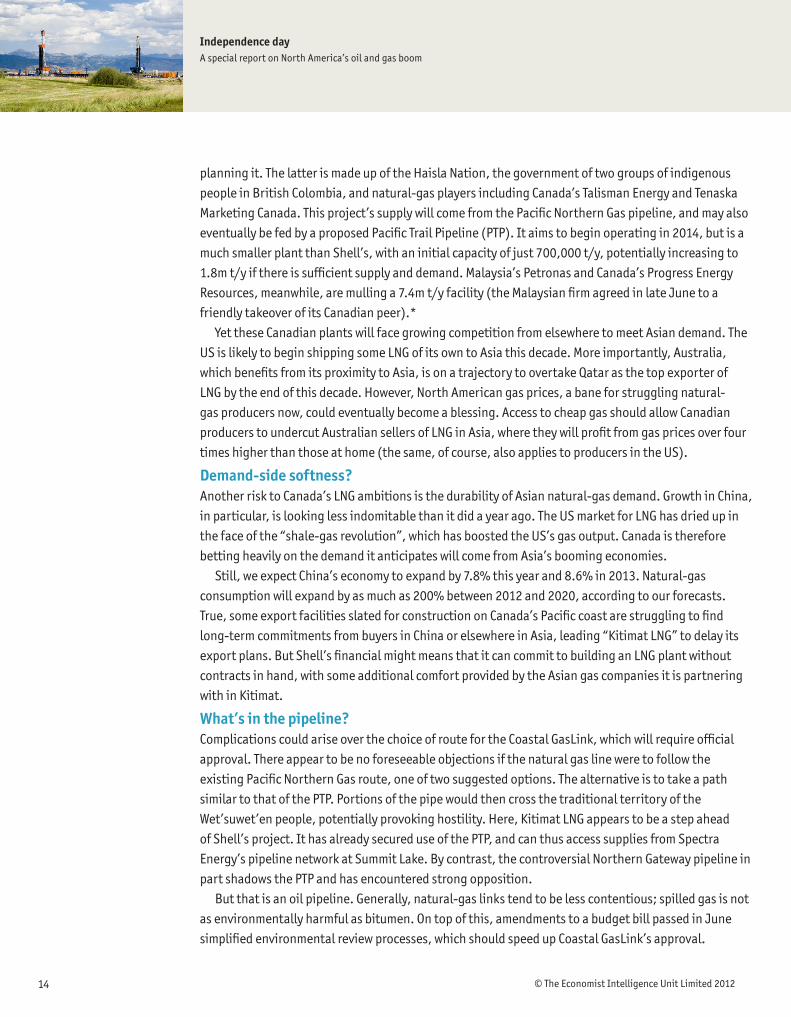
Contest at KitimatA Shell-led project is well placed to become the biggest exporter from British Columbia of liquefied natural gas.
Four plants are vying to export liquefied natural gas (LNG) from Kitimat in British Columbia, on Canada’s west coast, to the growing gas markets of Asia. Royal Dutch Shell announced the largest
proposal yet in May, LNG Canada, a 12m tonne/year (t/y) liquefaction and export facility, for which it has already bought a site. Yet spoilsports soon pointed out a problem—namely, a lack of infrastructure to pipe the gas from inland gasfields to Kitimat. Since then, Shell has taken a big step towards silencing the sceptics.
On June 4th Shell made a deal with TransCanada. Under the terms of the agreement, the pipeline firm is to build, own and operate a 700-km connection, Coastal GasLink, which will supply 1.7bn cu ft/day to the planned export facility. The pipeline will originate near Dawson Creek, linking the Kitimat plant to the shale-gas-rich Montney, Cordova, and Horn River basins in British Columbia. By tapping into TransCanada’s existing pipeline network, it will also be able to draw in supplies from other provinces.
Supply-side competitionShell will take a 40% share in LNG Canada, with Korea Gas (KOGAS), PetroChina and Japan’s Mitsubishi each holding 20%. LNG Canada has applied for, but not yet secured, an export licence. However, it has a number of strengths that could give it an advantage over rivals: scale; financial clout, chiefly by virtue of the involvement of a supermajor such as Shell; a pipeline plan in place; and several partners who happen to be Asian gas buyers. This does not, however, make it a risk-free endeavour.
Global LNG demand is expected to grow rapidly, and Canada needs to move quickly in order to carve out a share of the Asian market. Shell’s chief executive officer, Peter Voser, said in Calgary in late May that the country has until the end of the decade to begin shipments (the subtext presumably being that the government should press on with approving new plants such as Shell’s).
In fact, although the company’s LNG project is shaping up to be British Columbia’s biggest, it will probably not be its first. Shell aims to start shipping gas from Kitimat by the end of this decade—conveniently, just in time to meet Mr Voser’s stated deadline. But a joint venture formed by the US’s Apache and EOG Resources and Canada’s Encana expects to begin commercial activities at its plant, Kitimat LNG, in 2017. This will have an initial capacity of 5m t/y and, unlike LNG Canada, already has an export licence.
So too does BC LNG, the name of both a mooted plant and the consortium
0 km 200
Proposed LNG plants at Kitimat
PACIFIC OCEAN
Kitimat LNG
B R I T I S H C O L U M B I A
BC LNG
B R I T I S H C O L U M B I A
A L B E R T A
C A N A D A
U S
Petronas-Progress
LNG* Canada LNG*
Dawson Creek
BruderheimSummit Lake
Montney Basin
Horn Basin
TerraceKitimat
Prince Rupert
Vancouver
Pacific Trail Pipeline (planned)
No export licence*
Pacific Northern Gas pipeline
Spectra Energy pipeline
Northern Gateway pipeline(planned)
Kitimat
Independence dayA special report on North America’s oil and gas boom
© The Economist Intelligence Unit Limited 201214
planning it. The latter is made up of the Haisla Nation, the government of two groups of indigenous people in British Colombia, and natural-gas players including Canada’s Talisman Energy and Tenaska Marketing Canada. This project’s supply will come from the Pacific Northern Gas pipeline, and may also eventually be fed by a proposed Pacific Trail Pipeline (PTP). It aims to begin operating in 2014, but is a much smaller plant than Shell’s, with an initial capacity of just 700,000 t/y, potentially increasing to 1.8m t/y if there is sufficient supply and demand. Malaysia’s Petronas and Canada’s Progress Energy Resources, meanwhile, are mulling a 7.4m t/y facility (the Malaysian firm agreed in late June to a friendly takeover of its Canadian peer).*
Yet these Canadian plants will face growing competition from elsewhere to meet Asian demand. The US is likely to begin shipping some LNG of its own to Asia this decade. More importantly, Australia, which benefits from its proximity to Asia, is on a trajectory to overtake Qatar as the top exporter of LNG by the end of this decade. However, North American gas prices, a bane for struggling natural-gas producers now, could eventually become a blessing. Access to cheap gas should allow Canadian producers to undercut Australian sellers of LNG in Asia, where they will profit from gas prices over four times higher than those at home (the same, of course, also applies to producers in the US).
Demand-side softness?Another risk to Canada’s LNG ambitions is the durability of Asian natural-gas demand. Growth in China, in particular, is looking less indomitable than it did a year ago. The US market for LNG has dried up in the face of the “shale-gas revolution”, which has boosted the US’s gas output. Canada is therefore betting heavily on the demand it anticipates will come from Asia’s booming economies.
Still, we expect China’s economy to expand by 7.8% this year and 8.6% in 2013. Natural-gas consumption will expand by as much as 200% between 2012 and 2020, according to our forecasts. True, some export facilities slated for construction on Canada’s Pacific coast are struggling to find long-term commitments from buyers in China or elsewhere in Asia, leading “Kitimat LNG” to delay its export plans. But Shell’s financial might means that it can commit to building an LNG plant without contracts in hand, with some additional comfort provided by the Asian gas companies it is partnering with in Kitimat.
What’s in the pipeline?Complications could arise over the choice of route for the Coastal GasLink, which will require official approval. There appear to be no foreseeable objections if the natural gas line were to follow the existing Pacific Northern Gas route, one of two suggested options. The alternative is to take a path similar to that of the PTP. Portions of the pipe would then cross the traditional territory of the Wet’suwet’en people, potentially provoking hostility. Here, Kitimat LNG appears to be a step ahead of Shell’s project. It has already secured use of the PTP, and can thus access supplies from Spectra Energy’s pipeline network at Summit Lake. By contrast, the controversial Northern Gateway pipeline in part shadows the PTP and has encountered strong opposition.
But that is an oil pipeline. Generally, natural-gas links tend to be less contentious; spilled gas is not as environmentally harmful as bitumen. On top of this, amendments to a budget bill passed in June simplified environmental review processes, which should speed up Coastal GasLink’s approval.

Independence dayA special report on North America’s oil and gas boom
© The Economist Intelligence Unit Limited 201215
The other main regulatory hurdle is securing a licence to export gas. So far as it is possible to judge, however, the omens for LNG Canada look good. Few objections to LNG Canada have yet emerged, and Prime Minister Stephen Harper’s Conservative administration is aggressively pursuing Asia as a market for Canadian energy exports. The barriers to Shell’s plant are similar to those faced by its rivals. Not all competing Kitimat projects will necessarily go ahead but, provided that it can navigate the regulatory barriers, Shell looks like it has one of the surer bets.
Originally published August 1st 2012
* On October 19th 2012 Canada’s government rejected the merger between Petronas and Progress. At the time of publication of this report, Petronas was appealing the decision.

Independence dayA special report on North America’s oil and gas boom
© The Economist Intelligence Unit Limited 201216
New oil flowsPipeline developments will only partly release a glut of oil at Cushing. For now, rail has a role in bringing oil to market in North America.
During recent decades, the US has imported most of its oil. Now, however, new sources of supply in the region are emerging rapidly. US dependence on “foreign oil” is falling, while friendly
Canada has become the US’s biggest external supplier. But, under the strain of moving so much new production, the existing network of pipelines is being found wanting. Oil from shale plays in North Dakota in the US, for instance, and from the Alberta tar sands in Canada, has flooded into the main US crude storage hub of Cushing, Oklahoma. There, thanks to a lack of pipeline capacity, over 44m barrels of oil remain stuck, according to the EIA.
Cushing is the point at which the North American crude oil benchmark is set. Due to rampant oversupply, the price of a barrel of WTI oil has slumped. Hence the yawning spread between WTI and its main European counterpart, Brent. The gap between the two measures, which used to be slight, stood at more than US$20 in mid-August. This is bad news for many North American oil producers, particularly those with costly tar-sands operations in Alberta. Prices commanded by some big players there languish at one-quarter below their 2011 peak.
Troubled oil firms will take hope, however, from new developments in US pipeline infrastructure. Reversing the flow of one pipeline from Cushing and building a new link will allow excess oil to escape to south Texas, the heart of the US refining industry. It should be more needed there, thus more highly prized. As a result, WTI crude prices ought, in theory, to appreciate.
Pipeline panacea?The Seaway pipeline once pumped oil from the Gulf of Mexico to now-defunct refineries in Cushing. Today, the demand runs in the opposite direction. So, in May 2012, Seaway’s flow was reversed, making it the first direct link from Cushing to the Gulf coast. It currently moves 150,000 b/d, and pump stations will ramp up the pressure later this year. This will slash the time taken to force the oil through 1,000 km of pipe from 12 days to five and improve Seaway’s rate of flow to 400,000 b/d. Expansion work will then lift capacity to 850,000 b/d by mid-2014.
The other pipeline intended to relieve the build-up of oil in Cushing is Keystone XL. This controversial scheme would link Alberta’s tar sands, anathema to environmentalists, to refineries in Texas. But regulatory scrutiny and political stalling have held up progress on the plan. Nonetheless, TransCanada, the company behind the embattled project, on July 27th finally secured approval to construct the southern leg of the network (which, helpfully, did not need federal authorisation, as the route does not cross an international border). If all goes according to plan, by end-2013 Keystone XL will be shifting 700,000 b/d from Cushing to the Gulf coast, 780 km away.
Barges, lorries but mainly trainsIn the meantime, the lasting glut in Cushing, coupled with the relative cheapness of North American crude, has given rise to alternative, albeit more expensive means of transporting oil. Barges and lorries are doing their bit, but trains are the most important new trend.

Independence dayA special report on North America’s oil and gas boom
© The Economist Intelligence Unit Limited 201217
Pulling oil from A to B by freight train typically costs more than pumping it along a pipeline between the same two points. But, given low oil prices, the difference is affordable for refineries: while the WTI-Brent differential remains wide, cheaply priced domestic oil can undercut imports, even allowing for high rail-transport costs. Moreover, the existing railway system is extensive, so little additional infrastructure needs to be built. When it comes to transporting thick bitumen such as that from Saskatchewan, meanwhile, rail is especially convenient, since it obviates the need to buy the pricey thinning chemicals that allow tar to ooze along pipelines.
In Canada, the shift to transporting oil by rail has been sudden. A loading facility has been built in Saskatchewan in double-quick time, sending off up to 15,000 b/d to refineries in Texas, California and Pennsylvania. Its owner, Altex Energy, has two similar projects in the works in Alberta and reckons one-tenth of oil-sands production will eventually travel by rail, according to The Globe and Mail, a Canadian newspaper.
Across the border in the US, the Burlington Northern railroad carries one-quarter of the oil extracted from the Bakken shale in North Dakota. US Development Group, a logistics company, recently expanded its St. James, Louisiana terminal to be able to offload 130,000 b/d from trains. In the west of the country, Tesoro, a refiner, intends to receive 50,000 b/d by train at its Anacortes refinery—20,000 b/d more than previously announced.
Others, too, are building business plans around the rail option. In early July, private-equity firm Carlyle Group acquired the Sunoco refinery in Philadelphia. Sunoco has been running on expensive Brent-priced crude, but the revised plan is to feed it with 140,000 b/d brought by high-speed trains from the Bakken shale. Some analysts argue that this move signals a rebound in US east-coast refining capacity.
Peering down the trackFor now, while Keystone XL and other pipelines await approval, transporting oil by track is a handy way around the shortcomings of the North American oil transport system. But how long will that last? After all, once Seaway and the southern stretch of Keystone XL are in full flow in 2014, they will be capable of draining Cushing of over 1.5m b/d.
Pipelines linking Cushingto the Gulf coastPipelines linking Cushingto the Gulf coast
UNITED STATESOF AMERICA
Houston
Dallas
Oklahoma CityOklahoma City
Austin
Gulf of MexicoMEXICO
LOUISIANA
MISSOURI
OKLAHOMA
TEXAS
ARKANSAS
Port Arthur
Cushing
Freeport
CANADA
TEXAS
OKLAHOMAOKLAHOMAUSA
0 km 200
Seaway pipelineKeystone XL pipeline(southern leg)

Independence dayA special report on North America’s oil and gas boom
© The Economist Intelligence Unit Limited 201218
Before then, however, the Bakken shale could be churning out 700,000 b/d; while Alberta already sells 1.4m b/d to the US. This suggests that the two pipelines will not completely relieve oversupply in Oklahoma, and a niche may still exist for rail as an oil conduit. Ultimately, however, the fortunes of the WTI benchmark will be critical. As pipelines pump more oil out of Cushing, and trains carry more of it, the US benchmark should theoretically rise. If that happens, refiners’ margins may shrink to the point where paying rail fees no longer makes sense. Rail could be, partly, a victim of its own success.
Originally published August 14th 2012

© The Economist Intelligence Unit Limited 201219
Data, forecasts and analysis for the energy sector in 69 countries
Energy Briefing & Forecasts provides ten-year forecasts and daily news analysis for 69 of the world’s most important energy markets. It supports users in comparing supply and demand potential and
deepens their understanding of how economic and political developments will impact the energy industry.
Critical issues and events analysisEnergy Briefing & Forecasts provides regularly updated coverage of the key events and critical themes affecting the energy industry. The Economist Intelligence Unit’s deep analysis combines our view on the industry’s latest issues with our assessment of forthcoming developments, giving users a detailed overview of the industry worldwide.
A unique forecasting methodologyForecasts are produced in conjunction with economic models developed and maintained by our in-house economics team. These models incorporate the main economic drivers of the energy industry to produce country-specific forecasts. Our team of 160 country and industry analysts monitors these baseline forecasts, adjusting the outlook where necessary and taking into account extensive local knowledge of the market.
Extensive sector coverageEnergy Briefing & Forecasts provides coverage of the main sub-sectors in the energy industry:
l Oil and gas l Coal l Nuclear l Electricity l Alternatives
www.eiu.com/energy
Should you wish to speak to a sales representative please telephone us:Americas: +1 212 698 9717Asia: +852 2585 3888Europe, Middle East & Africa: +44 20 7576 8181
About Energy Briefing & Forecasts

© The Economist Intelligence Unit Limited 201220
Access analysis on over 200 countries worldwide with the Economist Intelligence Unit
The analysis and content in our reports is derived from our extensive economic, financial, political and business risk analysis of over 203 countries worldwide.
You may gain access to this information by signing up, free of charge, at www.eiu.com.Click on the country name to go straight to the latest analysis of that country:
Further reports are available from Economist Intelligence Unit and can be downloaded atwww.eiu.com.
Should you wish to speak to a sales representative please telephone us:Americas: +1 212 698 9717Asia: +852 2585 3888Europe, Middle East & Africa: +44 (0)20 7576 8181
l Canada
l France
l Germany
l Italy
G8 Countries
l Japan
l Russia
l United Kingdom
l United States of America
BRIC Countries
l Indial Brazil l Russia l China
CIVETS Countries
l Turkey
l South Africa
l Vietnam
l Egypt
l Colombia
l Indonesia
Or view the list of all the countries.

© The Economist Intelligence Unit Limited 201221
Meet your specific research needs with our Custom Research service
Successful strategies leave nothing to chance. That is why business leaders throughout the world commission custom research from the Economist Intelligence Unit to enrich their insight for
sharper business decisions.EIU Custom Research was established in 2004 to provide a superior level of knowledge to clients
who need a more thorough understanding of current markets and growth opportunities at a strategic or operational level. This specialist service delivers bespoke business intelligence that is deeper and broader than the published reports and subscription-based services for which we are renowned.
BenchmarkingWe can provide a detailed evaluation of competitors operating in a market you are considering for expansion, evaluate local human capital, the overseas talent market, labour market conditions and how local regulations will affect your organisation—positively or negatively—to help you to prioritise markets for expansion and pinpoint hidden opportunities for growth and profitability.
Find out more by reading this case study.
Country analysisWe can provide you with an in-depth understanding of specific political and economics issues and forecasts including scenario analysis.You may be interested in business environment analysis or cross-country benchmarking—our global reach and ability to focus on your business needs within a cross-country framework is unparalleled.
Find out more by reading this case study.
ForecastingWe are able to help you to understand where you are most likely to find the greatest demand for your products or services—now, and over time. Our unrivalled database of over 200 countries, combined with our ability to offer more granular research, allows us to do this effectively.
Find out more by reading this case study.
IndexingOur expertise is not limited to business or government applications. We can combine our analysis and modelling capabilities with access to global academic experts to develop highly customised indexes that highlight particular factors that your organisation needs to be aware of.
Find out more by reading this case study.
Market sizingWe can help you to determine the best markets in which to expand, how to expand effectively, and what your organisation needs to be ready to manage this expansion. We do this by drawing from our peerless databases of macroeconomic and demographic analysis and forecasting, combined with sophisticated econometric modelling services.
Find out more by reading this case study.

© The Economist Intelligence Unit Limited 201222
Meet your specific research needs with our Custom Research service
Product demandWe can identify where the greatest demand for your product—and the greatest opportunity for expansion—may lie through our access to industry leaders, combined with our expert forecasting and analysis capabilities.
Find out more by reading this case study.
Risk analysisWe can identify obstacles your company may face from exposure to new markets and new opportunities in a comparative framework that sets unfamiliar markets and situations alongside places and activities you already know. We can provide country-specific, operational and financial risk ratings to help you to make informed decisions on a number of different indicators, including early warning of possible market and industry threats in areas such as security, tax policy, supply chain, regulatory, creditworthiness and labour markets.
Find out more by reading this case study.
Visit our website at www.eiu.com/research
Or
Should you wish to speak to a sales representative please telephone us:
Americas: +1 212 698 9717Asia: +852 2585 3888Europe, Middle East & Africa: +44 (0)20 7576 8181

© The Economist Intelligence Unit Limited 201223
Media Enquiries for the Economist Intelligence Unit
Europe, Middle East & AfricaGrayling LondonTommy AllezTel: +44 (0)20 7592 7926Felicity McKaneTel: +44 (0)20 7932 1833Mobile: +44 (0) 7808 643 021Liam JacklinTel: +44 (0)207 932 1838Mobile: +44 (0)783 432 [email protected]
AmericasGrayling New YorkRavi SunnakTel: + 1 (646) 359-2173Kevin MaloneyTel: + 1 (646) 284-9417 [email protected]
Asia Pacific (excluding China)The ConsultancyTom Engel Tel: +852 3114 6337 / +852 9577 [email protected] Ian FokTel: +852 3114 6335 / +852 9348 [email protected] TaylorTel: +852 3114 [email protected]
ChinaGrayling ShanghaiHarriet GaywoodTel: +86 21 5239 7719 / 7729 ext. [email protected]

Cover image - © Jim Parkin/Shutterstock
While every effort has been taken to verify the accuracy of this information, The Economist Intelligence Unit Ltd. cannot accept any responsibility or liability for reliance by any person on this report or any of the information, opinions or conclusions set out in this report.

LONDON26 Red Lion SquareLondon WC1R 4HQUnited KingdomTel: (44.20) 7576 8000Fax: (44.20) 7576 8500E-mail: [email protected]
NEW YORK750 Third Avenue5th FloorNew York, NY 10017United StatesTel: (1.212) 554 0600Fax: (1.212) 586 1181/2E-mail: [email protected]
HONG KONG6001, Central Plaza18 Harbour RoadWanchai Hong KongTel: (852) 2585 3888Fax: (852) 2802 7638E-mail: [email protected]
GENEVABoulevard des Tranchées 161206 GenevaSwitzerlandTel: (41) 22 566 2470Fax: (41) 22 346 93 47E-mail: [email protected]
TM