Embed Size (px)
Citation preview
Indels, structural variation, and recombinationdrive genomic diversity in Plasmodium falciparumAlistair Miles,1,2 Zamin Iqbal,3 Paul Vauterin,1 Richard Pearson,1,2 Susana Campino,2
Michel Theron,2 Kelda Gould,2 Daniel Mead,2 Eleanor Drury,2 John O’Brien,4
Valentin Ruano Rubio,5 Bronwyn MacInnis,5 Jonathan Mwangi,6,7
Upeka Samarakoon,8 Lisa Ranford-Cartwright,7 Michael Ferdig,8 Karen Hayton,9
Xin-zhuan Su,9 Thomas Wellems,9 Julian Rayner,2 Gil McVean,3,10
and Dominic Kwiatkowski1,21MRC Centre for Genomics and Global Health, University of Oxford, Oxford OX3 7BN, United Kingdom; 2Malaria Programme,Wellcome Trust Sanger Institute, Hinxton CB10 1SA, United Kingdom; 3Wellcome Trust Centre for Human Genetics, University ofOxford, Oxford OX3 7BN, United Kingdom; 4Bowdoin College, Brunswick, Maine 04011, USA; 5Broad Institute of Harvard and MIT,Cambridge, Massachusetts 02142, USA; 6Department of Biochemistry, Medical School, Mount Kenya University, 01000 Thika,Kenya; 7Institute of Infection, Immunity and Inflammation, College of Medical, Veterinary and Life Sciences, University of Glasgow,Glasgow G12 8QQ, United Kingdom; 8Eck Institute for Global Health, Department of Biological Sciences, University of Notre Dame,Notre Dame, Indiana 46556, USA; 9Laboratory of Malaria and Vector Research, National Institute of Allergy and Infectious Disease,National Institutes of Health, Bethesda, Maryland 20892-9806, USA; 10Department of Statistics, University of Oxford, OxfordOX1 3LB, United Kingdom
The malaria parasite Plasmodium falciparum has a great capacity for evolutionary adaptation to evade host immunity and
develop drug resistance. Current understanding of parasite evolution is impeded by the fact that a large fraction of the ge-
nome is either highly repetitive or highly variable and thus difficult to analyze using short-read sequencing technologies.
Here, we describe a resource of deep sequencing data on parents and progeny from genetic crosses, which has enabled us to
perform the first genome-wide, integrated analysis of SNP, indel and complex polymorphisms, using Mendelian error rates
as an indicator of genotypic accuracy. These data reveal that indels are exceptionally abundant, being more common than
SNPs and thus the dominant mode of polymorphism within the core genome. We use the high density of SNP and indel
markers to analyze patterns of meiotic recombination, confirming a high rate of crossover events and providing the first
estimates for the rate of non-crossover events and the length of conversion tracts. We observe several instances of meiotic
recombination within copy number variants associated with drug resistance, demonstrating a mechanism whereby fitness
costs associated with resistance mutations could be compensated and greater phenotypic plasticity could be acquired.
[Supplemental material is available for this article.]
Genome variation in the eukaryotic pathogen Plasmodium falcipa-rum underpins both fundamental biology, such as the ability ofthe parasite to evade the human immune response, and clinicaloutcomes, through the evolution of antimalarial drug resistance.This is of particular concern with the recent spread of resistanceto front-line therapies in Southeast Asia (Ashley et al. 2014).High-throughput sequencing is a proven technology for the studyof genome variation in P. falciparum and has yielded insights intoparasite population structure (Manske et al. 2012; Miotto et al.2013), transmission dynamics (Daniels et al. 2015), multiplicityof infection (Nair et al. 2014), the generation of antigenic diversity(Claessens et al. 2014), and the genetic basis for artemisinin resis-tance (Ariey et al. 2014). Despite these recent advances, our currentunderstanding of P. falciparum genome variation remains incom-plete due tomultiple factors that are challenging both for sequenc-
ing technologies and for statistical methods used for variantdiscovery and genotyping. The highly compact 23-Mbp genomehas an extremely biased nucleotide composition, with 80.6%(A + T) content overall and ∼90% (A + T) in noncoding regions(Gardner et al. 2002). As a result, many regions of the parasite ge-nome are highly repetitive, with short tandem repeats and otherlow complexity sequences unusually abundant in both codingand noncoding regions (Gardner et al. 2002; DePristo et al. 2006;Zilversmit et al. 2010; Muralidharan and Goldberg 2013).Another difficulty is that parasite genes encoding antigenic tar-gets of the host immune system tend to exhibit very high levelsof diversity, and alternate alleles can be highly diverged from thereference sequence. An extreme example is the multicopy vargene family encoding erythrocyte surface antigens which candiversify within the course of a single infection by nonallelic re-combination (Freitas-Junior et al. 2000; Bopp et al. 2013; Claessenset al. 2014).
Corresponding author: [email protected] published online before print. Article, supplemental material, and publi-cation date are at http://www.genome.org/cgi/doi/10.1101/gr.203711.115.Freely available online through the Genome Research Open Access option.
© 2016 Miles et al. This article, published in Genome Research, is available un-der a Creative Commons License (Attribution 4.0 International), as described athttp://creativecommons.org/licenses/by/4.0/.
Resource
1288 Genome Research 26:1288–1299 Published by Cold Spring Harbor Laboratory Press; ISSN 1088-9051/16; www.genome.orgwww.genome.org
Cold Spring Harbor Laboratory Press on October 7, 2016 - Published by genome.cshlp.orgDownloaded from
These factors have limited progress, and there are a number ofcurrent knowledge gaps. There has been no comprehensive surveyof insertion/deletion (indel) variation in P. falciparum, althoughthere is evidence that indels may be unusually abundant (Su andWellems 1996; Jeffares et al. 2007; Tan et al. 2010; Haerty andGolding 2011). Little is known about variation in noncoding re-gions, which could have a significant impact on phenotype by reg-ulating gene expression (Gonzales et al. 2008; Mok et al. 2014).Knowledge of complex variation, where haplotypes are highlydiverged from the reference genome, is constrained to a few well-studied genes such asmsp1 (Roy et al. 2008). A critical step in over-coming these obstacles is to have a reliable, empirical indicatorof genotyping error, which allows genotyping methods to be cali-brated and compared. There are many potential sources of errorin the process of high-throughput sequencing and variant call-ing (Robasky et al. 2014), and different analytical methodsmay have different strengths and weaknesses. A proven approachis to sequence multiple individuals belonging to a pedigree andidentify genotype calls in violation of Mendelian inheritance. Asmall number of Mendelian inconsistencies are expected due tode novo mutation, but the observation of many inconsistenciesis a strong indicator of genotyping error. Mendelian errors canthus be used to calibrate methods and filter data (Saunders et al.2007).
Here, we report an analysis of P. falciparum genome varia-tion in the parents and progeny of experimental genetic crosses.We have sequenced all three crosses that have been publishedto date (Walliker et al. 1987; Wellems et al. 1990; Hayton et al.2008) involving the parental clones 3D7, HB3, Dd2, 7G8, andGB4, representing a range of genetic and phenotypic diversity(Su et al. 2007; Ranford-Cartwright and Mwangi 2012). Althoughonly a limited number of crosses are currently available, typicallymore than 30 genetically distinct progeny clones can be obtainedfrom a single cross. The large number of progeny provides a high-er power to observe Mendelian errors than smaller pedigrees ortrios and thus to identify variants which are spurious or wheregenotyping is unreliable. We use a combination of methods forvariant discovery to build a map of genome variation withineach cross, integrating single nucleotide polymorphisms (SNPs),indel and complex polymorphisms, and spanning both codingand noncoding regions of the genome.
We also address open questions regarding meiotic recombi-nation in P. falciparum, a key biological process that generatesand maintains genetic diversity in natural parasite populationsand thus contributes to parasite evolution. Previous studies usingthese crosses have estimated crossover (CO) recombination rates(Walker-Jonah et al. 1992; Su et al. 1999; Jiang et al. 2011) andprovided evidence that non-crossover (NCO) recombination oc-curs (Su et al. 1999; Samarakoon et al. 2011a). Previous studieshave also demonstrated that some recombination events occurwithin coding regions (Kerr et al. 1994) and suggested that recom-bination events are not uniformly distributed over the genome(Jiang et al. 2011). Here, we combine SNP and indel markers to ob-tain a resolution of ∼300 bp within each cross, which is sufficientto estimate rates for both CO and NCO recombination events andto study conversion tract lengths. This resolution is also sufficientto resolve the location of most recombination events relative togene and exon boundaries and study the rate of intragenic recom-bination. We also investigate recombination in the context of twolarge regions of copy number amplification, both of which segre-gate in the crosses and are associated with antimalarial drug resis-tance (Wellems et al. 1990; Samarakoon et al. 2011b).
Results
Whole-genome sequencing and genome accessibility
Whole genomes of parent and progeny clones from the crosses3D7 ×HB3 (Walliker et al. 1987), HB3 ×Dd2 (Wellems et al.1990, 1991), and 7G8 ×GB4 (Hayton et al. 2008) were sequencedusing Illumina high-throughput technology (paired end, readlength 75–100 bp depending on sample, insert size ∼100–200bp)with themajority of samples obtaining an average depth above100× (Table 1; Supplemental Table S1). All DNA libraries were de-rived from haploid parasite clones in culture, and sufficient DNAwas available to use PCR-free library preparation throughout,which has been shown to reduce some of the biases associatedwith the AT-rich P. falciparum genome and hence improve theevenness of coverage across both coding and noncoding regions(Kozarewa et al. 2009). PCR can also induce false indels, providingan additional motivation for using PCR-free libraries (Fang et al.2014). The clone HB3 is a parent in two crosses; however, becauseDNA samples were obtained from different sources and had differ-ent culturing histories, the two HB3 clones were sequenced andanalyzed separately and are here labeled HB3(1) and HB3(2) forcrosses 3D7 ×HB3 and HB3 ×Dd2, respectively. Biological repli-cates were obtained for several progeny clones, where librarieswere created from DNA extracted from different cultures of thesame parasite clone. These were also sequenced and genotypedseparately to enable analysis of concordance between replicates.
Sequence reads from all samples were aligned to the 3D7 ref-erence genome, and various metrics were calculated per genomeposition, including depth of coverage and averaging mappingquality. Visual examination of these data revealed a clear, qualita-tive difference between a core genome (20.8 Mb; 90%) comprisingregions of near-complete coverage and unambiguous alignmentsin all samples; hypervariable regions (1.9 Mb; 8%) where accessi-bilitywas severely affected by both extensive paralogy and extremedivergence from the reference genome; and subtelomeric repeat re-gions (0.6 Mb; 2%) where accessibility was limited by repetitive se-quence (Supplemental Figs. S1–S3; Supplemental Table S2).Hypervariable regions contained all genes in the var family, whichare known to undergo frequent nonallelic recombination duringmitosis (Bopp et al. 2013; Claessens et al. 2014), and almost allgenes in the associated rif and stevor families. Hypervariable re-gions also corresponded closely with regions of heterochromatin(Flueck et al. 2009), confirming a strong association between chro-matin state and qualitative differences in genome variability. Allsamples exhibited some degree of bias such that coverage was low-er where (A + T) content was above 80%; however, the high depthof sequencing meant that >99.6% of the core genomewas coveredin all parental clones. Because of the poor accessibility of hypervar-iable and subtelomeric repeat regions, we excluded them from fur-ther study and limit ourselves to the core genome for theremainder of this paper.
SNPs, indels, and complex variation within the core genome
SNPs, small indels, and regions of complex polymorphism werediscovered and genotyped within each cross by two independentmethods, one based on alignment of sequence reads to the 3D7reference genome (Li and Durbin 2009; DePristo et al. 2011), theother based on partial assembly of sequence reads and comparisonof assembled contigs (Iqbal et al. 2012). Methods for variant call-ing and filtering are given in Supplemental Methods. Variantswhere genotype calls in one or more progeny clones were
Deep sequencing of P. falciparum crosses
Genome Research 1289www.genome.org
Cold Spring Harbor Laboratory Press on October 7, 2016 - Published by genome.cshlp.orgDownloaded from
inconsistent with Mendelian segregation (Mendelian errors) wereused to calibrate variant filtering for both calling methods(Methods; Supplemental Figs. S4–S7). After variants were filtered,bothmethods achieved near-perfect concordance between biolog-ical replicates for both SNPs and indels (Supplemental Table S3),with, at most, 34/27,422 (0.12%) discordant genotypes from thealignment method and 18/33,801 (0.05%) from the assemblymethod for any single clone, demonstrating that the processfrom DNA extraction through sequencing and variant callingwas highly reproducible. The inheritance of parental alleles withinthe progeny of each cross was also highly concordant when com-paring SNPs with indels (>99.7% in all crosses) (Supplemental Fig.S8) or comparing results of the two variant calling methods(>99.8% in all crosses) (Supplemental Figs. S6, S7). To providethe greatest possible resolution for the present study, filtered vari-ants called by eachmethodwere combined into a single call set foreach cross (Table 1; Methods; Supplemental Information).
To estimate rates of false discovery and sensitivity, we com-pared variant alleles called in each of the HB3 replicates withthe HB3 draft assembly (http://www.ncbi.nlm.nih.gov/nuccore/AANS00000000) and publicly available gene sequences for cloneHB3 derived from Sanger sequencing (Supplemental Information;Supplemental Table S4). Although neither of these published re-sources have been independently validated, they provide theonly pre-existing data on both SNP and indel polymorphism withwhich to compare. In comparisons at 32 genes, between 0.6%–
2.7% of SNPs called by the alignment method and 0.0%–1.1% ofSNPs called by the assembly method were not present in eitherthe draft HB3 assembly or the HB3 Sanger sequences, providingan estimate for the false discovery rate (FDR) (Supplemental TableS5). Indel FDR estimates were higher for both calling methods, inthe range 8.3%–12.5%; however, we noted a high rate of indel dis-cordances between previously published sequences (SupplementalFig. S17), suggesting the indel error rates in these sequences maybe high, making reliable FDR estimation difficult. For sample HB3(1), we estimated SNP sensitivity above 84% and indel sensitivityabove 70% for both calling methods; however, sensitivity waslower for HB3(2), particularly for the assembly calling method(Supplemental Table S5). This lower sensitivity forHB3(2)was part-ly due to a technical limitation of the assembly calling method,which was only capable of genotyping variants with a single non-reference allele (Supplemental Information).
Indels are the most abundant form of polymorphism
Within the core genome, segregating indels were more abundantthan SNPs in all three crosses (Table 1). Overall, 83% of indelswere found in noncoding regions, where indels where three timesmore abundant than SNPs. Indels were also relatively abundant incoding regions, with the ratio of SNPs to indels being approximate-ly 2:1. This relative abundance of indels is exceptionally highwhen compared with other species—for example, the SNP to indelratio is approximately 10:1 in primates and 20:1 in bacteria (Chenet al. 2009). The vast majority of indels were expansions or con-tractions of short tandem repeats (STRs), i.e., microsatellites (Fig.1A). In noncoding regions, 83%of indels were STR length variants,of which 71% were variants within poly(AT) repeats. In coding re-gions, 77% of indels were STR variants, of which themajority werewithin poly(asparagine) tracts (Fig. 1B). Longer repeat tracts weremore polymorphic, and for any given tract length, longer repeatunits were more stable (Supplemental Fig. S18), similar to indelsin humans (Montgomery et al. 2013). Tandem repeat sequencesare prone to slipped strand mispairing during DNA replication(Li et al. 2002; Lovett 2004) and are known to be associated withhigh rates of indel mutation (Montgomery et al. 2013). STRs arevery common in noncoding regions of the P. falciparum core ge-nome (Gardner et al. 2002), accounting for 34% of noncoding nu-cleotides. STRs are also unusually abundant in the exome (Tanet al. 2010; Muralidharan and Goldberg 2013), accounting for11% of coding nucleotides. Hence, the high indel to SNP ratiomay be accounted for by the abundance of STRs in the genome,coupled with the high mutability of STRs due to replicationslippage.
Frame shift mutations within coding regions are expected tohave severe consequences and hence be negatively selected. Wefound that 94% of coding indels were size multiples of three andhence preserved the reading frame, whereas most noncodingindels were size multiples of two, reflecting the abundance ofpoly(AT) repeats (Fig. 1A). Within noncoding regions, the pheno-typic consequences of indel mutations are harder to predict.Relatively little is known about the transcription machinery inP. falciparum; however, Brick et al. (2008) predicted the locationof core promoters upstream of genes based on a training set ofknown transcription start sites. We found that intergenic indeldiversity displayed a specific architecture relative to the central
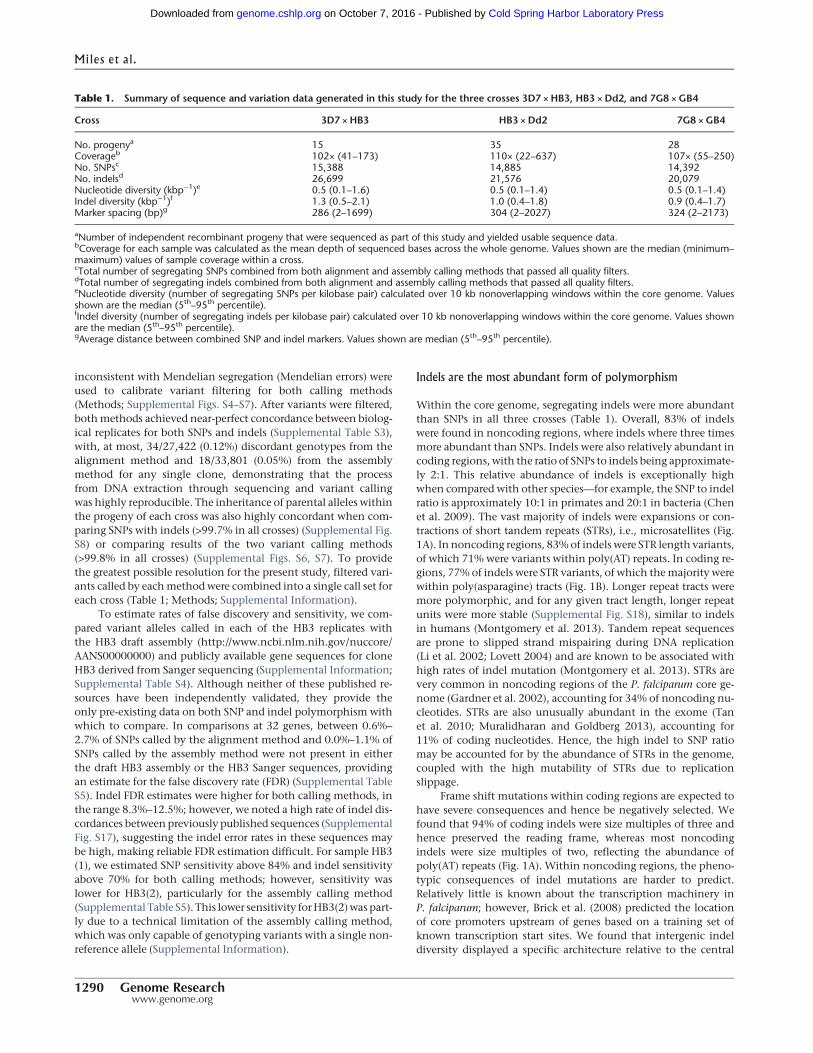
Table 1. Summary of sequence and variation data generated in this study for the three crosses 3D7 × HB3, HB3 ×Dd2, and 7G8 ×GB4
Cross 3D7 × HB3 HB3 ×Dd2 7G8 ×GB4
No. progenya 15 35 28Coverageb 102× (41–173) 110× (22–637) 107× (55–250)No. SNPsc 15,388 14,885 14,392No. indelsd 26,699 21,576 20,079Nucleotide diversity (kbp−1)e 0.5 (0.1–1.6) 0.5 (0.1–1.4) 0.5 (0.1–1.4)Indel diversity (kbp−1)f 1.3 (0.5–2.1) 1.0 (0.4–1.8) 0.9 (0.4–1.7)Marker spacing (bp)g 286 (2–1699) 304 (2–2027) 324 (2–2173)
aNumber of independent recombinant progeny that were sequenced as part of this study and yielded usable sequence data.bCoverage for each sample was calculated as the mean depth of sequenced bases across the whole genome. Values shown are the median (minimum–
maximum) values of sample coverage within a cross.cTotal number of segregating SNPs combined from both alignment and assembly calling methods that passed all quality filters.dTotal number of segregating indels combined from both alignment and assembly calling methods that passed all quality filters.eNucleotide diversity (number of segregating SNPs per kilobase pair) calculated over 10 kb nonoverlapping windows within the core genome. Valuesshown are the median (5th–95th percentile).fIndel diversity (number of segregating indels per kilobase pair) calculated over 10 kb nonoverlapping windows within the core genome. Values shownare the median (5th–95th percentile).gAverage distance between combined SNP and indel markers. Values shown are median (5th–95th percentile).
Miles et al.
1290 Genome Researchwww.genome.org
Cold Spring Harbor Laboratory Press on October 7, 2016 - Published by genome.cshlp.orgDownloaded from
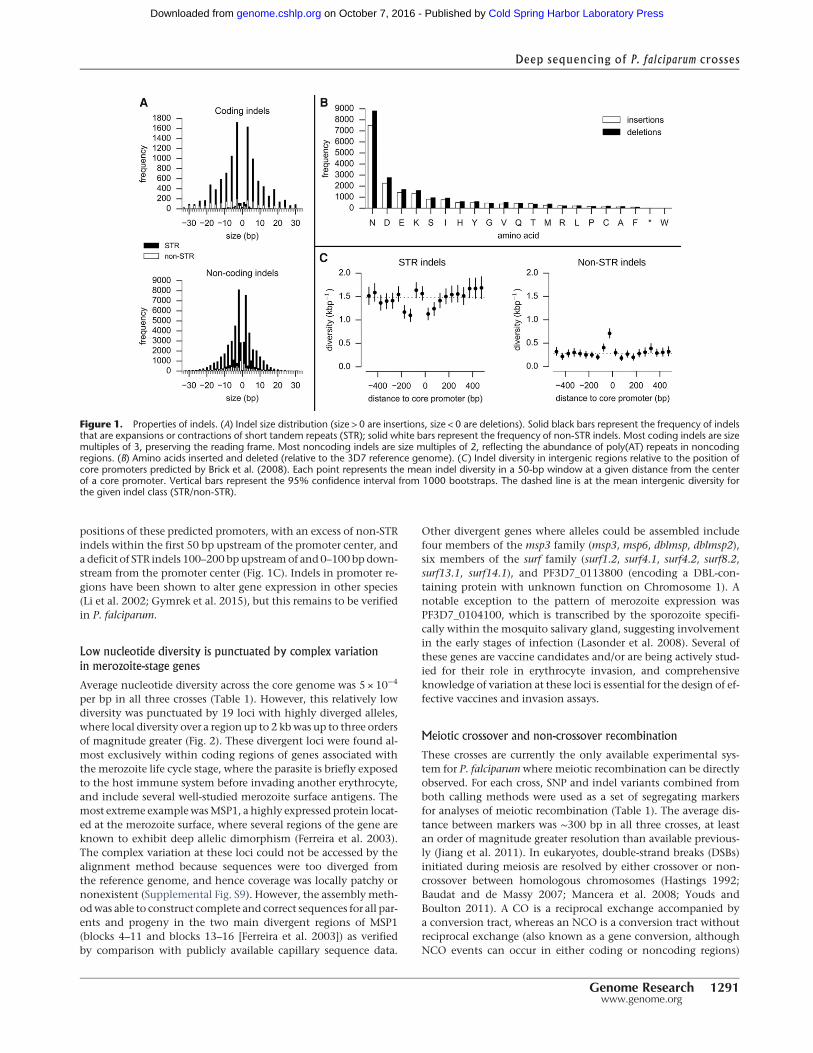
positions of these predicted promoters, with an excess of non-STRindels within the first 50 bp upstream of the promoter center, anda deficit of STR indels 100–200 bp upstreamof and 0–100 bp down-stream from the promoter center (Fig. 1C). Indels in promoter re-gions have been shown to alter gene expression in other species(Li et al. 2002; Gymrek et al. 2015), but this remains to be verifiedin P. falciparum.
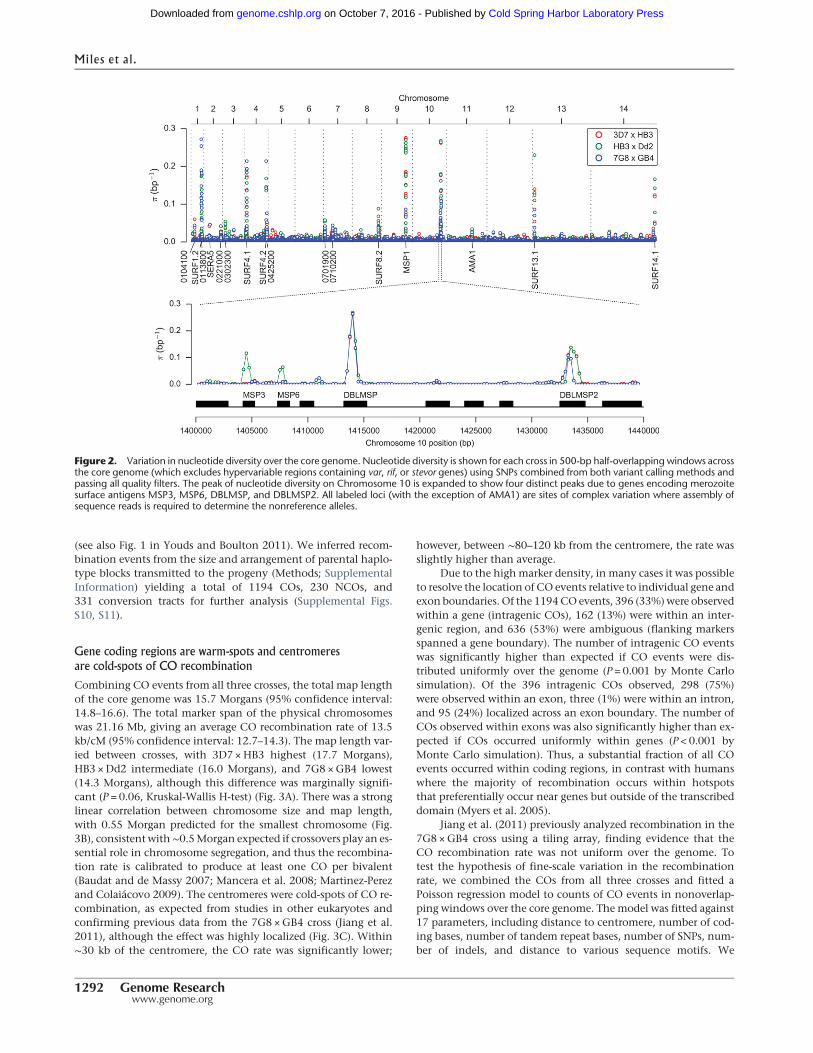
Low nucleotide diversity is punctuated by complex variation
in merozoite-stage genes
Average nucleotide diversity across the core genome was 5 × 10⁻⁴
per bp in all three crosses (Table 1). However, this relatively lowdiversity was punctuated by 19 loci with highly diverged alleles,where local diversity over a region up to 2 kbwas up to three ordersof magnitude greater (Fig. 2). These divergent loci were found al-most exclusively within coding regions of genes associated withthe merozoite life cycle stage, where the parasite is briefly exposedto the host immune system before invading another erythrocyte,and include several well-studied merozoite surface antigens. Themost extreme examplewasMSP1, a highly expressed protein locat-ed at the merozoite surface, where several regions of the gene areknown to exhibit deep allelic dimorphism (Ferreira et al. 2003).The complex variation at these loci could not be accessed by thealignment method because sequences were too diverged fromthe reference genome, and hence coverage was locally patchy ornonexistent (Supplemental Fig. S9). However, the assembly meth-odwas able to construct complete and correct sequences for all par-ents and progeny in the two main divergent regions of MSP1(blocks 4–11 and blocks 13–16 [Ferreira et al. 2003]) as verifiedby comparison with publicly available capillary sequence data.
Other divergent genes where alleles could be assembled includefour members of the msp3 family (msp3, msp6, dblmsp, dblmsp2),six members of the surf family (surf1.2, surf4.1, surf4.2, surf8.2,surf13.1, surf14.1), and PF3D7_0113800 (encoding a DBL-con-taining protein with unknown function on Chromosome 1). Anotable exception to the pattern of merozoite expression wasPF3D7_0104100, which is transcribed by the sporozoite specifi-cally within the mosquito salivary gland, suggesting involvementin the early stages of infection (Lasonder et al. 2008). Several ofthese genes are vaccine candidates and/or are being actively stud-ied for their role in erythrocyte invasion, and comprehensiveknowledge of variation at these loci is essential for the design of ef-fective vaccines and invasion assays.
Meiotic crossover and non-crossover recombination
These crosses are currently the only available experimental sys-tem for P. falciparum where meiotic recombination can be directlyobserved. For each cross, SNP and indel variants combined fromboth calling methods were used as a set of segregating markersfor analyses of meiotic recombination (Table 1). The average dis-tance between markers was ∼300 bp in all three crosses, at leastan order of magnitude greater resolution than available previous-ly (Jiang et al. 2011). In eukaryotes, double-strand breaks (DSBs)initiated during meiosis are resolved by either crossover or non-crossover between homologous chromosomes (Hastings 1992;Baudat and de Massy 2007; Mancera et al. 2008; Youds andBoulton 2011). A CO is a reciprocal exchange accompanied bya conversion tract, whereas an NCO is a conversion tract withoutreciprocal exchange (also known as a gene conversion, althoughNCO events can occur in either coding or noncoding regions)
Figure 1. Properties of indels. (A) Indel size distribution (size > 0 are insertions, size < 0 are deletions). Solid black bars represent the frequency of indelsthat are expansions or contractions of short tandem repeats (STR); solid white bars represent the frequency of non-STR indels. Most coding indels are sizemultiples of 3, preserving the reading frame. Most noncoding indels are size multiples of 2, reflecting the abundance of poly(AT) repeats in noncodingregions. (B) Amino acids inserted and deleted (relative to the 3D7 reference genome). (C) Indel diversity in intergenic regions relative to the position ofcore promoters predicted by Brick et al. (2008). Each point represents the mean indel diversity in a 50-bp window at a given distance from the centerof a core promoter. Vertical bars represent the 95% confidence interval from 1000 bootstraps. The dashed line is at the mean intergenic diversity forthe given indel class (STR/non-STR).
Deep sequencing of P. falciparum crosses
Genome Research 1291www.genome.org
Cold Spring Harbor Laboratory Press on October 7, 2016 - Published by genome.cshlp.orgDownloaded from
(see also Fig. 1 in Youds and Boulton 2011). We inferred recom-bination events from the size and arrangement of parental haplo-type blocks transmitted to the progeny (Methods; SupplementalInformation) yielding a total of 1194 COs, 230 NCOs, and331 conversion tracts for further analysis (Supplemental Figs.S10, S11).
Gene coding regions are warm-spots and centromeres
are cold-spots of CO recombination
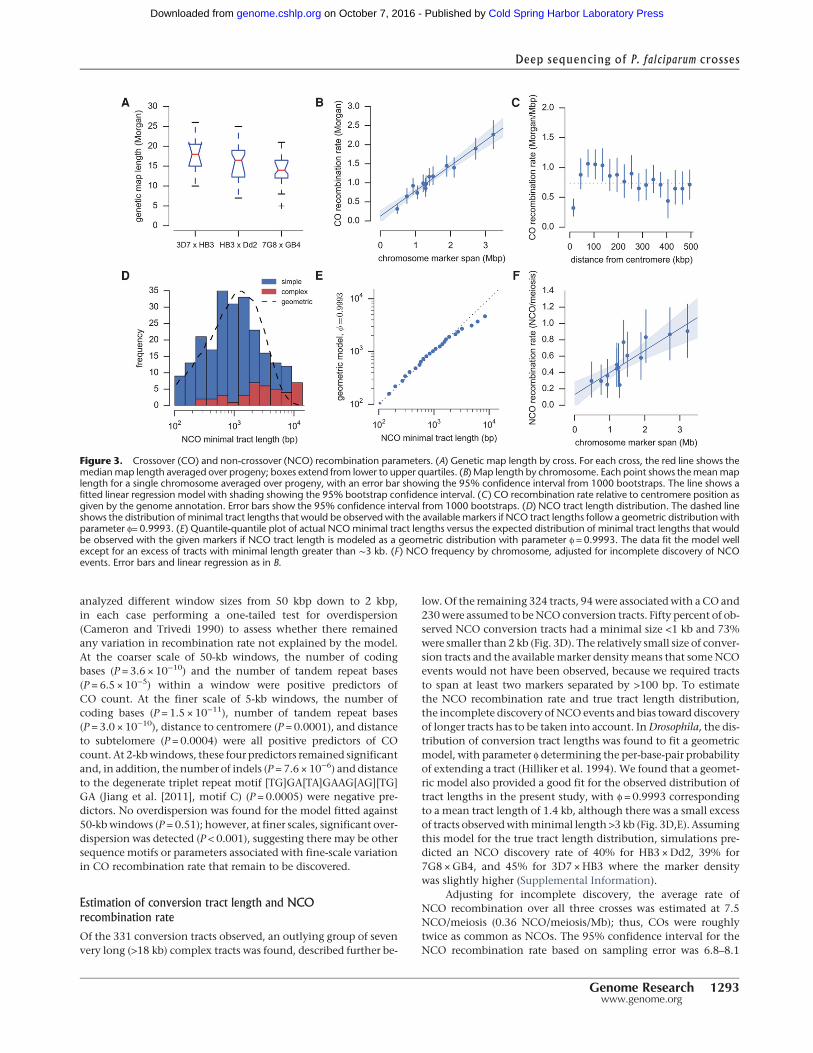
Combining CO events from all three crosses, the total map lengthof the core genome was 15.7 Morgans (95% confidence interval:14.8–16.6). The total marker span of the physical chromosomeswas 21.16 Mb, giving an average CO recombination rate of 13.5kb/cM (95% confidence interval: 12.7–14.3). The map length var-ied between crosses, with 3D7 ×HB3 highest (17.7 Morgans),HB3 ×Dd2 intermediate (16.0 Morgans), and 7G8 ×GB4 lowest(14.3 Morgans), although this difference was marginally signifi-cant (P = 0.06, Kruskal-Wallis H-test) (Fig. 3A). There was a stronglinear correlation between chromosome size and map length,with 0.55 Morgan predicted for the smallest chromosome (Fig.3B), consistent with∼0.5Morgan expected if crossovers play an es-sential role in chromosome segregation, and thus the recombina-tion rate is calibrated to produce at least one CO per bivalent(Baudat and de Massy 2007; Mancera et al. 2008; Martinez-Perezand Colaiácovo 2009). The centromeres were cold-spots of CO re-combination, as expected from studies in other eukaryotes andconfirming previous data from the 7G8 ×GB4 cross (Jiang et al.2011), although the effect was highly localized (Fig. 3C). Within∼30 kb of the centromere, the CO rate was significantly lower;
however, between ∼80–120 kb from the centromere, the rate wasslightly higher than average.
Due to the highmarker density, in many cases it was possibleto resolve the location of CO events relative to individual gene andexon boundaries. Of the 1194COevents, 396 (33%)were observedwithin a gene (intragenic COs), 162 (13%) were within an inter-genic region, and 636 (53%) were ambiguous (flanking markersspanned a gene boundary). The number of intragenic CO eventswas significantly higher than expected if CO events were dis-tributed uniformly over the genome (P = 0.001 by Monte Carlosimulation). Of the 396 intragenic COs observed, 298 (75%)were observed within an exon, three (1%) were within an intron,and 95 (24%) localized across an exon boundary. The number ofCOs observed within exons was also significantly higher than ex-pected if COs occurred uniformly within genes (P < 0.001 byMonte Carlo simulation). Thus, a substantial fraction of all COevents occurred within coding regions, in contrast with humanswhere the majority of recombination occurs within hotspotsthat preferentially occur near genes but outside of the transcribeddomain (Myers et al. 2005).
Jiang et al. (2011) previously analyzed recombination in the7G8 ×GB4 cross using a tiling array, finding evidence that theCO recombination rate was not uniform over the genome. Totest the hypothesis of fine-scale variation in the recombinationrate, we combined the COs from all three crosses and fitted aPoisson regression model to counts of CO events in nonoverlap-ping windows over the core genome. The model was fitted against17 parameters, including distance to centromere, number of cod-ing bases, number of tandem repeat bases, number of SNPs, num-ber of indels, and distance to various sequence motifs. We
Figure 2. Variation in nucleotide diversity over the core genome. Nucleotide diversity is shown for each cross in 500-bp half-overlapping windows acrossthe core genome (which excludes hypervariable regions containing var, rif, or stevor genes) using SNPs combined from both variant calling methods andpassing all quality filters. The peak of nucleotide diversity on Chromosome 10 is expanded to show four distinct peaks due to genes encoding merozoitesurface antigens MSP3, MSP6, DBLMSP, and DBLMSP2. All labeled loci (with the exception of AMA1) are sites of complex variation where assembly ofsequence reads is required to determine the nonreference alleles.
Miles et al.
1292 Genome Researchwww.genome.org
Cold Spring Harbor Laboratory Press on October 7, 2016 - Published by genome.cshlp.orgDownloaded from
analyzed different window sizes from 50 kbp down to 2 kbp,in each case performing a one-tailed test for overdispersion(Cameron and Trivedi 1990) to assess whether there remainedany variation in recombination rate not explained by the model.At the coarser scale of 50-kb windows, the number of codingbases (P = 3.6 × 10⁻¹⁰) and the number of tandem repeat bases(P = 6.5 × 10⁻⁵) within a window were positive predictors ofCO count. At the finer scale of 5-kb windows, the number ofcoding bases (P = 1.5 × 10⁻¹¹), number of tandem repeat bases(P = 3.0 × 10⁻¹⁰), distance to centromere (P = 0.0001), and distanceto subtelomere (P = 0.0004) were all positive predictors of COcount. At 2-kbwindows, these four predictors remained significantand, in addition, the number of indels (P = 7.6 × 10⁻⁶) and distanceto the degenerate triplet repeat motif [TG]GA[TA]GAAG[AG][TG]GA (Jiang et al. [2011], motif C) (P = 0.0005) were negative pre-dictors. No overdispersion was found for the model fitted against50-kbwindows (P = 0.51); however, at finer scales, significant over-dispersion was detected (P < 0.001), suggesting there may be othersequence motifs or parameters associated with fine-scale variationin CO recombination rate that remain to be discovered.
Estimation of conversion tract length and NCO
recombination rate
Of the 331 conversion tracts observed, an outlying group of sevenvery long (>18 kb) complex tracts was found, described further be-
low. Of the remaining 324 tracts, 94were associatedwith a CO and230were assumed to beNCO conversion tracts. Fifty percent of ob-served NCO conversion tracts had a minimal size <1 kb and 73%were smaller than 2 kb (Fig. 3D). The relatively small size of conver-sion tracts and the availablemarker densitymeans that someNCOevents would not have been observed, because we required tractsto span at least two markers separated by >100 bp. To estimatethe NCO recombination rate and true tract length distribution,the incomplete discovery of NCO events and bias toward discoveryof longer tracts has to be taken into account. InDrosophila, the dis-tribution of conversion tract lengths was found to fit a geometricmodel, with parameter ϕ determining the per-base-pair probabilityof extending a tract (Hilliker et al. 1994). We found that a geomet-ric model also provided a good fit for the observed distribution oftract lengths in the present study, with ϕ = 0.9993 correspondingto a mean tract length of 1.4 kb, although there was a small excessof tracts observedwithminimal length >3 kb (Fig. 3D,E). Assumingthis model for the true tract length distribution, simulations pre-dicted an NCO discovery rate of 40% for HB3 ×Dd2, 39% for7G8 ×GB4, and 45% for 3D7 ×HB3 where the marker densitywas slightly higher (Supplemental Information).
Adjusting for incomplete discovery, the average rate ofNCO recombination over all three crosses was estimated at 7.5NCO/meiosis (0.36 NCO/meiosis/Mb); thus, COs were roughlytwice as common as NCOs. The 95% confidence interval for theNCO recombination rate based on sampling error was 6.8–8.1
Figure 3. Crossover (CO) and non-crossover (NCO) recombination parameters. (A) Genetic map length by cross. For each cross, the red line shows themedianmap length averaged over progeny; boxes extend from lower to upper quartiles. (B) Map length by chromosome. Each point shows themeanmaplength for a single chromosome averaged over progeny, with an error bar showing the 95% confidence interval from 1000 bootstraps. The line shows afitted linear regression model with shading showing the 95% bootstrap confidence interval. (C) CO recombination rate relative to centromere position asgiven by the genome annotation. Error bars show the 95% confidence interval from 1000 bootstraps. (D) NCO tract length distribution. The dashed lineshows the distribution of minimal tract lengths that would be observed with the available markers if NCO tract lengths follow a geometric distribution withparameter ϕ= 0.9993. (E) Quantile-quantile plot of actual NCOminimal tract lengths versus the expected distribution of minimal tract lengths that wouldbe observed with the given markers if NCO tract length is modeled as a geometric distribution with parameter ϕ = 0.9993. The data fit the model wellexcept for an excess of tracts with minimal length greater than ∼3 kb. (F ) NCO frequency by chromosome, adjusted for incomplete discovery of NCOevents. Error bars and linear regression as in B.
Deep sequencing of P. falciparum crosses
Genome Research 1293www.genome.org
Cold Spring Harbor Laboratory Press on October 7, 2016 - Published by genome.cshlp.orgDownloaded from
NCO/meiosis; however, this does not account for additional un-certainty in the estimation of NCO discovery rates for each cross.As with CO events, there was a significant enrichment of NCOevents within genes (P = 0.002 by Monte Carlo simulation), with37 (16%) NCO conversion tracts falling entirely within a gene,110 (48%) spanning a gene boundary, 35 (15%) entirely spanninga gene, and 14 (6%) intergenic.
Asmentioned above, seven apparently long (>18 kb) complexconversion tracts were found. Two of these tracts occurred in cloneJF6 (7G8 ×GB4) within a 60-kb region on Chromosome 11 andthus appear to be part of a single complex long-range recombina-tion event involving a total of 20 switches in inheritance(Supplemental Fig. S12). Two biological replicates of clone JF6were sequenced and genotyped in this study, and the pattern of re-combination was identical in both replicates. Similar observationswere made in clones C04 (3D7 ×HB3) and 3BD5 (HB3 ×Dd2)(Supplemental Fig. S12). These observations do not fit well withconventional DSB repair pathways leading to normal CO andNCO events, suggesting other repair pathways may also be usedduring meiosis that have more radical results in terms of generat-ing novel haplotypes (Mancera et al. 2008).
Recombination within copy number variants spanning drug
resistance genes
CloneDd2 is knowntohavea threefoldamplification spanning themultidrug resistance gene mdr1, conferring mefloquine resistance(Cowman et al. 1994). Amplifications have also been found span-ning gch1, conferring resistance to anti-folate drugs, in both HB3and Dd2, although the amplifications are different in size and ex-tent (Kidgell et al. 2006; Heinberg et al. 2013). Themdr1 amplifica-tion segregates in the progeny of HB3 ×Dd2 (Wellems et al. 1990),and there is evidence that meiotic recombination has occurredwithin the amplified region in two progeny clones (Samarakoonet al. 2011a). The gch1 amplificationshavebeen shown to segregatein the progeny of HB3 ×Dd2, although one progeny clone(CH3_61) appeared to inherit both parental amplifications super-posed (Samarakoon et al. 2011a). Some form of recombinationwithin the amplified region could explain this phenomenon, al-though the exact nature of the recombination is uncertain. Allfive parental clones have been shown to carry some form of ampli-fication spanning gch1 (Kidgell et al. 2006; Sepúlveda et al. 2013);thus, the sequencedata generated in this studyprovide anopportu-nity to elaborate on previous results for HB3 ×Dd2 and extend theanalysis of copy number variant (CNV) transmission and recombi-nation at drug resistance loci to 3D7 ×HB3 and 7G8 ×GB4.
We combined data on depth of sequence coverage and theorientation of aligned read pairs to study CNV alleles in all threecrosses (Methods; Supplemental Information). The sequencedata confirmed a threefold amplification in Dd2 spanning mdr1and transmission as either two or three copies to 14 progeny ofHB3 ×Dd2 (Supplemental Fig. S13). Evidence for amplificationsspanning gch1 was also clear in all parental clones (Fig. 4). The3D7 reference sequence (version 3) has only a single copy ofgch1; however, all CNV studies, including ours, have found the3D7 clone to carry multiple copies of gch1, indicating an error inthe reference sequence. Parental amplifications spanning gch1 alldiffered in extent and copy number, confirming previous findings(Nair et al. 2008; Sepúlveda et al. 2013). The alignment of readpairs indicated that the Dd2 amplification was arranged as a tan-dem inversion (Fig. 4D), whereas 3D7, HB3, and 7G8 carriedtandemarrays (Fig. 4A,E), adding further evidence for the indepen-
dent origin of these CNValleles. TheHB3(2) sample appeared to bea mixture, with ∼20% of parasites retaining the duplication foundinHB3(1) and 80%having no amplification (Fig. 4D), which is notunexpected given that amplifications can be lost in culture in theabsence of drug pressure, leading to a mixed colony of parasites(Cowman et al. 1994). We found short (<50 bp) regions of homol-ogy at the putative breakpoints in 3D7, HB3, and 7G8, consistentwith previous CNV studies in P. falciparum (Nair et al. 2007), sug-gesting these tandem amplifications arose via unequal crossing-over. Transmission of gch1 CNV alleles was consistent withMendelian segregation in the progeny of all three crosses exceptfor two progeny of 3D7 ×HB3 (C05, C06) and one progeny ofHB3 ×Dd2 (CH3_61), where both parental alleles appeared to beinherited together (Fig. 4; Supplemental Figs. S14–S16).
Recombination within amplified regions leads
to pseudo-heterozygosity
To further explore the apparent non-Mendelian inheritance ofgch1 CNV alleles, we considered possible recombination eventsthat could explain the observed patterns of inheritance. Depend-ing on how homologous chromosomes align during meiosis, acrossover within a region that is duplicated in one parent could re-sult in a daughter thatmaintains the same duplication but inheritsone copy from either parent for some portion of the amplified re-gion. Within such a segment, a haploid individual would becomeeffectively diploidheterozygous for any SNP, indel, or smallerCNVvariants that segregated between the two parents. We used thealignment of sequence reads from each progeny clone to the3D7 reference genome to look for evidence of pseudo-heterozygos-ity and thus recombination within amplified regions. At segre-gating sites within a region of pseudo-heterozygosity, readssupporting each parental allele should appear in a roughly 1:1 ra-tio, whereas elsewhere only one parental allele should be observed.
At the gch1 locus, both clones C05 and C06 inherited thelarge 161-kb duplication from parent HB3 as well as the smaller2-kb fourfold amplification from parent 3D7 spanning gch1 only(Fig. 4). C06 had a region of heterozygosity spanning the leftmost130 kb of the region duplicated in HB3 but was apparently homo-zygous for the remainder of this region (Fig. 4B). The most parsi-monious explanation is that a single crossover occurred withinthe region duplicated in HB3. Clone C05 had a region of heterozy-gosity spanning the entire region duplicated in HB3, with bordersthat appeared to coincide closelywith the breakpoints of the dupli-cation (Fig. 4C). This is harder to explain as it would require at leasttwo crossover events at or close to the borders of the duplicated re-gion, which would seem improbable unless the CNV breakpointsare also prone to meiotic crossover (Völker et al. 2010). For bothclones C05 and C06, gch1 itself lay within the region of heterozy-gosity, thus one copy of gch1 was inherited from HB3 and fourcopies from 3D7. At the same locus, clone CH3_61 inherited the161-kb duplication fromHB3 as well as the 5-kb threefold tandeminversion fromDd2 (Fig. 4E). Two separate regions of heterozygos-ity were visible at either end of the HB3 duplicated region, whichcan be explained if two crossover events occurred. Again, gch1was within the region of heterozygosity, and thus CH3_61 ac-quired one copy from HB3 and three copies from Dd2. We alsoconfirmed previous evidence for recombination within the 82-kbamplification spanning mdr1 in two progeny of HB3 ×Dd2(Samarakoon et al. 2011a). Clone QC23 had a region of heterozy-gosity spanning the leftmost 16 kb of the segment, and CH3_61was heterozygous for the rightmost 40 kb spanning mdr1 itself
Miles et al.
1294 Genome Researchwww.genome.org
Cold Spring Harbor Laboratory Press on October 7, 2016 - Published by genome.cshlp.orgDownloaded from
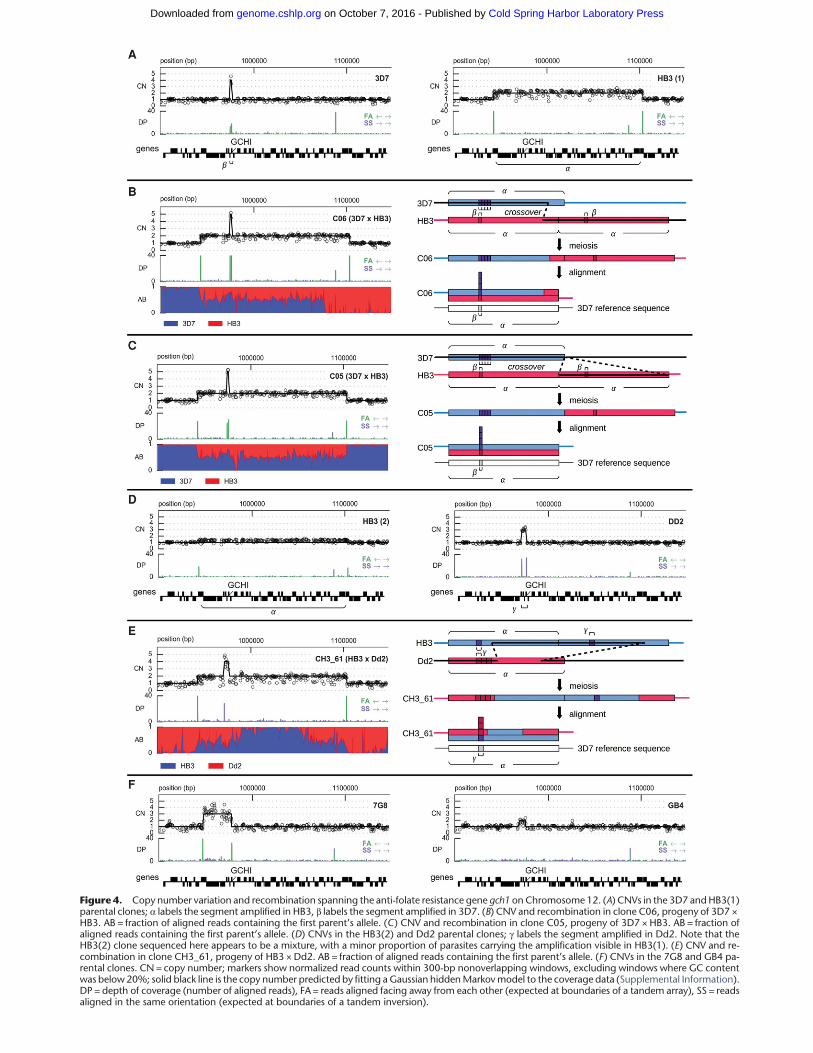
Figure 4. Copy number variation and recombination spanning the anti-folate resistance gene gch1 on Chromosome 12. (A) CNVs in the 3D7 andHB3(1)parental clones; α labels the segment amplified in HB3, β labels the segment amplified in 3D7. (B) CNV and recombination in clone C06, progeny of 3D7 ×HB3. AB = fraction of aligned reads containing the first parent’s allele. (C) CNV and recombination in clone C05, progeny of 3D7 × HB3. AB = fraction ofaligned reads containing the first parent’s allele. (D) CNVs in the HB3(2) and Dd2 parental clones; γ labels the segment amplified in Dd2. Note that theHB3(2) clone sequenced here appears to be a mixture, with a minor proportion of parasites carrying the amplification visible in HB3(1). (E) CNV and re-combination in clone CH3_61, progeny of HB3 × Dd2. AB = fraction of aligned reads containing the first parent’s allele. (F) CNVs in the 7G8 and GB4 pa-rental clones. CN = copy number; markers show normalized read counts within 300-bp nonoverlapping windows, excluding windows where GC contentwas below20%; solid black line is the copy number predicted by fitting a Gaussian hiddenMarkovmodel to the coverage data (Supplemental Information).DP = depth of coverage (number of aligned reads), FA = reads aligned facing away from each other (expected at boundaries of a tandem array), SS = readsaligned in the same orientation (expected at boundaries of a tandem inversion).
Cold Spring Harbor Laboratory Press on October 7, 2016 - Published by genome.cshlp.orgDownloaded from
(data not shown). Both of these are consistent with a single cross-over having occurred within the amplified region.
Discussion
Genome variation has been studied in P. falciparum using a varietyof technologies (e.g., Su andWellems 1996; Kidgell et al. 2006; Muet al. 2007; Neafsey et al. 2008; Manske et al. 2012). However, wehave described the first integrated analysis of SNPs, indels, andcomplex polymorphisms, spanning both coding and noncodingregions of the core genome. Our analysis excluded hypervariableregions containing var genes, because divergence from the refer-ence genome combined with paralogous sequence present severechallenges to both alignment- and assembly-based variant callingmethods using short sequence reads. Longer sequence reads willbe required to overcome these challenges and fully characterizethe structural rearrangements between var genes that occur duringmitosis (Claessens et al. 2014).
We found that indels were the most common polymorphismwithin the core genome. Indels were exceptionally common innoncoding regions and displayed a specific pattern of abundancerelative to the position of predicted core promoters. Repeat lengthvariants within regulatory regions have been found in other spe-cies and shown to affect gene activity (Li et al. 2002; Muzzey et al.2013). Using the HB3 ×Dd2 cross, Gonzales et al. (2008) showedthat both cis and trans genetic variation influences gene expressionin P. falciparum, including a major trans regulatory hotspot coin-ciding with the amplification spanning mdr1. Variation in generegulation could affect clinically relevant phenotypes includingdrug sensitivity; e.g.,Mok et al. (2014) found that deletion of a pro-moter upstream ofmrp2 altered sensitivity to quinoline drugs. Thedata on noncoding variation presented here could provide a start-ing point for further experimental work to explore the impact ofnoncoding variation in P. falciparum.
P. falciparum is a sexually reproducing eukaryotic pathogen,and these crosses provided the first demonstration that parasitesundergo meiotic recombination while in the mosquito (Wallikeret al. 1987). We combined data from all three crosses to estimatea CO recombination rate in the range 12.7–14.3 kb/cM, in closeagreement with previous studies (Jiang et al. 2011). We alsoestimated that CO events are approximately twice as frequent asNCO events, similar to yeast (Mancera et al. 2008) but contrast-ing with humans (Padhukasahasram and Rannala 2013) andDrosophila (Miller et al. 2012), where NCOsmay bemore commonthan COs. Samarakoon et al. (2011b) studied two progeny ofHB3 ×Dd2 using 454 sequencing and observed a similar numberof CO and putative NCO events in both progeny samples. It isnot clear why our estimatedNCO rate is lower, especially asmarkerresolution is an order of magnitude higher in this study, and thuspower to observe NCO tracts should be higher.We found that con-version tract lengths in P. falciparum are comparable to yeast(Mancera et al. 2008) but longer than humans (Jeffreys and May2004) and Drosophila (Hilliker et al. 1994; Miller et al. 2012). Ourobservations of apparent long-range complex recombinationevents spanning >60 kb in some progeny do not fit well with cur-rentmodels for eukaryotic recombination pathways and remain tobe explained, although similar events have been observed in yeast(Mancera et al. 2008).
In many eukaryotes, the recombination rate is known to bevariable over the genome, with most recombination concentratedwithin narrow hotspots (Myers et al. 2005; Drouaud et al. 2006;Tsai et al. 2010). Previous work on the 7G8 ×GB4 cross suggested
that the P. falciparum genome may also contain recombinationhotspots (Jiang et al. 2011). At scales of 2–5 kbwe found that, with-in the core genome, recombination rates were lower near centro-meres and subtelomeres, and higher CO recombination rateswere associated with repeat-rich coding sequence, including oneof the hotspot motifs previously identified, a 12-bp degeneratetriplet repeat (Jiang et al. 2011). Coding regions have higher(G +C) content than noncoding regions in P. falciparum, and sothis could indicate a preference for double-strand break formationin regions with higher (G +C) content; however, this does not ex-plain the bias toward repetitive sequence. At finer scales, the pa-rameters we modeled did not fully explain the variation inrecombination rates observed; thus, there may be other factorsdriving local variation in recombination rate. However, given thetotal number of CO events (1194) observed in this study, we can-not be confident about the existence of any specific recombinationhotspots. For example, taking a simple definition of hotspot as any5-kb window with two or more CO events in a single cross, onlyseven of 204 hotspots would be discovered in more than one crossand none in all three crosses. Further crosses combined with fine-scale recombination maps estimated from population data wouldhelp to resolve these questions.
We have extended the previous observation of a recombina-tion event within the gch1 amplification in the HB3 ×Dd2 cross(Samarakoon et al. 2011a) to illustrate two other cases of meioticrecombination within amplifications at this locus. We have alsoshown that all of these events generate regions of pseudo-hetero-zygosity within a progeny clone where both parental sequencesare inherited and maintained within a single haploid genome.Such events could have important evolutionary consequences.First, drug resistance mutations may confer a fitness cost relativeto the wild-type allele in the absence of drug pressure (Andersonet al. 2009; Kondrashov 2012; Rosenthal 2013) and may also con-fer both resistance to one class of drugs and sensitivity to another(Anderson et al. 2009). The process of amplification followed byhomologous recombination provides a mechanism by whichboth mutant and wild-type alleles can be acquired. If both allelesare expressed, this could produce a new codominant phenotype,compensating for the lower fitness of either allele alone. The acqui-sition of both alleles also creates an opportunity to epigeneticallysilence one allele and switch expression between alleles if condi-tions change. Epigenetic switching between duplicated genes hasbeen shown to occur at the clag3 locus, altering susceptibility tothe antibiotic blasticidin S (Mira-Martínez et al. 2013). Over a lon-ger timescale, gene duplication combined with recombinationmay facilitate functional diversification, enabling adaptation todifferent or novel conditions. For example, in plant viruses, geneduplication and recombination may have facilitated adaptationto a wide range of host species (Valli et al. 2007).
Finally,we remarkon the connection between indel andCNVmutation. Previous studies have found that CNV breakpoints al-most invariably occur at sites with some degree of local homology,suggesting that amplifications are due to improper pairing of ho-mologous chromosomes followed by unequal crossover (Nairet al. 2007). Tandem repeats are highly abundant in the P. falcipa-rum core genome; thus, there are many sites of ectopic homologyproviding opportunities for improper pairing during meiosis.Nair et al. (2007) also showed that CNV breakpoints are found inrepeat region that are slightly longer than the genome-wideaverage; thus, variation in tandem repeat length could shift theamplification potential to a different set of loci. We have shownhere that indel variants within tandem repeat regions are
Miles et al.
1296 Genome Researchwww.genome.org
Cold Spring Harbor Laboratory Press on October 7, 2016 - Published by genome.cshlp.orgDownloaded from
abundant throughout the core genome, and thus amplificationpotential is likely to be highly dynamic and variablewithinnaturalpopulations.
The core genome of P. falciparum thus appears stable yetpoised to undergo rapid evolution within any region that comesunder selection. This may become particularly relevant as malariaelimination intensifies in Southeast Asia, applying ever strongerselective pressures to parasite populations.
Methods
Whole-genome sequencing
All sequencing was carried out using Illumina high-throughputtechnology as described in Manske et al. (2012), except that thePCR-free method of library preparation as described in Kozarewaet al. (2009) was used.
Variant calling
Variants were called by two independent methods. The alignmentmethod followed GATK best practice recommendations (DePristoet al. 2011; Van der Auwera et al. 2013) with some adaptationsfor P. falciparum. The assembly method used Cortex (Iqbal et al.2012) following the independent workflow. Mendelian errorswere used to calibrate variant filtering methods. Filtered variantsfrom both calling methods were then combined into a single setof segregating variation for each cross.
Inference of CO and NCO recombination events
and conversion tracts
The combined variant call sets were used to infer recombinationevents via the inheritance of parental haplotype blocks. The call-ing algorithm identified conversion tracts and called CO andNCO events from the size and arrangement of parental haplotypeblocks within each progeny clone, based on the assumption thattwo CO events are unlikely to occur within close proximity, andtherefore short haplotype blocks (minimal size < 10 kb) are dueto conversion tracts.
Recombination analyses
To calculate the map length for each cross, the identity map func-tion was used because the marker density was high, and thuswe assumed all crossovers were observed. To estimate the true con-version tract length distribution, the parameter ϕ (per-base-pairprobability of extending a tract) was fitted via Monte Carlo simu-lations. These simulations also estimated the fraction of conver-sion tracts that would be discovered given the markers availablein each cross. The rate of NCO recombination was then estimatedby adjusting the number of observed NCO events by the estimateddiscovery rate.
To study variation in recombination rate over the genome,we fitted a Poisson regression model to counts of CO events innonoverlapping windows over the genome using the glm() func-tion in R (R Core Team 2015) and tested for overdispersion usingthe AER package (Kleiber and Zeileis 2008). The following param-eters were included in the model: distance to centromere, distanceto subtelomere, number of coding bases within the window, num-ber of tandem repeat bases within the window, percent (G +C),number of segregating SNPs, number of segregating indels, nearestdistance to each of the five motifs identified in Jiang et al. (2011),and nearest distance to the common repeat motifs poly(A),poly(T), poly(AT), and poly(AAT).
Copy number variation
The genome was divided into 300-bp nonoverlapping bins, andthe number of reads whose alignment started within each binwas calculated for each sample. Bins where the GC content waslower than 20% were excluded from coverage analyses due to cov-erage bias inmost samples. The binned read counts were then nor-malized by dividing by the median read count found within thecore regions of Chromosome 14. Copy number state was predictedin all samples by fitting a Gaussian hidden Markov model to thenormalized coverage data.
Data access
Genome sequence data from this study have been submitted to theEuropean Nucleotide Archive (ENA; http://www.ebi.ac.uk/ena)under study accession numbers PRJEB2146 (3D7 ×HB3) andPRJEB2136 (HB3 ×Dd2 and 7G8 ×GB4). Alignments of sequencereads to the 3D7 reference genome have been submitted to theENA under study accession number PRJEB14481. A mappingfrom clone identifiers to ENA run accessions is given in Supple-mental Table S1. All variant calls from this studyhavebeen submit-ted to the EuropeanVariationArchive (EVA; http://www.ebi.ac.uk/eva) under study accession number PRJEB14423. Data from thisstudy can also be downloaded from a public FTP site at ftp://ngs.sanger.ac.uk/production/malaria/pf-crosses/ and can be exploredinteractively via a Web application at http://www.malariagen.net/apps/pf-crosses/ (Supplemental Methods section 1.5, Supple-mental Fig. S19).
Acknowledgments
This work was supported by the Wellcome Trust (090770/Z/09/Z;098051) and Medical Research Council UK & DFID (MR/M006212/1) and by the Division of Intramural Research,National Institute of Allergy and Infectious Diseases, NationalInstitutes of Health. Research in L.R.-C.’s laboratory was supportedby the Wellcome Trust (091791).
References
Anderson TJC, Patel J, Ferdig MT. 2009. Gene copy number and malariabiology. Trends Parasitol 25: 336–343.
Ariey F, Witkowski B, Amaratunga C, Beghain J, Langlois A-C, Khim N, KimS, Duru V, Bouchier C, Ma L, et al. 2014. A molecular marker of arte-misinin-resistant Plasmodium falciparum malaria. Nature 505: 50–55.
Ashley EA, Dhorda M, Fairhurst RM, Amaratunga C, Lim P, Suon S, Sreng S,Anderson JM,Mao S, Sam B, et al. 2014. Spread of artemisinin resistancein Plasmodium falciparum malaria. N Engl J Med 371: 411–423.
Baudat F, de Massy B. 2007. Regulating double-stranded DNA break repairtowards crossover or non-crossover during mammalian meiosis.Chromosome Res 15: 565–577.
Bopp SER, Manary MJ, Bright AT, Johnston GL, Dharia NV, Luna FL,McCormack S, Plouffe D, McNamara CW, Walker JR, et al. 2013.Mitotic evolution of Plasmodium falciparum shows a stable core genomebut recombination in antigen families. PLoS Genet 9: e1003293.
Brick K,Watanabe J, Pizzi E. 2008. Core promoters are predicted by their dis-tinct physicochemical properties in the genome of Plasmodium falcipa-rum. Genome Biol 9: R178.
Cameron AC, Trivedi PK. 1990. Regression-based tests for overdispersion inthe Poisson model. J Econom 46: 347–364.
Chen J-Q, Wu Y, Yang H, Bergelson J, Kreitman M, Tian D. 2009. Variationin the ratio of nucleotide substitution and indel rates across genomes inmammals and bacteria. Mol Biol Evol 26: 1523–1531.
Claessens A, Hamilton WL, Kekre M, Otto TD, Faizullabhoy A, Rayner JC,Kwiatkowski D. 2014. Generation of antigenic diversity in Plasmodiumfalciparum by structured rearrangement of var genes during mitosisPLoS Genet 10: e1004812.
Cowman AF, Galatis D, Thompson JK. 1994. Selection for mefloquine resis-tance in Plasmodium falciparum is linked to amplification of the pfmdr1
Deep sequencing of P. falciparum crosses
Genome Research 1297www.genome.org
Cold Spring Harbor Laboratory Press on October 7, 2016 - Published by genome.cshlp.orgDownloaded from
gene and cross-resistance to halofantrine and quinine. Proc Natl Acad Sci91: 1143–1147.
Daniels RF, Schaffner SF,Wenger EA, Proctor JL, Chang H-H,WongW, BaroN, Ndiaye D, Fall FB, Ndiop M, et al. 2015. Modeling malaria genomicsreveals transmission decline and rebound in Senegal. Proc Natl Acad Sci112: 7067–7072.
DePristo MA, Zilversmit MM, Hartl DL. 2006. On the abundance, aminoacid composition, and evolutionary dynamics of low-complexity re-gions in proteins. Gene 378: 19–30.
DePristo MA, Banks E, Poplin R, Garimella KV, Maguire JR, Hartl C,Philippakis AA, del Angel G, Rivas MA, Hanna M, et al. 2011. A frame-work for variation discovery and genotyping using next-generationDNA sequencing data. Nat Genet 43: 491–498.
Drouaud J, Camilleri C, Bourguignon P-Y, Canaguier A, Bérard A, Vezon D,Giancola S, Brunel D, Colot V, Prum B, et al. 2006. Variation in crossing-over rates across chromosome 4 of Arabidopsis thaliana reveals the pres-ence of meiotic recombination “hot spots”. Genome Res 16: 106–114.
Fang H,Wu Y, Narzisi G, O’Rawe JA, Barrón LTJ, Rosenbaum J, RonemusM,Iossifov I, Schatz MC, Lyon GJ. 2014. Reducing INDEL calling errors inwhole genome and exome sequencing data. Genome Med 6: 89.
Ferreira MU, RibeiroWL, Tonon AP, Kawamoto F, Rich SM. 2003. Sequencediversity and evolution of the malaria vaccine candidate merozoite sur-face protein-1 (MSP-1) of Plasmodium falciparum. Gene 304: 65–75.
Flueck C, Bartfai R, Volz J, Niederwieser I, Salcedo-Amaya AM, Alako BTF,Ehlgen F, Ralph SA, Cowman AF, Bozdech Z, et al. 2009. Plasmodium fal-ciparum heterochromatin protein 1 marks genomic loci linked to phe-notypic variation of exported virulence factors. PLoS Pathog 5:e1000569.
Freitas-Junior LH, Bottius E, Pirrit LA, Deitsch KW, Scheidig C, Guinet F,Nehrbass U, Wellems TE, Scherf A. 2000. Frequent ectopic recombina-tion of virulence factor genes in telomeric chromosome clusters of P. fal-ciparum. Nature 407: 1018–1022.
Gardner MJ, Hall N, Fung E,White O, BerrimanM, Hyman RW, Carlton JM,Pain A, Nelson KE, Bowman S, et al. 2002. Genome sequence of the hu-man malaria parasite Plasmodium falciparum. Nature 419: 498–511.
Gonzales JM, Patel JJ, Ponmee N, Jiang L, Tan A, Maher SP, Wuchty S,Rathod PK, FerdigMT. 2008. Regulatory hotspots in themalaria parasitegenome dictate transcriptional variation. PLoS Biol 6: e238.
GymrekM,Willems T, Guilmatre A, Zeng H,Markus B, Georgiev S, DalyMJ,Price AL, Pritchard JK, Sharp AJ, et al. 2015. Abundant contribution ofshort tandem repeats to gene expression variation in humans. NatGenet 48: 22–29.
Haerty W, Golding GB. 2011. Increased polymorphism near low-complex-ity sequences across the genomes of Plasmodium falciparum isolates.Genome Biol Evol 3: 539–550.
Hastings PJ. 1992.Mechanism and control of recombination in fungi.MutatRes 284: 97–110.
Hayton K, Gaur D, Liu A, Takahashi J, Henschen B, Singh S, Lambert L,Furuya T, Bouttenot R, Doll M, et al. 2008. Erythrocyte binding proteinPfRH5 polymorphisms determine species-specific pathways ofPlasmodium falciparum invasion. Cell Host Microbe 4: 40–51.
Heinberg A, Siu E, Stern C, Lawrence EA, Ferdig MT, Deitsch KW, KirkmanLA. 2013. Direct evidence for the adaptive role of copy number variationon antifolate susceptibility in Plasmodium falciparum. Mol Microbiol 88:702–712.
Hilliker AJ, Harauz G, Reaume AG, Gray M, Clark SH, Chovnick A. 1994.Meiotic gene conversion tract length distribution within the rosy locusof Drosophila melanogaster. Genetics 137: 1019–1026.
Iqbal Z, Caccamo M, Turner I, Flicek P, McVean G. 2012. De novo assemblyand genotyping of variants using colored de Bruijn graphs. Nat Genet44: 226–232.
Jeffares DC, Pain A, Berry A, Cox AV, Stalker J, Ingle CE, Thomas A, QuailMA, Siebenthall K, Uhlemann A-C, et al. 2007. Genome variation andevolution of the malaria parasite Plasmodium falciparum. Nat Genet 39:120–125.
Jeffreys AJ, May CA. 2004. Intense and highly localized gene conversion ac-tivity in human meiotic crossover hot spots. Nat Genet 36: 151–156.
Jiang H, Li N, Gopalan V, Zilversmit MM, Varma S, Nagarajan V, Li J, Mu J,Hayton K, Henschen B, et al. 2011. High recombination rates and hot-spots in a Plasmodium falciparum genetic cross. Genome Biol 12: R33.
Kerr PJ, Ranford-Cartwright LC, Walliker D. 1994. Proof of intragenic re-combination in Plasmodium falciparum. Mol Biochem Parasitol 66:241–248.
Kidgell C, Volkman SK, Daily J, Borevitz JO, Plouffe D, Zhou Y, Johnson JR,Le Roch K, Sarr O, Ndir O, et al. 2006. A systematic map of genetic var-iation in Plasmodium falciparum. PLoS Pathog 2: e57.
Kleiber C, Zeileis A. 2008. Applied econometrics with R (Use R!). Springer,New York.
Kondrashov FA. 2012. Gene duplication as a mechanism of genomic adap-tation to a changing environment. Proc Biol Sci 279: 5048–5057.
Kozarewa I, Ning Z, Quail MA, Sanders MJ, Berriman M, Turner DJ. 2009.Amplification-free Illumina sequencing-library preparation facilitatesimproved mapping and assembly of (G+C)-biased genomes. NatMethods 6: 291–295.
Lasonder E, Janse CJ, van Gemert G-J, Mair GR, Vermunt AMW,Douradinha BG, van Noort V, Huynen MA, Luty AJF, Kroeze H, et al.2008. Proteomic profiling of Plasmodium sporozoite maturation identi-fies new proteins essential for parasite development and infectivity.PLoS Pathog 4: e1000195.
Li H, Durbin R. 2009. Fast and accurate short read alignment with Burrows–Wheeler transform. Bioinformatics 25: 1754–1760.
Li Y-C, Korol AB, Fahima T, Beiles A, Nevo E. 2002. Microsatellites: genomicdistribution, putative functions and mutational mechanisms: a review.Mol Ecol 11: 2453–2465.
Lovett ST. 2004. Encoded errors: mutations and rearrangements mediatedby misalignment at repetitive DNA sequences. Mol Microbiol 52:1243–1253.
Mancera E, Bourgon R, Brozzi A, Huber W, Steinmetz LM. 2008. High-reso-lution mapping of meiotic crossovers and non-crossovers in yeast.Nature 454: 479–485.
Manske M, Miotto O, Campino S, Auburn S, Almagro-Garcia J, Maslen G,O’Brien J, Djimde A, Doumbo O, Zongo I, et al. 2012. Analysis ofPlasmodium falciparum diversity in natural infections by deep sequenc-ing. Nature 487: 375–379.
Martinez-Perez E, ColaiácovoMP. 2009. Distribution of meiotic recombina-tion events: talking to your neighbors.Curr Opin Genet Dev 19: 105–112.
Miller DE, Takeo S, Nandanan K, Paulson A, Gogol MM, Noll AC, Perera AG,Walton KN, GillilandWD, Li H, et al. 2012. A whole-chromosome anal-ysis of meiotic recombination in Drosophila melanogaster. G3 (Bethesda)2: 249–260.
Miotto O, Almagro-Garcia J, Manske M, Macinnis B, Campino S, RockettKA, Amaratunga C, Lim P, Suon S, Sreng S, et al. 2013. Multiple popula-tions of artemisinin-resistant Plasmodium falciparum in Cambodia. NatGenet 45: 648–655.
Mira-Martínez S, Rovira-Graells N, Crowley VM, Altenhofen LM, Llinás M,Cortés A. 2013. Epigenetic switches in clag3 genes mediate blasticidin Sresistance in malaria parasites. Cell Microbiol 15: 1913–1923.
Mok S, Liong K-Y, Lim E-H, Huang X, Zhu L, Preiser PR, Bozdech Z. 2014.Structural polymorphism in the promoter of pfmrp2 confersPlasmodium falciparum tolerance to quinoline drugs. Mol Microbiol 91:918–934.
Montgomery SB, Goode DL, Kvikstad E, Albers CA, Zhang ZD, Mu XJ,Ananda G, Howie B, Karczewski KJ, Smith KS, et al. 2013. The origin,evolution, and functional impact of short insertion–deletion variantsidentified in 179 human genomes. Genome Res 23: 749–761.
Mu J, Awadalla P, Duan J, McGee KM, Keebler J, Seydel K, McVeanGA, Su X.2007. Genome-wide variation and identification of vaccine targets inthe Plasmodium falciparum genome. Nat Genet 39: 126–130.
Muralidharan V, Goldberg DE. 2013. Asparagine repeats in Plasmodium fal-ciparum proteins: good for nothing? PLoS Pathog 9: e1003488.
Muzzey D, Schwartz K, Weissman JS, Sherlock G. 2013. Assembly of aphased diploid Candida albicans genome facilitates allele-specific mea-surements and provides a simple model for repeat and indel structure.Genome Biol 14: R97.
Myers S, Bottolo L, Freeman C, McVean G, Donnelly P. 2005. A fine-scalemap of recombination rates and hotspots across the human genome.Science 310: 321–324.
Nair S, Nash D, SudimackD, Jaidee A, BarendsM, Uhlemann A-C, Krishna S,Nosten F, Anderson TJC. 2007. Recurrent gene amplification and softselective sweeps during evolution ofmultidrug resistance inmalaria par-asites. Mol Biol Evol 24: 562–573.
Nair S,Miller B, BarendsM, Jaidee A, Patel J, MayxayM, Newton P, Nosten F,Ferdig MT, Anderson TJC. 2008. Adaptive copy number evolution inmalaria parasites. PLoS Genet 4: e1000243.
Nair S, Nkhoma SC, Serre D, Zimmerman PA, Gorena K, Daniel BJ, Nosten F,Anderson TJC, Cheeseman IH. 2014. Single-cell genomics for dissectionof complex malaria infections. Genome Res 24: 1028–1038.
Neafsey DE, Schaffner SF, Volkman SK, Park D, Montgomery P, Milner DA,Lukens A, Rosen D, Daniels R, Houde N, et al. 2008. Genome-wide SNPgenotyping highlights the role of natural selection in Plasmodium falcip-arum population divergence. Genome Biol 9: R171.
Padhukasahasram B, Rannala B. 2013. Meiotic gene-conversion rate andtract length variation in the human genome. Eur J Hum Genet doi:10.1038/ejhg.2013.30.
R Core Team. 2015. R: a language and environment for statistical computing. RFoundation for Statistical Computing, Vienna, Austria. http://www.R-project.org/.
Ranford-Cartwright LC, Mwangi JM. 2012. Analysis of malaria parasite phe-notypes using experimental genetic crosses of Plasmodium falciparum.Int J Parasitol 42: 529–534.
Miles et al.
1298 Genome Researchwww.genome.org
Cold Spring Harbor Laboratory Press on October 7, 2016 - Published by genome.cshlp.orgDownloaded from
Robasky K, Lewis NE, Church GM. 2014. The role of replicates for error mit-igation in next-generation sequencing. Nat Rev Genet 15: 56–62.
Rosenthal PJ. 2013. The interplay between drug resistance and fitness inma-laria parasites. Mol Microbiol 89: 1025–1038.
Roy SW, Ferreira MU, Hartl DL. 2008. Evolution of allelic dimorphism inmalarial surface antigens. Heredity (Edinb) 100: 103–110.
Samarakoon U, Gonzales JM, Patel JJ, Tan A, Checkley L, Ferdig MT. 2011a.The landscape of inherited and de novo copy number variants in aPlasmodium falciparum genetic cross. BMC Genomics 12: 457.
Samarakoon U, Regier A, Tan A, Desany BA, Collins B, Tan JC, Emrich SJ,Ferdig MT. 2011b. High-throughput 454 resequencing for allele discov-ery and recombination mapping in Plasmodium falciparum. BMCGenomics 12: 116.
Saunders IW, Brohede J, Hannan GN. 2007. Estimating genotyping errorrates from Mendelian errors in SNP array genotypes and their impacton inference. Genomics 90: 291–296.
Sepúlveda N, Campino SG, Assefa SA, Sutherland CJ, Pain A, Clark TG.2013. A Poisson hierarchical modelling approach to detecting copynumber variation in sequence coverage data. BMC Genomics 14: 128.
Su Xz, Wellems TE. 1996. Toward a high-resolution Plasmodium falciparumlinkage map: polymorphic markers from hundreds of simple sequencerepeats. Genomics 33: 430–444.
Su X, Ferdig MT, Huang Y, Huynh CQ, Liu A, You J, Wootton JC, WellemsTE. 1999. A genetic map and recombination parameters of the humanmalaria parasite Plasmodium falciparum. Science 286: 1351–1353.
SuX,Hayton K,Wellems TE. 2007. Genetic linkage and association analysesfor trait mapping in Plasmodium falciparum. Nat Rev Genet 8: 497–506.
Tan JC, Tan A, Checkley L, Honsa CM, Ferdig MT. 2010. Variable numbersof tandem repeats in Plasmodium falciparum genes. J Mol Evol 71:268–278.
Tsai IJ, Burt A, Koufopanou V. 2010. Conservation of recombination hot-spots in yeast. Proc Natl Acad Sci 107: 7847–7852.
Valli A, López-Moya JJ, García JA. 2007. Recombination and gene duplica-tion in the evolutionary diversification of P1 proteins in the familyPotyviridae. J Gen Virol 88: 1016–1028.
Van der Auwera GA, Carneiro MO, Hartl C, Poplin R, Del Angel G, Levy-Moonshine A, Jordan T, Shakir K, Roazen D, Thibault J, et al. 2013. InCurrent protocols in bioinformatics (ed. Bateman A, et al.). Wiley,Hoboken, NJ.
Völker M, Backström N, Skinner BM, Langley EJ, Bunzey SK, Ellegren H,Griffin DK. 2010. Copy number variation, chromosome rearrangement,and their association with recombination during avian evolution.Genome Res 20: 503–511.
Walker-Jonah A, Dolan SA, Gwadz RW, Panton LJ, Wellems TE. 1992. AnRFLP map of the Plasmodium falciparum genome, recombination ratesand favored linkage groups in a genetic cross. Mol Biochem Parasitol51: 313–320.
Walliker D, Quakyi IA, Wellems TE, McCutchan TF, Szarfman A, LondonWT, Corcoran LM, Burkot TR, Carter R. 1987. Genetic analysis of the hu-man malaria parasite Plasmodium falciparum. Science 236: 1661–1666.
Wellems TE, Panton LJ, Gluzman IY, do Rosario VE, Gwadz RW, Walker-Jonah A, Krogstad DJ. 1990. Chloroquine resistance not linked to mdr-like genes in a Plasmodium falciparum cross. Nature 345: 253–255.
Wellems TE, Walker-Jonah A, Panton LJ. 1991. Genetic mapping of thechloroquine-resistance locus on Plasmodium falciparum chromosome7. Proc Natl Acad Sci 88: 3382–3386.
Youds JL, Boulton SJ. 2011. The choice inmeiosis—defining the factors thatinfluence crossover or non-crossover formation. J Cell Sci 124: 501–513.
Zilversmit MM, Volkman SK, DePristo MA, Wirth DF, Awadalla P, Hartl DL.2010. Low-complexity regions in Plasmodium falciparum: missing linksin the evolution of an extreme genome. Mol Biol Evol 27: 2198–2209.
Received December 22, 2015; accepted in revised form June 28, 2016.
Deep sequencing of P. falciparum crosses
Genome Research 1299www.genome.org
Cold Spring Harbor Laboratory Press on October 7, 2016 - Published by genome.cshlp.orgDownloaded from
10.1101/gr.203711.115Access the most recent version at doi:2016 26: 1288-1299 originally published online August 16, 2016Genome Res.
Alistair Miles, Zamin Iqbal, Paul Vauterin, et al.
Plasmodium falciparumdiversity in Indels, structural variation, and recombination drive genomic
Material
Supplemental
http://genome.cshlp.org/content/suppl/2016/08/16/gr.203711.115.DC1.html
References
http://genome.cshlp.org/content/26/9/1288.full.html#ref-list-1
This article cites 76 articles, 20 of which can be accessed free at:
Open Access
Open Access option.Genome ResearchFreely available online through the
License
Commons Creative
.http://creativecommons.org/licenses/by/4.0/
License (Attribution 4.0 International), as described at , is available under a Creative CommonsGenome ResearchThis article, published in
ServiceEmail Alerting
click here.top right corner of the article or
Receive free email alerts when new articles cite this article - sign up in the box at the
http://genome.cshlp.org/subscriptionsgo to: Genome Research To subscribe to
© 2016 Miles et al.; Published by Cold Spring Harbor Laboratory Press
Cold Spring Harbor Laboratory Press on October 7, 2016 - Published by genome.cshlp.orgDownloaded from