Embed Size (px)
Citation preview
National Aeronautics and Space Administration
1
Increment 59/60 Science SymposiumAdvanced Colloids Experiment (Temperature controlled) – ACE-T11PI: Professor Boris Khusid – New Jersey Institute of Technology (NJIT)
Co-PI: Professor Paul M. Chaikin – New York University (NYU)
Co-PI: Professor Andrew D. Hollingsworth - NYU
Presented by:
Dr. William V. Meyer (a.k.a. Bill Meyer)
ACE NASA Project ScientistUSRA at NASA GRC, Tel: (216) 433-5011, Email: [email protected]
ACE NASA Project Manager: Ron Sicker, Tel.: (216) 433-6498
ZIN-Technologies ACE Project Manager: Michael Bohurjak, Tel: (440) 625-2264
ZIN-Technologies Science Lead: John Eustace, Tel: (440) 625-2244
February 12 - 14, 2019
www.nasa.gov
Advanced Colloids Experiment (Temperature controlled) – ACE-T11
OUTLINE OF PRESENTATION
• Science Background and Hypothesis
• Investigation goals and objectives
• Measurement approach
• Importance and reason for ISS
• Expected results and how they will advance the field
• Earth benefits/spin-off applications
2
ISS INCREMENTS 59/60
SCIENCE SYMPOSIUM
3
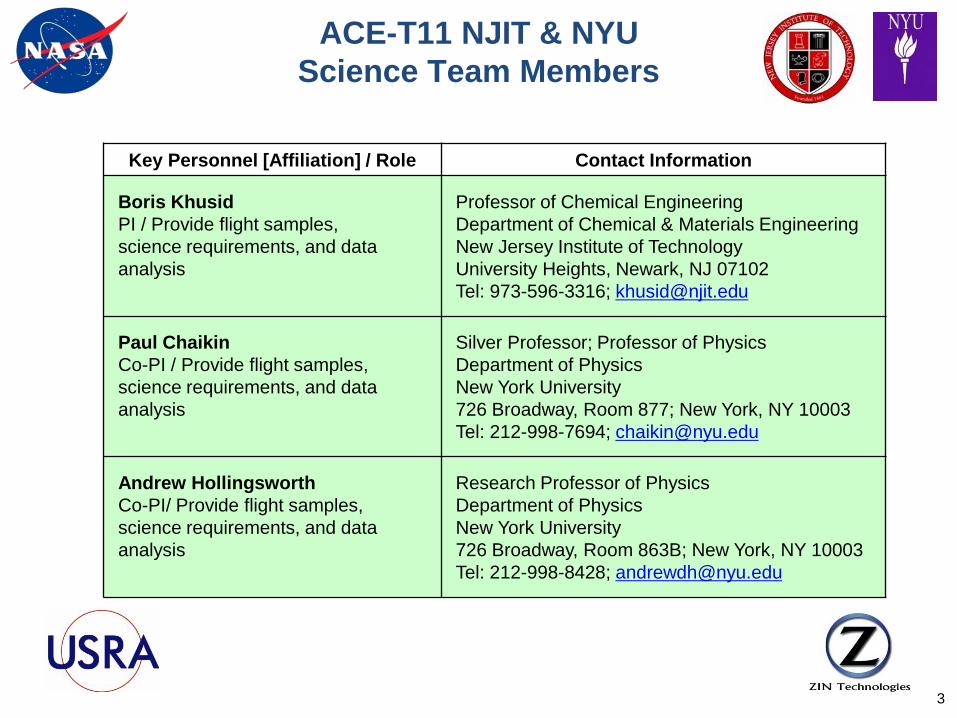
Key Personnel [Affiliation] / Role Contact Information
Boris Khusid
PI / Provide flight samples,
science requirements, and data
analysis
Professor of Chemical Engineering
Department of Chemical & Materials Engineering
New Jersey Institute of Technology
University Heights, Newark, NJ 07102
Tel: 973-596-3316; [email protected]
Paul Chaikin
Co-PI / Provide flight samples,
science requirements, and data
analysis
Silver Professor; Professor of Physics
Department of Physics
New York University
726 Broadway, Room 877; New York, NY 10003
Tel: 212-998-7694; [email protected]
Andrew Hollingsworth
Co-PI/ Provide flight samples,
science requirements, and data
analysis
Research Professor of Physics
Department of Physics
New York University
726 Broadway, Room 863B; New York, NY 10003
Tel: 212-998-8428; [email protected]
ACE-T11 NJIT & NYU
Science Team Members
www.nasa.gov
Advanced Colloids Experiment (Temperature controlled) – ACE-T11
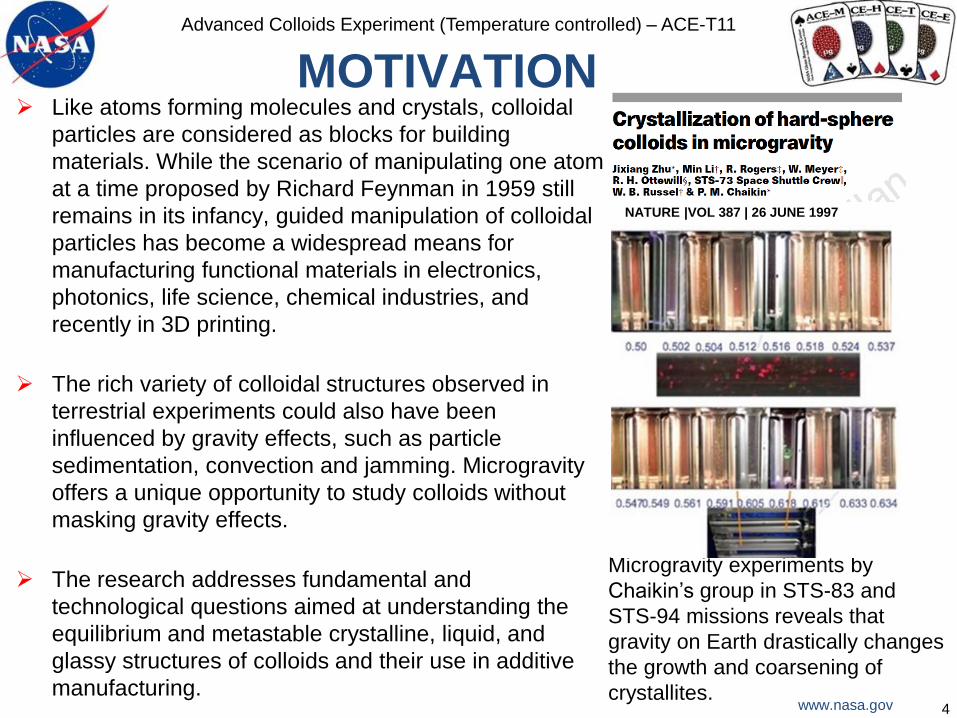
MOTIVATION Like atoms forming molecules and crystals, colloidal
particles are considered as blocks for building
materials. While the scenario of manipulating one atom
at a time proposed by Richard Feynman in 1959 still
remains in its infancy, guided manipulation of colloidal
particles has become a widespread means for
manufacturing functional materials in electronics,
photonics, life science, chemical industries, and
recently in 3D printing.
The rich variety of colloidal structures observed in
terrestrial experiments could also have been
influenced by gravity effects, such as particle
sedimentation, convection and jamming. Microgravity
offers a unique opportunity to study colloids without
masking gravity effects.
The research addresses fundamental and
technological questions aimed at understanding the
equilibrium and metastable crystalline, liquid, and
glassy structures of colloids and their use in additive
manufacturing.4
Microgravity experiments by
Chaikin’s group in STS-83 and
STS-94 missions reveals that
gravity on Earth drastically changes
the growth and coarsening of
crystallites.
NATURE |VOL 387 | 26 JUNE 1997
www.nasa.gov
Advanced Colloids Experiment (Temperature controlled) – ACE-T11
WHY MICROGRAVITY ON ISS?
5
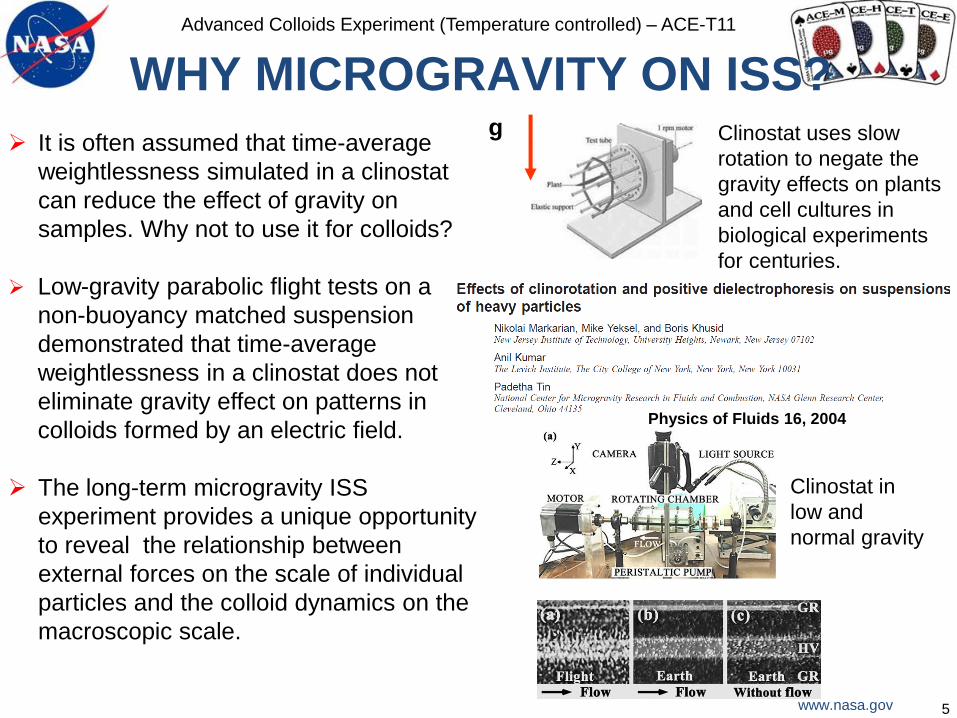
Clinostat uses slow
rotation to negate the
gravity effects on plants
and cell cultures in
biological experiments
for centuries.
It is often assumed that time-average
weightlessness simulated in a clinostat
can reduce the effect of gravity on
samples. Why not to use it for colloids?
Low-gravity parabolic flight tests on a
non-buoyancy matched suspension
demonstrated that time-average
weightlessness in a clinostat does not
eliminate gravity effect on patterns in
colloids formed by an electric field.
The long-term microgravity ISS
experiment provides a unique opportunity
to reveal the relationship between
external forces on the scale of individual
particles and the colloid dynamics on the
macroscopic scale.
g
Clinostat in
low and
normal gravity
Physics of Fluids 16, 2004
www.nasa.gov
Advanced Colloids Experiment (Temperature controlled) – ACE-T11
HYPOTHESIS
A difference between MD simulation predictions for the
crystal growth rate and experiments ~12 orders of magnitude!
The contrast in structures formed in model suspensions under
microgravity in ACE-T11 and normal gravity on Earth will
reveal the salient features of the influence of a temperature
gradient and gravity on non-equilibrium colloidal processes.
Understanding these phenomena is essential for the
development and operation of a wide range of terrestrial and
space applications involving colloids.
6
www.nasa.gov
Advanced Colloids Experiment (Temperature controlled) – ACE-T11
INVESTIGATION GOALS
AND OBJECTIVES
An outstanding problem in condensed matter science concerns
the non-equilibrium crystallization of metastable liquids. The
major challenge is due to kinetic limitations as particles can be
trapped into metastable configurations for a long time due to the
lower mobility of multi-particle structures.
The simplest colloid to study crystallization is naturally comprised
of hard-sphere particles. ACE-T11 experiments will vary
temperature gradients to explore the effect of thermophoresis on
crystallization of hard-sphere colloids.
The goal is to crystallize a hard-sphere metastable colloidal liquid
and study the nucleation and growth of crystals simultaneously in
different regions of the phase diagram of hard-sphere colloids.
7
www.nasa.gov
Advanced Colloids Experiment (Temperature controlled) – ACE-T11
Package updated January 27, 2019
We will be using a flight-hardened Commercial-
Off-The-Shelf (COTS) microscope[pictured on next page]
and an
ACE-T sample module[pictured later]
Measurement approach – 1/15
8
www.nasa.gov
Advanced Colloids Experiment (Temperature controlled) – ACE-T11
Package updated January 27, 2019
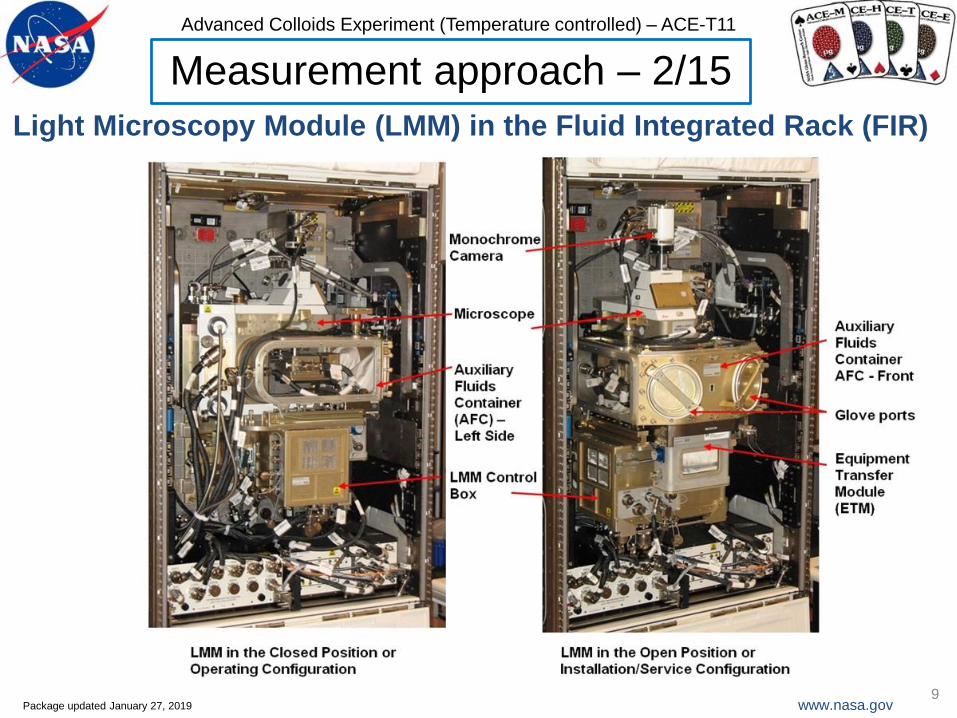
Light Microscopy Module (LMM) in the Fluid Integrated Rack (FIR)
Measurement approach – 2/15
9
www.nasa.gov
Advanced Colloids Experiment (Temperature controlled) – ACE-T11
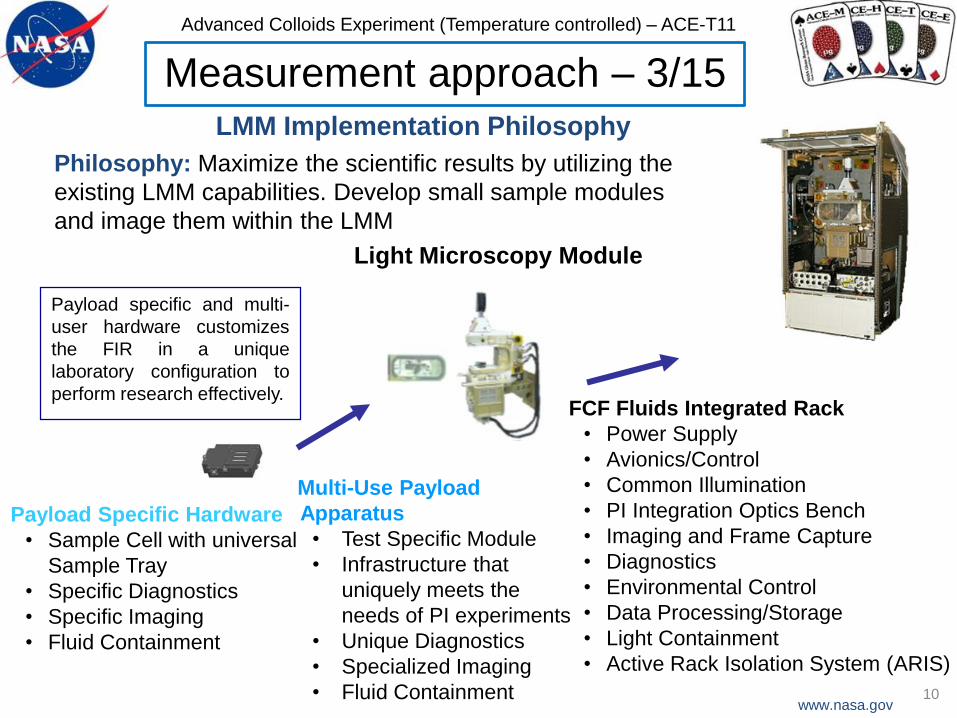
LMM Implementation Philosophy
Payload Specific Hardware
• Sample Cell with universal
Sample Tray
• Specific Diagnostics
• Specific Imaging
• Fluid Containment
Multi-Use Payload
Apparatus
• Test Specific Module
• Infrastructure that
uniquely meets the
needs of PI experiments
• Unique Diagnostics
• Specialized Imaging
• Fluid Containment
FCF Fluids Integrated Rack
• Power Supply
• Avionics/Control
• Common Illumination
• PI Integration Optics Bench
• Imaging and Frame Capture
• Diagnostics
• Environmental Control
• Data Processing/Storage
• Light Containment
• Active Rack Isolation System (ARIS)
Payload specific and multi-
user hardware customizes
the FIR in a unique
laboratory configuration to
perform research effectively.
Light Microscopy Module
Philosophy: Maximize the scientific results by utilizing the
existing LMM capabilities. Develop small sample modules
and image them within the LMM
Measurement approach – 3/15
10
www.nasa.gov
Advanced Colloids Experiment (Temperature controlled) – ACE-T11
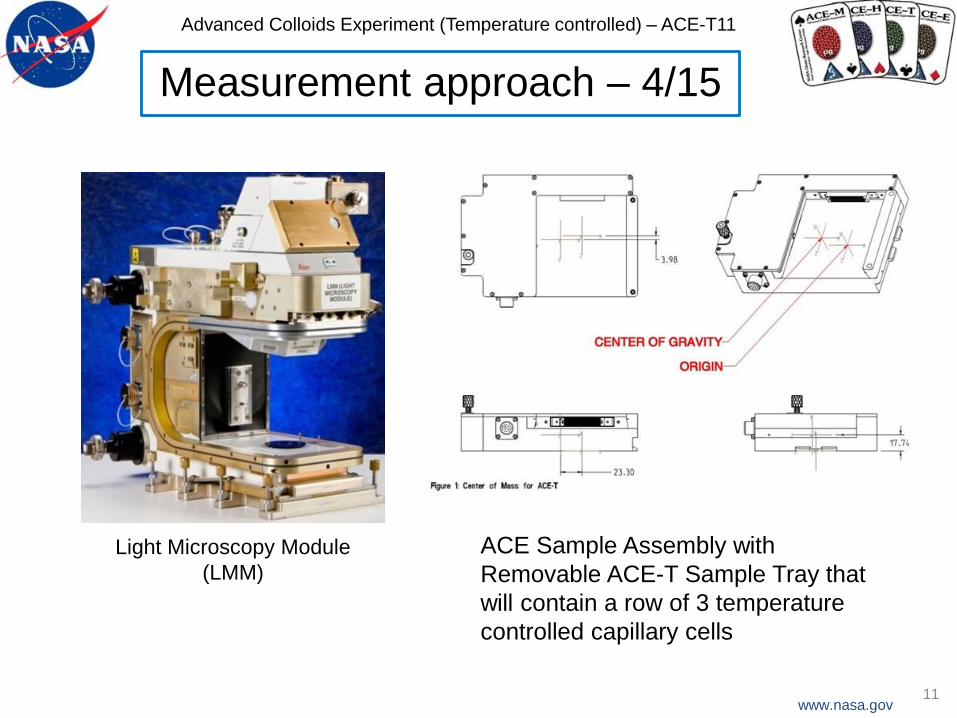
Measurement approach – 4/15
11
Light Microscopy Module
(LMM)
ACE Sample Assembly with
Removable ACE-T Sample Tray that
will contain a row of 3 temperature
controlled capillary cells
www.nasa.gov
Advanced Colloids Experiment (Temperature controlled) – ACE-T11
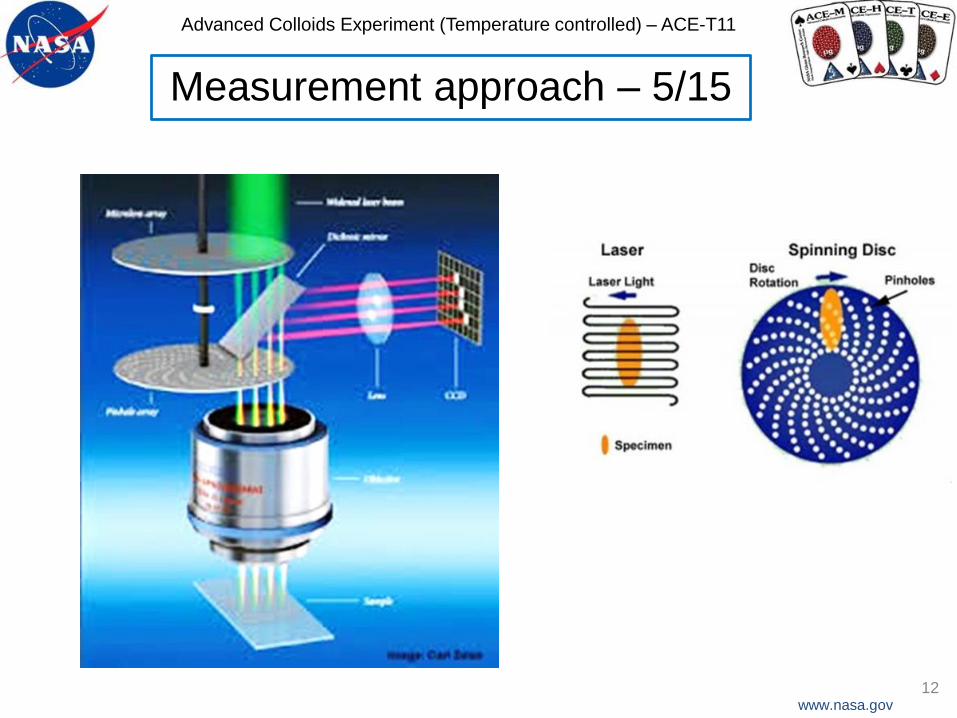
Measurement approach – 5/15
12
www.nasa.gov
Advanced Colloids Experiment (Temperature controlled) – ACE-T11
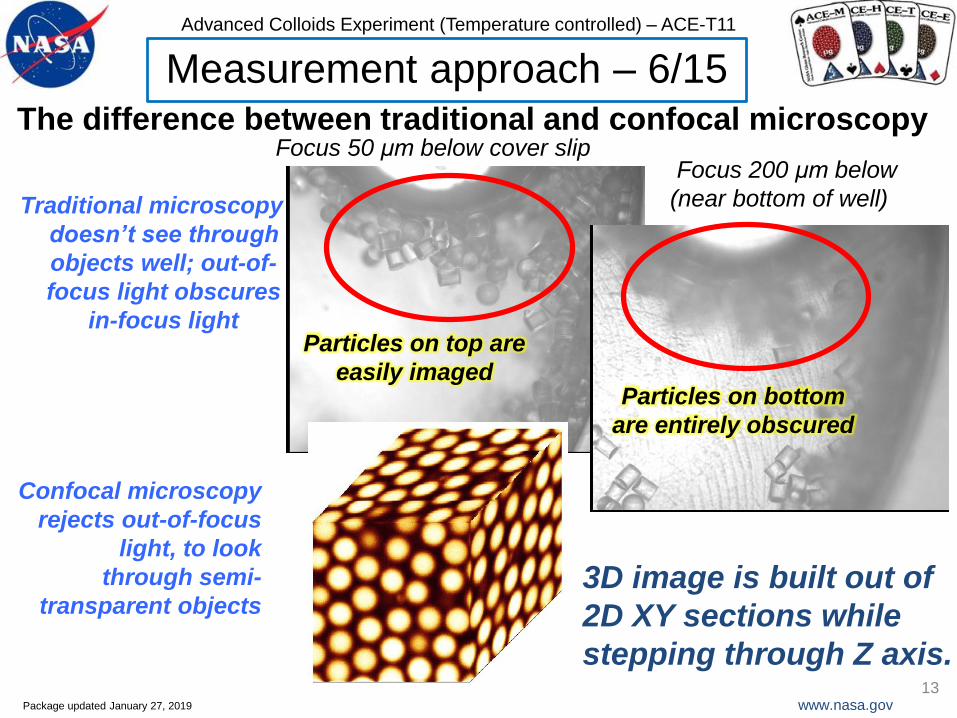
Package updated January 27, 2019
The difference between traditional and confocal microscopyFocus 50 μm below cover slip
Focus 200 μm below
(near bottom of well)
Particles on top are
easily imagedParticles on bottom
are entirely obscured
Traditional microscopy
doesn’t see through
objects well; out-of-
focus light obscures
in-focus light
Confocal microscopy
rejects out-of-focus
light, to look
through semi-
transparent objects3D image is built out of
2D XY sections while
stepping through Z axis.
Measurement approach – 6/15
13
www.nasa.gov
Advanced Colloids Experiment (Temperature controlled) – ACE-T11
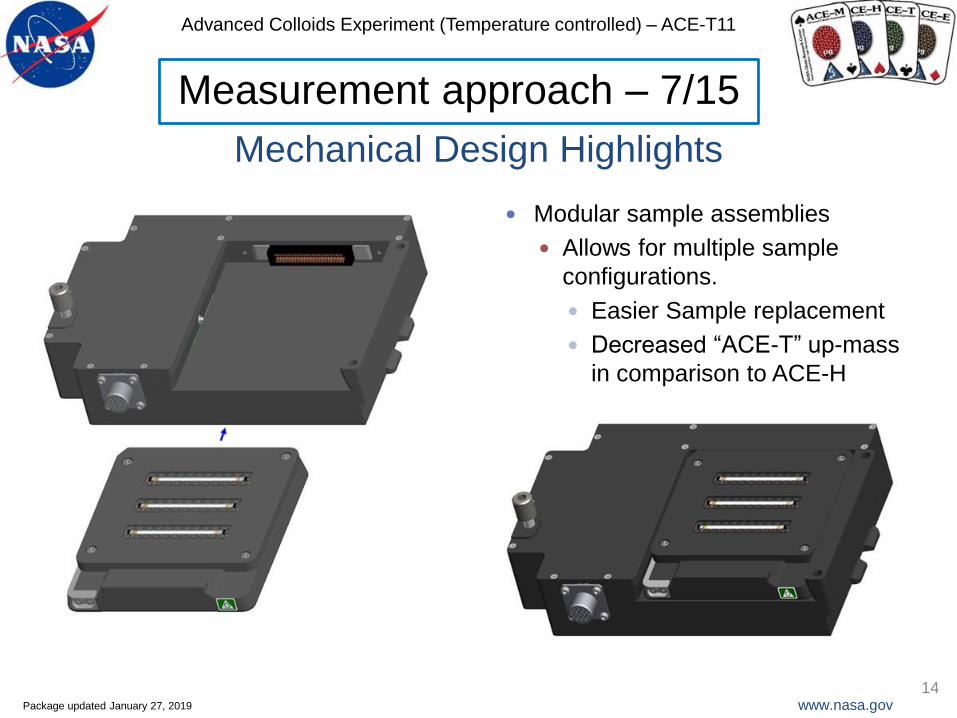
Package updated January 27, 2019
Mechanical Design Highlights
Modular sample assemblies
Allows for multiple sample
configurations.
Easier Sample replacement
Decreased “ACE-T” up-mass
in comparison to ACE-H
Measurement approach – 7/15
14
www.nasa.gov
Advanced Colloids Experiment (Temperature controlled) – ACE-T11
Package updated January 27, 2019
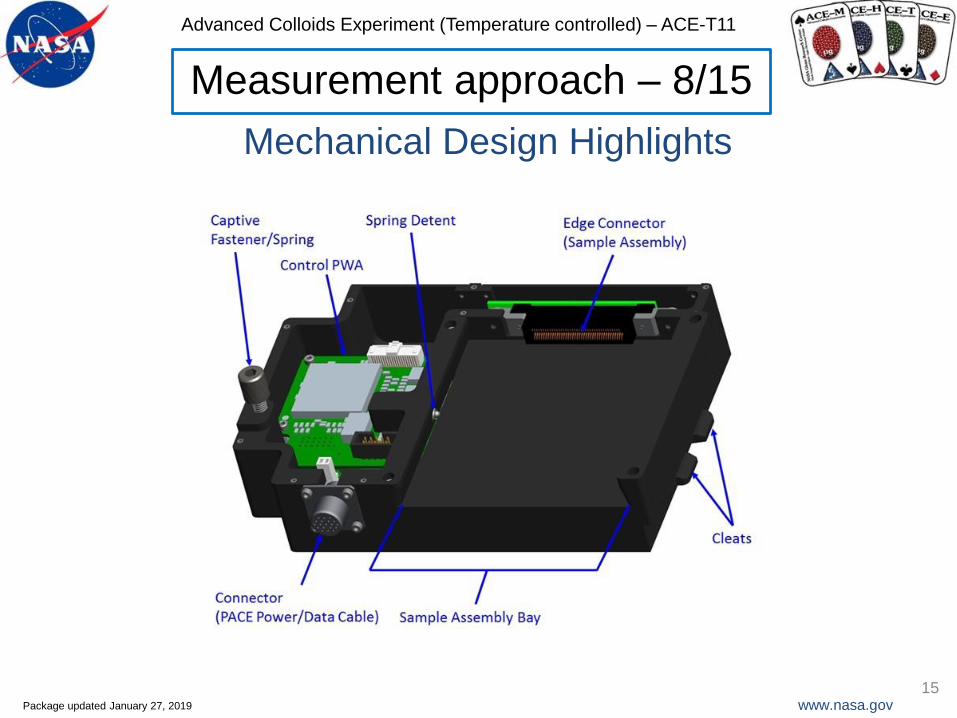
Mechanical Design Highlights
Measurement approach – 8/15
15
www.nasa.gov
Advanced Colloids Experiment (Temperature controlled) – ACE-T11
Package updated January 27, 2019
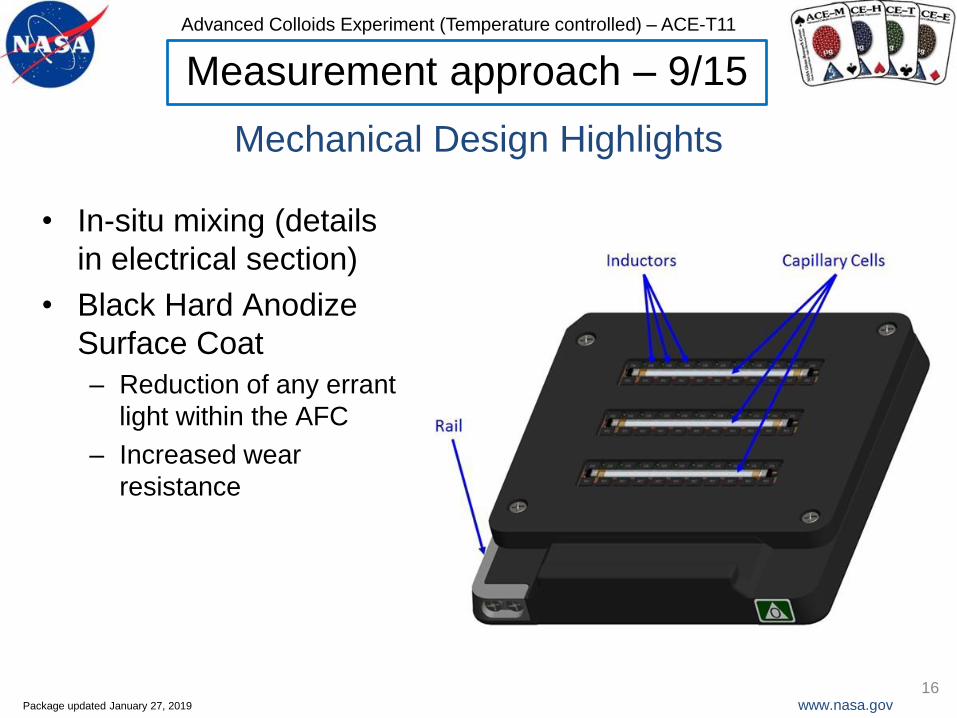
Mechanical Design Highlights
• In-situ mixing (details
in electrical section)
• Black Hard Anodize
Surface Coat
– Reduction of any errant
light within the AFC
– Increased wear
resistance
Measurement approach – 9/15
16
www.nasa.gov
Advanced Colloids Experiment (Temperature controlled) – ACE-T11
Package updated January 27, 2019
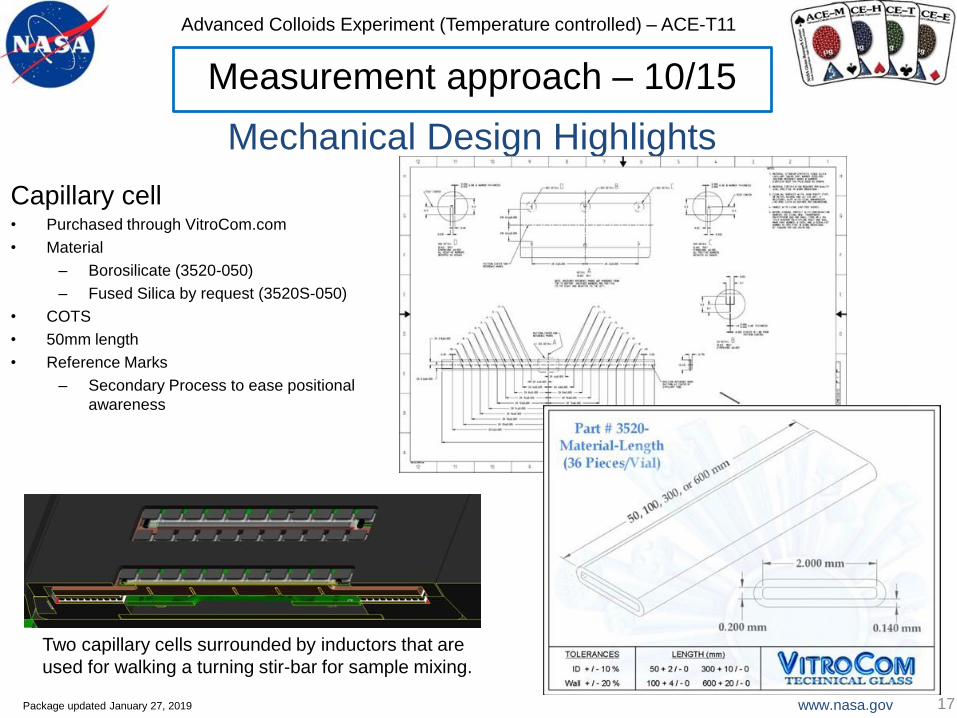
Mechanical Design Highlights
Capillary cell• Purchased through VitroCom.com
• Material
– Borosilicate (3520-050)
– Fused Silica by request (3520S-050)
• COTS
• 50mm length
• Reference Marks
– Secondary Process to ease positional
awareness
Measurement approach – 10/15
Two capillary cells surrounded by inductors that are
used for walking a turning stir-bar for sample mixing.17
17
www.nasa.gov
Advanced Colloids Experiment (Temperature controlled) – ACE-T11
Package updated January 27, 2019
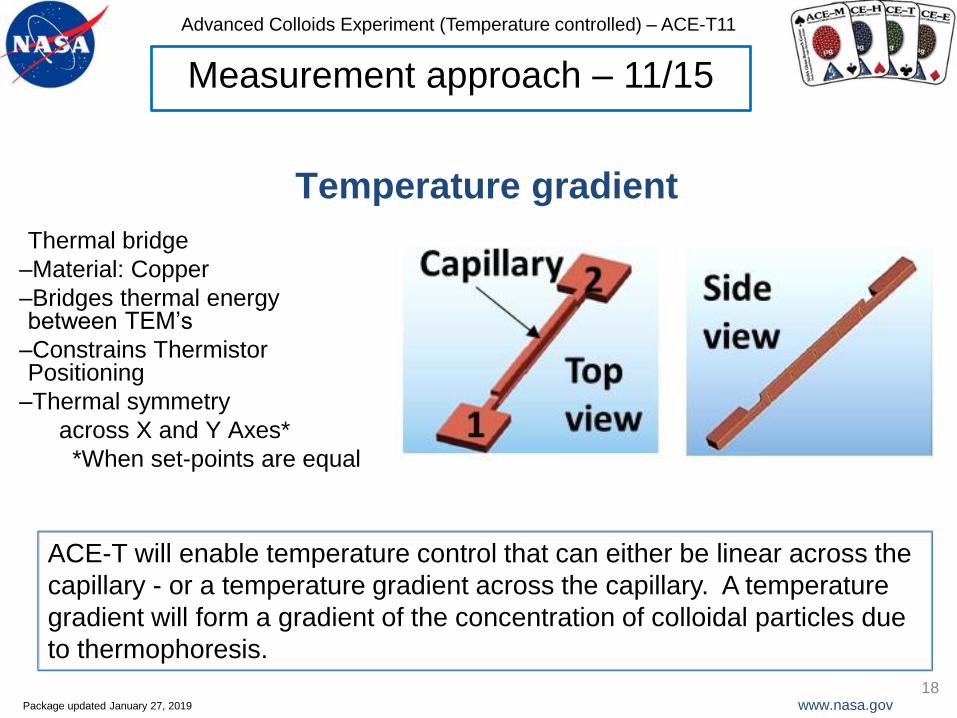
Temperature gradient
Thermal bridge
–Material: Copper
–Bridges thermal energy between TEM’s
–Constrains Thermistor Positioning
–Thermal symmetry
across X and Y Axes*
*When set-points are equal
Measurement approach – 11/15
ACE-T will enable temperature control that can either be linear across the
capillary - or a temperature gradient across the capillary. A temperature
gradient will form a gradient of the concentration of colloidal particles due
to thermophoresis.
18
www.nasa.gov
Advanced Colloids Experiment (Temperature controlled) – ACE-T11
Package updated January 27, 2019
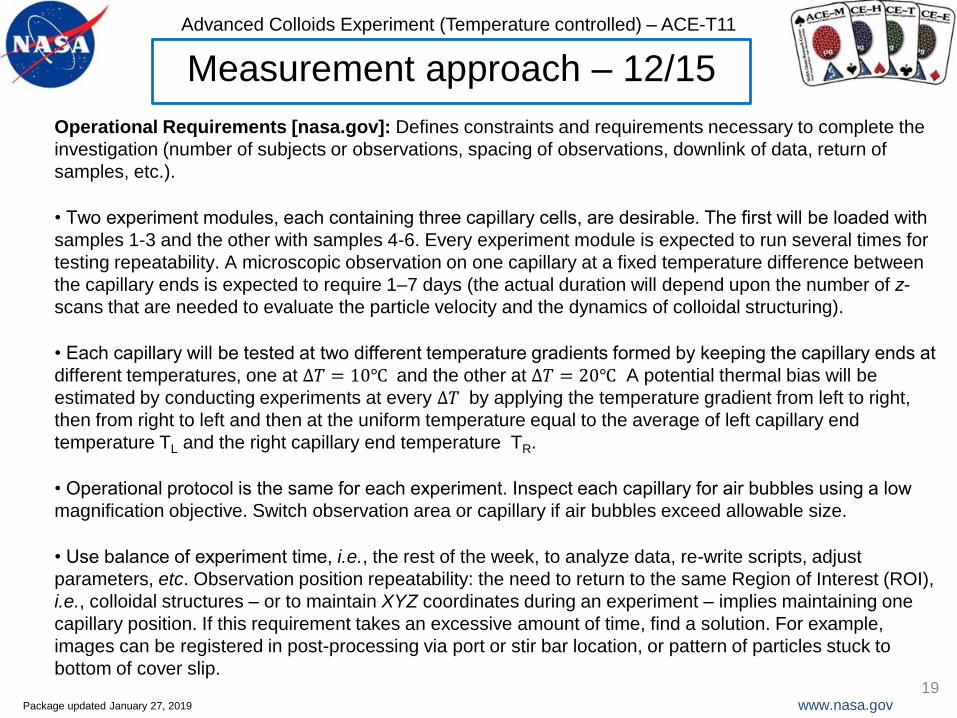
Operational Requirements [nasa.gov]: Defines constraints and requirements necessary to complete the
investigation (number of subjects or observations, spacing of observations, downlink of data, return of
samples, etc.).
• Two experiment modules, each containing three capillary cells, are desirable. The first will be loaded with
samples 1-3 and the other with samples 4-6. Every experiment module is expected to run several times for
testing repeatability. A microscopic observation on one capillary at a fixed temperature difference between
the capillary ends is expected to require 1–7 days (the actual duration will depend upon the number of z-
scans that are needed to evaluate the particle velocity and the dynamics of colloidal structuring).
• Each capillary will be tested at two different temperature gradients formed by keeping the capillary ends at
different temperatures, one at ∆𝑇 = 10℃ and the other at ∆𝑇 = 20℃ A potential thermal bias will be
estimated by conducting experiments at every ∆𝑇 by applying the temperature gradient from left to right,
then from right to left and then at the uniform temperature equal to the average of left capillary end
temperature TL and the right capillary end temperature TR.
• Operational protocol is the same for each experiment. Inspect each capillary for air bubbles using a low
magnification objective. Switch observation area or capillary if air bubbles exceed allowable size.
• Use balance of experiment time, i.e., the rest of the week, to analyze data, re-write scripts, adjust
parameters, etc. Observation position repeatability: the need to return to the same Region of Interest (ROI),
i.e., colloidal structures – or to maintain XYZ coordinates during an experiment – implies maintaining one
capillary position. If this requirement takes an excessive amount of time, find a solution. For example,
images can be registered in post-processing via port or stir bar location, or pattern of particles stuck to
bottom of cover slip.
Measurement approach – 12/15
19
www.nasa.gov
Advanced Colloids Experiment (Temperature controlled) – ACE-T11
Package updated January 27, 2019
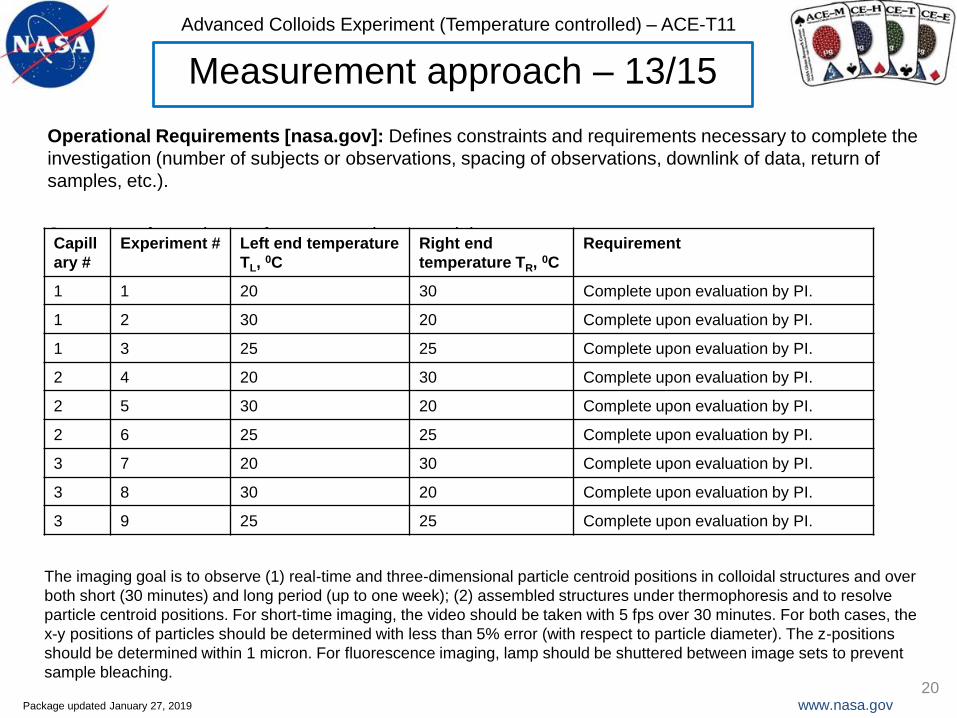
Operational Requirements [nasa.gov]: Defines constraints and requirements necessary to complete the
investigation (number of subjects or observations, spacing of observations, downlink of data, return of
samples, etc.).
Sequence of experiments for one experiment module at : ∆𝑇 = 10℃
Measurement approach – 13/15
20
Capill
ary #
Experiment # Left end temperature
TL, 0C
Right end
temperature TR, 0C
Requirement
1 1 20 30 Complete upon evaluation by PI.
1 2 30 20 Complete upon evaluation by PI.
1 3 25 25 Complete upon evaluation by PI.
2 4 20 30 Complete upon evaluation by PI.
2 5 30 20 Complete upon evaluation by PI.
2 6 25 25 Complete upon evaluation by PI.
3 7 20 30 Complete upon evaluation by PI.
3 8 30 20 Complete upon evaluation by PI.
3 9 25 25 Complete upon evaluation by PI.
The imaging goal is to observe (1) real-time and three-dimensional particle centroid positions in colloidal structures and over
both short (30 minutes) and long period (up to one week); (2) assembled structures under thermophoresis and to resolve
particle centroid positions. For short-time imaging, the video should be taken with 5 fps over 30 minutes. For both cases, the
x-y positions of particles should be determined with less than 5% error (with respect to particle diameter). The z-positions
should be determined within 1 micron. For fluorescence imaging, lamp should be shuttered between image sets to prevent
sample bleaching.
www.nasa.gov
Advanced Colloids Experiment (Temperature controlled) – ACE-T11
Package updated January 27, 2019
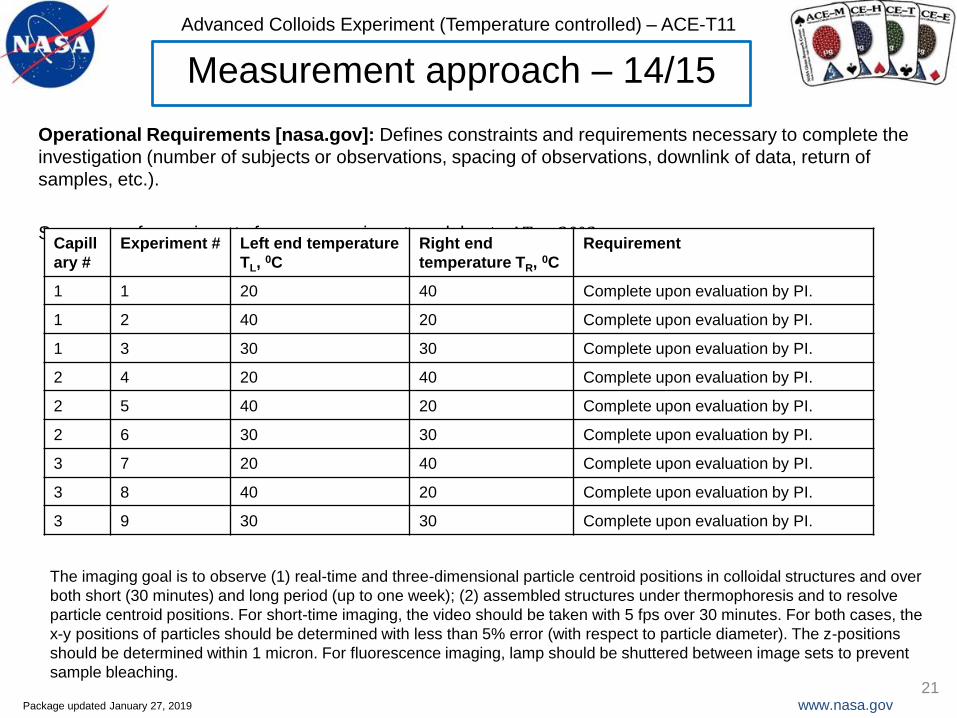
Operational Requirements [nasa.gov]: Defines constraints and requirements necessary to complete the
investigation (number of subjects or observations, spacing of observations, downlink of data, return of
samples, etc.).
Sequence of experiments for one experiment module at : ∆𝑇 = 20℃
Measurement approach – 14/15
21
Capill
ary #
Experiment # Left end temperature
TL, 0C
Right end
temperature TR, 0C
Requirement
1 1 20 40 Complete upon evaluation by PI.
1 2 40 20 Complete upon evaluation by PI.
1 3 30 30 Complete upon evaluation by PI.
2 4 20 40 Complete upon evaluation by PI.
2 5 40 20 Complete upon evaluation by PI.
2 6 30 30 Complete upon evaluation by PI.
3 7 20 40 Complete upon evaluation by PI.
3 8 40 20 Complete upon evaluation by PI.
3 9 30 30 Complete upon evaluation by PI.
The imaging goal is to observe (1) real-time and three-dimensional particle centroid positions in colloidal structures and over
both short (30 minutes) and long period (up to one week); (2) assembled structures under thermophoresis and to resolve
particle centroid positions. For short-time imaging, the video should be taken with 5 fps over 30 minutes. For both cases, the
x-y positions of particles should be determined with less than 5% error (with respect to particle diameter). The z-positions
should be determined within 1 micron. For fluorescence imaging, lamp should be shuttered between image sets to prevent
sample bleaching.
www.nasa.gov
Advanced Colloids Experiment (Temperature controlled) – ACE-T11
Package updated January 27, 2019
Operational Protocols [nasa.gov]: Descriptive overview of the investigation on orbit procedures.
General experiment steps on each capillary for imaging of colloidal structuring at a specified temperature difference between
the capillary left end TL and right TR end:
1. Inspect the samples.
2. Mix the sample in sample module using the in-situ mixer for 1 minute(s).
3. Define XY offsets.
4. Experiment on one capillary using the 100x oil (or 63x air) objective. The use of high numeric aperture (oil immersion)
lenses requires the control of the objective temperature because the immersion oil will be thermally coupled with the cell
capillary and affect its temperature. Therefore, 63x air objective is preferable.
5. Adjust camera parameters using 2.5x objective and bright field.
6. Survey capillary(s) at 2.5x, scanning in the X direction over a range of at least 10 millimeters. Determine bubble
locations and possible primary (and secondary) Regions of Interest (ROI). If the 2.5x objective is difficult to switch in and
out with the 63x air or 100x oil objective, then find ROI capillary cells before using 63x air or 100x oil objective. Select
primary locations away from stir bar or bubble. There will be about (9) 800 x 800 micron areas within the capillary strip.
The number of areas may increase once usage of the flight capillary cell design is available to test.
7. Set the specified temperature TL (ramp rate 10C/min) for left end of the capillary and TR for the right end. Using 63x air
objective or 100x oil objective, observe the motion of particles in the field of view.
8. Focus on the inner surface of the bottom glass capillary, it is closest to the objective.
9. Take one image at each of the z-depth and scan over the thickness of the glass capillary (e.g., twenty z-depths over
100 microns). The z-scanning rate should be set as fast as possible, potentially 5 -10 frames per second. No pixel
binning, 8 bits per pixel (highest supported), full frame images. The number (e.g., 20 here) of z-depths depends on the
lengths of colloidal structures and the thickness of glass capillary.
10. Repeat the z-scan of the same colloidal structure over 30 minutes.
11. Find another colloidal structure by moving the stage in x-y direction.
12. Repeat steps 8-11.
13. To obtain statistically meaningful data, at least ten colloidal structures in one capillary should be imaged. This calculates
to at least ~400 minutes for one capillary.
14. Complete upon evaluation by PI.
Measurement approach – 15/15
22
www.nasa.gov
Advanced Colloids Experiment (Temperature controlled) – ACE-T11
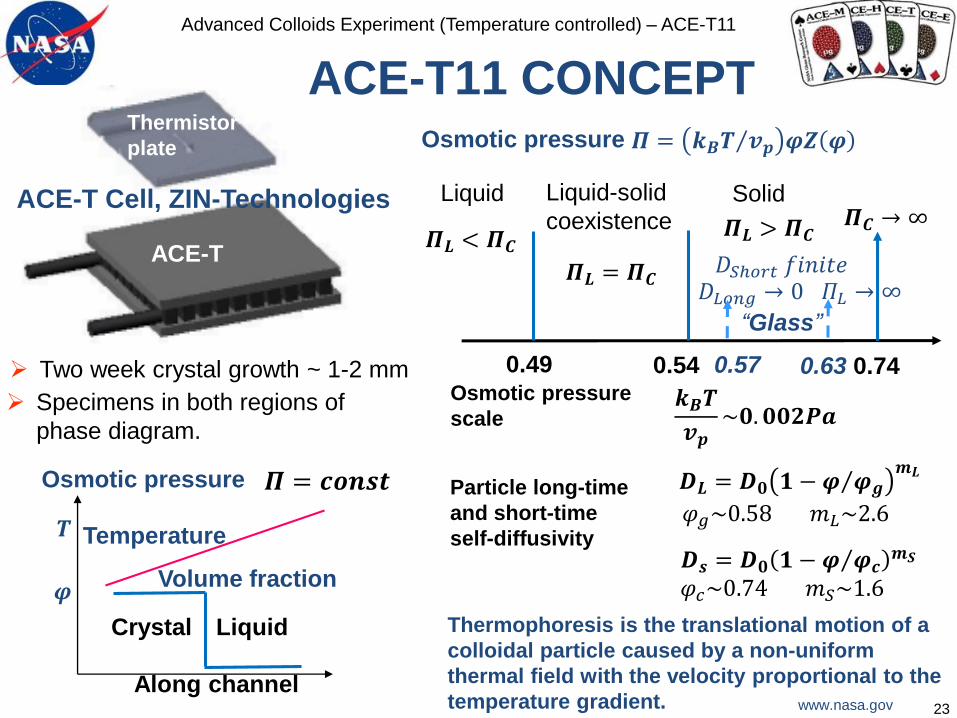
23
Thermistor
plate
ACE-T
ACE-T Cell, ZIN-Technologies
Two week crystal growth ~ 1-2 mmOsmotic pressure
scale𝒌𝑩𝑻
𝒗𝒑~𝟎. 𝟎𝟎𝟐𝑷𝒂
Liquid Liquid-solid
coexistence
“Glass”
0.49 0.54 0.740.630.57
𝜫 = Τ𝒌𝑩𝑻 𝒗𝒑 𝝋𝒁 𝝋
𝜫𝑳 = 𝜫𝑪𝛱𝐿 → ∞
𝜫𝑪 → ∞
𝐷𝐿𝑜𝑛𝑔 → 0
Solid
Osmotic pressure
𝐷𝑆ℎ𝑜𝑟𝑡 𝑓𝑖𝑛𝑖𝑡𝑒𝜫𝑳 < 𝜫𝑪
𝜫𝑳 > 𝜫𝑪
Specimens in both regions of
phase diagram.
LiquidCrystal
Volume fraction𝝋
Along channel
𝑻 Temperature
𝜫 = 𝒄𝒐𝒏𝒔𝒕Osmotic pressure
ACE-T11 CONCEPT
Thermophoresis is the translational motion of a
colloidal particle caused by a non-uniform
thermal field with the velocity proportional to the
temperature gradient.
Particle long-time
and short-time
self-diffusivity
𝑫𝑳 = 𝑫𝟎 𝟏 − Τ𝝋 𝝋𝒈𝒎𝑳
𝑫𝒔 = 𝑫𝟎 𝟏 − Τ𝝋 𝝋𝒄𝒎𝑺
𝜑𝑐~0.74 𝑚𝑆~1.6
𝜑𝑔~0.58 𝑚𝐿~2.6
www.nasa.gov
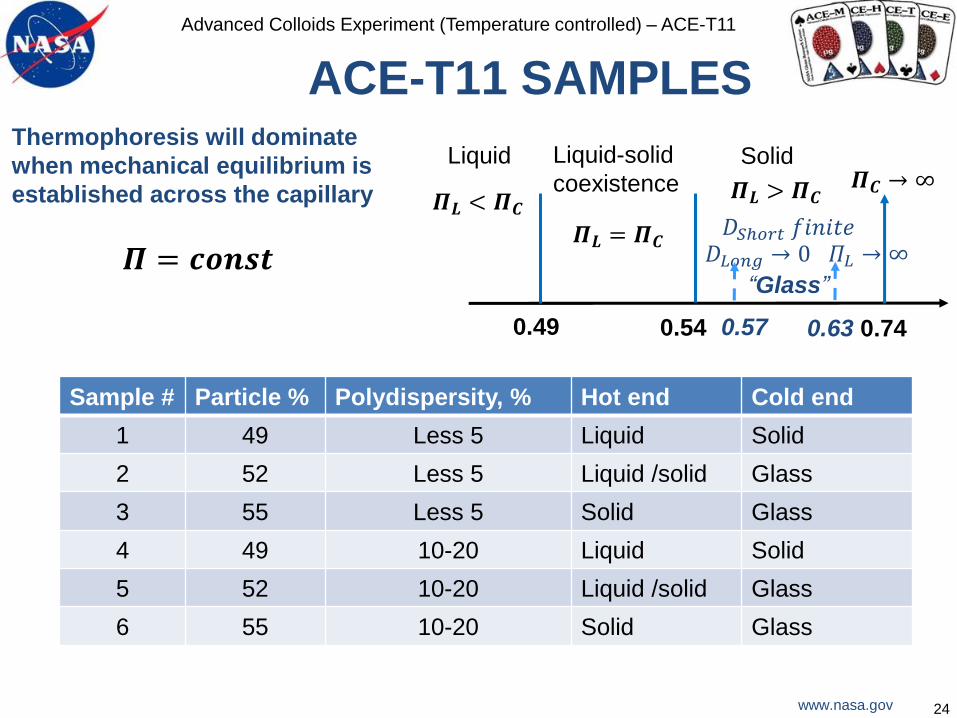
Advanced Colloids Experiment (Temperature controlled) – ACE-T11
Liquid Liquid-solid
coexistence
“Glass”
0.49 0.54 0.740.630.57
𝜫𝑳 = 𝜫𝑪𝛱𝐿 → ∞
𝜫𝑪 → ∞
𝐷𝐿𝑜𝑛𝑔 → 0
Solid
𝐷𝑆ℎ𝑜𝑟𝑡 𝑓𝑖𝑛𝑖𝑡𝑒𝜫𝑳 < 𝜫𝑪
𝜫𝑳 > 𝜫𝑪
𝜫 = 𝒄𝒐𝒏𝒔𝒕
Thermophoresis will dominate
when mechanical equilibrium is
established across the capillary
ACE-T11 SAMPLES
24
Sample # Particle % Polydispersity, % Hot end Cold end
1 49 Less 5 Liquid Solid
2 52 Less 5 Liquid /solid Glass
3 55 Less 5 Solid Glass
4 49 10-20 Liquid Solid
5 52 10-20 Liquid /solid Glass
6 55 10-20 Solid Glass
www.nasa.gov
Advanced Colloids Experiment (Temperature controlled) – ACE-T11
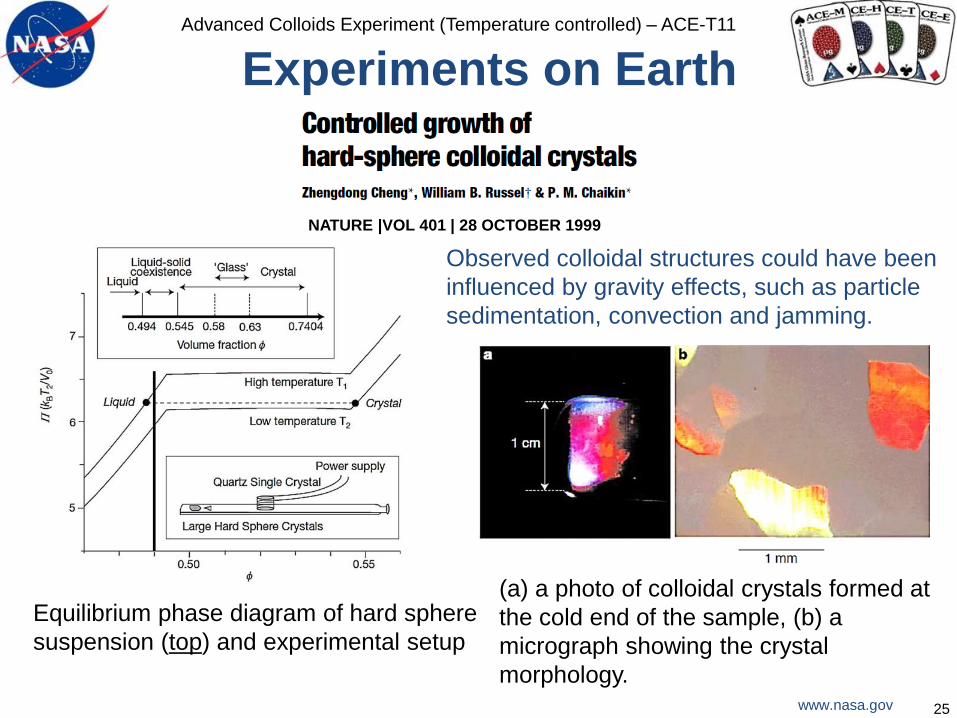
25
Equilibrium phase diagram of hard sphere
suspension (top) and experimental setup
(a) a photo of colloidal crystals formed at
the cold end of the sample, (b) a
micrograph showing the crystal
morphology.
NATURE |VOL 401 | 28 OCTOBER 1999
Experiments on Earth
Observed colloidal structures could have been
influenced by gravity effects, such as particle
sedimentation, convection and jamming.
www.nasa.gov
Advanced Colloids Experiment (Temperature controlled) – ACE-T11
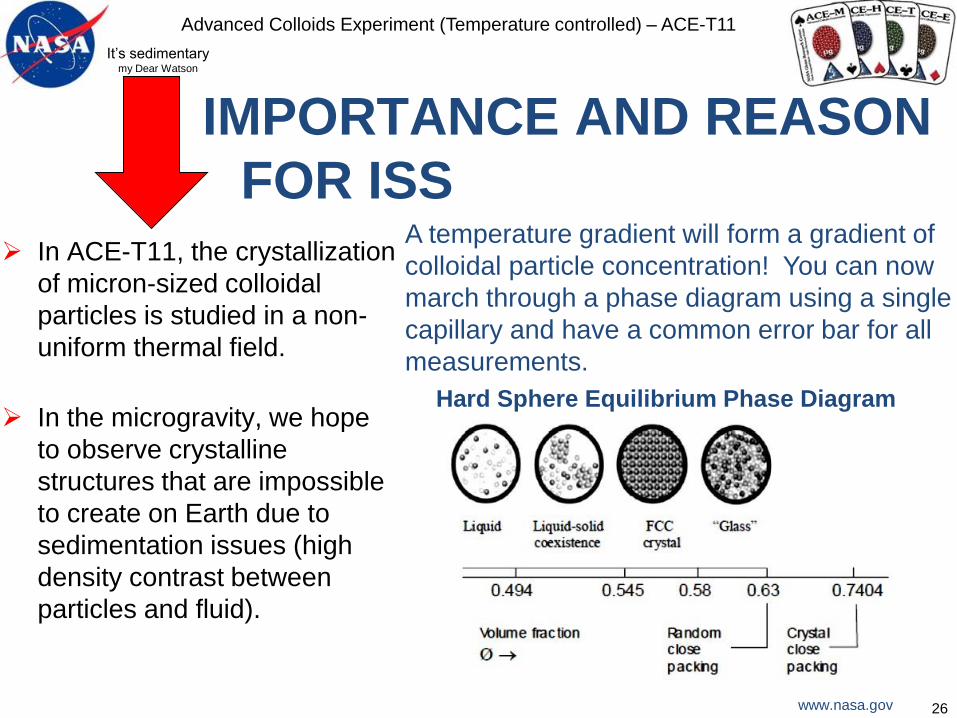
IMPORTANCE AND REASON
FOR ISS……………………. In ACE-T11, the crystallization
of micron-sized colloidal
particles is studied in a non-
uniform thermal field.
In the microgravity, we hope
to observe crystalline
structures that are impossible
to create on Earth due to
sedimentation issues (high
density contrast between
particles and fluid).
It’s sedimentarymy Dear Watson
Hard Sphere Equilibrium Phase Diagram
A temperature gradient will form a gradient of
colloidal particle concentration! You can now
march through a phase diagram using a single
capillary and have a common error bar for all
measurements.
26
www.nasa.gov
Advanced Colloids Experiment (Temperature controlled) – ACE-T11
EXPECTED RESULTS AND HOW
THEY WILL ADVANCE THE FIELD
Due to masking gravity effects, numerous
terrestrial studies conducted so far have not
clarified subtle interplay of macroscopic and
microscopic processes in colloids at particle
level.
Based on our previous findings, we expect
that the contrast in guided assembly of
colloidal structures in microgravity and on
Earth should reveal the coupling between
the gradient driven macroscopic transport of
particles to predetermined locations and the
microstructure they form there.
Understanding the underlying mechanisms
will open pathways for engineering novel
functional materials across a broad range of
terrestrial and space applications. 27
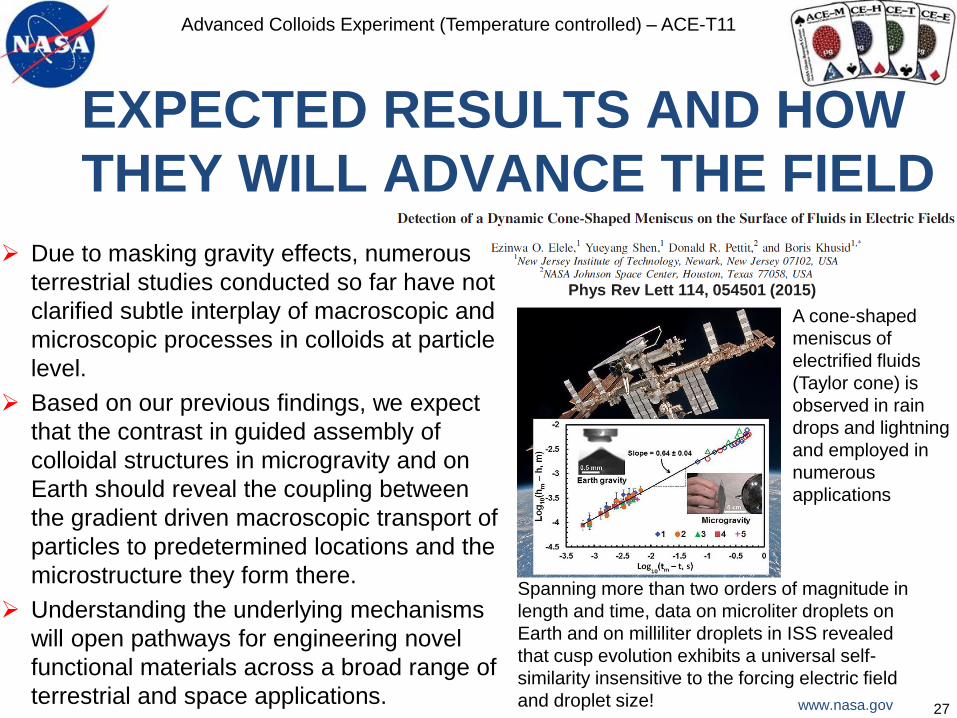
Phys Rev Lett 114, 054501 (2015)
Spanning more than two orders of magnitude in
length and time, data on microliter droplets on
Earth and on milliliter droplets in ISS revealed
that cusp evolution exhibits a universal self-
similarity insensitive to the forcing electric field
and droplet size!
A cone-shaped
meniscus of
electrified fluids
(Taylor cone) is
observed in rain
drops and lightning
and employed in
numerous
applications
www.nasa.gov
Advanced Colloids Experiment (Temperature controlled) – ACE-T11
A contrast between microgravity and terrestrial experiments
provides unique advantages to reveal hidden features of multiphase
systems since their behavior is inevitably influenced by gravity
effects:
Fundamental studies of Order, Frustration:
The role of macroscopic and microscopic forces in
structure formation.
Technologies for complex processes including 3D printing:
Pathway for fabrication of multiphase micro-structured
heterogeneous items from polymers, metals and ceramics.
28
www.nasa.gov
Advanced Colloids Experiment (Temperature controlled) – ACE-T11
EARTH BENEFITS / SPIN-OFF
APPLICATIONS
The proposed research will scrutinize the colloid behavior for inquiring
about the nature of metastable structures formed by external field
gradients in the absence of gravity at a particle level.
Although the time and equipment available for microgravity tests is
limited, research outcomes have a potential to develop foundations for
guided assembly of colloidal structures with hierarchical organization
from the nanometer and micrometer length scales to macroscopic
dimensions for diverse applications in science and technology, ranging
from optics and photonics to bioscience and biotechnologies and to
electromagnetic and acoustic metamaterials. 29
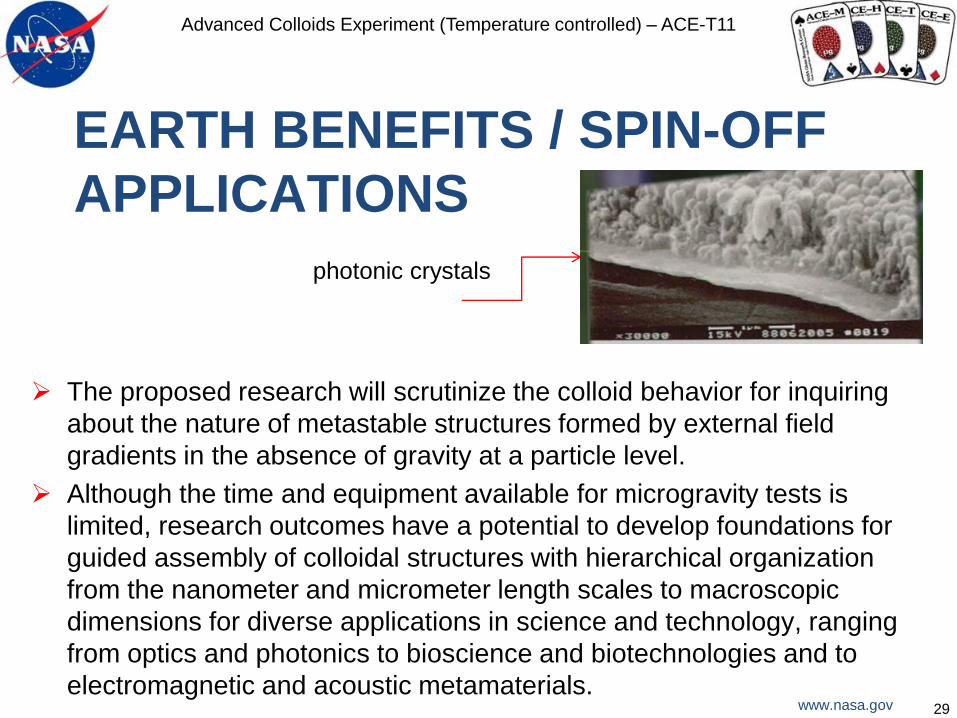
photonic crystals
30
ACE-T11
Increment 59/60 Science Symposium
BACKUP SLIDES
www.nasa.gov
Advanced Colloids Experiment (Temperature controlled) – ACE-T11
Package updated January 27, 2019
ACE-T11 PI Flight Endorsement Letter
31

www.nasa.gov
Advanced Colloids Experiment (Temperature controlled) – ACE-T11
Package updated January 27, 2019
Capillary # Capillary Cell Contents
NJIT & NYU ACE-T11
Flight Sample #1
(P/N: T11_Flt_Sample1)
Samples 1/6
From C.O.C. date June 19, 2017
Suspending media: composition
, wt %
particle
polydispersity,
wt%
comments
C/T decahydronaphthaline 20.70 refractive index
matching
1,2,3,4-tetrahydronaphthaline 25.30
Particles:
colloid: poly(methyl methacrylate-co-
methacrylic acid) (PMMA) spheres
49.0 𝑙𝑒𝑠𝑠 5 1 to 2 microns
fluorophore (rhodamine B, or
julolidine rhodol, or Cy3)
< 0.01 fluorophore
chemically attached
to PMMA
poly(12-hydroxystearic acid)-g-
poly(methylmethacrylate) (PHS-g-
PMMA) surfactant
< 0.1 chemically attached
to particle surface
depletant: silica nanoparticles 5.0 100 nm diameter
trimethoxysilyl-terminated PHS-g-
PMMA surfactant
< 0.1 chemically attached
to particles
TOTAL 100.0

www.nasa.gov
Advanced Colloids Experiment (Temperature controlled) – ACE-T11
Package updated January 27, 2019
Capillary # Capillary Cell Contents
NJIT & NYU ACE-T11
Flight Sample #2
(P/N: T11_Flt_Sample2)
Samples 2/6
From C.O.C. date June 19, 2017
Suspending media: composition
, wt %
particle
polydispersity,
wt%
comments
C/T decahydronaphthaline 19.35 refractive index
matching
1,2,3,4-tetrahydronaphthaline 23.65
Particles:
colloid: poly(methyl methacrylate-co-
methacrylic acid) (PMMA) spheres
52.0 𝑙𝑒𝑠𝑠 5 1 to 2 microns
fluorophore (rhodamine B, or
julolidine rhodol, or Cy3)
< 0.01 fluorophore
chemically attached
to PMMA
poly(12-hydroxystearic acid)-g-
poly(methylmethacrylate) (PHS-g-
PMMA) surfactant
< 0.1 chemically attached
to particle surface
depletant: silica nanoparticles 5.0 100 nm diameter
trimethoxysilyl-terminated PHS-g-
PMMA surfactant
< 0.1 chemically attached
to particles
TOTAL 100.0

www.nasa.gov
Advanced Colloids Experiment (Temperature controlled) – ACE-T11
Package updated January 27, 2019
Capillary # Capillary Cell Contents
NJIT & NYU ACE-T11
Flight Sample #3
(P/N: T11_Flt_Sample3)
Samples 3/6
From C.O.C. date June 19, 2017
Suspending media: composition
, wt %
particle
polydispersity,
wt%
comments
C/T decahydronaphthaline 18.00 refractive index
matching
1,2,3,4-tetrahydronaphthaline 22.00
Particles:
colloid: poly(methyl methacrylate-co-
methacrylic acid) (PMMA) spheres
55.0 𝑙𝑒𝑠𝑠 5 1 to 2 microns
fluorophore (rhodamine B, or
julolidine rhodol, or Cy3)
< 0.01 fluorophore
chemically attached
to PMMA
poly(12-hydroxystearic acid)-g-
poly(methylmethacrylate) (PHS-g-
PMMA) surfactant
< 0.1 chemically attached
to particle surface
depletant: silica nanoparticles 5.0 100 nm diameter
trimethoxysilyl-terminated PHS-g-
PMMA surfactant
< 0.1 chemically attached
to particles
TOTAL 100.0
www.nasa.gov
Advanced Colloids Experiment (Temperature controlled) – ACE-T11
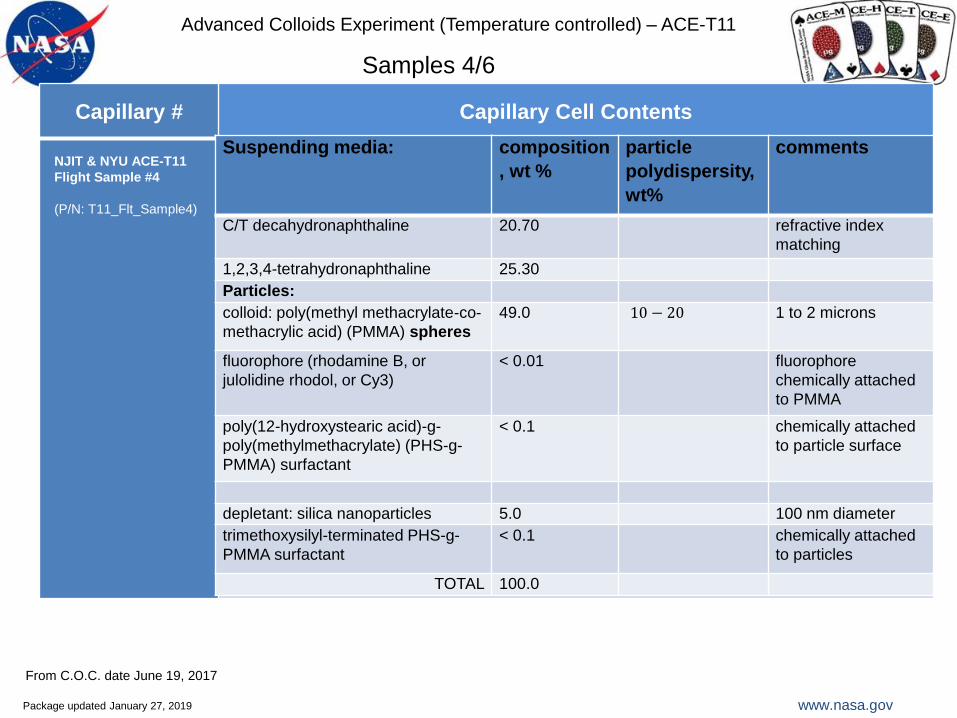
Package updated January 27, 2019
Capillary # Capillary Cell Contents
NJIT & NYU ACE-T11
Flight Sample #4
(P/N: T11_Flt_Sample4)
Samples 4/6
From C.O.C. date June 19, 2017
Suspending media: composition
, wt %
particle
polydispersity,
wt%
comments
C/T decahydronaphthaline 20.70 refractive index
matching
1,2,3,4-tetrahydronaphthaline 25.30
Particles:
colloid: poly(methyl methacrylate-co-
methacrylic acid) (PMMA) spheres
49.0 10 − 20 1 to 2 microns
fluorophore (rhodamine B, or
julolidine rhodol, or Cy3)
< 0.01 fluorophore
chemically attached
to PMMA
poly(12-hydroxystearic acid)-g-
poly(methylmethacrylate) (PHS-g-
PMMA) surfactant
< 0.1 chemically attached
to particle surface
depletant: silica nanoparticles 5.0 100 nm diameter
trimethoxysilyl-terminated PHS-g-
PMMA surfactant
< 0.1 chemically attached
to particles
TOTAL 100.0
www.nasa.gov
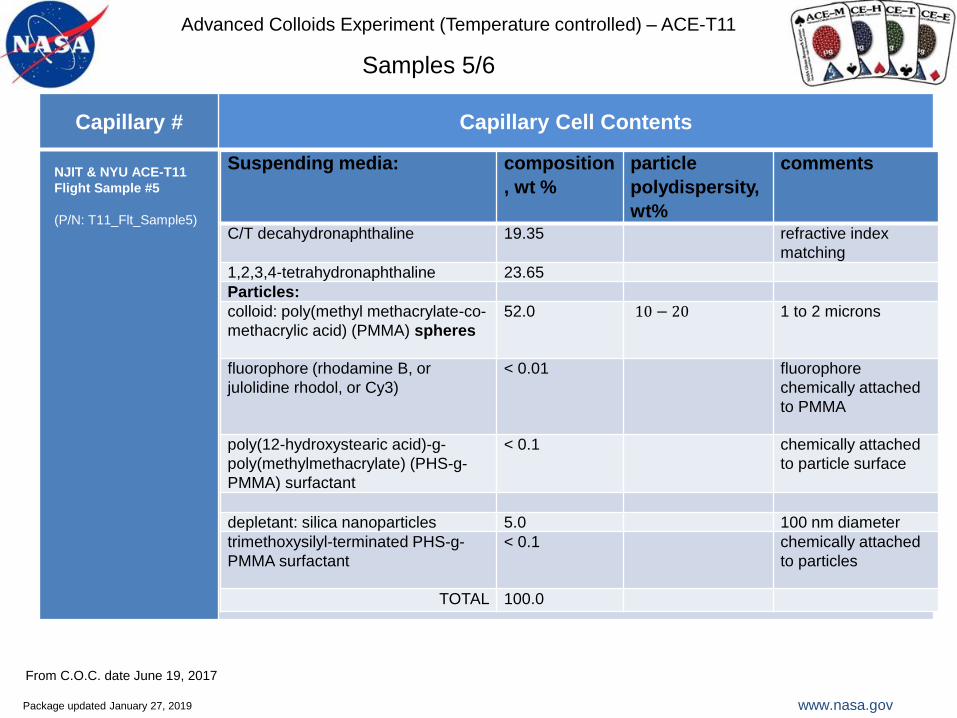
Advanced Colloids Experiment (Temperature controlled) – ACE-T11
Package updated January 27, 2019
Capillary # Capillary Cell Contents
NJIT & NYU ACE-T11
Flight Sample #5
(P/N: T11_Flt_Sample5)
Samples 5/6
From C.O.C. date June 19, 2017
Suspending media: composition
, wt %
particle
polydispersity,
wt%
comments
C/T decahydronaphthaline 19.35 refractive index
matching
1,2,3,4-tetrahydronaphthaline 23.65
Particles:
colloid: poly(methyl methacrylate-co-
methacrylic acid) (PMMA) spheres
52.0 10 − 20 1 to 2 microns
fluorophore (rhodamine B, or
julolidine rhodol, or Cy3)
< 0.01 fluorophore
chemically attached
to PMMA
poly(12-hydroxystearic acid)-g-
poly(methylmethacrylate) (PHS-g-
PMMA) surfactant
< 0.1 chemically attached
to particle surface
depletant: silica nanoparticles 5.0 100 nm diameter
trimethoxysilyl-terminated PHS-g-
PMMA surfactant
< 0.1 chemically attached
to particles
TOTAL 100.0
www.nasa.gov
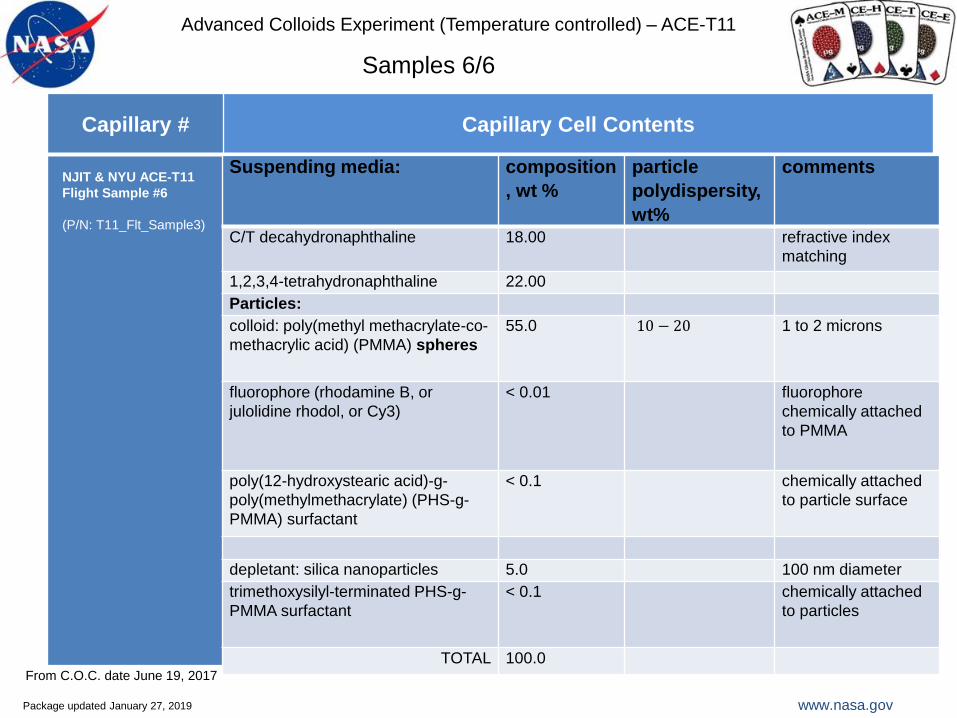
Advanced Colloids Experiment (Temperature controlled) – ACE-T11
Package updated January 27, 2019
Capillary # Capillary Cell Contents
NJIT & NYU ACE-T11
Flight Sample #6
(P/N: T11_Flt_Sample3)
Samples 6/6
From C.O.C. date June 19, 2017
Suspending media: composition
, wt %
particle
polydispersity,
wt%
comments
C/T decahydronaphthaline 18.00 refractive index
matching
1,2,3,4-tetrahydronaphthaline 22.00
Particles:
colloid: poly(methyl methacrylate-co-
methacrylic acid) (PMMA) spheres
55.0 10 − 20 1 to 2 microns
fluorophore (rhodamine B, or
julolidine rhodol, or Cy3)
< 0.01 fluorophore
chemically attached
to PMMA
poly(12-hydroxystearic acid)-g-
poly(methylmethacrylate) (PHS-g-
PMMA) surfactant
< 0.1 chemically attached
to particle surface
depletant: silica nanoparticles 5.0 100 nm diameter
trimethoxysilyl-terminated PHS-g-
PMMA surfactant
< 0.1 chemically attached
to particles
TOTAL 100.0
www.nasa.gov
Advanced Colloids Experiment (Temperature controlled) – ACE-T11
Package updated January 27, 2019
ACE-T11 Success Criteria
38ACE-T6 Science Slides
Success Level Accomplishment
Minimum Success• Homogenize completely at least 40% of the complete set of samples, and observe the time
evolution with (using pre-confocal - bright field and fluorescent microscopy; and if available and
working we would use confocal microscopy for appropriate samples) imaging for several days to
weeks, depending on rates of changes caused by the application of a temperature gradient that
will be determined in real-time as data is downlinked to earth (these cannot be predicted
accurately ahead of time in the 1g environment).
• Have sufficient data (both in terms of frequency and duration) from microscopy of sufficient
quality to observe, characterize and quantify the rates of growth of structures formed as a result
of the physical process of interest in microgravity, including but not limited to crystallization,
phase separation and gelation. The behavior cannot be predicted ahead of time, often new
mechanisms can be observed whose presence is masked on earth by the presence of gravity.
• We hope that these processes will generate new structures formed by thermophoresis in
microgravity, that may direct further earthbound studies and inspire new directions for materials
synthesis and fundamental physics understanding.
Significant
Success• Accomplish the above for 50% of the different types fluid samples launched.
Complete
Success
• Accomplish the above for all launched samples, with multiple runs to repeat the experiment and
assess reproducibility.
Complete success is the achievement of all of the science requirements. This means that there will be sufficient
information to provide a crosscheck of all data and calculated factors. Processing, manipulation and characterization of
the samples in micro-gravity are as important as the measurements during the experiments themselves. e.g., sample
homogenization is essential to conduct of any of the flight experiments. This allows for the homogenization of the
crystallites or any structures formed from phase separation or gelation that have occurred in 1g before launch, and
provides a proper starting point in micro-g.
www.nasa.gov
Advanced Colloids Experiment (Temperature controlled) – ACE-T11
Package updated January 27, 2019
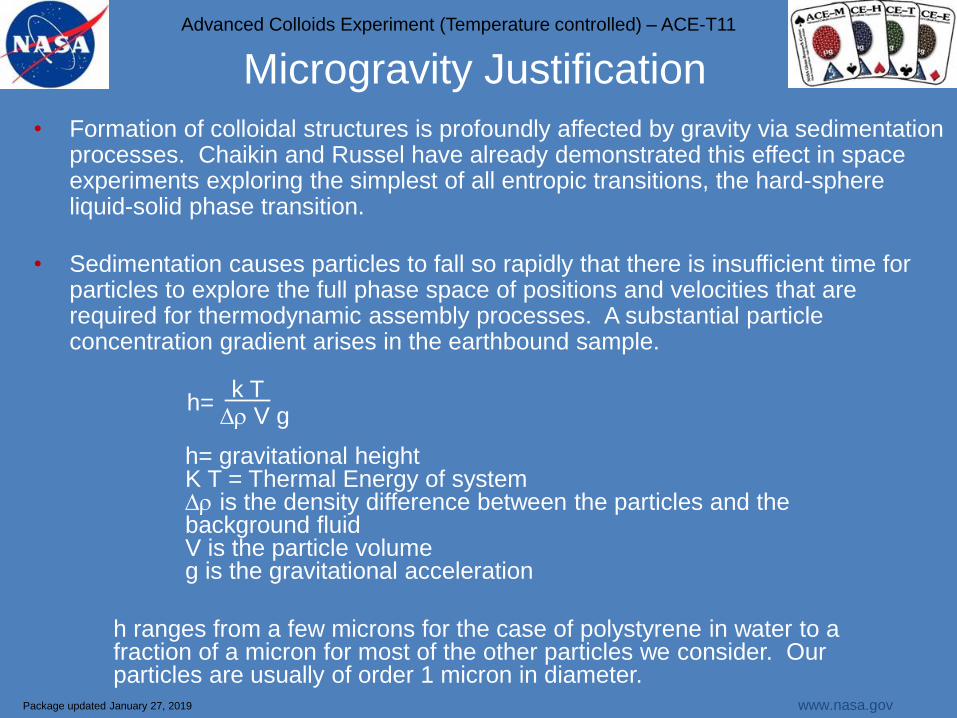
Microgravity Justification
• Formation of colloidal structures is profoundly affected by gravity via sedimentation processes. Chaikin and Russel have already demonstrated this effect in space experiments exploring the simplest of all entropic transitions, the hard-sphere liquid-solid phase transition.
• Sedimentation causes particles to fall so rapidly that there is insufficient time for particles to explore the full phase space of positions and velocities that are required for thermodynamic assembly processes. A substantial particle concentration gradient arises in the earthbound sample.
h= gravitational heightK T = Thermal Energy of systemDr is the density difference between the particles and the background fluidV is the particle volumeg is the gravitational acceleration
h ranges from a few microns for the case of polystyrene in water to a fraction of a micron for most of the other particles we consider. Our particles are usually of order 1 micron in diameter.
h=k T Dr V g
www.nasa.gov
Advanced Colloids Experiment (Temperature controlled) – ACE-T11
Package updated January 27, 2019
• In addition, the shear forces of fluid flow due to the sedimenting particles is often sufficient to break structures that are forming thermodynamically.
• The solvents we plan to are restricted by various factors, for example by our need to fix the colloidal structures in space. Almost all of the particles of future interest are either too heavy or too light compared to water.
• Sample equilibration often requires ~1 to 12 hours. Structure growth sometimes continues for one to two more weeks after the initiation process. These processes are too slow for a drop tower or an airplane.
• Space station provides a unique environment where microgravity is sustained long enough to allow these experiments to be conducted. The samples can be homogenized, and then allowed to develop via thermophoresis in the microgravity environment. Their structures and optical properties can be measured. For most samples we are contemplating, the density mismatch between particle and background fluid is large (e.g. > 1.1 x). Microgravity dramatically reduces these differences and permits true equilibrium processes to occur.
(continued)Microgravity Justification

www.nasa.gov
Advanced Colloids Experiment (Temperature controlled) – ACE-T11
4141


![Brainf*ck Lexical Analysis - GitHub Pages€¦ · Brainf*ck Lexical Analysis Program: ++[>+[+]]. Program Tokens: INCREMENT INCREMENT LOOP_HEADER MOVE_RIGHT INCREMENT LOOP_HEADER INCREMENT](https://img.pdfslide.us/doc/110x75/5f98faba31b4de6080596e95/brainfck-lexical-analysis-github-pages-brainfck-lexical-analysis-program-.jpg)