Embed Size (px)
Citation preview
2015 SIMULIA Community Conference 1
www.3ds.com/simulia
Increasing the efficiency of offshore rigid pipeline lateral buckling assessments using a dedicated GUI
and Isight
Carlos Charnaux, Samuel Paul, and Graeme Roberts
Subsea 7
Abstract: The design phase for offshore rigid pipelines can be lengthy and demanding. A
significant number of engineering hours can be burned before the various analyses attain target
results. The assessment of the lateral buckling phenomenon is one aspect of the pipeline design
that requires numerous finite element simulations. The purpose of such simulations is to
determine if the pipeline has a genuine tendency for lateral buckling and, if so, whether control of
the buckling behavior is required to ensure that the pipeline stresses and strains are within
allowable limits.
The process map for finite element based lateral buckling assessments follows a distinct procedure
distributed into four generic steps: (1) gathering input information, (2) constructing finite element
models, (3) running the simulations and (4) results post-processing. Typically, the process map is
followed manually, and requires engineering analysts to develop quite complex FE models using
typed data input with subsequent use of batched Python scripts to acquire model results, verify
and validate the analysis runs and make tabular and graphical output.
Depending on project requirements and other circumstances such as availability of license tokens
and disk space, the simulation process can be relatively inefficient and places a limit on the
number of analysis runs that can be made and, therefore, the range of input that can be assessed.
The latter point is important because the results of lateral buckling assessments depend heavily on
input uncertainties (e.g. pipe-soil interaction data) and limiting the number of analysis runs may
lead to conclusions that are not based on sound engineering judgment.
In modern offices, it is rare to find engineers who are conversant and comfortable with developing
batch processes or writing computer code that would enable a large range of jobs to be completed
and post-processed efficiently. However, Windows-based applications such as the user-friendly
Isight program allow engineering processes to be automated in order to enhance the results fields
and to better understand the influences of the uncertainties of some input parameters.
2 2015 SIMULIA Community Conference
www.3ds.com/simulia
Subsea 7 has developed a Graphical User Interface (GUI) that works with Isight and which fully
automates lateral buckling assessments, from the input gathering stage through model generation,
post-processing, graphical output and model verification.
This paper demonstrates the current status of the automation process which is built around the
“Splatter” GUI, Isight workflows and in-house Python scripts. The process enables engineers
with relatively little experience of Abaqus to create, analyze and post-process Abaqus models for
lateral buckling, pipeline walking and on-bottom roughness assessments.
Keywords: Design of Experiments, Exploration, Lateral Buckling, Optimization, Pipeline, Pipe-
Soil Interaction, Post-processing, Probabilistic Design, Scripting.
1. Introduction
Subsea steel rigid pipelines may be required to transport hydrocarbons that are at elevated
temperatures and pressures. Pipelines with these operating characteristics, and which are surface-
laid on the seabed, may be susceptible to the formation of global lateral buckles. The lateral
buckles are the result of a combination of the operational characteristics and the interaction
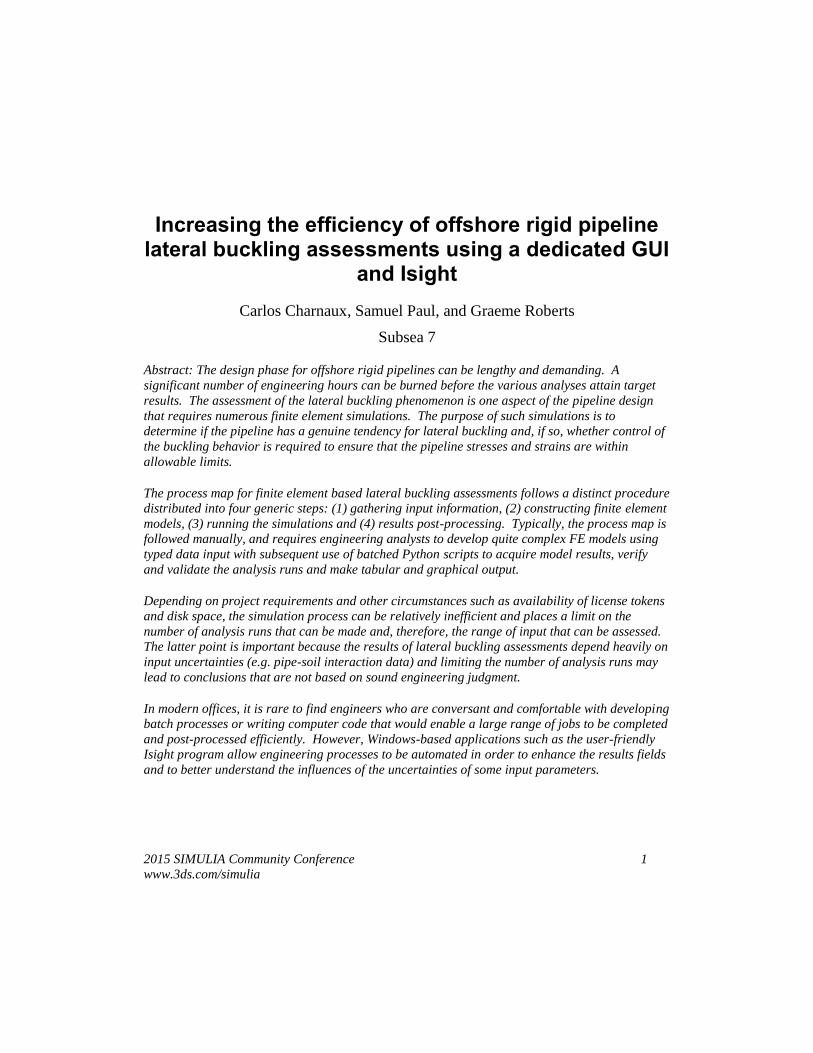
between the pipe and the seabed. In simple terms, the elevated temperature and pressure introduce
an expansion tendency along the pipeline’s length but this tendency is resisted by pipe-soil
interaction (Figure 1). The pipe-soil interaction generates a compressive force within the pipeline.
The compressive force builds up transiently with the pressure and temperature until either the full
operating condition is reached, and the compressive internal force in the pipeline is not high
enough to initiate buckling, or the pipeline’s capacity to resist lateral buckling is exceeded.
Figure 1. Pipeline expansion due to increase in temperature and pressure and soil compressive resistance
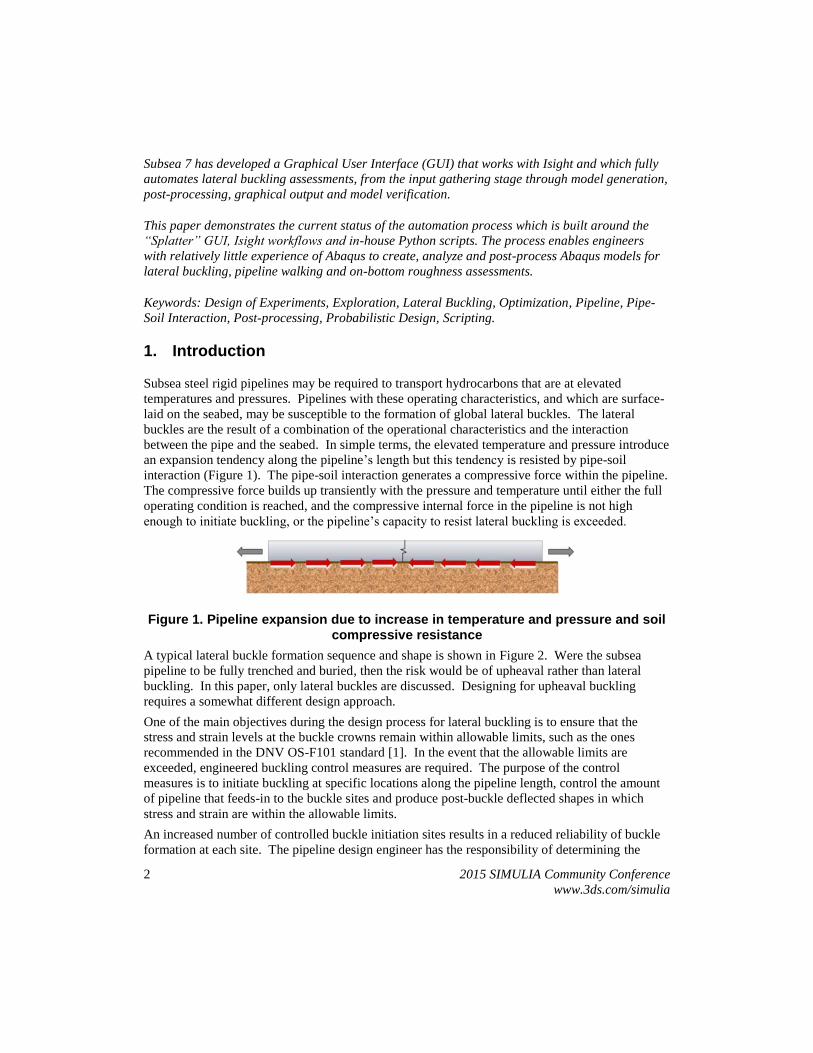
A typical lateral buckle formation sequence and shape is shown in Figure 2. Were the subsea
pipeline to be fully trenched and buried, then the risk would be of upheaval rather than lateral
buckling. In this paper, only lateral buckles are discussed. Designing for upheaval buckling
requires a somewhat different design approach.
One of the main objectives during the design process for lateral buckling is to ensure that the
stress and strain levels at the buckle crowns remain within allowable limits, such as the ones
recommended in the DNV OS-F101 standard [1]. In the event that the allowable limits are
exceeded, engineered buckling control measures are required. The purpose of the control
measures is to initiate buckling at specific locations along the pipeline length, control the amount
of pipeline that feeds-in to the buckle sites and produce post-buckle deflected shapes in which
stress and strain are within the allowable limits.
An increased number of controlled buckle initiation sites results in a reduced reliability of buckle
formation at each site. The pipeline design engineer has the responsibility of determining the
2015 SIMULIA Community Conference 3
www.3ds.com/simulia
balance between the number of buckle initiation sites and the reliability of the triggering strategy.
Each engineered buckling initiator results in an additional fabrication and installation cost that
must be borne by the project.
Figure 2. Typical lateral buckle formation
Lateral buckling assessments may become long and complex depending on the project
characteristics and client requirements. The assessment process consists of several stages that
require engineering expertise and time, most notably:
Data interpretation;
Constructing FE models;
Running simulations;
Post-processing FE output.
The objective of this paper is to show the work performed by Subsea 7 to enhance the lateral
buckling design process by using in-house tools and Simulia’s Isight process automation software.
Automating analyses and post-processing has enabled pipeline design engineers working on recent
deep water, high-pressure high-temperature pipeline projects to assess a wider range input
parameters and better optimization of lateral buckling control strategies than was previously
possible.
4 2015 SIMULIA Community Conference
www.3ds.com/simulia
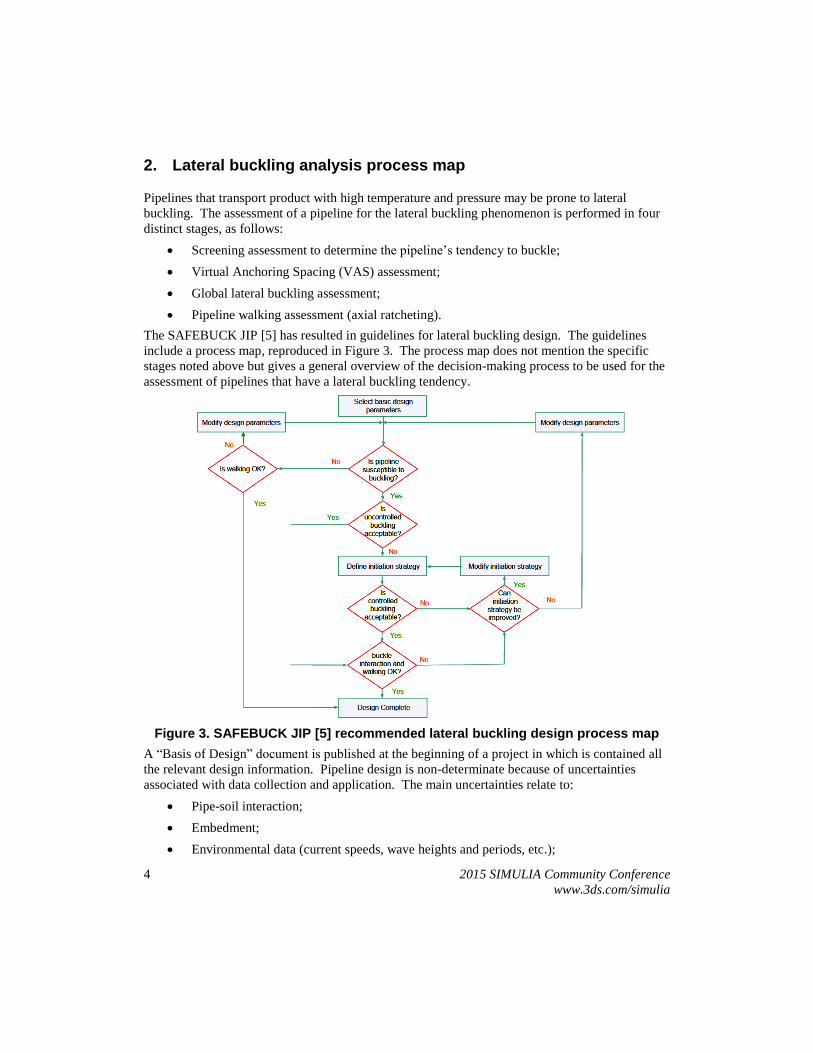
2. Lateral buckling analysis process map
Pipelines that transport product with high temperature and pressure may be prone to lateral
buckling. The assessment of a pipeline for the lateral buckling phenomenon is performed in four
distinct stages, as follows:
Screening assessment to determine the pipeline’s tendency to buckle;
Virtual Anchoring Spacing (VAS) assessment;
Global lateral buckling assessment;
Pipeline walking assessment (axial ratcheting).
The SAFEBUCK JIP [5] has resulted in guidelines for lateral buckling design. The guidelines
include a process map, reproduced in Figure 3. The process map does not mention the specific
stages noted above but gives a general overview of the decision-making process to be used for the
assessment of pipelines that have a lateral buckling tendency.
Figure 3. SAFEBUCK JIP [5] recommended lateral buckling design process map
A “Basis of Design” document is published at the beginning of a project in which is contained all
the relevant design information. Pipeline design is non-determinate because of uncertainties
associated with data collection and application. The main uncertainties relate to:
Pipe-soil interaction;
Embedment;
Environmental data (current speeds, wave heights and periods, etc.);
2015 SIMULIA Community Conference 5
www.3ds.com/simulia
Pipe dimensional tolerances;
Material certificates.
The pipeline design engineer has to deal with these uncertainties, be able to interpret them, select
the useful values and perform engineering with the selected data. It is only after data
interpretation that calculations may be performed. Data is not always available at the project start
and, consequently, significant re-work has to be done during the mid or late project stages.
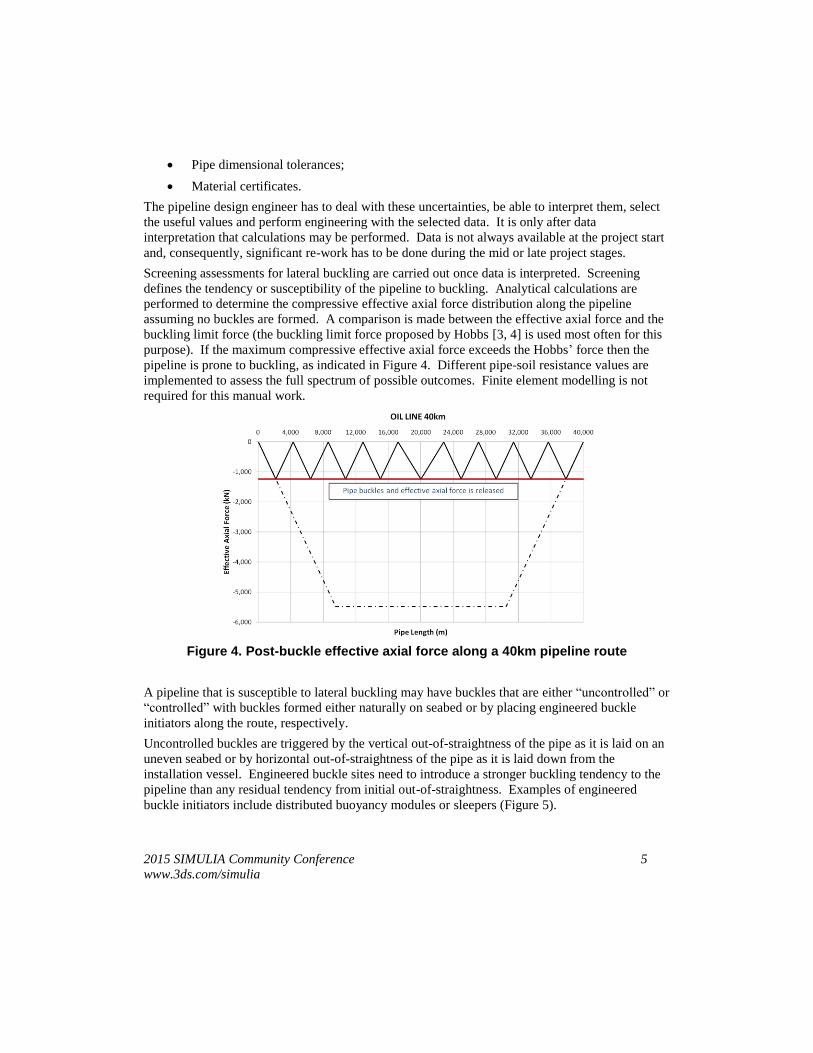
Screening assessments for lateral buckling are carried out once data is interpreted. Screening
defines the tendency or susceptibility of the pipeline to buckling. Analytical calculations are
performed to determine the compressive effective axial force distribution along the pipeline
assuming no buckles are formed. A comparison is made between the effective axial force and the
buckling limit force (the buckling limit force proposed by Hobbs [3, 4] is used most often for this
purpose). If the maximum compressive effective axial force exceeds the Hobbs’ force then the
pipeline is prone to buckling, as indicated in Figure 4. Different pipe-soil resistance values are
implemented to assess the full spectrum of possible outcomes. Finite element modelling is not
required for this manual work.
Figure 4. Post-buckle effective axial force along a 40km pipeline route
A pipeline that is susceptible to lateral buckling may have buckles that are either “uncontrolled” or
“controlled” with buckles formed either naturally on seabed or by placing engineered buckle
initiators along the route, respectively.
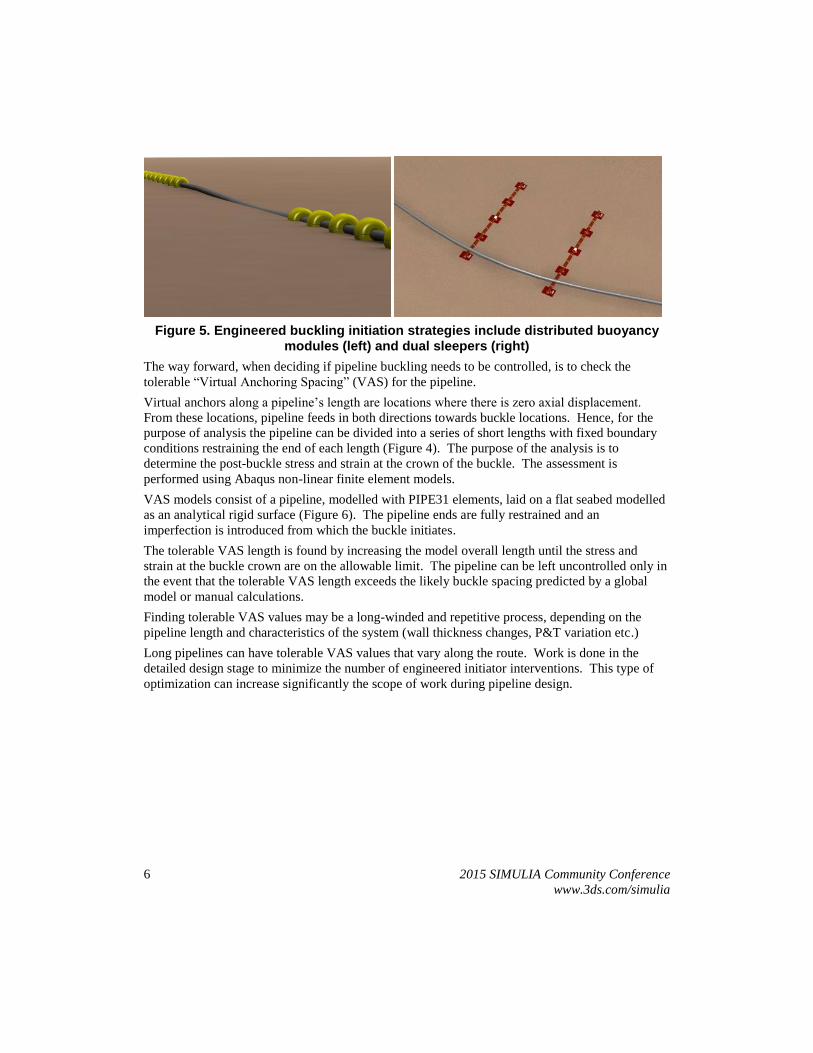
Uncontrolled buckles are triggered by the vertical out-of-straightness of the pipe as it is laid on an
uneven seabed or by horizontal out-of-straightness of the pipe as it is laid down from the
installation vessel. Engineered buckle sites need to introduce a stronger buckling tendency to the
pipeline than any residual tendency from initial out-of-straightness. Examples of engineered
buckle initiators include distributed buoyancy modules or sleepers (Figure 5).
6 2015 SIMULIA Community Conference
www.3ds.com/simulia
Figure 5. Engineered buckling initiation strategies include distributed buoyancy modules (left) and dual sleepers (right)
The way forward, when deciding if pipeline buckling needs to be controlled, is to check the
tolerable “Virtual Anchoring Spacing” (VAS) for the pipeline.
Virtual anchors along a pipeline’s length are locations where there is zero axial displacement.
From these locations, pipeline feeds in both directions towards buckle locations. Hence, for the
purpose of analysis the pipeline can be divided into a series of short lengths with fixed boundary
conditions restraining the end of each length (Figure 4). The purpose of the analysis is to
determine the post-buckle stress and strain at the crown of the buckle. The assessment is
performed using Abaqus non-linear finite element models.
VAS models consist of a pipeline, modelled with PIPE31 elements, laid on a flat seabed modelled
as an analytical rigid surface (Figure 6). The pipeline ends are fully restrained and an
imperfection is introduced from which the buckle initiates.
The tolerable VAS length is found by increasing the model overall length until the stress and
strain at the buckle crown are on the allowable limit. The pipeline can be left uncontrolled only in
the event that the tolerable VAS length exceeds the likely buckle spacing predicted by a global
model or manual calculations.
Finding tolerable VAS values may be a long-winded and repetitive process, depending on the
pipeline length and characteristics of the system (wall thickness changes, P&T variation etc.)
Long pipelines can have tolerable VAS values that vary along the route. Work is done in the
detailed design stage to minimize the number of engineered initiator interventions. This type of
optimization can increase significantly the scope of work during pipeline design.
2015 SIMULIA Community Conference 7
www.3ds.com/simulia
Figure 6. VAS finite element model
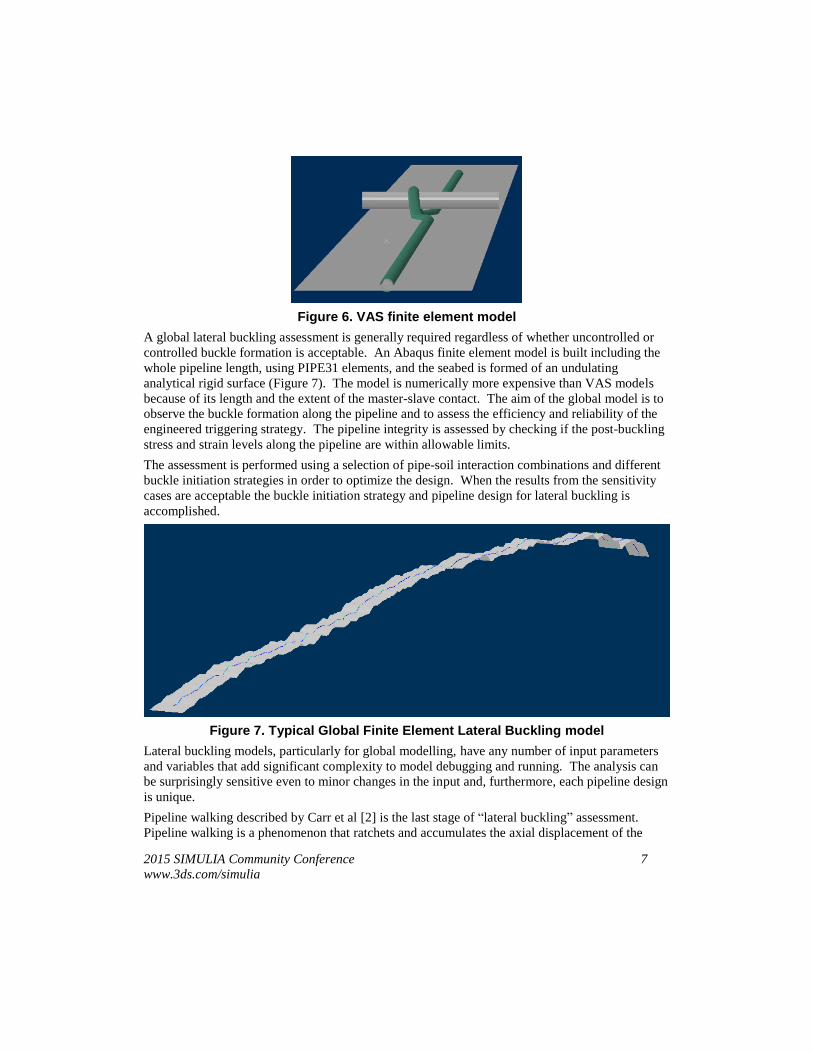
A global lateral buckling assessment is generally required regardless of whether uncontrolled or
controlled buckle formation is acceptable. An Abaqus finite element model is built including the
whole pipeline length, using PIPE31 elements, and the seabed is formed of an undulating
analytical rigid surface (Figure 7). The model is numerically more expensive than VAS models
because of its length and the extent of the master-slave contact. The aim of the global model is to
observe the buckle formation along the pipeline and to assess the efficiency and reliability of the
engineered triggering strategy. The pipeline integrity is assessed by checking if the post-buckling
stress and strain levels along the pipeline are within allowable limits.
The assessment is performed using a selection of pipe-soil interaction combinations and different
buckle initiation strategies in order to optimize the design. When the results from the sensitivity
cases are acceptable the buckle initiation strategy and pipeline design for lateral buckling is
accomplished.
Figure 7. Typical Global Finite Element Lateral Buckling model
Lateral buckling models, particularly for global modelling, have any number of input parameters
and variables that add significant complexity to model debugging and running. The analysis can
be surprisingly sensitive even to minor changes in the input and, furthermore, each pipeline design
is unique.
Pipeline walking described by Carr et al [2] is the last stage of “lateral buckling” assessment.
Pipeline walking is a phenomenon that ratchets and accumulates the axial displacement of the
8 2015 SIMULIA Community Conference
www.3ds.com/simulia
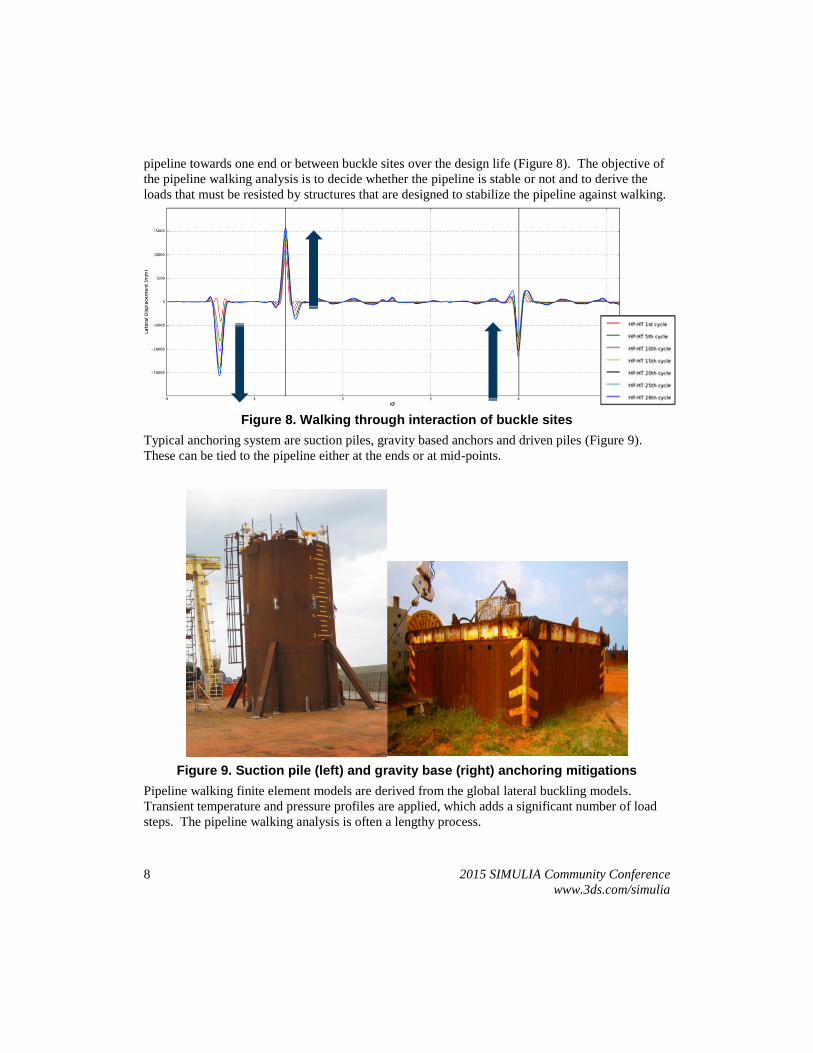
pipeline towards one end or between buckle sites over the design life (Figure 8). The objective of
the pipeline walking analysis is to decide whether the pipeline is stable or not and to derive the
loads that must be resisted by structures that are designed to stabilize the pipeline against walking.
Figure 8. Walking through interaction of buckle sites
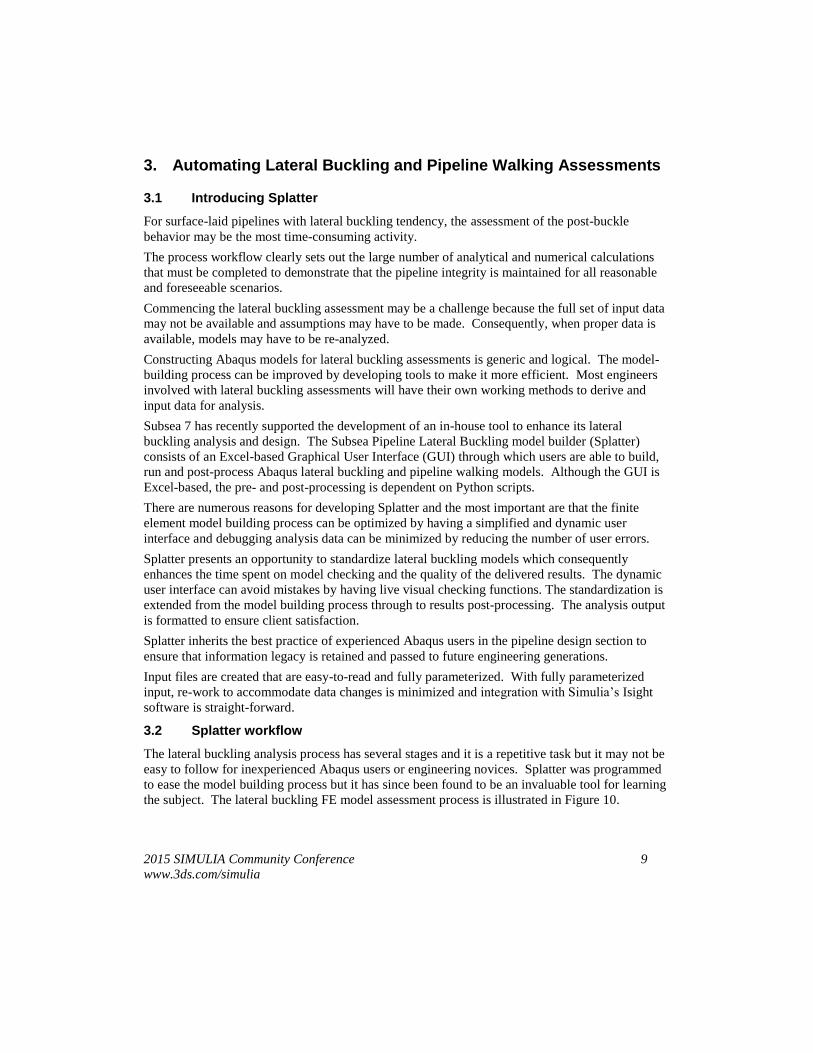
Typical anchoring system are suction piles, gravity based anchors and driven piles (Figure 9).
These can be tied to the pipeline either at the ends or at mid-points.
Figure 9. Suction pile (left) and gravity base (right) anchoring mitigations
Pipeline walking finite element models are derived from the global lateral buckling models.
Transient temperature and pressure profiles are applied, which adds a significant number of load
steps. The pipeline walking analysis is often a lengthy process.
2015 SIMULIA Community Conference 9
www.3ds.com/simulia
3. Automating Lateral Buckling and Pipeline Walking Assessments
3.1 Introducing Splatter
For surface-laid pipelines with lateral buckling tendency, the assessment of the post-buckle
behavior may be the most time-consuming activity.
The process workflow clearly sets out the large number of analytical and numerical calculations
that must be completed to demonstrate that the pipeline integrity is maintained for all reasonable
and foreseeable scenarios.
Commencing the lateral buckling assessment may be a challenge because the full set of input data
may not be available and assumptions may have to be made. Consequently, when proper data is
available, models may have to be re-analyzed.
Constructing Abaqus models for lateral buckling assessments is generic and logical. The model-
building process can be improved by developing tools to make it more efficient. Most engineers
involved with lateral buckling assessments will have their own working methods to derive and
input data for analysis.
Subsea 7 has recently supported the development of an in-house tool to enhance its lateral
buckling analysis and design. The Subsea Pipeline Lateral Buckling model builder (Splatter)
consists of an Excel-based Graphical User Interface (GUI) through which users are able to build,
run and post-process Abaqus lateral buckling and pipeline walking models. Although the GUI is
Excel-based, the pre- and post-processing is dependent on Python scripts.
There are numerous reasons for developing Splatter and the most important are that the finite
element model building process can be optimized by having a simplified and dynamic user
interface and debugging analysis data can be minimized by reducing the number of user errors.
Splatter presents an opportunity to standardize lateral buckling models which consequently
enhances the time spent on model checking and the quality of the delivered results. The dynamic
user interface can avoid mistakes by having live visual checking functions. The standardization is
extended from the model building process through to results post-processing. The analysis output
is formatted to ensure client satisfaction.
Splatter inherits the best practice of experienced Abaqus users in the pipeline design section to
ensure that information legacy is retained and passed to future engineering generations.
Input files are created that are easy-to-read and fully parameterized. With fully parameterized
input, re-work to accommodate data changes is minimized and integration with Simulia’s Isight
software is straight-forward.
3.2 Splatter workflow
The lateral buckling analysis process has several stages and it is a repetitive task but it may not be
easy to follow for inexperienced Abaqus users or engineering novices. Splatter was programmed
to ease the model building process but it has since been found to be an invaluable tool for learning
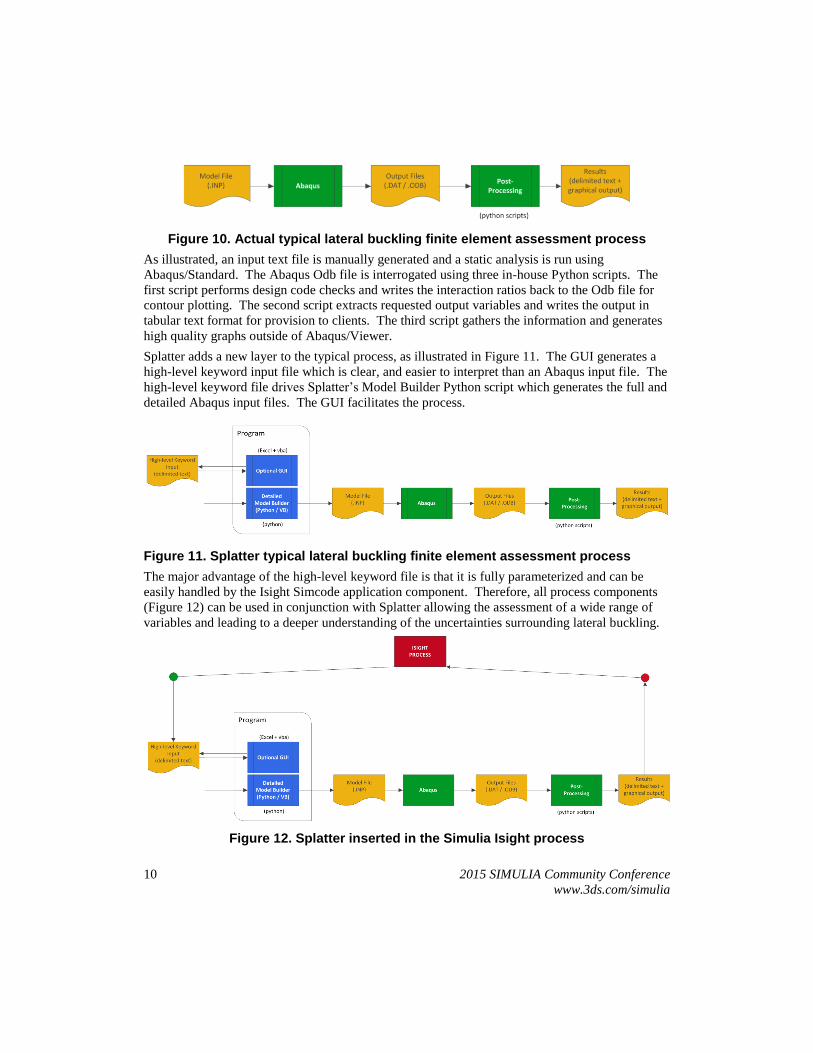
the subject. The lateral buckling FE model assessment process is illustrated in Figure 10.
10 2015 SIMULIA Community Conference
www.3ds.com/simulia
Figure 10. Actual typical lateral buckling finite element assessment process
As illustrated, an input text file is manually generated and a static analysis is run using
Abaqus/Standard. The Abaqus Odb file is interrogated using three in-house Python scripts. The
first script performs design code checks and writes the interaction ratios back to the Odb file for
contour plotting. The second script extracts requested output variables and writes the output in
tabular text format for provision to clients. The third script gathers the information and generates
high quality graphs outside of Abaqus/Viewer.
Splatter adds a new layer to the typical process, as illustrated in Figure 11. The GUI generates a
high-level keyword input file which is clear, and easier to interpret than an Abaqus input file. The
high-level keyword file drives Splatter’s Model Builder Python script which generates the full and
detailed Abaqus input files. The GUI facilitates the process.
Figure 11. Splatter typical lateral buckling finite element assessment process
The major advantage of the high-level keyword file is that it is fully parameterized and can be
easily handled by the Isight Simcode application component. Therefore, all process components
(Figure 12) can be used in conjunction with Splatter allowing the assessment of a wide range of
variables and leading to a deeper understanding of the uncertainties surrounding lateral buckling.
Figure 12. Splatter inserted in the Simulia Isight process
2015 SIMULIA Community Conference 11
www.3ds.com/simulia
The Splatter GUI automates the post-processing stage which is an extensive and fundamental part
of lateral buckling design and one on which engineers may spend any number of hours. A single
tool to post-process model results allows users to build an identity for the company by
standardizing results and enhances communication with clients.
3.3 Splatter GUI and its capabilities
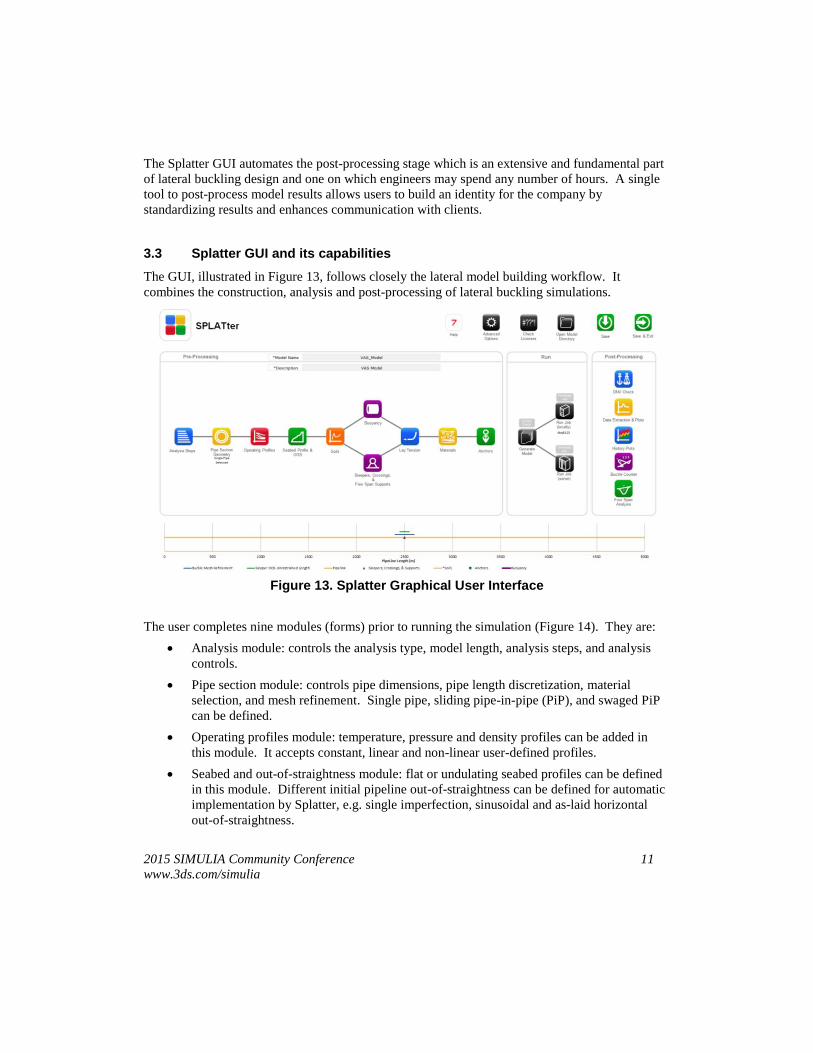
The GUI, illustrated in Figure 13, follows closely the lateral model building workflow. It
combines the construction, analysis and post-processing of lateral buckling simulations.
Figure 13. Splatter Graphical User Interface
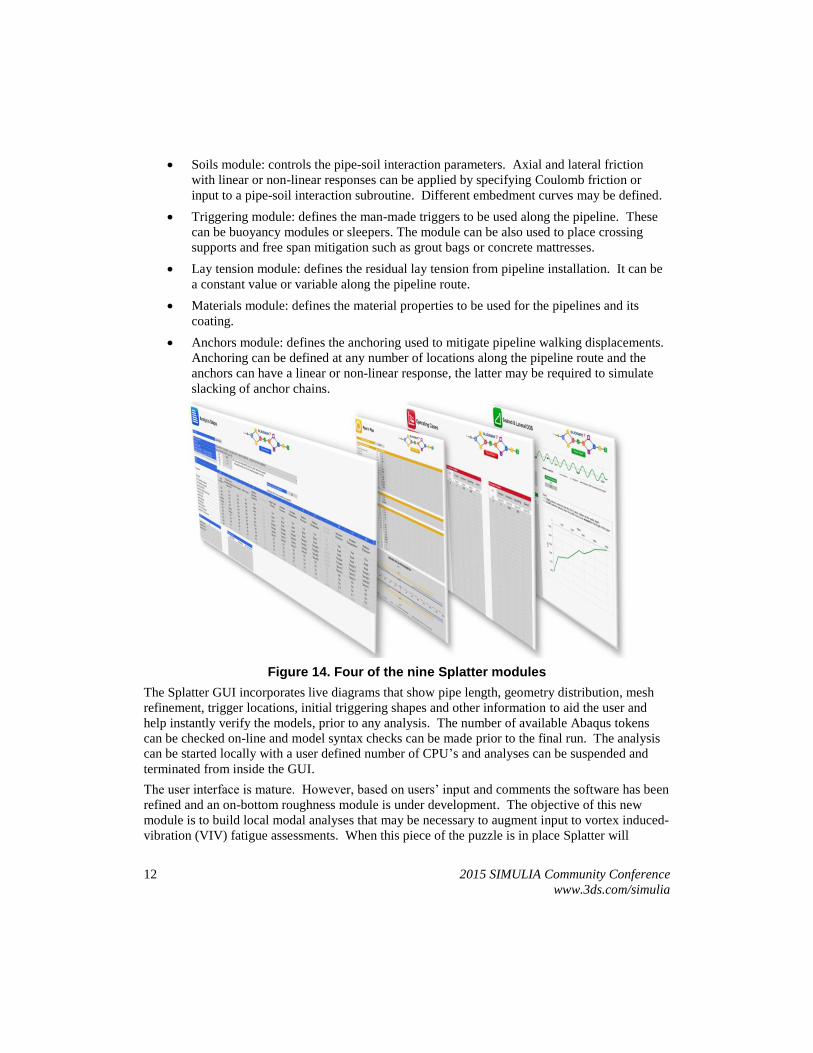
The user completes nine modules (forms) prior to running the simulation (Figure 14). They are:
Analysis module: controls the analysis type, model length, analysis steps, and analysis
controls.
Pipe section module: controls pipe dimensions, pipe length discretization, material
selection, and mesh refinement. Single pipe, sliding pipe-in-pipe (PiP), and swaged PiP
can be defined.
Operating profiles module: temperature, pressure and density profiles can be added in
this module. It accepts constant, linear and non-linear user-defined profiles.
Seabed and out-of-straightness module: flat or undulating seabed profiles can be defined
in this module. Different initial pipeline out-of-straightness can be defined for automatic
implementation by Splatter, e.g. single imperfection, sinusoidal and as-laid horizontal
out-of-straightness.
12 2015 SIMULIA Community Conference
www.3ds.com/simulia
Soils module: controls the pipe-soil interaction parameters. Axial and lateral friction
with linear or non-linear responses can be applied by specifying Coulomb friction or
input to a pipe-soil interaction subroutine. Different embedment curves may be defined.
Triggering module: defines the man-made triggers to be used along the pipeline. These
can be buoyancy modules or sleepers. The module can be also used to place crossing
supports and free span mitigation such as grout bags or concrete mattresses.
Lay tension module: defines the residual lay tension from pipeline installation. It can be
a constant value or variable along the pipeline route.
Materials module: defines the material properties to be used for the pipelines and its
coating.
Anchors module: defines the anchoring used to mitigate pipeline walking displacements.
Anchoring can be defined at any number of locations along the pipeline route and the
anchors can have a linear or non-linear response, the latter may be required to simulate
slacking of anchor chains.
Figure 14. Four of the nine Splatter modules
The Splatter GUI incorporates live diagrams that show pipe length, geometry distribution, mesh
refinement, trigger locations, initial triggering shapes and other information to aid the user and
help instantly verify the models, prior to any analysis. The number of available Abaqus tokens
can be checked on-line and model syntax checks can be made prior to the final run. The analysis
can be started locally with a user defined number of CPU’s and analyses can be suspended and
terminated from inside the GUI.
The user interface is mature. However, based on users’ input and comments the software has been
refined and an on-bottom roughness module is under development. The objective of this new
module is to build local modal analyses that may be necessary to augment input to vortex induced-
vibration (VIV) fatigue assessments. When this piece of the puzzle is in place Splatter will
2015 SIMULIA Community Conference 13
www.3ds.com/simulia
become a single interface that is able to deal with lateral buckling, pipeline walking, on-bottom
roughness and free span assessments.
4. Integration with Simulia’s Isight
Simulia’s Isight is a Process Integration and Design Optimization (PIDO) application. Isight has
been heavily used in the automotive and aerospace industries and it is starting to get some renown
and traction in the oil and gas sector. Subsea 7 is engaged with the development of analysis tools
that benefit directly from Isight’s capabilities.
Splatter is one of several applications that are under development which will interface with Isight
to increase the efficiency of analysis processes and enhance the quality of the results. In essence,
the aim is to move from deterministic towards probabilistic pipeline assessments. Splatter
enhances model-building efficiency and results’ post-processing but it still only allows running
one case per time and the extraction of deterministic results. But because Splatter is fully
parameterized it is possible to work in close partnership with Isight and Splatter’s architecture was
developed with Isight integration as a major objective. The high-level keyword file aimed to
establish a quick and simple implementation of lateral buckling models inside the Isight Simcode
application component. The Simcode component per se is enough to pre-process, run and post-
process the lateral buckling analysis. Once the process is set, it is straightforward to run several
analyses driven by Design of Experiments (DOE), Exploration, Monte-Carlo and Six-Sigma
process components.
Isight process components have already been invoked by Subsea 7 for lateral buckling analyses
and the following aspects will be presented briefly in this paper:
Tolerable Virtual Anchoring Spacing assessment;
Welds stress ranges due to lateral buckle formation assessments;
Global model probabilistic assessment.
Future papers will describe Subsea 7’s ongoing work with Isight in pipelines and other disciplines.
4.1 Tolerable VAS analysis using Isight
Tolerable VAS modelling is a repetitive process that requires a number of engineering hours in
order to find the maximum tolerable virtual anchoring spacing (VAS) that a buckled pipeline can
have whilst remaining within integrity limits.
Tolerable VAS analysis is performed for a specific set of pipeline data, pipe-soil interaction
parameters and operational conditions. VAS FE models are constructed, run and the resultant
stresses and strains compared to the allowable limits. Graphical output is helpful to confirm the
validity of the models and results. The pipeline length is incremented or decremented until the
allowable limits are reached. Within each simulation there are several steps that can be automated
with Isight.
In the following example, a single sleeper is being used in a VAS pipeline model to initiate lateral
buckling. The buckle has to occur at the middle of the VAS pipeline length to maximize feed-in
towards the buckle crown.
14 2015 SIMULIA Community Conference
www.3ds.com/simulia
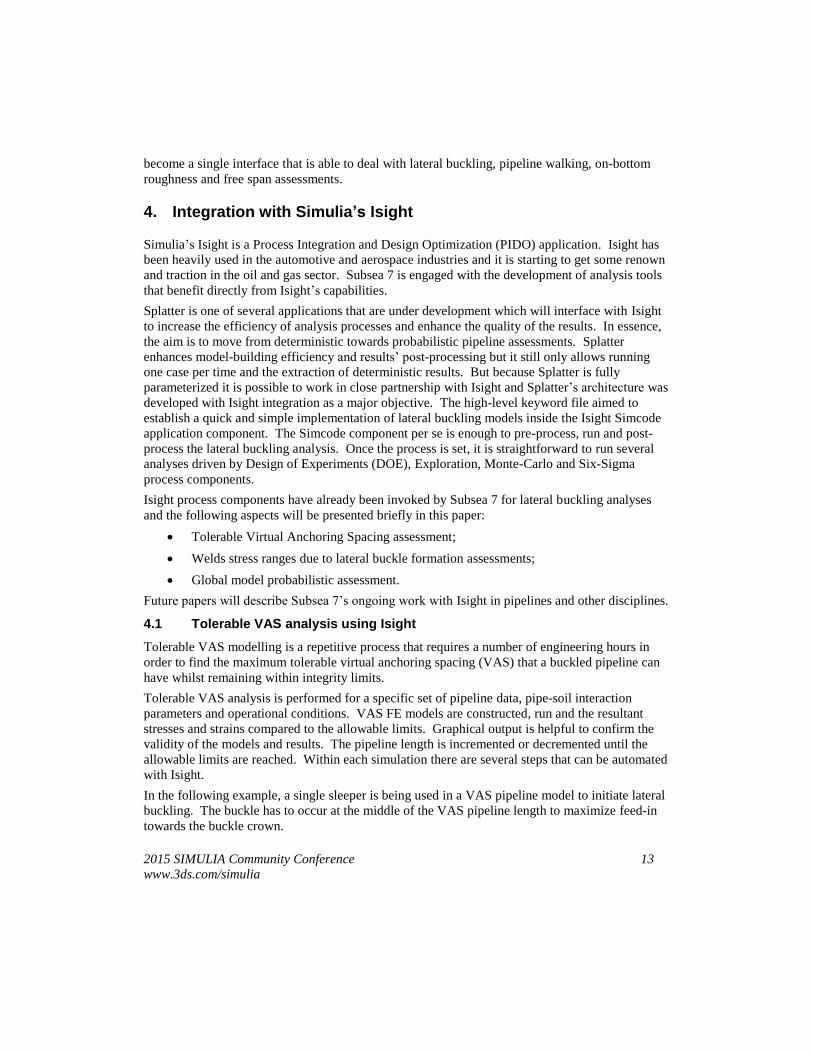
A suitable Isight process component to drive the tolerable VAS analysis is the “Exploration”
process. The analysis results in this example had linear responses and “Hooke-Jeeves” was
chosen as a suitable optimization technique. The Exploration component is set up with the
objective of making the DNV interaction ratio be equal to 1.0. The Isight process used in this
assessment is illustrated in Figure 15.
Figure 15. Isight process for tolerable VAS seeking
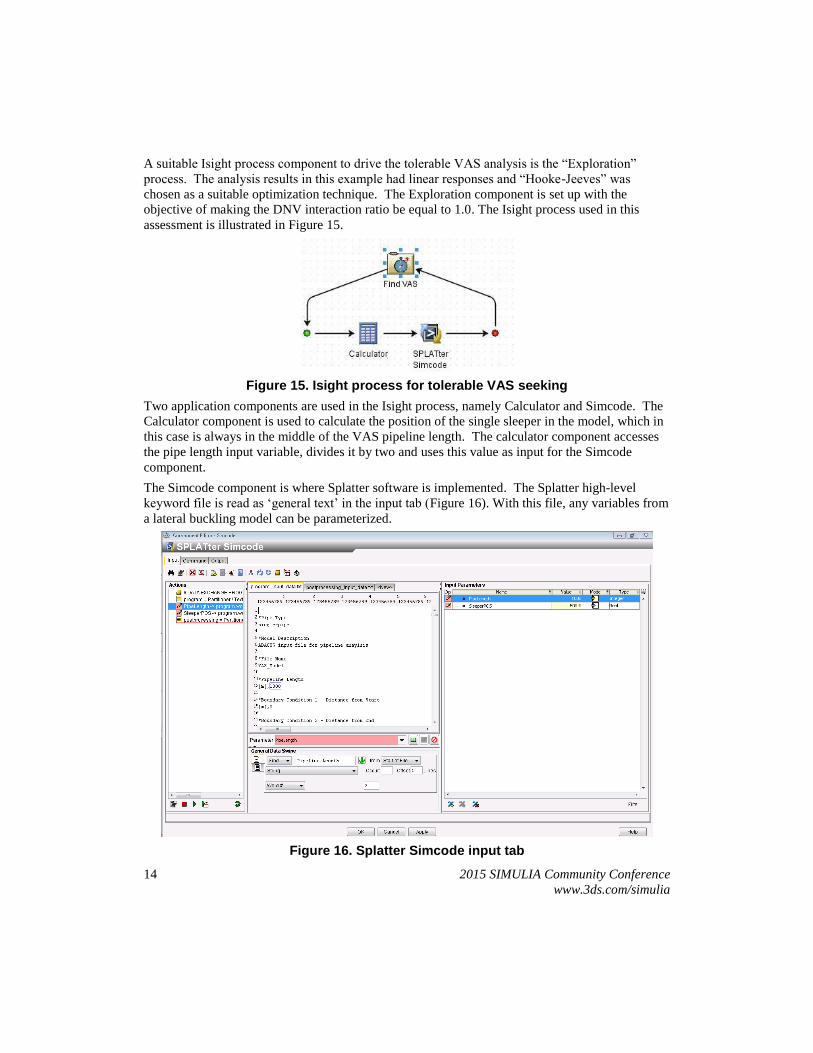
Two application components are used in the Isight process, namely Calculator and Simcode. The
Calculator component is used to calculate the position of the single sleeper in the model, which in
this case is always in the middle of the VAS pipeline length. The calculator component accesses
the pipe length input variable, divides it by two and uses this value as input for the Simcode
component.
The Simcode component is where Splatter software is implemented. The Splatter high-level
keyword file is read as ‘general text’ in the input tab (Figure 16). With this file, any variables from
a lateral buckling model can be parameterized.
Figure 16. Splatter Simcode input tab
2015 SIMULIA Community Conference 15
www.3ds.com/simulia
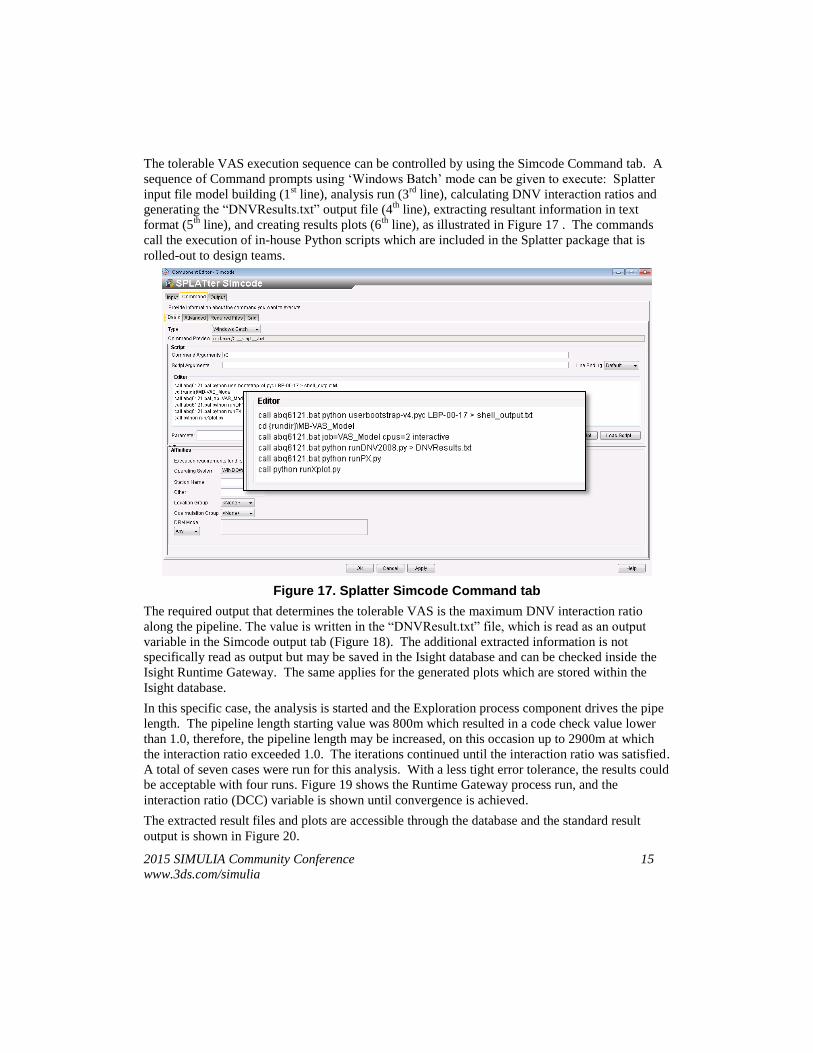
The tolerable VAS execution sequence can be controlled by using the Simcode Command tab. A
sequence of Command prompts using ‘Windows Batch’ mode can be given to execute: Splatter
input file model building (1st line), analysis run (3
rd line), calculating DNV interaction ratios and
generating the “DNVResults.txt” output file (4th
line), extracting resultant information in text
format (5th
line), and creating results plots (6th
line), as illustrated in Figure 17 . The commands
call the execution of in-house Python scripts which are included in the Splatter package that is
rolled-out to design teams.
Figure 17. Splatter Simcode Command tab
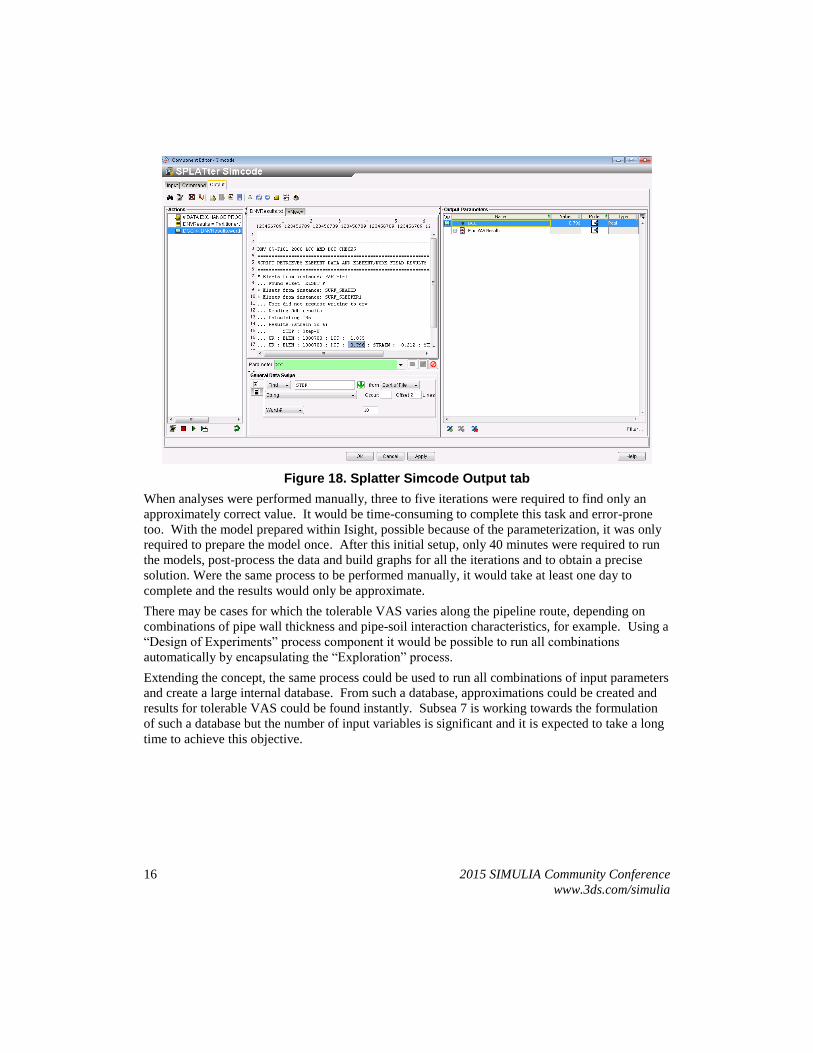
The required output that determines the tolerable VAS is the maximum DNV interaction ratio
along the pipeline. The value is written in the “DNVResult.txt” file, which is read as an output
variable in the Simcode output tab (Figure 18). The additional extracted information is not
specifically read as output but may be saved in the Isight database and can be checked inside the
Isight Runtime Gateway. The same applies for the generated plots which are stored within the
Isight database.
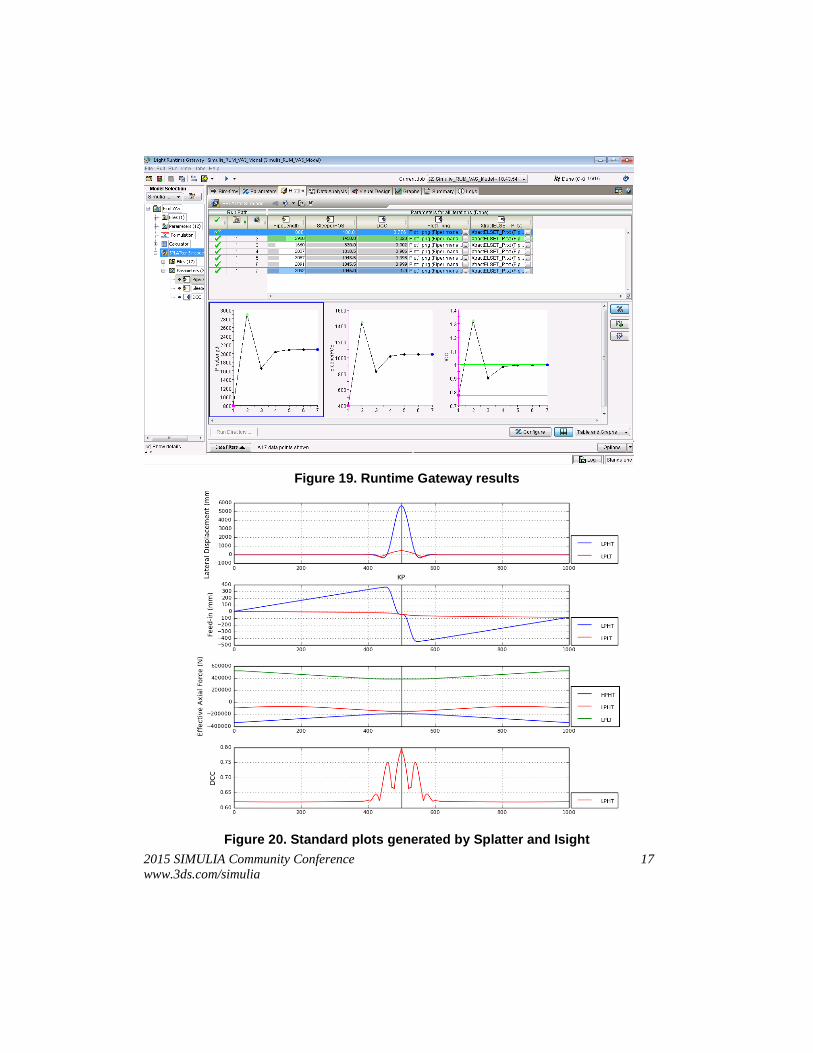
In this specific case, the analysis is started and the Exploration process component drives the pipe
length. The pipeline length starting value was 800m which resulted in a code check value lower
than 1.0, therefore, the pipeline length may be increased, on this occasion up to 2900m at which
the interaction ratio exceeded 1.0. The iterations continued until the interaction ratio was satisfied.
A total of seven cases were run for this analysis. With a less tight error tolerance, the results could
be acceptable with four runs. Figure 19 shows the Runtime Gateway process run, and the
interaction ratio (DCC) variable is shown until convergence is achieved.
The extracted result files and plots are accessible through the database and the standard result
output is shown in Figure 20.
16 2015 SIMULIA Community Conference
www.3ds.com/simulia
Figure 18. Splatter Simcode Output tab
When analyses were performed manually, three to five iterations were required to find only an
approximately correct value. It would be time-consuming to complete this task and error-prone
too. With the model prepared within Isight, possible because of the parameterization, it was only
required to prepare the model once. After this initial setup, only 40 minutes were required to run
the models, post-process the data and build graphs for all the iterations and to obtain a precise
solution. Were the same process to be performed manually, it would take at least one day to
complete and the results would only be approximate.
There may be cases for which the tolerable VAS varies along the pipeline route, depending on
combinations of pipe wall thickness and pipe-soil interaction characteristics, for example. Using a
“Design of Experiments” process component it would be possible to run all combinations
automatically by encapsulating the “Exploration” process.
Extending the concept, the same process could be used to run all combinations of input parameters
and create a large internal database. From such a database, approximations could be created and
results for tolerable VAS could be found instantly. Subsea 7 is working towards the formulation
of such a database but the number of input variables is significant and it is expected to take a long
time to achieve this objective.
2015 SIMULIA Community Conference 17
www.3ds.com/simulia
Figure 19. Runtime Gateway results
Figure 20. Standard plots generated by Splatter and Isight
18 2015 SIMULIA Community Conference
www.3ds.com/simulia
4.2 Other processes using Isight
The tolerable VAS process using Isight is one example of a development made by Subsea 7. The
tolerable VAS process is a basis for other processes involving lateral buckling assessments or
general pipeline analysis. For example, determining the maximum End of Life (EOL) stresses and
associated stress ranges along a pipe length is important for fatigue evaluation and Engineering
Critical Assessment.
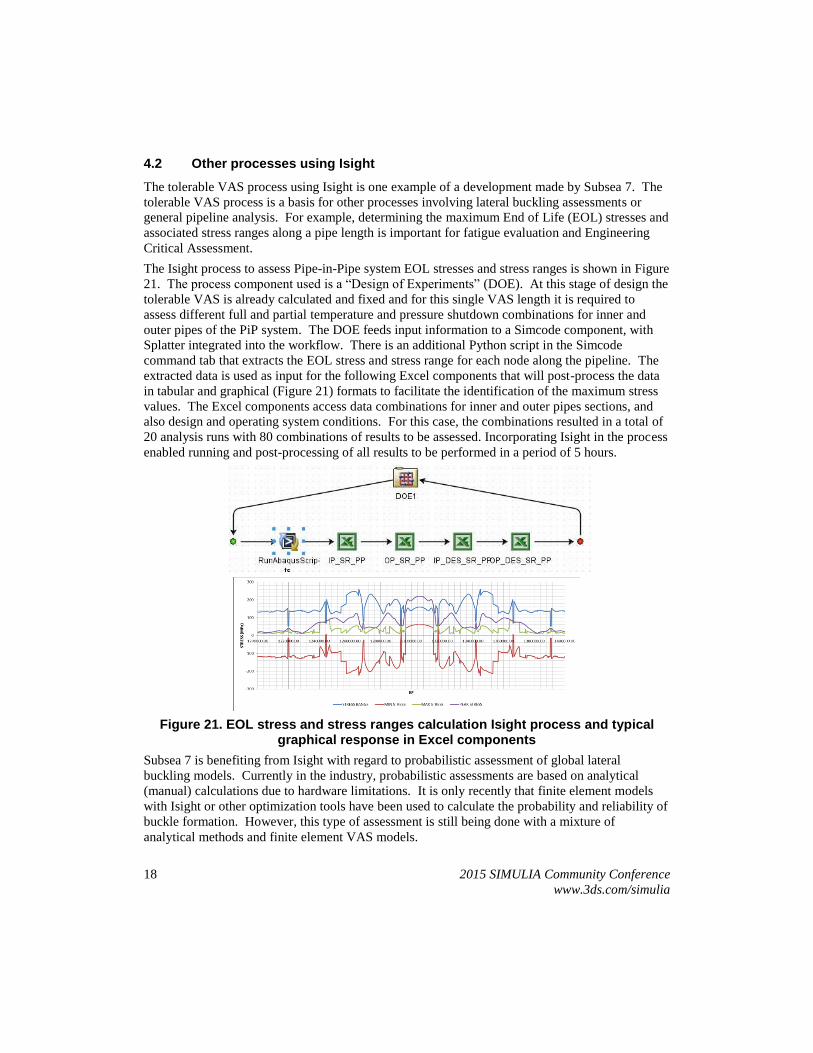
The Isight process to assess Pipe-in-Pipe system EOL stresses and stress ranges is shown in Figure
21. The process component used is a “Design of Experiments” (DOE). At this stage of design the
tolerable VAS is already calculated and fixed and for this single VAS length it is required to
assess different full and partial temperature and pressure shutdown combinations for inner and
outer pipes of the PiP system. The DOE feeds input information to a Simcode component, with
Splatter integrated into the workflow. There is an additional Python script in the Simcode
command tab that extracts the EOL stress and stress range for each node along the pipeline. The
extracted data is used as input for the following Excel components that will post-process the data
in tabular and graphical (Figure 21) formats to facilitate the identification of the maximum stress
values. The Excel components access data combinations for inner and outer pipes sections, and
also design and operating system conditions. For this case, the combinations resulted in a total of
20 analysis runs with 80 combinations of results to be assessed. Incorporating Isight in the process
enabled running and post-processing of all results to be performed in a period of 5 hours.
Figure 21. EOL stress and stress ranges calculation Isight process and typical graphical response in Excel components
Subsea 7 is benefiting from Isight with regard to probabilistic assessment of global lateral
buckling models. Currently in the industry, probabilistic assessments are based on analytical
(manual) calculations due to hardware limitations. It is only recently that finite element models
with Isight or other optimization tools have been used to calculate the probability and reliability of
buckle formation. However, this type of assessment is still being done with a mixture of
analytical methods and finite element VAS models.
2015 SIMULIA Community Conference 19
www.3ds.com/simulia
Subsea 7 is developing probabilistic assessments using full route-length models including all man-
made triggers, initial out-of-straightness variations, and seabed unevenness. The reasoning for
using global models is that pipeline-seabed interaction, as-laid horizontal and vertical out-of-
straightness and buckle-site interaction may affect significantly the overall response.
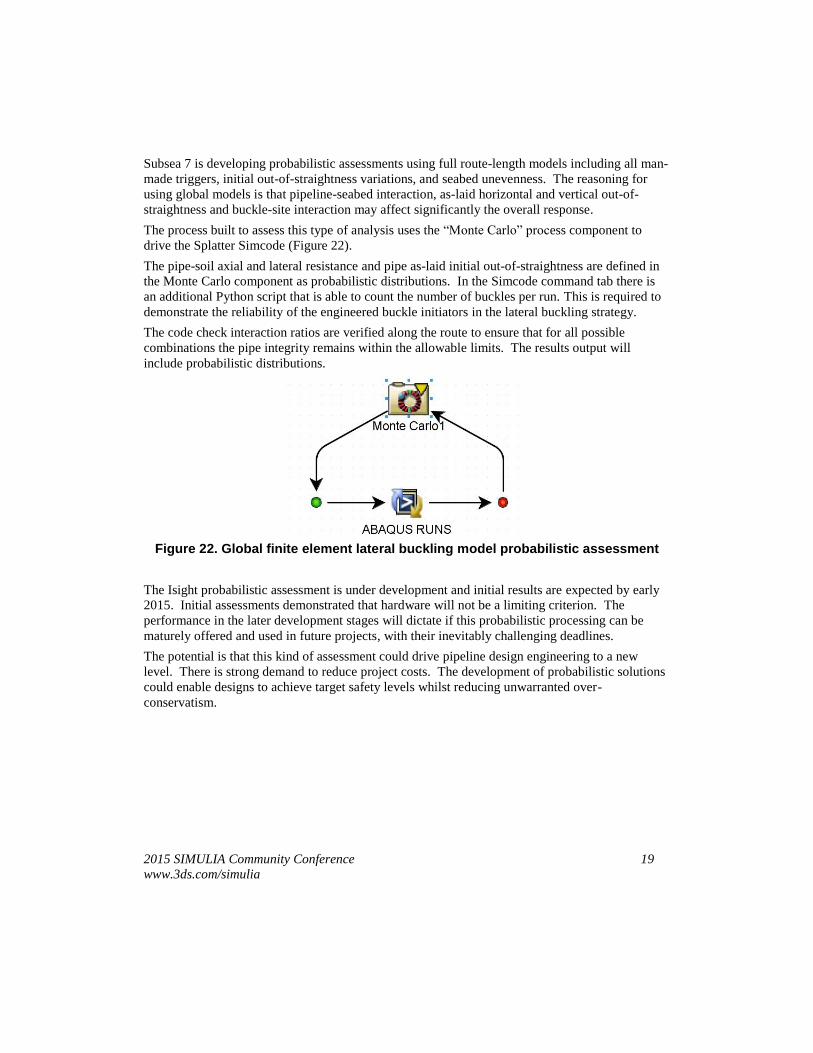
The process built to assess this type of analysis uses the “Monte Carlo” process component to
drive the Splatter Simcode (Figure 22).
The pipe-soil axial and lateral resistance and pipe as-laid initial out-of-straightness are defined in
the Monte Carlo component as probabilistic distributions. In the Simcode command tab there is
an additional Python script that is able to count the number of buckles per run. This is required to
demonstrate the reliability of the engineered buckle initiators in the lateral buckling strategy.
The code check interaction ratios are verified along the route to ensure that for all possible
combinations the pipe integrity remains within the allowable limits. The results output will
include probabilistic distributions.
Figure 22. Global finite element lateral buckling model probabilistic assessment
The Isight probabilistic assessment is under development and initial results are expected by early
2015. Initial assessments demonstrated that hardware will not be a limiting criterion. The
performance in the later development stages will dictate if this probabilistic processing can be
maturely offered and used in future projects, with their inevitably challenging deadlines.
The potential is that this kind of assessment could drive pipeline design engineering to a new
level. There is strong demand to reduce project costs. The development of probabilistic solutions
could enable designs to achieve target safety levels whilst reducing unwarranted over-
conservatism.
20 2015 SIMULIA Community Conference
www.3ds.com/simulia
5. Conclusions
Lateral buckling of subsea pipelines may incur a high engineering cost during the
detailed design stage, depending on the complexity of the production requirements,
terrain and pipeline characteristics. Pipeline design engineers rely on finite element
analysis to assess the lateral buckling phenomenon.
Subsea 7 has developed the Splatter software to enhance the efficiency in constructing,
running and post-processing Abaqus lateral buckling models.
Splatter standardizes finite element models and output including graphical interpretation,
based on engineers’ experiences and best practice.
Splatter is fully parameterized and the architecture works easily with Simulia’s Isight
software.
Isight workflows have been implemented to determine tolerable pipeline VAS lengths as
a basis for all types of lateral buckling models.
Automation with Isight can result in significant hours saved compared to manual
processing.
Isight allows a wide envelope of input variables to be assessed resulting in a richer set of
results compared to deterministic assessments that are frequently used in the industry.
The next step will be the probabilistic assessment of global finite element models which
may result in output that demonstrates realistic pipeline responses and which fully satisfy
target safety levels whilst minimizing unwarranted over-conservatism.
6. References
1. DNV, “Submarine Pipeline Systems - DNV-OS-F101”, Norway, 2013
2. Carr M., Sinclair F., Bruton D., “Pipeline Walking – Understanding the Field Layout
Challenges, and Analytical Solutions Developed for the SAFEBUCK JIP”, OTC 17945, May
2006.
3. Hobbs R.E., “In Service Buckling of Heated Pipelines”, Journal of Transportation
Engineering, Vol. 110, No 2, March 1984.
4. Hobbs R.E. and Liang F., “Thermal Buckling of Pipelines Close to Restraints”, Eighth
International Conference on Offshore Mechanics and Arctic Engineering, The Hague,
Volume 5, pp 121-127, 1989.
5. SAFEBUCK JIP, “Safe Design of Pipelines with Lateral Buckling – SAFEBUCK III”, United
Kingdom, 2011