Embed Size (px)
Citation preview
Increasing Nighttime Seatbelt Usage Rates: An Evaluation of Enforcement, Education,
and Outreach Strategies Shashi Nambisan
Jerry Everett, Matt Cate
Center for Transportation Research University of Tennessee, Knoxville
Tennessee Section ITE Spring 2015 Meeting
Kingsport, TN May 21, 2015
2
Project Overview
• 3-year CDC funded research project • Additional support from TN GHSO • Target age group: 16-34 year olds • Study area: 5 east TN counties + control county • Community support/participation is key • Lessons learned to be shared across US

3
Study Setting and Potential Observation Sites

4
Seatbelts Save Lives
• Use of seatbelts save > 15,000 annually • Statewide ave. daytime SB use rate in TN ~88 % • Nighttime seatbelt usage rate ~ 15 % lower • Studies show that about half of TN highway
traffic crash fatalities are unbuckled • => 50% of the traffic fatalities come from 12% of
our population

5
TN Seat Belt Usage 2000-2014
35%
40%
45%
50%
55%
60%
65%
70%
75%
80%
85%
90%
95%
2000 2001 2002 2003 2004 2005 2006 2007 2008 2009 2010 2011 2012 2013 2014
Usa
ge R
ate
Year
All Vehicles
Cars
Pickup Trucks
Vans
SUVs

6
Average: TN vs National
0
10
20
30
40
50
60
70
80
90
10020
03
2004
2005
2006
2007
2008
2009
2010
2011
2012
2013
Tennessee
National Avg

7
CTR Survey Research Findings
Seat belt usage tends to be lower for those • With a high school education or less (vs. college) • Who are black or Asian (vs. Caucasian) • Who are between the ages of 18-45 • Who earn less than $30K/year • Who drive pick up trucks

8
• Develop, implement, and evaluate a pilot program which o combines increased targeted nighttime seatbelt use enforcement and o broad community-based outreach & education (O&E) activities including
paid media campaigns
• Assess how such interventions o affect nighttime seatbelt usage rates and impaired driving o are related to socio-demographic, spatial, and temporal characteristics o affect other traffic violations o are related to other societal indicators of public safety o influence morbidity and mortality due to such crashes
Project Aims

9
• Centers for Disease Control and Injury Prevention • Prof. Mack Shelley, Iowa State University (Statistician) • Tombras, Knoxville, TN (Advertising and media) • Law Enforcement Agencies: State and Local • TDOT and TDOS • Hospitality industry • University of Tennessee
o Athletics, Greek Communities, College of Business, ITE Student Chapter
• Colleges and High-Schools • Health Departments and Programs • Arenas, Coliseums, Stadia • Conventions and Professional Sports: Baseball, Hockey • Others??: Regal Cinemas, UT Honors Council, Retail outlets
Collaborators and Partners

10
Study Area: All MV Citations
0
5,000
10,000
15,000
20,000
25,000
30,000
2003 2004 2005 2006 2007 2008 2009 2010 2011 2012
All C
itatio
ns
Year (2003 - 2012)
Blount Knox Loudon Roane Sevier Rutherford

11
Study Area: Seat Belt Citations
0
500
1000
1500
2000
2500
2003 2004 2005 2006 2007 2008 2009 2010 2011 2012
Num
ber o
f Sea
t Bel
t Cita
tions
Year (2003-2012)
Blount Knox Loudon Roane Sevier Rutherford

12
Study Area: % Seat Belt Citations
0.0%
2.0%
4.0%
6.0%
8.0%
10.0%
12.0%
14.0%
16.0%
18.0%
20.0%
2003 2004 2005 2006 2007 2008 2009 2010 2011 2012
% C
itatio
ns Is
sued
for R
estr
aint
Law
Vio
latio
ns
Year (2003 - 2012)
Blount Knox Loudon Roane Sevier Rutherford

14
Crash Rates Per 100,000 Drivers
0
0.1
0.2
0.3
Blount Knox Loudon Roane Sevier Rutherford
Rat
e
Fatal Crash Rate
0
5
10
15
Blount Knox Loudon Roane Sevier Rutherford
Rat
e
Injury Crash Rate

15
• Phased approach for targeted nighttime enforcement activities and O&E efforts
o Coordinate schedules for broadcast and social media based O&E efforts with existing efforts
• Targeted enforcement activities similar to those for DUI enforcement
o saturation patrols
o check-points
• Typical timeline for enforcement activities and O&E intervention
Intervention and Evaluation
16
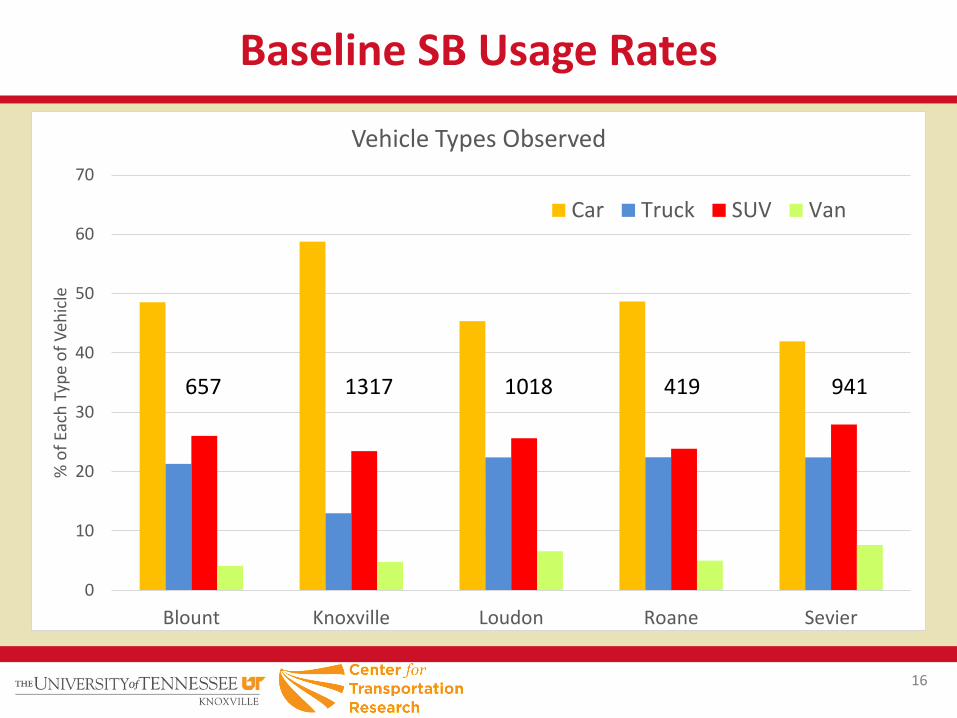
Baseline SB Usage Rates
0
10
20
30
40
50
60
70
Blount Knoxville Loudon Roane Sevier
% o
f Eac
h Ty
pe o
f Veh
icle
Vehicle Types Observed
Car Truck SUV Van
657 1317 1018 419 941

17
Baseline SB Usage Rates: By Gender
0
10
20
30
40
50
60
70
80
90
100
Blount Knoxville Loudon Roane Sevier All
% o
f Driv
ers B
elte
d
Seat Belt Usage Based - County
% of Male Drivers Belted % of Female Drivers Belted

18
Baseline SB Usage Rates: By County
0
20
40
60
80
100
Blount Knoxville Loudon Roane Sevier All
% o
f Driv
ers B
elte
d
Seat Belt Usage - Counties
Car Truck SUV Van All Vehicle

19
Baseline SB Usage Rates: By Vehicle Type
0%
10%
20%
30%
40%
50%
60%
70%
80%
90%
Car Truck SUV Van All Vehicle
% o
f Driv
ers B
elte
d
Vehicle Type
Blount Knoxville Loudon Roane Sevier All

20
Schedule
Activity 2014 2015
Dec Jan Feb Mar April May June July Aug Sept Oct Nov Dec
Intercept/Phone Surveys
Seatbelt Surveys Pilot Before During After/Before After Before After Before After After
Before
GHSO Campaigns CIOT Summer Heat
Law Enforcement Activity
Advise
Backup
Assist with Data Collection
Additional locations
Saturation Patrols
Check Points
Outreach & Education
Broadcast Media
Targeted Digital Media Pilot Test
Community-based Pilot Test
Social Media

21
Evaluation
• Observational seatbelt surveys • Telephone/Web surveys • Citation tracking • Local assessments • Statistical Analysis

23
Revealed vs Stated Behavior