Embed Size (px)
Citation preview

2016 Disparities in Care
Increasing Health Equity in Washington State
www.wacommunitycheckup.org

For more about the Alliance:
www.WashingtonHealthAlliance.org
For the Community Checkup report:
www.WACommunityCheckup.org
Disparities in Care 2016 Report
Page 2
2
Table of Contents
Background 3
Key findings 7
Accessing care 7
Asthma 12
Behavioral health 12
Cardiovascular disease 14
Diabetes care 15
Generic prescription drugs 17
Health screenings 19
Potentially avoidable care 22
Language barriers 23
Summary look across all measures: Comparing care for Medicaid, Medicare and commercial enrollees 27
Resources 30
About the data 30
Understanding the measures 31
Acknowledgements 34
Contact Information 34

For more about the Alliance:
www.WashingtonHealthAlliance.org
For the Community Checkup report:
www.WACommunityCheckup.org
Disparities in Care 2016 Report
Page 3
3
Background This is the fourth year that the Washington Health Alliance has identified health disparities among minority populations in Washington state. In an effort to educate our community partners and inspire strategic efforts to reduce these disparities, this report identifies some gaps in care at a statewide level. These data are intended to inform stakeholders as they allocate resources and pursue interventions to improve healthcare. Perhaps even more importantly, this conversation about the state of health in our communities will spur discussion of concrete ways to improve our delivery system so that all patients receive quality care, and ultimately, have better health outcomes.
It is critical that we address barriers to care given that the uninsured are less likely to have a regular doctor or to get timely and routine care, and are more likely to be hospitalized for preventable conditions, when compared with the insured population.2 Thus, expansions to health insurance coverage like Medicaid and Medicare are of particular importance to determine whether and when people get necessary medical care. Medicaid enrollees have distinctly higher rates of poverty, chronic illness, and disability than the commercially insured population. Having health insurance is important and Medicaid increases access to care, health care use and lowers costs.3
About this report
To produce this report, the Alliance stratified Medicaid claims data used to produce its annual report, the Community Checkup. Data from the 2016 report with a measurement year of July 1, 2014 through June 30, 2015, were stratified by race, ethnicity, and language (REL). The REL categories are those selected and used by the Centers for Medicare & Medicaid Services, with each broad category representing many different population groups—likely representing huge variation among populations that are not accounted for in this report. Our analysis currently only looks at the Medicaid-insured population because commercial plans in Washington state do not consistently capture REL data in a standardized way to allow for a comparison across the commercially insured population. This year, we are very pleased to partner with Qualis Health, which has provided the Alliance with data for Medicare fee-for-service beneficiaries for six measures. This combination of data adds an additional element to inform how clinicians serving our community can better target improvement efforts.
The measures referred to in this report help to quantify and track the quality of health care services provided throughout our health care system. They include
1 U.S. Centers for Disease Control and Prevention. Promoting Health Equity: A resource to help communities address social determinants of health. http://www.cdc.gov/nccdphp /dch/programs/healthycommunitiesprogram/tools/pdf/SDOH-workbook.pdf. 2008 2 Kaiser Family Foundation. Eliminating Racial/Ethnic Disparities in Health Care: What are the Options? http://kff.org/disparities-policy/issue-brief/eliminating-racialethnic-disparities-in-health-care-what/#back2. 2008. 3 Kaiser Family Foundation. What is Medicaid's Impact on Access to Care, Health Outcomes, and Quality of Care? http://kff.org/report-section/what-is-medicaids-impact-on-access-to-care-health-outcomes-and-quality-of-care-setting-the-record-straight-on-the-evidence-issue-brief/. 2013
HEALTH DISPARITIES refer to population-specific differences in the presence of disease, health outcomes, or access to healthcare. Some groups are more likely to be affected by disparities, including ethnic and racial
minorities, the elderly, or persons with disabilities, an
inadequate level of education or living in poverty. Disparities occur across a broad range of dimensions and reflect a complex set of individual, social, and environmental factors. Such factors make it more difficult to understand and navigate
the health care system and limit one’s ability to communicate effectively with health care professionals.
HEALTH EQUITY, therefore,
can be achieved when health
disparities are eliminated
and no one is disadvantaged
from achieving their health
potential from social, race or
geographical circumstances.1

For more about the Alliance:
www.WashingtonHealthAlliance.org
For the Community Checkup report:
www.WACommunityCheckup.org
Disparities in Care 2016 Report
Page 4
4
data associated with clinicians’ ability to provide high-quality health care or relate to long-term goals for quality health care.4
The figures in this report highlight care by REL and provide an overview of the percentage of patients by the county in which they receive specific care relative to the statewide Medicaid or Medicare rate, when available. Ratings of “Better” “Average” or “Worse” are color-coded to indicate the rate in relation to the statewide average. Green=the rate is significantly better than the Medicaid or Medicare statewide rate; Gray=the rate is not significantly different from the statewide average; Red=the rate is significantly worse than the statewide average; Yellow=there are too few cases (<160) to report. More information on the methods, population included and measure descriptions can be found at the end of this report.
Disparities in care: at the intersection of priorities
Achieving equity in health care is essential to successfully achieving the Institute of Healthcare Improvement’s Triple Aim—improving the experience of care and health of a population while lowering per capita cost. By focusing on reducing disparities, health providers, health plans and community organizations work to promote equity and improve the overall quality of health care while also providing care that is personalized and meaningful.
Demographic shift
U.S. Census Bureau projections estimate that racial and ethnic minority populations will comprise a majority of the U.S. population by 2044.5
Washington state is experiencing unprecedented growth in language diversity. The foreign-born population in our state grew by 54 percent in the years 2000-2014.6 It is estimated that 46.7 percent of Washington’s total foreign-born population is limited in English-proficiency (LEP).7
o Individuals who primarily speak a language other than English are less likely to have health insurance, see a health provider regularly, or follow instructions for medical care and are more likely frequent emergency departments or other safety net options.8
o While Spanish is the predominant home language of LEP families, more than 60 other languages are spoken by large numbers of LEP families in
4 Centers for Medicare & Medicaid Services. Clinical Quality Measures Basics. www.cms.gov/regulations-and-guidance/legislation/ehrincentiveprograms/clinicalquality measures.html. 2015. 5 Colby S, Ortman J. Projections of the Size and Composition of the U.S. Population: 2014 to 2060, Current Population Reports, P25-1143, U.S. Census Bureau, Washington, DC, 2014. http://www.census.gov/content/dam/Census/library/publications/2015/demo/p25-1143.pdf 6 Migration Policy Institute. Washington State Immigration Data Profile. http://www.migrationpolicy.org/data/state-profiles/state/demographics/WA. 2014 7 Office of the Education Ombuds. Providing Language Access Services for Limited English Proficient Parents in Washington Schools. http://oeo.wa.gov/wp-content/uploads/Language-Access-Report-Binder-January-20-2015.pdf. 2015 8 Washington Health Benefit Exchange Language Access Plan. http://www.wahbexchange.org/wp-content/uploads/2015/08/671411165305_Draft_-_Language_Acess_Plan_EB_092514.pdf. September 2014

For more about the Alliance:
www.WashingtonHealthAlliance.org
For the Community Checkup report:
www.WACommunityCheckup.org
Disparities in Care 2016 Report
Page 5
5
Washington. In total, over 200 different languages are spoken in homes across the state.9
o The concentrations of population by race and origin across Washington state are quite varied. In 2015, King County had the largest percentage of Asian populations (58.6 percent), Black or African American populations (49.4 percent) and American Indian or Alaska Native populations (16.7 percent). Outside of King County, the largest proportion of the American Indian and Alaska Native population are found in Yakima County at 11.2 percent and Pierce County at 10.4 percent.10
Figure 1. Percentage of State Population by Race and Hispanic Origin: 2015.11
About Medicaid results
The most recent data in this Disparities in Care report reflects the full enrollment due to Medicaid expansion under the Affordable Care Act. (The previous report only captured six months of expanded enrollment.) This report, also for the first time, fully captures Medicaid enrollees in Medicaid managed care organizations (MCOs).
Besides dramatically increasing the number of people in Washington covered under Medicaid, the expansion may have an impact on the results in this report. For example, some measures in this report require continuous enrollment over a period of time in order for a patient to be included in results. Moreover, as the
9 Washington State Office of the Education Ombuds. Providing Language Access Services for Limited English Proficient Parents in Washington Schools. http://oeo.wa.gov/wp-content/uploads/Language-Access-Report-Binder-January-20-2015.pdf. January 16, 2015 10 Washington State Office of Financial Management. Executive Summary: Washington State Population by Race and Hispanic Origin: 2010 and 2015. http://www.ofm.wa.gov/pop/asr/sade/ofm_pop_race_2010_and_2015_summary.pdf 11 Source: Executive Summary Population by Race and Hispanic Origin: 2010 and 2015. http://www.ofm.wa.gov/pop/asr/sade/ofm_pop_race_2010_and_2015_summary.pdf

For more about the Alliance:
www.WashingtonHealthAlliance.org
For the Community Checkup report:
www.WACommunityCheckup.org
Disparities in Care 2016 Report
Page 6
6
health care system works to absorb this large number of new patients, some results may be affected as patients seek access to a limited number of providers.
Because of these transitional issues, results for Medicaid enrollees in the current report may not necessarily reflect future results.
Impact of Medicaid expansion under the Affordable Care Act (ACA)
Washington state Medicaid expansion, known as Apple Health, offers a unique opportunity to increase coverage among low-income populations of which some racial and ethnic populations are disproportionately represented. And Apple Health had a profound impact on the uninsured rate. For example, the number of Washingtonians without health insurance has dropped from 16.8 percent to 6.4 percent from 2013 to 2015 with an estimated 1,776,851 people covered by Medicaid as of June 2016.12
Research suggests that Medicaid expansion has helped to reduce income- and race-based coverage disparities.13 Additional research indicates that Medicaid expansion improves the affordability of care and financial security among the low-income population.14 Analyses find positive effects of expansion on multiple economic outcomes, despite Medicaid enrollment growth initially exceeding projections in many states.15
Review of key measures in this report
In a review of key measures of importance such as cancer screenings, diabetes, and access to care, Medicaid enrollees receive lower rates of effective care.
Locally, breast cancer is the most frequently diagnosed cancer among women and is the second leading cause of cancer death among women. Washington ranks as one of the top 10 states in the country for newly diagnosed invasive breast cancers16 and colon cancer is the second leading cause of cancer deaths that affect men and women.17
o Given the importance of screenings for breast, cervical and colon cancer, more can be done to raise the statewide Medicaid rates. Screening rates have lagged up to 23 percentage points behind the statewide commercial rates since the 2013 reporting year.
o Since the 2013 reporting year, fewer than half of patients 51-58 years of age received a recommended colon cancer screening. For reporting years 2013-2016, the statewide Medicaid rate for this measure has hovered between
12 Norris, Louise. https://www.healthinsurance.org/washington-medicaid/. September 26, 2016. 13 Courtemanche, Marton, Ukert, Yelowitz, and Zapata, Impacts of the Affordable Care Act on Health Insurance Coverage in Medicaid Expansion and Non-Expansion States (Working Paper No. 22182, The National Bureau of Economic Research, April 2016) and Buchmueller, Levinson, Levy, and Wolfe, “Effect of the Affordable Care Act on Racial and Ethnic Disparities in Health Insurance Coverage,” American Journal of Public Health. May 2016. 14 Benitez, Creel, and Jennings, “Kentucky’s Medicaid Expansion Showing Early Promise on Coverage and Access to Care,” Health Affairs. February 2016. 15 Kaiser Family Foundation. The Effects of Medicaid Expansion under the ACA: Findings from a Literature Review. http://kff.org/medicaid/issue-brief/the-effects-of-medicaid-expansion-under-the-aca-findings-from-a-literature-review/. June 20, 2016. 16 Washington State Department of Health. Female Breast Cancer. http://www.doh.wa.gov/YouandYourFamily/WomensHealth/Cancer. 2016 17 Washington State Department of Health. Colon Cancer. http://www.doh.wa.gov/YouandYourFamily/ IllnessandDisease/Cancer/ColonCancer. 2016
For more about the Alliance:
www.WashingtonHealthAlliance.org
For the Community Checkup report:
www.WACommunityCheckup.org
Disparities in Care 2016 Report
Page 7
7
35-43 percent, well below the commercial rate of 51-63 percent for the same reporting time frame.
People with diabetes have a higher risk of blindness than those without diabetes.18 Therefore, the CDC recommends that people with diabetes have a dilated eye exam each year.19 As Figure 10 on page 16 shows, both the statewide Medicaid and Medicare rates for the measure looking at eye exams for diabetics are lower than the statewide commercial rates, by 12 and 19 percentage points, respectively.
A call to action
The following data demonstrate that racial, ethnic and economic disparities are indeed a problem in Washington state. The Alliance hopes that these findings will contribute to a continuing call to action that will lead to effective quality improvement efforts to improve the health of all the people in our state. Successful strategies to improve disparities not only incorporate a disparities-in-care lens throughout an organization but are supported by significant system-wide, person-focused care reforms.
The sooner health care organizations successfully address disparities in care, the better they will be positioned in this increasingly and rapidly changing landscape that places a greater emphasis on effective population health management. Strategies on how delivery systems can focus on disparities in care can be found in the Resources section on page 30.
Key findings: Accessing care Access to care measures look at utilization for patients who are enrolled in a health plan and who saw their primary health care provider during the measurement time period.
Access to quality primary care is likely to increase preventive care, improve health, lower costs and help avoid unnecessary visits to the emergency room.20 Studies show that Medicaid patients have a harder time accessing primary and specialty care physicians. As such, when they are admitted to hospitals they are often admitted with more serious conditions that those with commercial insurance.21 According to the U.S. Department of Health and Human Services’
18 American Diabetes Association. http://www.diabetes.org/living-with-diabetes/complications/eye-complications/. 2016 19 The U.S. Centers for Disease Control. Keep an Eye on Your Vision Health. http://www.cdc.gov/features/healthyvision/. 2016 20 Starfield B, Shi L, Macinko J. Contribution of Primary Care to Health Systems and Health. The Milbank Quarterly. 2005;83(3):457-502. doi:10.1111/j.1468-0009.2005.00409.x. 21 Dayaratna, Kevin D. Studies Show: Medicaid Patients Have Worse Access and Outcomes than the Privately Insured. The Heritage Foundation. http://thf_media.s3.amazonaws.com/2012/pdf/bg2740.pdf. 2012

For more about the Alliance:
www.WashingtonHealthAlliance.org
For the Community Checkup report:
www.WACommunityCheckup.org
Disparities in Care 2016 Report
Page 8
8
Agency for Healthcare Research and Quality (AHRQ)22, good access to care requires three discrete steps:
1. Gaining entry into the health care system. 2. Getting access to sites of care where patients can receive needed
services. 3. Finding providers who meet the needs of individual patients and with
whom patients can develop a relationship based on mutual communication and trust.
Interesting findings
Medicaid and Medicare enrollees access primary health care services less than commercially insured enrollees.
At 71 percent, adults ages 20-44 years old have the lowest rates of accessing care compared to other Medicaid enrollees. Children ages 2-6 years and adults ages 45-64 years also have low rates, both at 75 percent.
Black or African American enrollees had an 8 percentage point increase in access to primary care rates in those patients ages 12-19 years as compared with rates reported in 2015.
Figure 2. Accessing primary care among Medicaid enrollees, by racial/ethnic group, July 2014-June 2015. Green=rate is significantly better than Medicaid statewide rate; Gray=not
significantly different; Red=significantly worse; Yellow= too few cases to report. Color rankings based on Wilson Score Interval statistical test.
ACCESS TO CARE: Percentage of patients who had a primary care visit during 2014-2015 measurement year
Statewide Results (all races) American Indian
and Alaska Native
Asian Black or African
American
Hispanic or
Latino
Native Hawaiian and Other
Pacific Islander
White
Medicaid Commercial
Ages 12–24 months 89% 98% 94% 85% 87% 90% 85% 87%
Ages 2–6 years 75% 89% 82% 68% 70% 75% 66% 76%
Ages 7–11 years 86% 90% 88% 83% 84% 88% 77% 87%
Ages 12–19 years 86% 90% 90% 81% 85% 88% 79% 87%
Ages 20–44 years 71% 92% 83% 67% 74% 77% 67% 76%
Ages 45–64 years 75% 96% 86% 70% 72% 74% 68% 74%
Ages 65+ years 84% 98% * * * * * *
*Did not meet public reporting denominator minimum (<160) threshold requirements.
22 U.S. Department of Health and Human Services Agency for Healthcare Research and Quality. Access to Health Care. National Healthcare Quality Report, 2011. http://www.ahrq.gov/research/findings/nhqrdr/nhqr11/chap9.html.

For more about the Alliance:
www.WashingtonHealthAlliance.org
For the Community Checkup report:
www.WACommunityCheckup.org
Disparities in Care 2016 Report
Page 9
9
Figure 3. Accessing primary care among Medicare enrollees,** by racial/ethnic group, July 2014-June 2015. Green=rate is significantly better than Medicaid statewide rate; Gray=not
significantly different; Red=significantly worse; Yellow= too few cases to report. Color rankings based on Wilson Score Interval statistical test
ACCESS TO CARE: Percentage of patients who had a primary care visit during 2014-2015 measurement year
Statewide Results (all races) American Indian
and Alaska Native
Asian Black or African
American
Hispanic or
Latino
White
Medicare Commercial
Ages 20–44 years 80% 92% 80% 75% 74% 79% 81%
Ages 45–64 years 83% 96% 87% 80% 80% 87% 84%
Ages 65+ years 79% 98% 76% 47% 68% 63% 82%
**Medicare is available for certain people with disabilities who are under age 65. These individuals must have received Social Security Disability benefits for 24 months or have End Stage Renal Disease (ESRD) or Amyotropic Lateral Sclerosis (ALS, also known as Lou Gehrig's disease).
Figure 4 below shows the following:
Native Hawaiian and Other Pacific Islanders have the lowest rates compared to other racial/ethnic groups.
American Indian and Alaska Natives have the highest access to care rates across the racial/ethnic groups noted in this report. The rate for those aged 12-19 matches the rate for those commercially insured, 90 percent.
Across all racial/ethnic groups, children between 2-6 years old and adults ages 20-44 years have the lowest rates compared to other age categories.
Figure 4. Accessing primary care among Medicaid enrollees, by age group and racial/ethnic group, July 2014-June 2015.
60%
65%
70%
75%
80%
85%
90%
95%
100%
12-24months
2-6years
7-11years
12-19years
20-44years
45-64years
American Indian and AlaskaNative
Asian
Black or African American
Commercial
Hispanic or Latino
Native Hawaiian and OtherPacific Islander
Medicaid
White

For more about the Alliance:
www.WashingtonHealthAlliance.org
For the Community Checkup report:
www.WACommunityCheckup.org
Disparities in Care 2016 Report
Page 10
10
The two county-level figures on the next page provide examples of the variation in access to care found across the counties of Washington state. Figure 5 on the next page shows a 25 percentage point difference from the highest and lowest performing counties (Adams 86 percent and Island 61 percent) in access to primary care for Medicaid enrollees ages 20-44. Figure 6 shows a 14 percentage point gap between the highest and lowest performing counties (Pend Oreille 89 percent and Pierce 75 percent) for those Medicare enrollees. These are people with disabilities who are under age 65 who have received Social Security Disability benefits for 24 months or have End Stage Renal Disease (ESRD) or Amyotropic Lateral Sclerosis (ALS, also known as Lou Gehrig's disease).
Looking at the figures, some of the counties have similar rates yet appear to be different relative to the state average. For example, Figure 5 presents both Franklin and Walla Walla counties with a rate of 75 percent. Franklin is green while Walla Walla is grey. This means that the confidence interval range for Franklin County was completely above the state rate of 71 percent, making the results statistically different; whereas the confidence interval range for Walla Walla County includes the state’s average rate and therefore is not statistically different.

For more about the Alliance:
www.WashingtonHealthAlliance.org
For the Community Checkup report:
www.WACommunityCheckup.org
Disparities in Care 2016 Report
Page 11
11
Figure 5. Access to primary care among Medicaid enrollees (ages 20-44 years), county rates compared to statewide Medicaid rate (71%), July 2014-June 2015. Color rankings based on Wilson Score Interval statistical test.
Figure 6. Access to primary care among Medicare enrollees (ages 20-44 years), county rates compared to statewide Medicare rate (80%), July 2014-June 2015. Color rankings based on Wilson Score Interval statistical test.

For more about the Alliance:
www.WashingtonHealthAlliance.org
For the Community Checkup report:
www.WACommunityCheckup.org
Disparities in Care 2016 Report
Page 12
12
Asthma The asthma measure is intended to improve the diagnosis and care of those with asthma, including how often those with persistent asthma were prescribed appropriate asthma medication and remained on their medication at least 50% of the time.
Figure 7 below displays the rates across racial/ethnic groups for the measure “managing medications for people with asthma” among Medicaid enrollees. Statewide, Medicaid enrollees have lower rates as compared to the commercial rate.
Figure 7. Managing medications for people with asthma among Medicaid enrollees, by racial/ethnic group, July 2014-June 2015. Green=rate is significantly better
than Medicaid statewide rate; Gray=not significantly different; Red=significantly worse; Yellow= too few cases to report. Color rankings based on Wilson Score Interval statistical test.
RACIAL/ETHNIC GROUP Asthma
Managing medications for people with asthma
Statewide Medicaid (all races) 60%
Statewide commercial (all races) 67%
American Indian and Alaska Native 55%
Asian 59%
Black or African American 56%
Hispanic or Latino 54%
Native Hawaiian and Other Pacific Islander * *
White 63%
*Did not meet public reporting denominator minimum (<160) threshold requirements.
Behavioral health The behavioral health measures look at those patients newly diagnosed with major depression and their adherence to antidepressant medication at 12 weeks and 6 months.
Increasingly, Washington state is focused on better integration of physical and behavioral health. This reflects a goal of more systematic coordination of care with a focus on the whole person. One aspect of behavioral health care is getting access to, and properly using, medication. Some illnesses, such as major depression, require that patients use medication for several months or years, and

For more about the Alliance:
www.WashingtonHealthAlliance.org
For the Community Checkup report:
www.WACommunityCheckup.org
Disparities in Care 2016 Report
Page 13
13
others require lifelong medication.23 Noncompliance of treatment can have serious consequences, such as relapse or recurrence of the illness. Therefore, enhancing medication compliance (or preventing noncompliance) is an important treatment goal for patients and clinicians.24
Interesting findings
Figure 8 shows a 14 percentage point difference between the commercial and Medicaid rates for the two antidepressant medication measures discussed in this report. These measures look at the number of patients, newly diagnosed with depression, who were prescribed an antidepressant medication and remained on the medication for the prescription duration. The figure below shows the rates across racial/ethnic groups.
Figure 8. Staying on antidepressant medication (12 weeks and 6 months) among Medicaid enrollees, by racial/ethnic group, July 2014-June 2015. Green=rate is significantly better than Medicaid statewide rate; Gray=not significantly different; Red=significantly worse; Yellow= too few cases to report. Color rankings based on Wilson Score Interval statistical test.
RACIAL/ETHNIC GROUP Behavioral Health
Staying on antidepressant medication (12 weeks)
Staying on antidepressant medication (6 months)
Statewide Medicaid (all races) 58% 42%
Statewide commercial (all races) 72% 56%
American Indian and Alaska Native 56% 42%
Asian * *
Black or African American 51% 32%
Hispanic or Latino 49% 33%
Native Hawaiian and Other Pacific Islander * *
White 64% 48%
*Did not meet public reporting denominator minimum (<160) threshold requirements.
23 Lin Elizabeth H.B., et al. The Role of the Primary Care Physician in Patients’ Adherence to Antidepressant Therapy. Med Care, 1995;33:67. 24 Balon, Richard. Managing Compliance. http://www.psychiatrictimes.com/articles/managing-compliance. 2002

For more about the Alliance:
www.WashingtonHealthAlliance.org
For the Community Checkup report:
www.WACommunityCheckup.org
Disparities in Care 2016 Report
Page 14
14
Cardiovascular disease These four measures focus on patients taking cholesterol-lowering medication as directed, monitoring patients on blood pressure medication and use of generics for cholesterol and high-blood pressure medications.
Cardiovascular disease is the leading cause of death for women and men in the U.S., accounting for one of every three deaths among adults.25 It is the second leading cause of death in Washington state, resulting in the deaths of one in five women and one in four men.26 Older adults, men, American Indians and Alaska Natives, Native Hawaiians and other Pacific Islanders, and people in lower socioeconomic positions experience higher rates of coronary heart disease than others.27
Interesting findings
Figure 9 on the next page displays rates for the cardiovascular measures by racial/ethnic group. Of the groups noted in this report, Black or African American Medicaid enrollees surpass the statewide Medicaid rate for the measure monitoring patients on high-blood pressure medication by 6 percentage points. This is good news given that the prevalence of high blood pressure in African-Americans in the United States is among the highest in the world.28
25 Statin Use for the Primary Prevention of Cardiovascular Disease in Adults: US Preventive Services Task Force Recommendation Statement. 2016 Nov 15;316(19):1997-2007. doi: 10.1001/jama.2016.15450. 26 Washington State Department of Health. Heart Disease. www.doh.wa.gov.YouandYourFamily/IllnessandDisease/HeartDisease. 27 Washington State Department of Health. Coronary Heart Disease. www.doh.wa.gov/Portals/1/Documents/5500/CD-HRT2013.pdf. 2013 28 The American Heart Association. High Blood Pressure and African Americans. http://www.heart.org/HEARTORG/Conditions/HighBloodPressure/UnderstandYourRiskforHighBloodPressure/High-Blood-Pressure-and-African-Americans_UCM_301832_Article.jsp#.WEnnPrIrJpg. 2016

For more about the Alliance:
www.WashingtonHealthAlliance.org
For the Community Checkup report:
www.WACommunityCheckup.org
Disparities in Care 2016 Report
Page 15
15
Figure 9. Cardiovascular disease care measures among Medicaid enrollees, by racial/ethnic group, July 2014-June 2015. Green=rate is significantly better than Medicaid
statewide rate; Gray=not significantly different; Red=significantly worse; Yellow= too few cases to report. Color rankings based on Wilson Score Interval statistical test.
RACIAL/ETHNIC GROUP Cardiovascular disease
Generics for cholesterol-
lowering medication
Generics for high-blood pressure
medication
Monitoring patients on high-blood pressure
medication
Taking cholesterol
medication as directed
Statewide Medicaid (all races) 96% 99% 82% 57%
Statewide commercial (all races) 92% 97% 82% 76%
American Indian and Alaska Native 91% 99% * *
Asian 97% 99% * *
Black or African American 99% 100% 88% *
Hispanic or Latino 97% 100% 87% 50%
Native Hawaiian and Other Pacific Islander
98% 100% * *
White 93% 99% 84% 61%
*Did not meet public reporting denominator minimum (<160) threshold requirements.
Diabetes care Diabetes measures look at how often patients with diabetes are receiving recommended care, including eye exams, kidney disease screening and blood sugar testing, all of which are essential for disease management.
In Washington state the prevalence of diabetes has approximately doubled in the past 20 years.29 Currently this disease affects more than half a million residents.30 There are disparities according to race and ethnicity, with diabetes more prevalent among American Indians and Alaska Natives, Latinos, and Black or African American adults than among White and Asian adults.31 Diabetes rates are higher among low-income Washington residents, most likely because they have less access to health care and healthy living choices.32
29 The State of Obesity. Diabetes in the United States. http://stateofobesity.org/diabetes/. 2015 30 Washington State Department of Health. Diabetes. http://www.doh.wa.gov/portals/1/documents/5500/cd-diab2014.pdf. 2014 31 Washington State Department of Health (2013). Diabetes. http://www.doh.wa.gov/Portals/1/Documents/5500/CD-DIAB2014.pdf 32 Washington State Department of Health. Diabetes Epidemic & Action Report. http://www.doh.wa.gov/Portals/1/Documents/Pubs/345-342-DiabetesEpidemicActionReport.pdf. 2014

For more about the Alliance:
www.WashingtonHealthAlliance.org
For the Community Checkup report:
www.WACommunityCheckup.org
Disparities in Care 2016 Report
Page 16
16
Interesting findings
Given the high rates of diabetes in Washington, the 27 percentage point difference between the Medicaid and commercial rates for the blood sugar testing measure is concerning. Only breast cancer screenings had a wider disparity between the Medicaid and commercial rates.
Figure 10 shows the variation among racial/ethnic groups across the diabetes measures. Of note is the diabetes eye exam measure which has the lowest rates of the diabetes measures and the largest variation across racial/ethnic groups (31 percentage points).
o Fewer than half of Hispanic or Latino Medicaid patients with diabetes are screened for eye disease, compared to 63 percent for the state average.
o The rate of 79 percent of American Indian and Alaska Native patients with diabetes receiving eye exams is a positive trend given that they are at increased risk of developing diabetic eye disease.33
Figure 10. Diabetes care measures among Medicaid and Medicare enrollees, by racial/ethnic group, July 2014-June 2015. Green=rate is significantly better than Medicaid
statewide rate; Gray=not significantly different; Red=significantly worse; Yellow= too few cases to report. Color rankings based on Wilson Score Interval statistical test.
RACIAL/ETHNIC GROUP Diabetes
Blood sugar (HbA1c) test
Eye exam
Kidney disease screening
Statewide commercial (all races)
90% 75% 86%
Statewide
(all races)
Medicaid Medicare Medicaid Medicare Medicaid Medicare
63% 91% 63% 56% 71% 73%
American Indian and Alaska Native 80% 85% 79% 50% 78% 76%
Asian * 93% * 57% * 75%
Black or African American 84% 87% 52% 52% 77% 77%
Hispanic or Latino 84% 92% 48% 52% 74% 77%
Native Hawaiian and Other Pacific Islander
84% N/A 50% N/A 83% N/A
White 82% 91% 50% 57% 72% 73%
*Did not meet public reporting denominator minimum (<160) threshold requirements.
Figure 11 on the next page compares the results for blood sugar tests across three reporting years, including the 2014, 2015 and 2016 Disparities reports. It shows
33 The National Institutes for Health. National Eye Institute. https://nei.nih.gov/sites/default/files/nehep-pdfs/AIAN_DED_drop-in%20article_2014.pdf. 2014

For more about the Alliance:
www.WashingtonHealthAlliance.org
For the Community Checkup report:
www.WACommunityCheckup.org
Disparities in Care 2016 Report
Page 17
17
that the statewide Medicaid rate has dropped by 24 percentage points. Asians are not represented in the chart below given there were too few cases (<160) in 2016 to report.
Figure 11. Diabetes care over time: Blood sugar (HbA1c) tests among Medicaid enrollees for reporting years 2014-2016.
Generic prescription drugs These measures look at the percentage of generic drugs prescribed when common medications have well-established generic options. Increasing the use of generic drugs when appropriate increases affordability for patients, which is an important contributor to adherence to medication as prescribed.
Generic prescription measures look at how clinics and communities approach ways to control costs and improve quality of care. Patients may be more likely to adhere to their recommended drug regimen if the medicine is more affordable.34
Interesting findings
This is a domain in which Medicaid rates often outperform those for the commercially insured. This is important to note given that, as seen in this report, rates of care for Medicaid enrollees are consistently lower than for commercial enrollees on most measures, an indication of gaps in the care received.
34 National Community Pharmacists Association. Medication Adherence in America. A National Report Card. http://www.ncpanet.org/pdf/reportcard/AdherenceReportCard_Full.pdf. 2013
60%
65%
70%
75%
80%
85%
90%
95%
100%
2014 2015 2016
American Indian and AlaskaNative
Black or African American
Commercial
Hispanic or Latino
Native Hawaiian and OtherPacific Islander
Medicaid
White

For more about the Alliance:
www.WashingtonHealthAlliance.org
For the Community Checkup report:
www.WACommunityCheckup.org
Disparities in Care 2016 Report
Page 18
18
Figure 12. Access to generic prescription drugs among Medicaid enrollees, by racial/ethnic group, July 2014-June 2015. Green=rate is significantly better than Medicaid
statewide rate; Gray=not significantly different; Red= significantly worse. Color rankings based on Wilson Score Interval statistical test.
RACIAL/ETHNIC GROUP Generic Prescription Drugs
ADHD medication
Antacid medication
Antidepressant medication
Cholesterol-lowering drugs
High-blood pressure
medication
Statewide Medicaid (all races) 78% 89% 100% 96% 99%
Statewide commercial (all races) 70% 92% 98% 92% 97%
American Indian and Alaska Native 82% 93% 99% 91% 99%
Asian 89% 94% 100% 97% 99%
Black or African American 77% 86% 100% 99% 100%
Hispanic or Latino 83% 92% 100% 97% 100%
Native Hawaiian and Other Pacific Islander
81% 92% 99% 98% 100%
White 76% 87% 100% 93% 99%
The following figure for ADHD medications demonstrates how even a moderately high statewide rate of 78 percent for Medicaid enrollees can still leave room for improvement. Variation across counties continues to be high, with a 41 percentage point difference from the highest to lowest performing county (100 percent in San Juan and Wahkiakum Counties to 59 percent in Lincoln County).

For more about the Alliance:
www.WashingtonHealthAlliance.org
For the Community Checkup report:
www.WACommunityCheckup.org
Disparities in Care 2016 Report
Page 19
19
Figure 13. ADHD medication generic prescriptions among Medicaid enrollees, county rates compared to statewide Medicaid rate (78 percent), July 2014-June 2015. Color rankings based on Wilson Score Interval statistical test.
Health screenings Health screening measures are based on nationally agreed-upon standards
of care for specific age groups. For example, well-child visits for children ages 3-6 years and adolescent well-care visits, breast cancer screenings for women 52-74 years of age, cervical cancer screenings for women 21-64 years of age, chlamydia screenings for sexually active women between 16-24 years of age and colon cancer screenings for individuals 50-75 years of age.
Regular visits for children and adolescents are important given the rapid growth and development occurring during childhood. Such visits are a key time for physicians to assess a child’s growth, development, oral health, vision and hearing. At the same time, doctors also deliver evidence-based and age-appropriate vaccines to prevent childhood disease and administer screenings to prevent problems and keep children healthy.
Regular cancer screenings are important for early detection of abnormal tissue or cancer, before a person has any symptoms. Early detection is especially significant considering Washington’s high rates of breast and colon cancers.

For more about the Alliance:
www.WashingtonHealthAlliance.org
For the Community Checkup report:
www.WACommunityCheckup.org
Disparities in Care 2016 Report
Page 20
20
Interesting findings
The Medicaid rates are lower than commercial rates for all of the cancer screenings discussed in this report, ranging from a 20 to 48 percentage point difference.
Figure 14 on the following page shows the variation in cancer screenings across racial/ethnic groups among Medicaid and Medicaid enrollees.
o Fewer than half of age-eligible patients are receiving recommended colon cancer screenings.
o Cancer screenings in women represent vast opportunities for improvement. Cervical cancer screenings are 20 percentage points lower for Medicaid enrollees than that for the commercial population and vary by 11 percentage points across racial/ethnic groups.
o Breast cancer screening rates for the Medicaid population are 48 percentage points lower than that seen for commercial population. The Medicare rate for breast cancer screenings is 33 percentage points higher than the Medicaid rate, with a 12 percentage point difference across racial/ethnic groups.
o At 51 percent, the Medicaid rate for chlamydia screenings outperforms the commercial (39 percent) statewide rate, which is the inverse for what is found among cancer screenings. However, there is much variation across racial/ethnic groups, with a 16 percentage point difference between the highest rates for Black or African-Americans (61 percent) and the lowest rates for Asians (45 percent).

For more about the Alliance:
www.WashingtonHealthAlliance.org
For the Community Checkup report:
www.WACommunityCheckup.org
Disparities in Care 2016 Report
Page 21
21
Figure 14. Health screenings among Medicaid and Medicare enrollees, by racial/ethnic group, July 2014-June 2015. Green=rate is significantly better than Medicaid
statewide rate; Gray=not significantly different; Red= significantly worse; Yellow= too few cases to report. Color rankings based on Wilson Score Interval statistical test.
RACIAL/ETHNIC GROUP
Health Screenings
Adolescent well-care
visits
Breast cancer screening
Cervical cancer
screening
Chlamydia screening
Colon cancer screening
Well-child visits
Statewide commercial (all races)
44% 75% 75% 39% 63% 73%
Statewide
(all races)
Medicaid Medicaid Medicare Medicaid Medicaid Medicaid Medicare Medicaid
41% 27% 60% 55% 51% 43% 43% 58%
American Indian and Alaska Native
41% * 49% 56% 55% * 38% 55%
Asian 43% * 49% 67% 45% * 35% 57%
Black or African American
45% * 52% 67% 61% 37% 39% 56%
Hispanic or Latino 42% * 53% 67% 53% 45% 33% 58%
Native Hawaiian and Other Pacific Islander
44% * N/A 62% 54% * N/A 57%
White 40% 60% 61% 63% 49% 45% 44% 58%
*Did not meet public reporting denominator minimum (<160) threshold requirements.
With Medicaid and commercial rates for adolescent well-care visits at 41 and 44 percent, respectively, Washington state can improve. Rates for well-child visits (ages 3-6 years) are also low across the Medicaid population at 58 percent, 15 percentage points lower than the commercial rate. With fewer than half of adolescents receiving well-care visits, there is much room for improvement. As seen in Figure 15 on the next page, rates for adolescent well-care visits range from 25 percent (Clark County) to 56 percent (Lincoln County), with 17 counties statistically significant lower than the overall Medicaid rate.

For more about the Alliance:
www.WashingtonHealthAlliance.org
For the Community Checkup report:
www.WACommunityCheckup.org
Disparities in Care 2016 Report
Page 22
22
Figure 15. Adolescent well-care visits, county rates compared to the statewide Medicaid rate (41%), June 2014-July 2015. Color rankings based on Wilson Score Interval
statistical test.
.
Potentially avoidable care In health care, some services are provided more often than are necessary, and that can do more harm than good. More care is not always better. Some examples of potentially avoidable care include: taking antibiotics when you don’t need them, receiving imaging (X-rays, MRIs or CT) for low-back pain or going to the emergency room for problems that don’t require special care.
Interesting findings:
Figure 16 on the next page displays the rates across racial/ethnic groups for potentially avoidable care. With a statewide Medicaid rate of 30 percent, four percentage points below the commercial rate, Washington state can do more to reduce the amount of antibiotics prescribed for acute bronchitis. On a positive note, the Medicaid rate for avoiding antibiotics of children with upper respiratory infections is equal to that of commercial enrollees, 93 percent. For both these measures, higher rates are better, indicating more people are not being prescribed unnecessary medication. This helps to reduce spending and the potential of drug-resistant infections.

For more about the Alliance:
www.WashingtonHealthAlliance.org
For the Community Checkup report:
www.WACommunityCheckup.org
Disparities in Care 2016 Report
Page 23
23
Figure 16. Potentially avoidable care among Medicaid enrollees, by racial/ethnic group, July 2014-June 2015. Green=rate is significantly better than Medicaid statewide rate; Gray=not
significantly different; Red= significantly worse; Yellow= too few cases to report. Color rankings based on Wilson Score Interval statistical test.
RACIAL/ETHNIC GROUP
Potentially Avoidable Care
Appropriate testing
for children with
sore throat
Avoiding antibiotics for
adults with acute bronchitis
Avoiding antibiotics for children with
upper respiratory infections
Avoiding X-ray, MRI and CT scan for low-back pain
Potentially avoidable ER visits
Statewide Medicaid (all races)
66% 30% 93% 77% 19%
Statewide commercial (all races)
77% 34% 93% 80% 10%
American Indian and Alaska Native
68% * 94% * 19%
Asian 57% * 94% * 17%
Black or African American 70% * 96% 81% 21%
Hispanic or Latino 60% 28% 93% 78% 22%
Native Hawaiian and Other Pacific Islander
* * 96% * 21%
White 67% 29% 92% 76% 18%
*Did not meet public reporting denominator minimum (<160) threshold requirements.
Language barriers The following language categories are those used by Medicaid during enrollment to capture language preferences among enrollees. The below categories are but a small representation of the vast number of languages used across Washington state. However, the information highlights how care may differ according to language preference.
The effectiveness of communication between patients and their providers can have a major effect on quality and health outcomes. Limited English proficiency can be a barrier to effective communication, making patients less likely to seek and receive needed care, and raise costs.35
There is significantly much less data for language performance rates than there are for race/ethnicity rates. For many of the measures discussed in this report
35 Brach C, Fraser I, and Paez K. Crossing the Language Chiasm. Health Affairs. 24:(2); 424-434. 2005

For more about the Alliance:
www.WashingtonHealthAlliance.org
For the Community Checkup report:
www.WACommunityCheckup.org
Disparities in Care 2016 Report
Page 24
24
there are too few cases (<160); therefore, the following focuses on those for which there the Alliance has sufficient data.
Interesting findings: Language and accessing primary care
Enrollees who self-selected Spanish as their primary language had higher than average rates for many measures, most notably:
Access to primary care ages 12-19, 20-44, and 65+
Blood sugar testing and kidney screening for people with diabetes
Monitoring patients on high blood pressure medications
As seen in figure 17 below, there was a significant drop across all access to care rates for Asian and Pacific Island language speakers when compared to our 2015 report.
Figure 17. Access of care, Asian and Pacific Island language speakers, by age, July 2012-July 2013 compared with July 2014-June 2015.
50%
65%
80%
95%
12–24 months
2–6 years
7–11 years
12–19 years
20–44 years
45-64years
2015
2016

For more about the Alliance:
www.WashingtonHealthAlliance.org
For the Community Checkup report:
www.WACommunityCheckup.org
Disparities in Care 2016 Report
Page 25
25
Figure 18 below shows the variation across access to care, stratified by language for Medicaid enrollees. Access to care rates for Medicaid enrollees selecting Other Indo-European and Asian and Pacific Island languages are, on average, between 11 and 20 percentage points lower than those selecting Spanish and English as their primary language.
Figure 18. Access to care among Medicaid enrollees, by language, July 2014-June 2015. Green=rate is significantly better than Medicaid statewide rate; Gray=not significantly different;
Red= significantly worse; Yellow= too few cases to report. Color rankings based on Wilson Score Interval statistical test.
QUALITY MEASURE Statewide commercial
(all languages)
Statewide Medicaid
(all languages)
Asian and Pacific Island
Languages
English Other Indo-European languages
Other languages
Spanish
Access to Care
Access to primary care (ages 12-24 months) 98% 89% 79% 88% 79% 85% 90%
Access to primary care (ages 2-6 years) 89% 75% 60% 75% 63% 68% 73%
Access to primary care (ages 7-11 years) 90% 86% 84% 86% 69% 82% 89%
Access to primary care (ages 12-19 years) 90% 86% 78% 86% 70% 78% 88%
Access to primary care (ages 20- 44 years) 92% 71% 60% 76% 62% 76% 78%
Access to primary care (ages 45-64 years) 96% 75% 70% 74% 67% 74% 73%
Access to primary care (ages 65+ years) 98% 84% * 88% * 97% *
*Did not meet public reporting denominator minimum (<160) threshold requirements
Figures 19 and 20 on the following pages show the statewide Medicaid and Medicare rates for five measures, and by language for Medicaid enrollees only.

For more about the Alliance:
www.WashingtonHealthAlliance.org
For the Community Checkup report:
www.WACommunityCheckup.org
Disparities in Care 2016 Report
Page 26
26
Figure 19. Asthma, cardiovascular disease, diabetes care and health screenings with statewide Medicaid and Medicare rates, by language for Medicaid enrollees, July 2014-June 2015. Green=rate is significantly better than Medicaid statewide rate;
Gray=not significantly different; Red= significantly worse; Yellow= too few cases to report. Color rankings based on Wilson Score Interval statistical test.
QUALITY MEASURE Statewide Medicare
(all languages
Statewide Medicaid
(all languages)
Asian and Pacific Island
languages
English Other Indo-European languages
Other languages
Spanish
Asthma
Managing medications for people with asthma N/A 60% * 62% * * 50%
Cardiovascular Disease
Cholesterol-lowering medication generic prescriptions N/A 96% 96% 94% 95% 98% 97%
High-blood pressure medication generic prescriptions N/A 99% 100% 99% 96% 98% 99%
Monitoring patients on high-blood pressure medications
N/A 82% * 84% * * 90%
Taking cholesterol-lowering medications as directed N/A 57% * 59% * * 49%
Diabetes
Blood sugar (HbA1c) test 91% 63% * 82% * * 90%
Eye exam 56% 63% * 52% * * 51%
Kidney disease screening 73% 71% * 74% * * 80%
Health Screenings
Adolescent well-care visits N/A 41% 40% 41% 34% 39% 44%
Breast cancer screening 60% 27% * 59% * * *
Cervical cancer screening N/A 55% 66% 64% 63% 65% 64%
Chlamydia screening N/A 51% * 52% * * 49%
Colon cancer screening 43% 43% * 43% * * *
Well-child visits (ages 3-6 years) N/A 58% 49% 58% 45% 50% 59%
For more about the Alliance:
www.WashingtonHealthAlliance.org
For the Community Checkup report:
www.WACommunityCheckup.org
Disparities in Care 2016 Report
Page 27
27
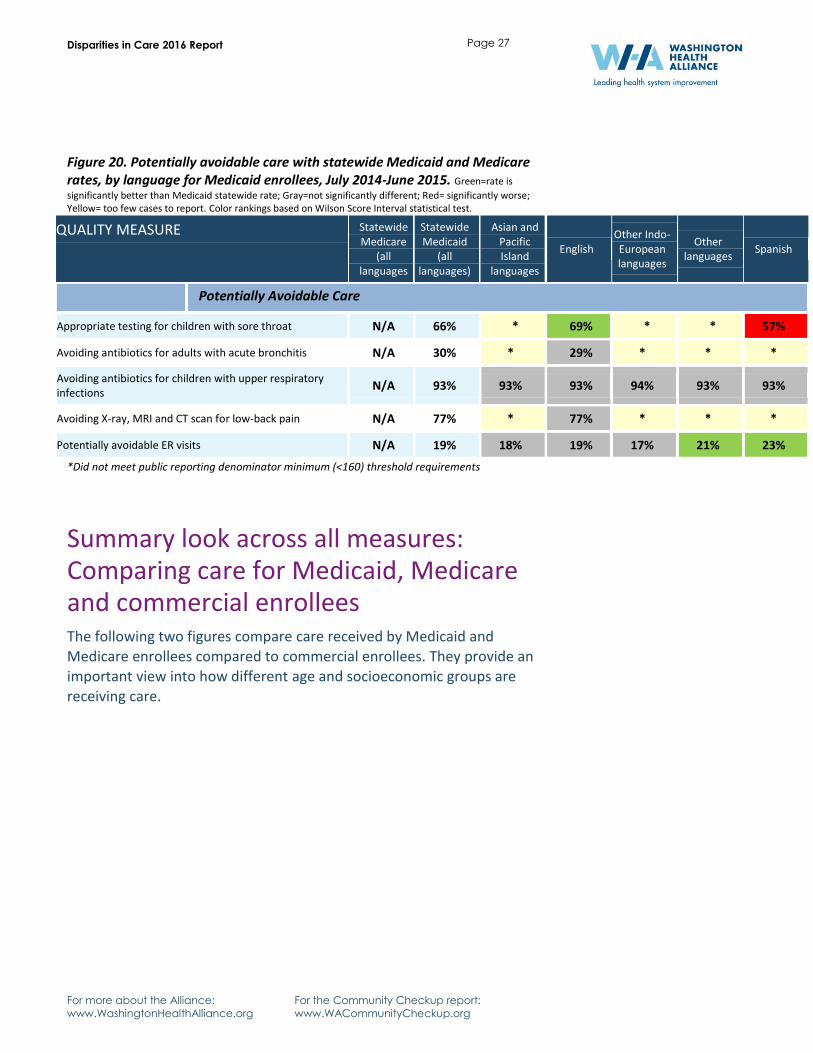
Figure 20. Potentially avoidable care with statewide Medicaid and Medicare rates, by language for Medicaid enrollees, July 2014-June 2015. Green=rate is
significantly better than Medicaid statewide rate; Gray=not significantly different; Red= significantly worse; Yellow= too few cases to report. Color rankings based on Wilson Score Interval statistical test.
QUALITY MEASURE Statewide Medicare
(all languages
Statewide Medicaid
(all languages)
Asian and Pacific Island
languages
English Other Indo-European languages
Other languages
Spanish
Potentially Avoidable Care
Appropriate testing for children with sore throat N/A 66% * 69% * * 57%
Avoiding antibiotics for adults with acute bronchitis N/A 30% * 29% * * *
Avoiding antibiotics for children with upper respiratory infections
N/A 93% 93% 93% 94% 93% 93%
Avoiding X-ray, MRI and CT scan for low-back pain N/A 77% * 77% * * *
Potentially avoidable ER visits N/A 19% 18% 19% 17% 21% 23%
*Did not meet public reporting denominator minimum (<160) threshold requirements
Summary look across all measures: Comparing care for Medicaid, Medicare and commercial enrollees The following two figures compare care received by Medicaid and Medicare enrollees compared to commercial enrollees. They provide an important view into how different age and socioeconomic groups are receiving care.

For more about the Alliance:
www.WashingtonHealthAlliance.org
For the Community Checkup report:
www.WACommunityCheckup.org
Disparities in Care 2016 Report
Page 28
28
Figure 21. Medicaid and Medicare enrollees compared to commercially insured populations, July 2014–June 2015. Medicare rate shown only for where there is data. Green=rate is
significantly better than Medicaid statewide rate; Gray=not significantly different; Red= significantly worse. Color
rankings based on Wilson Score Interval statistical test, P-value= 0.05.
QUALITY MEASURE (MEASURE DESCRIPTIONS CAN BE FOUND ON PAGE 31-33)
STATEWIDE
MEDICAID
RATE
STATEWIDE
MEDICARE
RATE
STATEWIDE
COMMERCIAL
RATE
Access to Care
Access to primary care (ages 12–24 months) 89% 98%
Access to primary care (ages 2–6 years) 75% 89%
Access to primary care (ages 7–11 years) 86% 90%
Access to primary care (ages 12–19 years) 86% 90%
Access to primary care (ages 20–44)** 71% 80% 92%
Access to primary care (ages 45–64) 75% 83% 96%
Access to primary care (ages 65+) 84% 79% 98%
Asthma
Managing medications for people with asthma 60% 67%
Behavioral Health
Antidepressant medication (12 weeks) 58% 72%
Antidepressant medication (6 months) 42% 56%
Cardiovascular Disease
Cholesterol-lowering medication generic prescriptions 96% 92%
High-blood pressure medication generic prescriptions 99% 97%
Monitoring patients on high-blood pressure medications 82% 82%
Taking cholesterol-lowering medications as directed 57% 76%
Diabetes
Blood sugar (HbA1c) test 63% 91% 90%
Eye exam 63% 56% 75%
Kidney disease screening 71% 73% 86%
** Medicare is available for certain people with disabilities who are under age 65. These individuals must have received Social Security Disability benefits for 24 months or have End Stage Renal Disease (ESRD) or Amyotropic Lateral Sclerosis (ALS, also known as Lou Gehrig's disease).

For more about the Alliance:
www.WashingtonHealthAlliance.org
For the Community Checkup report:
www.WACommunityCheckup.org
Disparities in Care 2016 Report
Page 29
29
Figure 22. Medicaid and Medicare enrollees compared to commercially insured populations, July 2014–June 2015. Medicare rate shown only for where there is data. Green=rate is
significantly better than Medicaid statewide rate; Gray=not significantly different; Red= significantly worse. Color
rankings based on Wilson Score Interval statistical test, P-value= 0.05.
QUALITY MEASURE (MEASURE DESCRIPTIONS CAN BE FOUND ON PAGE 31-33)
STATEWIDE
MEDICAID
RATE
STATEWIDE
MEDICARE
RATE
STATEWIDE
COMMERCIAL
RATE
Generic Prescription Drugs
ADHD medication generic prescriptions 78% 70%
Antacid medication generic prescriptions 89% 92%
Antidepressant medication generic prescriptions 100% 98%
Cholesterol-lowering medication generic prescriptions 96% 92%
High-blood pressure medication generic prescriptions 99% 97%
Health Screenings
Adolescent well-care visits 41% 44%
Breast cancer screening 27% 60% 75%
Cervical cancer screening 55% 75%
Chlamydia screening 51% 39%
Colon cancer screening 43% 43% 63%
Well-child visits 58% 73%
Medication Safety
Monitoring patients on high-blood pressure medications 82% 82%
Taking cholesterol-lowering medications as directed 57% 76%
Taking diabetes medications as directed 45% 65%
Taking hypertension medications as directed 59% 79%
Potentially Avoidable Care
Appropriate testing for children with sore throat 66% 70%
Avoiding antibiotics for adults with acute bronchitis 30% 34%
Avoiding antibiotics for children with upper respiratory infections 93% 93%
Avoiding X-ray, MRI and CT scan for low-back pain 77% 80%
Potentially avoidable ER visits 19% 10%
For more about the Alliance:
www.WashingtonHealthAlliance.org
For the Community Checkup report:
www.WACommunityCheckup.org
Disparities in Care 2016 Report
Page 30
30
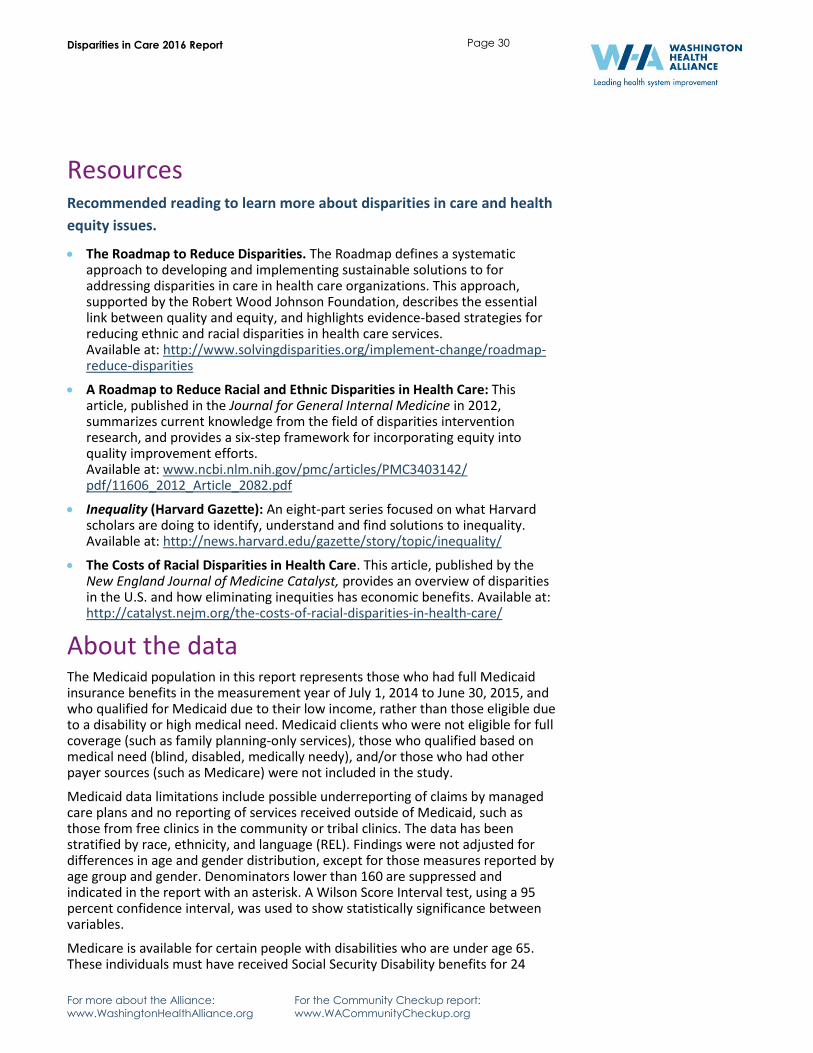
Resources Recommended reading to learn more about disparities in care and health
equity issues.
The Roadmap to Reduce Disparities. The Roadmap defines a systematic approach to developing and implementing sustainable solutions to for addressing disparities in care in health care organizations. This approach, supported by the Robert Wood Johnson Foundation, describes the essential link between quality and equity, and highlights evidence-based strategies for reducing ethnic and racial disparities in health care services. Available at: http://www.solvingdisparities.org/implement-change/roadmap-reduce-disparities
A Roadmap to Reduce Racial and Ethnic Disparities in Health Care: This article, published in the Journal for General Internal Medicine in 2012, summarizes current knowledge from the field of disparities intervention research, and provides a six-step framework for incorporating equity into quality improvement efforts. Available at: www.ncbi.nlm.nih.gov/pmc/articles/PMC3403142/ pdf/11606_2012_Article_2082.pdf
Inequality (Harvard Gazette): An eight-part series focused on what Harvard scholars are doing to identify, understand and find solutions to inequality. Available at: http://news.harvard.edu/gazette/story/topic/inequality/
The Costs of Racial Disparities in Health Care. This article, published by the New England Journal of Medicine Catalyst, provides an overview of disparities in the U.S. and how eliminating inequities has economic benefits. Available at: http://catalyst.nejm.org/the-costs-of-racial-disparities-in-health-care/
About the data The Medicaid population in this report represents those who had full Medicaid insurance benefits in the measurement year of July 1, 2014 to June 30, 2015, and who qualified for Medicaid due to their low income, rather than those eligible due to a disability or high medical need. Medicaid clients who were not eligible for full coverage (such as family planning-only services), those who qualified based on medical need (blind, disabled, medically needy), and/or those who had other payer sources (such as Medicare) were not included in the study.
Medicaid data limitations include possible underreporting of claims by managed care plans and no reporting of services received outside of Medicaid, such as those from free clinics in the community or tribal clinics. The data has been stratified by race, ethnicity, and language (REL). Findings were not adjusted for differences in age and gender distribution, except for those measures reported by age group and gender. Denominators lower than 160 are suppressed and indicated in the report with an asterisk. A Wilson Score Interval test, using a 95 percent confidence interval, was used to show statistically significance between variables.
Medicare is available for certain people with disabilities who are under age 65. These individuals must have received Social Security Disability benefits for 24

For more about the Alliance:
www.WashingtonHealthAlliance.org
For the Community Checkup report:
www.WACommunityCheckup.org
Disparities in Care 2016 Report
Page 31
31
months or have End Stage Renal Disease (ESRD) or Amyotropic Lateral Sclerosis (ALS, also known as Lou Gehrig's disease). Approximately 20 percent of the Washington State Medicare population is under 65.
Understanding the measures More on the measure specifications used in the Community Checkup and Disparities in Care reports.
Access to Care
Adult access to primary care, for ages 20 and older as of the last date in the measurement year: measures adults with a preventive care visit in the past year.
Child and adolescent access to primary care, for ages 12 months to 19 years. The number of children ages 12 months to six years with a primary care physician (PCP) visit in the past year, or the number of children ages seven to 19 years with a PCP visit in the past two years.
Asthma
Managing medications for people with asthma, ages 5 to 64 years: measures the number of patients ages 5 to 64 identified as having persistent asthma who were dispensed appropriate medications and remained on them for at least 50 percent of the period between the initial prescription during the measurement year through the end of the measurement year.
Behavioral Health
Staying on antidepressant medication (12 weeks): measures the number of patients ages 18 and older newly diagnosed with depression, who were prescribed (as determined by prescription fills) an antidepressant medication, and remained on an antidepressant during the entire 12 weeks after the diagnosis (i.e. effective acute treatment phase).
Staying on antidepressant medication (6 months): measures the number of patients ages 18 and older newly diagnosed with depression, who were prescribed (as determined by prescription fills) an antidepressant medication drug, and continued taking an antidepressant for at least 6 months (i.e., effective continuation phase).
Cardiovascular Disease
High-blood pressure medication generic prescriptions (antihypertensives): measures the number of prescriptions for antihypertensive drugs (ACE inhibitors and ARB) that were filled with a generic antihypertensive anytime during the one-year measurement period.
Medication safety: monitoring patients on high-blood pressure medications: number of patients 18 years and older who received at least 180 treatment days of ACE inhibitors or ARBs (drugs to help lower blood pressure) during the measurement year and who had at least one monitoring event (serum potassium and serum creatinine) in the measurement year.

For more about the Alliance:
www.WashingtonHealthAlliance.org
For the Community Checkup report:
www.WACommunityCheckup.org
Disparities in Care 2016 Report
Page 32
32
Taking cholesterol-lowering medications as directed: measure focuses on patient adherence to prescribed cholesterol medications by considering the number of days the patient had access to at least one drug in the statin medication class based on the prescription fill date and the days of supply. The proportion of days covered (PDC) rate must be at least 80 percent to meet the numerator.
Diabetes
Blood sugar (HbA1c) testing for people with diabetes: measures number of patients ages 18 to 75 with diabetes (type 1 and type 2) whose blood sugar was tested using an HbA1c test by a doctor or other health care provider at least once in the one-year measurement period.
Eye exam for people with diabetes: measures the number of patients ages 18 to 75 diagnosed with diabetes (type 1 and type 2) who had an eye exam at least once in a two-year period or, if there is evidence of eye disease, during a one-year period. Specifically, the eye exam is a retinal or dilated eye exam by an eye care professional (optometrist or ophthalmologist).
Kidney disease screening for people with diabetes: measures the number of patients ages 18 to 75 with diabetes (type 1 and type 2) who had a kidney screening test or were treated for kidney disease (nephropathy) or who have already been diagnosed with kidney disease, at least once during the one-year measurement period.
Generic Prescription Drugs
ADHD medication generic prescriptions: measures the number of prescriptions for certain ADHD drugs that were filled with a generic drug rather than a brand name drug anytime during the one-year measurement period.
Antacid medication generic prescriptions (proton pump inhibitors): measures the number of prescriptions for antacids to reduce chronic stomach or gastric acid (proton pump inhibitors or PPIs) that were filled with a generic PPI anytime during the one-year measurement period.
Antidepressant medication generic prescriptions: measures the number of prescriptions for antidepressant drugs (all second-generation antidepressants) that were filled with a generic antidepressant anytime during the one-year measurement period.
Cholesterol-lowering medication generic prescriptions (statins): measures the number of all prescriptions for cholesterol-lowering drugs that were filled with a generic drug rather than a brand-name drug anytime during the one-year measurement period.
High-blood pressure medication generic prescriptions (antihypertensives): measures the number of prescriptions for antihypertensive drugs (ACE inhibitors and ARB) that were filled with a generic antihypertensive anytime during the one-year measurement period.

For more about the Alliance:
www.WashingtonHealthAlliance.org
For the Community Checkup report:
www.WACommunityCheckup.org
Disparities in Care 2016 Report
Page 33
33
Health Screenings
Adolescent well-care visits: measures the percentage of adolescents ages 12–21 who had at least one comprehensive well-care visit with a PCP or an OB/GYN practitioner during in the past year.
Breast cancer screening: measures the number of women ages 50 to 74 who had at least one mammogram screening for breast cancer on or between the first day of the year two years prior and the last day of the measurement year.
Cervical cancer screening: measures the number of women ages 21 to 64 who had a Pap test in the past three years (begins at age 24 to allow three year look back), or women 30 to 64 who had a Pap test and HPV test every five years.
Chlamydia screening: measures the number of women ages 16 to 24 who were identified as sexually active and who had at least one test for chlamydia during the measurement year.
Colon cancer screening: measures the number of adults 50 to 75 years of age who had appropriate screening for colorectal cancer with any of the following tests: annual fecal occult blood test; flexible sigmoidoscopy every five years; or colonoscopy every ten years.
Well-child visits, ages 3 - 6: measures the number of children ages three to six who had one or more well-child visits with a primary care provider during the measurement year.
Potentially Avoidable Care
Appropriate testing for children with sore throat: measures the number of children 2-18 years of age who were diagnosed with pharyngitis, dispensed an antibiotic and received a group A streptococcus (strep) test for the episode.
Avoiding antibiotics for adults with acute bronchitis: measures the number of adults ages 18 to 64 diagnosed with acute bronchitis who were not dispensed an antibiotic prescription for three days after diagnosis.
Avoiding antibiotics for children with upper respiratory infections: measures the number of children ages three months to 18 years who went to the doctor for a common cold who were not prescribed an antibiotic for three days after the diagnosis.
Avoiding X-ray, MRI and CT scan for low-back pain: measures the number of patients ages 18 to 50 with a primary diagnosis of low-back pain who did not have any X-ray, or other imaging study (MRI, CT Scan) in the 28 days after they first visited a health care provider due to low-back pain.
Potentially avoidable ER visits: measures the number of potentially avoidable emergency room (ER) visits using the definition of potentially avoidable ER visits originally developed by the Medicaid program for the state of California.

For more about the Alliance:
www.WashingtonHealthAlliance.org
For the Community Checkup report:
www.WACommunityCheckup.org
Disparities in Care 2016 Report
Page 34
34
Acknowledgements This report was prepared by the Washington Health Alliance with special thanks to the Washington State Health Care Authority and Qualis Health for their continued partnership.
The Alliance is grateful to the following data suppliers, who voluntarily shared their data to be used in this report:
Amerigroup Community Health Plan of Washington Coordinated Care Health Molina Healthcare of Washington UnitedHealthCare Community Plan
Contact Information For more information on the Disparities in Care report and related activities, contact Laurie Kavanagh, MPH, at [email protected] or 206-454-2953.

For more about the Alliance:
www.WashingtonHealthAlliance.org
For the Community Checkup report:
www.WACommunityCheckup.org
Disparities in Care 2016 Report
Page 35
35
ABOUT THE ALLIANCE
The Washington Health Alliance brings together those who give, get and pay for health care to create a high-quality, affordable system for the people of Washington state. The Alliance is a nonprofit, nonpartisan organization that shares the most reliable data on health care quality and value in the state to help providers, patients, employers and union trusts make better decisions about health care. Through innovative strategies and initiatives, we help the entire health care system—from exam room to board room—focus on improving quality and value. We are committed to being the catalyst for change for the health care system in Washington. The Alliance is one of 16 organizations that are part of the Robert Wood Johnson Foundation’s Aligning Forces for Quality (AF4Q) initiative.
For more about the Alliance: www.WashingtonHealthAlliance.org
For the Community Checkup report: www.WACommunityCheckup.org