Embed Size (px)
Citation preview
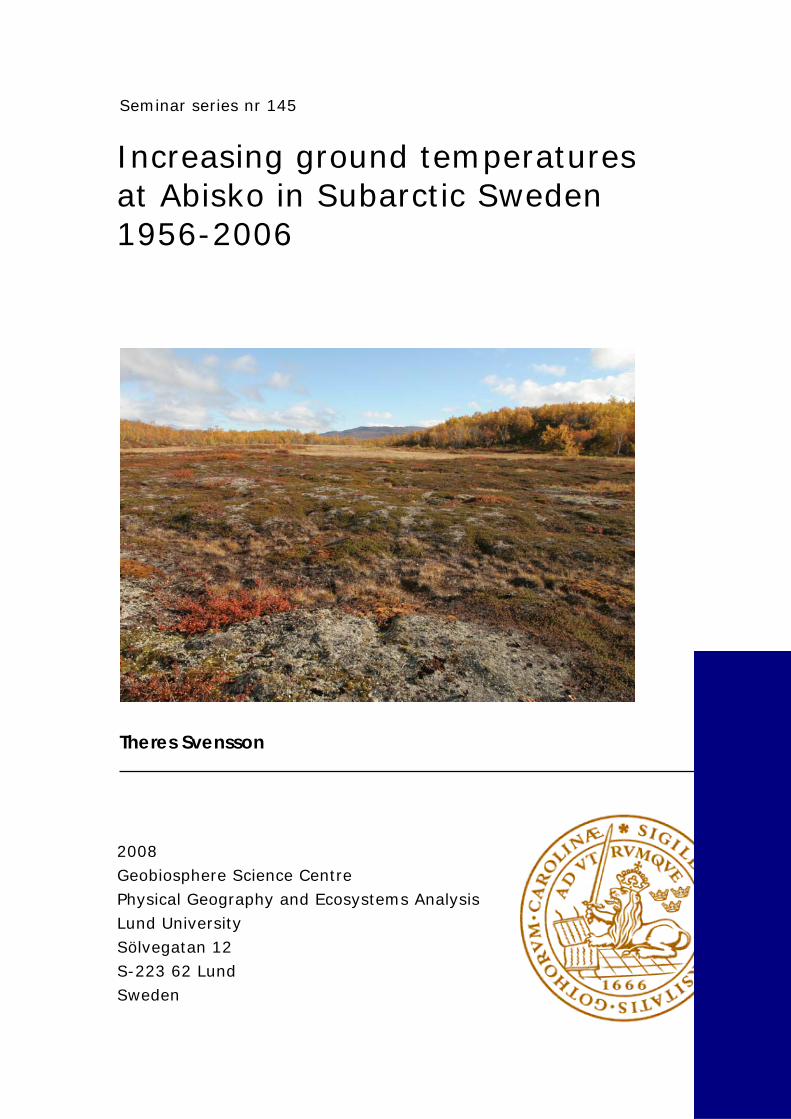
Seminar series nr 145
Increasing ground temperatures at Abisko in Subarctic Sweden 1956-2006 Theres Svensson
2008 Geobiosphere Science Centre Physical Geography and Ecosystems Analysis Lund University Sölvegatan 12 S-223 62 Lund Sweden
Increasing ground temperatures at Abisko in Subarctic Sweden
1956-2006
Theres Svensson
2008
__________________________________________________________
Degree-thesis for Bachelor of Science in Physical Geography and Ecosystem Analysis,
Department of Physical Geography and Ecosystem Analyses, Lund University
Supervisor:
Margareta Johansson, PhD student GeoBiosphere Science Center
Department of Physical Geography and Ecosystem Analyses Lund University
The photograph on the front page is taken by Margareta Johansson, and shows Helikoptermyren (a peat mire at Abisko) in September.
2
Abstract _________________________________________________________________________________ Increasing ground temperatures have been documented all around the Arctic. Ground temperatures are sensitive climate indicators and play an important role in biological and physical processes that occur in soils. Increases in ground temperatures can lead to permafrost thawing which in turn can have profound effects on vegetation, hydrology and infrastructure. Also the greenhouse gas balance can be affected leading to a greater Global Warming Potential, thus representing a positive feedback to climate. Air temperatures and snow depth are the two most important factors controlling ground temperatures, and increases in both air temperatures and snow depth have been reported during the last decades from around the Arctic.
The aim of this study is to investigate if ground temperatures at Abisko in northernmost Sweden are following the increasing trend detected at many sites in the Arctic, to attribute what causes the changes in ground temperatures and to discuss the potential consequences.
Ground temperature data from two sites (one moraine and one peat, at depths of 0.2 m – 1 m) in the Abisko region was used in this study. The data set covers the period 1956-2006 and has not been analysed prior to this study. In order to explain the variance found in ground temperatures correlations with air temperatures and snow depth were done.
This study shows a significant increase in ground temperatures of around 0.3°C per decade on an annual basis, and in all seasons except the summer. In summer, ground temperatures increased by around 0.1 °C per decade (when averaged over the two sites) however this trend was not statistically significant. The observed changes in ground temperatures could be correlated with air temperatures and snow depth, but these two parameters alone could not explain all the variance found in the ground temperatures. Keywords: Geography, Physical Geography, Ground temperatures, Abisko, Subarctic Sweden

3
Sammanfattning _________________________________________________________________________________ Ökande marktemperaturer har rapporterats från hela Arktis. Marktemperaturen är känslig för klimatförändringar och spelar en viktig roll för biologiska och fysiska processer i jorden. I områden med permafrost (mark som är frusen minst två år i följd) kan en ökad marktemperatur leda till att permafrosten tinar, vilket kan få genomgripande konsekvenser på vegetation, hydrologi och infrastruktur. Upptining av permafrosten kan också påverka markens växthusgasutbyte, med en ökad global uppvärmningspotential (Global Warming Potential) som följd. På så sätt genereras en positiv feedback på klimatet. Marktemperaturen styrs i första hand av lufttemperatur och snödjup, och båda dessa parametrar har generellt sett en positiv effekt på marktemperaturen. Ökningar i både lufttemperaturer och snödjup har ägt rum runt om i Arktis under de senaste decennierna.
Syftet med den här studien är att undersöka huruvida marktemperaturerna i Abisko i nordligaste Sverige har följt den ökande trenden som har ägt rum i Arktis, att utreda vad som orsakar marktemperaturförändringarna i Abisko, samt att diskutera de potentiella konsekvenserna av en ökad marktemperatur.
I det här arbetet har marktemperaturdata från 0.2 m – 1 m djup på två olika studieområden (ett moränområde och en torvmyr) i Abiskoområdet analyserats. Dataserien täcker perioden 1956-2006 och har aldrig tidigare blivit analyserad. För att förklara variansen i marktemperatur gjordes korrelationer med lufttemperaturer och snödjup.
Resultaten visar att årsmedelmarktemperaturen har ökat signifikant med cirka 0.3°C per decennium. Ökningarna har skett både på årlig basis och under alla årstider utom sommaren. De största temperaturökningarna ägde rum på torvmyren, och på 0.2 meters djup var ökningarna större än på 0.5 respektive 1 meters djup på båda studieområdena. Under sommaren ökade marktemperaturen i genomsnitt med ungefär 0.1 °C per decennium, men denna trend var inte signifikant. På moränområdet på 0.2 meters djup återfanns en minskande marktemperatur på 0.1°C/decennium vilken dock inte var statistisk signifikant. Förändringarna i marktemperaturer kunde korreleras med förändringar i lufttemperaturer och snödjup, men dessa båda parametrar kunde inte förklara all varians i marktemperaturen. På torvmyren kunde en mindre del av variansen förklaras av lufttemperatur och snödjup än på moränområdet. Sommar och höst var de årstider med allra lägst förklaringsgrad på torvmyren. Nyckelord: geografi, naturgeografi, marktemperatur, klimatförändring, Abisko, Sverige
4
Populärvetenskaplig sammanfattning _________________________________________________________________________________ Global uppvärmning ökar marktemperaturen - en studie från Abisko i nordligaste Sverige Forskare har rapporterat om ökande marktemperaturer runt omkring hela Arktis. I Abisko i nordligaste Sverige finns en femtio år lång mätserie (1956-2006), som aldrig tidigare hade blivit analyserad. I den här studien analyseras denna mätserie och resultatet visar att marktemperaturerna i Abisko har ökat med i genomsnitt 0.3 grader per decennium. Ökningen är signifikant, vilket innebär att den inte skulle kunna ha åstadkommits av en slump. På sommaren var ökningen inte riktigt lika stor, och vad det kan bero är ännu inte undersökt. Marktemperaturen är känslig för klimatförändringar och spelar en viktig roll för biologiska och fysiska processer i jorden. I Arktis är marken frusen även på sommaren, vilket kallas för permafrost. En ökad marktemperatur kan leda till att marken börjar tina på sommaren och detta kan få omfattande konsekvenser för till exempel växtlighet, vattendrag och vägar. Dessutom kan markens utsläpp av växthusgaser öka, vilket innebär att den globala uppvärmningen förvärras. Vad är det då som gör att marktemperaturen ökar? Jo, lufttemperatur och snödjup är de faktorer som i första hand brukar användas för att förklara förändringar i marktemperaturen. Varmare lufttemperatur ger varmare marktemperatur, och ett ökat snödjup innebär att marken blir bättre isolerad och därmed varmare. Ökningar av både lufttemperaturer och snödjup har ägt rum runt om i Arktis under de senaste decennierna. Enligt den här studien kunde ökningar i lufttemperaturer och snödjup i Abisko förklara ökningen av marktemperaturerna där. Men det är inte hela sanningen. Det finns ytterligare faktorer som påverkar marktemperaturerna i Abisko, men dessa har ännu inte blivit undersökta.

5
Table of Contents _________________________________________________________________________________ Introduction.................................................................................................................................. 6 Background: Factors controlling ground temperature ........................................................... 7
Air temperature Snow cover Precipitation Wind Vegetation Topography Glaciers Water bodies Soils Humans
Site description............................................................................................................................. 9
The Abisko region The sites
The moraine site The peat site
Methods ........................................................................................................................................ 11
Monitoring Ground temperature Air temperature Snow depth
Analysing data Trend Analyses Attributing causes of change
Results ........................................................................................................................................... 12
Trends in ground temperature Attributing causes of the observed changes in ground temperature
Air temperature Snow depth
Discussion..................................................................................................................................... 18
Trends Attributing causes of the observed changes
Air temperature Snow depth Other attributing causes
Consequences Conclusions .................................................................................................................................. 21
Future research References..................................................................................................................................... 22 Acknowledgements ..................................................................................................................... 25 All published degree-thesis......................................................................................................... 26
6
Introduction _________________________________________________________________________________ Ground temperatures are a sensitive climate indicator and play an important role in biological and physical processes that occur in soils. In the Arctic and high altitude areas where permafrost (perennial frozen ground that stays frozen for two or more consecutive years) exists, ground temperatures are of major importance. In these areas changes in ground temperatures can change the phase of the ground from frozen to unfrozen, which lead to instability in the ground. This can have profound effects on vegetation, hydrology and infrastructure (ACIA, 2005). In addition, in areas where permafrost exists, carbon is currently stored, but can potentially be released when the permafrost thaws. This would provide a positive feedback through the release of greenhouse gases to the atmosphere.
Air temperatures and snow depth are the two most important factors controlling ground temperatures (Johansson et al. 2008; Josefsson 1990b; Thorn et al. 1999). Increasing air temperatures has been reported during the 20th Century from the Arctic. The increase has however not been uniform throughout the Century, but can be divided into three periods. During the first three decades of the 20th Century a warming period, followed by a cooling period that lasted until around 1980 when a new warming period started (Kungl. Vetenskapsakademien 1989 p 44; Aune 1989). The increase in air temperatures has been twice as high in the Arctic as for the rest of the Northern Hemisphere during the last decades (ACIA 2005), and according to climate models it will continue to rise faster in the Arctic than on the rest of the globe (IPCC 2001; IPCC scenarios A2 and B2; Kattsov et al. 2005 in ACIA 2005). Snow coverage has increased in northern latitudes during the last decades (Brown 2000; Dye 2002; Bamzai 2003). Some studies show that the snow season became shorter during the last decades of the 20th century (Dye 2002; Bamzai 2003), however these results are averaged over very large areas in the Northern hemisphere.
Increasing ground temperatures have been documented all around the Arctic (Isaksen et al. 2007; Romanovsky et al. 2007; Osterkamp and Romanovsky 1999; Walsh et al. 2005). In Northern Scandinavia Isaksen et al. (2007) found increases in ground temperatures in mountain permafrost. Significant warming was detected down to at least 60 m depth. Ground temperature data from lowland areas in northern Fennoscandia is in general underrepresented (Johansson et al 2008).
In this study ground temperatures from two lowland sites in the Abisko region in northernmost Sweden will be presented. Ground temperatures have been monitored since 1956 and measurements were taken approximately every fifth day. The data has not prior been digitised nor analysed.
The aim of this study is to investigate if the ground temperatures in the Abisko area are following the increasing trend detected at many sites in the Arctic, to attribute what causes the changes in ground temperatures (with focus on air temperature and snow depth) and to discuss the potential consequences.
7
Background: Factors controlling ground temperature _________________________________________________________________________________ There are many factors that are of importance for ground temperatures. The most important ones are listed below. Air temperatures Air temperatures are one of the main factors controlling ground temperatures (Osterkamp and Romanovsky 1999). The explaining factor can however differ largely at a small scale. Thorn et al. (1999) showed that air temperatures in a valley in the Abisko region could explain between 20% and 95% of the variance in ground temperatures at different sites in the same valley. The rest of the variance could be explained by other factors. Snow cover Snow cover is also an important parameter for ground temperatures (Thorn et al 1999). Snow cover can have both a cooling and a warming effect on ground temperatures. A thick layer of snow has an insulating effect, which hinders cold winter air from penetrating into the ground and prevents heat loss from the ground to the atmosphere (Johansson et al. 2006). In contrast, the high albedo of snow reflects a large amount of the solar radiation, meaning that only a small portion of radiation will penetrate the ground. In addition, during snowmelt latent heat is consumed from the ground, which leads to lowering of ground temperatures (Zhang et al. 2001). Precipitation As well as snow, precipitation in general affects ground temperatures. Precipitation can influence ground temperatures twofold; towards higher and lower temperatures. Increased precipitation results in increased evaporation and latent heat flow from the ground to the atmosphere (as mentioned above concerning snow melt), which thereby leads to a decrease in ground temperatures (Johansson et al 2008; Zhang et al. 2001). Increasing precipitation can also lead to a rise in the thermal conductivity of the ground (especially in peat soils), which means that the heat in the air can penetrate more easily and hence cause an increase in ground temperatures. Wind Wind has an indirect influence on ground temperatures by effecting where snow accumulates (see description on snow insulation above) (Stenborg 1965). Vegetation Vegetation is another parameter that is of importance for ground temperatures. An increase in vegetation cover could have either a warming or a cooling effect. More vegetation means a lower albedo that can lead to higher ground temperatures. On the other hand, if vegetation becomes denser, this will increase the shading effect, resulting in lower ground temperatures especially in summer, but also on an annual basis (Johansson et al 2006). Vegetation can also influence ground temperatures in indirect ways. By reducing wind speed and sublimation rates vegetation can act as a snow trap and thereby influencing where an insulating snow cover will occur (see description on snow cover above) (Jones 1998). Another indirect effect of increased vegetation is increased soil moisture, which influence ground temperatures in similar ways as the influence of increased precipitation (see description on precipitation above).
8
Topography At higher altitudes ground temperature is lower than at low altitudes (Johansson et al. 2006). The aspect is also of importance. Ground temperatures on north-facing slopes are cooler than on slopes facing other directions, as north-facing slopes receive less solar radiation. Glaciers Ground temperatures are lower beneath cold based glaciers (where the basal layer is frozen to the glacier bed) than beneath warm based glaciers (where the basal layers are not frozen to the glacier bed) (Sonesson 1970). The high albedo of the glacier ice means that only small quantities of solar radiation can penetrate into the ice and further down into the ground. A thinning of a glacier may decrease the ground temperatures, since the high albedo effect remains the same at the same time as cold winter air can penetrate more easily (IPCC 2001). Water bodies Water bodies can be one of the most important factors influencing ground temperatures on a local scale (Dunfield et al. 1993). Water bodies are equalizing ground temperatures throughout the year, having a warming effect in winters and a cooling effect in summers (Johansson et al. 2006). Soils The thermal conductivity of the soil determines how fast and to what extent ground temperatures can change. The conductivity is influenced by several different soil parameters, such as amount of organic material, soil water content and soil texture. A higher amount of organic material in the soil leads to a lower thermal conductivity, a higher soil water content results in higher conductivity, and a dense packing of the soil leads to lower thermal conductivity (Johansson et al. 2006). Humans Human activities affect many of the parameters controlling ground temperature. These activities are for example leading to increased erosion (IPCC 2001), degradation of the vegetation (Josefsson 1990b; Zhang et al. 2001, Johansson et al. 2008) change of albedo, modification of the heat exchange balance, and alteration of the hydrology and the snow accumulation (Josefsson 1990b; Stenborg 1965; Zhang et al. 2001). Humans alter ground temperatures in these ways by for example transport activities (IPCC 2001), dust from burning (Kattsov et al. 2005 in ACIA 2005), and construction of infrastructure such as roads, railroads, pipelines and transmission lines. Humans also affect ground temperatures indirectly by contributing to the increased global warming by the release of greenhouse gases (IPCC, 2007).

Site description _________________________________________________________________________________ The Abisko region The Abisko valley is situated in the Scandinavian Mountains in northernmost Sweden at 340-580 m.a.s.l. (68°21’N Latitude and 18°49’E Longitude) (Figure 1). The valley is surrounded by mountains to the South, East and West. The height of the mountains ranges from 1000 to 1750 m.a.s.l. On its north side the valley is open towards Lake Torneträsk, which has an area of 330 km2. The subalpine zone of the Abisko region is dominated by mountain birch forest and the tree line is situated at an elevation of about 500 m.a.s.l. (Josefsson 1990a).
Figure 1. The study site is located at Abisko in northernmost Sweden
(modified from Akerman and Johansson, Submitted).
The climate in the Abisko region is in the lower parts and the valleys defined as Dfc, and in the mountains as ET, according to the Köppen Climate System (Köppen and Geiger 1954). Dfc represents a snowy forest climate with a moist winter and ET is a tundra climate. The Abisko area is relatively dry with an annual mean precipitation of 303 mm (1913-2006) (Johansson et al 2008). About 50 % of the annual precipitation is snow. The low amount of precipitation is explained by the region’s basin form, which causes an orographic shadow. Mean annual air temperature in Abisko is -0.6 °C (1913-2006) (Johansson et al 2008). In the Abisko area, freezing and thawing processes dominate ground temperatures, and the region lies within the zone of discontinuous permafrost (Brown et al. 1998). Permafrost is common above the tree line, but under the tree line permafrost occurs only at especially favourable sites such as peat mires (Johansson et al 2006).
The local climate of the Abisko Valley is dominated by the influence of Lake Torneträsk and the surrounding mountains. During the period when the lake is not covered by ice the water body creates a lake-land breeze system and a more maritime climate in the valley, which have an impact on the temperatures near the lake (Holmgren and Tenow 1987). In winter ablation and transport of snow from the lake ice results in snow accumulation in the forest around Lake Torneträsk. Mountain and valley winds are consequences of the mountain landscape in the area. Mt. Nuolja, directly to the west of Abisko, causes a very pronounced Foehn effect. Another consequence of the topography in the region is that open areas on the valley floors can become cold air depressions (Mattson 1979). Local climate is also influenced by vegetation, in terms of varying albedo. Open vegetated areas, such as mires, have a higher albedo than the birch forest, both in summer and when the landscape is snow-covered (Oke 1987).
9
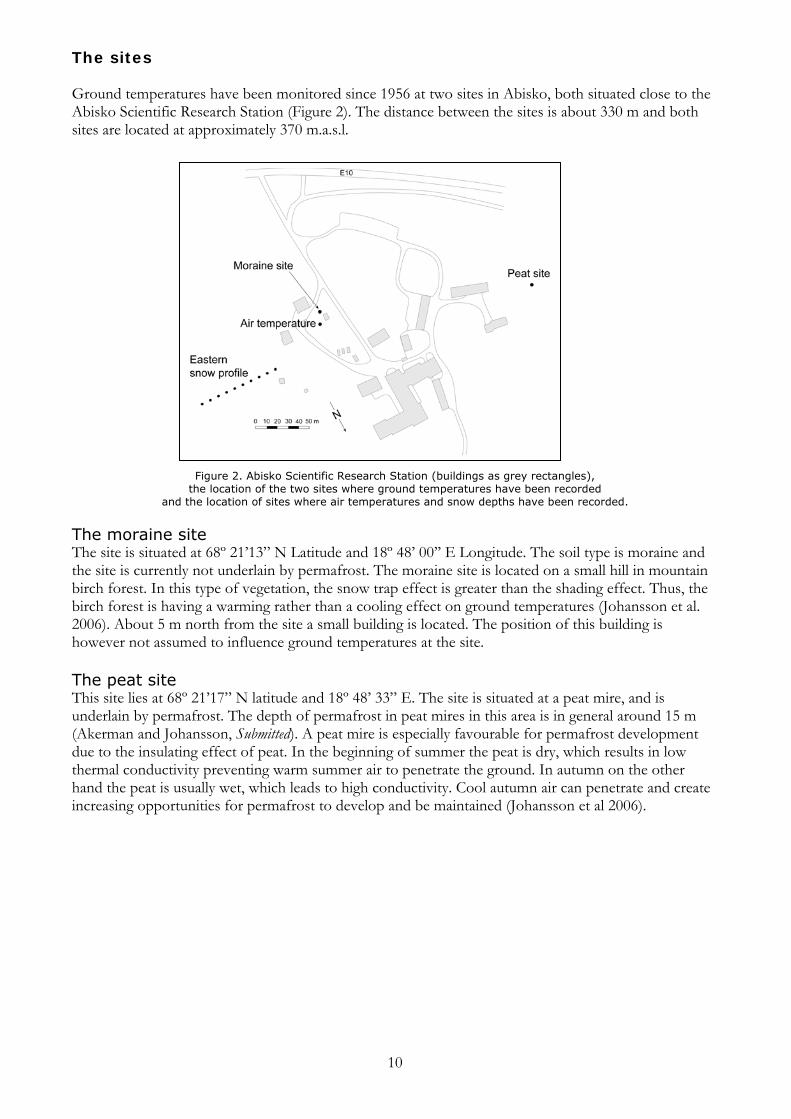
The sites Ground temperatures have been monitored since 1956 at two sites in Abisko, both situated close to the Abisko Scientific Research Station (Figure 2). The distance between the sites is about 330 m and both sites are located at approximately 370 m.a.s.l.
10
Figure 2. Abisko Scientific Research Station (buildings as grey rectangles), the location of the two sites where ground temperatures have been recorded
and the location of sites where air temperatures and snow depths have been recorded.
The moraine site The site is situated at 68º 21’13” N Latitude and 18º 48’ 00’’ E Longitude. The soil type is moraine and the site is currently not underlain by permafrost. The moraine site is located on a small hill in mountain birch forest. In this type of vegetation, the snow trap effect is greater than the shading effect. Thus, the birch forest is having a warming rather than a cooling effect on ground temperatures (Johansson et al. 2006). About 5 m north from the site a small building is located. The position of this building is however not assumed to influence ground temperatures at the site. The peat site This site lies at 68º 21’17” N latitude and 18º 48’ 33” E. The site is situated at a peat mire, and is underlain by permafrost. The depth of permafrost in peat mires in this area is in general around 15 m (Akerman and Johansson, Submitted). A peat mire is especially favourable for permafrost development due to the insulating effect of peat. In the beginning of summer the peat is dry, which results in low thermal conductivity preventing warm summer air to penetrate the ground. In autumn on the other hand the peat is usually wet, which leads to high conductivity. Cool autumn air can penetrate and create increasing opportunities for permafrost to develop and be maintained (Johansson et al 2006).

11
Methods _________________________________________________________________________________ Monitoring Ground temperatures The ground temperatures analysed here has been monitored at the depths 0.2, 0.5, 1 and 1.5 m at both sites, with one borehole for each depth. In addition, at the moraine site the ground temperatures were also measured at 0.05 and 2 m. Temperatures were registered by manually reading mercury thermometers, with a precision of 0.5 degree. The observations commenced in October 1956 for all depths except for 0.2 m at the peat site, which started in November 1959. Measurements were taken at the 5th, 10th, 15th etc. of every month. This results in observations approximately every fifth day (as not all months have exactly 30 days). The data series is almost uninterrupted, with gaps of a few days, or a few weeks at the most. These gaps are mainly due to a broken thermometer or that a thermometer was frozen in a borehole and could not be read. In this study data was digitised from paper records held at the Abisko Station for the period 1956-1981, and earlier digitised data from 1982-2006 was also used. Due to time constraints, data was only analysed from the depths of 0.2, 0.5 and 1 m at both sites. Air temperature Air temperatures are in addition to snow depth, identified to be the two most important parameters for ground temperatures. Because of their importance, and with the limited time for the study taken into account, I have chosen to focus on these two parameters when trying to attribute the causes of changes in ground temperatures. The air temperatures used were monitored at the Abisko Scientific Research Station (Figure 2) (Johansson et al. 2008) and observations have been carried out at the same site since 1913 until present. 2 m screen air temperature was used, which is the same method as used at the Swedish Meteorological and Hydrological Institute. Air temperatures are recorded manually every third hour (from 01:00 to 22:00 local time). In 1984 an automatic weather station was installed and since then, air temperatures have in addition been recorded automatically every 10 minutes. Snow depth Snow depth used to attribute the causes of change in ground temperatures were monitored at the Abisko Scientific Research Station, 50 m east of the original main building (Figure 2) (Kohler et al. 2006). Snow depth was recorded by calculating the mean value of 10 stakes, and this was done usually every 5th day, year round, when appropriate. Monitoring snow depth at Abisko commenced in 1913. Since 1956 however, measurements became regularized and the series is essentially uninterrupted from 1956 until present. Analysing data Trend Analyses The ground temperatures trends were calculated by using linear regression. For this the software SPSS 16.0 was used and trends were assumed to be significant for p levels ≤ 0.05. Attributing causes of change To determine the causes of the observed changes in the ground temperatures, correlations between ground temperatures and air temperatures, and also between ground temperature and snow depth were calculated. The same method, software and p-value as mentioned above were used for this. Before analysis all data was standardized.
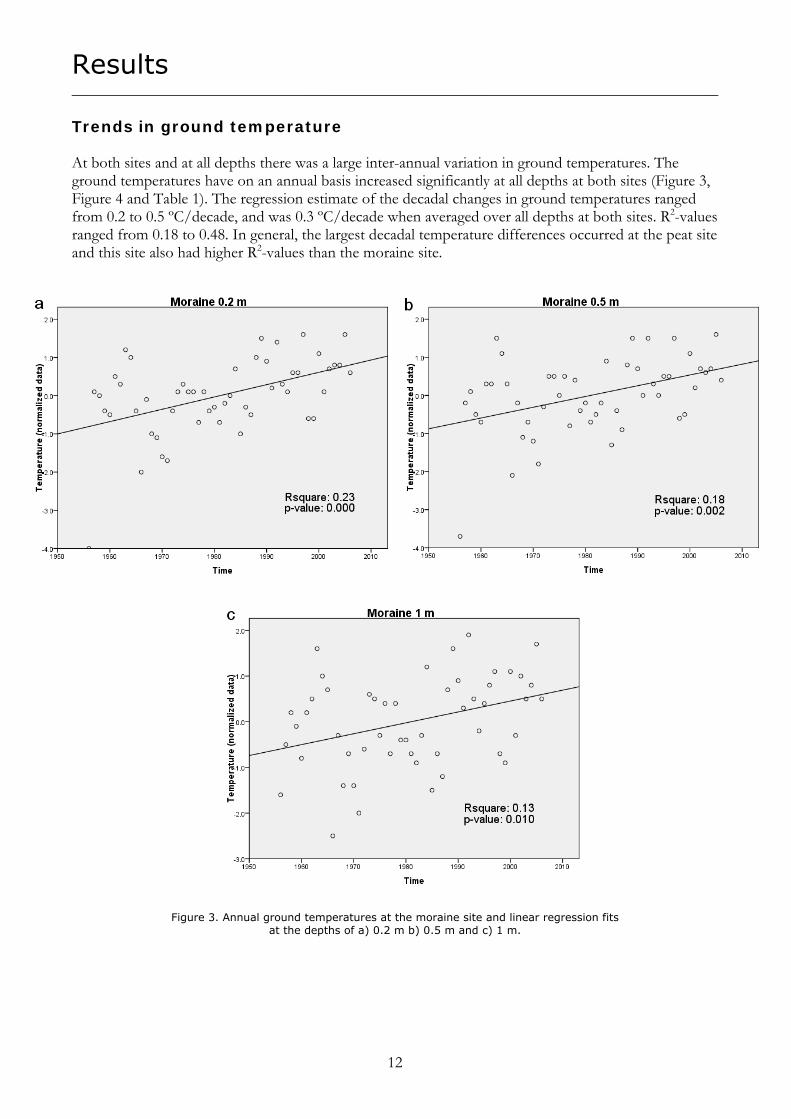
Results _________________________________________________________________________________ Trends in ground temperature At both sites and at all depths there was a large inter-annual variation in ground temperatures. The ground temperatures have on an annual basis increased significantly at all depths at both sites (Figure 3, Figure 4 and Table 1). The regression estimate of the decadal changes in ground temperatures ranged from 0.2 to 0.5 ºC/decade, and was 0.3 ºC/decade when averaged over all depths at both sites. R2-values ranged from 0.18 to 0.48. In general, the largest decadal temperature differences occurred at the peat site and this site also had higher R2-values than the moraine site.
Figure 3. Annual ground temperatures at the moraine site and linear regression fits at the depths of a) 0.2 m b) 0.5 m and c) 1 m.
12
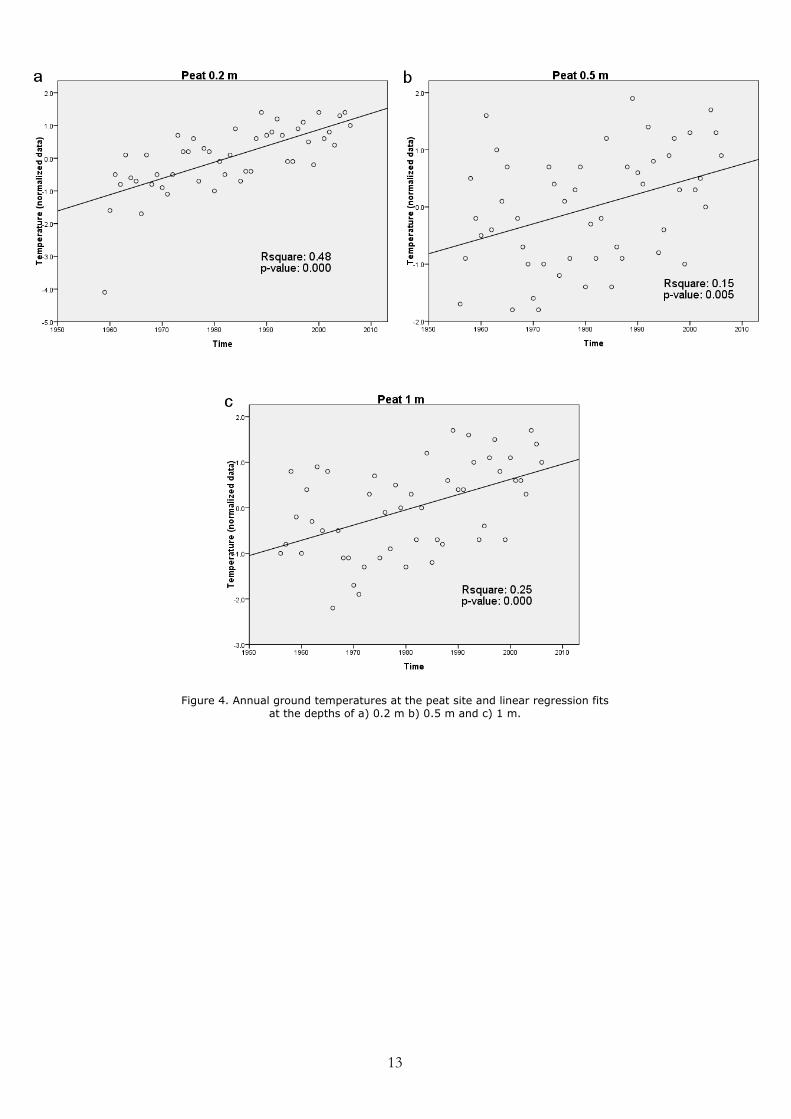
Figure 4. Annual ground temperatures at the peat site and linear regression fits at the depths of a) 0.2 m b) 0.5 m and c) 1 m.
13
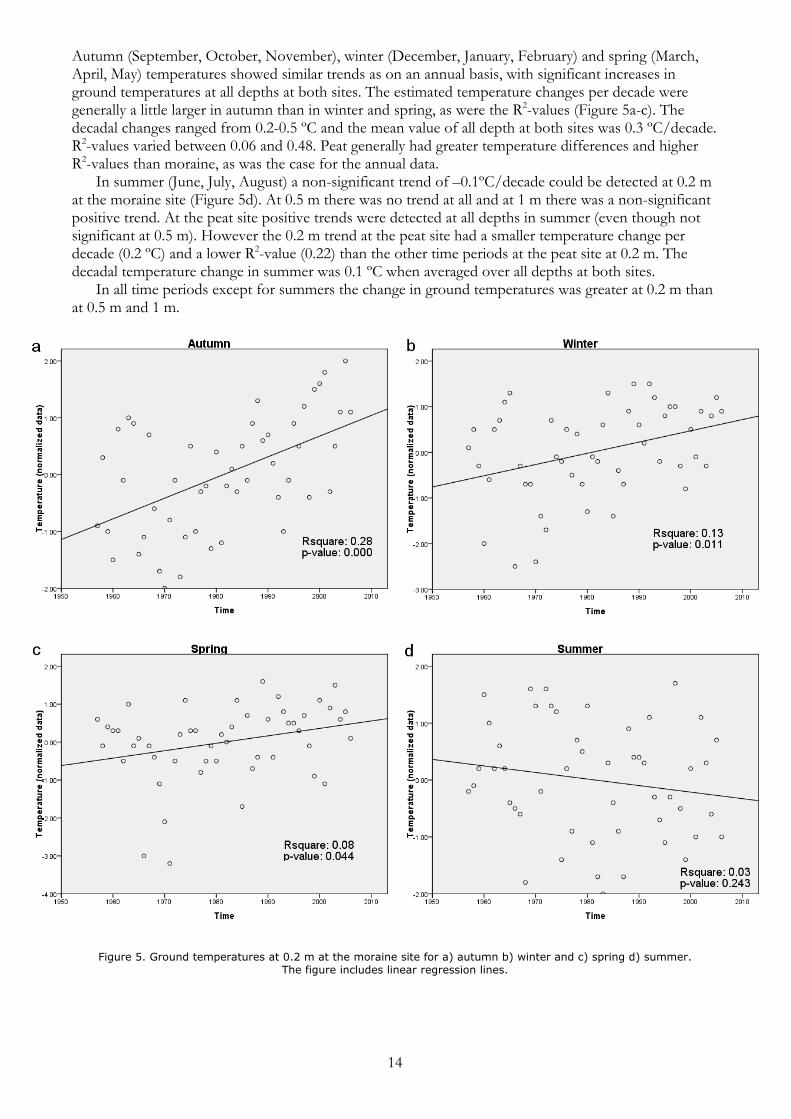
Autumn (September, October, November), winter (December, January, February) and spring (March, April, May) temperatures showed similar trends as on an annual basis, with significant increases in ground temperatures at all depths at both sites. The estimated temperature changes per decade were generally a little larger in autumn than in winter and spring, as were the R2-values (Figure 5a-c). The decadal changes ranged from 0.2-0.5 ºC and the mean value of all depth at both sites was 0.3 ºC/decade. R2-values varied between 0.06 and 0.48. Peat generally had greater temperature differences and higher R2-values than moraine, as was the case for the annual data.
In summer (June, July, August) a non-significant trend of –0.1ºC/decade could be detected at 0.2 m at the moraine site (Figure 5d). At 0.5 m there was no trend at all and at 1 m there was a non-significant positive trend. At the peat site positive trends were detected at all depths in summer (even though not significant at 0.5 m). However the 0.2 m trend at the peat site had a smaller temperature change per decade (0.2 ºC) and a lower R2-value (0.22) than the other time periods at the peat site at 0.2 m. The decadal temperature change in summer was 0.1 ºC when averaged over all depths at both sites.
In all time periods except for summers the change in ground temperatures was greater at 0.2 m than at 0.5 m and 1 m.
Figure 5. Ground temperatures at 0.2 m at the moraine site for a) autumn b) winter and c) spring d) summer.
The figure includes linear regression lines.
14

15
Table 1. Trend analyses of ground temperatures. Bold indicates significance at the p ≤ 0,05 level.
Time Soil type Depth (m) R2 p-value Regression estimate of temp
ºC in 1956
Regression estimate of temp
ºC in 2006
Difference ºC decade-1
Annual Moraine 0.2 0.23 0,000 -1.2 0.3 0.3 Moraine 0.5 0.18 0.002 -1.2 0.2 0.3 Moraine 1 0.13 0.010 -0.3 0.9 0.2 Peat 0.2 0.48 0.000 -0.7 1.7 0.5 Peat 0.5 0.15 0.005 -0.9 0.4 0.3 Peat 1 0.25 0.000 -1.7 -0.1 0.3 Autumn Moraine 0.2 0.28 0.000 -1.6 0.1 0.4 Moraine 0.5 0.11 0.017 -0.5 0.6 0.2 Moraine 1 0.17 0.003 -1.3 0.1 0.3 Peat 0.2 0.48 0.000 -1.4 1.1 0.5 Peat 0.5 0.20 0.001 -0.1 1.4 0.3 Peat 1 0.14 0.009 -1.3 -0.1 0.2 Winter Moraine 0.2 0.13 0.011 0.2 1.4 0.2 Moraine 0.5 0.09 0.033 0.3 1.4 0.2 Moraine 1 0.06 0.076 -1.1 -0.2 0.2 Peat 0.2 0.43 0.000 -1.5 0.8 0.5 Peat 0.5 0.27 0.000 0.1 1.8 0.4 Peat 1 0.13 0.009 0.0 1.4 0.3 Spring Moraine 0.2 0.08 0.044 0.3 1.3 0.2 Moraine 0.5 0.12 0.014 0.2 1.4 0.2 Moraine 1 0.08 0.044 0.4 1.4 0.2 Peat 0.2 0.33 0.000 -0.7 1.4 0.4 Peat 0.5 0.22 0.001 -0.3 1.3 0.3 Peat 1 0.15 0.005 -1.7 -0.2 0.3 Summer Moraine 0.2 0.03 0.243 1.3 0.7 -0.1 Moraine 0.5 0.00 0.911 0.3 0.2 0.0 Moraine 1 0.02 0.405 -0.7 -0.3 0.1 Peat 0.2 0.22 0.001 -1.1 0.4 0.3 Peat 0.5 0.05 0.120 -1.0 -0.3 0.1
Peat 1 0.28 0.000 -1.8 -0.1 0.4
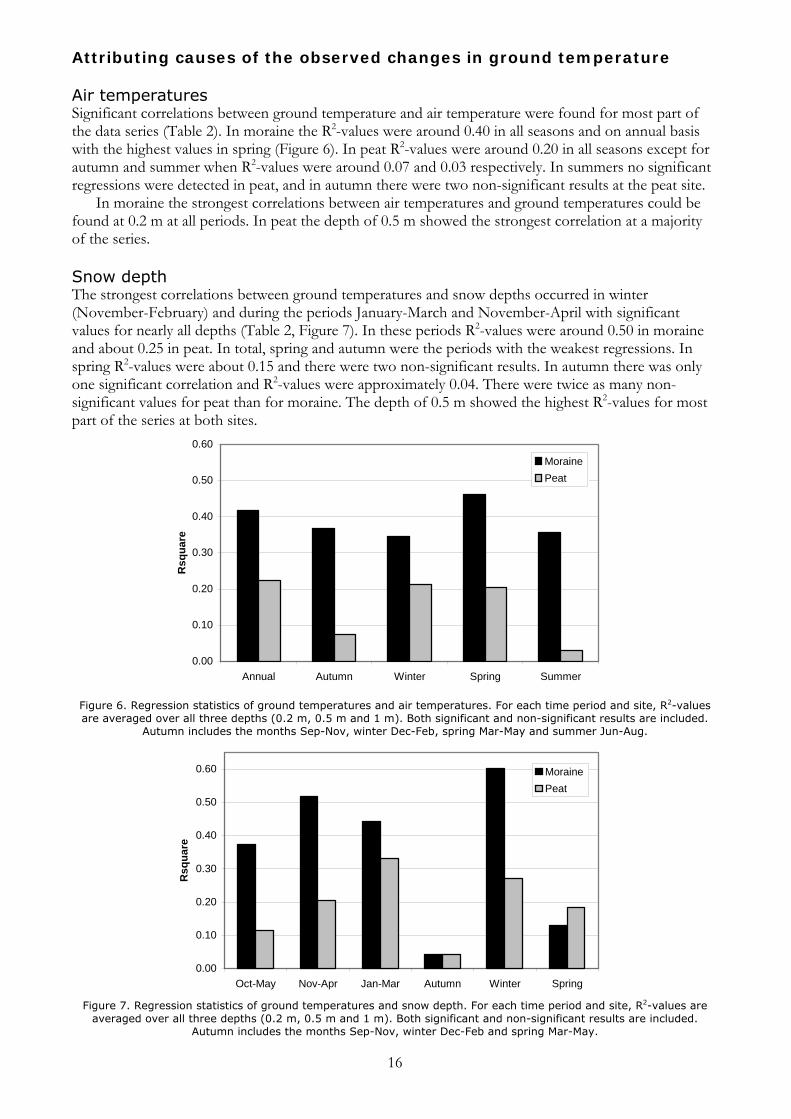
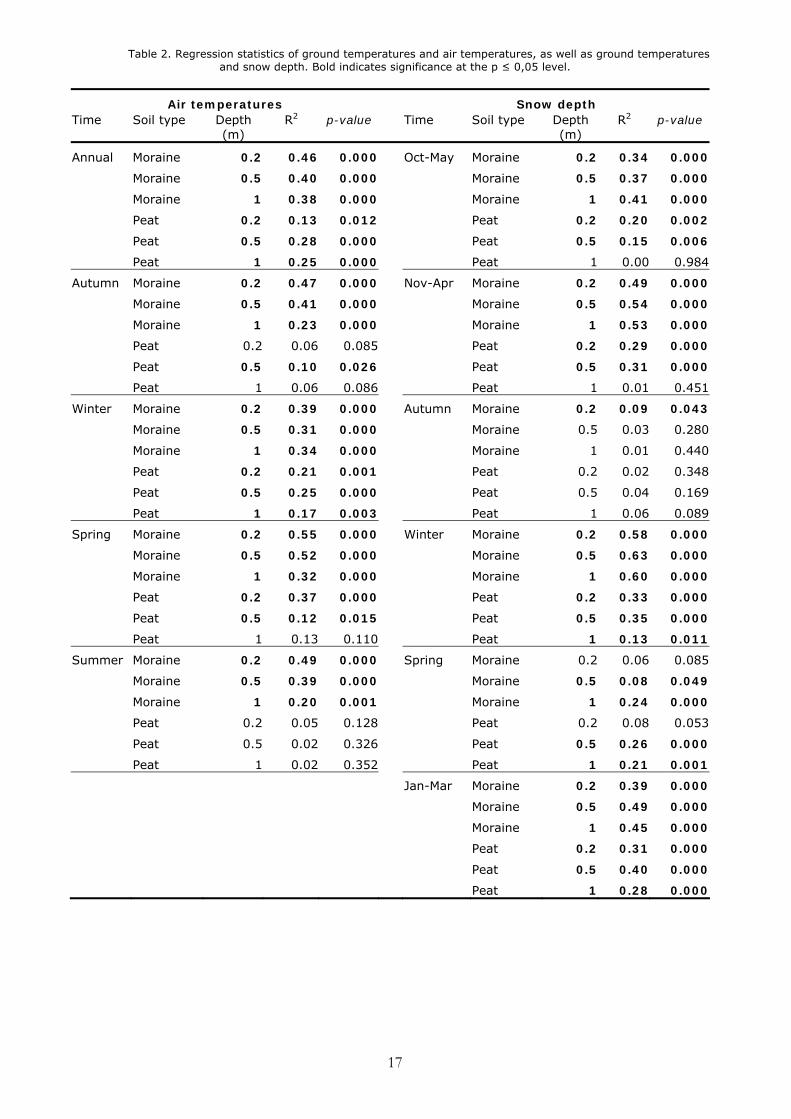
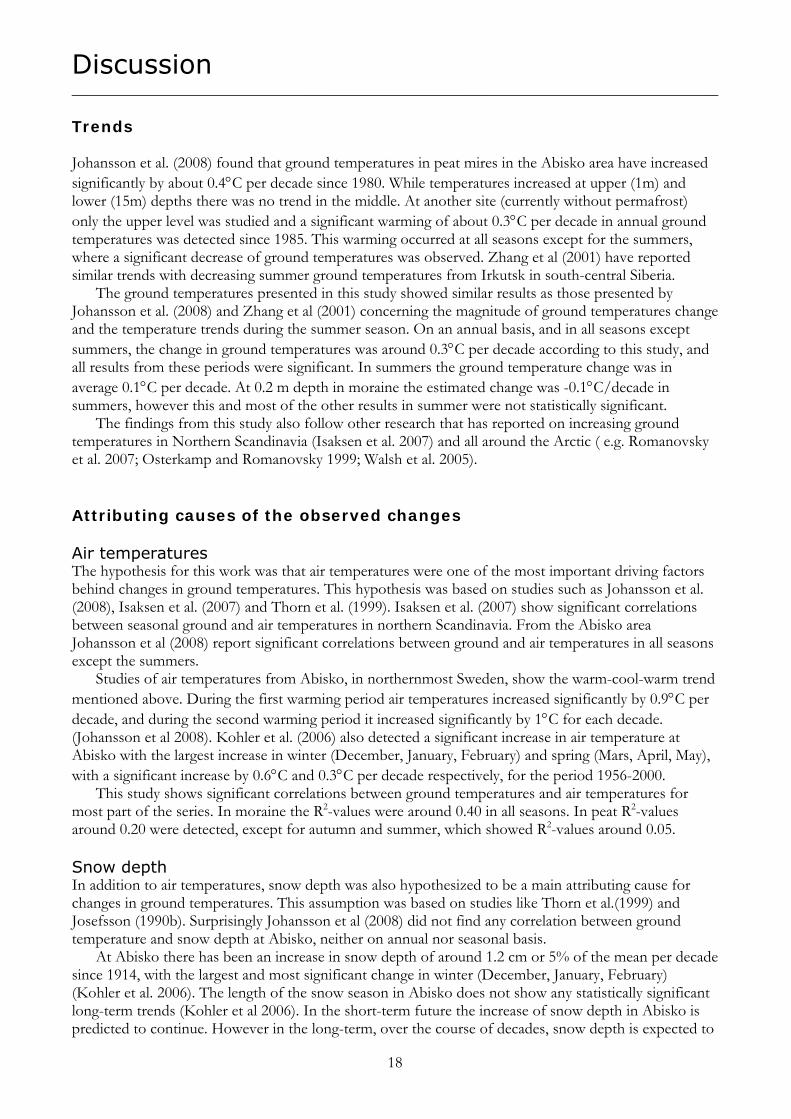
Attributing causes of the observed changes in ground temperature Air temperatures Significant correlations between ground temperature and air temperature were found for most part of the data series (Table 2). In moraine the R2-values were around 0.40 in all seasons and on annual basis with the highest values in spring (Figure 6). In peat R2-values were around 0.20 in all seasons except for autumn and summer when R2-values were around 0.07 and 0.03 respectively. In summers no significant regressions were detected in peat, and in autumn there were two non-significant results at the peat site.
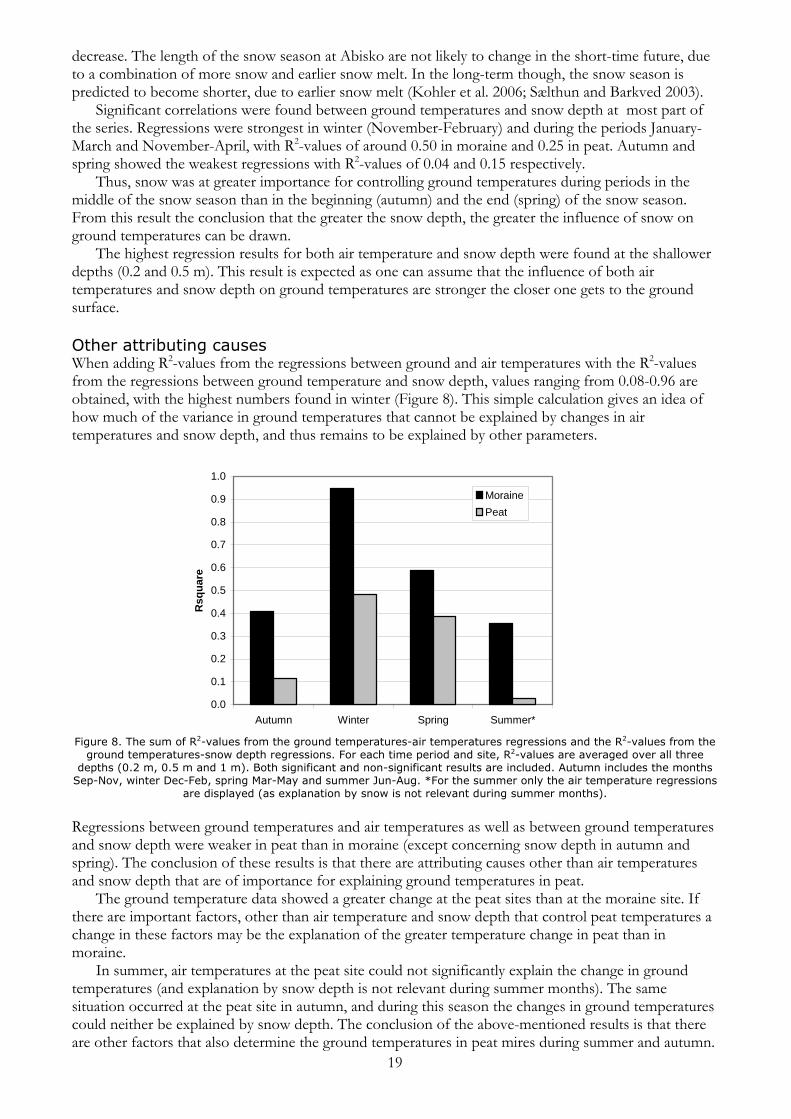
In moraine the strongest correlations between air temperatures and ground temperatures could be found at 0.2 m at all periods. In peat the depth of 0.5 m showed the strongest correlation at a majority of the series. Snow depth The strongest correlations between ground temperatures and snow depths occurred in winter (November-February) and during the periods January-March and November-April with significant values for nearly all depths (Table 2, Figure 7). In these periods R2-values were around 0.50 in moraine and about 0.25 in peat. In total, spring and autumn were the periods with the weakest regressions. In spring R2-values were about 0.15 and there were two non-significant results. In autumn there was only one significant correlation and R2-values were approximately 0.04. There were twice as many non-significant values for peat than for moraine. The depth of 0.5 m showed the highest R2-values for most part of the series at both sites.
0.00
0.10
0.20
0.30
0.40
0.50
0.60
Annual Autumn Winter Spring Summer
Rsq
uare
MorainePeat
Figure 6. Regression statistics of ground temperatures and air temperatures. For each time period and site, R2-values are averaged over all three depths (0.2 m, 0.5 m and 1 m). Both significant and non-significant results are included.
Autumn includes the months Sep-Nov, winter Dec-Feb, spring Mar-May and summer Jun-Aug.
0.00
0.10
0.20
0.30
0.40
0.50
0.60
Oct-May Nov-Apr Jan-Mar Autumn Winter Spring
Rsq
uare
MorainePeat
Figure 7. Regression statistics of ground temperatures and snow depth. For each time period and site, R2-values are
averaged over all three depths (0.2 m, 0.5 m and 1 m). Both significant and non-significant results are included. Autumn includes the months Sep-Nov, winter Dec-Feb and spring Mar-May.
16
17
Table 2. Regression statistics of ground temperatures and air temperatures, as well as ground temperatures and snow depth. Bold indicates significance at the p ≤ 0,05 level.
Air temperatures Snow depth Time Soil type Depth
(m) R2 p-value Time Soil type Depth
(m) R2 p-value
Annual Moraine 0.2 0.46 0.000 Oct-May Moraine 0.2 0.34 0.000
Moraine 0.5 0.40 0.000 Moraine 0.5 0.37 0.000
Moraine 1 0.38 0.000 Moraine 1 0.41 0.000
Peat 0.2 0.13 0.012 Peat 0.2 0.20 0.002
Peat 0.5 0.28 0.000 Peat 0.5 0.15 0.006
Peat 1 0.25 0.000 Peat 1 0.00 0.984
Autumn Moraine 0.2 0.47 0.000 Nov-Apr Moraine 0.2 0.49 0.000
Moraine 0.5 0.41 0.000 Moraine 0.5 0.54 0.000
Moraine 1 0.23 0.000 Moraine 1 0.53 0.000
Peat 0.2 0.06 0.085 Peat 0.2 0.29 0.000
Peat 0.5 0.10 0.026 Peat 0.5 0.31 0.000
Peat 1 0.06 0.086 Peat 1 0.01 0.451
Winter Moraine 0.2 0.39 0.000 Autumn Moraine 0.2 0.09 0.043
Moraine 0.5 0.31 0.000 Moraine 0.5 0.03 0.280
Moraine 1 0.34 0.000 Moraine 1 0.01 0.440
Peat 0.2 0.21 0.001 Peat 0.2 0.02 0.348
Peat 0.5 0.25 0.000 Peat 0.5 0.04 0.169
Peat 1 0.17 0.003 Peat 1 0.06 0.089
Spring Moraine 0.2 0.55 0.000 Winter Moraine 0.2 0.58 0.000
Moraine 0.5 0.52 0.000 Moraine 0.5 0.63 0.000
Moraine 1 0.32 0.000 Moraine 1 0.60 0.000
Peat 0.2 0.37 0.000 Peat 0.2 0.33 0.000
Peat 0.5 0.12 0.015 Peat 0.5 0.35 0.000
Peat 1 0.13 0.110 Peat 1 0.13 0.011
Summer Moraine 0.2 0.49 0.000 Spring Moraine 0.2 0.06 0.085
Moraine 0.5 0.39 0.000 Moraine 0.5 0.08 0.049
Moraine 1 0.20 0.001 Moraine 1 0.24 0.000
Peat 0.2 0.05 0.128 Peat 0.2 0.08 0.053
Peat 0.5 0.02 0.326 Peat 0.5 0.26 0.000
Peat 1 0.02 0.352 Peat 1 0.21 0.001
Jan-Mar Moraine 0.2 0.39 0.000
Moraine 0.5 0.49 0.000
Moraine 1 0.45 0.000
Peat 0.2 0.31 0.000
Peat 0.5 0.40 0.000
Peat 1 0.28 0.000
18
Discussion _________________________________________________________________________________ Trends Johansson et al. (2008) found that ground temperatures in peat mires in the Abisko area have increased significantly by about 0.4°C per decade since 1980. While temperatures increased at upper (1m) and lower (15m) depths there was no trend in the middle. At another site (currently without permafrost) only the upper level was studied and a significant warming of about 0.3°C per decade in annual ground temperatures was detected since 1985. This warming occurred at all seasons except for the summers, where a significant decrease of ground temperatures was observed. Zhang et al (2001) have reported similar trends with decreasing summer ground temperatures from Irkutsk in south-central Siberia.
The ground temperatures presented in this study showed similar results as those presented by Johansson et al. (2008) and Zhang et al (2001) concerning the magnitude of ground temperatures change and the temperature trends during the summer season. On an annual basis, and in all seasons except summers, the change in ground temperatures was around 0.3°C per decade according to this study, and all results from these periods were significant. In summers the ground temperature change was in average 0.1°C per decade. At 0.2 m depth in moraine the estimated change was -0.1°C/decade in summers, however this and most of the other results in summer were not statistically significant.
The findings from this study also follow other research that has reported on increasing ground temperatures in Northern Scandinavia (Isaksen et al. 2007) and all around the Arctic ( e.g. Romanovsky et al. 2007; Osterkamp and Romanovsky 1999; Walsh et al. 2005). Attributing causes of the observed changes Air temperatures The hypothesis for this work was that air temperatures were one of the most important driving factors behind changes in ground temperatures. This hypothesis was based on studies such as Johansson et al. (2008), Isaksen et al. (2007) and Thorn et al. (1999). Isaksen et al. (2007) show significant correlations between seasonal ground and air temperatures in northern Scandinavia. From the Abisko area Johansson et al (2008) report significant correlations between ground and air temperatures in all seasons except the summers.
Studies of air temperatures from Abisko, in northernmost Sweden, show the warm-cool-warm trend mentioned above. During the first warming period air temperatures increased significantly by 0.9°C per decade, and during the second warming period it increased significantly by 1°C for each decade. (Johansson et al 2008). Kohler et al. (2006) also detected a significant increase in air temperature at Abisko with the largest increase in winter (December, January, February) and spring (Mars, April, May), with a significant increase by 0.6°C and 0.3°C per decade respectively, for the period 1956-2000.
This study shows significant correlations between ground temperatures and air temperatures for most part of the series. In moraine the R2-values were around 0.40 in all seasons. In peat R2-values around 0.20 were detected, except for autumn and summer, which showed R2-values around 0.05. Snow depth In addition to air temperatures, snow depth was also hypothesized to be a main attributing cause for changes in ground temperatures. This assumption was based on studies like Thorn et al.(1999) and Josefsson (1990b). Surprisingly Johansson et al (2008) did not find any correlation between ground temperature and snow depth at Abisko, neither on annual nor seasonal basis.
At Abisko there has been an increase in snow depth of around 1.2 cm or 5% of the mean per decade since 1914, with the largest and most significant change in winter (December, January, February) (Kohler et al. 2006). The length of the snow season in Abisko does not show any statistically significant long-term trends (Kohler et al 2006). In the short-term future the increase of snow depth in Abisko is predicted to continue. However in the long-term, over the course of decades, snow depth is expected to
decrease. The length of the snow season at Abisko are not likely to change in the short-time future, due to a combination of more snow and earlier snow melt. In the long-term though, the snow season is predicted to become shorter, due to earlier snow melt (Kohler et al. 2006; Sælthun and Barkved 2003).
Significant correlations were found between ground temperatures and snow depth at most part of the series. Regressions were strongest in winter (November-February) and during the periods January-March and November-April, with R2-values of around 0.50 in moraine and 0.25 in peat. Autumn and spring showed the weakest regressions with R2-values of 0.04 and 0.15 respectively.
Thus, snow was at greater importance for controlling ground temperatures during periods in the middle of the snow season than in the beginning (autumn) and the end (spring) of the snow season. From this result the conclusion that the greater the snow depth, the greater the influence of snow on ground temperatures can be drawn.
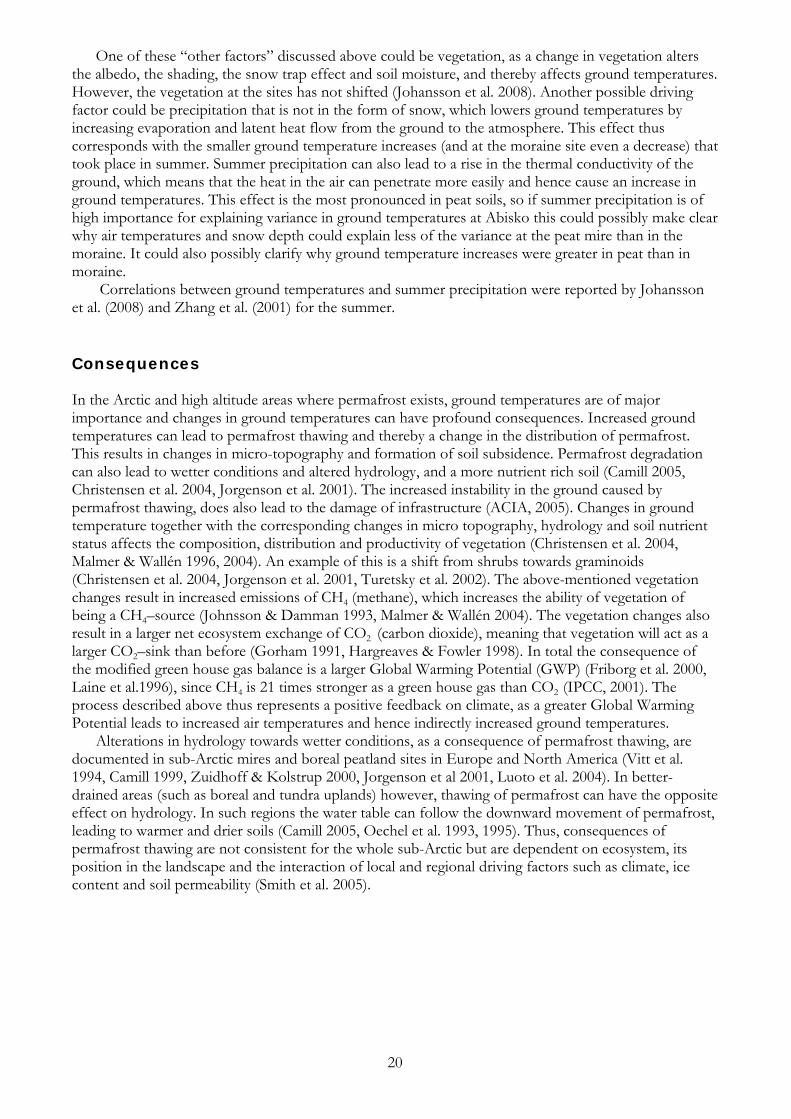
The highest regression results for both air temperature and snow depth were found at the shallower depths (0.2 and 0.5 m). This result is expected as one can assume that the influence of both air temperatures and snow depth on ground temperatures are stronger the closer one gets to the ground surface. Other attributing causes When adding R2-values from the regressions between ground and air temperatures with the R2-values from the regressions between ground temperature and snow depth, values ranging from 0.08-0.96 are obtained, with the highest numbers found in winter (Figure 8). This simple calculation gives an idea of how much of the variance in ground temperatures that cannot be explained by changes in air temperatures and snow depth, and thus remains to be explained by other parameters.
0.0
0.1
0.2
0.3
0.4
0.5
0.6
0.7
0.8
0.9
1.0
Autumn Winter Spring Summer*
Rsq
uare
MorainePeat
Figure 8. The sum of R2-values from the ground temperatures-air temperatures regressions and the R2-values from the
ground temperatures-snow depth regressions. For each time period and site, R2-values are averaged over all three depths (0.2 m, 0.5 m and 1 m). Both significant and non-significant results are included. Autumn includes the months
Sep-Nov, winter Dec-Feb, spring Mar-May and summer Jun-Aug. *For the summer only the air temperature regressions are displayed (as explanation by snow is not relevant during summer months).
Regressions between ground temperatures and air temperatures as well as between ground temperatures and snow depth were weaker in peat than in moraine (except concerning snow depth in autumn and spring). The conclusion of these results is that there are attributing causes other than air temperatures and snow depth that are of importance for explaining ground temperatures in peat.
The ground temperature data showed a greater change at the peat sites than at the moraine site. If there are important factors, other than air temperature and snow depth that control peat temperatures a change in these factors may be the explanation of the greater temperature change in peat than in moraine.
19
In summer, air temperatures at the peat site could not significantly explain the change in ground temperatures (and explanation by snow depth is not relevant during summer months). The same situation occurred at the peat site in autumn, and during this season the changes in ground temperatures could neither be explained by snow depth. The conclusion of the above-mentioned results is that there are other factors that also determine the ground temperatures in peat mires during summer and autumn.
20
One of these “other factors” discussed above could be vegetation, as a change in vegetation alters the albedo, the shading, the snow trap effect and soil moisture, and thereby affects ground temperatures. However, the vegetation at the sites has not shifted (Johansson et al. 2008). Another possible driving factor could be precipitation that is not in the form of snow, which lowers ground temperatures by increasing evaporation and latent heat flow from the ground to the atmosphere. This effect thus corresponds with the smaller ground temperature increases (and at the moraine site even a decrease) that took place in summer. Summer precipitation can also lead to a rise in the thermal conductivity of the ground, which means that the heat in the air can penetrate more easily and hence cause an increase in ground temperatures. This effect is the most pronounced in peat soils, so if summer precipitation is of high importance for explaining variance in ground temperatures at Abisko this could possibly make clear why air temperatures and snow depth could explain less of the variance at the peat mire than in the moraine. It could also possibly clarify why ground temperature increases were greater in peat than in moraine.
Correlations between ground temperatures and summer precipitation were reported by Johansson et al. (2008) and Zhang et al. (2001) for the summer. Consequences In the Arctic and high altitude areas where permafrost exists, ground temperatures are of major importance and changes in ground temperatures can have profound consequences. Increased ground temperatures can lead to permafrost thawing and thereby a change in the distribution of permafrost. This results in changes in micro-topography and formation of soil subsidence. Permafrost degradation can also lead to wetter conditions and altered hydrology, and a more nutrient rich soil (Camill 2005, Christensen et al. 2004, Jorgenson et al. 2001). The increased instability in the ground caused by permafrost thawing, does also lead to the damage of infrastructure (ACIA, 2005). Changes in ground temperature together with the corresponding changes in micro topography, hydrology and soil nutrient status affects the composition, distribution and productivity of vegetation (Christensen et al. 2004, Malmer & Wallén 1996, 2004). An example of this is a shift from shrubs towards graminoids (Christensen et al. 2004, Jorgenson et al. 2001, Turetsky et al. 2002). The above-mentioned vegetation changes result in increased emissions of CH4 (methane), which increases the ability of vegetation of being a CH4–source (Johnsson & Damman 1993, Malmer & Wallén 2004). The vegetation changes also result in a larger net ecosystem exchange of CO2 (carbon dioxide), meaning that vegetation will act as a larger CO2–sink than before (Gorham 1991, Hargreaves & Fowler 1998). In total the consequence of the modified green house gas balance is a larger Global Warming Potential (GWP) (Friborg et al. 2000, Laine et al.1996), since CH4 is 21 times stronger as a green house gas than CO2 (IPCC, 2001). The process described above thus represents a positive feedback on climate, as a greater Global Warming Potential leads to increased air temperatures and hence indirectly increased ground temperatures.
Alterations in hydrology towards wetter conditions, as a consequence of permafrost thawing, are documented in sub-Arctic mires and boreal peatland sites in Europe and North America (Vitt et al. 1994, Camill 1999, Zuidhoff & Kolstrup 2000, Jorgenson et al 2001, Luoto et al. 2004). In better-drained areas (such as boreal and tundra uplands) however, thawing of permafrost can have the opposite effect on hydrology. In such regions the water table can follow the downward movement of permafrost, leading to warmer and drier soils (Camill 2005, Oechel et al. 1993, 1995). Thus, consequences of permafrost thawing are not consistent for the whole sub-Arctic but are dependent on ecosystem, its position in the landscape and the interaction of local and regional driving factors such as climate, ice content and soil permeability (Smith et al. 2005).

21
Conclusions _________________________________________________________________________________ Ground temperatures have increased significantly at two sites (one moraine and one peat, at depths of 0.2 m – 1 m) in Abisko during the last 50 years. On an annual basis, and at all seasons except summers, the change in ground temperatures was an increase of around 0.3°C per decade. The largest increases occurred at the peat site, and the depth of 0.2 m showed greater values of increases than the depth of 0.5 and 1m at both sites. In summer ground temperatures at both sites in average increased by around 0.1°C per decade. At the moraine site at 0.2 m depth the trend was -0.1°C per decade, however this trend was not statistically significant.
The observed changes in ground temperatures could be correlated with air temperatures and snow depth, but these two parameters could not explain all the variance found in the ground temperatures. At the peat site these factors could explain less of the variance than at the moraine site, and summer and autumn were the periods with the lowest R2-values at the peat site. Future research There are many parameters of importance to ground temperature (see background section) and in this study only two (air temperatures and snow depth) were examined. To get a better picture of what actually determines the ground temperatures it is important to also correlate ground temperatures with the other parameters.
In addition to the data used for this study there are also measurements made at the depths 0.05 m, 1.5 m and 2 m at the moraine site, as well as at 1.5 m at the peat site. This data remains to be digitised and analysed, and can potentially strengthen and verify the results in this study. It can also give more information about the ground temperature trends and its causes at a deeper level.
22
References _________________________________________________________________________________ ACIA 2005. Arctic Climate Impact Assessment. Cambridge University Press. 1042 pp Akerman, H.J. and Johansson, M. Submitted. Deepening active layer and thawing permafrost in
Sub-arctic Sweden. Submitted to Permafrost and Periglacial Processes. Aune, B.1989. Lufttemperatur og nedebör i Norge. Utvikling i löpet av tiden med instrumentelle
målningar. Det Norske Meterologiske Institutt Rapport 26/89 Klima. Bamzai, A. S. 2003. Relationship between snow cover variability and Arctic Oscillation index on a
hierarchy of time scales. Int. J. Climatol. 23, 131-142. Brown, J., Ferrians, Jr. O.J., Heginbottom, J.A. and Melnikov, E.S. 1998 Circum-Arctic Map of
Permafrost and Ground-Ice Conditions. International Permafrost Association Standing Committee on Data Information and Communication (comp.). 2003. Circumpolar Active-Layer Permafrost System, Version 2.0. Parsons, M. and Zhang, T. (eds.). Boulder, Colorado, National Snow and Ice Data Center/World Data Center for Glaciology. CD-ROM.
Brown, R. D. 2000. Northern hemisphere snow cover variability and change, 1915-97. J. Clim. 13, 2339-2355.
Camill, P. 1999. Peat accumulation and succession following permafrost thaw in the boreal peatlands of Manitoba, Canada. Ecoscience. 6, 592-602.
Camill, P. 2005. Permafrost thaw accelerates in boreal peatlands during late-20th century climate warming. Climatic Change. 68, 135-152.
Christensen, T. R., Johansson, T., Åkerman, H. J. et al. 2004. Thawing sub-arctic permafrost: effects on vegetation and methane emissions. Global Research Letter. 31, L04501, doi: 10.1029 / 2003GL018680.
Dunfield, P., R. Knowles, R. Dumont, and T. R. Moore. 1993 Methane production and consumption in temperate and subarctic peat soils: response to temperature and pH. Soil. Biol. Biochem. 25, 321-326.
Dye, D. G. 2002. Variability and trends in the annual snow cover cycle in Northern Hemisphere land areas, 1972-2000. Hydrol. Process. 16, 3065-3077.
Friborg, T., Christensen, T. R., Hansen, B. U. et al. 2000. Trace gas exchange in a high-arctic valley 2. Landscape CH4 fluxes measured and modeled using eddy correlation data. Global Biogeochemical Cycles. 14, 715-724.
Gorham, E. 1991. Northern peatlands role in the carbon cycle and probable responses to climatic warming. Ecological Applications. 1, 182-195.
Hargreaves, K. J. and Fowler, D. 1998. Quantifying the effects of water table and soil temperature on the emission of methane from peat wetland at the field scale. Atmospheric Environment. 32, 3275-3282.
Holmgren, B. and Tenow, O. 1987. Local extreme minima of winter air temperature in high-latitude mountainous terrain. Uppsala Universitet Naturgeografiska Institutionen Rapport. Nr 6:25-41.
IPCC (Intergovernmental Panel on Climate Change), Climate Change 2001, The Scientific Basis. Cambridge University Press. Cambridge.
IPCC (Intergovernmental Panel on Climate Change), Climate Change 2007: The Physical Science Basis. Cambridge University Press. Cambridge.
Isaksen, K., Sollid, J. L., Holmlund, P. and Harris, C. 2007. Recent warming in mountain permafrost in Svalbard and Scandinavia. Journal of Geophysical Research. 112: F02S04, doi: 10.1029/2006JF000522.
Johansson, M., Christensen, T. R., Akerman, H. J. and Callaghan, T. V. 2006. What determines the current presence or absence of permafrost in the Torneträsk Region, a sub-arctic landscape in northern Sweden. Ambio. 35, 190-197.
Johansson, M., Akerman, H. J., Jonasson, C., Christensen, T. R. and Callaghan, T. V. 2008. Increasing Permafrost Temperatures in Subarctic Sweden. Ninth international conference on permafrost.
23
Johnsson, L. C. and Damman, A. W. H. 1993. Decay and its regulation in Sphagnum peatlands. Advances in Bryology. 5, 249-296.
Jones, D. L.1998. Organic acids in the rhizosphere – a critical review. Plant and soil. 205, 25-44. Jorgenson, M. T., Racine C. H., Walters J. C. and Osterkamp, T. E. 2001. Permafrost degradation
and ecological changes associated with a warming in central Alaska. Clim. Change. 48, 551- 579.
Josefsson, M. 1990a. The geoecology of subalpine heaths in the Abisko Valley, Northern Sweden. UNGI Rapport Nr 78.
Josefsson, M. 1990b. Ground Temperature Variations in a Subarctic Mountain Valley, Abisko, Northern Sweden. Geografiska Annaler. Series A, 72 (2): 179-190.
Kattsov, V. M., Källén, E., Cattle H. et al. 2005. Chapter 4: Future climate change: modeling and scenarios for the Arctic. Arctic Climate Impact Assessment – Scientific Report (eds. Symon, C., Arris, L., Heal, B.), pp 99-150. Cambridge University Press. New York.
Kohler, J., Brandt, O., Johansson, M. and Callaghan, T. V. 2006. A long-term Arctic snow depth record from Abisko, northern Sweden, 1913-2004. Polar Research. 25, 91-113.
Kungliga Vetenskapsakademien.1989. The Abisko Research Station. Documenta. Annual Report of the Royal Academy of Sciences. p 44.
Köppen, W. and Geiger, R., 1954. Klima der Erde (map). Justus Perthes. Darmstadt, Germany. Laine, J., Silvola, J. Tolonen, K. et al.1996. Effect of water-level drawdown on global climatic
warming: Northern peatlands. Ambio. 25, 179-184. Luoto, M., Heikkinen, R. K., Carter, T. R. 2004. Loss of palsa mires in Europe and biological
consequences. Environmental Conservation. 31, 30-37. Malmer, N. and Wallén, B. 1996. Peat formation and mass balance in subarctic ombrotrophic
peatlands around Abisko, northern Scandinavia. Plant Ecology in the Subarctic Swedish Lapland, Ecological Bulletins, Vol. 45 (eds. Karlsson, P. S. and Callaghan, T. V.), pp. 79-92. Munksgaard International Booksellers and Publishers. Copenhagen.
Malmer, N. and Wallén, B. 2004. Input rates, decay losses and accumulation rates of carbon in bogs during the last millennium: internal processes and environmental changes. The Holocene. 14, 111-117.
Mattson, J. O. 1979. Introduktion till Mikro- och Lokalklimatologin. Liberläromedel. Malmö. 200 p. Oechel, W. C., Hastings, S. T., Vourlitis, G. et al. 1993. Recent change of arctic tundra ecosystems
from a net carbon dioxide sink to a source. Nature. 361, 520-523. Oechel, W. C., Vourlitis, G. L., Hastings, S. J., et al. 1995. Change in Arctic CO2 flux over two
decades: Effect of climate change at Barrow, Alaska. Ecological Applications. 5, 846-855. Oke, T. R. 1987. Boundary Layer Climates. Methuen. London. 435 p. Osterkamp, T. E. and Romanovsky, V. E. 1999. Evidence for warming and thawing of discontinuous
permafrost in Alaska. Permafrost and Periglacial Processes. 10, 17-37. Romanovsky, V. E., Sazonova, T. S., Balobaev, V. T., Shender, N. I. and Sergueev, D. O. 2007.
Past and recent changes in air and permafrost temperatures in eastern Siberia. Global and Planetary Change. 56, 399-413.
Smith, L. C., Sheng, Y., MacDonald, G. M. et al. 2005. Disappearing Arctic lakes. Science. 308, 1429.
Sonesson, M. 1970. Studies on mire vegetation in the Torneträsk area, Northern Sweden. III. Communities of the Poor Mires. Opera Botanica. 26. 120 p.
Stenborg, T. 1965. Problems concerning winter run-off from glaciers. Geografiska Annaler. 47A (3), 141-185.
Sælthun, N. R. and Barkved, L. 2003. Climate change scenarios for the SCANNET region. NIVA Report. 4663-2003. Norwegian Institute for Water Research. Oslo.
Thorn, C. E., Schlyter, J. P. L., Darmody, R. G. and Dixon, J. C. 1999. Statistical relationship between daily and monthly air and shallow-ground temperatures in Kärkevagge, Swedish Lapland. Permafrost and Periglacial processes. 10, 317-330.
Turetsky, M. R., Kelman Wieder, R. and Vitt, D. H. 2002. Boreal peatland C fluxes under varying permafrost regimes. Soil Biol. Biochem. 34, 907-912.
24
Vitt, D. H., Halsey L. A., Zoltai, S. C. 1994. The bog landforms of continental western Canada in relation to climate and permafrost patterns. Artic and Alpine Research. 26, 1-13.
Walsh, J. E., Anisimov, O., Hagen, J. O. M., Jakobsson, T., Oerlemans, J., Prowse, T., Romanovsky, V., Savelieva, N., Serreze, M., Shiklomanov, A., Shiklomanov, I. and Solomon, S. 2005. Cryosphere and hydrology. Arctic Climate Impact Assessment. Cambridge University Press. 182-242.
Zhang, T., Barry, R. G. and Haeberli, W. 2001b. Numerical simulations of the influence of seasonal snow cover on the occurrence of permafrost at high latitudes. Norsk Geografisk Tidsskrift. 55, 261-266.
Zuidhoff, F. S. and Kolstrup, E. 2000. Changes in palsa distribution in relation to climate change in Laivadalen, northern Sweden, especially 1960-1997. Permafrost and Periglacial Processes. 11, 55-69.

Acknowledgements _________________________________________________________________________________ I would like to thank my supervisor Margareta Johansson for giving me the possibility to do this study, and to go Abisko for to do some of the work there. Thanks also for the great supervision both in Abisko and in Lund. I would also like to thank the staff at Abisko Scientific Research Station and my fellow students for nice company during the work with my thesis. Finally I would like to thank Rickard Almers, Waqas Ahmed and Camille Delepierre for helping me with the proofreading. Theres Svensson Lund, May 30 2008
The author at Abisko on a snowy and windy day in February
25
26
All published degree-thesis _________________________________________________________________________________ The reports are available at the Geo-Library, Department of Physical Geography, University of Lund, Sölvegatan 12, S-223 62 Lund, Sweden. Report series started 1985. 79. Ullman, M., (2001): El Niño Southern Oscillation och dess atmosfäriska
fjärrpåverkan. 80. Andersson, A., (2001): The wind climate of northwestern Europe in SWECLIM
regional climate scenarios. 81. Lalloo, D., (2001): Geografiska informationssystem för studier av polyaromatiska
kolväten (PAH) – Undersökning av djupvariation i BO01-området, Västra hamnen, Malmö, samt utveckling av en matematisk formel för beräkning av PAH-koncentrationer från ett kontinuerligt utsläpp.
82. Almqvist, J., Fergéus, J., (2001): GIS-implementation in Sri Lanka. Part 1: GIS-applications in Hambantota district Sri Lanka : a case study. Part 2: GIS in socio-economic planning : a case study.
83. Berntsson, A., (2001): Modellering av reflektans från ett sockerbetsbestånd med hjälp av en strålningsmodell.
84. Umegård, J., (2001): Arctic aerosol and long-range transport. 85. Rosenberg, R., (2002): Tetratermmodellering och regressionsanalyser mellan
topografi, tetraterm och tillväxt hos sitkagran och lärk – en studie i norra Island. 86. Håkansson, J., Kjörling, A., (2002): Uppskattning av mängden kol i trädform – en
metodstudie. 87. Arvidsson, H., (2002): Coastal parallel sediment transport on the SE Australian inner
shelf – A study of barrier morphodynamics. 88. Bemark, M., (2002): Köphultssjöns tillstånd och omgivningens påverkan. 89. Dahlberg, I., (2002): Rödlistade kärlväxter i Göteborgs innerstad – temporal och
rumslig analys av rödlistade kärlväxter i Göteborgs artdataarkiv, ADA. 90. Poussart, J-N., (2002): Verification of Soil Carbon Sequestration - Uncertainties of
Assessment Methods. 91. Jakubaschk, C., (2002): Acacia senegal, Soil Organic Carbon and Nitrogen Contents:
A Study in North Kordofan, Sudan. 92. Lindqvist, S., (2002): Skattning av kväve i gran med hjälp av fjärranalys. 93. Göthe, A., (2002): Översvämningskartering av Vombs ängar. 94. Lööv, A., (2002): Igenväxning av Köphultasjö – bakomliggande orsaker och
processer. 95. Axelsson, H., (2003): Sårbarhetskartering av bekämpningsmedels läckage till
grundvattnet – Tillämpat på vattenskyddsområdet Ignaberga-Hässleholm. 96. Hedberg, M., Jönsson, L., (2003): Geografiska Informationssystem på Internet – En
webbaserad GIS-applikation med kalknings- och försurningsinformation för Kronobergs län.
97. Svensson, J., (2003): Wind Throw Damages on Forests – Frequency and Associated Pressure Patterns 1961-1990 and in a Future Climate Scenario.
98. Stroh, E., (2003): Analys av fiskrättsförhållandena i Stockholms skärgård i relation till känsliga områden samt fysisk störning.
99. Bäckstrand, K., (2004): The dynamics of non-methane hydrocarbons and other trace gas fluxes on a subarctic mire in northern Sweden.
100. Hahn, K., (2004): Termohalin cirkulation i Nordatlanten. 101. Lina Möllerström (2004): Modelling soil temperature & soil water availability in semi-
arid Sudan: validation and testing. 102. Setterby, Y., (2004): Igenväxande hagmarkers förekomst och tillstånd i Västra
Götaland.
27
103. Edlundh, L., (2004): Utveckling av en metodik för att med hjälp av lagerföljdsdata och geografiska informationssystem (GIS) modellera och rekonstruera våtmarker i Skåne.
104. Schubert, P., (2004): Cultivation potential in Hambantota district, Sri Lanka 105. Brage, T., (2004): Kvalitetskontroll av servicedatabasen Sisyla 106. Sjöström., M., (2004): Investigating Vegetation Changes in the African Sahel 1982-
2002: A Comparative Analysis Using Landsat, MODIS and AVHRR Remote Sensing Data
107. Danilovic, A., Stenqvist, M., (2004): Naturlig föryngring av skog 108. Materia, S., (2004): Forests acting as a carbon source: analysis of two possible causes
for Norunda forest site 109. Hinderson, T., (2004): Analysing environmental change in semi-arid areas in
Kordofan, Sudan 110. Andersson, J., (2004): Skånska småvatten nu och då - jämförelse mellan 1940, 1980
och 2000-talet 111. Tränk, L., (2005): Kadmium i skånska vattendrag – en metodstudie i
föroreningsmodellering. 112. Nilsson, E., Svensson, A.-K., (2005): Agro-Ecological Assessment of Phonxay
District, Luang Phrabang Province, Lao PDR. A Minor Field Study. 113. Svensson, S., (2005): Snowcover dynamics and plant phenology extraction using
digital camera images and its relation to CO2 fluxes at Stordalen mire, Northern Sweden.
114. Barth, P. von., (2005): Småvatten då och nu. En förändringsstudie av småvatten och deras kväveretentionsförmåga.
115. Areskoug, M., (2005): Planering av dagsutflykter på Island med nätverkanalys 116. Lund, M., (2005): Winter dynamics of the greenhouse gas exchange in a natural bog. 117. Persson, E., (2005): Effect of leaf optical properties on remote sensing of leaf area
index in deciduous forest. 118. Mjöfors, K., (2005): How does elevated atmospheric CO2 concentration affect
vegetation productivity? 119. Tollebäck, E.,(2005): Modellering av kväveavskiljningen under fyra år i en anlagd
våtmark på Lilla Böslid, Halland 120. Isacsson, C., (2005): Empiriska samband mellan fältdata och satellitdata – för olika
bokskogområden i södra Sverige. 121. Bergström, D., Malmros, C., (2005): Finding potential sites for small-scale Hydro
Power in Uganda: a step to assist the rural electrification by the use of GIS 122. Magnusson, A., (2005): Kartering av skogsskador hos bok och ek i södra Sverige med
hjälp av satellitdata. 123. Levallius, J., (2005): Green roofs on municipal buildings in Lund – Modeling
potential environmenta benefits. 124. Florén, K., Olsson, M., (2006): Glacifluviala avlagrings- och erosionsformer I
sydöstra Skåne – en sedimentologisk och geomorfologisk undersökning. 125. Liljewalch-Fogelmark, K., (2006): Tågbuller i Skåne – befolkningens exponering. 126.
Irminger Street, T., (2006): The effects of landscape configuration on species richness and diversity in semi-natural grasslands on Öland – a preliminary study.
127. Karlberg, H., (2006): Vegetationsinventering med rumsligt högupplösande satellitdata – en studie av QuickBirddata för kartläggning av gräsmark och konnektivitet i landskapet.
128 Malmgren, A., (2006): Stormskador. En fjärranalytisk studie av stormen Gudruns skogsskador och dess orsaker.
129 Olofsson, J., (2006): Effects of human land-use on the global carbon cycle during the last 6000 years.
130 Johansson , T., (2006): Uppskattning av nettoprimärproduktionen (NPP) i stormfällen efter stormen Gudrun med hjälp av satellitdata.
131 Eckeskog, M., (2006) Spatial distribution of hydraulic conductivity in the Rio Sucio drainage basin, Nicaragua.
28
132 Lagerstedt, J., (2006): The effects of managed ruminants grazing on the global carbon cycle and greenhouse gas forcing.
133 Persson, P., (2007) Investigating the Impact of Ground Reflectance on Satellite Estimates of Forest Leaf Area Index
134 Valoczi, P. (2007) Koldioxidbalans och koldioxidinnehållsimulering av barrskog I Kristianstads län, samt klimatförändringens inverkan på skogen.
135 Johansson, H. (2007) Dalby Söderskog - en studie av trädarternas sammansättning 1921 jämfört med 2005
137 Kalén, V. (2007) Analysing temporal and spatial variations in DOC concentrations in Scanian lakes and streams, using GIS and Remote Sensing
138 Maichel, V. (2007) Kvalitetsbedömning av kväveretentionen i nyanlagda våtmarker i Skåne
139 Agardh, M. (2007) Koldioxidbudget för Högestad – utsläpp/upptag och åtgärdsförslag
140 Peterz, S. (2007) Do landscape properties influence the migration of Ospreys? 141 Hendrikson, K. (2007) Småvatten och groddjur i Täby kommun 142 Carlsson, A. (2008) Antropogen påverkan i Sahel – påverkar människans aktivitet
NDVI uppmätt med satellit. 143 Paulsson, R. (2008) Analysing climate effect of agriculture and forestry in southern
Sweden at Högestad & Christinehof Estate 144 Ahlstrom, A. (2008) Accessibility, Poverty and Land Cover in Hambantota District,
Sri Lanka. Incorporating local knowledge into a GIS based accessibility model.