Embed Size (px)
Citation preview
Increasing Desalination by Mitigating Anolyte pH Imbalance UsingCatholyte Effluent Addition in a Multi-Anode Bench Scale MicrobialDesalination CellRobert J. Davis, Younggy Kim,† and Bruce E. Logan*
Department of Civil and Environmental Engineering, The Pennsyvania State University, 231Q Sackett Building, University Park,Pennsylvania 16802, United States
*S Supporting Information
ABSTRACT: A microbial desalination cell (MDC) uses exoelectrogenic bacteria to oxidize organic matterwhile desalinating water. Protons produced from the oxidation of organics at the anode result in anolyteacidification and reduce performance. A new method was used here to mitigate anolyte acidification based onadding non-buffered saline catholyte effluent from a previous cycle to the anolyte at the beginning of the nextcycle. This method was tested using a larger-scale MDC (267 mL) containing four anode brushes and a threecell pair membrane stack. With an anolyte salt concentration increased by an equivalent of 75 mM NaClusing the catholyte effluent, salinity was reduced by 26.0 ± 0.5% (35 g/L NaCl initial solution) in a 10 hcycle, compared to 18.1 ± 2.0% without catholyte addition. This improvement was primarily due to theincrease in buffering capacity of the anolyte, although increased conductivity slightly improved performanceas well. There was some substrate loss from the anolyte by diffusion into the membrane stack, but this wasdecreased from 11% to 2.6% by increasing the anolyte conductivity (7.6 to 14 mS/cm). These resultsdemonstrated that catholyte effluent can be utilized as a useful product for mitigating anolyte acidificationand improving MDC performance.
KEYWORDS: Microbial desalination cell, Desalination, Multi-anode, Anolyte acidification, Electrolyte recycle, MDC
■ INTRODUCTION
It is estimated that more than 4 billion people currently live inhigh water stressed regions in the world, and that 2.5 billionlack safe sanitary practices.1,2 Conservation and infrastructureimprovement can help alleviate some of the water stress, butwith the global water shortage projected to grow through 2050due to the effects of climate change, industrialization, andpopulation growth, new sources of water will be needed.3 Thenumber of seawater desalination facilities is predicted toincrease exponentially in the next 10 years, but currentcommercial desalination techniques such as electrodialysis,thermal desalination, and reverse osmosis have many environ-mental concerns and high energy costs.4,5 Even with state of theart advances in reverse osmosis technology bringing its energyconsumption close to the practical theoretical minimum, theenergy cost for seawater desalination is still too high forwidespread implementation, especially in poorer regions, whichare the majority of the water stressed demographic.6
A new desalination technology has recently been developed,called a microbial desalination cell (MDC), that usesexoelectrogenic microorganisms to degrade organic matter inwastewater and generate electricity.7 This process is coupledwith a stack of ion exchange membranes to desalinate water andproduce energy. One of the main factors limiting MDCperformance has been anolyte acidification. As organic matterin wastewater is oxidized by exoelectrogenic bacteria on theanode and electrons are transferred to the electrode, protonsare released into solution, lowering the anolyte pH. The rate of
proton production at the anode is greater than the rate of bufferdiffusion into the anode biofilm, which results in a pH gradientbetween the solution and biofilm. This creates an acidicenvironment for the anodic microbial community that canoccur even before it is detected in bulk solution.8 A decrease inthe pH below neutral inhibits the respiration of anodicbacteria.9,10 This pH change is heightened in MDCs astransport of protons from the anode chamber is limited due tothe anion exchange membrane in the membrane stack locatedadjacent to the anode chamber. Similarly, at the cathode, thepH increases when a cation exchange membrane is placed nextto the cathode chamber.Several different approaches have been used to avoid
decreases in anode pH such as using larger volumes ofelectrolyte solutions,7,11 applying electrolyte recirculationbetween the cathode and anode chambers,12,13 or inserting abipolar membrane next to the anode chamber.14 Largerelectrolyte solution volumes increase cycle time by providingmore solution to balance pH, but they require higheroperational and capital costs associated with pumping andstoring larger volumes of water and do not solve the inherentpH problem. Electrolyte recirculation extends cycle time bybalancing protons accumulated in the anode chamber withhydroxide ions that are formed in the cathode chamber, but the
Received: May 17, 2013Revised: June 24, 2013Published: June 28, 2013
Research Article
pubs.acs.org/journal/ascecg
© 2013 American Chemical Society 1200 dx.doi.org/10.1021/sc400148j | ACS Sustainable Chem. Eng. 2013, 1, 1200−1206
introduction of organic matter into the cathode chamber canresult in extensive biofouling of the cathode and lowCoulombic efficiencies (<25%). A bipolar membrane can beused instead of the anion exchange membrane next to theanode chamber to dissociate water and balance pH. However, alarge voltage (1.0 V) must be used due to the high resistance ofthe bipolar membrane, which makes the process energyintensive.A different approach was used here to mitigate anolyte pH
imbalance based on using the cathode solution. Instead ofrecycling electrolyte solutions between the electrode chambers,the non-buffered and saline catholyte effluent was mixed oncewith fresh anolyte to increase the anolyte alkalinity and ionicconductivity. Oxygen reduction reaction at the cathodeconsumes protons and increases the pH to approximately12.8. The catholyte has a high conductivity due to the salinityof the water being desalinated (∼70 mS/cm with 35 g/LNaCl). Therefore, adding the catholyte to the anolyte increasesthe conductivity of the anolyte solution and reduces internalresistance. The effectiveness of amending the anolyte withcatholyte was examined here using a larger-scale multi-anodeelectrode MDC in terms of current production, desalination,power generation, and COD removal. The transport of anionsout of the anode chamber during a cycle by back-diffusion wasalso measured to determine substrate losses from the anodechamber. Additional experiments were conducted by addingNaCl directly to the anolyte, allowing observation of the effectof conductivity separately from that produced by catholyte pH.
■ MATERIALS AND METHODSMDC Construction. The anode and cathode chambers were
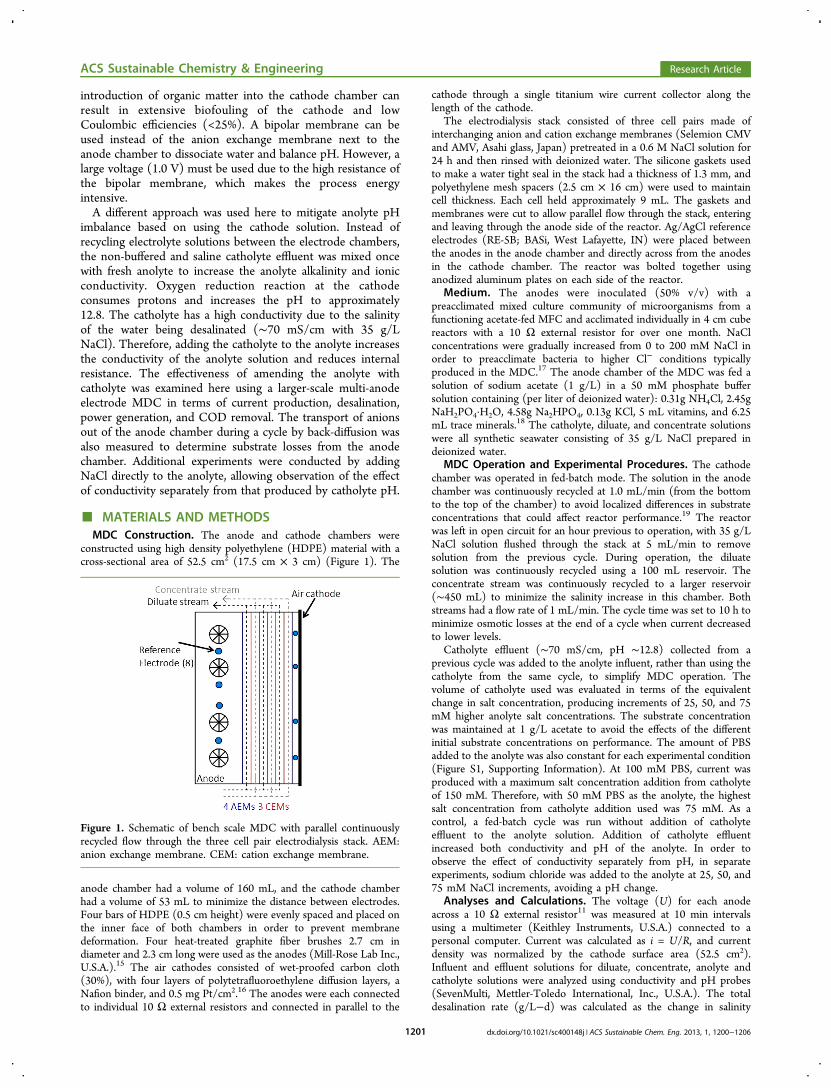
constructed using high density polyethylene (HDPE) material with across-sectional area of 52.5 cm2 (17.5 cm × 3 cm) (Figure 1). The
anode chamber had a volume of 160 mL, and the cathode chamberhad a volume of 53 mL to minimize the distance between electrodes.Four bars of HDPE (0.5 cm height) were evenly spaced and placed onthe inner face of both chambers in order to prevent membranedeformation. Four heat-treated graphite fiber brushes 2.7 cm indiameter and 2.3 cm long were used as the anodes (Mill-Rose Lab Inc.,U.S.A.).15 The air cathodes consisted of wet-proofed carbon cloth(30%), with four layers of polytetrafluoroethylene diffusion layers, aNafion binder, and 0.5 mg Pt/cm2.16 The anodes were each connectedto individual 10 Ω external resistors and connected in parallel to the
cathode through a single titanium wire current collector along thelength of the cathode.
The electrodialysis stack consisted of three cell pairs made ofinterchanging anion and cation exchange membranes (Selemion CMVand AMV, Asahi glass, Japan) pretreated in a 0.6 M NaCl solution for24 h and then rinsed with deionized water. The silicone gaskets usedto make a water tight seal in the stack had a thickness of 1.3 mm, andpolyethylene mesh spacers (2.5 cm × 16 cm) were used to maintaincell thickness. Each cell held approximately 9 mL. The gaskets andmembranes were cut to allow parallel flow through the stack, enteringand leaving through the anode side of the reactor. Ag/AgCl referenceelectrodes (RE-5B; BASi, West Lafayette, IN) were placed betweenthe anodes in the anode chamber and directly across from the anodesin the cathode chamber. The reactor was bolted together usinganodized aluminum plates on each side of the reactor.
Medium. The anodes were inoculated (50% v/v) with apreacclimated mixed culture community of microorganisms from afunctioning acetate-fed MFC and acclimated individually in 4 cm cubereactors with a 10 Ω external resistor for over one month. NaClconcentrations were gradually increased from 0 to 200 mM NaCl inorder to preacclimate bacteria to higher Cl− conditions typicallyproduced in the MDC.17 The anode chamber of the MDC was fed asolution of sodium acetate (1 g/L) in a 50 mM phosphate buffersolution containing (per liter of deionized water): 0.31g NH4Cl, 2.45gNaH2PO4·H2O, 4.58g Na2HPO4, 0.13g KCl, 5 mL vitamins, and 6.25mL trace minerals.18 The catholyte, diluate, and concentrate solutionswere all synthetic seawater consisting of 35 g/L NaCl prepared indeionized water.
MDC Operation and Experimental Procedures. The cathodechamber was operated in fed-batch mode. The solution in the anodechamber was continuously recycled at 1.0 mL/min (from the bottomto the top of the chamber) to avoid localized differences in substrateconcentrations that could affect reactor performance.19 The reactorwas left in open circuit for an hour previous to operation, with 35 g/LNaCl solution flushed through the stack at 5 mL/min to removesolution from the previous cycle. During operation, the diluatesolution was continuously recycled using a 100 mL reservoir. Theconcentrate stream was continuously recycled to a larger reservoir(∼450 mL) to minimize the salinity increase in this chamber. Bothstreams had a flow rate of 1 mL/min. The cycle time was set to 10 h tominimize osmotic losses at the end of a cycle when current decreasedto lower levels.
Catholyte effluent (∼70 mS/cm, pH ∼12.8) collected from aprevious cycle was added to the anolyte influent, rather than using thecatholyte from the same cycle, to simplify MDC operation. Thevolume of catholyte used was evaluated in terms of the equivalentchange in salt concentration, producing increments of 25, 50, and 75mM higher anolyte salt concentrations. The substrate concentrationwas maintained at 1 g/L acetate to avoid the effects of the differentinitial substrate concentrations on performance. The amount of PBSadded to the anolyte was also constant for each experimental condition(Figure S1, Supporting Information). At 100 mM PBS, current wasproduced with a maximum salt concentration addition from catholyteof 150 mM. Therefore, with 50 mM PBS as the anolyte, the highestsalt concentration from catholyte addition used was 75 mM. As acontrol, a fed-batch cycle was run without addition of catholyteeffluent to the anolyte solution. Addition of catholyte effluentincreased both conductivity and pH of the anolyte. In order toobserve the effect of conductivity separately from pH, in separateexperiments, sodium chloride was added to the anolyte at 25, 50, and75 mM NaCl increments, avoiding a pH change.
Analyses and Calculations. The voltage (U) for each anodeacross a 10 Ω external resistor11 was measured at 10 min intervalsusing a multimeter (Keithley Instruments, U.S.A.) connected to apersonal computer. Current was calculated as i = U/R, and currentdensity was normalized by the cathode surface area (52.5 cm2).Influent and effluent solutions for diluate, concentrate, anolyte andcatholyte solutions were analyzed using conductivity and pH probes(SevenMulti, Mettler-Toledo International, Inc., U.S.A.). The totaldesalination rate (g/L−d) was calculated as the change in salinity
Figure 1. Schematic of bench scale MDC with parallel continuouslyrecycled flow through the three cell pair electrodialysis stack. AEM:anion exchange membrane. CEM: cation exchange membrane.
ACS Sustainable Chemistry & Engineering Research Article
dx.doi.org/10.1021/sc400148j | ACS Sustainable Chem. Eng. 2013, 1, 1200−12061201
based on total dissolved solids. The salinity was estimated fromconductivity measurements using an in situ conductivity conversion aspreviously outlined by Bennett20 and assuming the conductivitymeasured was due only to NaCl. Current efficiency (η) wasdetermined as ratio of ionic separation of NaCl to the total numberof electrons passed through the circuit, as
η =−
∑ ∫
F c v c vN
( )
i t
inD
inD
outD
outD
cp d (1)
where F is Faraday’s constant, c the molar concentration of NaCl inthe diluate, v the volume of the diluate, Ncp the number of cell pairs inthe electrodialysis stack, and i the current generated in the reactor. Thesubscript “in” indicates conditions at the beginning of the cycle, “out”the end of the cycle, and the superscript “D” indicates diluate.17
The chemical oxygen demand (COD) was measured for influentand effluent anolyte solutions using standard methods (Hach Co.,U.S.A.). The COD sample was diluted at a 1:10 ratio in order tominimize the effect of chloride ions on measurements. The Coulombicefficiency (CE) was calculated based on the total COD removed andthe number of coulombs collected during the cycle as previouslydescribed.21 The Coulombic efficiency calculated here was modified toaccount for acetate losses due to diffusion out of the anode chamber,as
∫=
− +
M I t
Fb vCE
d
(COD COD COD )diffO2 0
t
es an in eff diff (2)
where MO2 is the molecular weight of O2 (32 g/mol), bes the numberof electrons exchanged per mole of oxygen (4 mol e−/mol O2), CODinthe measured substrate concentration at the beginning of the cycle,CODeff the measured concentration at the end of the cycle, andCODdiff the substrate concentration measured in the adjacent diluatesolution due to diffusion through the membrane.Diluate samples were analyzed for phosphate using ion chromatog-
raphy (IC, Dionex ICS-1100) and acetate using high performanceliquid chromatography (HPLC, Shimadzu LC-20AT). The powerdensity was measured for each experimental condition using anexternal resistance ranging from 10 to 10,000 Ω at 20 min intervals,after the reactor was initially set at open circuit for ∼1 h. Duringpolarization tests, salt solution (35 g/L NaCl) was continuously flowedthrough the electrodialysis stack at a flow rate of 5 mL/min in order tominimize losses due to junction potential and to decrease internalresistance as previously demonstrated.17 Power densities (mW/m2)were normalized by the cathode projected surface area.
■ RESULTSDesalination and Current Generation. The MDC was
run under four different operating conditions, each with varyingamounts of catholyte effluent added to the anolyte. The salt
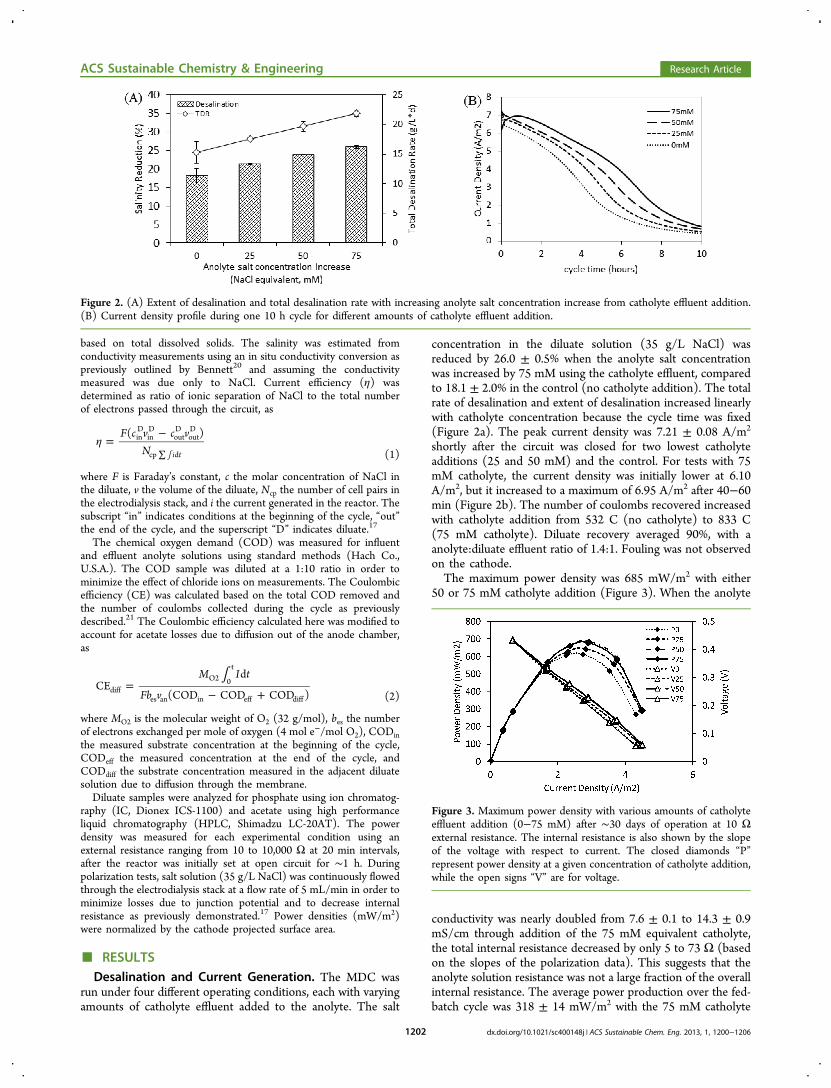
concentration in the diluate solution (35 g/L NaCl) wasreduced by 26.0 ± 0.5% when the anolyte salt concentrationwas increased by 75 mM using the catholyte effluent, comparedto 18.1 ± 2.0% in the control (no catholyte addition). The totalrate of desalination and extent of desalination increased linearlywith catholyte concentration because the cycle time was fixed(Figure 2a). The peak current density was 7.21 ± 0.08 A/m2
shortly after the circuit was closed for two lowest catholyteadditions (25 and 50 mM) and the control. For tests with 75mM catholyte, the current density was initially lower at 6.10A/m2, but it increased to a maximum of 6.95 A/m2 after 40−60min (Figure 2b). The number of coulombs recovered increasedwith catholyte addition from 532 C (no catholyte) to 833 C(75 mM catholyte). Diluate recovery averaged 90%, with aanolyte:diluate effluent ratio of 1.4:1. Fouling was not observedon the cathode.The maximum power density was 685 mW/m2 with either
50 or 75 mM catholyte addition (Figure 3). When the anolyte
conductivity was nearly doubled from 7.6 ± 0.1 to 14.3 ± 0.9mS/cm through addition of the 75 mM equivalent catholyte,the total internal resistance decreased by only 5 to 73 Ω (basedon the slopes of the polarization data). This suggests that theanolyte solution resistance was not a large fraction of the overallinternal resistance. The average power production over the fed-batch cycle was 318 ± 14 mW/m2 with the 75 mM catholyte
Figure 2. (A) Extent of desalination and total desalination rate with increasing anolyte salt concentration increase from catholyte effluent addition.(B) Current density profile during one 10 h cycle for different amounts of catholyte effluent addition.
Figure 3. Maximum power density with various amounts of catholyteeffluent addition (0−75 mM) after ∼30 days of operation at 10 Ωexternal resistance. The internal resistance is also shown by the slopeof the voltage with respect to current. The closed diamonds “P”represent power density at a given concentration of catholyte addition,while the open signs “V” are for voltage.
ACS Sustainable Chemistry & Engineering Research Article
dx.doi.org/10.1021/sc400148j | ACS Sustainable Chem. Eng. 2013, 1, 1200−12061202
addition, and this power density decreased linearly with smallervolumes of catholyte addition (Figure S2, SupportingInformation). The external resistance of the MDC was set tomaximize current and therefore desalination rate rather thanpower production. Increasing the external resistance could yieldhigher power densities as discussed by Jacobson et al.22
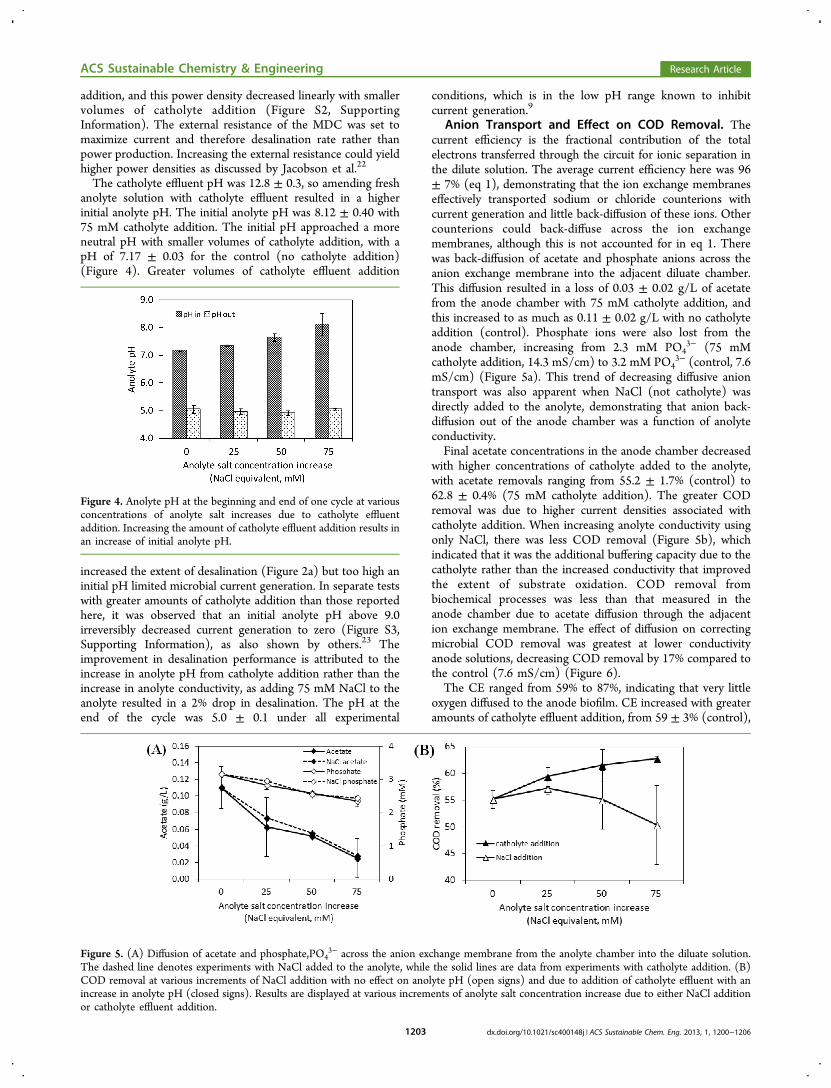
The catholyte effluent pH was 12.8 ± 0.3, so amending freshanolyte solution with catholyte effluent resulted in a higherinitial anolyte pH. The initial anolyte pH was 8.12 ± 0.40 with75 mM catholyte addition. The initial pH approached a moreneutral pH with smaller volumes of catholyte addition, with apH of 7.17 ± 0.03 for the control (no catholyte addition)(Figure 4). Greater volumes of catholyte effluent addition
increased the extent of desalination (Figure 2a) but too high aninitial pH limited microbial current generation. In separate testswith greater amounts of catholyte addition than those reportedhere, it was observed that an initial anolyte pH above 9.0irreversibly decreased current generation to zero (Figure S3,Supporting Information), as also shown by others.23 Theimprovement in desalination performance is attributed to theincrease in anolyte pH from catholyte addition rather than theincrease in anolyte conductivity, as adding 75 mM NaCl to theanolyte resulted in a 2% drop in desalination. The pH at theend of the cycle was 5.0 ± 0.1 under all experimental
conditions, which is in the low pH range known to inhibitcurrent generation.9
Anion Transport and Effect on COD Removal. Thecurrent efficiency is the fractional contribution of the totalelectrons transferred through the circuit for ionic separation inthe dilute solution. The average current efficiency here was 96± 7% (eq 1), demonstrating that the ion exchange membraneseffectively transported sodium or chloride counterions withcurrent generation and little back-diffusion of these ions. Othercounterions could back-diffuse across the ion exchangemembranes, although this is not accounted for in eq 1. Therewas back-diffusion of acetate and phosphate anions across theanion exchange membrane into the adjacent diluate chamber.This diffusion resulted in a loss of 0.03 ± 0.02 g/L of acetatefrom the anode chamber with 75 mM catholyte addition, andthis increased to as much as 0.11 ± 0.02 g/L with no catholyteaddition (control). Phosphate ions were also lost from theanode chamber, increasing from 2.3 mM PO4
3− (75 mMcatholyte addition, 14.3 mS/cm) to 3.2 mM PO4
3− (control, 7.6mS/cm) (Figure 5a). This trend of decreasing diffusive aniontransport was also apparent when NaCl (not catholyte) wasdirectly added to the anolyte, demonstrating that anion back-diffusion out of the anode chamber was a function of anolyteconductivity.Final acetate concentrations in the anode chamber decreased
with higher concentrations of catholyte added to the anolyte,with acetate removals ranging from 55.2 ± 1.7% (control) to62.8 ± 0.4% (75 mM catholyte addition). The greater CODremoval was due to higher current densities associated withcatholyte addition. When increasing anolyte conductivity usingonly NaCl, there was less COD removal (Figure 5b), whichindicated that it was the additional buffering capacity due to thecatholyte rather than the increased conductivity that improvedthe extent of substrate oxidation. COD removal frombiochemical processes was less than that measured in theanode chamber due to acetate diffusion through the adjacention exchange membrane. The effect of diffusion on correctingmicrobial COD removal was greatest at lower conductivityanode solutions, decreasing COD removal by 17% compared tothe control (7.6 mS/cm) (Figure 6).The CE ranged from 59% to 87%, indicating that very little
oxygen diffused to the anode biofilm. CE increased with greateramounts of catholyte effluent addition, from 59 ± 3% (control),
Figure 4. Anolyte pH at the beginning and end of one cycle at variousconcentrations of anolyte salt increases due to catholyte effluentaddition. Increasing the amount of catholyte effluent addition results inan increase of initial anolyte pH.
Figure 5. (A) Diffusion of acetate and phosphate,PO43− across the anion exchange membrane from the anolyte chamber into the diluate solution.
The dashed line denotes experiments with NaCl added to the anolyte, while the solid lines are data from experiments with catholyte addition. (B)COD removal at various increments of NaCl addition with no effect on anolyte pH (open signs) and due to addition of catholyte effluent with anincrease in anolyte pH (closed signs). Results are displayed at various increments of anolyte salt concentration increase due to either NaCl additionor catholyte effluent addition.
ACS Sustainable Chemistry & Engineering Research Article
dx.doi.org/10.1021/sc400148j | ACS Sustainable Chem. Eng. 2013, 1, 1200−12061203
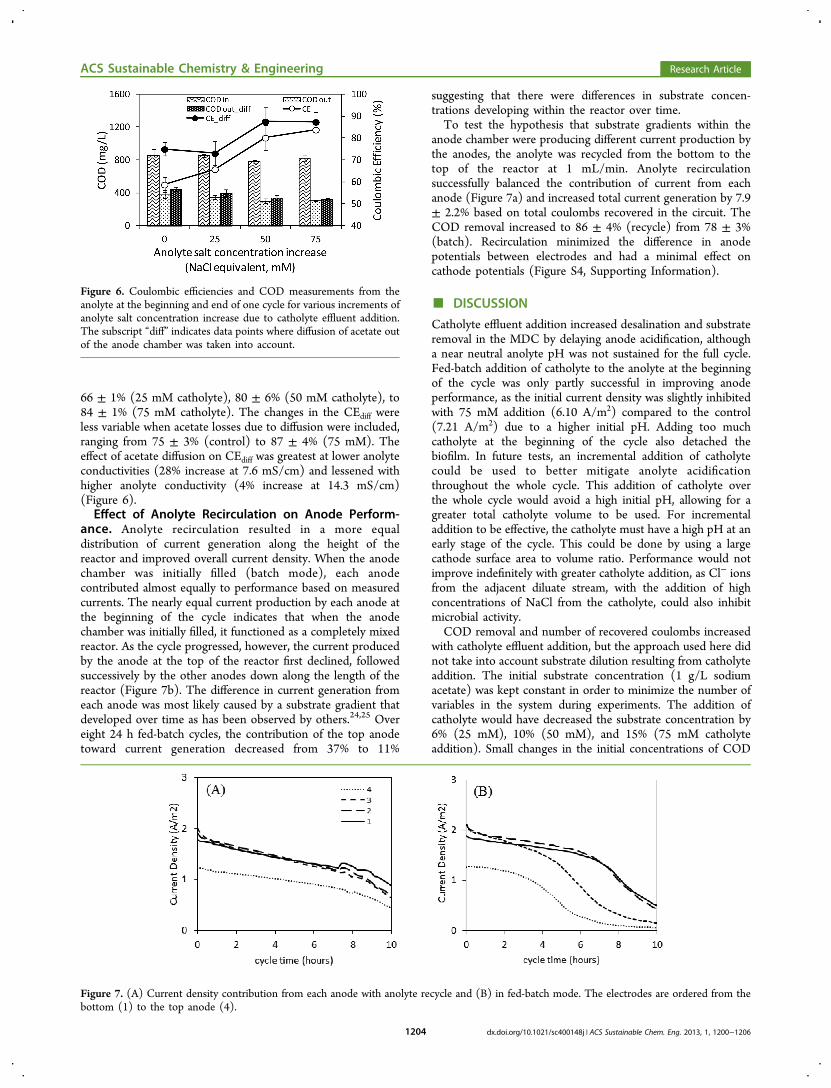
66 ± 1% (25 mM catholyte), 80 ± 6% (50 mM catholyte), to84 ± 1% (75 mM catholyte). The changes in the CEdiff wereless variable when acetate losses due to diffusion were included,ranging from 75 ± 3% (control) to 87 ± 4% (75 mM). Theeffect of acetate diffusion on CEdiff was greatest at lower anolyteconductivities (28% increase at 7.6 mS/cm) and lessened withhigher anolyte conductivity (4% increase at 14.3 mS/cm)(Figure 6).Effect of Anolyte Recirculation on Anode Perform-
ance. Anolyte recirculation resulted in a more equaldistribution of current generation along the height of thereactor and improved overall current density. When the anodechamber was initially filled (batch mode), each anodecontributed almost equally to performance based on measuredcurrents. The nearly equal current production by each anode atthe beginning of the cycle indicates that when the anodechamber was initially filled, it functioned as a completely mixedreactor. As the cycle progressed, however, the current producedby the anode at the top of the reactor first declined, followedsuccessively by the other anodes down along the length of thereactor (Figure 7b). The difference in current generation fromeach anode was most likely caused by a substrate gradient thatdeveloped over time as has been observed by others.24,25 Overeight 24 h fed-batch cycles, the contribution of the top anodetoward current generation decreased from 37% to 11%
suggesting that there were differences in substrate concen-trations developing within the reactor over time.To test the hypothesis that substrate gradients within the
anode chamber were producing different current production bythe anodes, the anolyte was recycled from the bottom to thetop of the reactor at 1 mL/min. Anolyte recirculationsuccessfully balanced the contribution of current from eachanode (Figure 7a) and increased total current generation by 7.9± 2.2% based on total coulombs recovered in the circuit. TheCOD removal increased to 86 ± 4% (recycle) from 78 ± 3%(batch). Recirculation minimized the difference in anodepotentials between electrodes and had a minimal effect oncathode potentials (Figure S4, Supporting Information).
■ DISCUSSION
Catholyte effluent addition increased desalination and substrateremoval in the MDC by delaying anode acidification, althougha near neutral anolyte pH was not sustained for the full cycle.Fed-batch addition of catholyte to the anolyte at the beginningof the cycle was only partly successful in improving anodeperformance, as the initial current density was slightly inhibitedwith 75 mM addition (6.10 A/m2) compared to the control(7.21 A/m2) due to a higher initial pH. Adding too muchcatholyte at the beginning of the cycle also detached thebiofilm. In future tests, an incremental addition of catholytecould be used to better mitigate anolyte acidificationthroughout the whole cycle. This addition of catholyte overthe whole cycle would avoid a high initial pH, allowing for agreater total catholyte volume to be used. For incrementaladdition to be effective, the catholyte must have a high pH at anearly stage of the cycle. This could be done by using a largecathode surface area to volume ratio. Performance would notimprove indefinitely with greater catholyte addition, as Cl− ionsfrom the adjacent diluate stream, with the addition of highconcentrations of NaCl from the catholyte, could also inhibitmicrobial activity.COD removal and number of recovered coulombs increased
with catholyte effluent addition, but the approach used here didnot take into account substrate dilution resulting from catholyteaddition. The initial substrate concentration (1 g/L sodiumacetate) was kept constant in order to minimize the number ofvariables in the system during experiments. The addition ofcatholyte would have decreased the substrate concentration by6% (25 mM), 10% (50 mM), and 15% (75 mM catholyteaddition). Small changes in the initial concentrations of COD
Figure 6. Coulombic efficiencies and COD measurements from theanolyte at the beginning and end of one cycle for various increments ofanolyte salt concentration increase due to catholyte effluent addition.The subscript “diff” indicates data points where diffusion of acetate outof the anode chamber was taken into account.
Figure 7. (A) Current density contribution from each anode with anolyte recycle and (B) in fed-batch mode. The electrodes are ordered from thebottom (1) to the top anode (4).
ACS Sustainable Chemistry & Engineering Research Article
dx.doi.org/10.1021/sc400148j | ACS Sustainable Chem. Eng. 2013, 1, 1200−12061204
(>850 mg COD/L) would have had little effect on powergeneration, but at lower COD concentrations power candecrease substantially with the COD concentration.24,26,27
Substrate concentration is therefore only a factor at lowerCOD concentrations. At high COD concentrations, otherfactors are more important for maximizing current productionsuch as pH and conductivity. Substrate dilution could thereforehave an impact on performance of the MDC with eitherincremental or continuous addition of the catholyte to anolyte,in terms of reduced cycle times, desalination rates, or extent ofdesalination.Substrate losses by anion diffusion out of the anode chamber
affected both the CEdiff and COD removal. The CE is ameasure of the ratio of recovered coulombs as current to thetotal theoretical amount of coulombs that could be producedby the oxidized substrate. Losses in CE typically arise from theuse of alternate electron acceptors by the bacteria on the anode,such as oxygen, or from the incomplete oxidation of a substrate.The CE typically is calculated based only on currentproduction, with the assumption that all of the other substratelosses are due to other biological processes.21 However, asshown in MDC tests here, there was significant loss (11%) ofsubstrate through physical diffusion through the membrane.When an anion exchange membrane is placed adjacent to theanode chamber, transport of negatively charged species, such asacetate anions, should be measured and accounted for in theCOD removal and CE calculations (eq 2). In a two chamberMFC, substrate losses through the membrane have also beenshown to decrease cathode electrode performance.28 Withoutconsidering substrate diffusion, total COD degradation will beoverestimated and CE underestimated.In considering scale up of MDCs, two important factors are
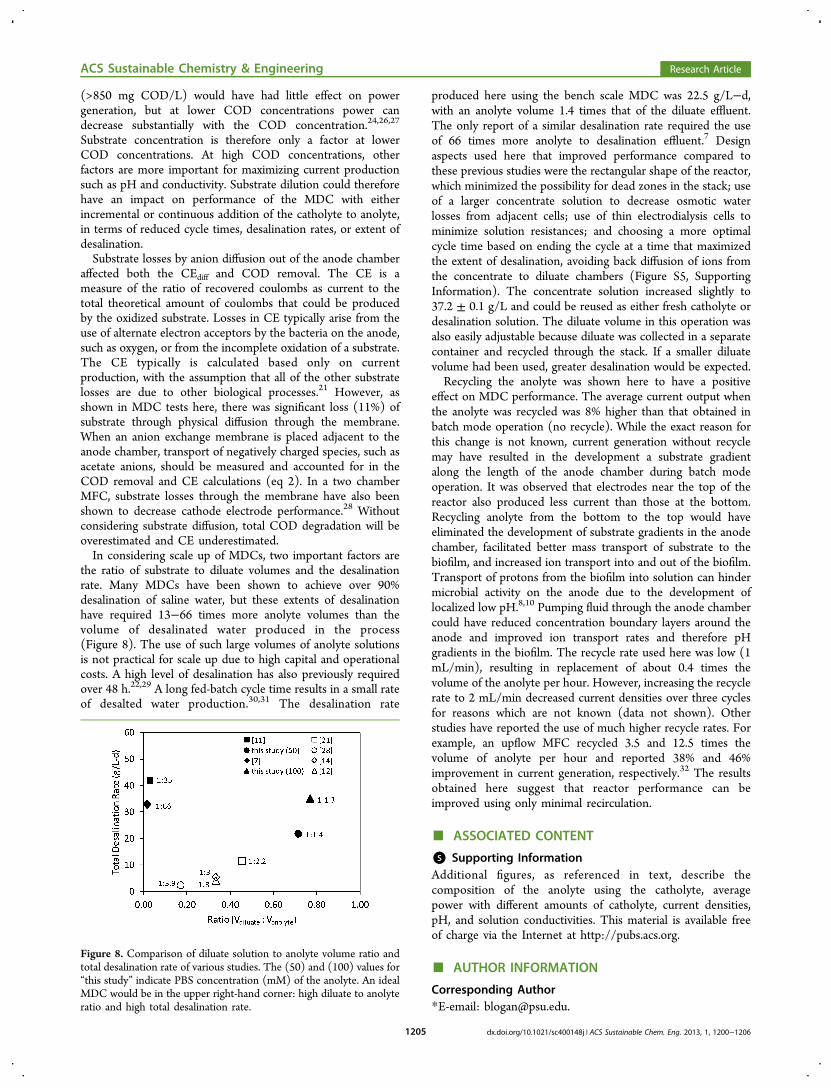
the ratio of substrate to diluate volumes and the desalinationrate. Many MDCs have been shown to achieve over 90%desalination of saline water, but these extents of desalinationhave required 13−66 times more anolyte volumes than thevolume of desalinated water produced in the process(Figure 8). The use of such large volumes of anolyte solutionsis not practical for scale up due to high capital and operationalcosts. A high level of desalination has also previously requiredover 48 h.22,29 A long fed-batch cycle time results in a small rateof desalted water production.30,31 The desalination rate
produced here using the bench scale MDC was 22.5 g/L−d,with an anolyte volume 1.4 times that of the diluate effluent.The only report of a similar desalination rate required the useof 66 times more anolyte to desalination effluent.7 Designaspects used here that improved performance compared tothese previous studies were the rectangular shape of the reactor,which minimized the possibility for dead zones in the stack; useof a larger concentrate solution to decrease osmotic waterlosses from adjacent cells; use of thin electrodialysis cells tominimize solution resistances; and choosing a more optimalcycle time based on ending the cycle at a time that maximizedthe extent of desalination, avoiding back diffusion of ions fromthe concentrate to diluate chambers (Figure S5, SupportingInformation). The concentrate solution increased slightly to37.2 ± 0.1 g/L and could be reused as either fresh catholyte ordesalination solution. The diluate volume in this operation wasalso easily adjustable because diluate was collected in a separatecontainer and recycled through the stack. If a smaller diluatevolume had been used, greater desalination would be expected.Recycling the anolyte was shown here to have a positive
effect on MDC performance. The average current output whenthe anolyte was recycled was 8% higher than that obtained inbatch mode operation (no recycle). While the exact reason forthis change is not known, current generation without recyclemay have resulted in the development a substrate gradientalong the length of the anode chamber during batch modeoperation. It was observed that electrodes near the top of thereactor also produced less current than those at the bottom.Recycling anolyte from the bottom to the top would haveeliminated the development of substrate gradients in the anodechamber, facilitated better mass transport of substrate to thebiofilm, and increased ion transport into and out of the biofilm.Transport of protons from the biofilm into solution can hindermicrobial activity on the anode due to the development oflocalized low pH.8,10 Pumping fluid through the anode chambercould have reduced concentration boundary layers around theanode and improved ion transport rates and therefore pHgradients in the biofilm. The recycle rate used here was low (1mL/min), resulting in replacement of about 0.4 times thevolume of the anolyte per hour. However, increasing the recyclerate to 2 mL/min decreased current densities over three cyclesfor reasons which are not known (data not shown). Otherstudies have reported the use of much higher recycle rates. Forexample, an upflow MFC recycled 3.5 and 12.5 times thevolume of anolyte per hour and reported 38% and 46%improvement in current generation, respectively.32 The resultsobtained here suggest that reactor performance can beimproved using only minimal recirculation.
■ ASSOCIATED CONTENT
*S Supporting InformationAdditional figures, as referenced in text, describe thecomposition of the anolyte using the catholyte, averagepower with different amounts of catholyte, current densities,pH, and solution conductivities. This material is available freeof charge via the Internet at http://pubs.acs.org.
■ AUTHOR INFORMATION
Corresponding Author*E-email: [email protected].
Figure 8. Comparison of diluate solution to anolyte volume ratio andtotal desalination rate of various studies. The (50) and (100) values for“this study” indicate PBS concentration (mM) of the anolyte. An idealMDC would be in the upper right-hand corner: high diluate to anolyteratio and high total desalination rate.
ACS Sustainable Chemistry & Engineering Research Article
dx.doi.org/10.1021/sc400148j | ACS Sustainable Chem. Eng. 2013, 1, 1200−12061205
Present Address†Younggy Kim: Department of Civil Engineering, McMasterUniversity, Hamilton, ON L8S 4L7, Canada
NotesThe authors declare no competing financial interest.
■ ACKNOWLEDGMENTS
The authors thank Siemens Corp. for kindly donating anelectrodialysis reactor as a design reference for this project,Hiroyuki Kashima for his help with ion chromatography, andDr. Xiuping Zhu for conducting the HPLC analysis. Thisresearch was supported by Award KUS-11-003-13 from theKing Abdullah University of Science and Technology(KAUST).
■ REFERENCES(1) Vorosmarty, C.; McIntyre, P.; Gessner, M.; Dudgeon, D.;Prusevich, A.; Green, P.; Glidden, S.; Bunn, S.; Sullivan, C.; Liermann,C.; Davies, P. Global threats to human water security and riverbiodiversity. Nature 2010, 467, 555.(2) Progress on Drinking Water and Sanitation; World HealthOrganization and UNICEF: Geneva, Switzerland, 2012.(3) Oki, T.; Kanae, S. Global hydrological cycles and world waterresources. Science 2006, 313, 1068.(4) Zhou, Y.; Tol, R. Evaluating the costs of desalination and watertransport. Water Resour. Res. 2005, 41 (3), 1−10.(5) Christen, K. Environmental costs of desalination. Environ. Sci.Technol. 2007, 41, 5579.(6) Elimelech, M.; Phillip, W. The future of seawater desalination:Energy, technology, and the environment. Science 2011, 333, 712.(7) Cao, X.; Huang, X.; Liang, P.; Xiao, K.; Zhou, Y.; Zhang, X.;Logan, B. A new method for water desalination using microbialdesalination cells. Environ. Sci. Technol. 2009, 43, 7148−7152.(8) Franks, A.; Nevin, K.; Jia, H.; Izallalen, M.; Woodard, T.; Lovely,D. Novel strategy for three-dimensional real-time imaging of microbialfuel cell communities: Monitoring the inhibitory effects of protonaccumulation within the anode biofilm. Energy Environ. Sci. 2009, 2,113−119.(9) He, Z.; Huang, Y.; Manohar, A.; Mansfeld, F. Effect of electrolytepH on the rate of the anodic and cathodic reactions in an air−cathodemicrobial fuel cell. Bioelectrochemistry 2008, 74, 78−82.(10) Torres, C.; Marcus, A.; Rittmann, B. Proton transport inside thebiofilm limits electrical current generation by anode-respiring bacteria.Biotechnol. Bioeng. 2008, 100 (5), 872−881.(11) Chen, X.; Xia, X.; Liang, P.; Cao, X.; Sun, H.; Huang, X. Stackedmicrobial desalination cells to enhance water desalination efficiency.Environ. Sci. Technol. 2011, 45, 2465−2470.(12) Qu, Y.; Feng, Y.; Wang, X.; Liu, J.; Lv, J.; He, W.; Logan, B.Simultaneous water desalination and electricity generation in amicrobial desalination cell with electrolyte recirculation for pHcontrol. Bioresour. Technol. 2012, 106, 89−94.(13) Chen, X.; Liang, P.; Wei, Z.; Zhang, X.; Huang, X. Sustainablewater desalination and electricity generation in a separator coupledstacked microbial desalination cell with buffer free electrolytecirculation. Bioresour. Technol. 2012, 119, 88−93.(14) Chen, S.; Liu, G.; Zhang, R.; Qin, B.; Luo, Y. Development ofthe microbial electrolysis desalination and chemical-production cell fordesalination as well as acid and alkali productions. Environ. Sci. Technol.2012, 46, 2467−2472.(15) Logan, B.; Cheng, S.; Watson, V.; Estadt, G. Graphite fiberbrush anodes for increased power production in air−cathode microbialfuel cells. Environ. Sci. Technol. 2007, 41, 3341−3346.(16) Cheng, S.; Liu, H.; Logan, B. E. Increased performance of single-chamber microbial fuel cells using an improved cathode structure.Electrochem. Commun. 2006, 8, 489−494.
(17) Kim, Y.; Logan, B. Series assembly of microbial desalination cellscontaining stacked electrodialysis cells for partial or complete seawaterdesalination. Environ. Sci. Technol. 2011, 45, 5840−5845.(18) Cheng, S.; Xing, D.; Call, D.; Logan, B. Direct biologicalconversion of electrical current into methane by electromethano-genesis. Environ. Sci. Technol. 2009, 43 (10), 3953−3958.(19) Ahn, Y.; Logan, B. Domestic wastewater treatment using multi-electrode continuous flow MFCs with a separator electrode assemblydesign. Appl. Microbiol. Biotechnol. 2013, 97, 409−416.(20) Bennett, A. S. Conversion of in situ measurements ofconductivity to salinity. Deep-Sea Res. 1976, 23, 157−165.(21) Logan, B. Microbial Fuel Cells; John Wiley & Sons, Inc.:Hoboken, NJ, 2008.(22) Jacobson, K.; Drew, D.; He, Z. Use of a liter-scale microbialdesalination cell as a platform to study bioelectrochemical desalinationwith salt solution or artificail seawater. Environ. Sci. Technol. 2011, 45,4652−4657.(23) Patil, S.; Harnisch, F.; Koch, C.; Hubschmann, T.; Fetzer, I.;Carmona-Martinez, A.; Muller, S.; Schroder, U. Electroactive mixedculture derived biofilms in microbial bioelectrochemical systems: Therole of pH on biofilm formation, performance and composition.Bioresour. Technol. 2011, 102, 9683−9690.(24) You, S.; Zhao, Q.; Zhang, J.; Jiang, J.; Wan, C.; Du, M.; Zhao, S.A graphite-granule membrane-less tubular air-cathode microbial fuelcell for power generation under continuously operational conditions. J.Power Sources 2007, 173, 172−177.(25) Karra, U.; Troop, E.; Curtis, M.; Scheible, K.; Tenaglier, C.;Patel, N.; Li, B. Performance of plug flow microbial fuel cell (PF-MFC) and complete mixing microbial fuel cell (CM-MFC) forwastewater treatment and power generation. Int. J. Hydrogen Energy2013, 38 (13), 5383−5388.(26) Jiang, D.; Li, B. Granular activated carbon single-chambermicrobial fuel cells (GAC-SCMFCs): A design suitable for large-scalewastewater treatment processes. Biochem. Eng. J. 2009, 47, 31−37.(27) Cheng, S.; Logan, B. Increasing power generation for scaling upsingle-chamber air cathode microbial fuel cells. Bioresour. Technol.2011, 102, 4468−4473.(28) Harnisch, F.; Wirth, S.; Schroder, U. Effects of substrate andmetabolite crossover on the cathodic oxygen reduction reaction inmicrobial fuel cells: Platinum vs. iron(II) phthalocyanine basedelectrodes. Electrochem. Commun. 2009, 11, 2253−2256.(29) Luo, H.; Xu, P.; Roane, T.; Jenkins, P.; Ren, Z. Microbialdesalination cells for improved performance in wastewater treatment,electricity production, and desalination. Bioresour. Technol. 2012, 105,60−66.(30) Mehanna, M.; Saito, T.; Yan, J.; Hickner, M.; Cao, X.; Huang,X.; Logan, B. Using microbial desalination cells to reduce water salinityprior to reverse osmosis. Energy Environ. Sci. 2010, 3, 1114−1120.(31) Kim, Y.; Logan, B. Microbial desalination cells for energyproduction and desalination. Desalination 2013, 308, 122−130.(32) Zhang, F.; Jacobson, K.; Torres, P.; He, Z. Effects of anolyterecirculation rates and catholytes on electricity generation in a litre-scale upflow microbial fuel cell. Energy Environ. Sci. 2010, 3, 1347−1352.
ACS Sustainable Chemistry & Engineering Research Article
dx.doi.org/10.1021/sc400148j | ACS Sustainable Chem. Eng. 2013, 1, 1200−12061206