Embed Size (px)
Citation preview
THESIS
INCREASING BMEP FOR DOWNSIZING OF INTERNAL COMBUSTION ENGINES
THROUGH AN ADVANCED TURBOCHARGING CONCEPT
Submitted by
Paris Amy
Department of Mechanical Engineering
In partial fulfillment of the requirements
For the Degree of Master of Science
Colorado State University
Fort Collins, Colorado
Fall 2012
Master’s Committee:
Advisor: Daniel Olsen
Allan Kirkpatrick
Jerry Johnson

Copyright by Paris Amy 2012
All Rights Reserved
ii
ABSTRACT
INCREASING BMEP FOR DOWNSIZING OF INTERNAL COMBUSTION ENGINES
THROUGH AN ADVANCED TURBOCHARGING CONCEPT
In order to meet more strict national emissions and fuel economy regulations automotive
manufacturers are turning to downsized boosted engines. A SuperTurboTM
is a device that
delivers the high speed torque of a turbocharger and the low speed torque of a supercharger, with
the benefits of turbo-compounding. This technological advantage makes it a perfect candidate for
engine downsizing and boosting application.
In order to validate the SuperTurboTM
as viable technology for engine downsizing, a
General Motors Ecotec LSJ 2.0l I4 engine was modeled using the industry standard engine
simulation software GT-Power. Two additional models of a SuperTurbocharged Ecotec LSJ
engine were also generated. One SuperTurbocharged Ecotec engine was tuned to match the
performance map of the stock Ecotec LSJ engine and another SuperTurbocharged Ecotec engine
was tuned to match the performance map of a larger General Motors Vortec LMG 5.3l V8.
Simulation results from the stock Ecotec model were compared to both of the results from the
SuperTurbocharged models in order to validate reported efficiency gains through SuperTurboTM
use. Additionally, the models were compared to determine how feasible a SuperTurboTM
is for
engine downsizing while maintaining power output.
The simulation results showed improvements in engine brake specific fuel consumption
(BSFC) up to 26% at high engine speeds when compared to the GM Vortec LMG engine and
BSFC improvements up to 21% at 4500 rpm when compared to the stock Ecotec LSJ engine. At
lower to mid-engine speeds both models saw BSFC improvements between 5 and 20%. It was

iii
concluded that downsizing an engine with a SuperTurboTM
was a practical way to improve
engine BSFC while maintaining performance.

iv
ACKNOWLEDGMENTS
My mother instilled in me the never-ending desire to question results that I do not agree
with and then act to bring about change. When I look at how we as a society function today, the
results I find lead me to question how we can do better. I know that I am just one person, but I
am not deterred. I am still on my quest to alter results that I don’t agree with. I have her to thank
for this desire, but my father to thank for the way in which I go about it. Watching him perfect
his craft throughout the years has taught me how to do the same with mine. He has done an
exceptional job raising me to be the dedicated, fun-loving, knowledge seeker that I am today. I
would not be here without his support. Bisous.
Dr. Daniel Olsen has given me the opportunity to expand my knowledge and skills such
that someday my quest for change might become a reality. I am eternally grateful for him
meeting with me on such short notice in May of 2011 and doing everything he could to find me a
research project so that I could attend graduate school at CSU. He could not have found a better
position for me and I continuously thank my lucky stars for having him in my life. I hope that I
have repaid the favour he did in putting his faith in me with the work I done. My thesis
committee, Dr. Allan Kirkpatrick and Dr. Jerry Johnson, also deserve acknowledgement for their
support and willingness to embark on this journey with me.
I also must, without a doubt, thank Ed VanDyne of VanDyne SuperTurboTM
for selecting
me to research the up and coming SuperTurboTM
technology and prove to the world that it is part
of the key to the better result we are all looking for. The entire VanDyne office deserves a thank
you for welcoming me into their work community, but expressly: Tom Waldron for giving me
the opportunity to continue applying what I have learned and treating me so well; Brian Tuohy
for his technical assistance in all things engine related; and the utmost thanks to Jared Brown for

v
educating and helping me with GT-Power whenever I needed it. Finally, previously at VanDyne,
Wayne Penfold who serves as the first person I have ever considered a professional mentor, I
have to thank for his conviction in me. I value both his mentorship and friendship and look
forward to a long and fruitful relationship.
Thank you to my friends Frank Sutley, Bryna Fitzgerald, Alexis Amy, Frazier Malone,
Alannah Wheeler, Lacey Bartels, and Johnny Gattoni for their patience with listening to me
discuss my thesis and their support, understanding, belief in me, and continued friendship when I
disappeared off the face of the Earth to work. Christian L’Orange, thank you for putting up with
my antics and willingness to answer any of my thesis or life related questions. Your help and
friendship helped carry me through. And of course, Ryan Doolittle, Dave Berube, a very
SPECIAL THANKS.
vi
DEDICATION
For DGA 1958-2004
And TLG 1971-2012
“In three words I can sum up everything
I’ve learned about life: it goes on.”
-Robert Frost
vii
TABLE OF CONTENTS
Abstract ......................................................................................................................................................... ii
Acknowledgments ........................................................................................................................................ iv
Dedication .................................................................................................................................................... vi
Chapter 1: Introduction ................................................................................................................................. 1
1.1 Motivation for Research................................................................................................................ 1
1.2 Literature Review .......................................................................................................................... 2
1.2.1 Power Boosting ..................................................................................................................... 3
1.2.1.1 Supercharging ................................................................................................................... 5
1.2.1.2 Turbocharging ................................................................................................................... 8
1.2.1.3 Turbo-compounding........................................................................................................ 10
1.3 The VanDyne SuperTurboTM
...................................................................................................... 10
1.4 GT-Suite Engine Modeling Software ......................................................................................... 16
1.5 Key Engine Performance Parameters.......................................................................................... 19
1.6 Thesis Overview ......................................................................................................................... 20
Chapter 2: Stock General Motors (GM) ECOTEC 2.0l LSJ Engine .......................................................... 21
2.1 GM Ecotec LSJ Engine ............................................................................................................... 21
2.1.1 Engine Specifications .......................................................................................................... 21
2.1.2 Engine Tear Down Process ................................................................................................. 23
2.2 GM Ecotec LSJ Engine Model and Development ...................................................................... 25
2.2.1 M62 Eaton Supercharger .................................................................................................... 26
2.2.2 Stock Engine Model Development ..................................................................................... 27
2.3 Stock Engine Simulation Results ................................................................................................ 29
Chapter 3: SuperTurbocharged GM ECOTEC 2.0L LSJ Engine ............................................................... 36
3.1 SuperTurbocharged GM Ecotec Engine Model and Development ............................................. 36
3.1.1 GM Vortec LMG Engine .................................................................................................... 36
3.1.2 SuperTurboTM
Model .......................................................................................................... 38
3.1.3 SuperTurbocharged Engine Model Development ............................................................... 40
3.1.3.1 Model Development for GM Vortec LMG Engine Match ............................................. 41
3.1.3.2 Model Development for Stock GM Ecotec LSJ Engine Match ...................................... 45
3.2 SuperTurbocharged Engine Simulation Results ......................................................................... 46
viii
3.2.1 GM Vortec LMG Engine Match ......................................................................................... 47
3.2.2 GM Ecotec LSJ Engine Match ............................................................................................ 56
Chapter 4: The Effects Of SuperTurbocharging ......................................................................................... 59
4.1 GT-Power Engine Simulation Comparisons ............................................................................... 59
4.1.1 High BMEP SuperTurbocharged Ecotec vs. Stock GM Ecotec LSJ .................................. 59
4.1.2 Low BMEP SuperTurbocharged Ecotec vs. Stock GM Ecotec LSJ ................................... 62
Chapter 5: Conclusion ................................................................................................................................. 66
5.1 Summary and Conclusions.............................................................................................................. 66
5.2 Recommendations for Future Work ................................................................................................ 67
References ................................................................................................................................................... 68
Appendix I .................................................................................................................................................. 70
Appendix II ................................................................................................................................................. 73
Appendix III ................................................................................................................................................ 75
List Of Abbreviations ................................................................................................................................. 88
1
CHAPTER 1: INTRODUCTION
1.1 Motivation for Research
The mantra has been repeated many times over. We've all heard it. It is imperative that as
a nation and a globally interconnected world we reduce our dependence on fossil fuels. On one
side there are some who argue we will run out of fossil fuels in our children's lifetime, but the
more pressing matter is the amount of harmful emissions generated by the combustion of these
fossil fuels. Arguably climate change is occurring due in part from the emissions from
automobiles and their contribution to the greenhouse effect. The greenhouse effect or warming of
the Earth is due to trapped gases such as carbon dioxide, oxides of nitrogen, and hydrocarbons in
the Earth’s atmosphere. The molecular structures of the gases lead them to trap heat and absorb
solar radiation emitted from the Earth’s surface [1]
. According to the United State Environmental
Protection Agency (US EPA) the largest contributor to greenhouse gas emissions is carbon
dioxide from fossil fuel combustion [2]
. The transportation sector accounted for 27 percent of US
greenhouse gas emissions in 2009 [2]
. By improving the efficiency of the internal combustion
engine by even a few percentage points we can not only drastically reduce our dependence on
fossil fuels, but also reduce the amount of greenhouse gases, including carbon dioxide, that are
released into the atmosphere each year.
In the United States the National Highway Traffic Safety Administration (NHTSA)
administers a Corporate Average Fuel Economy (CAFE) to reduce energy consumption by
increasing the fuel economy of cars and light trucks [3]
. Docket ID No. NHTSA-2010-0131 has
regulated that by 2020 the passenger car fleet of automotive manufacturers must have an average
fuel economy (mpg) of 44.7 and carbon dioxide emissions of 113 g CO2/km. In Europe this
2
regulation is even stricter with a mandate of 95 g CO2/km [4]
. How are original equipment
manufacturers (OEMs) expected to reach these targets? It is going to require a combination of
innovative automotive technology including downsizing engines.
In 2008 VanDyne SuperTurbo patented a novel idea, the SuperTurboTM
, which combines
the high speed torque of a turbocharger and the low speed torque of a supercharger, with the
benefits of turbo-compounding. It is expected to see gains of 15-20% [5]
in efficiency, using
brake specific fuel consumption (BSFC) as the gauge for efficiency, because it combines the
low-speed performance capabilities of a supercharger with the energy extraction capabilities of
turbo-compounding through an added transmission to the turbocharger. The motivation behind
this technology is based in the demand for innovative new engine technology. The research
performed in this thesis is used to validate the claims that VanDyne SuperTurbo has made in
regards to their SuperTurboTM
technology and to verify that the SuperTurboTM
is a viable
technology for engine downsizing.
1.2 Literature Review
One of the most cost-effective ways to lower pollutant engine emissions and meet more
stringent emissions regulations is through engine downsizing. By downsizing the engine the fuel
consumption can be reduced, however, the power output of the engine is reduced. Customers
receiving the final automotive product, for the most part, will not accept a less powerful engine.
For this reason a method of boosting the power of the engine is sought. The method of forced
induction is as old as the invention of the first gasoline powered engine itself [6]
. Boosting the
engine through forced induction is investigated and the opportunity for new forced induction
technology is explored.
3
1.2.1 Power Boosting
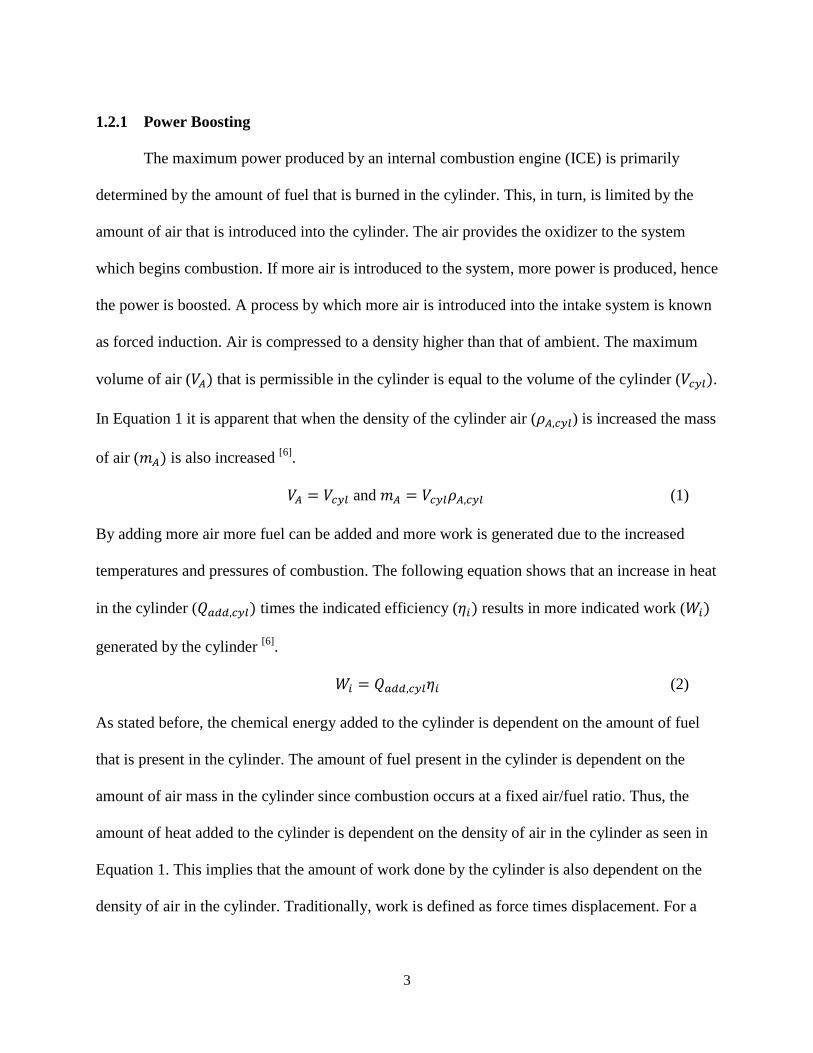
The maximum power produced by an internal combustion engine (ICE) is primarily
determined by the amount of fuel that is burned in the cylinder. This, in turn, is limited by the
amount of air that is introduced into the cylinder. The air provides the oxidizer to the system
which begins combustion. If more air is introduced to the system, more power is produced, hence
the power is boosted. A process by which more air is introduced into the intake system is known
as forced induction. Air is compressed to a density higher than that of ambient. The maximum
volume of air ( that is permissible in the cylinder is equal to the volume of the cylinder ( .
In Equation 1 it is apparent that when the density of the cylinder air ( ) is increased the mass
of air ( is also increased [6]
.
and (1)
By adding more air more fuel can be added and more work is generated due to the increased
temperatures and pressures of combustion. The following equation shows that an increase in heat
in the cylinder ( times the indicated efficiency ( results in more indicated work (
generated by the cylinder [6]
.
(2)
As stated before, the chemical energy added to the cylinder is dependent on the amount of fuel
that is present in the cylinder. The amount of fuel present in the cylinder is dependent on the
amount of air mass in the cylinder since combustion occurs at a fixed air/fuel ratio. Thus, the
amount of heat added to the cylinder is dependent on the density of air in the cylinder as seen in
Equation 1. This implies that the amount of work done by the cylinder is also dependent on the
density of air in the cylinder. Traditionally, work is defined as force times displacement. For a
4
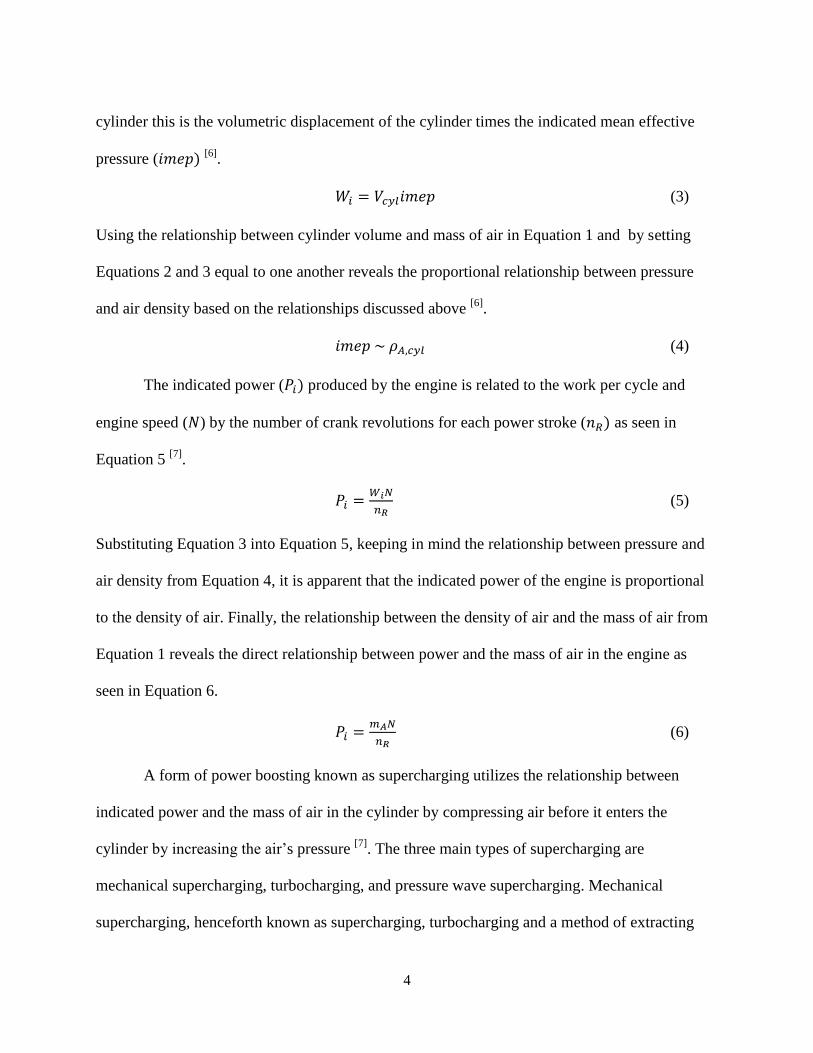
cylinder this is the volumetric displacement of the cylinder times the indicated mean effective
pressure ( [6]
.
(3)
Using the relationship between cylinder volume and mass of air in Equation 1 and by setting
Equations 2 and 3 equal to one another reveals the proportional relationship between pressure
and air density based on the relationships discussed above [6]
.
(4)
The indicated power ( produced by the engine is related to the work per cycle and
engine speed ( ) by the number of crank revolutions for each power stroke ( as seen in
Equation 5 [7]
.
(5)
Substituting Equation 3 into Equation 5, keeping in mind the relationship between pressure and
air density from Equation 4, it is apparent that the indicated power of the engine is proportional
to the density of air. Finally, the relationship between the density of air and the mass of air from
Equation 1 reveals the direct relationship between power and the mass of air in the engine as
seen in Equation 6.
(6)
A form of power boosting known as supercharging utilizes the relationship between
indicated power and the mass of air in the cylinder by compressing air before it enters the
cylinder by increasing the air’s pressure [7]
. The three main types of supercharging are
mechanical supercharging, turbocharging, and pressure wave supercharging. Mechanical
supercharging, henceforth known as supercharging, turbocharging and a method of extracting
5
excess power from the turbocharger, known as turbo-compounding, are further expanded upon in
the following sections.
1.2.1.1 Supercharging
Superchargers employ the use of a compressor powered by the engine crankshaft to
increase the pressure of the air before it enters the engine cylinder. The compressor typically
operates at the same speed as the engine due to its connection to the crankshaft [8]
. Three
classifications of compressors for automotive application currently exist: sliding vane
compressors, rotary compressors, and centrifugal compressors [7]
. Sliding vane compressors are
not typically used in supercharging, but rather, in air conditioning systems [9]
. Centrifugal
compressors are normally found in conjunction with turbines for turbocharging application.
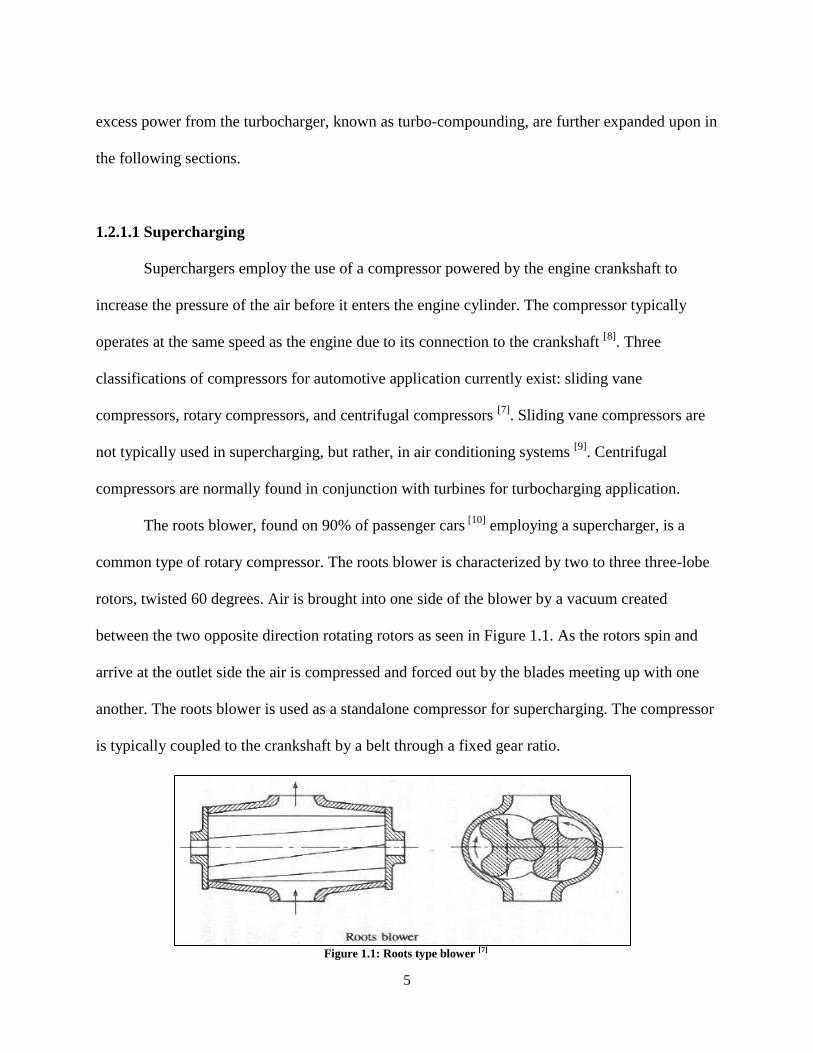
The roots blower, found on 90% of passenger cars [10]
employing a supercharger, is a
common type of rotary compressor. The roots blower is characterized by two to three three-lobe
rotors, twisted 60 degrees. Air is brought into one side of the blower by a vacuum created
between the two opposite direction rotating rotors as seen in Figure 1.1. As the rotors spin and
arrive at the outlet side the air is compressed and forced out by the blades meeting up with one
another. The roots blower is used as a standalone compressor for supercharging. The compressor
is typically coupled to the crankshaft by a belt through a fixed gear ratio.
Figure 1.1: Roots type blower [7]
6
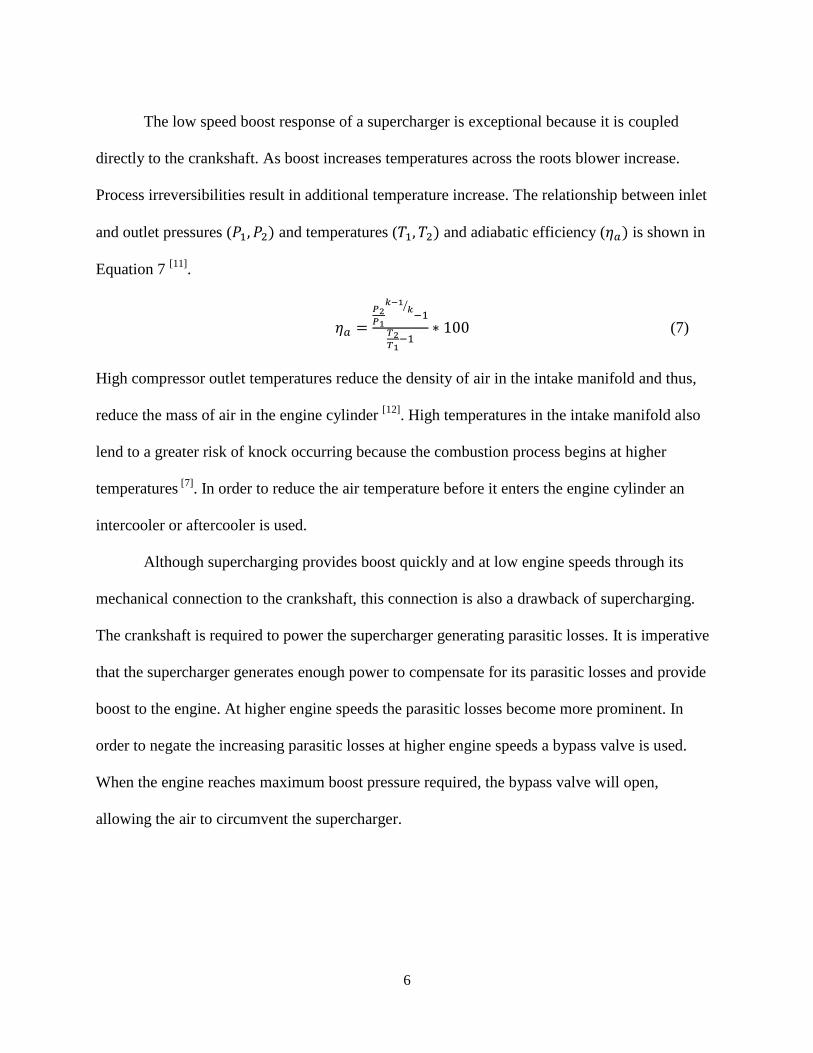
The low speed boost response of a supercharger is exceptional because it is coupled
directly to the crankshaft. As boost increases temperatures across the roots blower increase.
Process irreversibilities result in additional temperature increase. The relationship between inlet
and outlet pressures ( and temperatures ( and adiabatic efficiency ( is shown in
Equation 7 [11]
.
⁄
(7)
High compressor outlet temperatures reduce the density of air in the intake manifold and thus,
reduce the mass of air in the engine cylinder [12]
. High temperatures in the intake manifold also
lend to a greater risk of knock occurring because the combustion process begins at higher
temperatures [7]
. In order to reduce the air temperature before it enters the engine cylinder an
intercooler or aftercooler is used.
Although supercharging provides boost quickly and at low engine speeds through its
mechanical connection to the crankshaft, this connection is also a drawback of supercharging.
The crankshaft is required to power the supercharger generating parasitic losses. It is imperative
that the supercharger generates enough power to compensate for its parasitic losses and provide
boost to the engine. At higher engine speeds the parasitic losses become more prominent. In
order to negate the increasing parasitic losses at higher engine speeds a bypass valve is used.
When the engine reaches maximum boost pressure required, the bypass valve will open,
allowing the air to circumvent the supercharger.
7
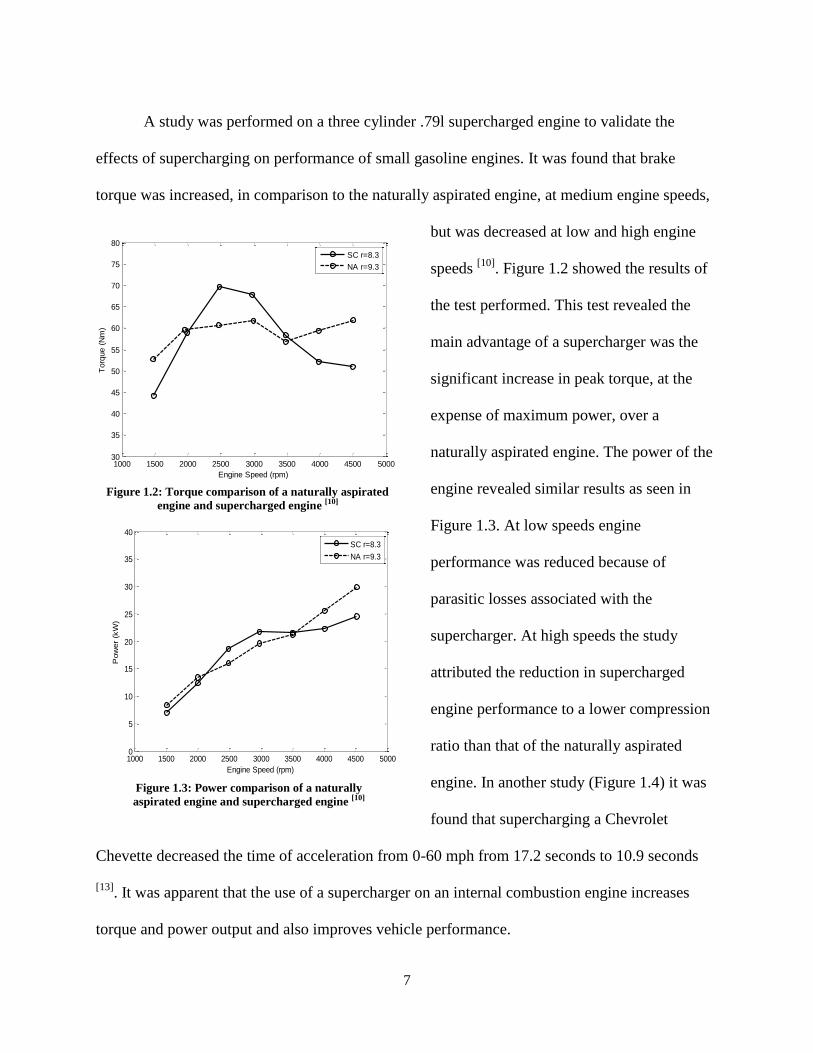
Figure 1.3: Power comparison of a naturally
aspirated engine and supercharged engine [10]
1000 1500 2000 2500 3000 3500 4000 4500 50000
5
10
15
20
25
30
35
40
Engine Speed (rpm)
Pow
er
(kW
)
SC r=8.3
NA r=9.3
1000 1500 2000 2500 3000 3500 4000 4500 500030
35
40
45
50
55
60
65
70
75
80
Engine Speed (rpm)
Torq
ue (
Nm
)
SC r=8.3
NA r=9.3
Figure 1.2: Torque comparison of a naturally aspirated
engine and supercharged engine [10]
A study was performed on a three cylinder .79l supercharged engine to validate the
effects of supercharging on performance of small gasoline engines. It was found that brake
torque was increased, in comparison to the naturally aspirated engine, at medium engine speeds,
but was decreased at low and high engine
speeds [10]
. Figure 1.2 showed the results of
the test performed. This test revealed the
main advantage of a supercharger was the
significant increase in peak torque, at the
expense of maximum power, over a
naturally aspirated engine. The power of the
engine revealed similar results as seen in
Figure 1.3. At low speeds engine
performance was reduced because of
parasitic losses associated with the
supercharger. At high speeds the study
attributed the reduction in supercharged
engine performance to a lower compression
ratio than that of the naturally aspirated
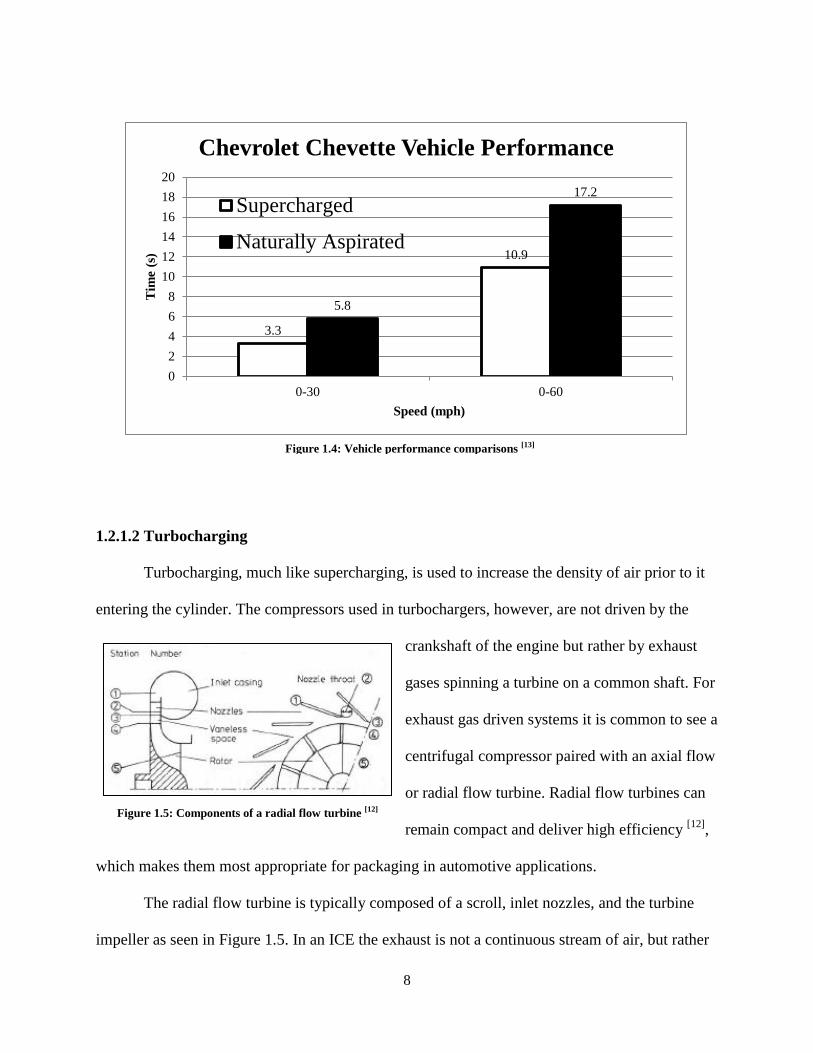
engine. In another study (Figure 1.4) it was
found that supercharging a Chevrolet
Chevette decreased the time of acceleration from 0-60 mph from 17.2 seconds to 10.9 seconds
[13]. It was apparent that the use of a supercharger on an internal combustion engine increases
torque and power output and also improves vehicle performance.
8
1.2.1.2 Turbocharging
Turbocharging, much like supercharging, is used to increase the density of air prior to it
entering the cylinder. The compressors used in turbochargers, however, are not driven by the
crankshaft of the engine but rather by exhaust
gases spinning a turbine on a common shaft. For
exhaust gas driven systems it is common to see a
centrifugal compressor paired with an axial flow
or radial flow turbine. Radial flow turbines can
remain compact and deliver high efficiency [12]
,
which makes them most appropriate for packaging in automotive applications.
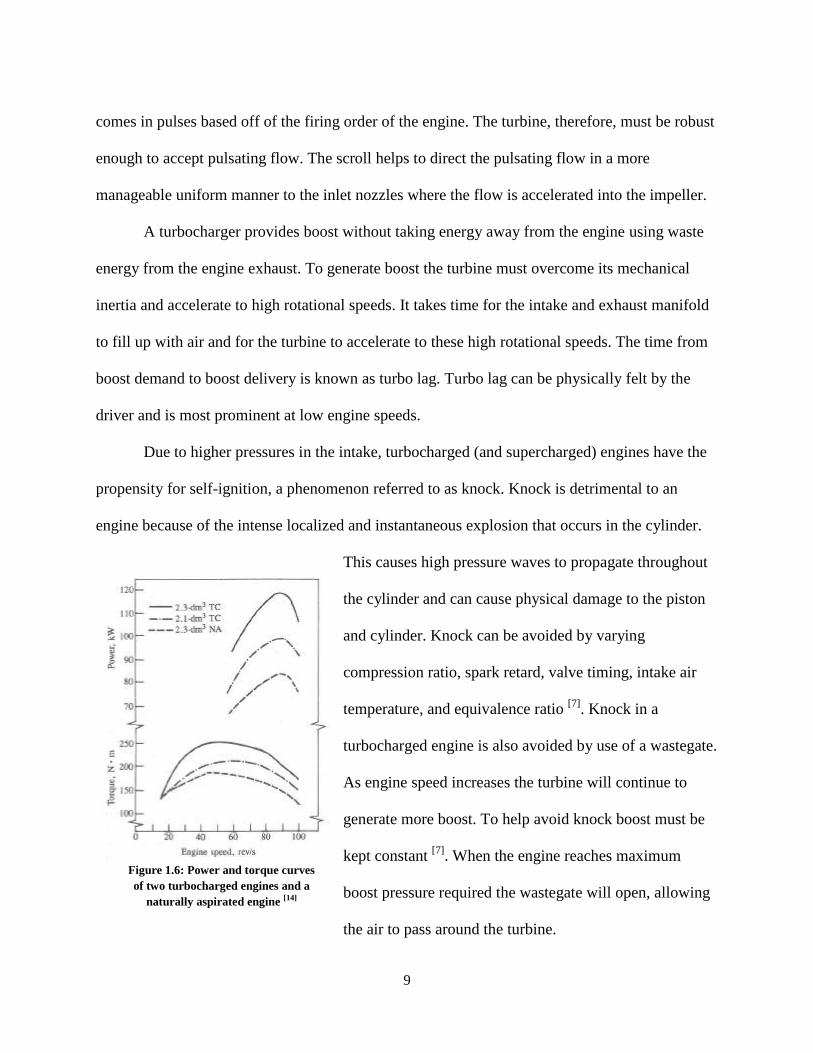
The radial flow turbine is typically composed of a scroll, inlet nozzles, and the turbine
impeller as seen in Figure 1.5. In an ICE the exhaust is not a continuous stream of air, but rather
Figure 1.5: Components of a radial flow turbine [12]
3.3
10.9
5.8
17.2
0
2
4
6
8
10
12
14
16
18
20
0-30 0-60
Tim
e (s
)
Speed (mph)
Chevrolet Chevette Vehicle Performance
Supercharged
Naturally Aspirated
Figure 1.4: Vehicle performance comparisons [13]
9
comes in pulses based off of the firing order of the engine. The turbine, therefore, must be robust
enough to accept pulsating flow. The scroll helps to direct the pulsating flow in a more
manageable uniform manner to the inlet nozzles where the flow is accelerated into the impeller.
A turbocharger provides boost without taking energy away from the engine using waste
energy from the engine exhaust. To generate boost the turbine must overcome its mechanical
inertia and accelerate to high rotational speeds. It takes time for the intake and exhaust manifold
to fill up with air and for the turbine to accelerate to these high rotational speeds. The time from
boost demand to boost delivery is known as turbo lag. Turbo lag can be physically felt by the
driver and is most prominent at low engine speeds.
Due to higher pressures in the intake, turbocharged (and supercharged) engines have the
propensity for self-ignition, a phenomenon referred to as knock. Knock is detrimental to an
engine because of the intense localized and instantaneous explosion that occurs in the cylinder.
This causes high pressure waves to propagate throughout
the cylinder and can cause physical damage to the piston
and cylinder. Knock can be avoided by varying
compression ratio, spark retard, valve timing, intake air
temperature, and equivalence ratio [7]
. Knock in a
turbocharged engine is also avoided by use of a wastegate.
As engine speed increases the turbine will continue to
generate more boost. To help avoid knock boost must be
kept constant [7]
. When the engine reaches maximum
boost pressure required the wastegate will open, allowing
the air to pass around the turbine.
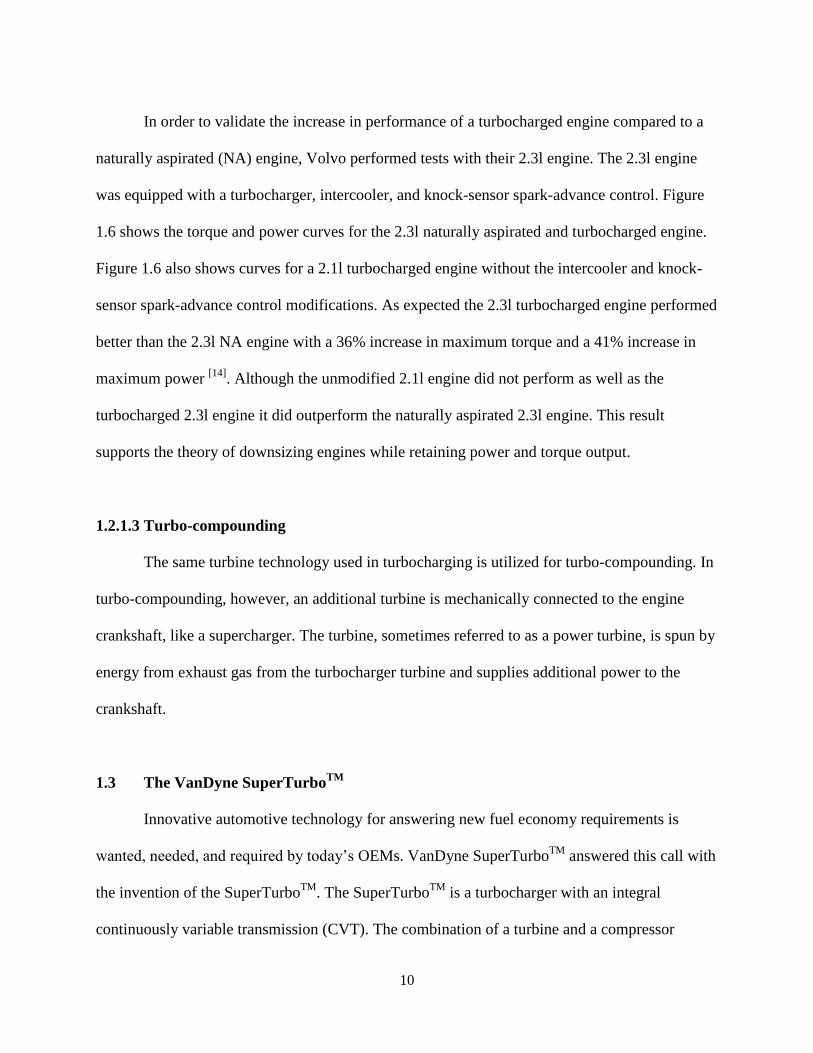
Figure 1.6: Power and torque curves
of two turbocharged engines and a
naturally aspirated engine [14]
10
In order to validate the increase in performance of a turbocharged engine compared to a
naturally aspirated (NA) engine, Volvo performed tests with their 2.3l engine. The 2.3l engine
was equipped with a turbocharger, intercooler, and knock-sensor spark-advance control. Figure
1.6 shows the torque and power curves for the 2.3l naturally aspirated and turbocharged engine.
Figure 1.6 also shows curves for a 2.1l turbocharged engine without the intercooler and knock-
sensor spark-advance control modifications. As expected the 2.3l turbocharged engine performed
better than the 2.3l NA engine with a 36% increase in maximum torque and a 41% increase in
maximum power [14]
. Although the unmodified 2.1l engine did not perform as well as the
turbocharged 2.3l engine it did outperform the naturally aspirated 2.3l engine. This result
supports the theory of downsizing engines while retaining power and torque output.
1.2.1.3 Turbo-compounding
The same turbine technology used in turbocharging is utilized for turbo-compounding. In
turbo-compounding, however, an additional turbine is mechanically connected to the engine
crankshaft, like a supercharger. The turbine, sometimes referred to as a power turbine, is spun by
energy from exhaust gas from the turbocharger turbine and supplies additional power to the
crankshaft.
1.3 The VanDyne SuperTurboTM
Innovative automotive technology for answering new fuel economy requirements is
wanted, needed, and required by today’s OEMs. VanDyne SuperTurboTM
answered this call with
the invention of the SuperTurboTM
. The SuperTurboTM
is a turbocharger with an integral
continuously variable transmission (CVT). The combination of a turbine and a compressor
11
0 2 4 6 8 10 12 140
2
4
6
8
10
12
BMEP (bar)
Gain
s in B
SF
C (
%)
1000 rpm
1500 rpm
2000 rpm
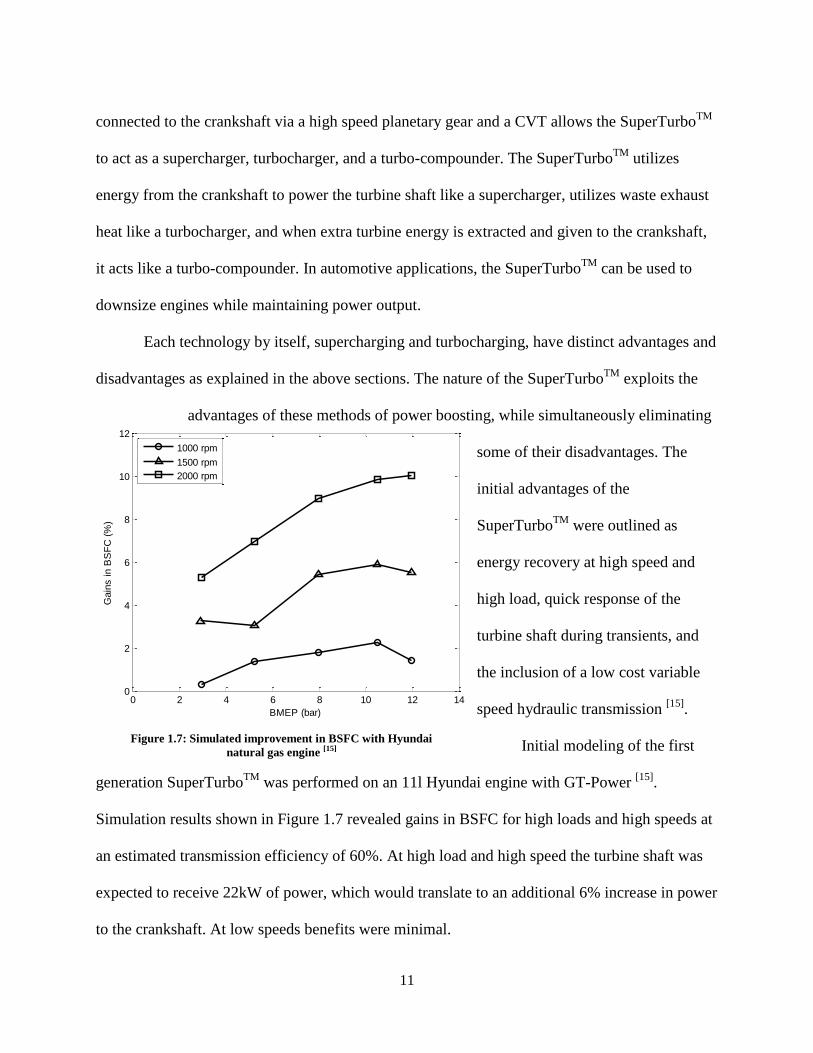
Figure 1.7: Simulated improvement in BSFC with Hyundai
natural gas engine [15]
connected to the crankshaft via a high speed planetary gear and a CVT allows the SuperTurboTM
to act as a supercharger, turbocharger, and a turbo-compounder. The SuperTurboTM
utilizes
energy from the crankshaft to power the turbine shaft like a supercharger, utilizes waste exhaust
heat like a turbocharger, and when extra turbine energy is extracted and given to the crankshaft,
it acts like a turbo-compounder. In automotive applications, the SuperTurboTM
can be used to
downsize engines while maintaining power output.
Each technology by itself, supercharging and turbocharging, have distinct advantages and
disadvantages as explained in the above sections. The nature of the SuperTurboTM
exploits the
advantages of these methods of power boosting, while simultaneously eliminating
some of their disadvantages. The
initial advantages of the
SuperTurboTM
were outlined as
energy recovery at high speed and
high load, quick response of the
turbine shaft during transients, and
the inclusion of a low cost variable
speed hydraulic transmission [15]
.
Initial modeling of the first
generation SuperTurboTM
was performed on an 11l Hyundai engine with GT-Power [15]
.
Simulation results shown in Figure 1.7 revealed gains in BSFC for high loads and high speeds at
an estimated transmission efficiency of 60%. At high load and high speed the turbine shaft was
expected to receive 22kW of power, which would translate to an additional 6% increase in power
to the crankshaft. At low speeds benefits were minimal.
12
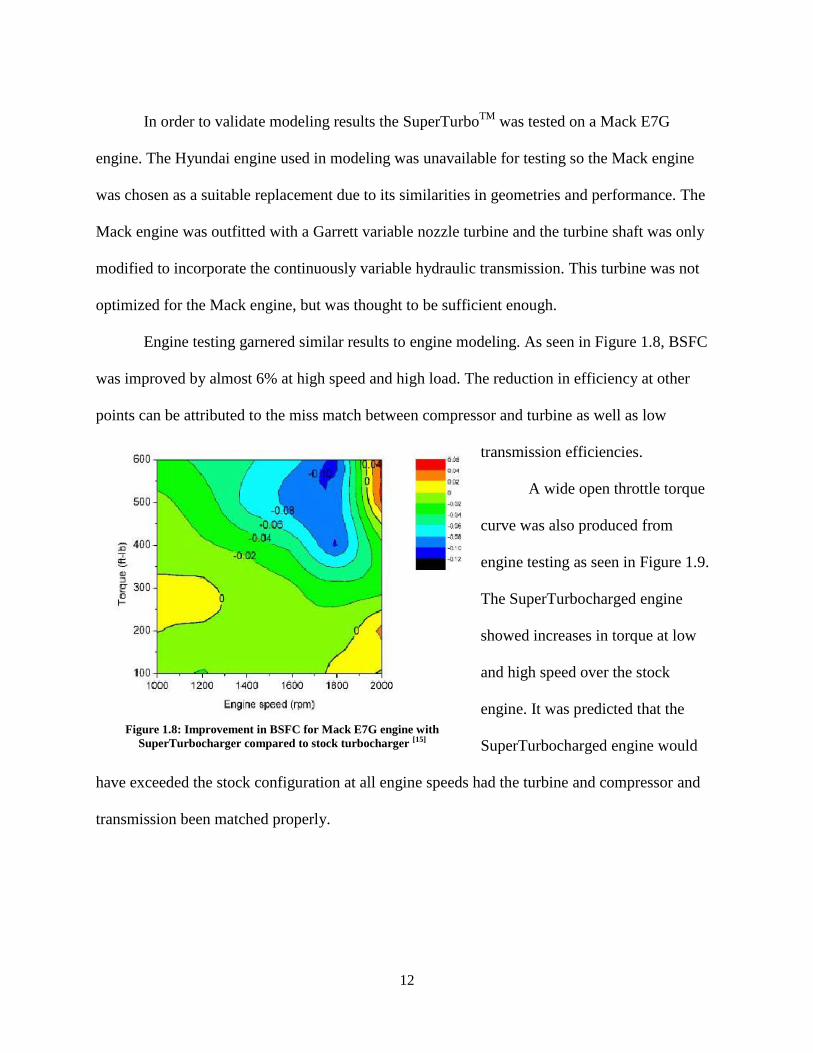
In order to validate modeling results the SuperTurboTM
was tested on a Mack E7G
engine. The Hyundai engine used in modeling was unavailable for testing so the Mack engine
was chosen as a suitable replacement due to its similarities in geometries and performance. The
Mack engine was outfitted with a Garrett variable nozzle turbine and the turbine shaft was only
modified to incorporate the continuously variable hydraulic transmission. This turbine was not
optimized for the Mack engine, but was thought to be sufficient enough.
Engine testing garnered similar results to engine modeling. As seen in Figure 1.8, BSFC
was improved by almost 6% at high speed and high load. The reduction in efficiency at other
points can be attributed to the miss match between compressor and turbine as well as low
transmission efficiencies.
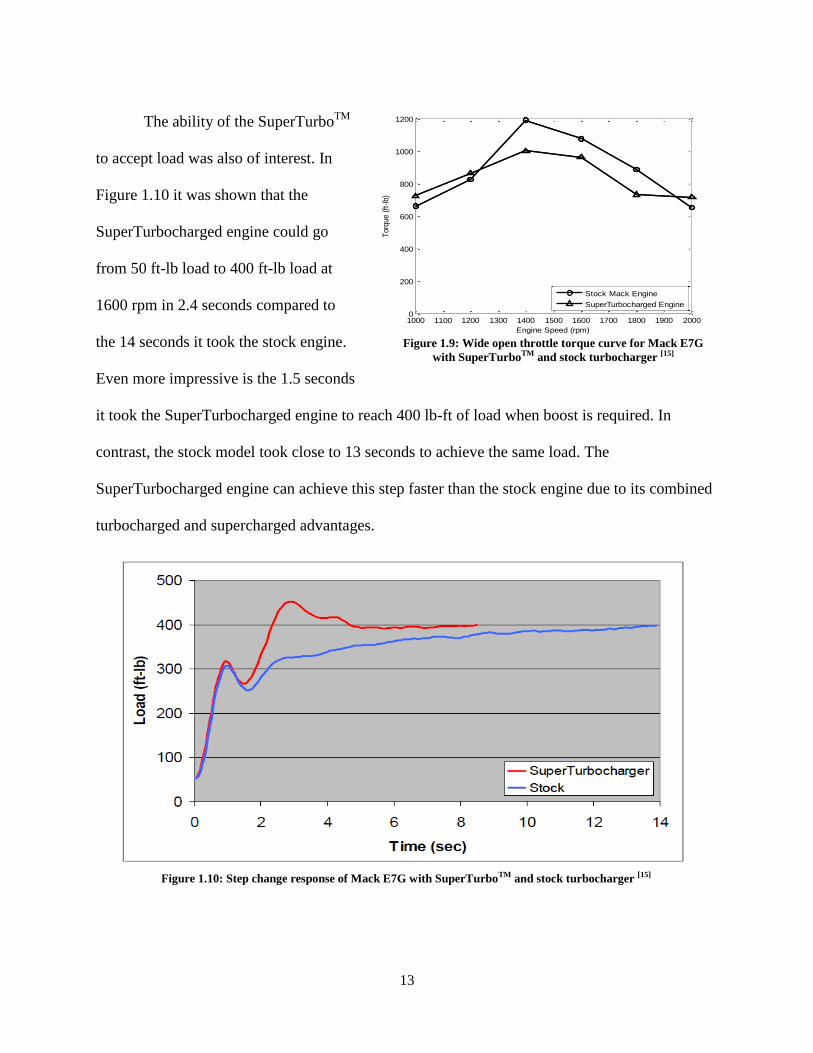
A wide open throttle torque
curve was also produced from
engine testing as seen in Figure 1.9.
The SuperTurbocharged engine
showed increases in torque at low
and high speed over the stock
engine. It was predicted that the
SuperTurbocharged engine would
have exceeded the stock configuration at all engine speeds had the turbine and compressor and
transmission been matched properly.
Figure 1.8: Improvement in BSFC for Mack E7G engine with
SuperTurbocharger compared to stock turbocharger [15]
13
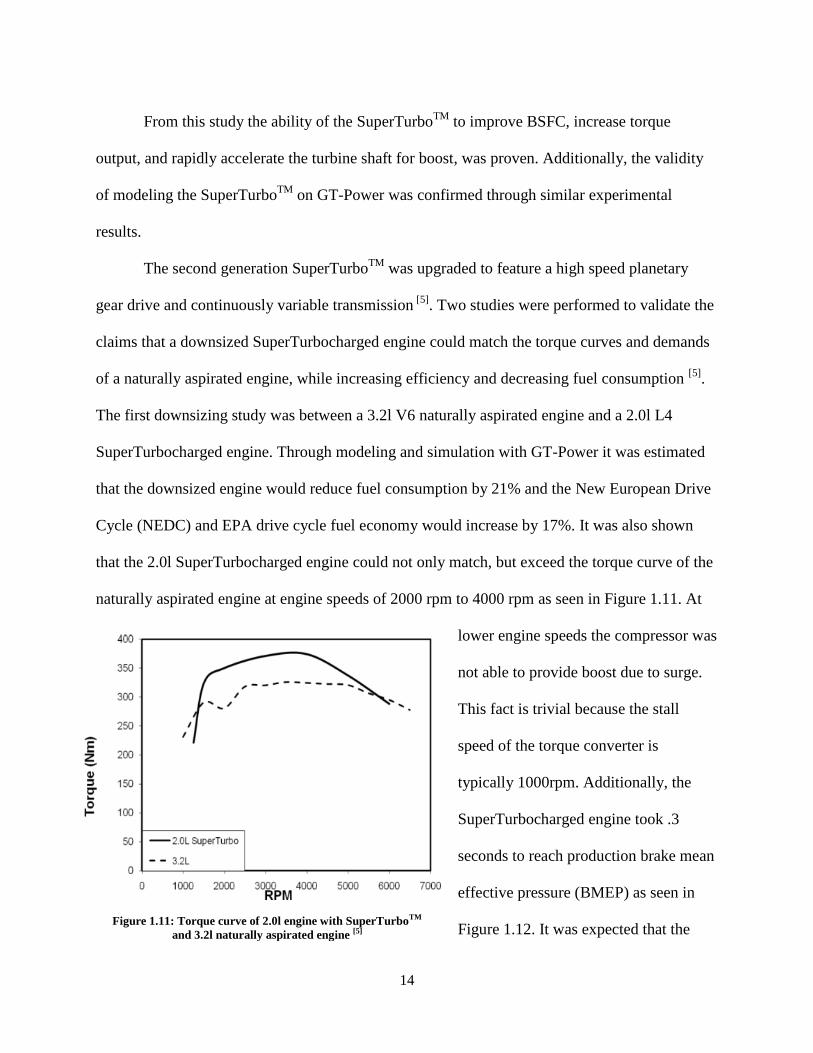
The ability of the SuperTurboTM
to accept load was also of interest. In
Figure 1.10 it was shown that the
SuperTurbocharged engine could go
from 50 ft-lb load to 400 ft-lb load at
1600 rpm in 2.4 seconds compared to
the 14 seconds it took the stock engine.
Even more impressive is the 1.5 seconds
it took the SuperTurbocharged engine to reach 400 lb-ft of load when boost is required. In
contrast, the stock model took close to 13 seconds to achieve the same load. The
SuperTurbocharged engine can achieve this step faster than the stock engine due to its combined
turbocharged and supercharged advantages.
Figure 1.9: Wide open throttle torque curve for Mack E7G
with SuperTurboTM and stock turbocharger [15]
1000 1100 1200 1300 1400 1500 1600 1700 1800 1900 20000
200
400
600
800
1000
1200
Engine Speed (rpm)
Torq
ue (
ft-lb)
Stock Mack Engine
SuperTurbocharged Engine
Figure 1.10: Step change response of Mack E7G with SuperTurboTM and stock turbocharger [15]
14
From this study the ability of the SuperTurboTM
to improve BSFC, increase torque
output, and rapidly accelerate the turbine shaft for boost, was proven. Additionally, the validity
of modeling the SuperTurboTM
on GT-Power was confirmed through similar experimental
results.
The second generation SuperTurboTM
was upgraded to feature a high speed planetary
gear drive and continuously variable transmission [5]
. Two studies were performed to validate the
claims that a downsized SuperTurbocharged engine could match the torque curves and demands
of a naturally aspirated engine, while increasing efficiency and decreasing fuel consumption [5]
.
The first downsizing study was between a 3.2l V6 naturally aspirated engine and a 2.0l L4
SuperTurbocharged engine. Through modeling and simulation with GT-Power it was estimated
that the downsized engine would reduce fuel consumption by 21% and the New European Drive
Cycle (NEDC) and EPA drive cycle fuel economy would increase by 17%. It was also shown
that the 2.0l SuperTurbocharged engine could not only match, but exceed the torque curve of the
naturally aspirated engine at engine speeds of 2000 rpm to 4000 rpm as seen in Figure 1.11. At
lower engine speeds the compressor was
not able to provide boost due to surge.
This fact is trivial because the stall
speed of the torque converter is
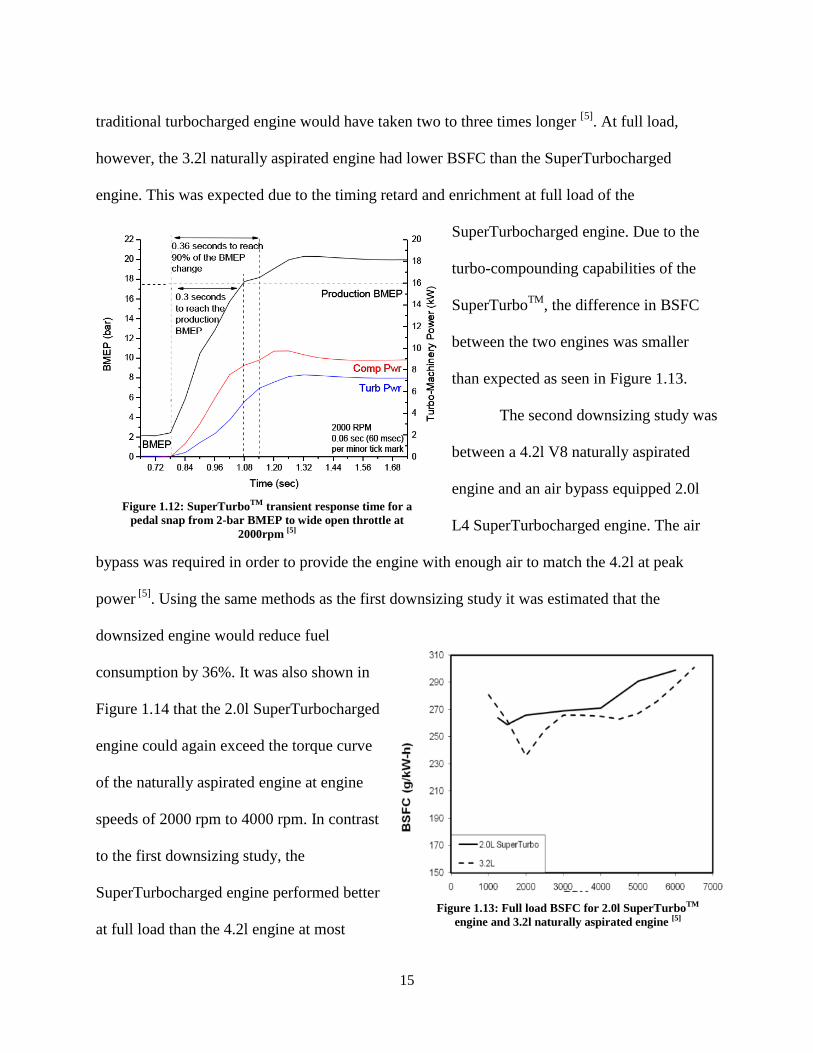
typically 1000rpm. Additionally, the
SuperTurbocharged engine took .3
seconds to reach production brake mean
effective pressure (BMEP) as seen in
Figure 1.12. It was expected that the Figure 1.11: Torque curve of 2.0l engine with SuperTurboTM
and 3.2l naturally aspirated engine [5]
15
traditional turbocharged engine would have taken two to three times longer [5]
. At full load,
however, the 3.2l naturally aspirated engine had lower BSFC than the SuperTurbocharged
engine. This was expected due to the timing retard and enrichment at full load of the
SuperTurbocharged engine. Due to the
turbo-compounding capabilities of the
SuperTurboTM
, the difference in BSFC
between the two engines was smaller
than expected as seen in Figure 1.13.
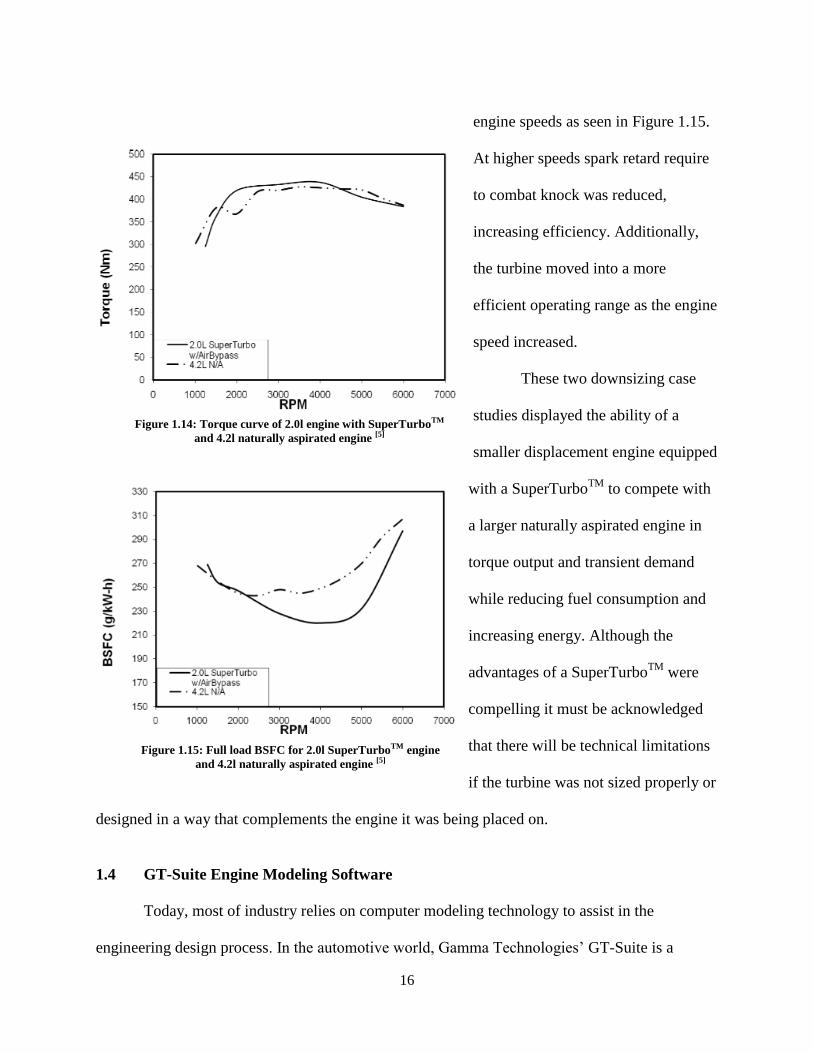
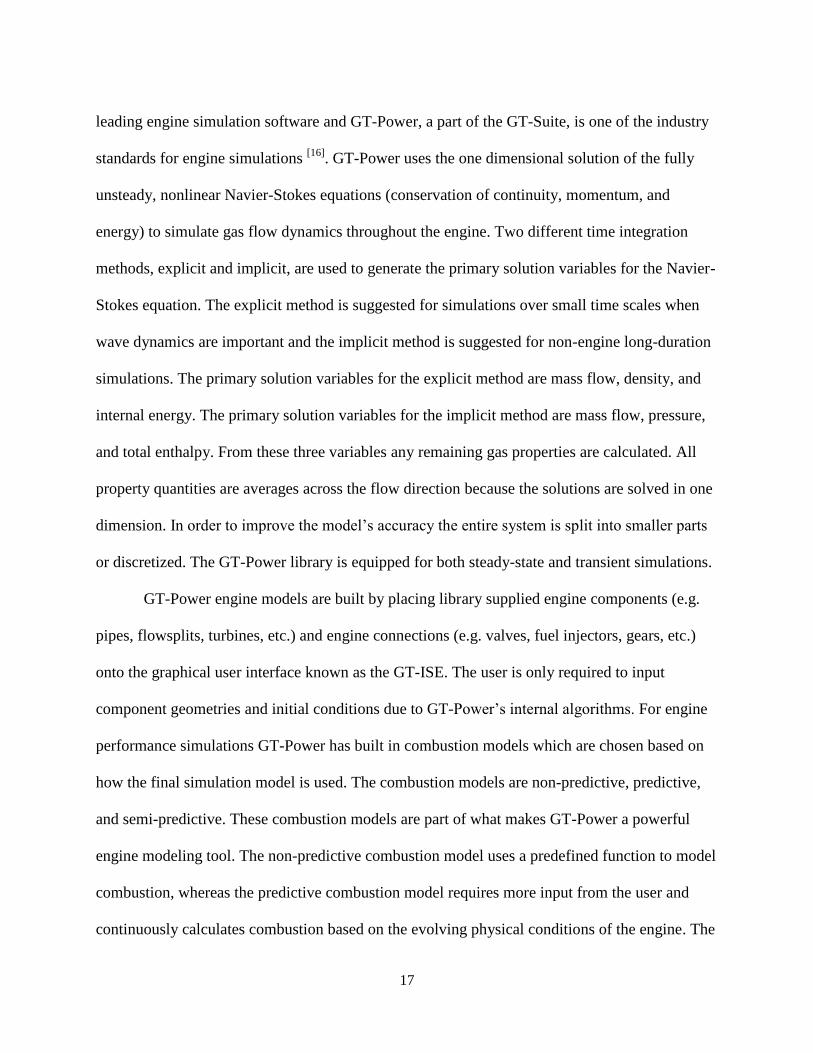
The second downsizing study was
between a 4.2l V8 naturally aspirated
engine and an air bypass equipped 2.0l
L4 SuperTurbocharged engine. The air
bypass was required in order to provide the engine with enough air to match the 4.2l at peak
power [5]
. Using the same methods as the first downsizing study it was estimated that the
downsized engine would reduce fuel
consumption by 36%. It was also shown in
Figure 1.14 that the 2.0l SuperTurbocharged
engine could again exceed the torque curve
of the naturally aspirated engine at engine
speeds of 2000 rpm to 4000 rpm. In contrast
to the first downsizing study, the
SuperTurbocharged engine performed better
at full load than the 4.2l engine at most
Figure 1.12: SuperTurboTM transient response time for a
pedal snap from 2-bar BMEP to wide open throttle at
2000rpm [5]
Figure 1.13: Full load BSFC for 2.0l SuperTurboTM
engine and 3.2l naturally aspirated engine [5]
16
engine speeds as seen in Figure 1.15.
At higher speeds spark retard require
to combat knock was reduced,
increasing efficiency. Additionally,
the turbine moved into a more
efficient operating range as the engine
speed increased.
These two downsizing case
studies displayed the ability of a
smaller displacement engine equipped
with a SuperTurboTM
to compete with
a larger naturally aspirated engine in
torque output and transient demand
while reducing fuel consumption and
increasing energy. Although the
advantages of a SuperTurboTM
were
compelling it must be acknowledged
that there will be technical limitations
if the turbine was not sized properly or
designed in a way that complements the engine it was being placed on.
1.4 GT-Suite Engine Modeling Software
Today, most of industry relies on computer modeling technology to assist in the
engineering design process. In the automotive world, Gamma Technologies’ GT-Suite is a
Figure 1.14: Torque curve of 2.0l engine with SuperTurboTM
and 4.2l naturally aspirated engine [5]
Figure 1.15: Full load BSFC for 2.0l SuperTurboTM engine
and 4.2l naturally aspirated engine [5]
17
leading engine simulation software and GT-Power, a part of the GT-Suite, is one of the industry
standards for engine simulations [16]
. GT-Power uses the one dimensional solution of the fully
unsteady, nonlinear Navier-Stokes equations (conservation of continuity, momentum, and
energy) to simulate gas flow dynamics throughout the engine. Two different time integration
methods, explicit and implicit, are used to generate the primary solution variables for the Navier-
Stokes equation. The explicit method is suggested for simulations over small time scales when
wave dynamics are important and the implicit method is suggested for non-engine long-duration
simulations. The primary solution variables for the explicit method are mass flow, density, and
internal energy. The primary solution variables for the implicit method are mass flow, pressure,
and total enthalpy. From these three variables any remaining gas properties are calculated. All
property quantities are averages across the flow direction because the solutions are solved in one
dimension. In order to improve the model’s accuracy the entire system is split into smaller parts
or discretized. The GT-Power library is equipped for both steady-state and transient simulations.
GT-Power engine models are built by placing library supplied engine components (e.g.
pipes, flowsplits, turbines, etc.) and engine connections (e.g. valves, fuel injectors, gears, etc.)
onto the graphical user interface known as the GT-ISE. The user is only required to input
component geometries and initial conditions due to GT-Power’s internal algorithms. For engine
performance simulations GT-Power has built in combustion models which are chosen based on
how the final simulation model is used. The combustion models are non-predictive, predictive,
and semi-predictive. These combustion models are part of what makes GT-Power a powerful
engine modeling tool. The non-predictive combustion model uses a predefined function to model
combustion, whereas the predictive combustion model requires more input from the user and
continuously calculates combustion based on the evolving physical conditions of the engine. The
18
semi-predictive combustion model uses the predefined functions from the non-predictive model
based on inputs that are imposed by the user. The combustion models utilized by GT-Power
allow for the engine model to be tuned to varying degrees of specificity required by the user for
data analysis.
Superchargers and turbochargers are also modeled in GT-Power using turbine and
compressor objects from the library. The user is required to input the performance map data of
the turbine or compressor typically provided by the manufacturer. Using the mass flow rate,
pressure ratio, and efficiency of the turbine or compressor for each speed line, GT-Power
extrapolates and interpolates the data and creates an internal performance map.
Another aspect of GT-Power that contributes to its relevance and strength is the ability to
integrate controllers. GT-Power has a template for a proportional-integral-derivative (PID)
controller. The PID controller controls the input into a system such that the output is a
commanded target value [6]
. The most important aspect of building a PID controller is choosing
the right gains. The correct gains force the controller to output the desired target value as quickly
as possible. Calibrating the PID controller with the right gains can be a tedious trial and error
process that is still required in GT-Power.
After an engine model is created in GT-Power and simulations are run, the results are
analyzed in GT-Suite’s post processing application called GT-Post. GT-Post allows the user to
plot, view, and manipulate data [16]
.
Although GT-Power is a powerful modeling tool, if there is no test data available with
which to tune the engine after it has been constructed, accuracy of the model decreases.
19
1.5 Key Engine Performance Parameters
The following normalized key engine performance parameters are discussed in the
following chapters in order to understand and analyze engine behaviour. Brake specific fuel
consumption (BSFC) is defined as the fuel mass flow rate ( ) divided by brake engine power
( [7]
.
(8)
Indicated specific fuel consumption (ISFC) is defined as the fuel mass flow rate divided by
indicated engine power [7]
.
(9)
Brake mean effective pressure (BMEP) is defined as brake power times the number of crank
revolutions for each power stroke divided by displaced volume times engine speed [7]
.
(10)
Thermal engine efficiency is defined as the work per cycle ( ) divided by the mass of fuel
times the heating value of the fuel ( [7]
.
(11)
A measure of the engine’s ability to pump air is known as its volumetric efficiency. It is defined
as the air mass flow rate divided by the density of air times displaced volume and engine speed
[7].
(12)
20
1.6 Thesis Overview
In the following chapters the process of modeling a stock and SuperTurbocharged 2.0l
General Motors (GM) Ecotec engine on GT-Power is outlined and significant results are
discussed. The aim of this research is to show that a SuperTurbocharged small displacement
engine has the capability to outperform a large displacement engine while reducing fuel
consumption.
21
CHAPTER 2: STOCK GENERAL MOTORS (GM) ECOTEC 2.0l LSJ ENGINE
2.1 GM Ecotec LSJ Engine
The GM Ecotec LSJ was chosen for research purposes by VanDyne SuperTurbo, Inc. due
to its strength as a stock engine, its easy acquisition as a crate engine, and the extensive literature
and support from GM Performance Division on upgrades and tuning. Two engines were initially
purchased with the intent of testing one for baseline data and the other was to be equipped with
the SuperTurbo for testing and data gathering. In the following chapter engine specifications and
performance parameters are explained. In order to input accurate engine data into GT-Power for
simulation, a GM Ecotec LSJ engine is taken apart and measured; this process is outlined and
important measurements acknowledged. The engine model building process and simulation on
GT-Power is explained. The engine model is validated when it closely matches the published
performance map. Significant results from simulation are discussed.
2.1.1 Engine Specifications
The GM Ecotec LSJ is a 2.0l inline 4-cylinder supercharged engine, henceforth referred
to as the Ecotec engine. A high pressure port fuel injection system supplies gasoline to the
engine. The head and engine block are lost foam and sand cast aluminum making them
lightweight, but also more susceptible to fracture if handled incorrectly. The Ecotec valvetrain
utilizes dual overhead camshafts with four valves per cylinder and
hydraulic roller finger follower valve lifters. Engine parameters are tabulated below in Table 2.1.
22
Engine General Motors Ecotec LSJ
Configuration I-4 Supercharged
Displacement 1998 cc
Bore 86 mm
Stroke 86 mm
Firing Order 1-3-4-2
Compression Ratio 9.5:1
Throttle Type Electronic throttle control
Ignition System Coil-on-plug
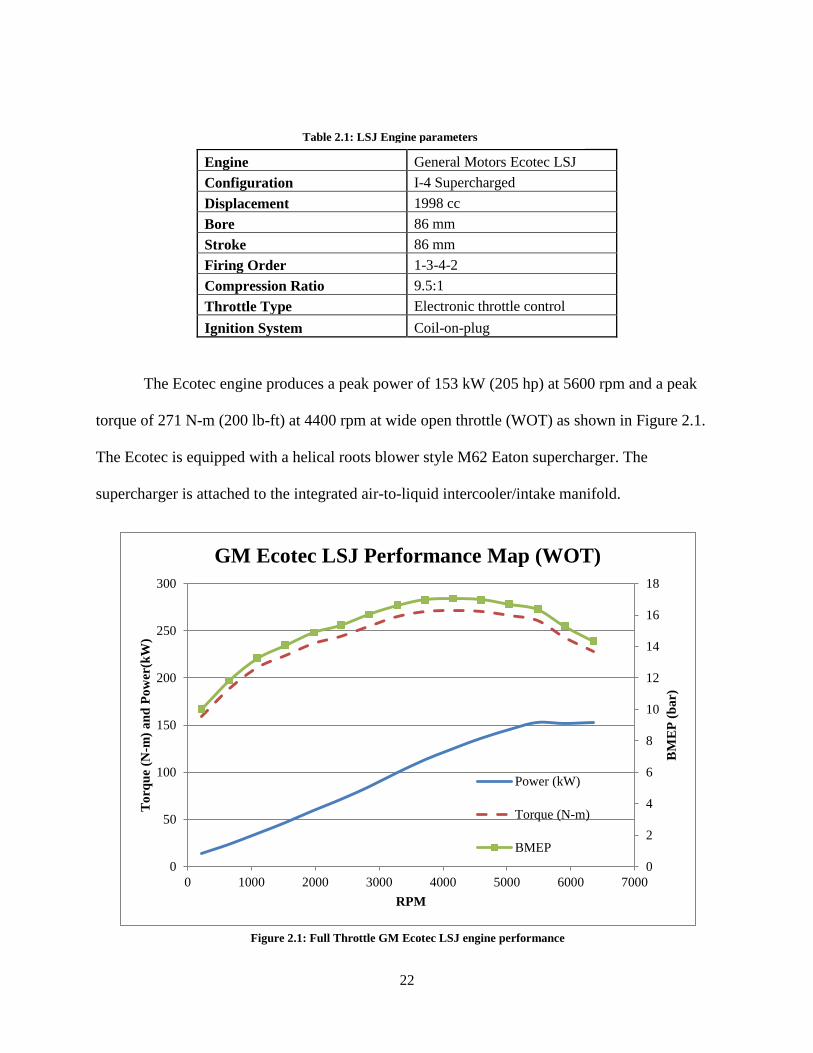
The Ecotec engine produces a peak power of 153 kW (205 hp) at 5600 rpm and a peak
torque of 271 N-m (200 lb-ft) at 4400 rpm at wide open throttle (WOT) as shown in Figure 2.1.
The Ecotec is equipped with a helical roots blower style M62 Eaton supercharger. The
supercharger is attached to the integrated air-to-liquid intercooler/intake manifold.
Table 2.1: LSJ Engine parameters
Figure 2.1: Full Throttle GM Ecotec LSJ engine performance
0
2
4
6
8
10
12
14
16
18
0
50
100
150
200
250
300
0 1000 2000 3000 4000 5000 6000 7000
BM
EP
(b
ar)
To
rqu
e (N
-m)
an
d P
ow
er(k
W)
RPM
GM Ecotec LSJ Performance Map (WOT)
Power (kW)
Torque (N-m)
BMEP
23
2.1.2 Engine Tear Down Process
GT-Power requires information about the geometry of the engine in order to generate
accurate model simulations. The Ecotec engine purchased for SuperTurbo testing was taken
apart and measured. Although some Ecotec geometry was available through build books from
GM Performance Division, the published measurements were validated.
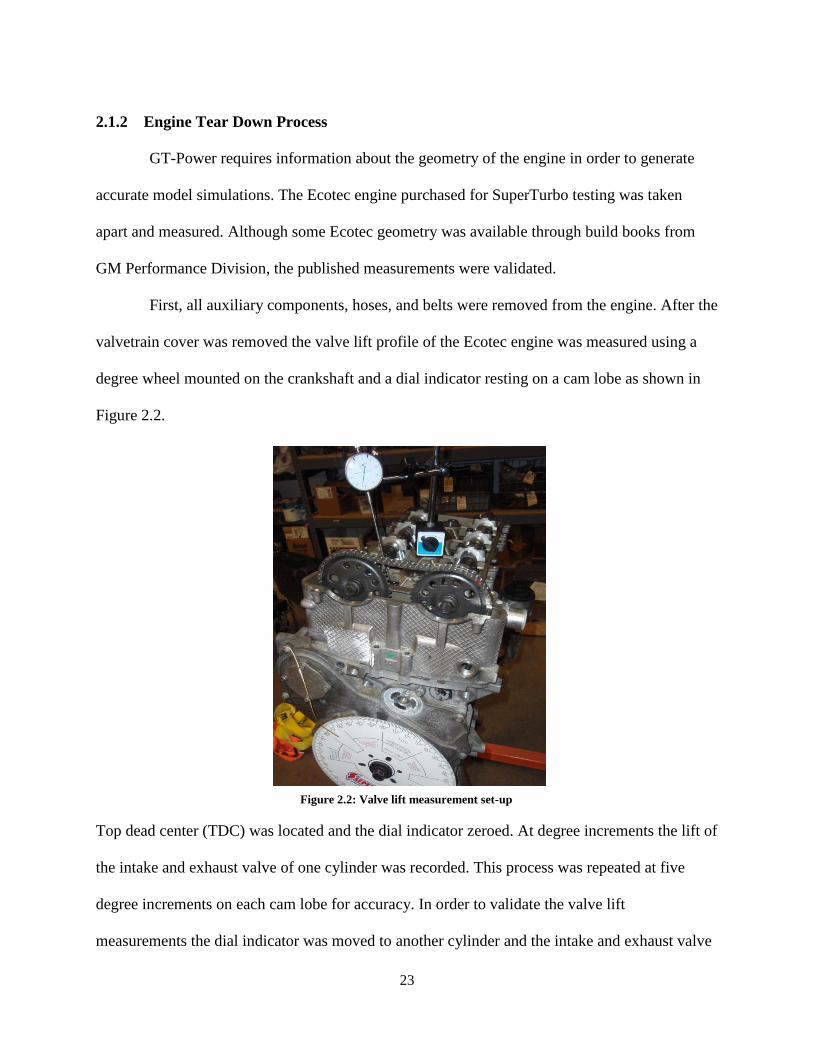
First, all auxiliary components, hoses, and belts were removed from the engine. After the
valvetrain cover was removed the valve lift profile of the Ecotec engine was measured using a
degree wheel mounted on the crankshaft and a dial indicator resting on a cam lobe as shown in
Figure 2.2.
Top dead center (TDC) was located and the dial indicator zeroed. At degree increments the lift of
the intake and exhaust valve of one cylinder was recorded. This process was repeated at five
degree increments on each cam lobe for accuracy. In order to validate the valve lift
measurements the dial indicator was moved to another cylinder and the intake and exhaust valve
Figure 2.2: Valve lift measurement set-up
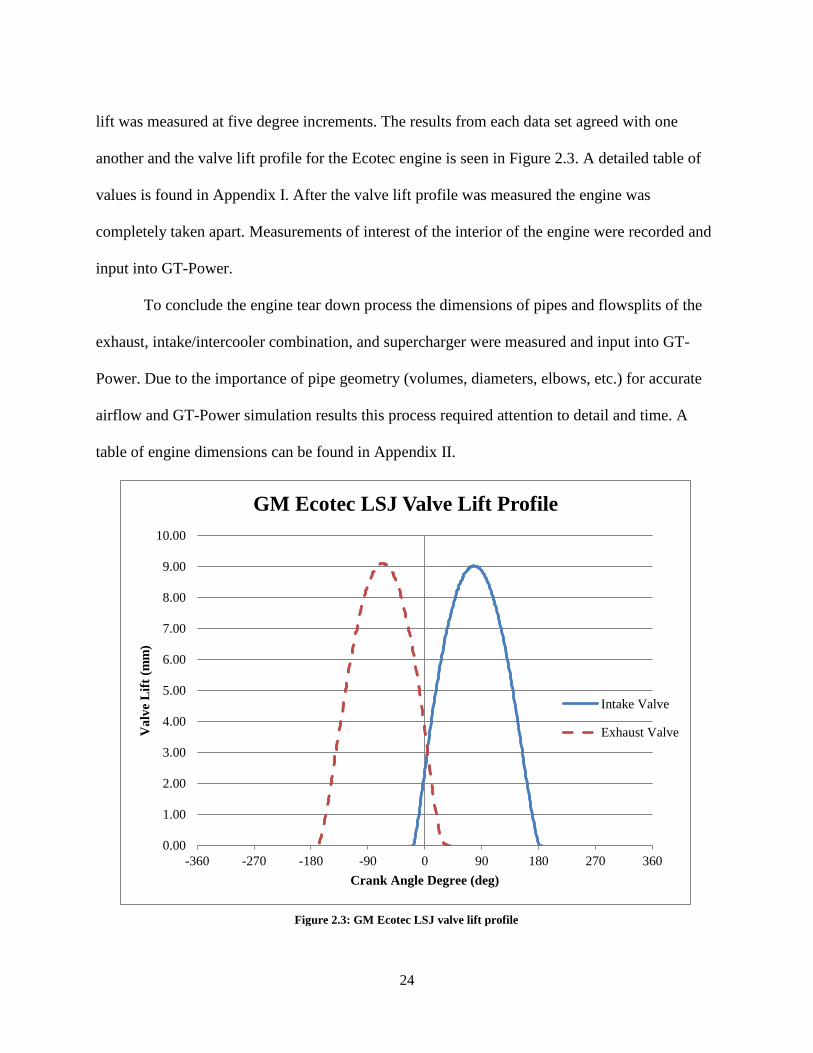
24
lift was measured at five degree increments. The results from each data set agreed with one
another and the valve lift profile for the Ecotec engine is seen in Figure 2.3. A detailed table of
values is found in Appendix I. After the valve lift profile was measured the engine was
completely taken apart. Measurements of interest of the interior of the engine were recorded and
input into GT-Power.
To conclude the engine tear down process the dimensions of pipes and flowsplits of the
exhaust, intake/intercooler combination, and supercharger were measured and input into GT-
Power. Due to the importance of pipe geometry (volumes, diameters, elbows, etc.) for accurate
airflow and GT-Power simulation results this process required attention to detail and time. A
table of engine dimensions can be found in Appendix II.
Figure 2.3: GM Ecotec LSJ valve lift profile
0.00
1.00
2.00
3.00
4.00
5.00
6.00
7.00
8.00
9.00
10.00
-360 -270 -180 -90 0 90 180 270 360
Va
lve
Lif
t (m
m)
Crank Angle Degree (deg)
GM Ecotec LSJ Valve Lift Profile
Intake Valve
Exhaust Valve
25
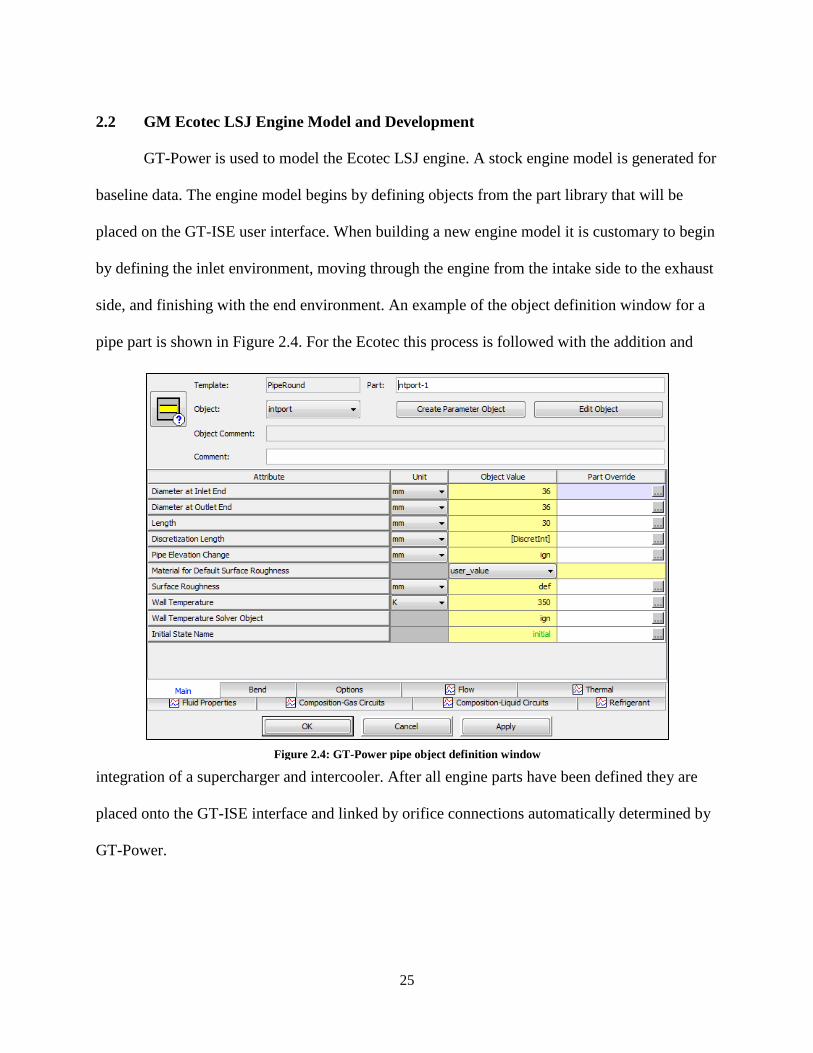
2.2 GM Ecotec LSJ Engine Model and Development
GT-Power is used to model the Ecotec LSJ engine. A stock engine model is generated for
baseline data. The engine model begins by defining objects from the part library that will be
placed on the GT-ISE user interface. When building a new engine model it is customary to begin
by defining the inlet environment, moving through the engine from the intake side to the exhaust
side, and finishing with the end environment. An example of the object definition window for a
pipe part is shown in Figure 2.4. For the Ecotec this process is followed with the addition and
integration of a supercharger and intercooler. After all engine parts have been defined they are
placed onto the GT-ISE interface and linked by orifice connections automatically determined by
GT-Power.
Figure 2.4: GT-Power pipe object definition window
26
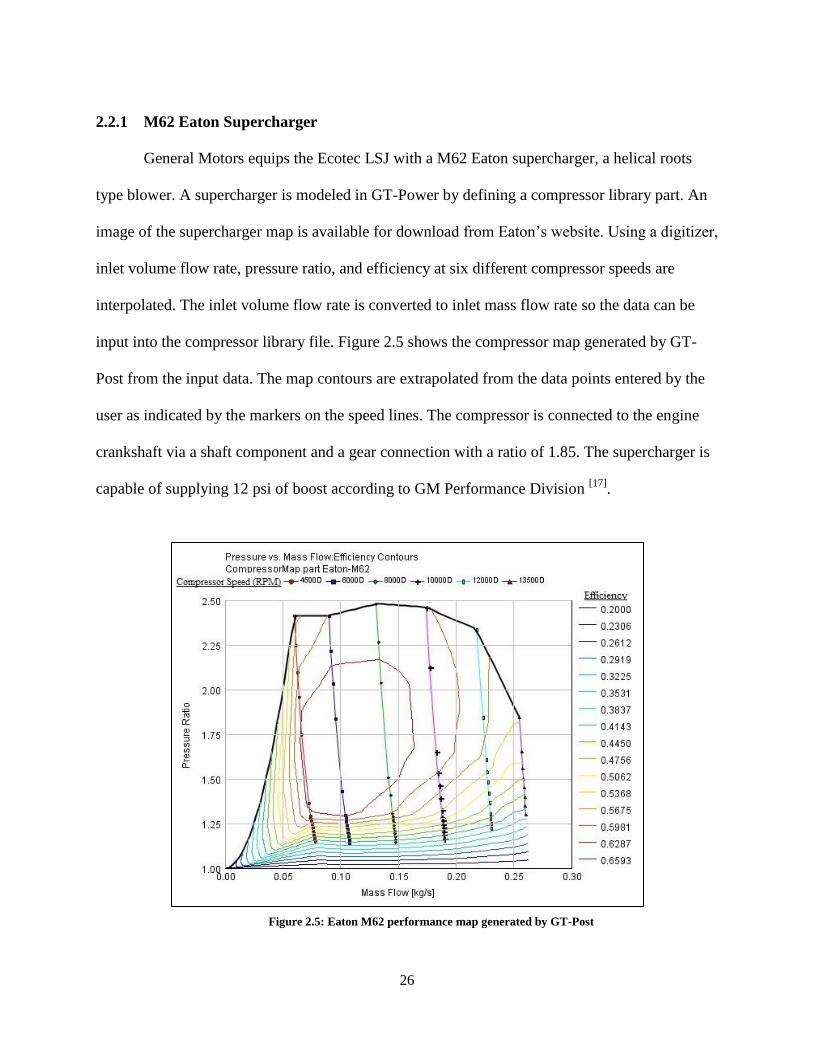
2.2.1 M62 Eaton Supercharger
General Motors equips the Ecotec LSJ with a M62 Eaton supercharger, a helical roots
type blower. A supercharger is modeled in GT-Power by defining a compressor library part. An
image of the supercharger map is available for download from Eaton’s website. Using a digitizer,
inlet volume flow rate, pressure ratio, and efficiency at six different compressor speeds are
interpolated. The inlet volume flow rate is converted to inlet mass flow rate so the data can be
input into the compressor library file. Figure 2.5 shows the compressor map generated by GT-
Post from the input data. The map contours are extrapolated from the data points entered by the
user as indicated by the markers on the speed lines. The compressor is connected to the engine
crankshaft via a shaft component and a gear connection with a ratio of 1.85. The supercharger is
capable of supplying 12 psi of boost according to GM Performance Division [17]
.
Figure 2.5: Eaton M62 performance map generated by GT-Post
27
2.2.2 Stock Engine Model Development
Once all engine components were in place and connected on the GT-ISE interface the
model was ready to be run. Run parameters were identified in the Run Setup window of GT-
Power. For baseline engine data the Ecotec was evaluated at speeds of 200 rpm to 6800 rpm at
intervals of 400 rpm. Initially, no blow off valve was included in the model. This resulted in high
power and torque, 189 kW (253 hp) at 6800 rpm and 302 N-m (223 lb-ft ) at 4000 rpm,
respectively. Continuously boosted air from the compressor was fed to the engine, which
accounted for the high values of power and torque.
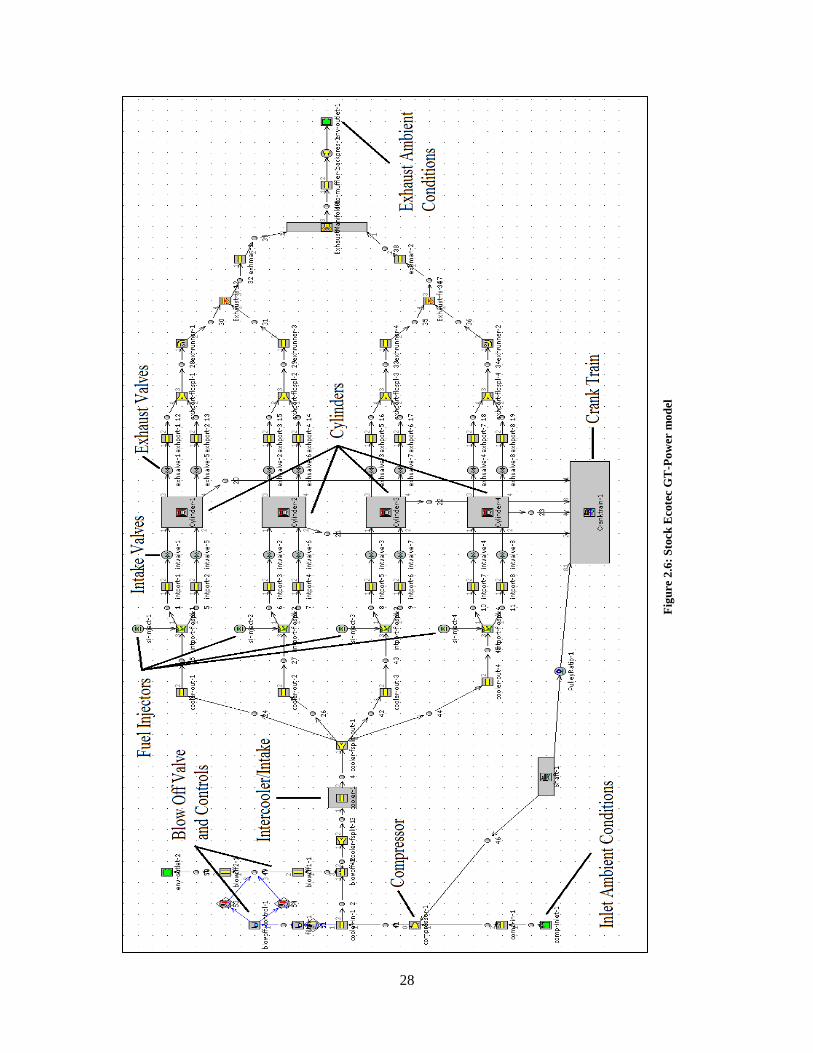
A blow off valve and PID controller were added to the engine model. The final Ecotec
engine model is shown in Figure 2.6. The PID controller was set to open the blow off valve at
1.8 bar or 12 psi. After the blow off valve and PID controller were added an engine simulation
was run. Again, the power and torque were much higher than desired. The first step to correct
this error was to calibrate the PID controller by running simulations with an array of gain values.
These simulations had little effect on the performance of the engine. The next step was to look at
the parameters of the in-cylinder combustion model.
28
Fig
ure
2.6
: S
tock
Eco
tec
GT
-Po
wer
mo
del
29
By modifying the built in GT-Power combustion models a more accurate burn profile can
be determined. An array of typical values defined by GT-Power for burn duration and anchoring
angle were run in combination with the array of controller gain values. The anchoring angle was
the number of crank angle degrees between TDC and the fifty percent combustion point of the
Wiebe combustion model curve. After the simulations were run the results were analyzed using
Matlab. Each set of performance values was graphed and compared to the published data. The
final simulation results are discussed in the following section and GT-Post generated data tables
for select engine speeds are shown in Appendix III.
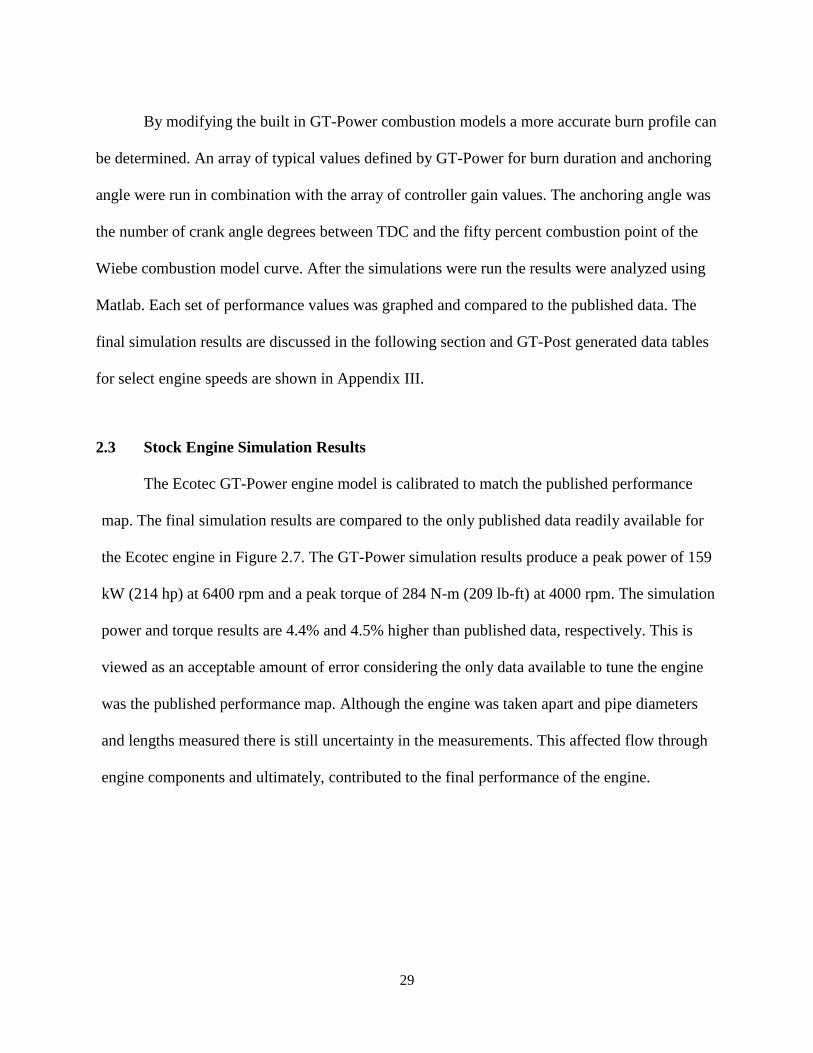
2.3 Stock Engine Simulation Results
The Ecotec GT-Power engine model is calibrated to match the published performance
map. The final simulation results are compared to the only published data readily available for
the Ecotec engine in Figure 2.7. The GT-Power simulation results produce a peak power of 159
kW (214 hp) at 6400 rpm and a peak torque of 284 N-m (209 lb-ft) at 4000 rpm. The simulation
power and torque results are 4.4% and 4.5% higher than published data, respectively. This is
viewed as an acceptable amount of error considering the only data available to tune the engine
was the published performance map. Although the engine was taken apart and pipe diameters
and lengths measured there is still uncertainty in the measurements. This affected flow through
engine components and ultimately, contributed to the final performance of the engine.
30
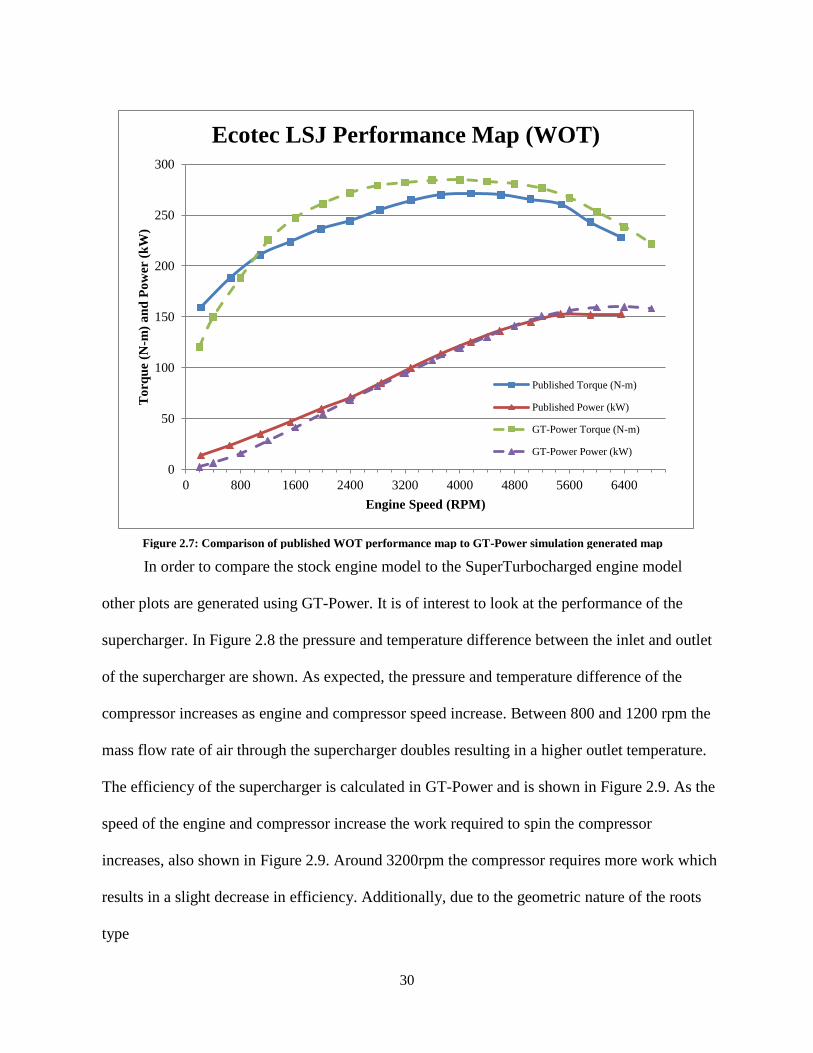
In order to compare the stock engine model to the SuperTurbocharged engine model
other plots are generated using GT-Power. It is of interest to look at the performance of the
supercharger. In Figure 2.8 the pressure and temperature difference between the inlet and outlet
of the supercharger are shown. As expected, the pressure and temperature difference of the
compressor increases as engine and compressor speed increase. Between 800 and 1200 rpm the
mass flow rate of air through the supercharger doubles resulting in a higher outlet temperature.
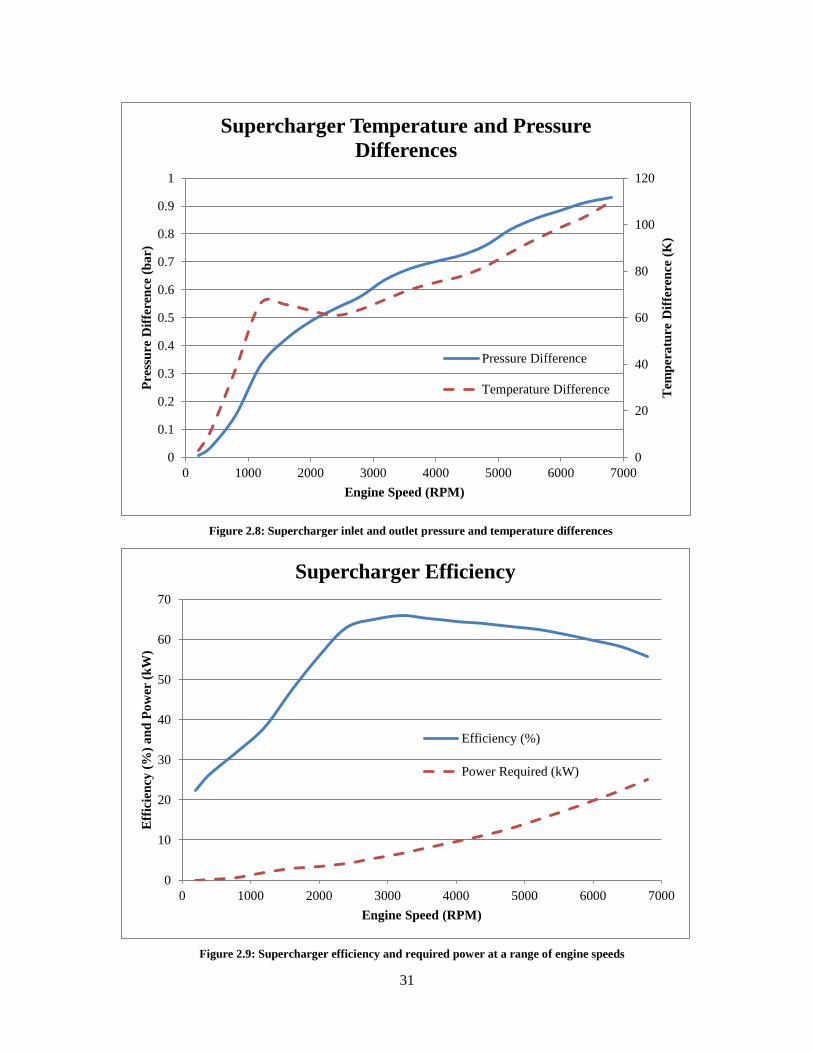
The efficiency of the supercharger is calculated in GT-Power and is shown in Figure 2.9. As the
speed of the engine and compressor increase the work required to spin the compressor
increases, also shown in Figure 2.9. Around 3200rpm the compressor requires more work which
results in a slight decrease in efficiency. Additionally, due to the geometric nature of the roots
type
Figure 2.7: Comparison of published WOT performance map to GT-Power simulation generated map
0
50
100
150
200
250
300
0 800 1600 2400 3200 4000 4800 5600 6400
To
rqu
e (N
-m)
an
d P
ow
er (
kW
)
Engine Speed (RPM)
Ecotec LSJ Performance Map (WOT)
Published Torque (N-m)
Published Power (kW)
GT-Power Torque (N-m)
GT-Power Power (kW)
31
Figure 2.9: Supercharger efficiency and required power at a range of engine speeds
0
10
20
30
40
50
60
70
0 1000 2000 3000 4000 5000 6000 7000
Eff
icie
ncy
(%
) a
nd
Po
wer
(k
W)
Engine Speed (RPM)
Supercharger Efficiency
Efficiency (%)
Power Required (kW)
Figure 2.8: Supercharger inlet and outlet pressure and temperature differences
0
20
40
60
80
100
120
0
0.1
0.2
0.3
0.4
0.5
0.6
0.7
0.8
0.9
1
0 1000 2000 3000 4000 5000 6000 7000
Tem
per
atu
re D
iffe
ren
ce (
K)
Pre
ssu
re D
iffe
ren
ce (
ba
r)
Engine Speed (RPM)
Supercharger Temperature and Pressure
Differences
Pressure Difference
Temperature Difference
32
blower inefficiencies can be associated with air leakage around the blades. The efficiency trend
line is also indicative of the parasitic losses associated with superchargers as engine speeds
increase. The efficiency of the supercharger is comparable to published results of a slightly
smaller 1.5l supercharger [11]
.
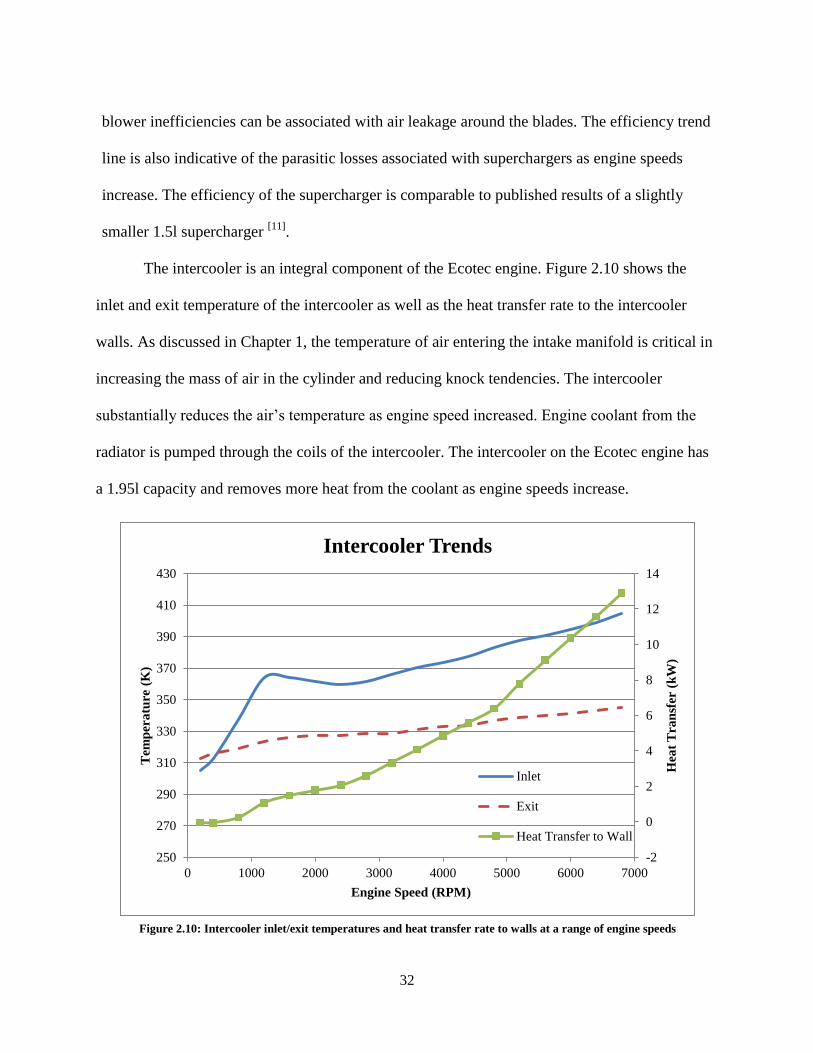
The intercooler is an integral component of the Ecotec engine. Figure 2.10 shows the
inlet and exit temperature of the intercooler as well as the heat transfer rate to the intercooler
walls. As discussed in Chapter 1, the temperature of air entering the intake manifold is critical in
increasing the mass of air in the cylinder and reducing knock tendencies. The intercooler
substantially reduces the air’s temperature as engine speed increased. Engine coolant from the
radiator is pumped through the coils of the intercooler. The intercooler on the Ecotec engine has
a 1.95l capacity and removes more heat from the coolant as engine speeds increase.
Figure 2.10: Intercooler inlet/exit temperatures and heat transfer rate to walls at a range of engine speeds
-2
0
2
4
6
8
10
12
14
250
270
290
310
330
350
370
390
410
430
0 1000 2000 3000 4000 5000 6000 7000
Hea
t T
ran
sfer
(k
W)
Tem
per
atu
re (
K)
Engine Speed (RPM)
Intercooler Trends
Inlet
Exit
Heat Transfer to Wall
33
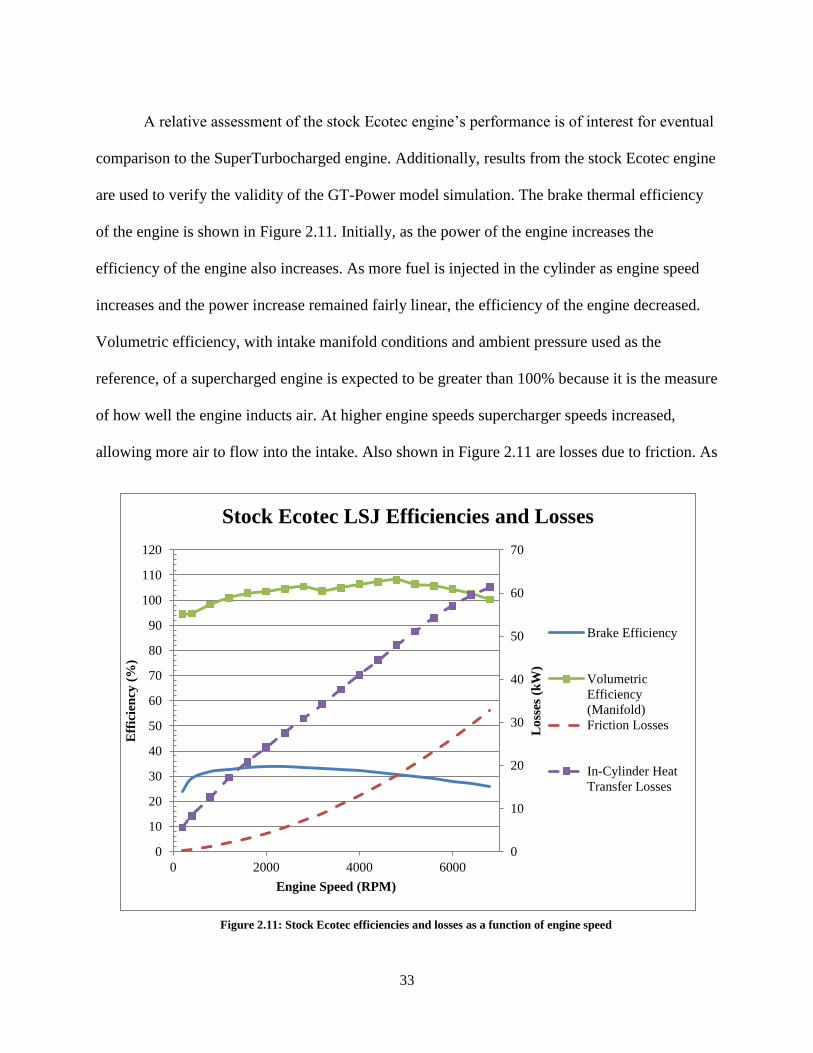
A relative assessment of the stock Ecotec engine’s performance is of interest for eventual
comparison to the SuperTurbocharged engine. Additionally, results from the stock Ecotec engine
are used to verify the validity of the GT-Power model simulation. The brake thermal efficiency
of the engine is shown in Figure 2.11. Initially, as the power of the engine increases the
efficiency of the engine also increases. As more fuel is injected in the cylinder as engine speed
increases and the power increase remained fairly linear, the efficiency of the engine decreased.
Volumetric efficiency, with intake manifold conditions and ambient pressure used as the
reference, of a supercharged engine is expected to be greater than 100% because it is the measure
of how well the engine inducts air. At higher engine speeds supercharger speeds increased,
allowing more air to flow into the intake. Also shown in Figure 2.11 are losses due to friction. As
Figure 2.11: Stock Ecotec efficiencies and losses as a function of engine speed
0
10
20
30
40
50
60
70
0
10
20
30
40
50
60
70
80
90
100
110
120
0 2000 4000 6000
Lo
sses
(k
W)
Eff
icie
ncy
(%
)
Engine Speed (RPM)
Stock Ecotec LSJ Efficiencies and Losses
Brake Efficiency
Volumetric
Efficiency
(Manifold)
Friction Losses
In-Cylinder Heat
Transfer Losses
34
indicated by the trend above, higher engine speeds result in greater friction losses caused by
pumping work, rubbing work, and accessory work. In-cylinder heat transfer losses also increase
as engine speed increases. The number of compression and expansion cycles increases as engine
speed increases. This causes in-cylinder temperatures to increase, thus, increasing heat transfer to
the cylinder wall.
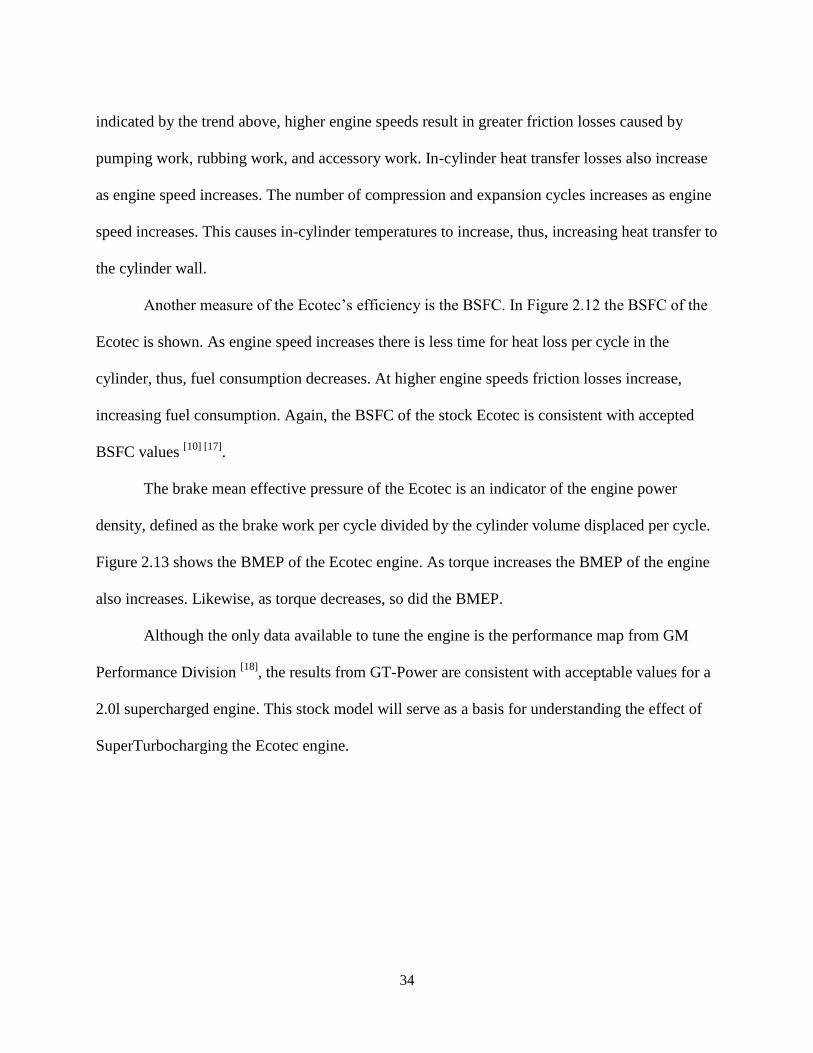
Another measure of the Ecotec’s efficiency is the BSFC. In Figure 2.12 the BSFC of the
Ecotec is shown. As engine speed increases there is less time for heat loss per cycle in the
cylinder, thus, fuel consumption decreases. At higher engine speeds friction losses increase,
increasing fuel consumption. Again, the BSFC of the stock Ecotec is consistent with accepted
BSFC values [10] [17]
.
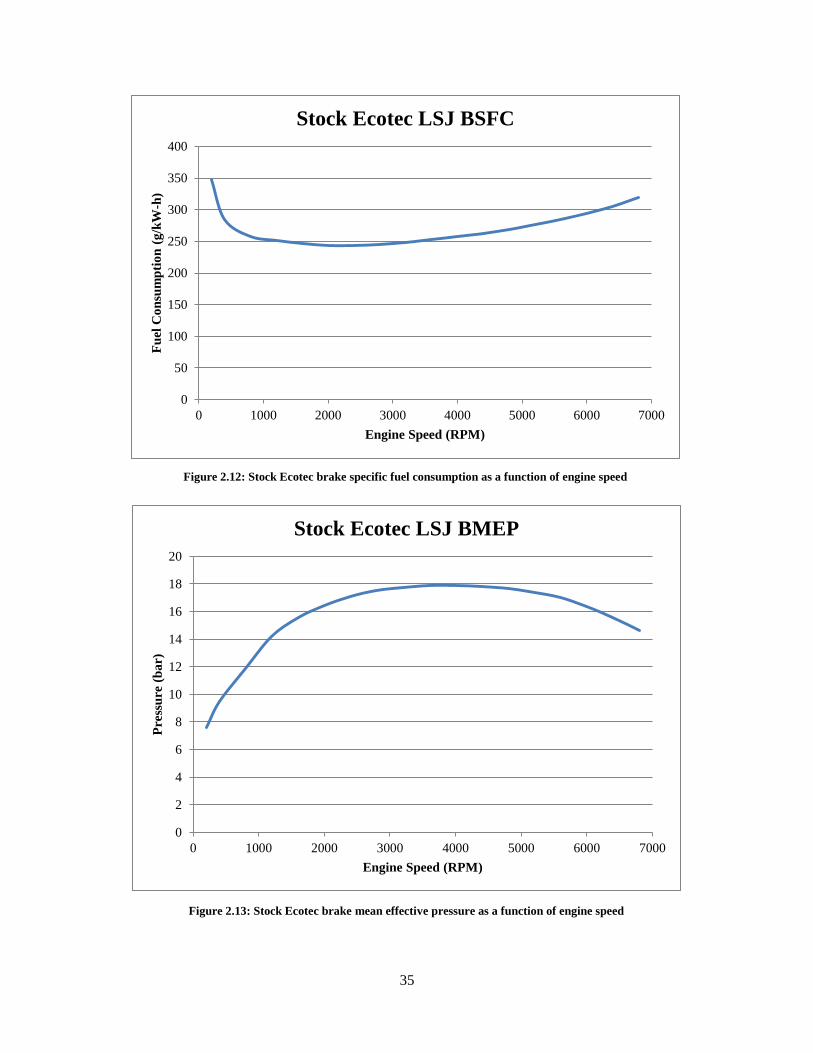
The brake mean effective pressure of the Ecotec is an indicator of the engine power
density, defined as the brake work per cycle divided by the cylinder volume displaced per cycle.
Figure 2.13 shows the BMEP of the Ecotec engine. As torque increases the BMEP of the engine
also increases. Likewise, as torque decreases, so did the BMEP.
Although the only data available to tune the engine is the performance map from GM
Performance Division [18]
, the results from GT-Power are consistent with acceptable values for a
2.0l supercharged engine. This stock model will serve as a basis for understanding the effect of
SuperTurbocharging the Ecotec engine.
35
0
50
100
150
200
250
300
350
400
0 1000 2000 3000 4000 5000 6000 7000
Fu
el C
on
sum
pti
on
(g
/kW
-h)
Engine Speed (RPM)
Stock Ecotec LSJ BSFC
Figure 2.12: Stock Ecotec brake specific fuel consumption as a function of engine speed
0
2
4
6
8
10
12
14
16
18
20
0 1000 2000 3000 4000 5000 6000 7000
Pre
ssu
re (
ba
r)
Engine Speed (RPM)
Stock Ecotec LSJ BMEP
Figure 2.13: Stock Ecotec brake mean effective pressure as a function of engine speed
36
CHAPTER 3: SUPERTURBOCHARGED GM ECOTEC 2.0L LSJ ENGINE
3.1 SuperTurbocharged GM Ecotec Engine Model and Development
GT-Power is again used to model the SuperTurbocharged Ecotec engine. The
SuperTurbocharged engine model is generated to show that the SuperTurboTM
can match and
exceed the performance curve of the stock Ecotec engine, while increasing engine efficiency.
The SuperTurbocharged Ecotec engine model is built from the stock engine model. The stock
model is placed on the GT-ISE user interface and the supercharger and end environment are
removed. A throttle, air filter, aftercooler, CVT, engine bypass, and the SuperTurboTM
are
integrated into the new model and linked by orifice connections automatically determined by
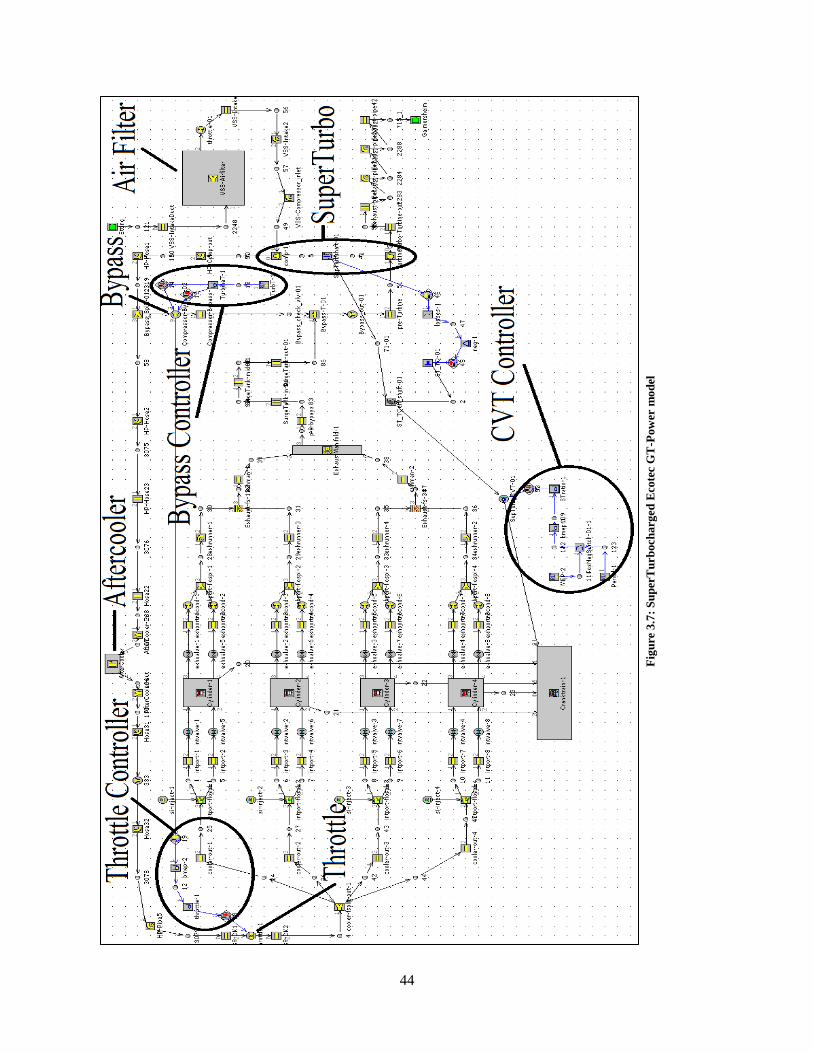
GT-Power. In this chapter the development of the SuperTurbocharged Ecotec engine model and
its components are outlined and the simulation process explained. The model is considered
complete when the SuperTurbocharging system functions as designed. The project goal is to
closely match the performance maps of the stock GT-Power Ecotec LSJ engine model and the
engine targeted for downsizing purposes, the GM Vortec LMG.
3.1.1 GM Vortec LMG Engine
The GM Vortec LMG engine is a 5.3l V8 naturally aspirated engine, henceforth referred
to as the Vortec engine. It is currently found in a number of Chevrolet and GMC
sport utility vehicles and pickup trucks [19]
. This engine is ideal for comparison to the Ecotec
because of the shared manufacturer as well as the opportunity for downsizing. A technically
advanced engine, the Vortec engine is equipped with variable valve timing (VVT), active fuel
management, an advanced electronic throttle control, returnless fuel injection, an advanced
37
ignition system, and is E85 flexible [19]
. A sequential direct injection fuel system supplies
gasoline and E85 to the engine. Engine parameters are tabulated below in Table 3.1.
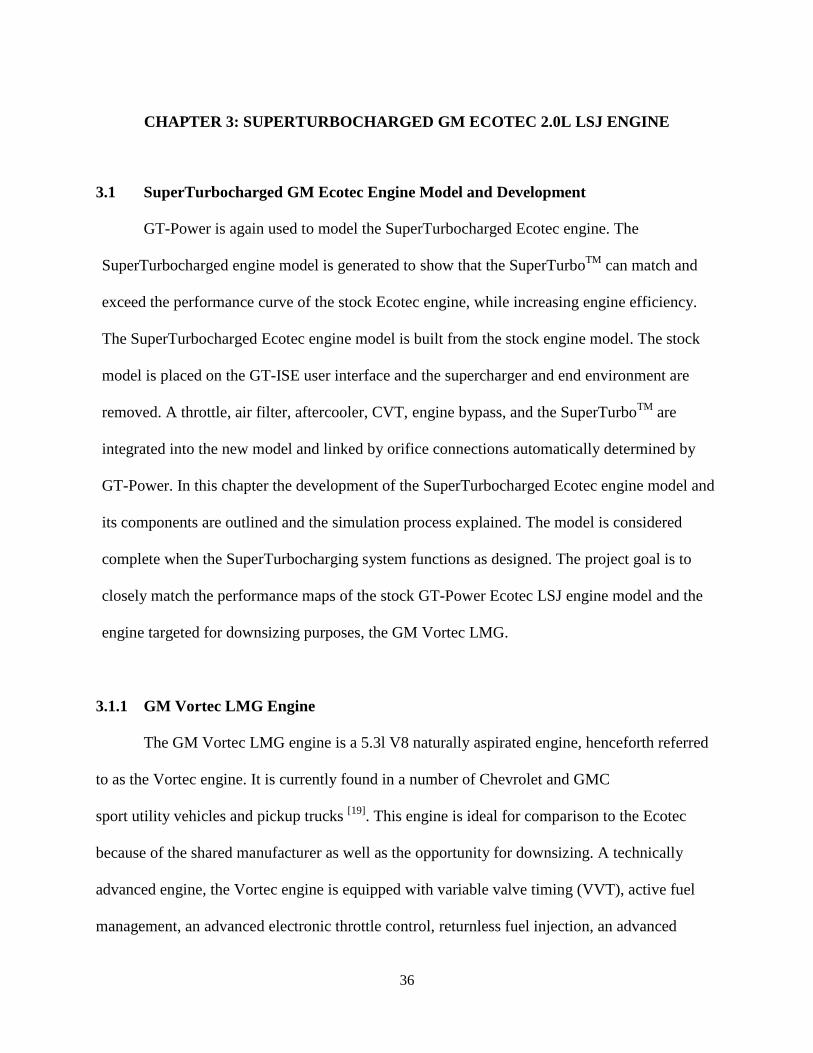
The Vortec produces a peak power of 230 kW (308 hp) at 5400 rpm and a peak torque of
454 N-m (335 lb-ft) at 4000 rpm at WOT as shown in Figure 3.1.
Engine General Motors Vortec LMG
Configuration V8 Naturally Aspirated
Displacement 5328 cc
Bore 96.01 mm
Stroke 92.00 mm
Firing Order 1-8-7-2-6-5-4-3
Compression Ratio 9.9:1
Throttle Type Electronic throttle control
Ignition System Coil-near-plug
Table 3.1: LSJ Engine parameters
Figure 3.1: Full Throttle GM Vortec LMG engine performance map
0
2
4
6
8
10
12
0
50
100
150
200
250
300
350
400
450
500
0 1000 2000 3000 4000 5000 6000 7000
BM
EP
(b
ar)
To
rqu
e (N
-m)
an
d P
ow
er (
kW
)
Engine Speed (RPM)
GM Vortec LMG Performance Map (WOT)
Torque (N-m)
Power (kW)
BMEP
38
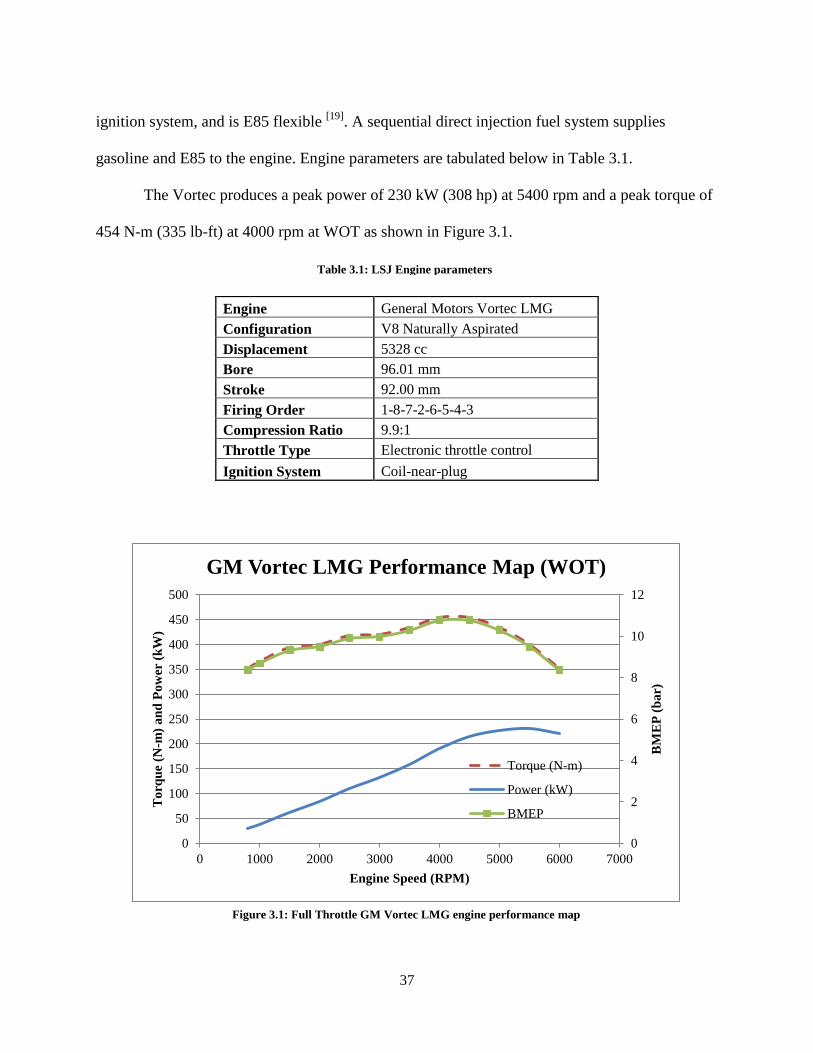
3.1.2 SuperTurboTM
Model
A previously constructed GT-Power model of the SuperTurboTM
is provided by VanDyne
for the purposes of this research. Figure 3.2 shows this model, which includes a turbine and
compressor, a shaft object connecting the compressor and turbine, the expected mechanical
losses associated with the SuperTurboTM
, the torque imposed on the shaft due to inefficiencies,
and a CVT. The speed of the SuperTurbo shaft is sensed using a sensor connection object. A
mechanical loss is associated with the speed of the shaft. This value is then multiplied by a
negative number indicating that it is a loss. An actuator connection object relays the final loss
value to the torque object. Through a torque connection the appropriate torque due to
inefficiencies is imposed on a new SuperTurbo shaft object (labeled ST_TQeff_shaft-01) which
is connected to the CVT. The torque delivered to the CVT is estimated by VanDyne to be about
80% of the torque in from the SuperTurbo shaft. The CVT is then connected to the crankshaft
(not shown in Figure 3.2).
Figure 3.2: GT-Power SuperTurboTM Model
39
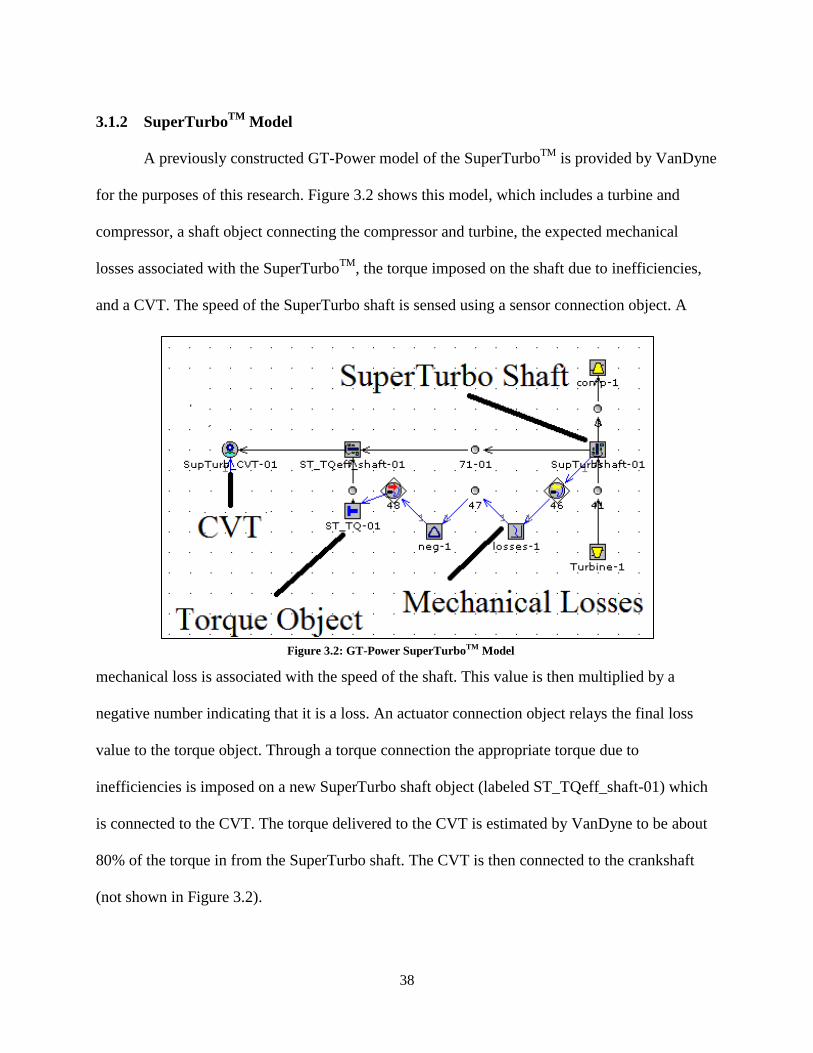
Turbine and compressor maps are also included in the SuperTurboTM
model. Figure 3.3
shows the compressor map generated by GT-Post from the input data. The map contours are
extrapolated from the data points entered by the user as indicated by the markers on the speed
lines. Figure 3.4 shows the turbine map generated by GT-Post from the input data. The turbine
and compressor map data is provided by VanDyne and are appropriately sized for the 2.0l Ecotec
engine.
Figure 3.3: SuperTurboTM compressor performance map generated by GT-Post
40
3.1.3 SuperTurbocharged Engine Model Development
The stock Ecotec engine served as the basis for the SuperTurbocharged model. In
addition to the SuperTurboTM
, a throttle, aftercooler, engine bypass, and air filter were added
from a GT-Power model of a 2.0l Volkswagen engine used for previous research at VanDyne
SuperTurboTM
, Inc. Additionally, the integral intercooler/intake was removed and replaced by a
similarly sized traditional intake manifold. The model was first run at one operating point of
3000 rpm at WOT in order to verify that the new pipe geometry was an acceptable match for
research purposes. Flow through the added pipes remained at low Mach numbers and was not
restricted.
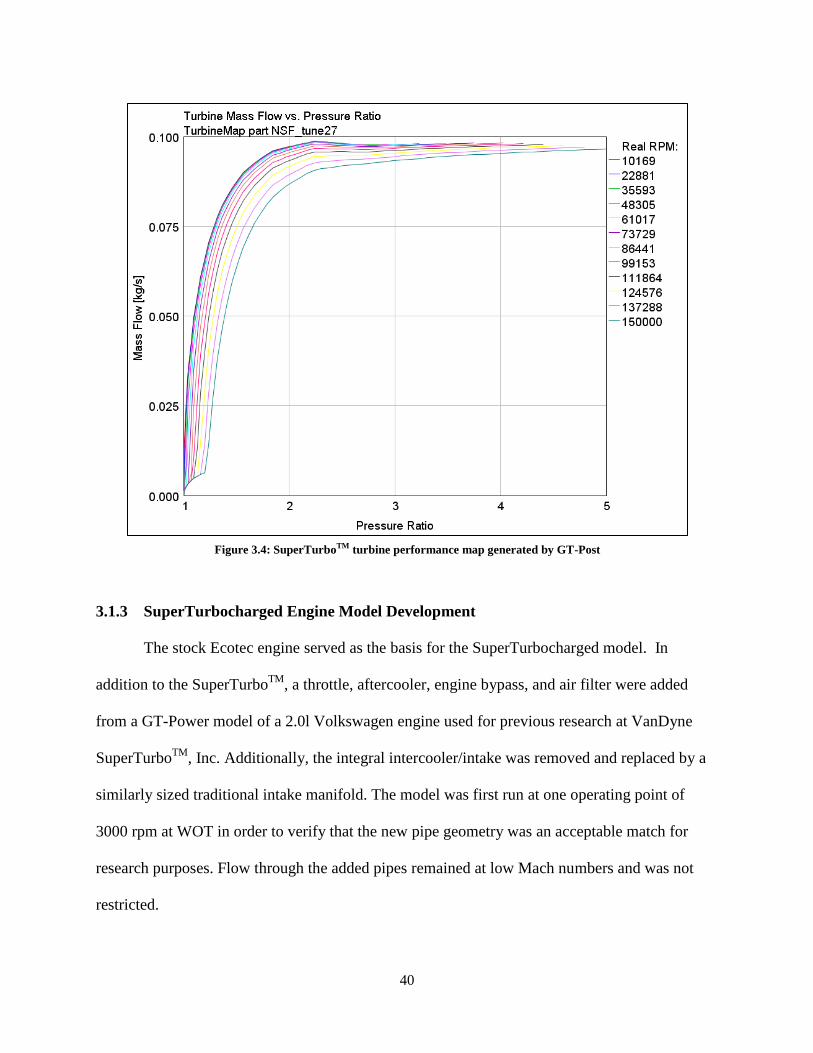
Figure 3.4: SuperTurboTM turbine performance map generated by GT-Post
41
At increments of 1000 rpm beginning with 1000 rpm and ending with 6000 rpm at WOT,
the SuperTurbocharged engine model was run. An error titled ‘injection timing overlap’ began to
appear and caused the simulation to fail at higher engine speeds. When the CVT was added to
the SuperTurbocharged model predefined CVT gear ratios were transferred to the new model. A
stoichiometric air/fuel ratio was imposed on the fuel injectors. Thus, the fuel injectors were
continuously spraying fuel into the engine in order to maintain the stoichiometric air/fuel ratio.
This, combined with the predefined CVT ratios, was causing the simulations to fail. To
determine an appropriate CVT gear ratio a PID controller was added to the CVT. The controller
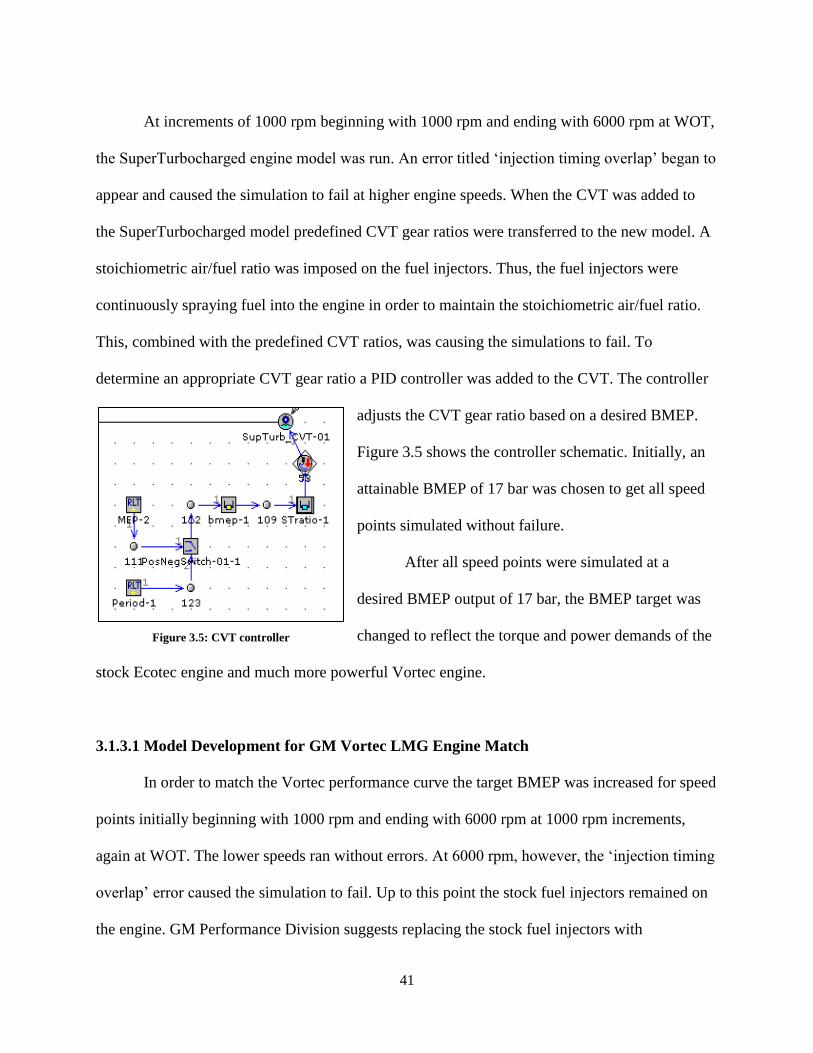
adjusts the CVT gear ratio based on a desired BMEP.
Figure 3.5 shows the controller schematic. Initially, an
attainable BMEP of 17 bar was chosen to get all speed
points simulated without failure.
After all speed points were simulated at a
desired BMEP output of 17 bar, the BMEP target was
changed to reflect the torque and power demands of the
stock Ecotec engine and much more powerful Vortec engine.
3.1.3.1 Model Development for GM Vortec LMG Engine Match
In order to match the Vortec performance curve the target BMEP was increased for speed
points initially beginning with 1000 rpm and ending with 6000 rpm at 1000 rpm increments,
again at WOT. The lower speeds ran without errors. At 6000 rpm, however, the ‘injection timing
overlap’ error caused the simulation to fail. Up to this point the stock fuel injectors remained on
the engine. GM Performance Division suggests replacing the stock fuel injectors with
Figure 3.5: CVT controller
42
performance fuel injectors if the engine will be making more than 240 hp [18]
. Using a calculation
guideline from GM Performance Division the rate of fuel delivery was effectively doubled for
matching the Vortec engine. After this change was made, the desired BMEP for the 6000 rpm
speed point was matched. With all speed point simulations converging at the demanded high
BMEP values, the thermal and flow data of the engine was looked at for verification. To
supplement the data set, additional simulations were run at 800, 1500, 2500, 3500, 4500, and
5500 rpm.
After examining the exhaust manifold and pipes leading to the inlet of the SuperTurboTM
it was determined that the pipe temperatures were too low. Based on results from previous
simulations it was expected that the turbine inlet temperature would exceed 1223K, the turbine
material failure point [20]
. GT-Power has a built-in template called ‘WallTempSolver’ that helps
the user define convective and radiative heat transfer around pipes and flowsplits and thus, better
reflect pipe temperatures. The ‘WallTempSolver’ object was defined and applied to the exhaust
configuration. Each speed point was run again and the exhaust pipe temperatures more closely
reflected expected conditions.
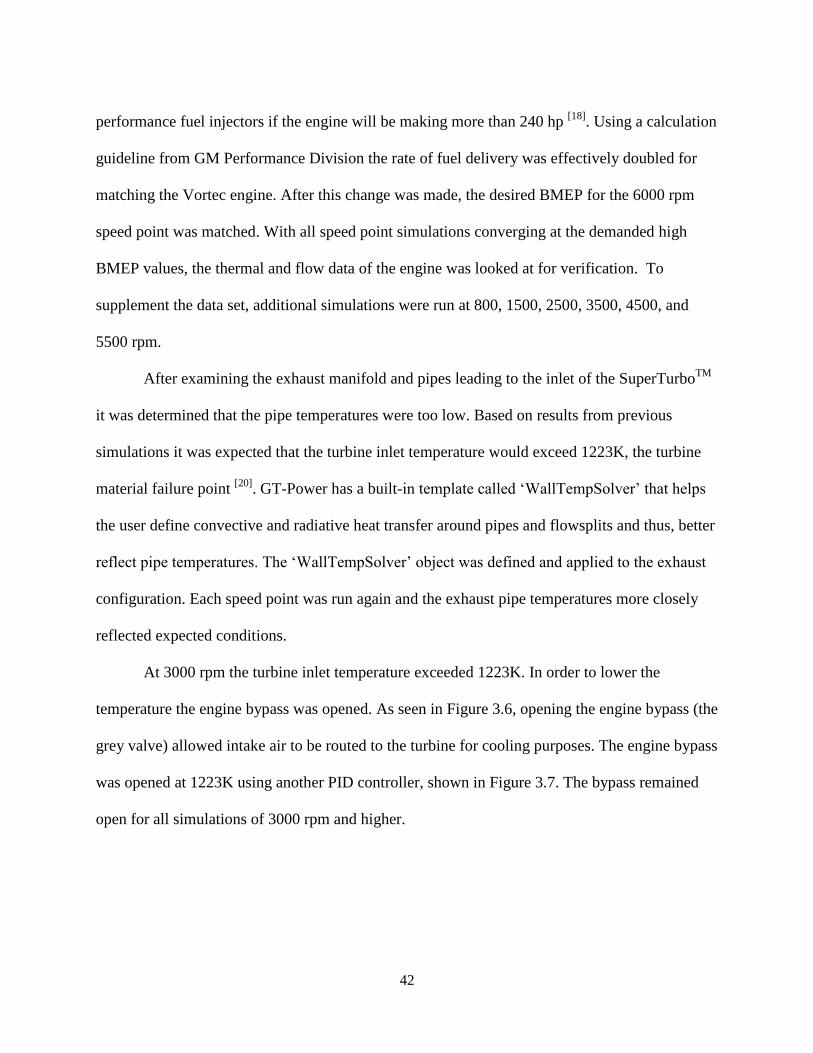
At 3000 rpm the turbine inlet temperature exceeded 1223K. In order to lower the
temperature the engine bypass was opened. As seen in Figure 3.6, opening the engine bypass (the
grey valve) allowed intake air to be routed to the turbine for cooling purposes. The engine bypass
was opened at 1223K using another PID controller, shown in Figure 3.7. The bypass remained
open for all simulations of 3000 rpm and higher.
43
At 4000 rpm the low pressure difference between the bypass and flowsplit where
bypassed air met the air compressed by the SuperTurboTM
resulted in exhaust gas recirculation
(EGR), which reduced the turbine inlet temperature. EGR can be an effective tool for cooling
the turbine inlet temperature, but in this case the low pressure difference negated the effect of the
bypass and increased fuel consumption. A PID controller managing throttle angle, shown in
Figure 3.7, was added to the model in order to maintain a 0.1 bar pressure difference between
these two orifices.
At 5000 rpm the turbine inlet temperature exceeded 1223K. Fuel cooling by lowering the
air/fuel ratio was introduced to lower the turbine temperature. When extra fuel was added to the
system the intake charge was cooled due to fuel evaporation and combustion temperatures
decrease because the specific heat of fuel absorbs energy. Multiple simulations were required for
each speed point from 5000 to 6000 rpm to pinpoint the appropriate air/fuel ratio for turbine inlet
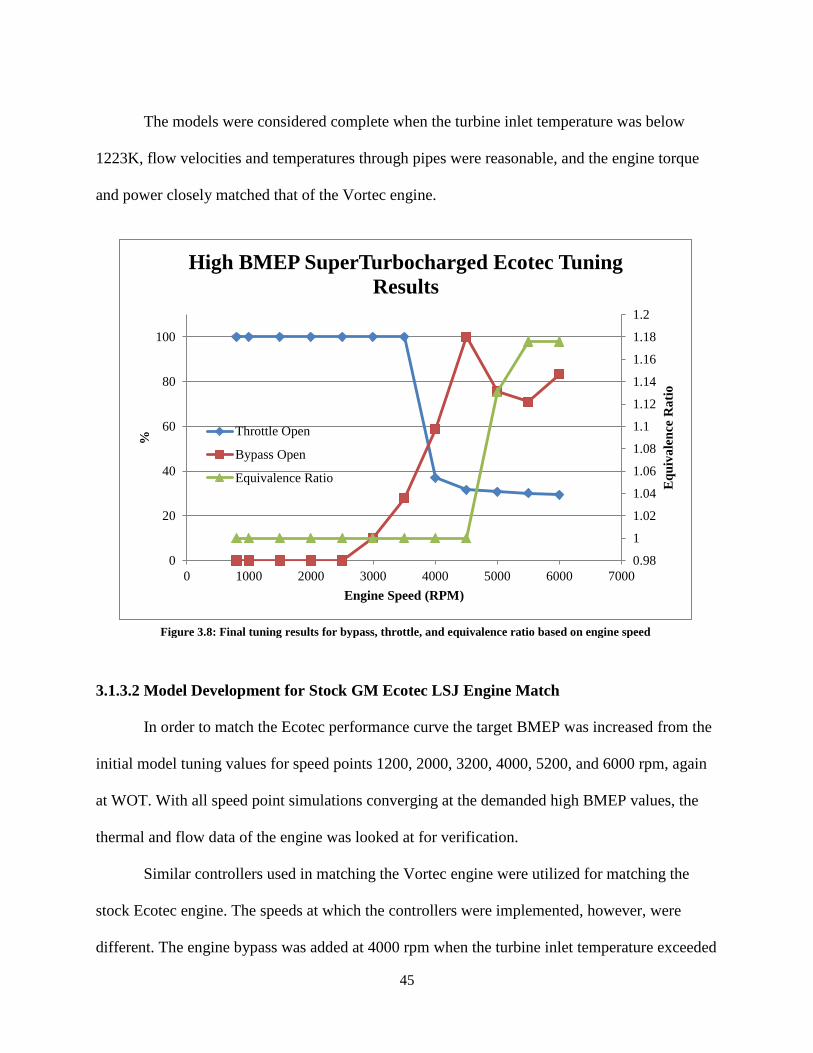
temperature. The final results of throttle closure, engine bypass opening, and equivalence ratio
from numerous model simulations are shown in Figure 3.8. The engine bypass was considered
100% open at the speed at which the most air flowed.
Figure 3.6: SuperTurboTM air flow schematic
44
Fig
ure
3.7
: S
up
erT
urb
och
arg
ed
Eco
tec
GT
-Pow
er m
od
el
45
The models were considered complete when the turbine inlet temperature was below
1223K, flow velocities and temperatures through pipes were reasonable, and the engine torque
and power closely matched that of the Vortec engine.
3.1.3.2 Model Development for Stock GM Ecotec LSJ Engine Match
In order to match the Ecotec performance curve the target BMEP was increased from the
initial model tuning values for speed points 1200, 2000, 3200, 4000, 5200, and 6000 rpm, again
at WOT. With all speed point simulations converging at the demanded high BMEP values, the
thermal and flow data of the engine was looked at for verification.
Similar controllers used in matching the Vortec engine were utilized for matching the
stock Ecotec engine. The speeds at which the controllers were implemented, however, were
different. The engine bypass was added at 4000 rpm when the turbine inlet temperature exceeded
0.98
1
1.02
1.04
1.06
1.08
1.1
1.12
1.14
1.16
1.18
1.2
0
20
40
60
80
100
0 1000 2000 3000 4000 5000 6000 7000
Eq
uiv
ale
nce
Ra
tio
%
Engine Speed (RPM)
High BMEP SuperTurbocharged Ecotec Tuning
Results
Throttle Open
Bypass Open
Equivalence Ratio
Figure 3.8: Final tuning results for bypass, throttle, and equivalence ratio based on engine speed
46
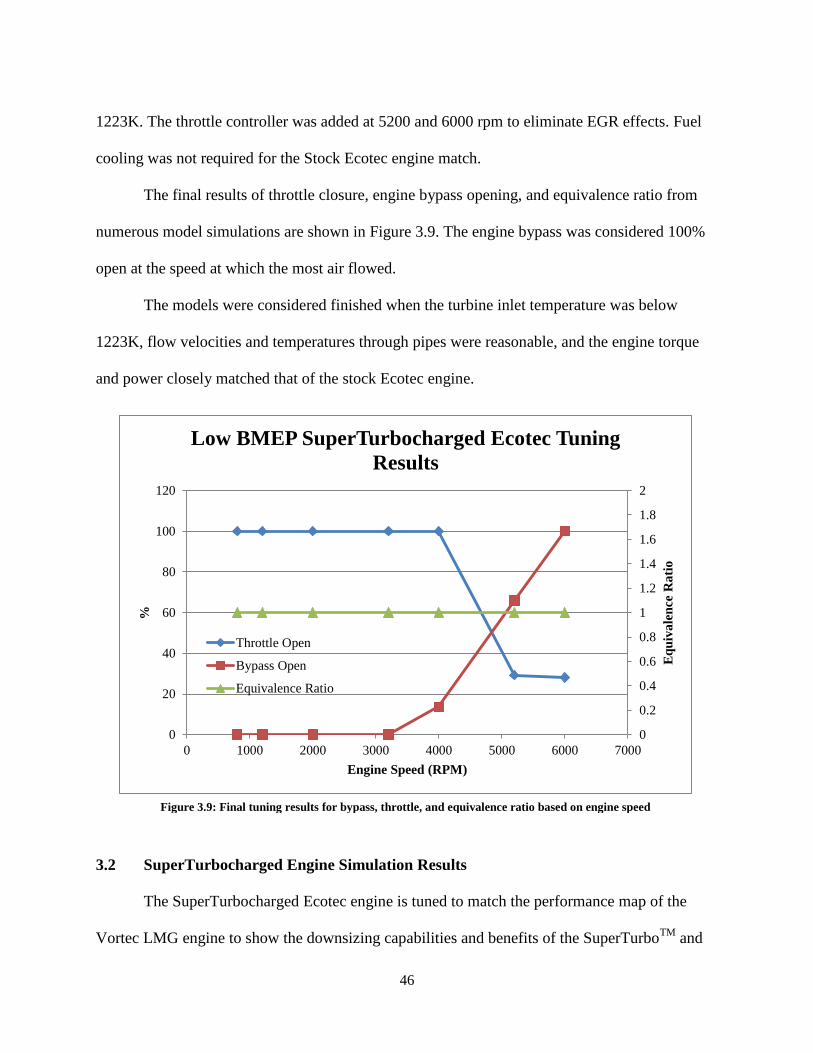
1223K. The throttle controller was added at 5200 and 6000 rpm to eliminate EGR effects. Fuel
cooling was not required for the Stock Ecotec engine match.
The final results of throttle closure, engine bypass opening, and equivalence ratio from
numerous model simulations are shown in Figure 3.9. The engine bypass was considered 100%
open at the speed at which the most air flowed.
The models were considered finished when the turbine inlet temperature was below
1223K, flow velocities and temperatures through pipes were reasonable, and the engine torque
and power closely matched that of the stock Ecotec engine.
3.2 SuperTurbocharged Engine Simulation Results
The SuperTurbocharged Ecotec engine is tuned to match the performance map of the
Vortec LMG engine to show the downsizing capabilities and benefits of the SuperTurboTM
and
0
0.2
0.4
0.6
0.8
1
1.2
1.4
1.6
1.8
2
0
20
40
60
80
100
120
0 1000 2000 3000 4000 5000 6000 7000
Eq
uiv
ale
nce
Ra
tio
%
Engine Speed (RPM)
Low BMEP SuperTurbocharged Ecotec Tuning
Results
Throttle Open
Bypass Open
Equivalence Ratio
Figure 3.9: Final tuning results for bypass, throttle, and equivalence ratio based on engine speed
47
to indicate how a SuperTurbocharged engine would behave on a test bench. Additionally, the
SuperTurbocharged Ecotec engine is tuned to match the performance map of the stock Ecotec
LSJ engine in order to understand the gains that can be made in efficiency. The final simulation
results are discussed in the following sections.
3.2.1 GM Vortec LMG Engine Match
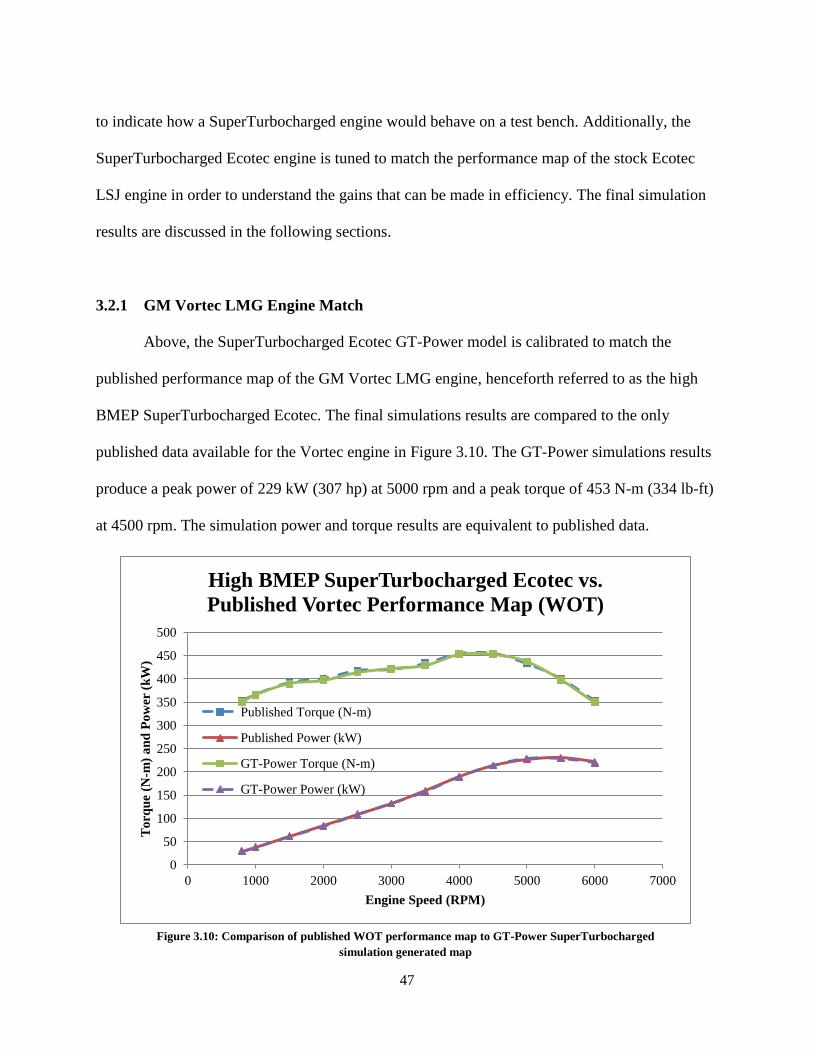
Above, the SuperTurbocharged Ecotec GT-Power model is calibrated to match the
published performance map of the GM Vortec LMG engine, henceforth referred to as the high
BMEP SuperTurbocharged Ecotec. The final simulations results are compared to the only
published data available for the Vortec engine in Figure 3.10. The GT-Power simulations results
produce a peak power of 229 kW (307 hp) at 5000 rpm and a peak torque of 453 N-m (334 lb-ft)
at 4500 rpm. The simulation power and torque results are equivalent to published data.
Figure 3.10: Comparison of published WOT performance map to GT-Power SuperTurbocharged
simulation generated map
0
50
100
150
200
250
300
350
400
450
500
0 1000 2000 3000 4000 5000 6000 7000
To
rqu
e (N
-m)
an
d P
ow
er (
kW
)
Engine Speed (RPM)
High BMEP SuperTurbocharged Ecotec vs.
Published Vortec Performance Map (WOT)
Published Torque (N-m)
Published Power (kW)
GT-Power Torque (N-m)
GT-Power Power (kW)
48
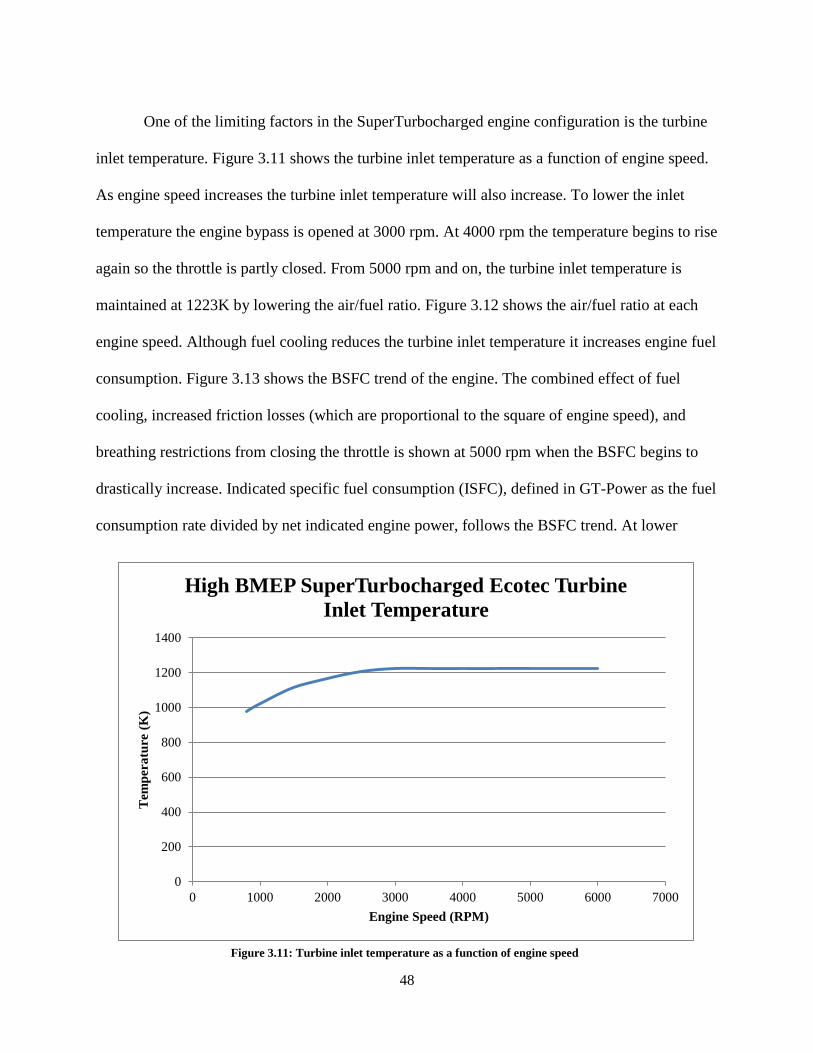
One of the limiting factors in the SuperTurbocharged engine configuration is the turbine
inlet temperature. Figure 3.11 shows the turbine inlet temperature as a function of engine speed.
As engine speed increases the turbine inlet temperature will also increase. To lower the inlet
temperature the engine bypass is opened at 3000 rpm. At 4000 rpm the temperature begins to rise
again so the throttle is partly closed. From 5000 rpm and on, the turbine inlet temperature is
maintained at 1223K by lowering the air/fuel ratio. Figure 3.12 shows the air/fuel ratio at each
engine speed. Although fuel cooling reduces the turbine inlet temperature it increases engine fuel
consumption. Figure 3.13 shows the BSFC trend of the engine. The combined effect of fuel
cooling, increased friction losses (which are proportional to the square of engine speed), and
breathing restrictions from closing the throttle is shown at 5000 rpm when the BSFC begins to
drastically increase. Indicated specific fuel consumption (ISFC), defined in GT-Power as the fuel
consumption rate divided by net indicated engine power, follows the BSFC trend. At lower
Figure 3.11: Turbine inlet temperature as a function of engine speed
0
200
400
600
800
1000
1200
1400
0 1000 2000 3000 4000 5000 6000 7000
Tem
per
atu
re (
K)
Engine Speed (RPM)
High BMEP SuperTurbocharged Ecotec Turbine
Inlet Temperature
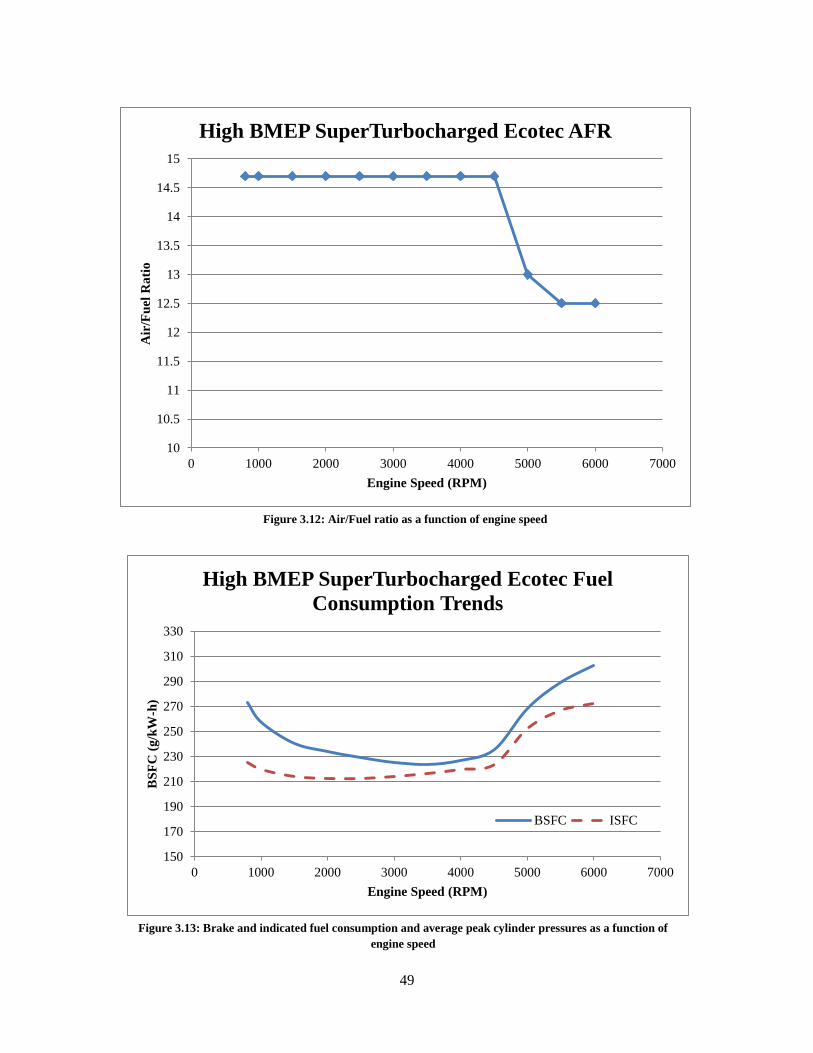
49
Figure 3.12: Air/Fuel ratio as a function of engine speed
10
10.5
11
11.5
12
12.5
13
13.5
14
14.5
15
0 1000 2000 3000 4000 5000 6000 7000
Air
/Fu
el R
ati
o
Engine Speed (RPM)
High BMEP SuperTurbocharged Ecotec AFR
Figure 3.13: Brake and indicated fuel consumption and average peak cylinder pressures as a function of
engine speed
150
170
190
210
230
250
270
290
310
330
0 1000 2000 3000 4000 5000 6000 7000
BS
FC
(g
/kW
-h)
Engine Speed (RPM)
High BMEP SuperTurbocharged Ecotec Fuel
Consumption Trends
BSFC ISFC
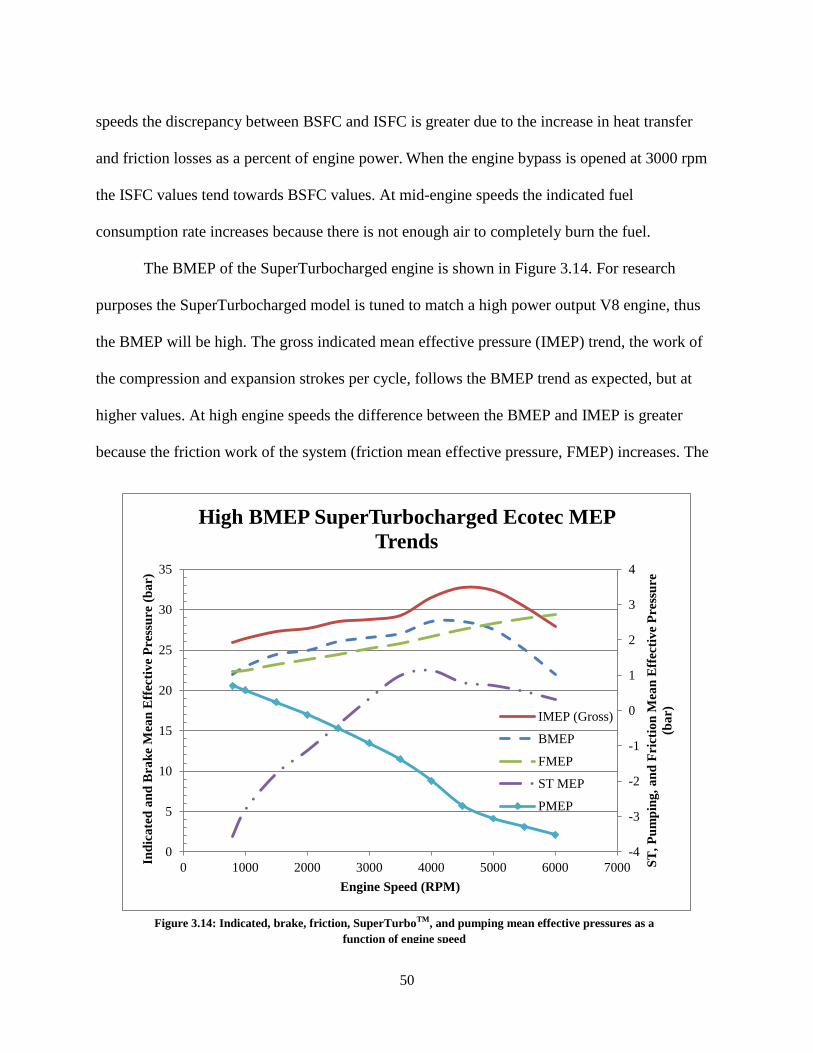
50
speeds the discrepancy between BSFC and ISFC is greater due to the increase in heat transfer
and friction losses as a percent of engine power. When the engine bypass is opened at 3000 rpm
the ISFC values tend towards BSFC values. At mid-engine speeds the indicated fuel
consumption rate increases because there is not enough air to completely burn the fuel.
The BMEP of the SuperTurbocharged engine is shown in Figure 3.14. For research
purposes the SuperTurbocharged model is tuned to match a high power output V8 engine, thus
the BMEP will be high. The gross indicated mean effective pressure (IMEP) trend, the work of
the compression and expansion strokes per cycle, follows the BMEP trend as expected, but at
higher values. At high engine speeds the difference between the BMEP and IMEP is greater
because the friction work of the system (friction mean effective pressure, FMEP) increases. The
Figure 3.14: Indicated, brake, friction, SuperTurboTM, and pumping mean effective pressures as a
function of engine speed
-4
-3
-2
-1
0
1
2
3
4
0
5
10
15
20
25
30
35
0 1000 2000 3000 4000 5000 6000 7000 ST
, P
um
pin
g,
an
d F
rict
ion
Mea
n E
ffec
tiv
e P
ress
ure
(ba
r)
Ind
ica
ted
an
d B
rak
e M
ean
Eff
ecti
ve
Pre
ssu
re (
ba
r)
Engine Speed (RPM)
High BMEP SuperTurbocharged Ecotec MEP
Trends
IMEP (Gross)
BMEP
FMEP
ST MEP
PMEP
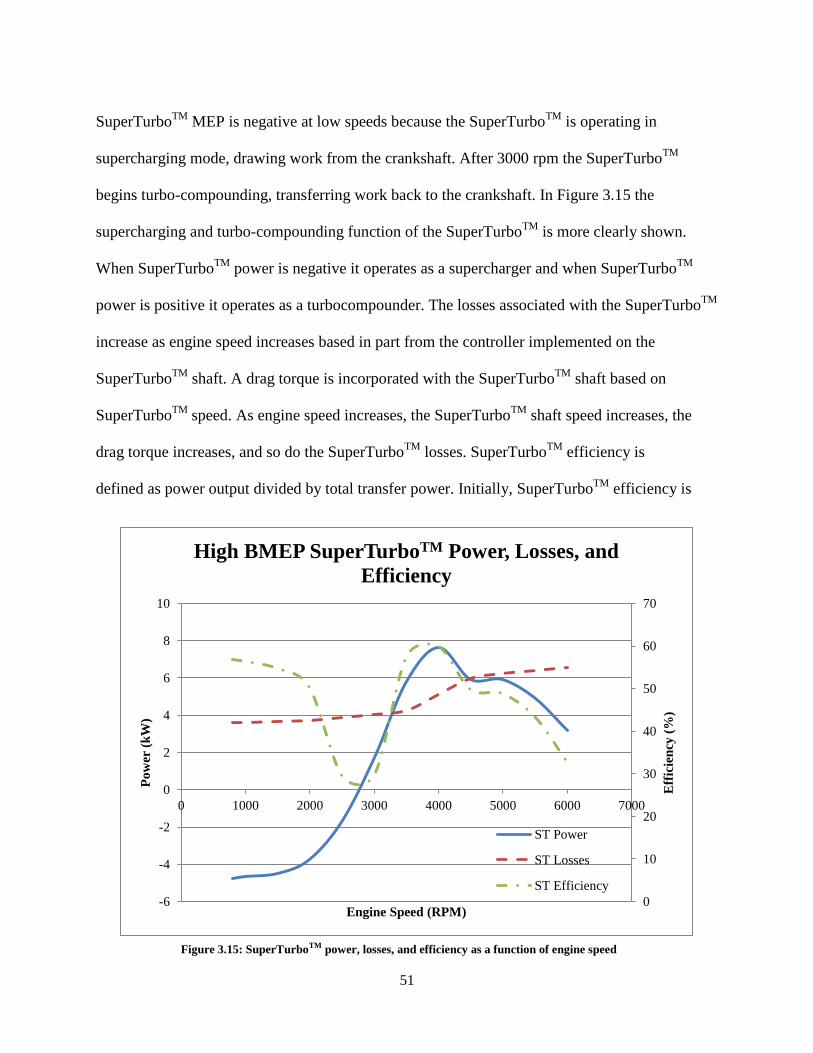
51
SuperTurboTM
MEP is negative at low speeds because the SuperTurboTM
is operating in
supercharging mode, drawing work from the crankshaft. After 3000 rpm the SuperTurboTM
begins turbo-compounding, transferring work back to the crankshaft. In Figure 3.15 the
supercharging and turbo-compounding function of the SuperTurboTM
is more clearly shown.
When SuperTurboTM
power is negative it operates as a supercharger and when SuperTurboTM
power is positive it operates as a turbocompounder. The losses associated with the SuperTurboTM
increase as engine speed increases based in part from the controller implemented on the
SuperTurboTM
shaft. A drag torque is incorporated with the SuperTurboTM
shaft based on
SuperTurboTM
speed. As engine speed increases, the SuperTurboTM
shaft speed increases, the
drag torque increases, and so do the SuperTurboTM
losses. SuperTurboTM
efficiency is
defined as power output divided by total transfer power. Initially, SuperTurboTM
efficiency is
Figure 3.15: SuperTurboTM power, losses, and efficiency as a function of engine speed
0
10
20
30
40
50
60
70
-6
-4
-2
0
2
4
6
8
10
0 1000 2000 3000 4000 5000 6000 7000
Eff
icie
ncy
(%
)
Po
wer
(k
W)
Engine Speed (RPM)
High BMEP SuperTurboTM Power, Losses, and
Efficiency
ST Power
ST Losses
ST Efficiency
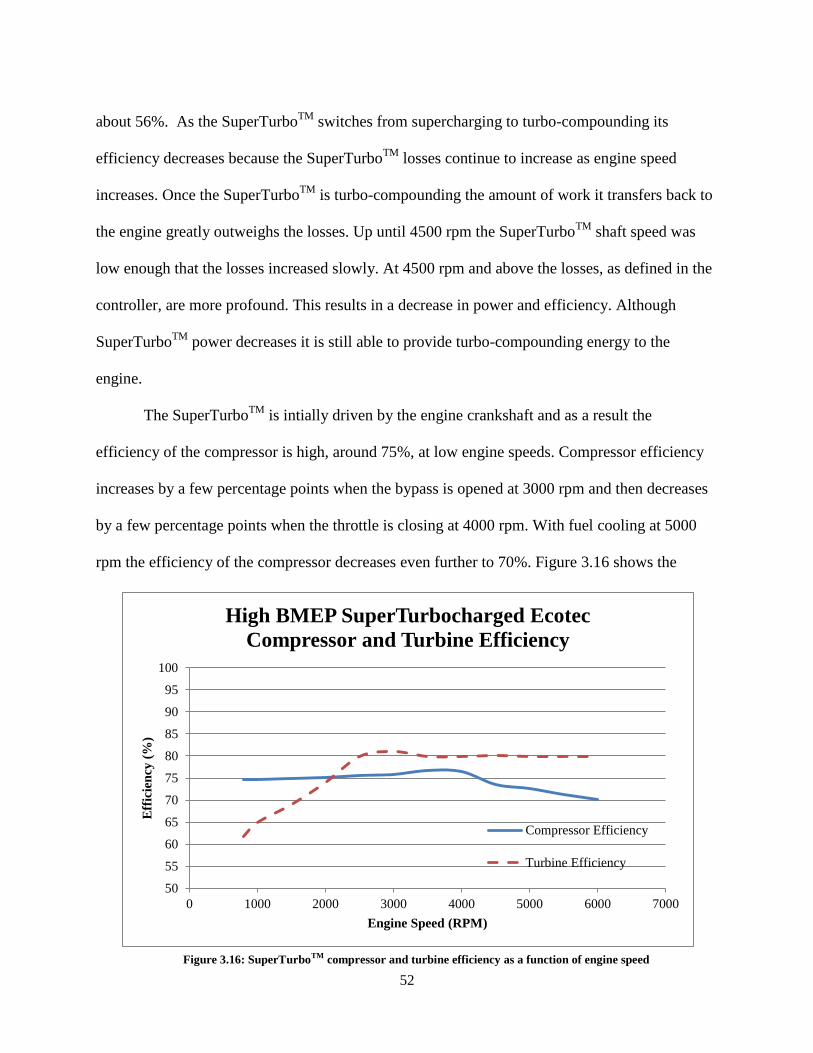
52
about 56%. As the SuperTurboTM
switches from supercharging to turbo-compounding its
efficiency decreases because the SuperTurboTM
losses continue to increase as engine speed
increases. Once the SuperTurboTM
is turbo-compounding the amount of work it transfers back to
the engine greatly outweighs the losses. Up until 4500 rpm the SuperTurboTM
shaft speed was
low enough that the losses increased slowly. At 4500 rpm and above the losses, as defined in the
controller, are more profound. This results in a decrease in power and efficiency. Although
SuperTurboTM
power decreases it is still able to provide turbo-compounding energy to the
engine.
The SuperTurboTM
is intially driven by the engine crankshaft and as a result the
efficiency of the compressor is high, around 75%, at low engine speeds. Compressor efficiency
increases by a few percentage points when the bypass is opened at 3000 rpm and then decreases
by a few percentage points when the throttle is closing at 4000 rpm. With fuel cooling at 5000
rpm the efficiency of the compressor decreases even further to 70%. Figure 3.16 shows the
Figure 3.16: SuperTurboTM compressor and turbine efficiency as a function of engine speed
50
55
60
65
70
75
80
85
90
95
100
0 1000 2000 3000 4000 5000 6000 7000
Eff
icie
ncy
(%
)
Engine Speed (RPM)
High BMEP SuperTurbocharged Ecotec
Compressor and Turbine Efficiency
Compressor Efficiency
Turbine Efficiency
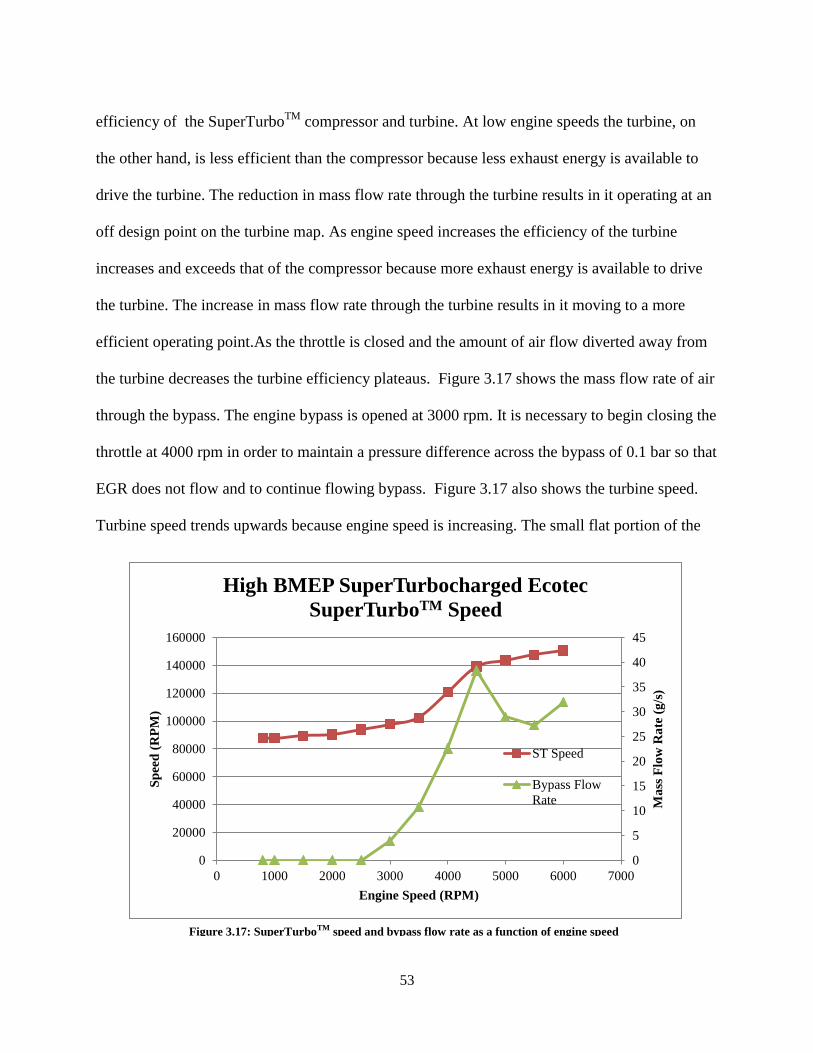
53
efficiency of the SuperTurboTM
compressor and turbine. At low engine speeds the turbine, on
the other hand, is less efficient than the compressor because less exhaust energy is available to
drive the turbine. The reduction in mass flow rate through the turbine results in it operating at an
off design point on the turbine map. As engine speed increases the efficiency of the turbine
increases and exceeds that of the compressor because more exhaust energy is available to drive
the turbine. The increase in mass flow rate through the turbine results in it moving to a more
efficient operating point.As the throttle is closed and the amount of air flow diverted away from
the turbine decreases the turbine efficiency plateaus. Figure 3.17 shows the mass flow rate of air
through the bypass. The engine bypass is opened at 3000 rpm. It is necessary to begin closing the
throttle at 4000 rpm in order to maintain a pressure difference across the bypass of 0.1 bar so that
EGR does not flow and to continue flowing bypass. Figure 3.17 also shows the turbine speed.
Turbine speed trends upwards because engine speed is increasing. The small flat portion of the
Figure 3.17: SuperTurboTM speed and bypass flow rate as a function of engine speed
0
5
10
15
20
25
30
35
40
45
0
20000
40000
60000
80000
100000
120000
140000
160000
0 1000 2000 3000 4000 5000 6000 7000
Ma
ss F
low
Ra
te (
g/s
)
Sp
eed
(R
PM
)
Engine Speed (RPM)
High BMEP SuperTurbocharged Ecotec
SuperTurboTM Speed
ST Speed
Bypass Flow
Rate
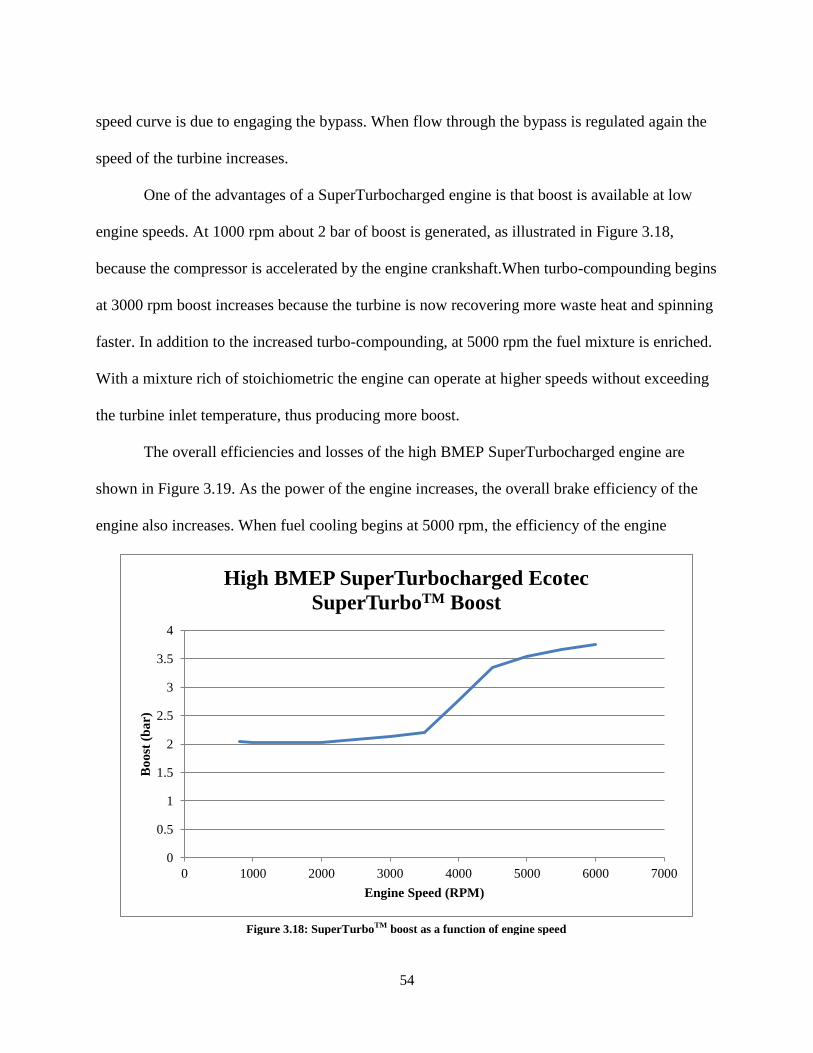
54
speed curve is due to engaging the bypass. When flow through the bypass is regulated again the
speed of the turbine increases.
One of the advantages of a SuperTurbocharged engine is that boost is available at low
engine speeds. At 1000 rpm about 2 bar of boost is generated, as illustrated in Figure 3.18,
because the compressor is accelerated by the engine crankshaft.When turbo-compounding begins
at 3000 rpm boost increases because the turbine is now recovering more waste heat and spinning
faster. In addition to the increased turbo-compounding, at 5000 rpm the fuel mixture is enriched.
With a mixture rich of stoichiometric the engine can operate at higher speeds without exceeding
the turbine inlet temperature, thus producing more boost.
The overall efficiencies and losses of the high BMEP SuperTurbocharged engine are
shown in Figure 3.19. As the power of the engine increases, the overall brake efficiency of the
engine also increases. When fuel cooling begins at 5000 rpm, the efficiency of the engine
Figure 3.18: SuperTurboTM boost as a function of engine speed
0
0.5
1
1.5
2
2.5
3
3.5
4
0 1000 2000 3000 4000 5000 6000 7000
Bo
ost
(b
ar)
Engine Speed (RPM)
High BMEP SuperTurbocharged Ecotec
SuperTurboTM Boost
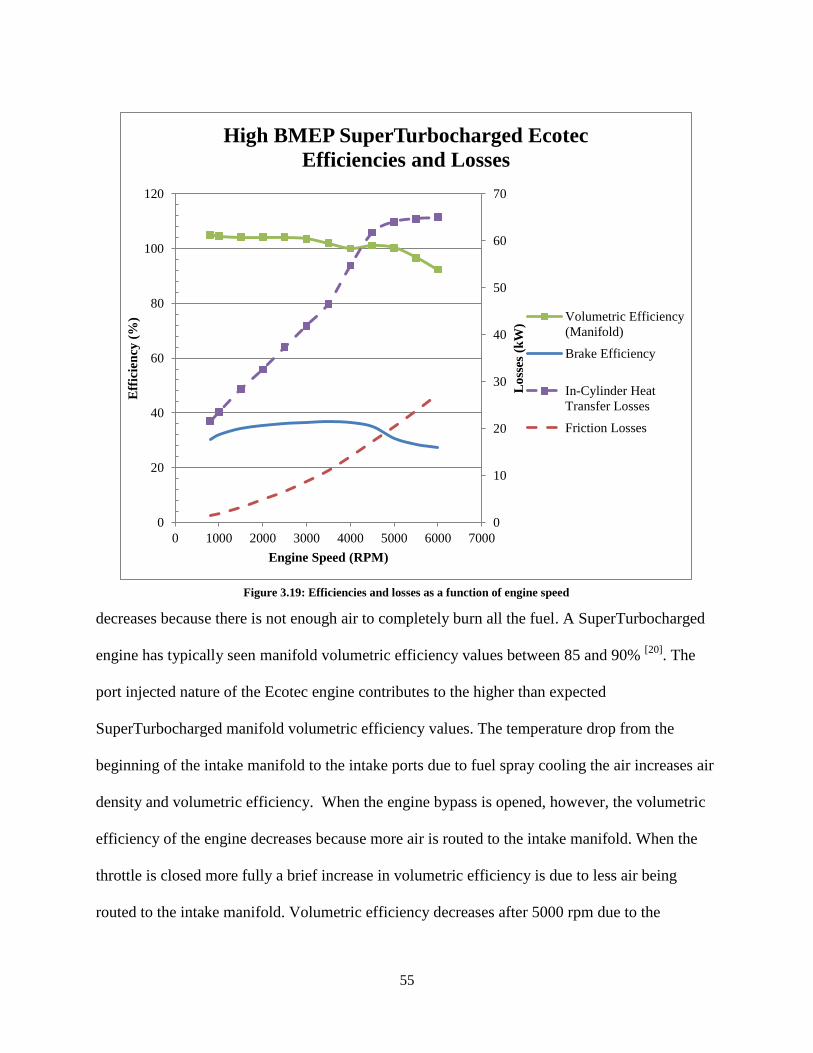
55
decreases because there is not enough air to completely burn all the fuel. A SuperTurbocharged
engine has typically seen manifold volumetric efficiency values between 85 and 90% [20]
. The
port injected nature of the Ecotec engine contributes to the higher than expected
SuperTurbocharged manifold volumetric efficiency values. The temperature drop from the
beginning of the intake manifold to the intake ports due to fuel spray cooling the air increases air
density and volumetric efficiency. When the engine bypass is opened, however, the volumetric
efficiency of the engine decreases because more air is routed to the intake manifold. When the
throttle is closed more fully a brief increase in volumetric efficiency is due to less air being
routed to the intake manifold. Volumetric efficiency decreases after 5000 rpm due to the
Figure 3.19: Efficiencies and losses as a function of engine speed
0
10
20
30
40
50
60
70
0
20
40
60
80
100
120
0 1000 2000 3000 4000 5000 6000 7000
Lo
sses
(k
W)
Eff
icie
ncy
(%
)
Engine Speed (RPM)
High BMEP SuperTurbocharged Ecotec
Efficiencies and Losses
Volumetric Efficiency
(Manifold)
Brake Efficiency
In-Cylinder Heat
Transfer Losses
Friction Losses
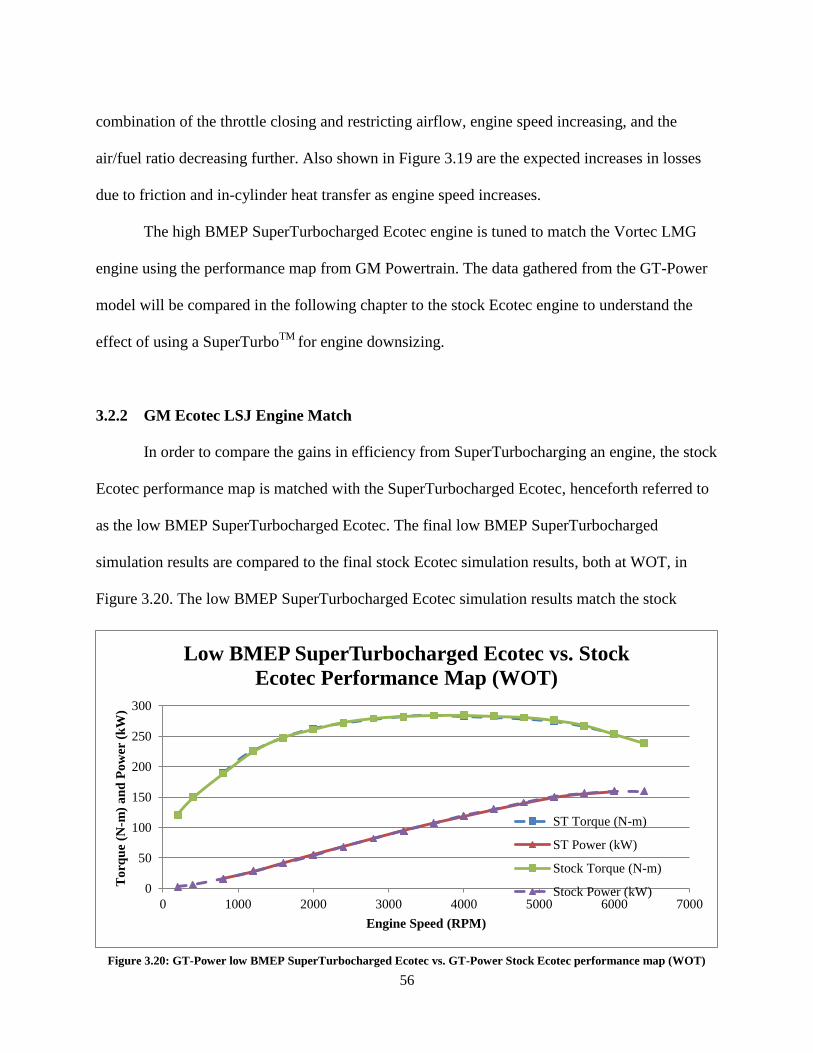
56
combination of the throttle closing and restricting airflow, engine speed increasing, and the
air/fuel ratio decreasing further. Also shown in Figure 3.19 are the expected increases in losses
due to friction and in-cylinder heat transfer as engine speed increases.
The high BMEP SuperTurbocharged Ecotec engine is tuned to match the Vortec LMG
engine using the performance map from GM Powertrain. The data gathered from the GT-Power
model will be compared in the following chapter to the stock Ecotec engine to understand the
effect of using a SuperTurboTM
for engine downsizing.
3.2.2 GM Ecotec LSJ Engine Match
In order to compare the gains in efficiency from SuperTurbocharging an engine, the stock
Ecotec performance map is matched with the SuperTurbocharged Ecotec, henceforth referred to
as the low BMEP SuperTurbocharged Ecotec. The final low BMEP SuperTurbocharged
simulation results are compared to the final stock Ecotec simulation results, both at WOT, in
Figure 3.20. The low BMEP SuperTurbocharged Ecotec simulation results match the stock
Figure 3.20: GT-Power low BMEP SuperTurbocharged Ecotec vs. GT-Power Stock Ecotec performance map (WOT)
0
50
100
150
200
250
300
0 1000 2000 3000 4000 5000 6000 7000
To
rqu
e (N
-m)
an
d P
ow
er (
kW
)
Engine Speed (RPM)
Low BMEP SuperTurbocharged Ecotec vs. Stock
Ecotec Performance Map (WOT)
ST Torque (N-m)
ST Power (kW)
Stock Torque (N-m)
Stock Power (kW)
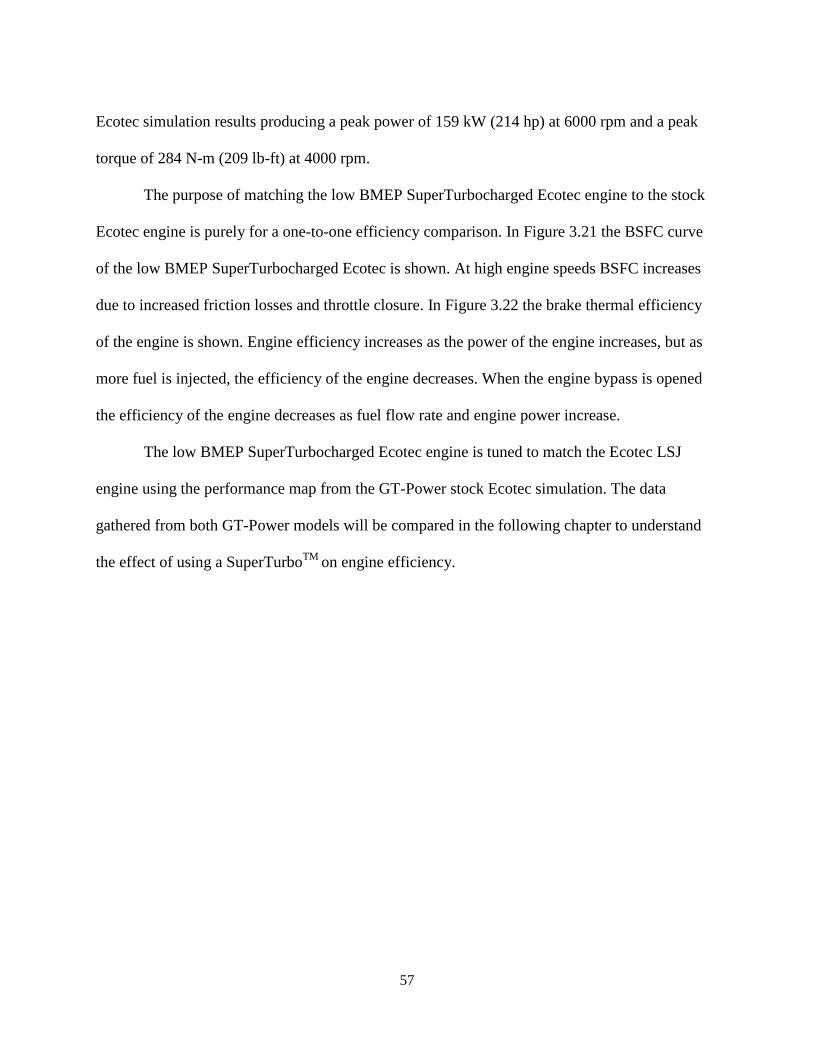
57
Ecotec simulation results producing a peak power of 159 kW (214 hp) at 6000 rpm and a peak
torque of 284 N-m (209 lb-ft) at 4000 rpm.
The purpose of matching the low BMEP SuperTurbocharged Ecotec engine to the stock
Ecotec engine is purely for a one-to-one efficiency comparison. In Figure 3.21 the BSFC curve
of the low BMEP SuperTurbocharged Ecotec is shown. At high engine speeds BSFC increases
due to increased friction losses and throttle closure. In Figure 3.22 the brake thermal efficiency
of the engine is shown. Engine efficiency increases as the power of the engine increases, but as
more fuel is injected, the efficiency of the engine decreases. When the engine bypass is opened
the efficiency of the engine decreases as fuel flow rate and engine power increase.
The low BMEP SuperTurbocharged Ecotec engine is tuned to match the Ecotec LSJ
engine using the performance map from the GT-Power stock Ecotec simulation. The data
gathered from both GT-Power models will be compared in the following chapter to understand
the effect of using a SuperTurboTM
on engine efficiency.
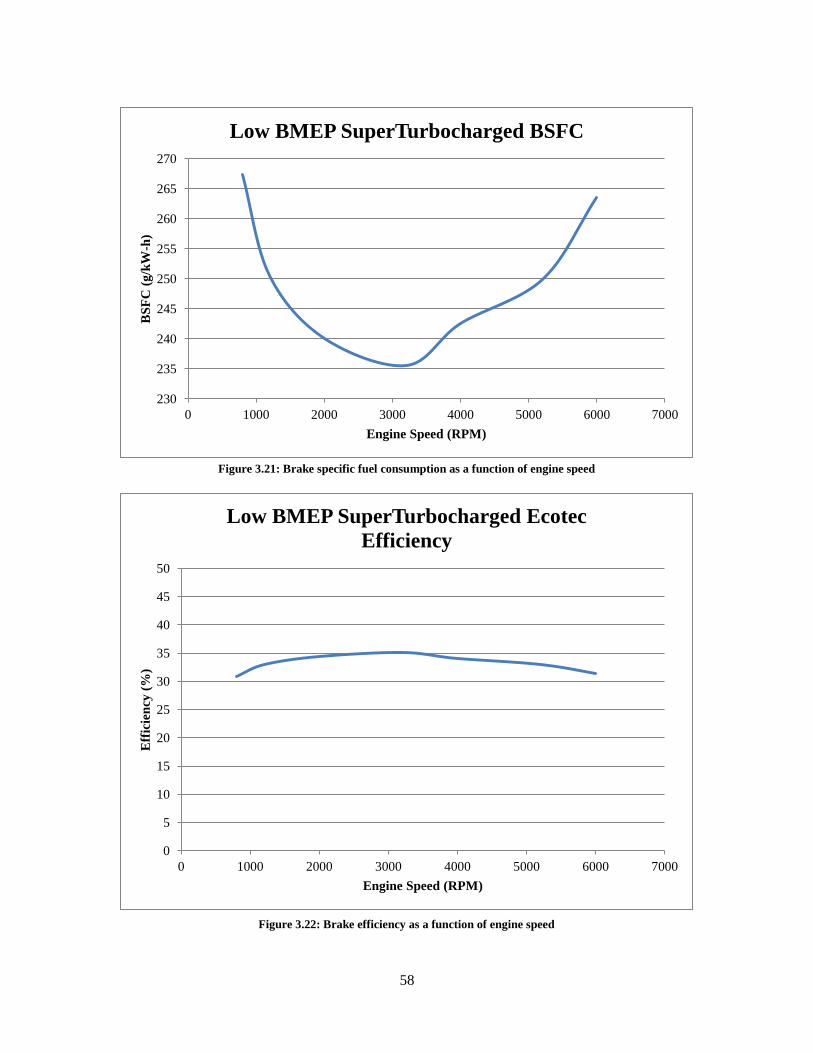
58
230
235
240
245
250
255
260
265
270
0 1000 2000 3000 4000 5000 6000 7000
BS
FC
(g
/kW
-h)
Engine Speed (RPM)
Low BMEP SuperTurbocharged BSFC
Figure 3.21: Brake specific fuel consumption as a function of engine speed
0
5
10
15
20
25
30
35
40
45
50
0 1000 2000 3000 4000 5000 6000 7000
Eff
icie
ncy
(%
)
Engine Speed (RPM)
Low BMEP SuperTurbocharged Ecotec
Efficiency
Figure 3.22: Brake efficiency as a function of engine speed
59
CHAPTER 4: THE EFFECTS OF SUPERTURBOCHARGING
4.1 GT-Power Engine Simulation Comparisons
The demand for boosting technology with the intent of engine downsizing is rising. An
integrated supercharger/turbocharger has the opportunity to emerge as a forerunner in the
advanced turbocharging market. In order to validate reported performance metrics of
SuperTurboTM
technology a stock Ecotec engine is compared to both a high and low BMEP
output SuperTurbocharged Ecotec engine. In the previous chapters GT-Power simulation results
were shown and discussed in order to validate the engine models that were generated. In the
following sections a comparison of engine efficiency and select indicative results are discussed.
4.1.1 High BMEP SuperTurbocharged Ecotec vs. Stock GM Ecotec LSJ
The high BMEP SuperTurbocharged Ecotec engine is compared to the stock Ecotec
engine in order to demonstrate the power boosting capabilities and efficiency gains of equipping
an engine with a SuperTurboTM
and to show its viability as technology used for engine
downsizing.
At low engine speeds the high BMEP SuperTurbocharged engine has slightly worse
BSFC values than the stock Ecotec engine, as illustrated in Figure 4.1. At low engine speeds the
SuperTurboTM
is operating as a supercharger and using power from the crankshaft in order to
spool the compressor. The supercharger on the stock Ecotec engine is also using power from the
crankshaft, but less of it at low engine speeds as shown in Figure 4.2. The supercharger on the
stock Ecotec engine continues to utilize more crankshaft power as engine speeds increase and
contributes to the increase in BSFC through friction losses. Conversely, the high BMEP
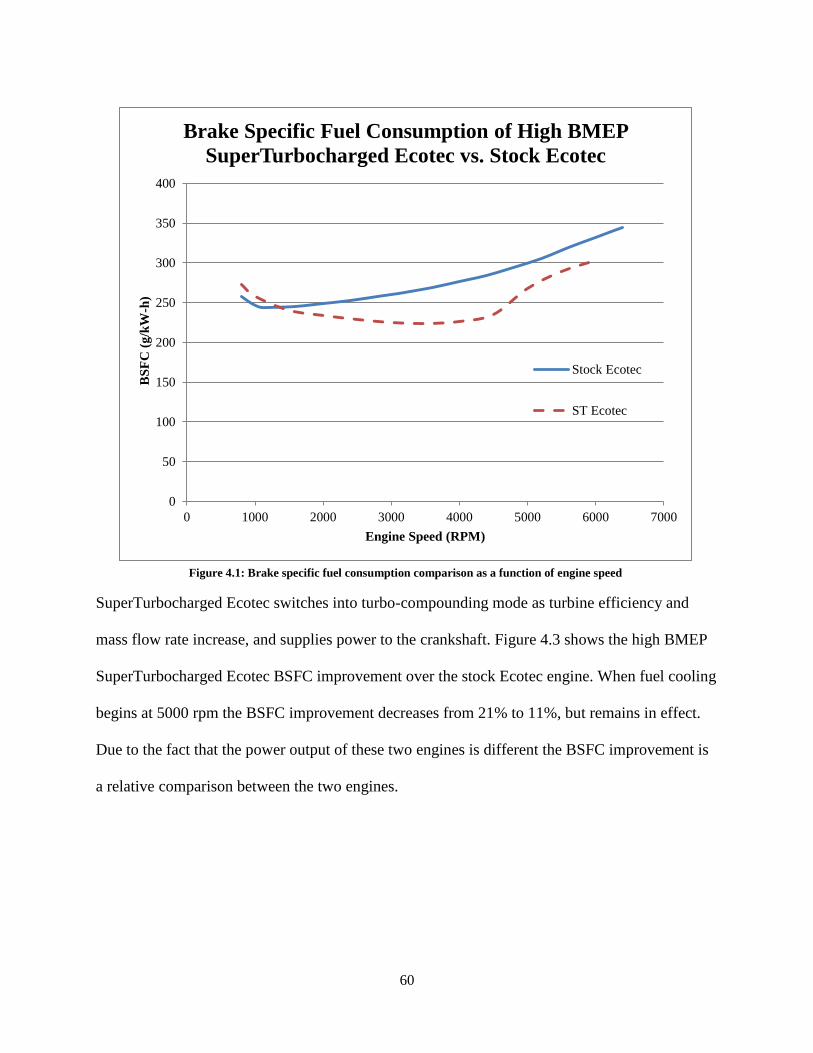
60
SuperTurbocharged Ecotec switches into turbo-compounding mode as turbine efficiency and
mass flow rate increase, and supplies power to the crankshaft. Figure 4.3 shows the high BMEP
SuperTurbocharged Ecotec BSFC improvement over the stock Ecotec engine. When fuel cooling
begins at 5000 rpm the BSFC improvement decreases from 21% to 11%, but remains in effect.
Due to the fact that the power output of these two engines is different the BSFC improvement is
a relative comparison between the two engines.
0
50
100
150
200
250
300
350
400
0 1000 2000 3000 4000 5000 6000 7000
BS
FC
(g
/kW
-h)
Engine Speed (RPM)
Brake Specific Fuel Consumption of High BMEP
SuperTurbocharged Ecotec vs. Stock Ecotec
Stock Ecotec
ST Ecotec
Figure 4.1: Brake specific fuel consumption comparison as a function of engine speed
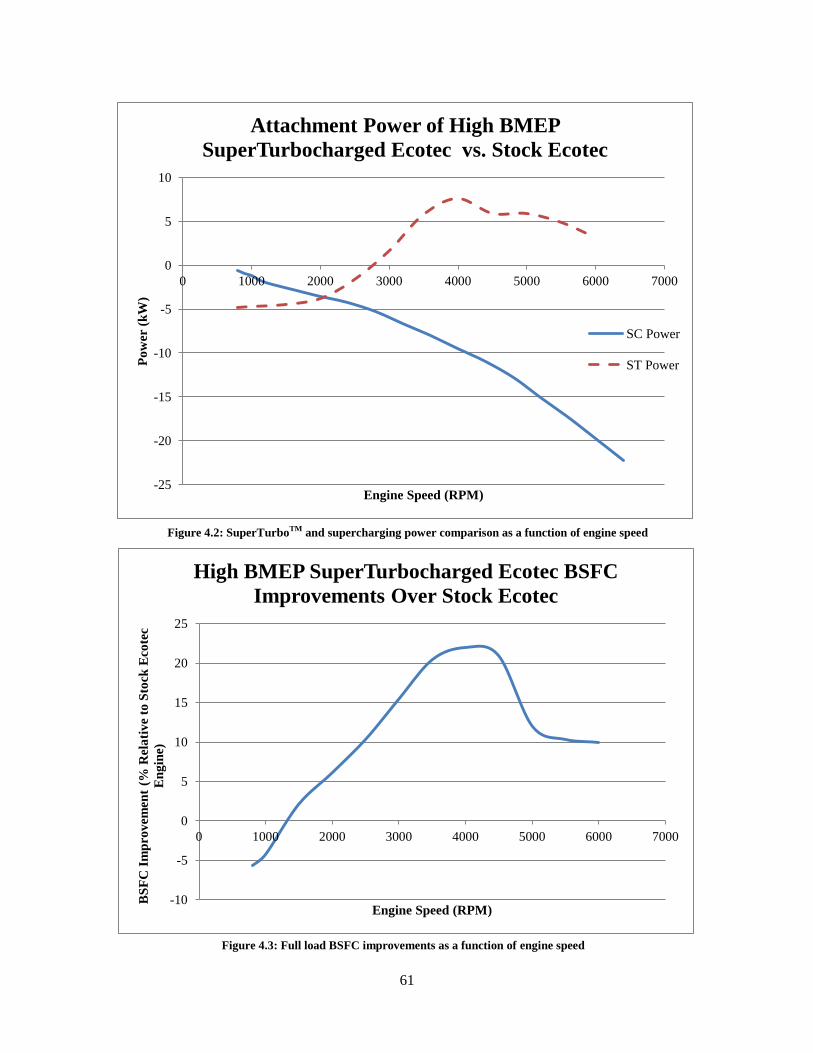
61
-25
-20
-15
-10
-5
0
5
10
0 1000 2000 3000 4000 5000 6000 7000
Po
wer
(k
W)
Engine Speed (RPM)
Attachment Power of High BMEP
SuperTurbocharged Ecotec vs. Stock Ecotec
SC Power
ST Power
Figure 4.2: SuperTurboTM and supercharging power comparison as a function of engine speed
-10
-5
0
5
10
15
20
25
0 1000 2000 3000 4000 5000 6000 7000
BS
FC
Im
pro
vem
ent
(% R
ela
tiv
e to
Sto
ck E
cote
c
En
gin
e)
Engine Speed (RPM)
High BMEP SuperTurbocharged Ecotec BSFC
Improvements Over Stock Ecotec
Figure 4.3: Full load BSFC improvements as a function of engine speed
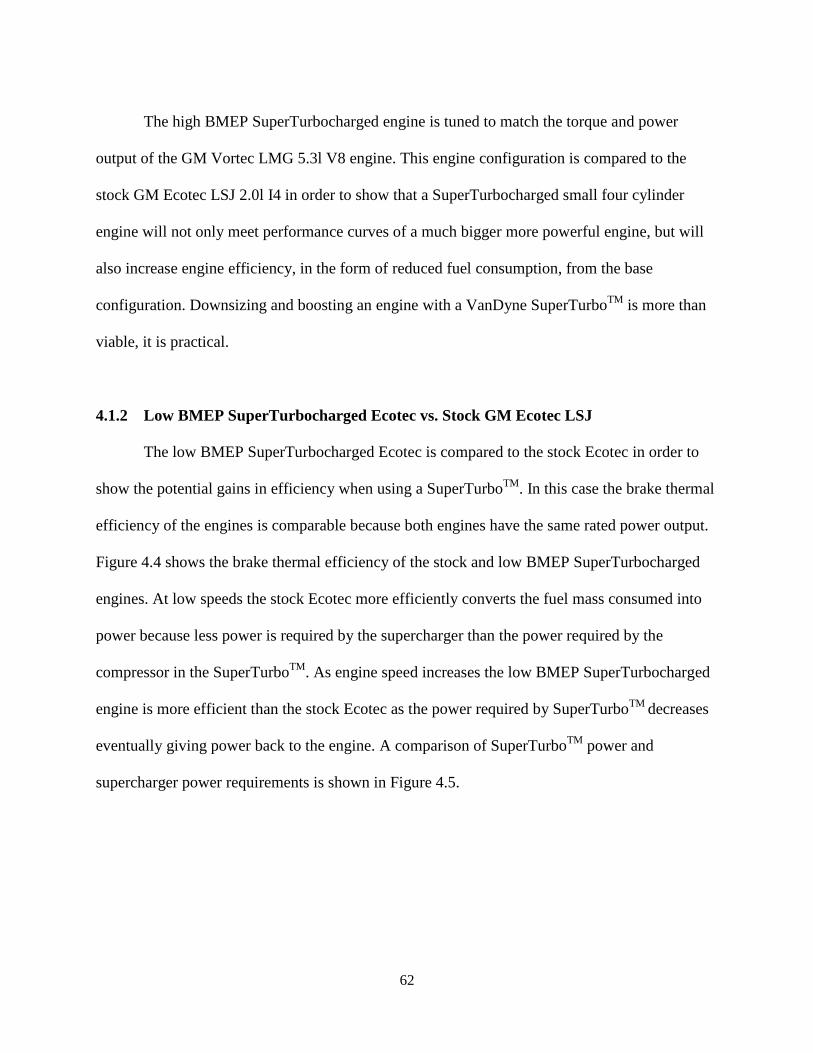
62
The high BMEP SuperTurbocharged engine is tuned to match the torque and power
output of the GM Vortec LMG 5.3l V8 engine. This engine configuration is compared to the
stock GM Ecotec LSJ 2.0l I4 in order to show that a SuperTurbocharged small four cylinder
engine will not only meet performance curves of a much bigger more powerful engine, but will
also increase engine efficiency, in the form of reduced fuel consumption, from the base
configuration. Downsizing and boosting an engine with a VanDyne SuperTurboTM
is more than
viable, it is practical.
4.1.2 Low BMEP SuperTurbocharged Ecotec vs. Stock GM Ecotec LSJ
The low BMEP SuperTurbocharged Ecotec is compared to the stock Ecotec in order to
show the potential gains in efficiency when using a SuperTurboTM
. In this case the brake thermal
efficiency of the engines is comparable because both engines have the same rated power output.
Figure 4.4 shows the brake thermal efficiency of the stock and low BMEP SuperTurbocharged
engines. At low speeds the stock Ecotec more efficiently converts the fuel mass consumed into
power because less power is required by the supercharger than the power required by the
compressor in the SuperTurboTM
. As engine speed increases the low BMEP SuperTurbocharged
engine is more efficient than the stock Ecotec as the power required by SuperTurboTM
decreases
eventually giving power back to the engine. A comparison of SuperTurboTM
power and
supercharger power requirements is shown in Figure 4.5.
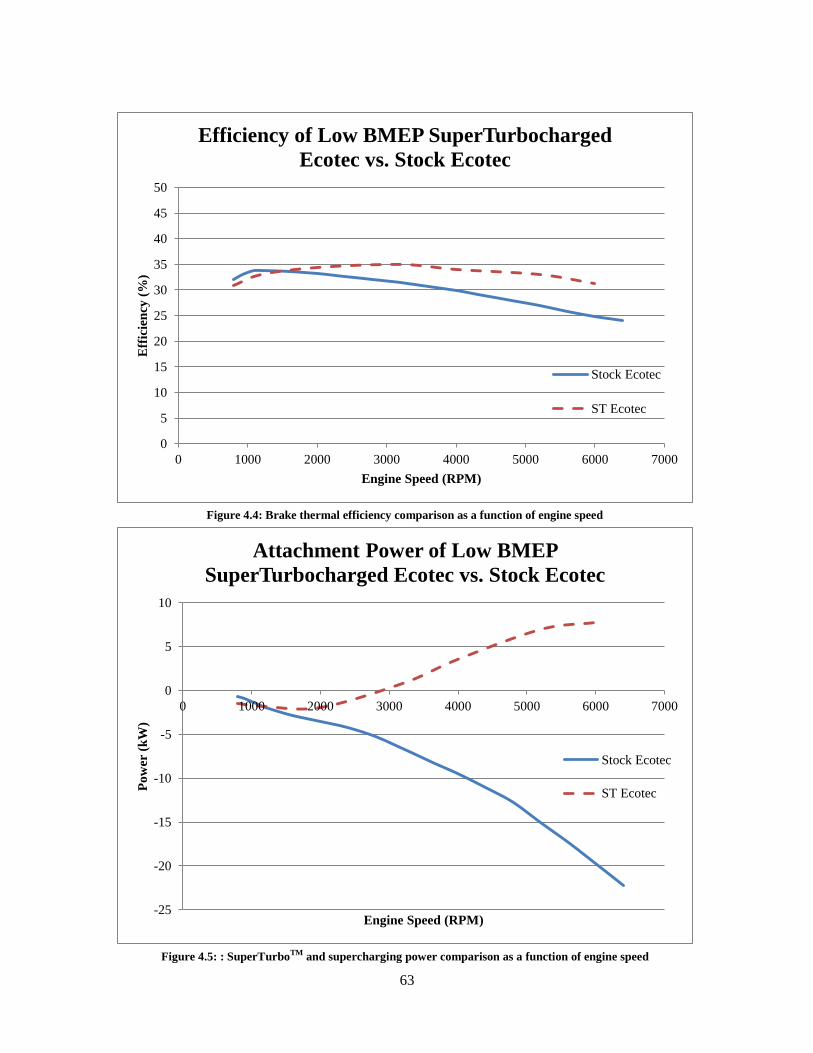
63
0
5
10
15
20
25
30
35
40
45
50
0 1000 2000 3000 4000 5000 6000 7000
Eff
icie
ncy
(%
)
Engine Speed (RPM)
Efficiency of Low BMEP SuperTurbocharged
Ecotec vs. Stock Ecotec
Stock Ecotec
ST Ecotec
Figure 4.4: Brake thermal efficiency comparison as a function of engine speed
-25
-20
-15
-10
-5
0
5
10
0 1000 2000 3000 4000 5000 6000 7000
Po
wer
(k
W)
Engine Speed (RPM)
Attachment Power of Low BMEP
SuperTurbocharged Ecotec vs. Stock Ecotec
Stock Ecotec
ST Ecotec
Figure 4.5: : SuperTurboTM and supercharging power comparison as a function of engine speed
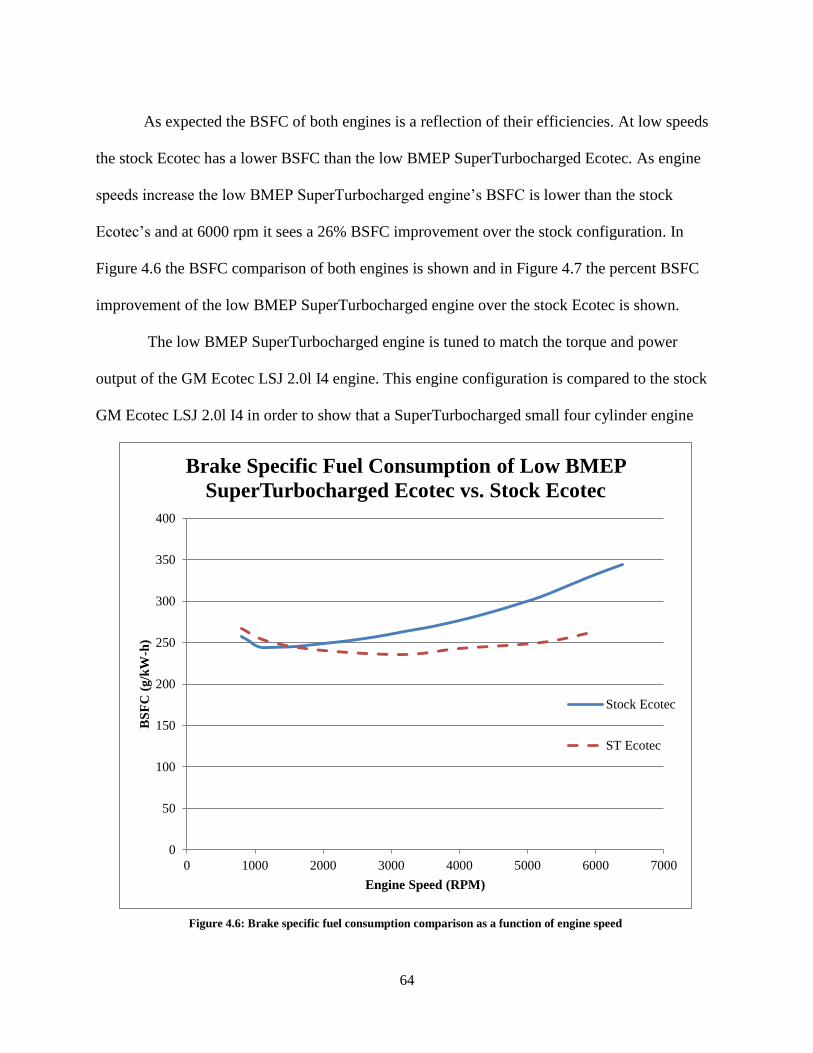
64
As expected the BSFC of both engines is a reflection of their efficiencies. At low speeds
the stock Ecotec has a lower BSFC than the low BMEP SuperTurbocharged Ecotec. As engine
speeds increase the low BMEP SuperTurbocharged engine’s BSFC is lower than the stock
Ecotec’s and at 6000 rpm it sees a 26% BSFC improvement over the stock configuration. In
Figure 4.6 the BSFC comparison of both engines is shown and in Figure 4.7 the percent BSFC
improvement of the low BMEP SuperTurbocharged engine over the stock Ecotec is shown.
The low BMEP SuperTurbocharged engine is tuned to match the torque and power
output of the GM Ecotec LSJ 2.0l I4 engine. This engine configuration is compared to the stock
GM Ecotec LSJ 2.0l I4 in order to show that a SuperTurbocharged small four cylinder engine
0
50
100
150
200
250
300
350
400
0 1000 2000 3000 4000 5000 6000 7000
BS
FC
(g
/kW
-h)
Engine Speed (RPM)
Brake Specific Fuel Consumption of Low BMEP
SuperTurbocharged Ecotec vs. Stock Ecotec
Stock Ecotec
ST Ecotec
Figure 4.6: Brake specific fuel consumption comparison as a function of engine speed
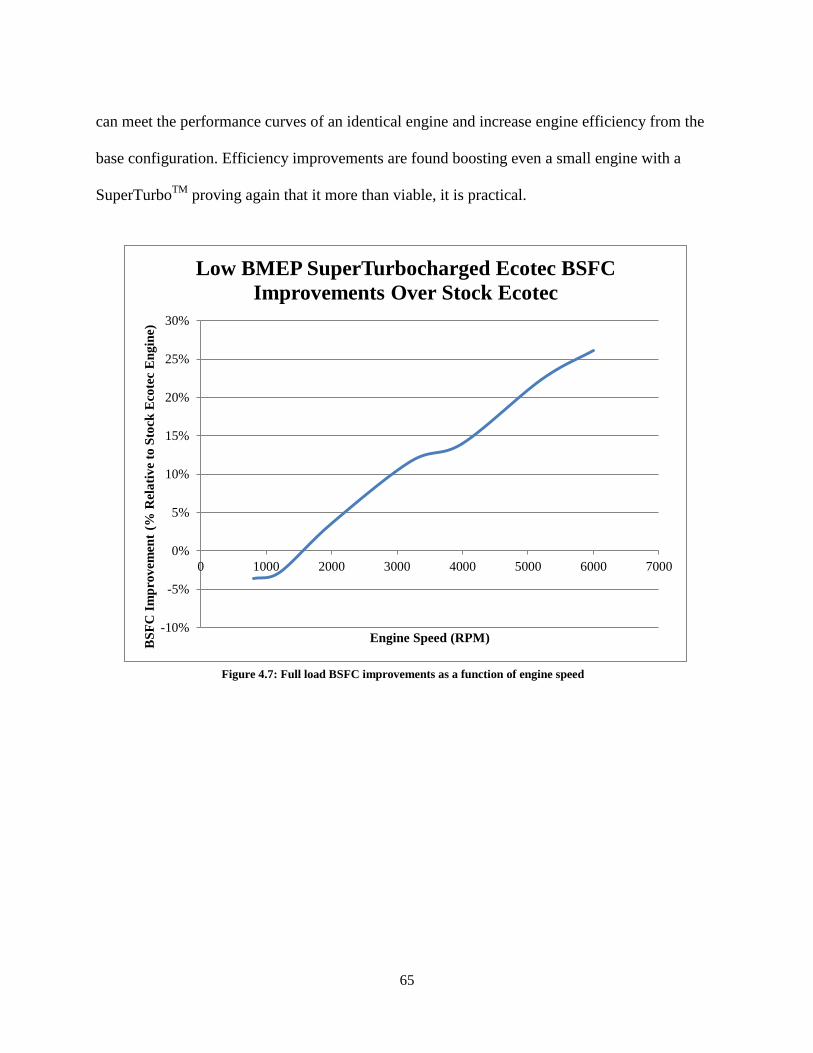
65
can meet the performance curves of an identical engine and increase engine efficiency from the
base configuration. Efficiency improvements are found boosting even a small engine with a
SuperTurboTM
proving again that it more than viable, it is practical.
-10%
-5%
0%
5%
10%
15%
20%
25%
30%
0 1000 2000 3000 4000 5000 6000 7000
BS
FC
Im
pro
vem
ent
(% R
ela
tiv
e to
Sto
ck E
cote
c E
ng
ine)
Engine Speed (RPM)
Low BMEP SuperTurbocharged Ecotec BSFC
Improvements Over Stock Ecotec
Figure 4.7: Full load BSFC improvements as a function of engine speed
66
CHAPTER 5: CONCLUSION
5.1 Summary and Conclusions
A GM Ecotec LSJ 2.0l I4 engine and a SuperTurbocharged GM Ecotec LSJ 2.0l I4
engine were modeled using GT-Power. Two configurations of SuperTurbocharged engine
models were simulated to validate reported SuperTurboTM
performance, to predict improvements
in BSFC over the stock engine configuration, and to show the value of SuperTurbocharging an
engine. At low engine speeds the SuperTurboTM
acted as a supercharger taking power from the
crankshaft in order to power the compressor to boost the engine. At mid-engine speeds when the
amount of power collected by the turbine exceeded the power requirement of the compressor, the
SuperTurboTM
began acting as a turbo-compounder, giving power back to the engine.
The claims that were made in regards to the SuperTurboTM
improving engine efficiency
up to 20% [5]
were validated through the research performed. The high BMEP
SuperTurbocharged Ecotec saw BSFC improvements up to 21% at 4500 rpm and the low BMEP
SuperTurbocharged Ecotec saw BSFC improvements up to 26% at 6000 rpm. At lower engine
speeds the high and low SuperTurbocharged Ecotec models saw BSFC improvements between 5
and 20%.
Additionally, through many simulations and model tuning, it was identified on the high
BMEP SuperTurbocharged Ecotec that the engine bypass should begin opening at 3000 rpm, the
throttle should begin closing at 4000 rpm, and fuel cooling begun at
5000 rpm. On the low BMEP SuperTurbocharged Ecotec it was identified that the bypass should
begin opening at 4000 rpm and the throttle should begin closing at 5200 rpm.
The SuperTurboTM
is an answer to the call for innovative new engine technology and is
sustainable and necessary for use in engine downsizing.
67
5.2 Recommendations for Future Work
At the conclusion of research the following recommendations for future work are made:
Additional engine data for tuning and validation would improve accuracy of the engine
models.
A finely tuned intake for the SuperTurbocharged Ecotec could improve BSFC values.
More speed points modeled for the low BMEP SuperTurbocharged Ecotec would give a
better idea of when the bypass and throttle controls needed to be engaged.
With more time it would have been of interest to model pure air cooling versus pure fuel
cooling at all engine speeds to see what effect this would have on BSFC.
An experimental validation of modeling results.
68
REFERENCES
[1] Halmann, Martin M., and Meyer Steinberg. Greenhouse Gas Carbon Dioxide Mitigation:
Science and Technology. CRC Press, 1999.
[2] U.S. EPA Office of Atmospheric Programs. “Inventory of U.S. Greenhouse Gas Emissions
and Sinks: 1990-2009” 2011 U.S. Greenhouse Gas Inventory Report, April 2011.
http://www.epa.gov/climatechange/emissions/usinventoryreport.html.
[3] National Highway Traffic Safety Administration. “Notice of Proposed Rulemaking for Fuel
Economy and Greenhouse Gas Emissions Regulations for Model Year 2017-2025 Light-duty
Vehicles.” Federal Register 76, no. 231 (December 1, 2011).
[4] European Parliament and the Council of the European Union. “Regulation (EC) No 443/2009
of the European Parliament and of the Council of 23 April 2009 Setting Emission Performance
Standards for New Passenger Cars as Part of the Community’s Integrated Approach to Reduce
CO2 Emissions From Light-duty Vehicles.” Official Journal of the European Union (June 5,
2009).
[5] Chadwell, Christopher, and Mark Walls. “Analysis of a SuperTurbocharged Downsized
Engine Using 1-D CFD Simulation.” SAE 2010-01-1231 (April 12, 2010).
[6] Hiereth, Hermann, and P. H. W Prenninger. Charging the Internal Combustion Engine.
Powertrain. Wien: Springer, 2007.
[7] Heywood, John B. Internal Combustion Engine Fundamentals. McGraw-Hill, Inc, 1988.
[8] Pulkrabek, Willard. Engineering Fundamentals of the Internal Combustion Engine. Prentice-
Hall, Inc., 1997.
[9] Huang, Yuan Mao, and Ching-Shin Shiau. “Optimal Tolerance Allocation for a Sliding Vane
Compressor.” Journal of Mechanical Design 128, no. 1 (2006): 98–107.
[10] Lee, Chang, Ki Lee, Dong Whang, Seo Choi, and Haeng Cho. “Supercharging Performance
of a Gasoline Engine with a Supercharger.” Journal of Mechanical Science and Technology 11,
no. 5 (1997): 556–564.
[11] Uthoff, Loren, and John Yakimow. “Supercharger Versus Turbocharger in Vehicle
Applications.” SAE Technical Paper (1987).
[12] Watson, N., and M. S. Janota. Turbocharging the Internal Combustion Engine. John Wiley
& Sons, Inc., 1982.
[13] Singer, D A. “Comparison of a Supercharger vs. a Turbocharger in a Small Displacement
Gasoline Engine Application.” SAE Technical Paper Series (1985).
69
[14] Andersson, J., Bengtsson, A., and Eriksson, S., "The Turbocharged and Intercooled 2.3 Liter
Engine for the Volvo 760," SAE Technical Paper 840253, 1984, doi:10.4271/840253
[15] VanDyne, Edward A., and Michael B. Riley. “An Advanced Turbocharging System for
Improved Fuel Efficiency.” ASME Conference Proceedings 2007, no. 48116 (2007): 21–28.
[16] GT-Power User’s Manual and Tutorial.: Gamma Technologies. Vol. V7.1
[17] Navratil J., M. Polasek, O. Vitek, J. Macek, P. Baumruk. “Simulation of Supercharged and
Turbocharged Small Spark-ignition Engine.” Journal of Middle European Construction and
Designing of Cars 2003, pp. 27–33.
[18] GM Performance Division. “Ecotec 2.0L LSJ POWER: Get the Most from the Ecotec 2.0L
Inline 4-Cylinder LSJ Engine.” 2006.
[19] GM Powertrain. www.gmpowertrain.com/VehicleEngines/PowertrainProducts.aspx
[20] Brown, Jared. Mechanical Engineer at VanDyne SuperTurboTM
Inc. Personal
Communication. 28 June 2012.
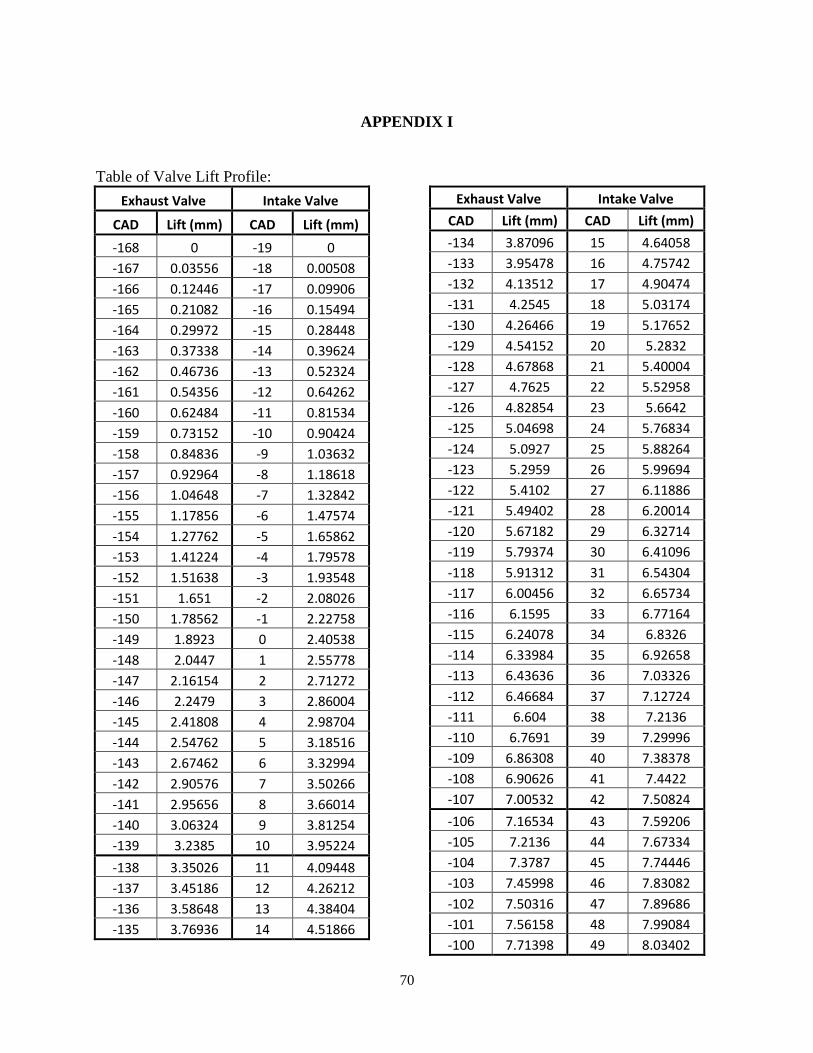
70
APPENDIX I
Table of Valve Lift Profile:
Exhaust Valve Intake Valve
CAD Lift (mm) CAD Lift (mm)
-168 0 -19 0
-167 0.03556 -18 0.00508
-166 0.12446 -17 0.09906
-165 0.21082 -16 0.15494
-164 0.29972 -15 0.28448
-163 0.37338 -14 0.39624
-162 0.46736 -13 0.52324
-161 0.54356 -12 0.64262
-160 0.62484 -11 0.81534
-159 0.73152 -10 0.90424
-158 0.84836 -9 1.03632
-157 0.92964 -8 1.18618
-156 1.04648 -7 1.32842
-155 1.17856 -6 1.47574
-154 1.27762 -5 1.65862
-153 1.41224 -4 1.79578
-152 1.51638 -3 1.93548
-151 1.651 -2 2.08026
-150 1.78562 -1 2.22758
-149 1.8923 0 2.40538
-148 2.0447 1 2.55778
-147 2.16154 2 2.71272
-146 2.2479 3 2.86004
-145 2.41808 4 2.98704
-144 2.54762 5 3.18516
-143 2.67462 6 3.32994
-142 2.90576 7 3.50266
-141 2.95656 8 3.66014
-140 3.06324 9 3.81254
-139 3.2385 10 3.95224
-138 3.35026 11 4.09448
-137 3.45186 12 4.26212
-136 3.58648 13 4.38404
-135 3.76936 14 4.51866
Exhaust Valve Intake Valve
CAD Lift (mm) CAD Lift (mm)
-134 3.87096 15 4.64058
-133 3.95478 16 4.75742
-132 4.13512 17 4.90474
-131 4.2545 18 5.03174
-130 4.26466 19 5.17652
-129 4.54152 20 5.2832
-128 4.67868 21 5.40004
-127 4.7625 22 5.52958
-126 4.82854 23 5.6642
-125 5.04698 24 5.76834
-124 5.0927 25 5.88264
-123 5.2959 26 5.99694
-122 5.4102 27 6.11886
-121 5.49402 28 6.20014
-120 5.67182 29 6.32714
-119 5.79374 30 6.41096
-118 5.91312 31 6.54304
-117 6.00456 32 6.65734
-116 6.1595 33 6.77164
-115 6.24078 34 6.8326
-114 6.33984 35 6.92658
-113 6.43636 36 7.03326
-112 6.46684 37 7.12724
-111 6.604 38 7.2136
-110 6.7691 39 7.29996
-109 6.86308 40 7.38378
-108 6.90626 41 7.4422
-107 7.00532 42 7.50824
-106 7.16534 43 7.59206
-105 7.2136 44 7.67334
-104 7.3787 45 7.74446
-103 7.45998 46 7.83082
-102 7.50316 47 7.89686
-101 7.56158 48 7.99084
-100 7.71398 49 8.03402
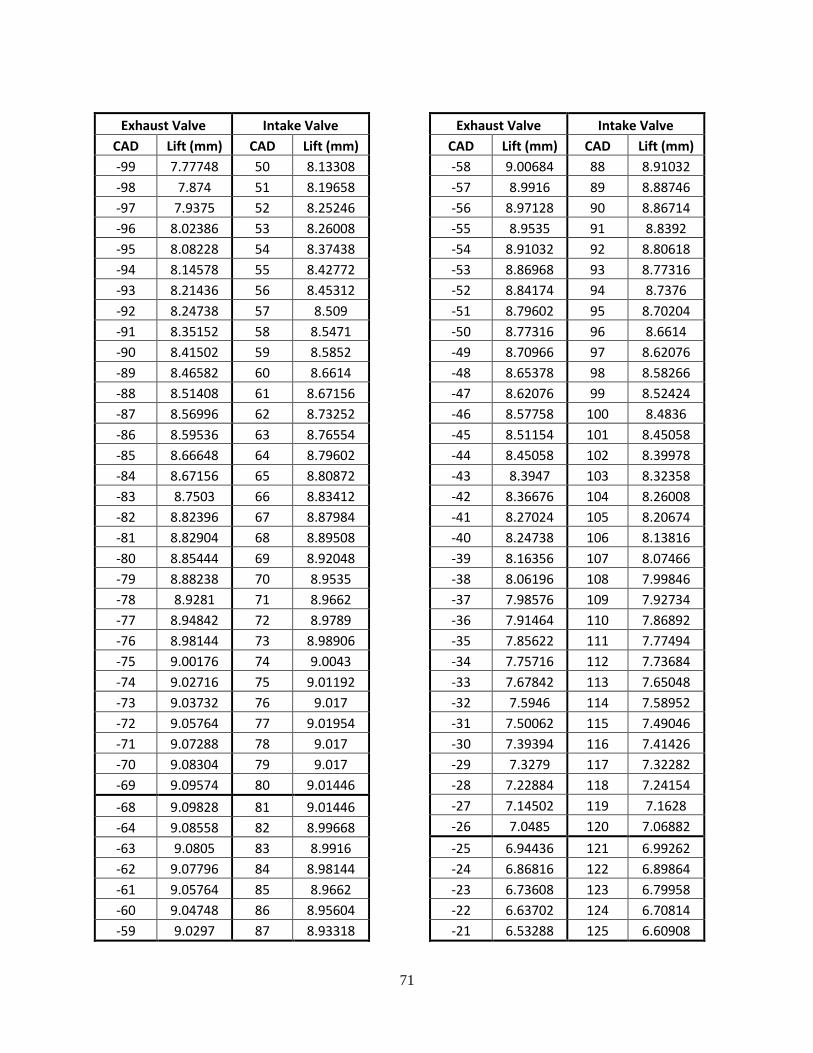
71
Exhaust Valve Intake Valve
CAD Lift (mm) CAD Lift (mm)
-99 7.77748 50 8.13308
-98 7.874 51 8.19658
-97 7.9375 52 8.25246
-96 8.02386 53 8.26008
-95 8.08228 54 8.37438
-94 8.14578 55 8.42772
-93 8.21436 56 8.45312
-92 8.24738 57 8.509
-91 8.35152 58 8.5471
-90 8.41502 59 8.5852
-89 8.46582 60 8.6614
-88 8.51408 61 8.67156
-87 8.56996 62 8.73252
-86 8.59536 63 8.76554
-85 8.66648 64 8.79602
-84 8.67156 65 8.80872
-83 8.7503 66 8.83412
-82 8.82396 67 8.87984
-81 8.82904 68 8.89508
-80 8.85444 69 8.92048
-79 8.88238 70 8.9535
-78 8.9281 71 8.9662
-77 8.94842 72 8.9789
-76 8.98144 73 8.98906
-75 9.00176 74 9.0043
-74 9.02716 75 9.01192
-73 9.03732 76 9.017
-72 9.05764 77 9.01954
-71 9.07288 78 9.017
-70 9.08304 79 9.017
-69 9.09574 80 9.01446
-68 9.09828 81 9.01446
-64 9.08558 82 8.99668
-63 9.0805 83 8.9916
-62 9.07796 84 8.98144
-61 9.05764 85 8.9662
-60 9.04748 86 8.95604
-59 9.0297 87 8.93318
Exhaust Valve Intake Valve
CAD Lift (mm) CAD Lift (mm)
-58 9.00684 88 8.91032
-57 8.9916 89 8.88746
-56 8.97128 90 8.86714
-55 8.9535 91 8.8392
-54 8.91032 92 8.80618
-53 8.86968 93 8.77316
-52 8.84174 94 8.7376
-51 8.79602 95 8.70204
-50 8.77316 96 8.6614
-49 8.70966 97 8.62076
-48 8.65378 98 8.58266
-47 8.62076 99 8.52424
-46 8.57758 100 8.4836
-45 8.51154 101 8.45058
-44 8.45058 102 8.39978
-43 8.3947 103 8.32358
-42 8.36676 104 8.26008
-41 8.27024 105 8.20674
-40 8.24738 106 8.13816
-39 8.16356 107 8.07466
-38 8.06196 108 7.99846
-37 7.98576 109 7.92734
-36 7.91464 110 7.86892
-35 7.85622 111 7.77494
-34 7.75716 112 7.73684
-33 7.67842 113 7.65048
-32 7.5946 114 7.58952
-31 7.50062 115 7.49046
-30 7.39394 116 7.41426
-29 7.3279 117 7.32282
-28 7.22884 118 7.24154
-27 7.14502 119 7.1628
-26 7.0485 120 7.06882
-25 6.94436 121 6.99262
-24 6.86816 122 6.89864
-23 6.73608 123 6.79958
-22 6.63702 124 6.70814
-21 6.53288 125 6.60908
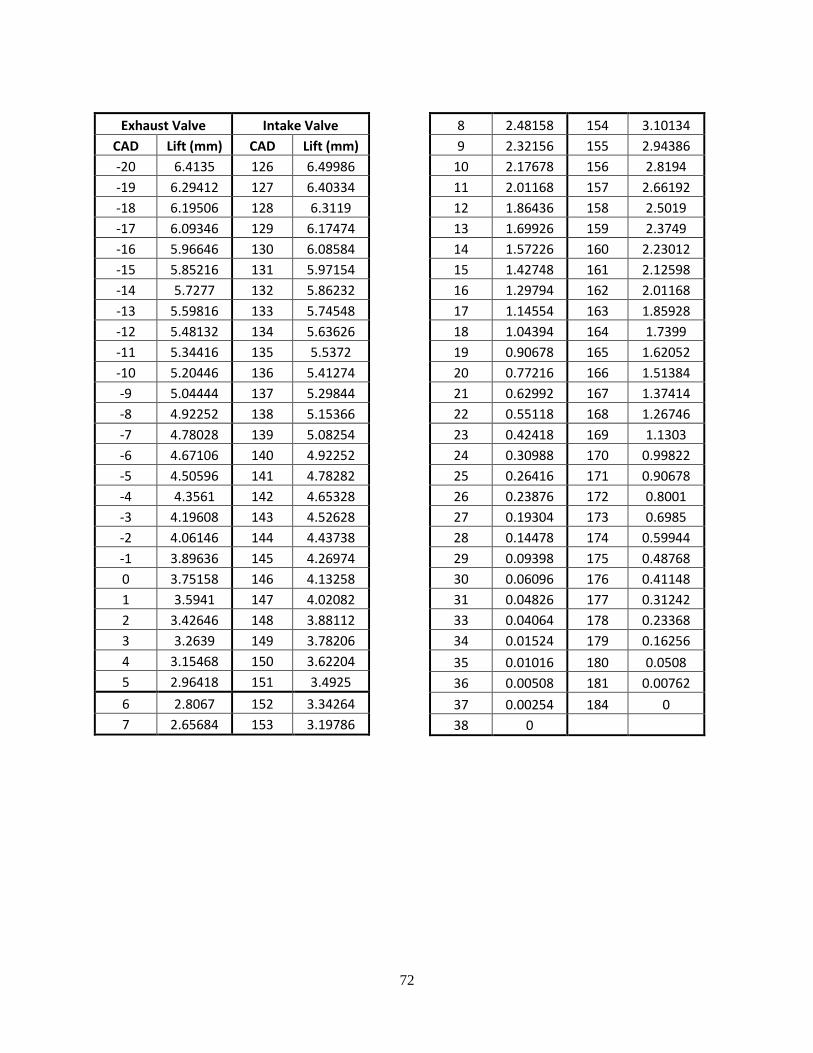
72
Exhaust Valve Intake Valve
CAD Lift (mm) CAD Lift (mm)
-20 6.4135 126 6.49986
-19 6.29412 127 6.40334
-18 6.19506 128 6.3119
-17 6.09346 129 6.17474
-16 5.96646 130 6.08584
-15 5.85216 131 5.97154
-14 5.7277 132 5.86232
-13 5.59816 133 5.74548
-12 5.48132 134 5.63626
-11 5.34416 135 5.5372
-10 5.20446 136 5.41274
-9 5.04444 137 5.29844
-8 4.92252 138 5.15366
-7 4.78028 139 5.08254
-6 4.67106 140 4.92252
-5 4.50596 141 4.78282
-4 4.3561 142 4.65328
-3 4.19608 143 4.52628
-2 4.06146 144 4.43738
-1 3.89636 145 4.26974
0 3.75158 146 4.13258
1 3.5941 147 4.02082
2 3.42646 148 3.88112
3 3.2639 149 3.78206
4 3.15468 150 3.62204
5 2.96418 151 3.4925
6 2.8067 152 3.34264
7 2.65684 153 3.19786
8 2.48158 154 3.10134
9 2.32156 155 2.94386
10 2.17678 156 2.8194
11 2.01168 157 2.66192
12 1.86436 158 2.5019
13 1.69926 159 2.3749
14 1.57226 160 2.23012
15 1.42748 161 2.12598
16 1.29794 162 2.01168
17 1.14554 163 1.85928
18 1.04394 164 1.7399
19 0.90678 165 1.62052
20 0.77216 166 1.51384
21 0.62992 167 1.37414
22 0.55118 168 1.26746
23 0.42418 169 1.1303
24 0.30988 170 0.99822
25 0.26416 171 0.90678
26 0.23876 172 0.8001
27 0.19304 173 0.6985
28 0.14478 174 0.59944
29 0.09398 175 0.48768
30 0.06096 176 0.41148
31 0.04826 177 0.31242
33 0.04064 178 0.23368
34 0.01524 179 0.16256
35 0.01016 180 0.0508
36 0.00508 181 0.00762
37 0.00254 184 0
38 0
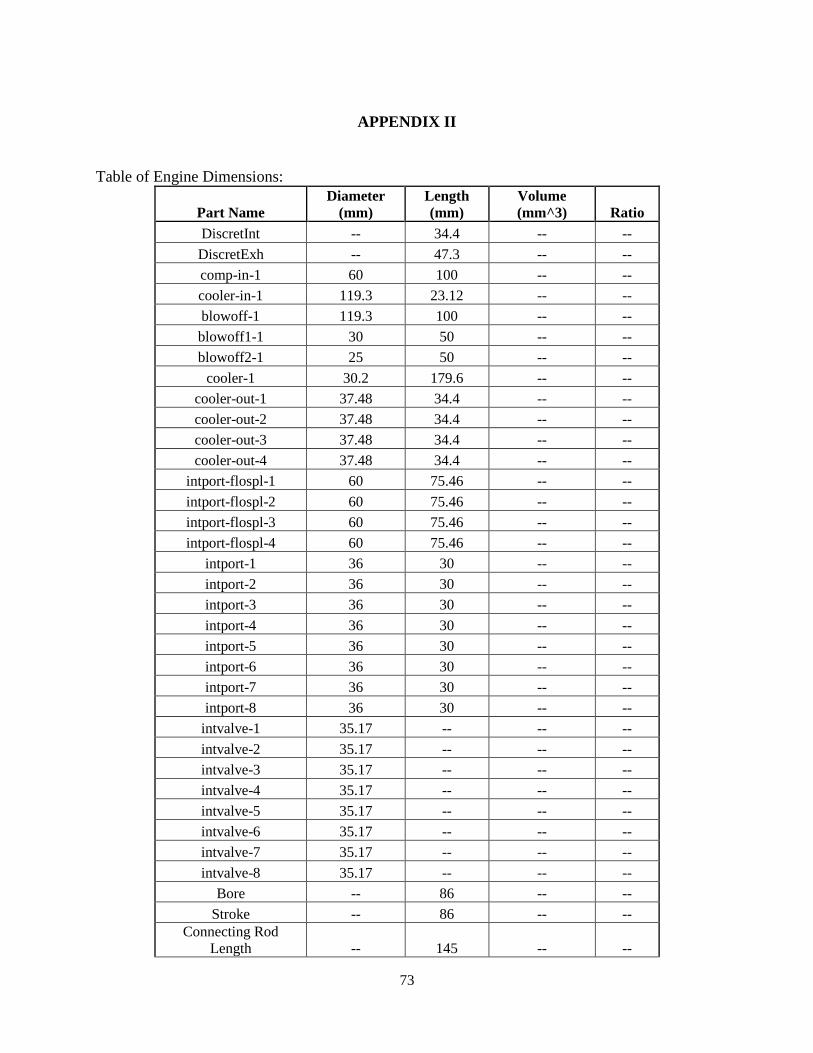
73
APPENDIX II
Table of Engine Dimensions:
Part Name
Diameter
(mm)
Length
(mm)
Volume
(mm^3) Ratio
DiscretInt -- 34.4 -- --
DiscretExh -- 47.3 -- --
comp-in-1 60 100 -- --
cooler-in-1 119.3 23.12 -- --
blowoff-1 119.3 100 -- --
blowoff1-1 30 50 -- --
blowoff2-1 25 50 -- --
cooler-1 30.2 179.6 -- --
cooler-out-1 37.48 34.4 -- --
cooler-out-2 37.48 34.4 -- --
cooler-out-3 37.48 34.4 -- --
cooler-out-4 37.48 34.4 -- --
intport-flospl-1 60 75.46 -- --
intport-flospl-2 60 75.46 -- --
intport-flospl-3 60 75.46 -- --
intport-flospl-4 60 75.46 -- --
intport-1 36 30 -- --
intport-2 36 30 -- --
intport-3 36 30 -- --
intport-4 36 30 -- --
intport-5 36 30 -- --
intport-6 36 30 -- --
intport-7 36 30 -- --
intport-8 36 30 -- --
intvalve-1 35.17 -- -- --
intvalve-2 35.17 -- -- --
intvalve-3 35.17 -- -- --
intvalve-4 35.17 -- -- --
intvalve-5 35.17 -- -- --
intvalve-6 35.17 -- -- --
intvalve-7 35.17 -- -- --
intvalve-8 35.17 -- -- --
Bore -- 86 -- --
Stroke -- 86 -- --
Connecting Rod
Length -- 145 -- --
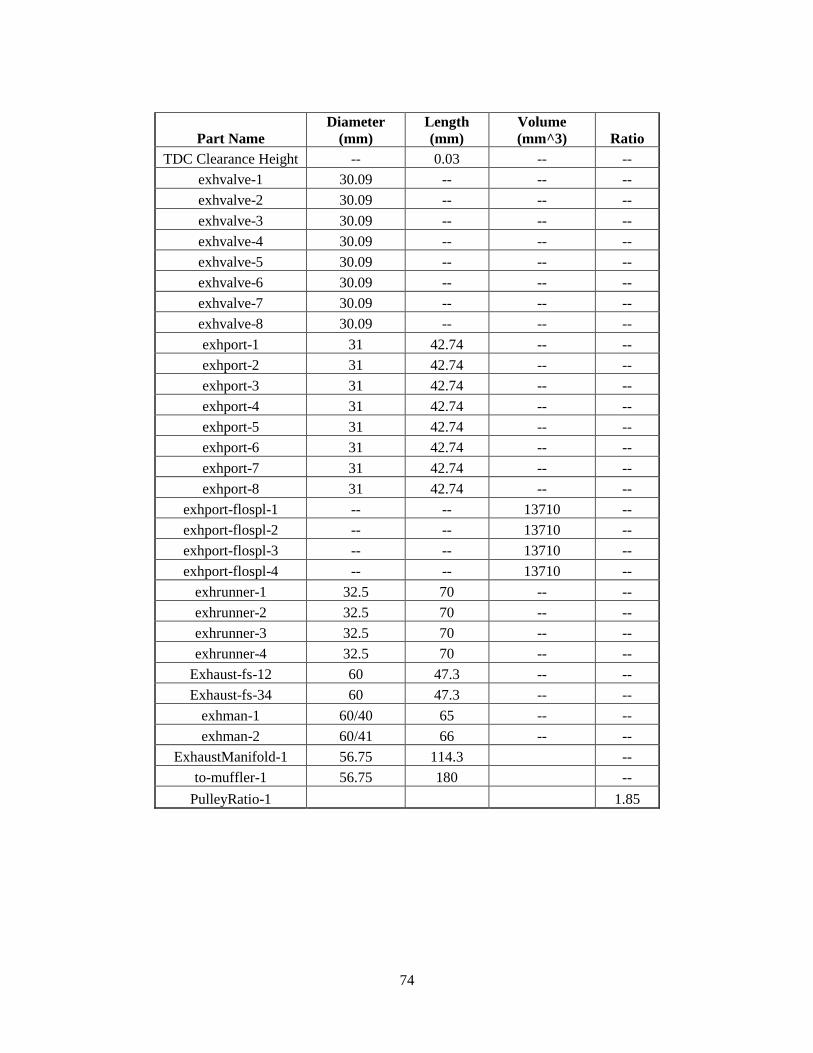
74
Part Name
Diameter
(mm)
Length
(mm)
Volume
(mm^3) Ratio
TDC Clearance Height -- 0.03 -- --
exhvalve-1 30.09 -- -- --
exhvalve-2 30.09 -- -- --
exhvalve-3 30.09 -- -- --
exhvalve-4 30.09 -- -- --
exhvalve-5 30.09 -- -- --
exhvalve-6 30.09 -- -- --
exhvalve-7 30.09 -- -- --
exhvalve-8 30.09 -- -- --
exhport-1 31 42.74 -- --
exhport-2 31 42.74 -- --
exhport-3 31 42.74 -- --
exhport-4 31 42.74 -- --
exhport-5 31 42.74 -- --
exhport-6 31 42.74 -- --
exhport-7 31 42.74 -- --
exhport-8 31 42.74 -- --
exhport-flospl-1 -- -- 13710 --
exhport-flospl-2 -- -- 13710 --
exhport-flospl-3 -- -- 13710 --
exhport-flospl-4 -- -- 13710 --
exhrunner-1 32.5 70 -- --
exhrunner-2 32.5 70 -- --
exhrunner-3 32.5 70 -- --
exhrunner-4 32.5 70 -- --
Exhaust-fs-12 60 47.3 -- --
Exhaust-fs-34 60 47.3 -- --
exhman-1 60/40 65 -- --
exhman-2 60/41 66 -- --
ExhaustManifold-1 56.75 114.3 --
to-muffler-1 56.75 180 --
PulleyRatio-1 1.85
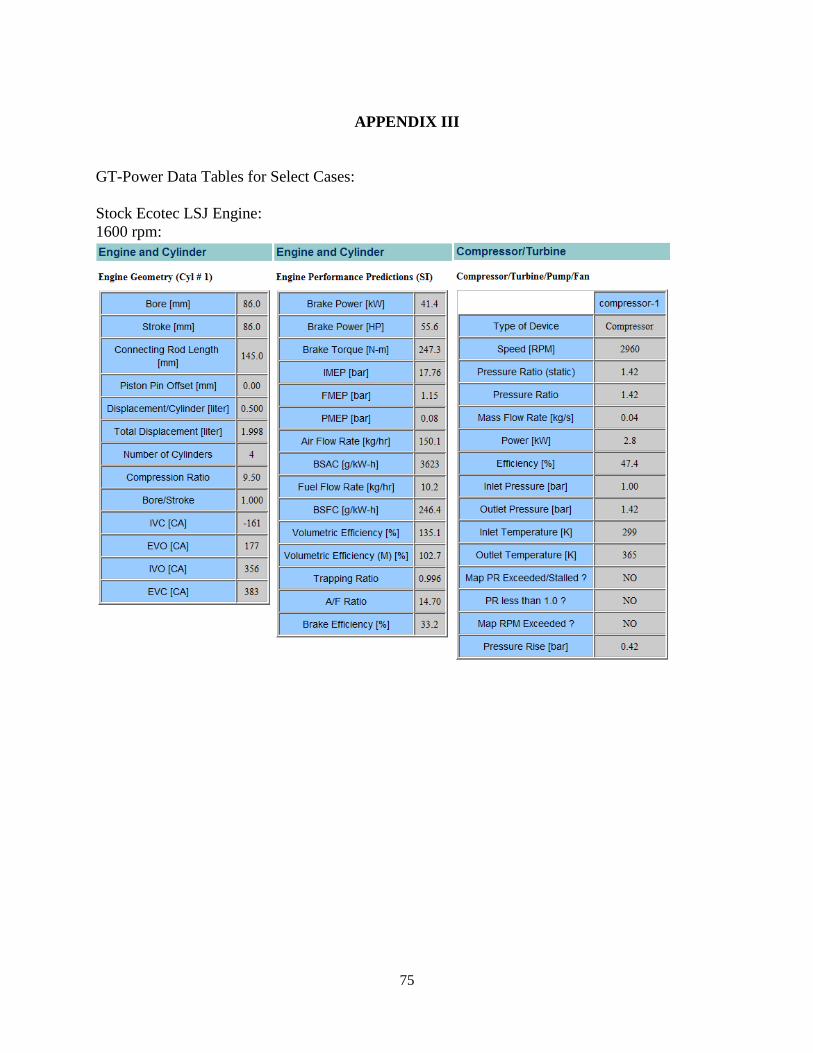
75
APPENDIX III
GT-Power Data Tables for Select Cases:
Stock Ecotec LSJ Engine:
1600 rpm:
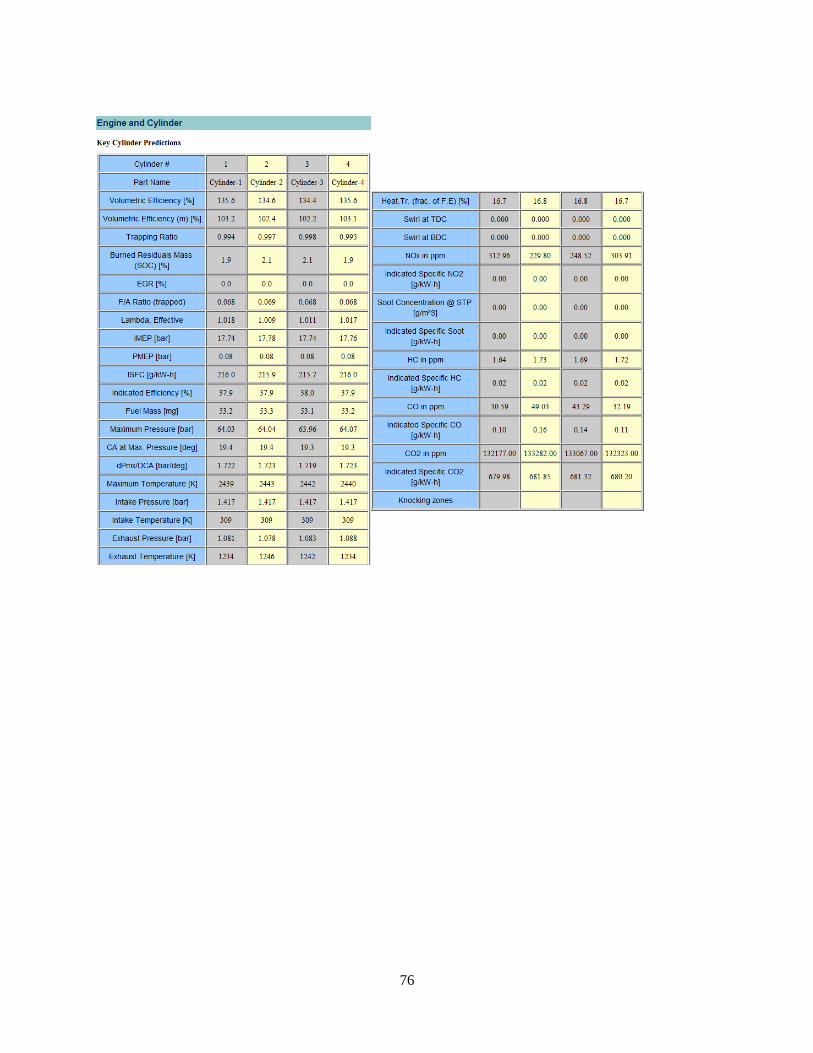
76
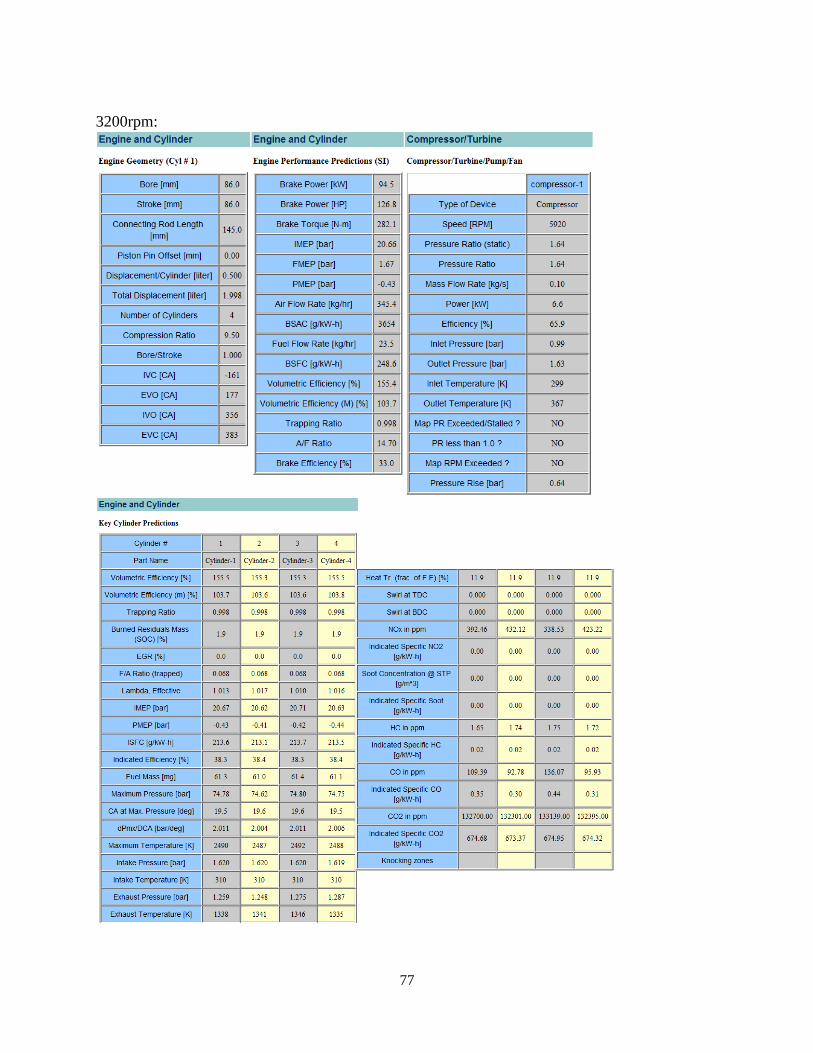
77
3200rpm:
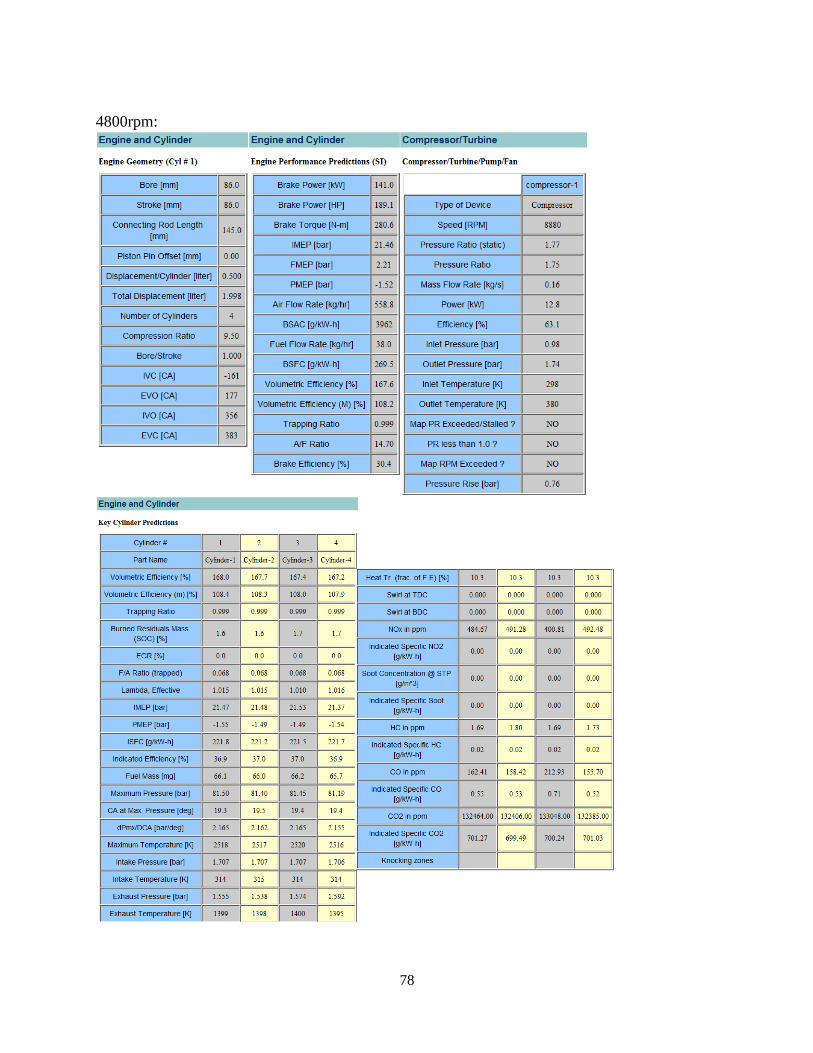
78
4800rpm:
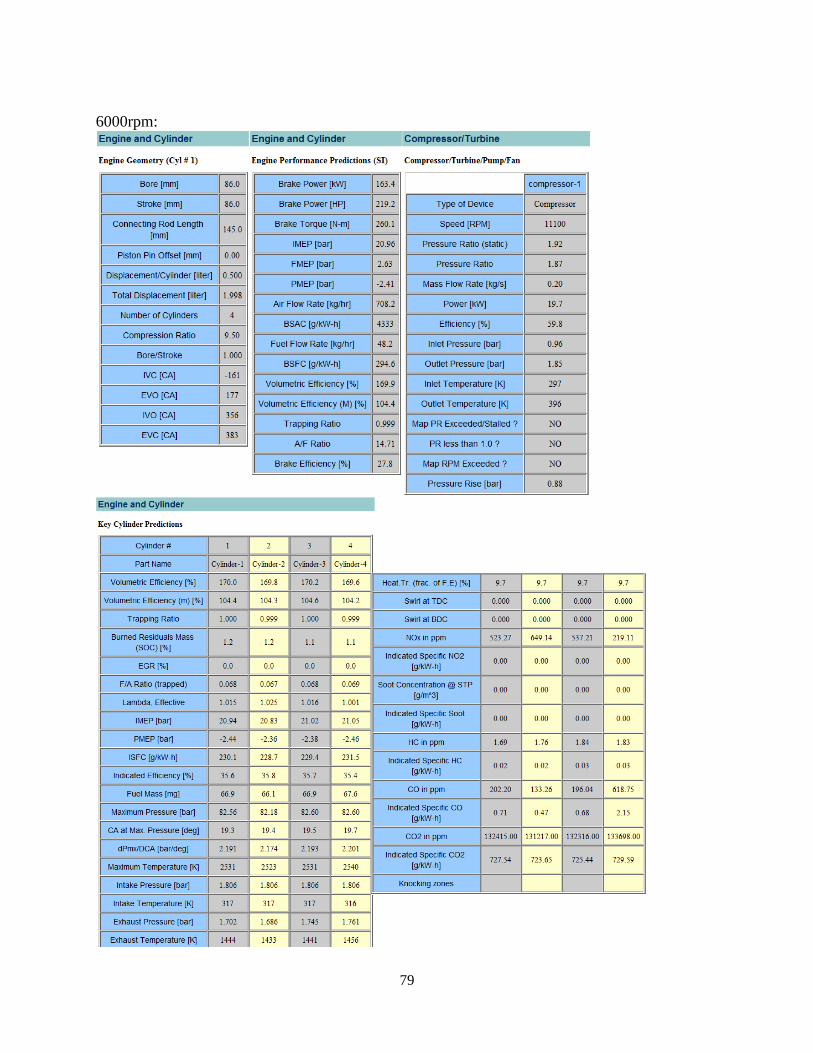
79
6000rpm:
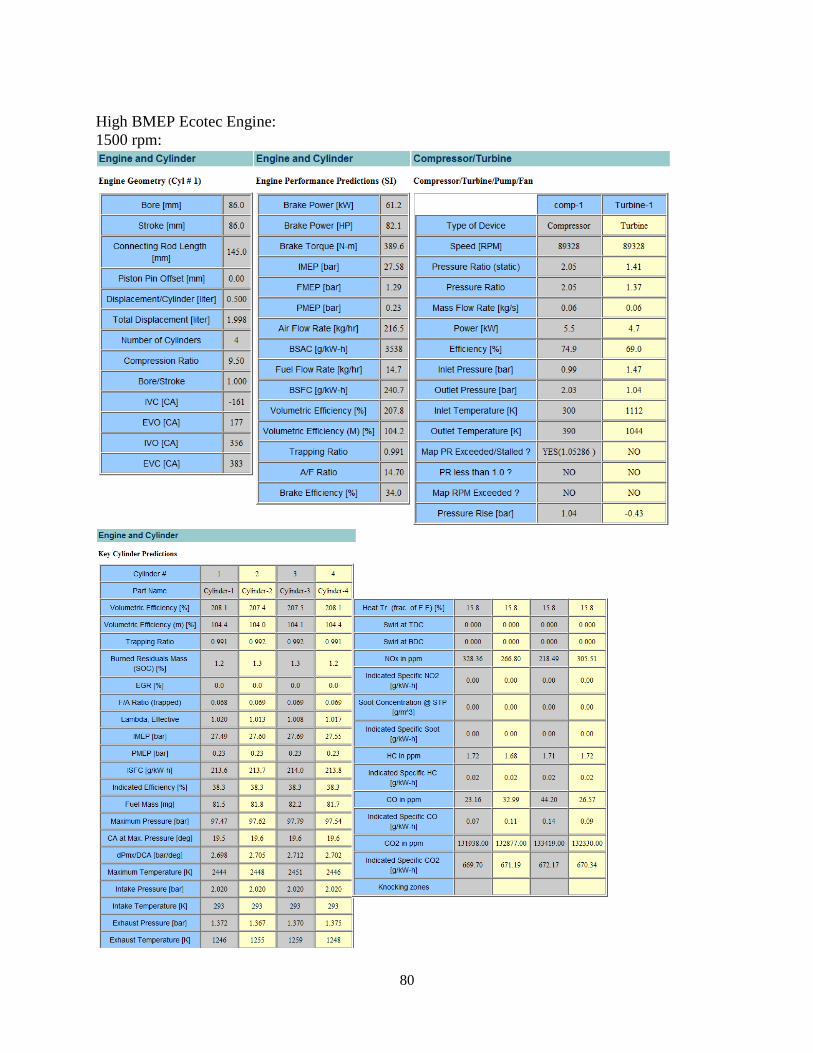
80
High BMEP Ecotec Engine:
1500 rpm:

81
3000 rpm:

82
4500 rpm:
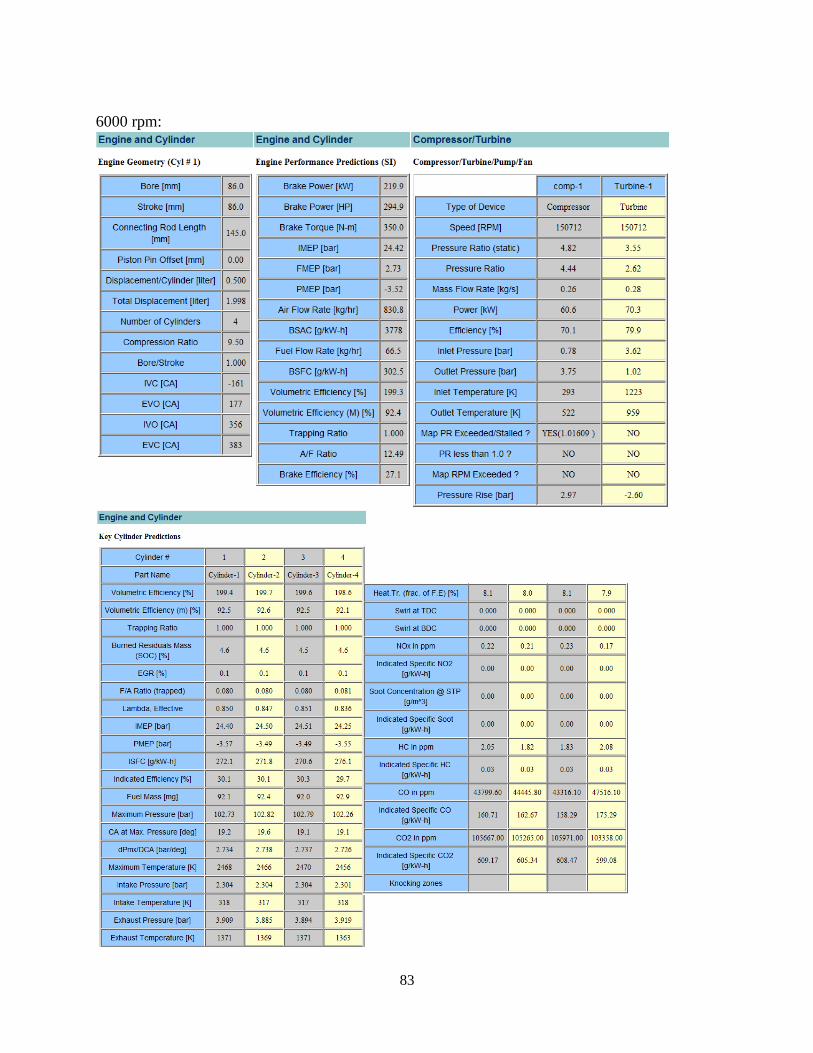
83
6000 rpm:
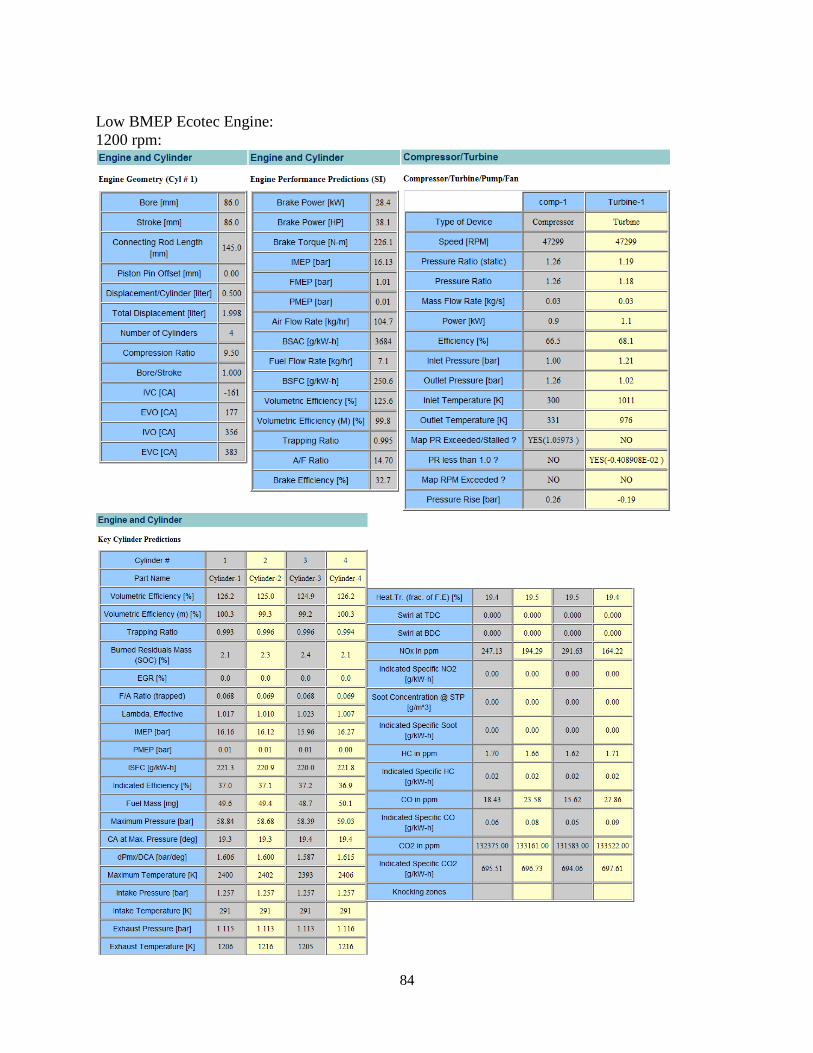
84
Low BMEP Ecotec Engine:
1200 rpm:
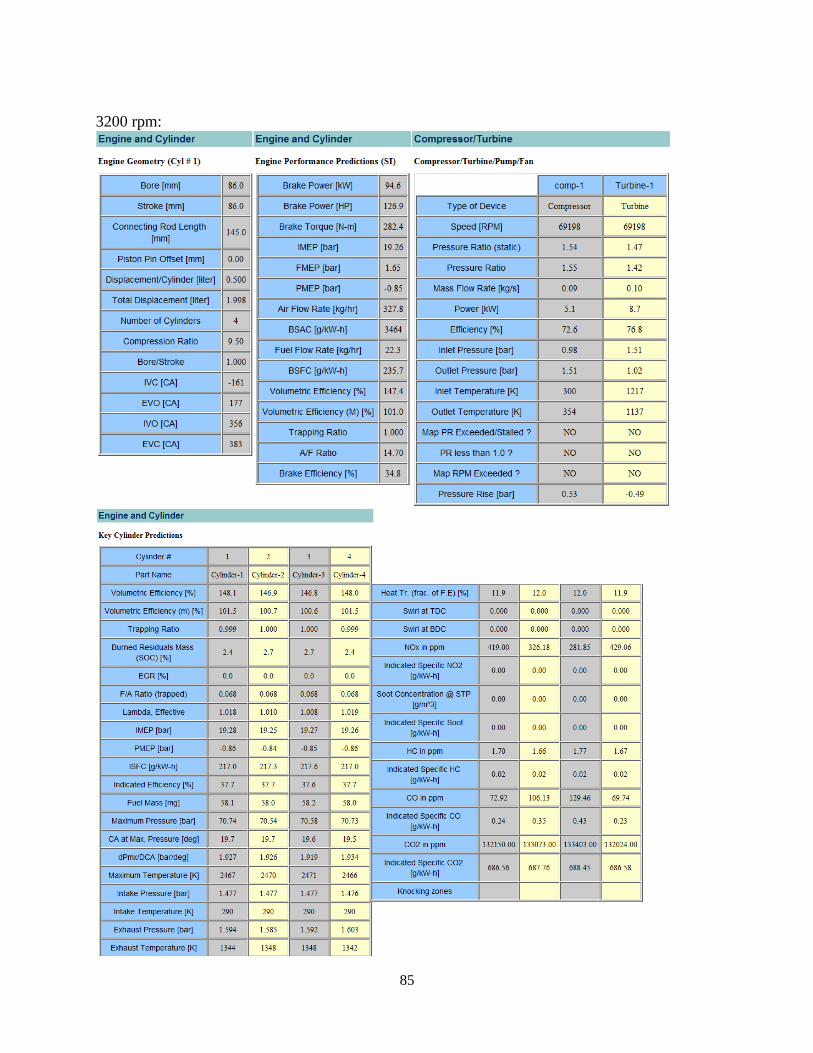
85
3200 rpm:

86
5200 rpm:

87
6000 rpm:
88
LIST OF ABBREVIATIONS
AFR – Air Fuel Ratio
BMEP – Brake Mean Effective Pressure
BSFC – Brake Specific Fuel Consumption
CAFE – Corporate Average Fuel Economy
CVT – Continuously Variable Transmission
EGR – Exhaust Gas Recirculation
FMEP – Friction Mean Effective Pressure
GM – General Motors
GT-ISE – Gamma Technologies-Integrated Simulation Environment
ICE – Internal Combustion Engine
IMEP – Indicated Mean Effective Pressure
ISFC – Indicated Specific Fuel Consumption
NEDC – New European Drive Cycle
NHTSA – National Highway Traffic Safety Administration
OEM – Original Equipment Manufacturer
PID – Proportional-Integral-Derivative
PMEP – Pumping Mean Effective Pressure
ST – SuperTurboTM
TDC – Top Dead Center
US EPA – United States Environmental Protection Agency
VVT – Variable Valve Timing
WOT – Wide Open Throttle