Embed Size (px)
Citation preview
International Journal of Software Engineering and Its Applications
Vol. 10, No. 5 (2016), pp. 175-188
http://dx.doi.org/10.14257/ijseia.2016.10.5.16
ISSN: 1738-9984 IJSEIA
Copyright ⓒ 2016 SERSC
Increasing Accuracy of Process-based Fraud Detection
Using a Behavior Model
Solichul Huda1, Riyanarto Sarno2 and Tohari Ahmad3
1Department of Informatics, Universitas Dian Nuswantoro,Semarang, Indonesia
2,3Department of Informatics, Institut Teknologi Sepuluh Nopember (ITS),
Surabaya, Indonesia
[email protected], [email protected], [email protected]
Abstract
Process-based fraud (PBF) is fraud caused by deviation from a business process
model. Some studies have proposed methods for PBF detection; however, these are still
not able to fully detect the occurrence of fraud. In this context, we propose a new method
of PBF detection which carries out the behavior of the originators (users who perform
events) to adjust the levels of fraud occured in the events. In this research, we propose a
method of PBF detection with behavior model in order to increase accuracy. This is done
firstly by analyzing the business processes that correspond to those in the standard
operating system (SOP). Secondly, by calculating the event execution performed by the
originator and his/her relations within the organization, whose behavior is then analyzed.
Thirdly, by using the number of deviations and the originator behavior to calculate the
attribute value. By using attribute importance weights, an attribute rating of each
originator is kept. Finally, Multi Attribute Decision Making is used to decide the PBF
rating of a case, on the basis of which it is decided whether fraud occurred or not. The
experimental results show that this behavior model is able to reduce false positive and
false negative, therefore, the method can increase the accuracy level by 0.01.
Keywords: Fraud detection, PBF detection, originator behavior, behavior model,
process deviation
1. Introduction
Companies utilize fraud detection methods to defend against fraudulent attacks. Fraud
has become a significant apprehension because it is the main cause of losses in companies
and organizations [1]. It is predicted that fraud causes a forfeit of approximately 5% of
their annual revenue. Fraud has generated more than 70 trillion dollars in losses [2].
Since anti-fraud systems are not able to detect every case of fraud, companies will
potentially continue to endure more financial losses. Therefore, they need to implement a
more accurate fraud detection system. Moreover, it is likely to detect fraud if the early
caution system works well. For instance, if a deviation from the standard operating
procedures (SOP) performed by an employee is identified timely, the company can
change the work pattern to minimize the possibility of fraud. In such cases, process
mining constitutes a method of testing the conformity of the actual business process to the
SOP [3].
Fraud detection through data mining has been researched for several years in various
ways. For example, by utilizing a Neural Network algorithm [4], the Dempster-Shafer
theory and Bayesian Learning algorithms [5], a Self-organizing Maps algorithm [6],
classification models [7], web service collaboration [8], and empirical analysis [9].
Furthermore, fraud detection through process mining has been done utilizing control flow
analysis, role analysis and performance analysis [3,10,11], hybrid Association Rule
Learning (ARL) and process mining [12], and fuzzy Multi Attribute Decision Making
International Journal of Software Engineering and Its Applications
Vol. 10, No. 5 (2016)
176 Copyright ⓒ 2016 SERSC
[13].
These previous studies, however, only considered attribute values and attribute
importance weights. Here, PBF detection is based on SOP deviation (attribute value
and attribute importance weights), although in fact not all deviations are fraud, as
debated by experts. As a result, fraud may not be decided by deviation from the SOP
only. Hence, we propose an originator behavior model to investigate the SOP
deviation of a case. Process mining methods are implemented to analyze both the
business processes and the behavior of the originator who performed an event. This
analysis tests whether events deviate from the SOP. Based on this analysis, we
calculate the weight of the relations and the behavior of the originator. In addition,
this research considers attribute value, attribute importance weight and originator
behavior. We hypothesize that the degree of membership of originator behavior can
supply the deviation weight. Finally, the weight of deviation can be utilized to
decide whether the deviation points to fraud or not. Based on this, we believe that
originator behavior is suitable to use for detecting fraud, especially in the case of
low or middle deviation levels.
2. Previous Works
It is difficult for companies not only to detect fraud, but also to minimize their losses
caused by it [1]. Fraud in a business process can be analyzed by process mining, including
event sequence, performance, role analysis and control flow [3]. Detection is done by
utilizing Association Rule Learning (data mining) and hybrid methods (e.g. combinations
of process mining and data mining). Based on the respective business processes, the
outcomes are analyzed to identify their deviation of SOP [10-13].
Fraud mitigation using process mining has first been proposed in [3]. This method
comprises a number of steps: control flow analysis, role analysis and performance
analysis, which are applied to investigate deviations from the business processes. Even
though it does not provide an algorithm for implementation, this work proved that fraud in
business processes can be detected by process mining.
In [10], tools for implementation of PBF detection are proposed using the 1+5+1
concept. In more detail, this consists of: (1) log preparation + (5) {a} log analysis, {b}
performance analysis, {c} social analysis, {d} conformance analysis, {e} process analysis
using sorting, summarization, joining and aging, filters, summarization + (1) refocusing
and iteration. The authors do not explain the forms of PBF. Furthermore, the
establishment of suspected fraud is not computed but carried out by experts. Similar to the
previous study, it proves that fraud in some business process models can be detected by
process mining.
A combination of process mining and an ARL algorithm (a hybrid method) has been
proposed in [12]. Process mining was employed to analyze deviation from the SOP, while
an ARL algorithm was applied to identify fraudulent behavior. Rules for compliance
checking were generated by expert opinion about Association Rule Learning. The authors
considered attributed weights for detecting fraud, which was done subjectively.
In [13], the authors proposed fuzzy Multi Attribute Decision Making for PBF rating.
Process mining was utilized for analyzing the conformity of business processes with the
SOP. An event execution deviating from the SOP was labeled with a PBF attribute.
Further, using fuzzy MADM, the PBF attributes of a case were decided as fraud or not.
Here, PBF rating was employed for fraud mitigation, with constant updating of the weight
of fraud. The study proved that fuzzy MADM is able to detect low deviations. However,
the behavior of the originator who performs an event was not analyzed for weighing SOP
deviation.
International Journal of Software Engineering and Its Applications
Vol. 10, No. 5 (2016)
Copyright ⓒ 2016 SERSC 177
3. Process-based Fraud Detection Method
Process mining for information retrieval focuses on event logs [12-16]. The processes
that are performed within an information system are recorded in event logs. The format of
the information is: event name, case code, event code, date and time of event execution,
and originator name.
The process mining consists of: conformance checking, discovery, and enhancement
[17,18]. Conformance checking is used to analyze the prevalence of a process
instance/case in a process model [19,20]. Comparison between cases in the event logs and
a process model has been proposed in [3]. This work concerns the development of the
conformance method for fraud detection. It used statistical tools to analyze the business
process.
3.1. Process Mining for Fraud Detection
Detecting PBF in business processes can be done from three different angles, i.e.
business process, business role, and organization. Hence, PBF detection can be performed
by comparing different business processes with respective models, or by analyzing any
process that deviates from the business role, or by analyzing the behavior from any
originator to see if it deviates from the segregation of duties (SOD) or separation of work
[11].
There are some advantages to the utilization of process mining for PBF detection. For
example, the conformance method can be employed to test the conformity of business
processes with SOP. In addition, this method is able to detect the occurrence of event skip
and indicates it as suspicious [13]. Furthermore, it also has the capability of analyzing and
controlling the flow of business processes along with their sequence. Similar to the
previous methods, if a process deviates from the standard sequence of processes, it is
classified as suspicious [3].
Process mining can be applied to review parallel events, wrong duty, the execution
time of an event, and wrong pattern. In this case, an event whose execution time is shorter
than the standard execution time is indicated as suspicious. Also, events whose execution
pattern is different from the SOP are labeled as suspicious. Like [13], deviations from
segregation of duty are put in the suspicious group.
3.2. PBF Attributes
In the present study conformance methods were employed for testing the conformity of
the business processes of a number of cases with the SOP. If a process deviated from the
SOP, it was labeled as a PBF attribute. PBF attributes are types of deviations from the
SOP. In [13], the authors proposed eleven PBF attributes, i.e. skip sequence, skip
decision, throughput time min, throughput time max, wrong resource, wrong decision,
wrong duty sequence, wrong duty decision, wrong duty combine, wrong pattern, and
parallel event. For example, if an originator performs an event for which he/she does not
have the proper authority, it fulfills the wrong resource attribute. Furthermore, if an event
execution jump conforms with the sequence of event execution in the SOP, it fulfills the
skip sequence or decision attribute. A detailed description and samples of PBF attributes
are presented in [13].
3.3. PBF Attribute Importance Weights
Study [13] proposed PBF attribute importance weights to identify cases with a low
deviation level. Expert opinion was used with the modified digital logic (MDL) method
for assessing attribute importance, which resulted in attribute importance weights. Table
II shows the attribute importance weights of the PBF attributes.
International Journal of Software Engineering and Its Applications
Vol. 10, No. 5 (2016)
178 Copyright ⓒ 2016 SERSC
3.4. Originator Behavior Model
Personal behavior influences other employees within an organization [21], the impact
of which depends on the relational weight. In a social network, the relational weight
method can be used to measure personal relations. In [22], the authors propose methods to
analyze relations in a social network. The weight of a relation is decided based on the
distance between the respective originators. If the distance between them is one, Eq. (1) is
used calculate its weight; if it is more than one, Eq. (2) is applied [22].
R = (p1 ⊳ Lp2 = (∑ |p1⊳c1C∈L p2|)/(∑ |c|-1c∈L ) (1)
𝑅 = 𝑝1 ⊳ 𝑝2 = (∑ ∑ 𝛽𝑛−1|𝑝1 ⊳𝑐𝑛
1≤𝑛<|𝑐|𝑐∈𝐿 𝑝2| )/(∑𝑐∈𝐿 ∑1≤𝑛<|𝑐| 𝛽𝑛−1(|𝑐| − 𝑛) (2)
To obtain linguistic labels for originator behavior, we consulted experts. The value of
originator behavior in each case was determined based on expert opinion and a training
dataset. This resulted in a categorization according to five linguistic labels: ‘very good’,
‘good’, ‘fair’, ‘bad’ and ‘very bad’.
Hence, we can distinguish two kinds of behavior, good and bad, which are used to limit
user authority. The labels ‘good’ and ‘very good’ provide the authority to execute events,
while ‘bad’ and ‘very bad’ do not. Users need a year to change their behavior from bad to
good, as argued by experts. Based on this, we set the period of shift in behavior weight to
one year. Additionally, behavior weight may increase or decrease, depending on the event
execution. If an execution conforms with the SOP, the weight goes up, and goes down if it
does not conform. Furthermore, by considering the effect of relations within a social
network, relation weight is employed in the behavior model. Hence, we propose to
express the behavior model in the following equation:
𝑃 = 𝐴 + ((𝐵 − 𝐺
∑ 𝐸𝑣𝑐) ∗ (∑ 𝐸𝑡 − ∑ 𝐸𝑓 + (∑ 𝑆𝑡𝑘 ∗ 𝑅) − (∑ 𝑆𝑓𝑘
𝑘
1
𝑘
1
∗ 𝑅))) |0 ≤ 𝑃 ≤ 1|
if n = 1 then 𝑅 = 𝑝1 ⊳ 𝐿𝑝2 = (∑ |𝑝1⊳𝑐1𝐶∈𝐿 𝑝2|)/(∑ |𝑐| − 1𝑐∈𝐿 );
if n > 1 then
𝑅 = 𝑝1 ⊳ 𝑝2 = (∑ ∑ 𝛽𝑛−1|𝑝1 ⊳𝑐𝑛
1≤𝑛<|𝑐|𝑐∈𝐿 𝑝2| )/(∑𝑐∈𝐿 ∑1≤𝑛<|𝑐| 𝛽𝑛−1(|𝑐| − 𝑛) (3)
where G is the weight for good behavior, B is the weight for bad behavior, EVc is total of
events for one period, Et is an event execution that conforms with the SOP, Ef is an event
execution that deviates from the SOP, Stk is an event execution that conforms with the
SOP and is done by an originator with relations, Sfk is an event execution that deviates
from the SOP and is done by an originator with relations, R is the relation weight, and P is
the originator.
3.5. Implementation of Methods
Our research decides the attribute value by multiplying the number of SOP deviations
by the behavior weight. The process mining method is utilized for analyzing the business
process and results in a number of SOP deviations along with the weight of the
originator’s behavior. Further, the number of deviations and the weight of the originator’s
behavior determine the attribute value for each originator. This value and the attribute
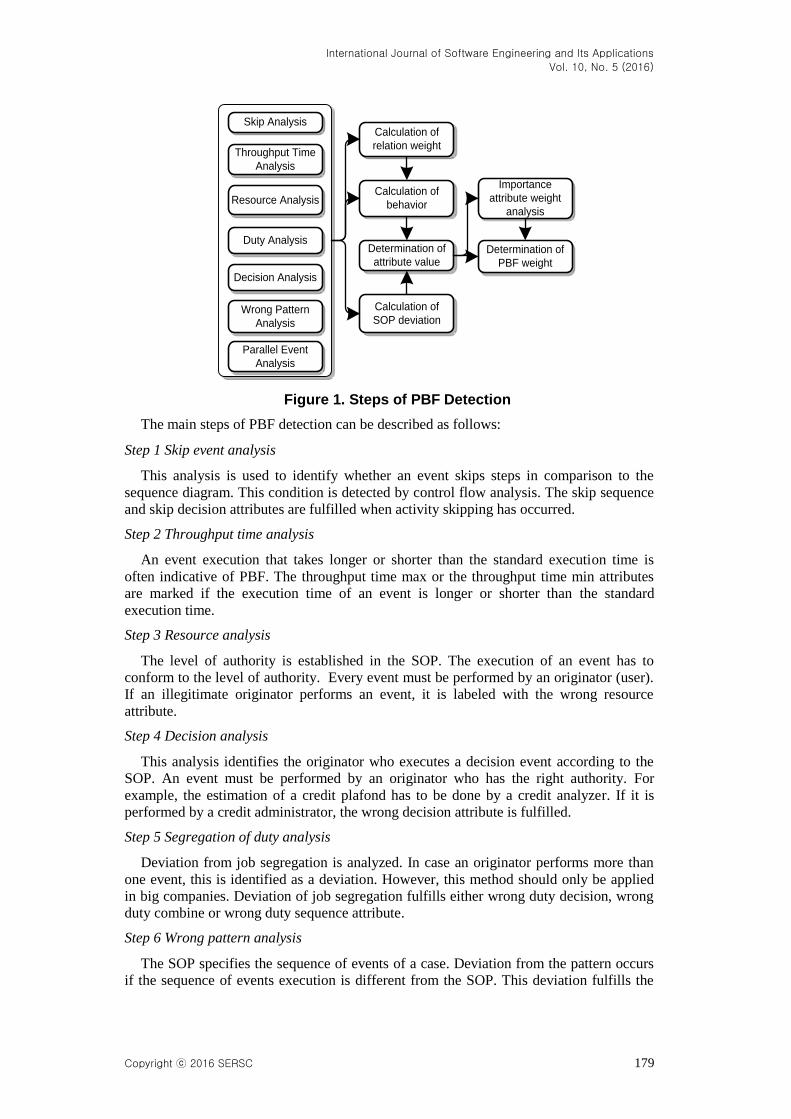
importance weight are multiplied with each other to get the PBF rating. Figure (1) shows
the implementation steps of this originator behavior model for fraud detection.
International Journal of Software Engineering and Its Applications
Vol. 10, No. 5 (2016)
Copyright ⓒ 2016 SERSC 179
Wrong Pattern
Analysis
Skip Analysis
Throughput Time
Analysis
Resource Analysis
Duty Analysis
Decision Analysis
Parallel Event
Analysis
Calculation of
relation weight
Calculation of
behavior
Importance
attribute weight
analysis
Calculation of
SOP deviation
Determination of
attribute valueDetermination of
PBF weight
Figure 1. Steps of PBF Detection
The main steps of PBF detection can be described as follows:
Step 1 Skip event analysis
This analysis is used to identify whether an event skips steps in comparison to the
sequence diagram. This condition is detected by control flow analysis. The skip sequence
and skip decision attributes are fulfilled when activity skipping has occurred.
Step 2 Throughput time analysis
An event execution that takes longer or shorter than the standard execution time is
often indicative of PBF. The throughput time max or the throughput time min attributes
are marked if the execution time of an event is longer or shorter than the standard
execution time.
Step 3 Resource analysis
The level of authority is established in the SOP. The execution of an event has to
conform to the level of authority. Every event must be performed by an originator (user).
If an illegitimate originator performs an event, it is labeled with the wrong resource
attribute.
Step 4 Decision analysis
This analysis identifies the originator who executes a decision event according to the
SOP. An event must be performed by an originator who has the right authority. For
example, the estimation of a credit plafond has to be done by a credit analyzer. If it is
performed by a credit administrator, the wrong decision attribute is fulfilled.
Step 5 Segregation of duty analysis
Deviation from job segregation is analyzed. In case an originator performs more than
one event, this is identified as a deviation. However, this method should only be applied
in big companies. Deviation of job segregation fulfills either wrong duty decision, wrong
duty combine or wrong duty sequence attribute.
Step 6 Wrong pattern analysis
The SOP specifies the sequence of events of a case. Deviation from the pattern occurs
if the sequence of events execution is different from the SOP. This deviation fulfills the
International Journal of Software Engineering and Its Applications
Vol. 10, No. 5 (2016)
180 Copyright ⓒ 2016 SERSC
wrong pattern attribute.
Step 7 Parallel event analysis
Execution of parallel events is usually performed to reduce the job execution time. This
type of performance, however, may also be marked as fraud. Our method proposes to
analyze if a parallel event execution corresponds to the SOP. Execution of parallel events
may denote an SOP deviation that has an effect on the parallel event attribute.
Step 8 Calculation of relation weight
The relation between originators in a social network is measured based on the distance
between them in the event sequence stored in the event logs. The relation weight is
affected by the sequence of events and the originator who runs the events. The relation
weight is obtained with Eq. (1) and Eq. (2).
Step 9 Calculation of originator behavior
Originator behavior is influenced by the performance of the originator when he/she
executes an event. The condition whether the execution deviates from the SOP or not will
affect originator behavior. Furthermore, the performance of the originator will also affect
the originator behavior of other originators who have a relation with him/her within the
organization. The behavior weight is obtained by applying Eq. (3).
Step 10 Weight value of deviation
Analyzing the business process of a case reveals whether processes deviated from the
SOP or not. If a process deviated from the SOP, this affects the number of deviations. For
determining the attribute value, the number of deviations is converted to deviation weight.
The conversion method uses the deviation weight method from [23]. Table 1 shows the
membership function of deviation weight.
Step 11 Attribute importance weight
In this research, eleven attributes of PBF were used. An expert assessed the attribute
importance weights by using Modified Digital Logic (MDL) [13]. The membership
function of the attribute importance weights is shown in Table 2.
Step 12 Weighting attribute value
The attribute value is the weight of an SOP deviation. In previous studies, the attribute
value was decided only by considering the number of SOP deviations and the attribute
importance weights. To better the accuracy of PBF detection, here, the attribute value is
calculated from the number of SOP deviations, originator behavior and attribute
importance weights. By utilizing the membership function in Table 3, the originator
behavior is converted to a fuzzy set. Additionally, the inference attribute value of the
number of SOP deviations and the originator behavior is applied to the rule behavior.
Also, rules of attribute importance result in the attribute value of a case, which is
defuzzified to produce the crisp value [13].
Step 13 Determination of attribute value for each PBF attribute
The attribute values of each case were grouped according to the PBF attributes (e.g.
skip sequence was performed in 1 case by 2 originators: Michael and David; throughput
time min was run by 3 originators; these occurrences were grouped to the skip sequence
and the throughput time min attribute respectively). Assessing the attribute values was
done by using Eq. (4). This method results in an attribute rating that is used to determine
the PBF rating.
𝑆 = 𝐴1 ∨ 𝐴2 ∨ 𝐴3 ∨ 𝐴4 … 𝐴𝑛 (4)
International Journal of Software Engineering and Its Applications
Vol. 10, No. 5 (2016)
Copyright ⓒ 2016 SERSC 181
where A is attribute value of originator n.
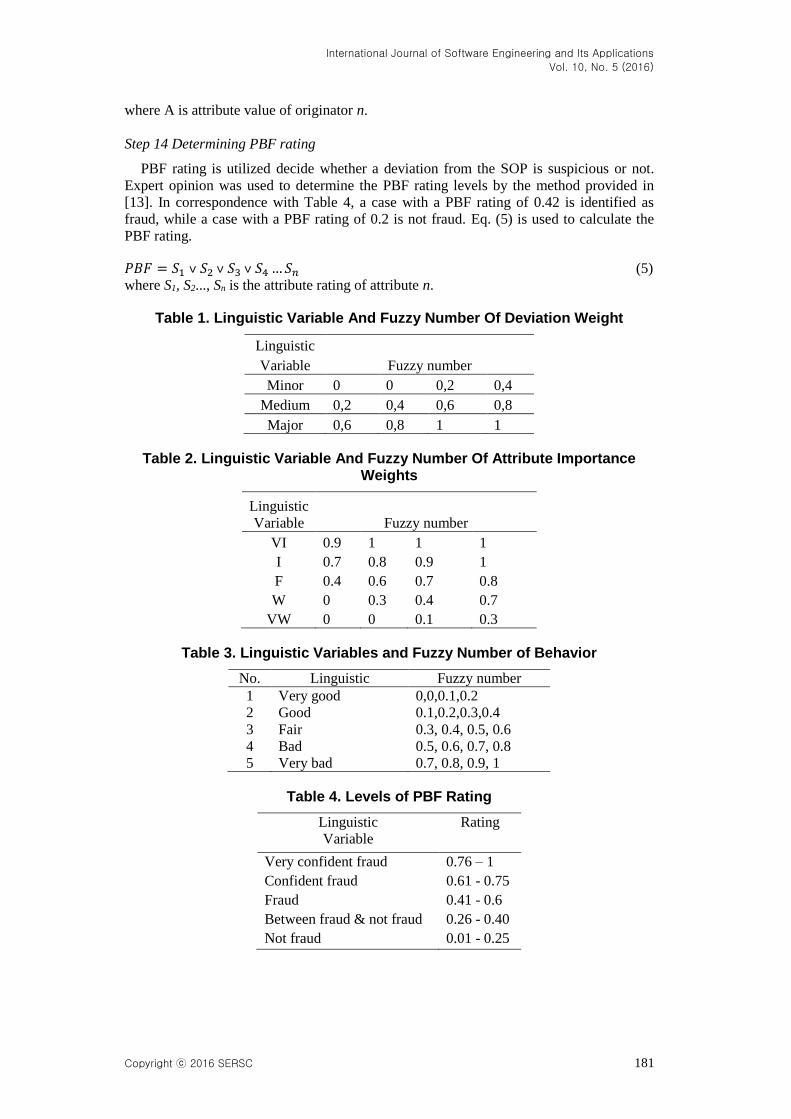
Step 14 Determining PBF rating
PBF rating is utilized decide whether a deviation from the SOP is suspicious or not.
Expert opinion was used to determine the PBF rating levels by the method provided in
[13]. In correspondence with Table 4, a case with a PBF rating of 0.42 is identified as
fraud, while a case with a PBF rating of 0.2 is not fraud. Eq. (5) is used to calculate the
PBF rating.
𝑃𝐵𝐹 = 𝑆1 ˅ 𝑆2 ˅ 𝑆3 ˅ 𝑆4 … 𝑆𝑛 (5)
where S1, S2..., Sn is the attribute rating of attribute n.
Table 1. Linguistic Variable And Fuzzy Number Of Deviation Weight
Linguistic
Fuzzy number Variable
Minor 0 0 0,2 0,4
Medium 0,2 0,4 0,6 0,8
Major 0,6 0,8 1 1
Table 2. Linguistic Variable And Fuzzy Number Of Attribute Importance Weights
Linguistic
Variable Fuzzy number
VI 0.9 1 1 1
I 0.7 0.8 0.9 1
F 0.4 0.6 0.7 0.8
W 0 0.3 0.4 0.7
VW 0 0 0.1 0.3
Table 3. Linguistic Variables and Fuzzy Number of Behavior
No. Linguistic Fuzzy number
1 Very good 0,0,0.1,0.2
2 Good 0.1,0.2,0.3,0.4
3 Fair 0.3, 0.4, 0.5, 0.6
4 Bad 0.5, 0.6, 0.7, 0.8
5 Very bad 0.7, 0.8, 0.9, 1
Table 4. Levels of PBF Rating
Linguistic
Variable
Rating
Very confident fraud 0.76 – 1
Confident fraud 0.61 - 0.75
Fraud 0.41 - 0.6
Between fraud & not fraud 0.26 - 0.40
Not fraud 0.01 - 0.25
International Journal of Software Engineering and Its Applications
Vol. 10, No. 5 (2016)
182 Copyright ⓒ 2016 SERSC
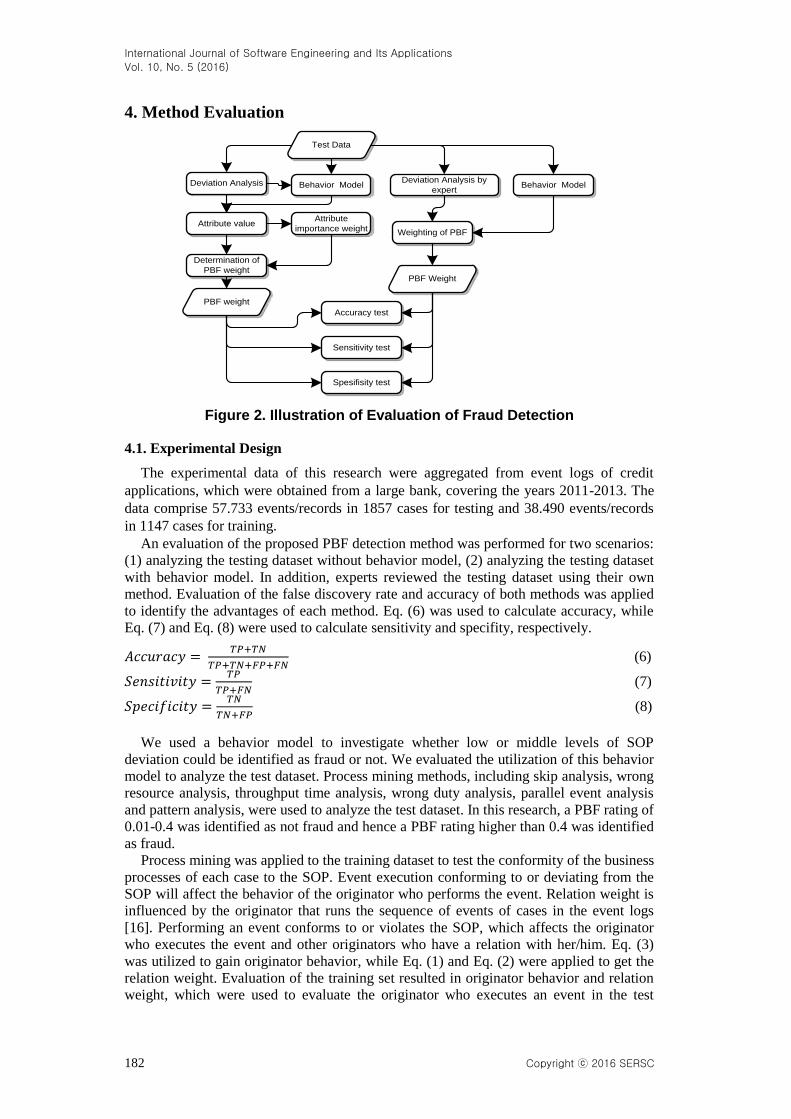
4. Method Evaluation
Deviation Analysis by
expertBehavior Model
Attribute
importance weightAttribute value
Determination of
PBF weight
Test Data
Deviation Analysis
Weighting of PBF
Behavior Model
PBF weight
PBF Weight
Accuracy test
Sensitivity test
Spesifisity test
Figure 2. Illustration of Evaluation of Fraud Detection
4.1. Experimental Design
The experimental data of this research were aggregated from event logs of credit
applications, which were obtained from a large bank, covering the years 2011-2013. The
data comprise 57.733 events/records in 1857 cases for testing and 38.490 events/records
in 1147 cases for training.
An evaluation of the proposed PBF detection method was performed for two scenarios:
(1) analyzing the testing dataset without behavior model, (2) analyzing the testing dataset
with behavior model. In addition, experts reviewed the testing dataset using their own
method. Evaluation of the false discovery rate and accuracy of both methods was applied
to identify the advantages of each method. Eq. (6) was used to calculate accuracy, while
Eq. (7) and Eq. (8) were used to calculate sensitivity and specifity, respectively.
𝐴𝑐𝑐𝑢𝑟𝑎𝑐𝑦 = 𝑇𝑃+𝑇𝑁
𝑇𝑃+𝑇𝑁+𝐹𝑃+𝐹𝑁 (6)
𝑆𝑒𝑛𝑠𝑖𝑡𝑖𝑣𝑖𝑡𝑦 =𝑇𝑃
𝑇𝑃+𝐹𝑁 (7)
𝑆𝑝𝑒𝑐𝑖𝑓𝑖𝑐𝑖𝑡𝑦 =𝑇𝑁
𝑇𝑁+𝐹𝑃 (8)
We used a behavior model to investigate whether low or middle levels of SOP
deviation could be identified as fraud or not. We evaluated the utilization of this behavior
model to analyze the test dataset. Process mining methods, including skip analysis, wrong
resource analysis, throughput time analysis, wrong duty analysis, parallel event analysis
and pattern analysis, were used to analyze the test dataset. In this research, a PBF rating of
0.01-0.4 was identified as not fraud and hence a PBF rating higher than 0.4 was identified
as fraud.
Process mining was applied to the training dataset to test the conformity of the business
processes of each case to the SOP. Event execution conforming to or deviating from the
SOP will affect the behavior of the originator who performs the event. Relation weight is
influenced by the originator that runs the sequence of events of cases in the event logs
[16]. Performing an event conforms to or violates the SOP, which affects the originator
who executes the event and other originators who have a relation with her/him. Eq. (3)
was utilized to gain originator behavior, while Eq. (1) and Eq. (2) were applied to get the
relation weight. Evaluation of the training set resulted in originator behavior and relation
weight, which were used to evaluate the originator who executes an event in the test
International Journal of Software Engineering and Its Applications
Vol. 10, No. 5 (2016)
Copyright ⓒ 2016 SERSC 183
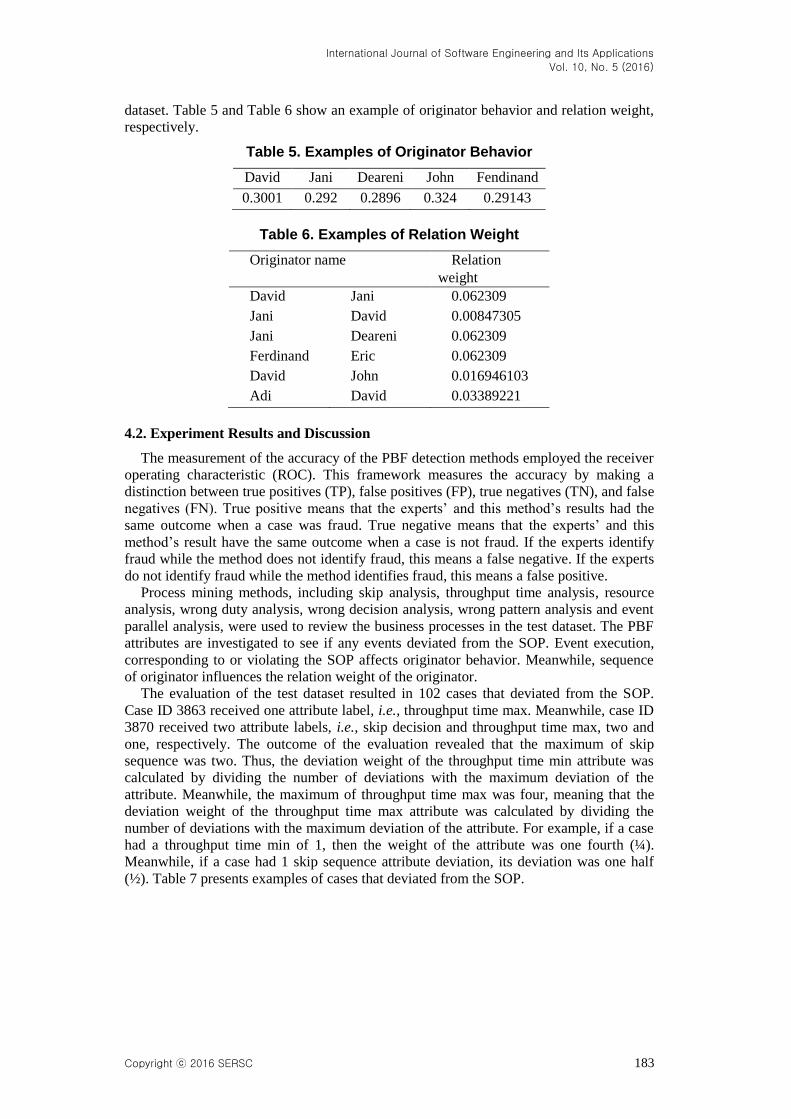
dataset. Table 5 and Table 6 show an example of originator behavior and relation weight,
respectively.
Table 5. Examples of Originator Behavior
David Jani Deareni John Fendinand
0.3001 0.292 0.2896 0.324 0.29143
Table 6. Examples of Relation Weight
Originator name Relation
weight
David Jani 0.062309
Jani David 0.00847305
Jani Deareni 0.062309
Ferdinand Eric 0.062309
David John 0.016946103
Adi David 0.03389221
4.2. Experiment Results and Discussion
The measurement of the accuracy of the PBF detection methods employed the receiver
operating characteristic (ROC). This framework measures the accuracy by making a
distinction between true positives (TP), false positives (FP), true negatives (TN), and false
negatives (FN). True positive means that the experts’ and this method’s results had the
same outcome when a case was fraud. True negative means that the experts’ and this
method’s result have the same outcome when a case is not fraud. If the experts identify
fraud while the method does not identify fraud, this means a false negative. If the experts
do not identify fraud while the method identifies fraud, this means a false positive.
Process mining methods, including skip analysis, throughput time analysis, resource
analysis, wrong duty analysis, wrong decision analysis, wrong pattern analysis and event
parallel analysis, were used to review the business processes in the test dataset. The PBF
attributes are investigated to see if any events deviated from the SOP. Event execution,
corresponding to or violating the SOP affects originator behavior. Meanwhile, sequence
of originator influences the relation weight of the originator.
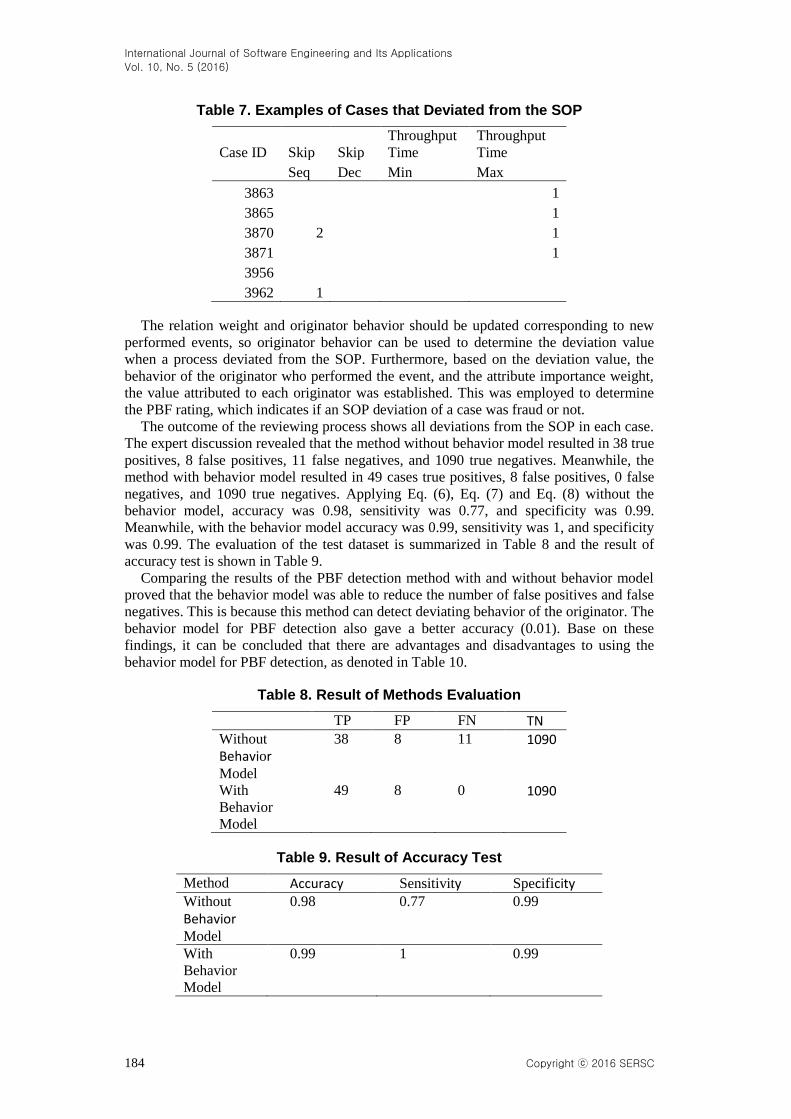
The evaluation of the test dataset resulted in 102 cases that deviated from the SOP.
Case ID 3863 received one attribute label, i.e., throughput time max. Meanwhile, case ID
3870 received two attribute labels, i.e., skip decision and throughput time max, two and
one, respectively. The outcome of the evaluation revealed that the maximum of skip
sequence was two. Thus, the deviation weight of the throughput time min attribute was
calculated by dividing the number of deviations with the maximum deviation of the
attribute. Meanwhile, the maximum of throughput time max was four, meaning that the
deviation weight of the throughput time max attribute was calculated by dividing the
number of deviations with the maximum deviation of the attribute. For example, if a case
had a throughput time min of 1, then the weight of the attribute was one fourth (¼ ).
Meanwhile, if a case had 1 skip sequence attribute deviation, its deviation was one half
(½ ). Table 7 presents examples of cases that deviated from the SOP.
International Journal of Software Engineering and Its Applications
Vol. 10, No. 5 (2016)
184 Copyright ⓒ 2016 SERSC
Table 7. Examples of Cases that Deviated from the SOP
Case ID Skip Skip
Throughput
Time
Throughput
Time
Seq Dec Min Max
3863 1
3865 1
3870 2 1
3871 1
3956
3962 1
The relation weight and originator behavior should be updated corresponding to new
performed events, so originator behavior can be used to determine the deviation value
when a process deviated from the SOP. Furthermore, based on the deviation value, the
behavior of the originator who performed the event, and the attribute importance weight,
the value attributed to each originator was established. This was employed to determine
the PBF rating, which indicates if an SOP deviation of a case was fraud or not.
The outcome of the reviewing process shows all deviations from the SOP in each case.
The expert discussion revealed that the method without behavior model resulted in 38 true
positives, 8 false positives, 11 false negatives, and 1090 true negatives. Meanwhile, the
method with behavior model resulted in 49 cases true positives, 8 false positives, 0 false
negatives, and 1090 true negatives. Applying Eq. (6), Eq. (7) and Eq. (8) without the
behavior model, accuracy was 0.98, sensitivity was 0.77, and specificity was 0.99.
Meanwhile, with the behavior model accuracy was 0.99, sensitivity was 1, and specificity
was 0.99. The evaluation of the test dataset is summarized in Table 8 and the result of
accuracy test is shown in Table 9.
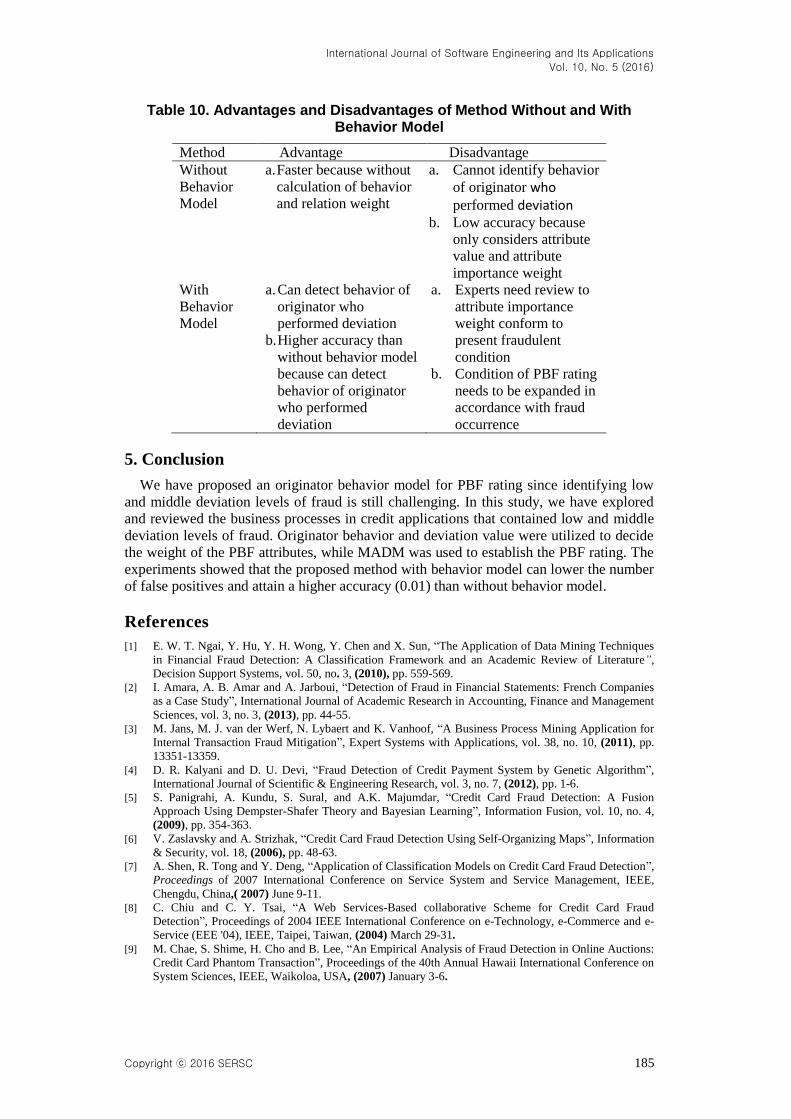
Comparing the results of the PBF detection method with and without behavior model
proved that the behavior model was able to reduce the number of false positives and false
negatives. This is because this method can detect deviating behavior of the originator. The
behavior model for PBF detection also gave a better accuracy (0.01). Base on these
findings, it can be concluded that there are advantages and disadvantages to using the
behavior model for PBF detection, as denoted in Table 10.
Table 8. Result of Methods Evaluation
TP FP FN TN
Without
Behavior Model
38 8 11 1090
With Behavior Model
49 8 0 1090
Table 9. Result of Accuracy Test
Method Accuracy Sensitivity Specificity
Without
Behavior Model
0.98 0.77 0.99
With
Behavior
Model
0.99 1 0.99
International Journal of Software Engineering and Its Applications
Vol. 10, No. 5 (2016)
Copyright ⓒ 2016 SERSC 185
Table 10. Advantages and Disadvantages of Method Without and With Behavior Model
Method Advantage Disadvantage
Without
Behavior
Model
a. Faster because without
calculation of behavior
and relation weight
a. Cannot identify behavior
of originator who performed deviation
b. Low accuracy because
only considers attribute
value and attribute
importance weight
With
Behavior
Model
a. Can detect behavior of
originator who
performed deviation
b. Higher accuracy than
without behavior model
because can detect
behavior of originator
who performed
deviation
a. Experts need review to
attribute importance
weight conform to
present fraudulent
condition
b. Condition of PBF rating
needs to be expanded in
accordance with fraud
occurrence
5. Conclusion
We have proposed an originator behavior model for PBF rating since identifying low
and middle deviation levels of fraud is still challenging. In this study, we have explored
and reviewed the business processes in credit applications that contained low and middle
deviation levels of fraud. Originator behavior and deviation value were utilized to decide
the weight of the PBF attributes, while MADM was used to establish the PBF rating. The
experiments showed that the proposed method with behavior model can lower the number
of false positives and attain a higher accuracy (0.01) than without behavior model.
References
[1] E. W. T. Ngai, Y. Hu, Y. H. Wong, Y. Chen and X. Sun, “The Application of Data Mining Techniques
in Financial Fraud Detection: A Classification Framework and an Academic Review of Literature”,
Decision Support Systems, vol. 50, no. 3, (2010), pp. 559-569.
[2] I. Amara, A. B. Amar and A. Jarboui, “Detection of Fraud in Financial Statements: French Companies
as a Case Study”, International Journal of Academic Research in Accounting, Finance and Management
Sciences, vol. 3, no. 3, (2013), pp. 44-55.
[3] M. Jans, M. J. van der Werf, N. Lybaert and K. Vanhoof, “A Business Process Mining Application for
Internal Transaction Fraud Mitigation”, Expert Systems with Applications, vol. 38, no. 10, (2011), pp.
13351-13359.
[4] D. R. Kalyani and D. U. Devi, “Fraud Detection of Credit Payment System by Genetic Algorithm”,
International Journal of Scientific & Engineering Research, vol. 3, no. 7, (2012), pp. 1-6.
[5] S. Panigrahi, A. Kundu, S. Sural, and A.K. Majumdar, “Credit Card Fraud Detection: A Fusion
Approach Using Dempster-Shafer Theory and Bayesian Learning”, Information Fusion, vol. 10, no. 4,
(2009), pp. 354-363.
[6] V. Zaslavsky and A. Strizhak, “Credit Card Fraud Detection Using Self-Organizing Maps”, Information
& Security, vol. 18, (2006), pp. 48-63.
[7] A. Shen, R. Tong and Y. Deng, “Application of Classification Models on Credit Card Fraud Detection”,
Proceedings of 2007 International Conference on Service System and Service Management, IEEE,
Chengdu, China,( 2007) June 9-11.
[8] C. Chiu and C. Y. Tsai, “A Web Services-Based collaborative Scheme for Credit Card Fraud
Detection”, Proceedings of 2004 IEEE International Conference on e-Technology, e-Commerce and e-
Service (EEE '04), IEEE, Taipei, Taiwan, (2004) March 29-31.
[9] M. Chae, S. Shime, H. Cho and B. Lee, “An Empirical Analysis of Fraud Detection in Online Auctions:
Credit Card Phantom Transaction”, Proceedings of the 40th Annual Hawaii International Conference on
System Sciences, IEEE, Waikoloa, USA, (2007) January 3-6.
International Journal of Software Engineering and Its Applications
Vol. 10, No. 5 (2016)
186 Copyright ⓒ 2016 SERSC
[10] J. J. Stoop, “Process Mining and Fraud Detection”, Thesis, Business Information Technology
Department, Twente University, Enschede, Netherlands, 2012.
[11] S. Huda, R. Sarno, T. Ahmad, H. A. Santosa, “Identification of Process-based Fraud Paterns in Credit
Application”, 2 nd International Conference on Information and Communication Technology (ICoICT),
(2014) June 28-29.
[12] R. Sarno, D. R. Dewandono, T. Ahmad, M. F. Naufal and F. Sinaga, “Hybrid Association Rule
Learning and Process Mining for Fraud Detection”, IAENG International Journal of Computer Science,
vol. 42, no. 2, (2015), pp. 59-72.
[13] S. Huda, R. Sarno and T. Ahmad, “Fuzzy MADM approach for Rating of Process-based Fraud”, Journal
ICT. Research Application, vol. 9, no. 2, (2015), pp. 111-128.
[14] R. Sarno, A.B. Sanjoyo, I. Mukhlash and M.H. Astuti, “Petri Net Model of ERP Business Process
Variations for Small and Medium Enterprises”, Journal of Theoretical and Applied Information
Technology, vol. 54, no. 1, (2013), pp. 31-38.
[15] R. Sarno, and C. A. Djeni, “Developing a Workflow Management System For Enterprise Resource
Planning”, Journal of Theoretical and Applied Information Technology, vol. 72, no. 3, (2015), pp. 412-
421.
[16] R. Sarno, P. L. I. Sari, H. Ginardi, D. Sunaryono , I. Mukhlash, “Decision Mining For Multi Choice
Workflow Patterns”, International conference on Computer, Control, and Its Application, (2013)
November 19-21.
[17] M. Jans, M. Alles and M. Vasarhelyi, “The Case for Process Mining in Auditing: Sources of Value
Added and Areas of Application”, International Journal of Accounting Information Systems, vol. 14 no.
1, (2013), pp. 1-20.
[18] W. M. P. van der Aalst, “Discovery, Conformance and Enhancement of Business Processes”, Springer,
pp. 7-8, (2010).
[19] W. M. P. van der Aalst and A. K. A. de Medeiros, “Process Mining and Security: Detecting Anomalous
Process Executions and Checking Process Conformance”, Electronic Notes in Theoretical Computer
Science.,vol. 121, (2005), pp. 3-21.
[20] R. Accorsi and T. Stocker, “On the Exploitation of Process Mining for Security Audits: The
Conformance Checking Case”, Proceedings of the 28th Annual ACM Symposium on Applied
Computing, Riva del Garda Congress, Trento, Italy, (2012) March 18-22.
[21] A. Bandura and D. Cervone, “Self-evaluative and Self-efficacy Mechanisms Governing the
Motivational Effects of Goal Systems”, Journal of Personality and Social Psychology, vol. 45, no. 5,
(1983), pp. 1017-1028.
[22] W. M. P. van der Aalst, H.A. Reijers and M. Song, “Discovering Social Networks from Event Logs”,
Computer Supported Cooperative Work, vol. 14, (2005), pp. 549-593.
[23] F. Sinaga and R. Sarno, “Business Process Anomaly Detection Using Multi-Level Class Association
Rule Learning”, 1st International Seminar on Science and Technology, F407-1-F407-2, (2015) August 5.
Author
Solichul Huda was born in Kudus, Indonesia. His current research
focuses on process mining for fraud detection. At present, he is a
student in the doctoral program of Computer Science, Department of
Informatics, Faculty of Information Technology, Institut Teknologi
Sepuluh Nopember (ITS) in Surabaya, Indonesia. He is a lecturer at
the in Computer Science Faculty of the Universitas Dian Nuswantoro
in Semarang.
Riyanarto Sarno was born in Surabaya, Indonesia. He is a
professor at Department of Informatics, Faculty of Information
Technology, Institut Teknologi Sepuluh Nopember in Surabaya,
Indonesia. His research focuses on Internet of Things, Business
Process Management, Process Aware Information Systems, and
Knowledge Engineering.

International Journal of Software Engineering and Its Applications
Vol. 10, No. 5 (2016)
Copyright ⓒ 2016 SERSC 187
Tohari Ahmad is a co-promoter at the doctoral program of
Computer Science, Department of Informatics, Institut Teknologi
Sepuluh Nopember in Surabaya, Indonesia. His research is focused
on net computing. He is a lecturer at the Department of Informatics,
Faculty of Information Technology, Institut Teknologi Sepuluh
Nopember (ITS ) in Surabaya, Indonesia.

International Journal of Software Engineering and Its Applications
Vol. 10, No. 5 (2016)
188 Copyright ⓒ 2016 SERSC


![Increasing Accuracy of Process-based Fraud Detection Using ......business processes can be detected by process mining. In [10], tools for implementation of PBF detection are proposed](https://img.pdfslide.us/doc/110x75/5fb631c3fe2822508c7c180a/increasing-accuracy-of-process-based-fraud-detection-using-business-processes.jpg)