Embed Size (px)
Citation preview
RESEARCH Open Access
Increased ANGPTL3, 4 and ANGPTL8/betatrophin expression levels in obesityand T2DMohamed Abu-Farha1* , Irina Al-Khairi1, Preethi Cherian1, Betty Chandy2, Devarajan Sriraman2, Asma Alhubail3,Faisal Al-Refaei3, Abdulmohsen AlTerki3 and Jehad Abubaker1*
Abstract
Background: Hypertriglyceridemia is associated with increased risk for cardiovascular diseases and type 2 diabetes(T2D). Angiopoietin like proteins particularly 3, 4 and recently 8 are well established regulators of plasma triglyceridelevel through regulating the activity of lipoprotein lipase. Plasma level and association between ANGPTL3, 4 and 8is not well established in human subjects. This study was designed to establish the level of these proteins in plasmaand adipose tissues and investigate the association between ANGPTL8 with ANGPTL3 and 4 in T2D and non-diabetics subjects.
Methods: A total of 235 subjects were enrolled in this study, 144 non-diabetics and 91 T2D. ANGPTL 3, 4 and 8 levelswere measured in plasma by ELISA and using real time RT-PCR in adipose tissues.
Results: In this study, we showed that ANGPTL3, 4 and 8 were higher in T2D subjects. Dividing the non-diabeticsubjects according to their BMI showed higher level of ANGPTL3, 4 and 8 in obese subjects compared to non-obesesubjects. No significant difference was observed between the T2D subjects. ANGPTL8 was showed positive correlationwith ANGPTL3 in the non-diabetic subjects in the non-obese (r = 0.2437, p-Value = 0.0543) and obese subjects(r = 0.418, p-Value = 0.0125). No association was observed in the T2D subjects. On the other hand, ANGPTL4was positively associated with the obese subjects in both the non-diabetics (r = 0.3322, p-Value = 0.0316) andthe obese T2D subjects (r = 0.3161, p-Value = 0.0211).
Conclusion: In conclusion, our data shows that ANGPTL3, 4 and 8 are increased in obesity and T2D. ANGPTL8associates with ANGPTL3 in the non-diabetic subjects while it associated more with ANGPTL4 in the obese andT2D subjects. Taken together, this data highlight the role of these proteins in metabolic diseases and how theyinteract with each other’s under different physiological and pathophysiological conditions.
BackgroundHypertriglyceridemia has been linked to increased inci-dents of cardiovascular disease and Type 2 diabetes(T2D) [1, 2]. Triglycerides (TG) are essential to humanlife as they provide energy and store excess energy in thebody [3, 4]. They circulate in blood as lipoprotein mole-cules such as chylomicrons that are formed from dietaryTG or VLDL, which are produced by the liver underfasting state [5, 6]. Chylomicrons and VLDL mediate the
transfer of TG to various tissues for storage or oxidationto produce energy [3, 4]. The key enzyme involved inthe breakdown of TG to generate free fatty acids (FFA)is lipoprotein lipase (LPL) [7, 8]. LPL activity regulatesTG clearance and its availability for other tissues such asheart and muscle. LPL hyperactivity has been associatedwith decreased plasma TG level and decreased cardio-vascular risks while its loss of function resulted in severehypertriglyceridemia [7, 8]. As a result its cellular func-tion is tightly regulated to accommodate the need ofvarious tissues for TG and to maintain physiological TGblood level [7, 8].One of the key regulators of LPL are members of
the angiopoietin-like protein (ANGPTL) family mainly
* Correspondence: [email protected];[email protected]; [email protected] and Molecular Biology Unit, Dasman Diabetes Institute,P.O. Box 1180, Dasman 15462, KuwaitFull list of author information is available at the end of the article
© 2016 The Author(s). Open Access This article is distributed under the terms of the Creative Commons Attribution 4.0International License (http://creativecommons.org/licenses/by/4.0/), which permits unrestricted use, distribution, andreproduction in any medium, provided you give appropriate credit to the original author(s) and the source, provide a link tothe Creative Commons license, and indicate if changes were made. The Creative Commons Public Domain Dedication waiver(http://creativecommons.org/publicdomain/zero/1.0/) applies to the data made available in this article, unless otherwise stated.
Abu-Farha et al. Lipids in Health and Disease (2016) 15:181 DOI 10.1186/s12944-016-0337-x

ANGPTL3, 4 and 8 [7, 8]. Seven members have been trad-itionally assigned to the ANGPTL family due to their simi-larity to angiopoietin proteins [9, 10]. All members haveN-terminal coiled-coil domain as well as a carboxyl-terminal fibrinogen-like domain, except the recently addedANGPTL8 family member which lacks the fibrinogen-likedomain [9–12]. The role of ANGPTL3 and 4 in regulatingLPL activity has been well established. ANGPTL3 isproduced by the liver then it is proteolytically cleaved byproprotein convertases to generate an active N-terminaldomain that acts as an inhibitor of LPL activity [12, 13].One study showed that loss of function mutations identi-fied in ANGPTL3 associated with decreased VLDL, LDL,HDL and TG [14]. This was also linked to a recessivedisorder disease termed familial combined hypobetali-poproteinemia [14, 15]. ANGPTL4 is another potentinhibitor of LPL activity that is induced in the fastingstate by the PPAR (peroxisome proliferator-activatedreceptor) transcription factor [7]. Similar to ANGPTL3,the N-terminal domain of ANGPTL4 is cleaved by pro-protein convertases and act as an inhibitor of LPL activity[7]. The inhibition of LPL activity occurs through the dir-ect binding of the cleaved ANGPTL4 to LPL protein,which in turn inhibits its dimerization rendering the LPLenzyme inactive [8, 16]. Recent data has also linked loss offunction mutations in ANGPTL4 to reduced incidences ofCoronary heart disease [17, 18]. Due to their role inregulating LPL activity and the fact that many genomewide association studies has linked them to dyslipid-emia, ANGPTL3 and 4 are being explored as drug tar-gets for metabolic diseases [16]. Specific monoclonalantibodies targeting ANGPTL3 and 4 has been shownto decrease plasma lipid content [16].ANGPTL8 on the other hand has been shown to regulate
LPL activity through its interaction with the N-terminal do-main of ANGPTL3, which facilitates its cleavage [12, 19].ANGPTL8 is mainly expressed in the liver, white adiposetissue as well as brown adipose tissue [12, 19–21]. It hasbeen initially shown to be induced by feeding and reducedby fasting [20, 21]. Similar to ANGPTL3 and 4, sequencevariation in ANGPTL8 has been associated with decreasedLDL and HDL lipid profile [12]. Quagliarini et al. showedthat rs2278426, which represents a non-synonymous aminoacid change from Arginine (R) to tryptophan (W) at aminoacid 59, was associated with lower LDL-C and HDL-C invarious ethnic groups [12]. We have also showed that thisvariant was associated with higher plasma glucose in Arabs[12]. Collectively, ANGPTL3, 4 and 8 are shown to play animportant role in the regulation of LPL activity. Therefore,further research on the collective role of these three pro-teins in humans is critical to enhance our understanding oflipid metabolism. As a result we designed this study toinvestigate the possible changes in the expression levelsin circulation and adipose tissue in both diabetic and
non-diabetic subjects. In addition, we investigated thepossible association between ANGPTL8 and ANGPTL3and 4 in this population to better understand theirphysiological role.
MethodsStudy population and ethical statementIn the present study, a total of 144 non-diabetics and 91T2D subjects were recruited at Dasman Diabetes Institute.Based on the Body Mass Index (BMI) the non-diabeticsubjects were split into a total of 82 non-obese subjects(19.5 and ≤ BMI < 30 kg/m2) and 62 obese subjects (30 ≤BMI < 40 kg/m2). On the other hand, 27 T2D subjectswere classified as non-obese and 64 were obese. The for-mula used to calculate BMI is the standard BMI formula:body weight (in kilograms)/height (in meters squared). Allsubjects signed a written informed consent before theirparticipation in the study, which was approved by theEthical Review Board of Dasman Diabetes Institute andabiding with the guideline ethical declaration of Helsinki.Morbidly obese subjects (BMI >40 kg/m2) as well as sub-jects with prior major illness or taking any medicationand/or supplement known to influence the body compos-ition or bone mass were excluded from the study [22].
Blood collection, anthropometric and biochemicalmeasurementsBlood samples were collected in vacutainer EDTA tubesthat were centrifuged to collect plasma samples which inturn were aliquoted and stored at −80 °C until assayedas described previously [22–24]. Subcutaneous adiposetissue (SAT) biopsies were obtained from the periumbilicalarea by surgical biopsy after a local anaesthesia as de-scribed previously [22]. Following the surgical extractionof SAT tissues they were rinsed in cold PBS and stored at−80 °C in Allprep until assayed.The anthropometric and biochemical measurements
were collected as follows: an average of three blood pres-sure readings measured using an Omron HEM-907XLDigital sphygmomanometer were taken with a 5–10 minrest between each reading. Whole-body composition wasdetermined by dual-energy radiographic absorptiometrydevice (Lunar DPX, Lunar radiation, Madison, WI). Fastingblood Glucose (FBG) triglyceride (TG), total cholesterol(TC), low density lipoprotein (LDL) and high density lipo-protein (HDL) were measured on the Siemens DimensionRXL chemistry analyzer (Diamond Diagnostics, Holliston,MA). Glycated hemoglobin (HbA1C) was determined usingthe VariantTM device (BioRad, Hercules, CA).
ANGPTL8 ELISAANGPTL8 level was measured in plasma as describedpreviously [23, 25, 26]. Plasma samples were thawed onice and centrifuged at 10000xg for 5 min at 4 °C to
Abu-Farha et al. Lipids in Health and Disease (2016) 15:181 Page 2 of 9

remove any debris as described previously [22–24]. Re-peated freeze thaw cycles were avoided. ANGPTL8 levelwas determined using the ELISA kit from Wuhan EIAABScience co (catalogue number E1164H) as described previ-ously [23, 25, 26]. No significant cross reactivity with otherproteins was observed. Intra-assay coefficients of variation(CV) were 2.1 to 4.6 %, while the inter-assay coefficientsof variation were 7.3 to 9.6 %.
ANGPTL3 and 4 ELISAPlasma levels of ANGPTL3 and 4 were assessed usingthe multiplexing immunobead array platform accord-ing to the manufacturer instructions (R & D systems).The data was processed using the Bio-Plex managersoftware version 6 (Bio-Rad) using five-parametriccurve fitting. Intra plate CV ranged from 7.0 to 12 %,while inter plate CV was <14 %. Samples were mea-sured using reagents from the same lot to avoid lot- tolot variations.
Measurement of gene expression by quantitative RealTime-PCR (qRT-PCR)Total RNA was extracted from frozen SAT tissues usingRNeasy Lipid Tissue Mini Kit according to manufac-turer’s protocol (Qiagen, Inc., Valencia, CA). Total RNAwas isolated from adipose tissue biopsies of obese non-diabetic (n = 8) and obese diabetic (n = 8). The cDNA wasprepared from total RNA sample using High CapacitycDNA Reverse Transcription Kits (Applied Biosystems,Foster City, CA). QRT-PCR was performed on Rotor-Disc100 system using SYBR Green normalized to Gapdh (Qia-gen, Inc., Valencia, CA). The following primer sequenceswere used for gene expression quantification: ANGPTL3forward: TCTCCAGAGCCAAAATCAAGAT and Reverse:TTTCACTGGTTTGCAGCGAT. ANGPTL4 forward: CAGTCCTCGCACCTGGAA and reverse: GCCAGGACATTCATCTCGTC. ANGPTL8 forward: AATCTGCCTGGATGGAACTG and reverse: CTGCGTCTGTCTCTGCTCTG.GAPDH forward: AACTTTGGCATTGTGGAAGG-3′and reverse: TGTGAGGGAGATGCTCAGTG. Relativeexpression was assessed by using the ΔΔCT method [27].
Statistical analysisComparisons between non-obese and obese subjectswere made by Student’s t-test. Spearman’s correlationcoefficients were estimated to determine associations ofANGPTL8 with ANGPTL3 and/or 4. All data are re-ported as mean ± standard deviations. Statistical assess-ments were two-sided and considered to be significantwhen p-Value < 0.05. All analyses were performed usingSAS (version 9.2; SAS Institute).
ResultsStudy population characteristicsClinical and biochemical characteristics of the non-diabetics and T2D subjects are shown in Table 1. Ourpopulation was made of 235 subjects divided into 144non-diabetic and 91 T2D subjects. The average age ofthe non-diabetic subjects was 41.76 ± 11.81 years whilethe average age of T2D subjects were 52.89 ± 9.32 years.T2D subjects had significantly higher BMI, percent bodyfat, TG, TC, HDL, FBG, and HbA1C (p-Value < 0.05)(Table 1). T2D subjects had significantly higher level ofANGPTL8 (2520.14 ± 155.31 pg/ml) compared to thenon-diabetics (936.78 ± 55.43 pg/ml, p-Value < 0.001).ANGPTL4 was also higher in T2D subjects (203.78 ±11.68 ng/ml compared to 144.47 ± 4.47 ng/ml for thenon-diabetics) (p-Value < 0.001). A similar trend was alsoobserved for ANGPTL3 in T2D 69.17 ± 3.07 ng/ml and62.39 ± 1.89 ng/ml for the non-diabetics (p-Value = 0.06)Table 1.
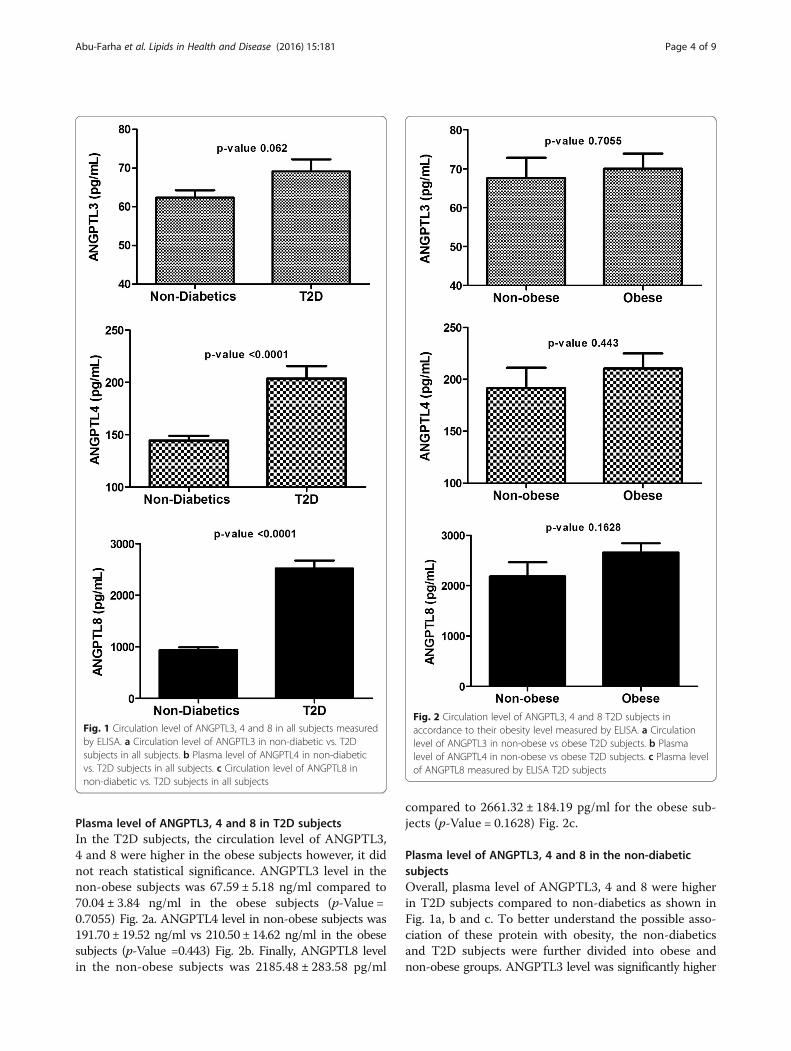
Plasma level of ANGPTL3, 4 and 8 in the wholepopulationPlasma level of all markers was examined between non-diabetic and T2D subjects. Overall, plasma level ofANGPTL3, 4 and 8 was higher in the T2D subjects.ANGPTL3 plasma level in the non-diabetic subjects was62.39 ± 1.89 ng/mL compared to 69.17 ± 3.07 in the T2Dsubjects (p-Value = 0.062) Fig. 1a. ANGPTL4 plasmalevel was 144.47 ± 4.47 ng/mL in the non-diabetic subjectsvs 203.78 ± 11.68 ng/mL in the T2D subjects (p-Value<0.0001) Fig. 1b. Finally, ANGPTL8 level was also higherin the T2D subjects 2520.14 ± 155.31 pg/mL comparedto 936.78 ± 55.43 pg/mL in the non-diabetic subjects(p-Value <0.0001) Fig. 1c.
Table 1 Characteristics of the non-diabetic and diabetic subjectsincluded in this study
Variable Average ± SDNon-DiabeticsN = 144
Average ± SDT2DN = 91
P-Value
Age (years) 41.76 ± 11.81 52.89 ± 9.32 <0.000
BMI (kg/m2) 29.06 ± 5.87 31.64 ± 4.30 <0.000
Percent Body Fat 34.56 ± 6.68 36.27 ± 5.56 0.023
TC (mmol/L) 5.07 ± 0.93 4.94 ± 1.29 0.282
HDL (mmol/L) 1.27 ± 0.38 1.19 ± 0.46 0.087
LDL (mmol/L) 3.20 ± 0.86 3.02 ± 1.26 0.110
TG (mmol/L) 1.29 ± 0.90 1.87 ± 2.18 0.003
FBG (mmol/L) 5.32 ± 1.01 8.64 ± 3.31 <0.000
HbA1C (DCCT%) 5.67 ± 0.85 7.98 ± 1.85 <0.000
ANGPTL8 pg/ml 936.78 ± 55.43 2520.14 ± 155.31 <0.000
ANGPTL4 ng/ml 144.47 ± 4.47 203.78 ± 11.68 <0.000
ANGPTL3 ng/ml 62.39 ± 1.89 69.17 ± 3.07 0.062
Abu-Farha et al. Lipids in Health and Disease (2016) 15:181 Page 3 of 9
Plasma level of ANGPTL3, 4 and 8 in T2D subjectsIn the T2D subjects, the circulation level of ANGPTL3,4 and 8 were higher in the obese subjects however, it didnot reach statistical significance. ANGPTL3 level in thenon-obese subjects was 67.59 ± 5.18 ng/ml compared to70.04 ± 3.84 ng/ml in the obese subjects (p-Value =0.7055) Fig. 2a. ANGPTL4 level in non-obese subjects was191.70 ± 19.52 ng/ml vs 210.50 ± 14.62 ng/ml in the obesesubjects (p-Value =0.443) Fig. 2b. Finally, ANGPTL8 levelin the non-obese subjects was 2185.48 ± 283.58 pg/ml
compared to 2661.32 ± 184.19 pg/ml for the obese sub-jects (p-Value = 0.1628) Fig. 2c.
Plasma level of ANGPTL3, 4 and 8 in the non-diabeticsubjectsOverall, plasma level of ANGPTL3, 4 and 8 were higherin T2D subjects compared to non-diabetics as shown inFig. 1a, b and c. To better understand the possible asso-ciation of these protein with obesity, the non-diabeticsand T2D subjects were further divided into obese andnon-obese groups. ANGPTL3 level was significantly higher
Fig. 1 Circulation level of ANGPTL3, 4 and 8 in all subjects measuredby ELISA. a Circulation level of ANGPTL3 in non-diabetic vs. T2Dsubjects in all subjects. b Plasma level of ANGPTL4 in non-diabeticvs. T2D subjects in all subjects. c Circulation level of ANGPTL8 innon-diabetic vs. T2D subjects in all subjects
Fig. 2 Circulation level of ANGPTL3, 4 and 8 T2D subjects inaccordance to their obesity level measured by ELISA. a Circulationlevel of ANGPTL3 in non-obese vs obese T2D subjects. b Plasmalevel of ANGPTL4 in non-obese vs obese T2D subjects. c Plasma levelof ANGPTL8 measured by ELISA T2D subjects
Abu-Farha et al. Lipids in Health and Disease (2016) 15:181 Page 4 of 9
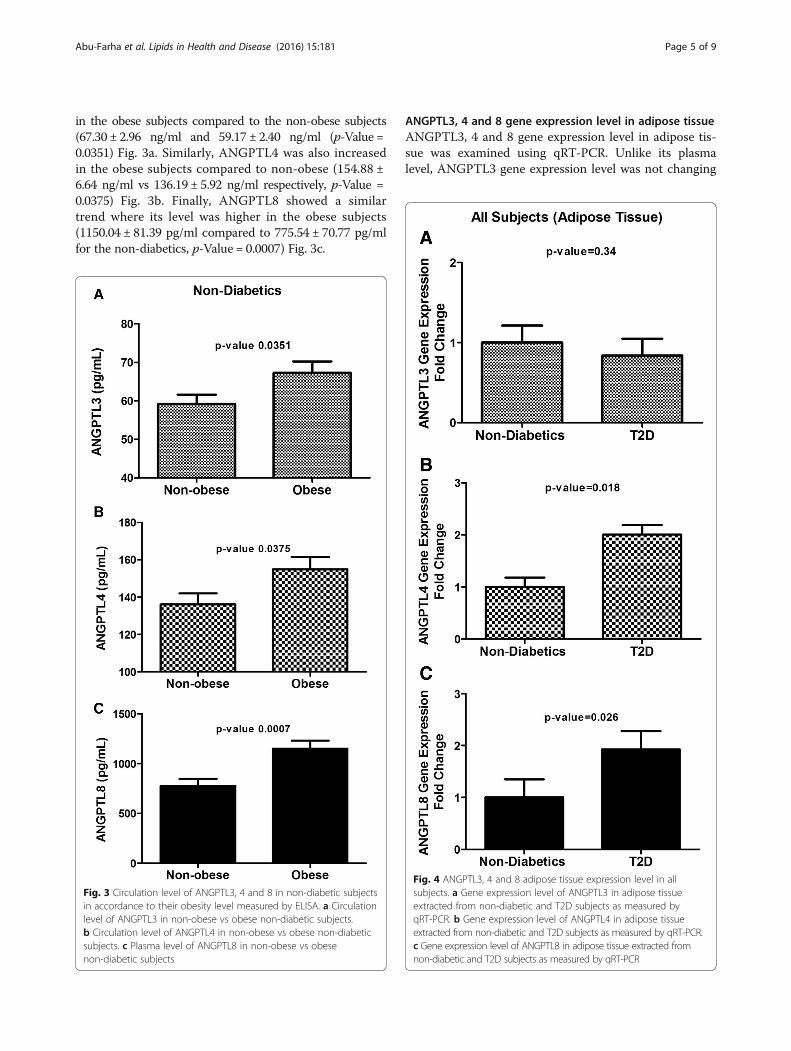
in the obese subjects compared to the non-obese subjects(67.30 ± 2.96 ng/ml and 59.17 ± 2.40 ng/ml (p-Value =0.0351) Fig. 3a. Similarly, ANGPTL4 was also increasedin the obese subjects compared to non-obese (154.88 ±6.64 ng/ml vs 136.19 ± 5.92 ng/ml respectively, p-Value =0.0375) Fig. 3b. Finally, ANGPTL8 showed a similartrend where its level was higher in the obese subjects(1150.04 ± 81.39 pg/ml compared to 775.54 ± 70.77 pg/mlfor the non-diabetics, p-Value = 0.0007) Fig. 3c.
ANGPTL3, 4 and 8 gene expression level in adipose tissueANGPTL3, 4 and 8 gene expression level in adipose tis-sue was examined using qRT-PCR. Unlike its plasmalevel, ANGPTL3 gene expression level was not changing
Fig. 3 Circulation level of ANGPTL3, 4 and 8 in non-diabetic subjectsin accordance to their obesity level measured by ELISA. a Circulationlevel of ANGPTL3 in non-obese vs obese non-diabetic subjects.b Circulation level of ANGPTL4 in non-obese vs obese non-diabeticsubjects. c Plasma level of ANGPTL8 in non-obese vs obesenon-diabetic subjects
Fig. 4 ANGPTL3, 4 and 8 adipose tissue expression level in allsubjects. a Gene expression level of ANGPTL3 in adipose tissueextracted from non-diabetic and T2D subjects as measured byqRT-PCR. b Gene expression level of ANGPTL4 in adipose tissueextracted from non-diabetic and T2D subjects as measured by qRT-PCR.c Gene expression level of ANGPTL8 in adipose tissue extracted fromnon-diabetic and T2D subjects as measured by qRT-PCR
Abu-Farha et al. Lipids in Health and Disease (2016) 15:181 Page 5 of 9

in the adipose tissue extracted from either T2D or non-diabetic subjects (p-Value = 0.356) Fig. 4a. However,ANGPTL4 level showed a two fold increase in T2D sub-jects compared to the non-diabetic subjects as shown inFig. 4b (p-Value = 0.018). Similarly, ANGPTL8 showedaround two fold increases in its gene expression level inthe T2D subjects compared to the non-diabetic subjectsas shown in Fig. 4c (p-Value = 0.026).
Correlation between ANGPTL8 and ANGPTL3Spearman’s correlation showed that ANGPTL8 associatedwith ANGPTL3 in the non-diabetics subjects. It showedsignificant association in the non-obese (r = 0.2437,p-Value = 0.0543). However, a stronger correlation was ob-served between ANGPTL8 and ANGPTL3 in the obesesubjects (r = 0.418, p-Value = 0.0125), Fig. 5. On the otherhand no association was observed between ANGPTL8and ANGPTL3 in the T2D subjects for both obese(r = −0.1431, p-Value = 0.3733) and non-obese groups(r = −0.200, p-Value = 0.3488) as shown in Fig. 5.
Correlation between ANGPTL8 and ANGPTL4Unlike ANGPTL3, Spearman’s correlation showed noassociation between ANGPTL8 and ANGPTL4 in thenon-diabetics non-obese subjects (r = 0.0997, p-Value =0.4186) as well as the non-obese T2D subjects (r = 0.3156,p-Value = 0.1088) Fig. 6. Nonetheless, it was significantlyassociated with ANGPTL4 in both obese non-diabetics(r = 0.3322, p-Value = 0.0316) and obese T2D subjects(r = 0.3161, p-Value = 0.0211) as shown in Fig. 6.
DiscussionIn order to investigate the relationship between ANGPTL3,4 and 8, we measured their expression level in plasma andadipose tissue in T2D and non-diabetic subjects in thewhole population as well as in obese and non-obese sub-jects. Overall, plasma level of ANGPTL 3, 4 and 8 were in-creased in subjects with T2D compared to non-diabeticsubjects. Similarly, Obese/non-diabetic subjects showeda significant increase in the plasma expression level ofANGPTL3, 4 and 8 compared to non-obese subjects.
Fig. 5 Spearman’s correlation between ANGPTL8 and ANGPTL3 in both non-diabetic and diabetic subjects divided into non-obese and obesesubjects according to their BMI
Abu-Farha et al. Lipids in Health and Disease (2016) 15:181 Page 6 of 9

On the other hand, no significant difference was ob-served between the plasma protein levels in obese andnon-obese T2D subjects. Similar to the protein level incirculation, adipose tissue ANGPTL4 and 8 gene expres-sion level showed a two fold increase in T2D subject com-pared to non-diabetics. However, gene expression level ofANGPTL3 was not affected. ANGPTL8 showed sig-nificant correlation with ANGPTL3 in both obese andnon-obese groups in the non-diabetic subjects. ANGPTL4on the other hand correlated positively with ANGPTL8only in the obese subjects from both T2D and non-diabetic subject groups.The hydrophobic nature of lipids prevent them from
circulating freely in blood unless emulsified by proteinsforming lipoprotein complexes that circulate the bloodstream to function as a source of energy, structuralblocks and singling molecules [9, 28–30]. TG is an es-sential lipid molecule that is used to provide energy forthe body [9]. It exists in circulation in the form of chylomi-crons and very low density lipoprotein (VLDL). Chylomi-crons are formed, after eating, in the villi of the duodenum
and secreted in the blood stream while VLDL are formed,in the fasting state, by the liver and released in blood stream[3, 31]. LPL is a key enzyme in the hydrolysis of these lipo-proteins as well as the uptake of free fatty acids into varioustissues [9, 32, 33]. Due to the important role of this enzymein regulating lipoprotein metabolism and tissue specificutilization of lipids, its activity is carefully regulated in boththe fasting and the fed state by various interacting proteinssuch as members of the ANGPTL protein family [7–9, 16].In the fasting state ANGPTL4 expression is inducedthrough the action of the PPAR gamma transcription factorthat is induced by fatty acids released from TG hydrolysis[7]. During the fasting condition LPL activity is inhibited inwhite adipose tissue and activated in cardiac and skeletalmuscles to increase TG hydrolysis in these tissues [16].Similarly, ANGPTL3 and 8 play a critical role in regulatingthe TG plasma level particularly under feeding condition;where more of the TG is directed toward the adipose tissuefor storage [16]. Their inhibition of LPL activity occurs as aresult of their interaction. Studies however have shown thatunlike ANGPTL4 and 8, ANGPTL3 is not nutritionally
Fig. 6 Spearman’s correlation between ANGPTL8 and ANGPTL4 in both non-diabetic and diabetic subjects divided into non-obese and obesesubjects according to their BMI
Abu-Farha et al. Lipids in Health and Disease (2016) 15:181 Page 7 of 9

regulated [12]. Therefore, it has been suggested thatANGPTL3 activity is rather regulated through ANGPTL8that is in turn regulated by nutrition [12]. Our data showsthat the three ANGPTL proteins studied are increased inobesity, highlighting the possibility that these proteinsmight be involved and perhaps responsible for the in-creased TG plasma levels in obese and T2D subjects. Fur-ther follow up studies into their mechanism of action areought to uncover their pathophysiological role in thesediseases.Due to their role in regulating plasma lipid content
and nutrient sensing, therapeutic modulation of the ac-tivity of ANGPTL3, 4 and 8 is currently under consider-able investigation as potential targets in the treatment ofdyslipidemia [7–9]. For example, monoclonal antibodiestargeting ANGPTL4 have been used in animal modelsand resulted in reduced TG level as well as higher LPLactivity [7]. Similarly ANGPTL3 specific antibodies wereresponsible for reduced plasma TG in both mice andmonkeys [34–36]. A recent study, by Fu et al. showedthat targeting ANGPTL8 using monoclonal antibodiesin mice resulted in reduced TG level and reduced LPLactivity in both heart and skeletal muscles but not inwhite adipose tissue [37]. Our data further highlights thepotential differential interaction between ANGPTL8with ANGPTL3 and 4. This provides more knowledgeabout their role and how they are affected by variousmetabolic diseases leading to better understanding oftheir biological significance as well as improving theirdrug targeting abilities. Our findings that ANGPTL4 and8 positively associate with each other may be contradict-ory as they are induced at different nutritional states;fasting and feeding respectively. However, this could bepartially explained by a recent model based on animaldata proposed by Zhang called ANGPTL3-4-8 model[16]. In this model, it’s proposed that these three pro-teins regulate LPL in a tissue specific manner accordingto the feeding status. In this model, it has been sug-gested that ANGPTL4 is induced in the fasting state toinhibit LPL in WAT directing TG to cardiac and skeletalmuscles [16]. Whereas; during feeding, ANGPTL8 is in-duced, which acts through the interaction with ANGPTL3to inhibit LPL activity in cardiac and skeletal musclesdirecting TG to adipose tissues for storage.One of the main limitations of this study is the cross
sectional design, which does not allow us to establishthe biological role of the studied proteins in the develop-ment of diabetes. However, due to their well-knownfunction in lipid regulation, it is assumed that their in-crease in obesity will lead to dyslipidemia that will con-tribute to the increased insulin resistance and eventuallylead to the development of metabolic diseases like T2D.Another limitation was the use of gene expression datafrom adipose tissue. It would have been more appropriate
to study the protein expression instead of the gene expres-sion, but due to the scarcity of the adipose tissues thatwere extracted from volunteers, only gene expression waspossible.
ConclusionsIn conclusion, we have comprehensively investigated theassociation between ANGPTL3, 4 and 8 in obesity andT2D in plasma and adipose tissue showing for the firsttime that ANGPTL 4 and 8 are increased in humansubjects with T2D compared to non-diabetic subjects.ANGPTL3 on the other hand was only increased in cir-culation but not adipose tissues. Obese subjects hadhigher level of ANGPTL3, 4 and 8 compared to non-obesein the non-diabetic subjects. However, their expression inT2D subjects was not affected by obesity. ANGPTL3 wasassociated with ANGPTL8 in the non-diabetic subjects,whereas, ANGPTL4 was associated with ANGPTL8 in theobese subjects regardless of their diabetes status. Finally,ANGPTL3, 4 and 8 are impotent regulators of lipidmetabolism and they offer potential therapeutic targetsfor lowering level of plasma lipids.
Acknowledgements“Not applicable”.
FundingThis work was funded by Kuwait Foundation for the Advancement ofSciences (KFAS) for financial support of this research project (RA-2011-03 andRA-2014-021). The funding agency was not involved in data collection,analysis, or interpretation; trial design; patient recruitment; or any aspectpertinent to the study. The corresponding authors had full access to all thedata in the study and it’s available upon request.
Availability of data and materialData will only be shared upon request from the corresponding authors dueto unpublished data and ethical restriction by the institute.
Authors’ contributionsMA: Study design, data interpretation, directed the laboratory investigationand wrote the manuscript. IA & PC: Performed the ELISA assay. BC: Bloodprocessing. DS: Data analysis and management. AA & FA: Clinical datahandling and collection. AAL: Data interpretation and critically revisedmanuscript. JA: Study design, data interpretation and critically revised themanuscript. All authors read and approved the final manuscript.
Competing interestsThe authors declare that they have no competing interests.
Consent for publication“Not applicable”.
Ethics approval and consent to participateAll subjects signed a written informed consent before their participation inthe study, which was approved by the Ethical Review Board of DasmanDiabetes Institute (number RA-2011-03) and abiding with the guidelineethical declaration of Helsinki.
Author details1Biochemistry and Molecular Biology Unit, Dasman Diabetes Institute,P.O. Box 1180, Dasman 15462, Kuwait. 2Tissue Banking Unit, DasmanDiabetes Institute, Kuwait City, Kuwait. 3Clinical Services Department, DasmanDiabetes Institute, Kuwait City, Kuwait.
Abu-Farha et al. Lipids in Health and Disease (2016) 15:181 Page 8 of 9

Received: 10 August 2016 Accepted: 17 September 2016
References1. Mooradian AD. Dyslipidemia in type 2 diabetes mellitus. Nat Clin Pract
Endocrinol Metab. 2009;5:150–9.2. Sacks FM, Hermans MP, Fioretto P, Valensi P, Davis T, Horton E, Wanner C,
Al-Rubeaan K, Aronson R, Barzon I, et al. Association between plasmatriglycerides and high-density lipoprotein cholesterol and microvascularkidney disease and retinopathy in type 2 diabetes mellitus: a globalcase–control study in 13 countries. Circulation. 2014;129:999–1008.
3. Kindel T, Lee DM, Tso P. The mechanism of the formation and secretion ofchylomicrons. Atheroscler Suppl. 2010;11:11–6.
4. Ramasamy I. Recent advances in physiological lipoprotein metabolism. ClinChem Lab Med. 2014;52:1695–727.
5. Sprong H, van der Sluijs P, van Meer G. How proteins move lipids and lipidsmove proteins. Nat Rev Mol Cell Biol. 2001;2:504–13.
6. Hegele RA. Plasma lipoproteins: genetic influences and clinical implications.Nat Rev Genet. 2009;10:109–21.
7. Dijk W, Kersten S. Regulation of lipoprotein lipase by Angptl4. TrendsEndocrinol Metab. 2014;25:146–55.
8. Kersten S. Physiological regulation of lipoprotein lipase. Biochim BiophysActa. 2014;1841:919–33.
9. Mattijssen F, Kersten S. Regulation of triglyceride metabolism byAngiopoietin-like proteins. Biochim Biophys Acta. 2012;1821:782–9.
10. Santulli G. Angiopoietin-like proteins: a comprehensive look. FrontEndocrinol (Lausanne). 2014;5:4.
11. Fu Z, Yao F, Abou-Samra AB, Zhang R. Lipasin, thermoregulated in brownfat, is a novel but atypical member of the angiopoietin-like protein family.Biochem Biophys Res Commun. 2013;430:1126–31.
12. Quagliarini F, Wang Y, Kozlitina J, Grishin NV, Hyde R, Boerwinkle E,Valenzuela DM, Murphy AJ, Cohen JC, Hobbs HH. Atypical angiopoietin-likeprotein that regulates ANGPTL3. Proc Natl Acad Sci U S A. 2012;109:19751–6.
13. Wang Y, Quagliarini F, Gusarova V, Gromada J, Valenzuela DM, Cohen JC,Hobbs HH. Mice lacking ANGPTL8 (Betatrophin) manifest disruptedtriglyceride metabolism without impaired glucose homeostasis. Proc NatlAcad Sci U S A. 2013;110:16109–14.
14. Musunuru K, Pirruccello JP, Do R, Peloso GM, Guiducci C, Sougnez C,Garimella KV, Fisher S, Abreu J, Barry AJ, et al. Exome sequencing,ANGPTL3 mutations, and familial combined hypolipidemia. N Engl J Med.2010;363:2220–7.
15. Welty FK. Hypobetalipoproteinemia and abetalipoproteinemia. Curr OpinLipidol. 2014;25:161–8.
16. Zhang R. The ANGPTL3-4-8 model, a molecular mechanism for triglyceridetrafficking. Open Biol. 2016;6(4):150272.
17. Dewey FE, Gusarova V, O’Dushlaine C, Gottesman O, Trejos J, Hunt C, VanHout CV, Habegger L, Buckler D, Lai KM, et al. Inactivating variants in ANGPTL4and risk of coronary artery disease. N Engl J Med. 2016;374:1123–33.
18. Myocardial Infarction G, Investigators CAEC. Coding variation inANGPTL4, LPL, and SVEP1 and the risk of coronary disease. N Engl JMed. 2016;374:1134–44.
19. Zhang R, Abou-Samra AB. Emerging roles of Lipasin as a critical lipidregulator. Biochem Biophys Res Commun. 2013;432:401–5.
20. Ren G, Kim JY, Smas CM. Identification of RIFL, a novel adipocyte-enrichedinsulin target gene with a role in lipid metabolism. Am J Physiol EndocrinolMetab. 2012;303:E334–51.
21. Zhang R. Lipasin, a novel nutritionally-regulated liver-enriched factorthat regulates serum triglyceride levels. Biochem Biophys Res Commun.2012;424:786–92.
22. Abubaker J, Tiss A, Abu-Farha M, Al-Ghimlas F, Al-Khairi I, Baturcam E,Cherian P, Elkum N, Hammad M, John J, et al. DNAJB3/HSP-40 cochaperoneis downregulated in obese humans and is restored by physical exercise.PLoS One. 2013;8:e69217.
23. Abu-Farha M, Abubaker J, Al-Khairi I, Cherian P, Noronha F, Hu FB,Behbehani K, Elkum N. Higher plasma betatrophin/ANGPTL8 level in Type 2Diabetes subjects does not correlate with blood glucose or insulinresistance. Sci Rep. 2015;5:10949.
24. Abu-Farha M, Cherian P, Al-Khairi I, Tiss A, Khadir A, Kavalakatt S, Warsame S,Dehbi M, Behbehani K, Abubaker J. DNAJB3/HSP-40 cochaperone improvesinsulin signaling and enhances glucose uptake in vitro through JNKrepression. Sci Rep. 2015;5:14448.
25. Espes D, Lau J, Carlsson PO. Increased circulating levels of betatrophin inindividuals with long-standing type 1 diabetes. Diabetologia. 2014;57(1):50–3.
26. Fenzl A, Itariu BK, Kosi L, Fritzer-Szekeres M, Kautzky-Willer A, Stulnig TM,Kiefer FW. Circulating betatrophin correlates with atherogenic lipid profilesbut not with glucose and insulin levels in insulin-resistant individuals.Diabetologia. 2014;57(6):1204–8.
27. Livak KJ, Schmittgen TD. Analysis of relative gene expression data usingreal-time quantitative PCR and the 2(−Delta Delta C(T)) Method. Methods.2001;25:402–8.
28. Nielsen S, Karpe F. Determinants of VLDL-triglycerides production. Curr OpinLipidol. 2012;23:321–6.
29. Nakajima K, Nakano T, Tokita Y, Nagamine T, Inazu A, Kobayashi J, MabuchiH, Stanhope KL, Havel PJ, Okazaki M, et al. Postprandial lipoproteinmetabolism: VLDL vs chylomicrons. Clin Chim Acta. 2011;412:1306–18.
30. Dallinga-Thie GM, Franssen R, Mooij HL, Visser ME, Hassing HC, Peelman F,Kastelein JJ, Peterfy M, Nieuwdorp M. The metabolism of triglyceride-richlipoproteins revisited: new players, new insight. Atherosclerosis. 2010;211:1–8.
31. Takahashi S, Sakai J, Fujino T, Hattori H, Zenimaru Y, Suzuki J, Miyamori I,Yamamoto TT. The very low-density lipoprotein (VLDL) receptor:characterization and functions as a peripheral lipoprotein receptor. JAtheroscler Thromb. 2004;11:200–8.
32. Tian GP, Chen WJ, He PP, Yin WD, Tnag CK. [Current progress in lipoproteinlipase and atherosclerosis]. Sheng Li Ke Xue Jin Zhan. 2012;43:345–50.
33. Lichtenstein L, Kersten S. Modulation of plasma TG lipolysis by Angiopoietin-like proteins and GPIHBP1. Biochim Biophys Acta. 2010;1801:415–20.
34. Wang Y, Gusarova V, Banfi S, Gromada J, Cohen JC, Hobbs HH.Inactivation of ANGPTL3 reduces hepatic VLDL-triglyceride secretion.J Lipid Res. 2015;56:1296–307.
35. Gusarova V, Alexa CA, Wang Y, Rafique A, Kim JH, Buckler D, Mintah IJ,Shihanian LM, Cohen JC, Hobbs HH, et al. ANGPTL3 blockade with a humanmonoclonal antibody reduces plasma lipids in dyslipidemic mice andmonkeys. J Lipid Res. 2015;56:1308–17.
36. Nakajima K, Kobayashi J. Antibodies to human angiopoietin-like protein 3: apatent evaluation of WO2012174178. Expert Opin Ther Pat. 2014;24:113–9.
37. Fu Z, Abou-Samra AB, Zhang R. A lipasin/Angptl8 monoclonal antibodylowers mouse serum triglycerides involving increased postprandial activityof the cardiac lipoprotein lipase. Sci Rep. 2015;5:18502.
• We accept pre-submission inquiries
• Our selector tool helps you to find the most relevant journal
• We provide round the clock customer support
• Convenient online submission
• Thorough peer review
• Inclusion in PubMed and all major indexing services
• Maximum visibility for your research
Submit your manuscript atwww.biomedcentral.com/submit
Submit your next manuscript to BioMed Central and we will help you at every step:
Abu-Farha et al. Lipids in Health and Disease (2016) 15:181 Page 9 of 9


![Research Paper Increased serum levels of betatrophin in … · 2018-12-15 · PDAC patients have glucose intolerance [5] and about 80% of PDAC patients are either glycemic or diabetic](https://img.pdfslide.us/doc/110x75/5f94af0b9ba3b15c4c389602/research-paper-increased-serum-levels-of-betatrophin-in-2018-12-15-pdac-patients.jpg)