Embed Size (px)
Citation preview

7/27/2019 Increase in Population
http://slidepdf.com/reader/full/increase-in-population 1/8
Population increase: The average annual change in the population, resulting from asurplus (or deficit) of births over deaths and the balance of migrants entering and leaving acountry. It may be positive or negative.
India is the second most populous country in the world, with over 1.21 billion people (2011 census). India occupies
2.4% of the world's land area ( Global Ranking 7th
) & contains 17.5% of the world's population ( Global Ranking
2nd). Its population growth rate is 1.41%. India is projected to be the world's most populous country by 2025,
surpassing China & its population reaching 1.6 billion by 2050.
The chart showing Population of India from 2000 – 2012 is as under:
2000 2001 2002 2003 2004 2005 2006 2007 2008 2009 2010 2011 2012
1,014,00
4,000
1,029,99
1,000
1,045,84
5,000
1,049,70
0,000
1,065,07
1,000
1,080,26
4,000
1,095,35
2,000
1,129,86
6,000
1,147,99
6,000
1,166,07
9,000
1,173,10
8,000
1,189,17
3,000
1,205,07
4,000
Population of four Metropolitan Cities of India as per Census 2011
Mumbai Maharashtra 12,478,447
Delhi Delhi 11,007,835
Chennai Tamil Nadu 4,681,087
Kolkata West Bengal 4,486,679
7/27/2019 Increase in Population
http://slidepdf.com/reader/full/increase-in-population 2/8
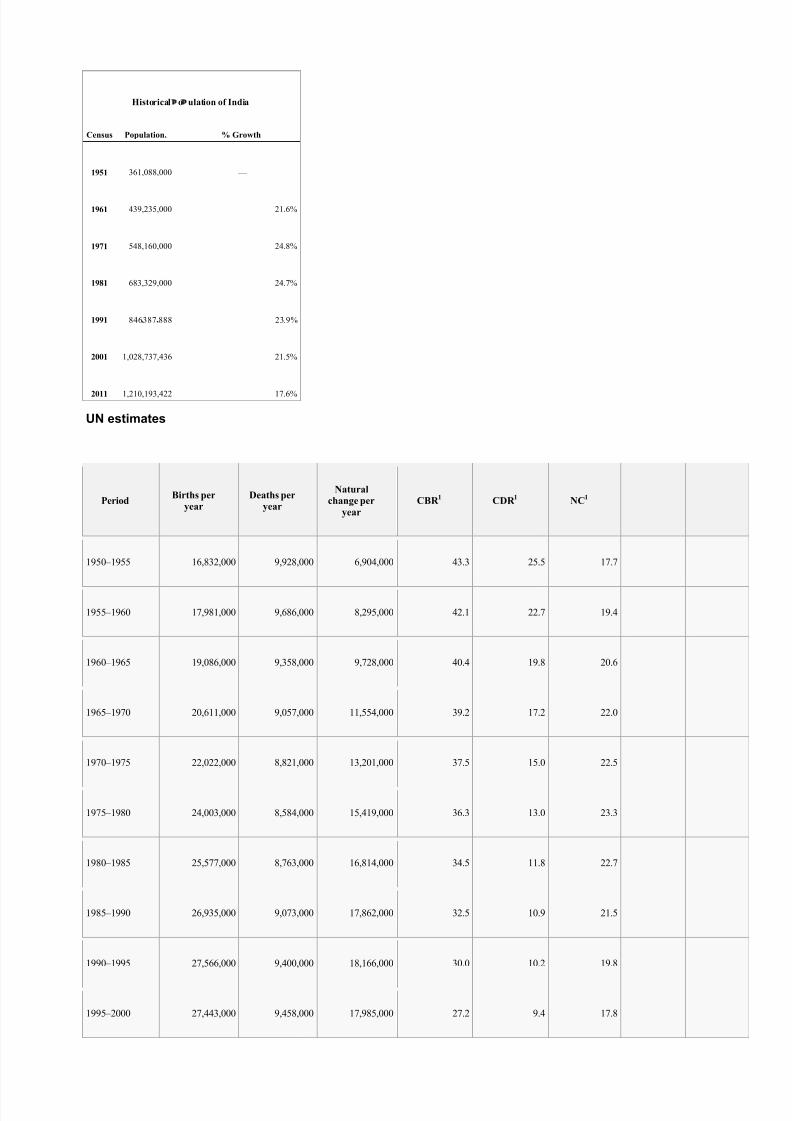
Historical o ulation of India
Census Population. % Growth
1951 361,088,000 —
1961 439,235,000 21.6%
1971 548,160,000 24.8%
1981 683,329,000 24.7%
1991 846387 888 23.9%
2001 1,028,737,436 21.5%
2011 1,210,193,422 17.6%
UN estimates
PeriodBirths per
year
Deaths per
year
Natural
change per
year
CBR 1 CDR 1 NC1
1950 – 1955 16,832,000 9,928,000 6,904,000 43.3 25.5 17.7
1955 – 1960 17,981,000 9,686,000 8,295,000 42.1 22.7 19.4
1960 – 1965 19,086,000 9,358,000 9,728,000 40.4 19.8 20.6
1965 – 1970 20,611,000 9,057,000 11,554,000 39.2 17.2 22.0
1970 – 1975 22,022,000 8,821,000 13,201,000 37.5 15.0 22.5
1975 – 1980 24,003,000 8,584,000 15,419,000 36.3 13.0 23.3
1980 – 1985 25,577,000 8,763,000 16,814,000 34.5 11.8 22.7
1985 – 1990 26,935,000 9,073,000 17,862,000 32.5 10.9 21.5
1990 – 1995 27,566,000 9,400,000 18,166,000 30.0 10.2 19.8
1995 – 2000 27,443,000 9,458,000 17,985,000 27.2 9.4 17.8

7/27/2019 Increase in Population
http://slidepdf.com/reader/full/increase-in-population 3/8
PeriodBirths per
year
Deaths per
year
Natural
change per
year
CBR 1
CDR 1
NC1
2000 – 2005 27,158,000 9,545,000 17,614,000 24.8 8.7 16.1
2005 – 2010 27,271,000 9,757,000 17,514,000 23.1 8.3 14.8
1 CBR = crude birth rate (per 1000); CDR = crude death rate (per 1000); NC = natural change (per 1000)
Sample Registration System
Average
population (x1000)
Live births1 Deaths1 Natural change Crude birth rate(per 1000) Crude deathrate (per 1000) Natural change(per 1000)
1981 716 493 24 289 000 8 956 000 15 333 000 33.9 12.5
1982 733 152 24 781 000 8 725 000 16 056 000 33.8 11.9 21.9
1983 750 034 25 276 000 8 925 000 16 351 000 33.7 11.9 21.8
1984 767 147 26 006 000 9 666 000 16 340 000 33.9 12.6 21.3
1985 784 491 25 810 000 9 257 000 16 553 000 32.9 11.8 21.1
1986 802 052 26 147 000 8 903 000 17 244 000 32.6 11.1 21.5
1987 819 800 26 316 000 8 936 000 17 380 000 32.1 10.9 21.2
1988 837 700 26 388 000 9 215 000 17 173 000 31.5 11.0 20.5
1989 855 707 26 185 000 8 814 000 17 371 000 30.6 10.3 20.3
1990 873 785 26 388 000 8 476 000 17 912 000 30.2 9.7 20.5
1991 891 910 26 133 000 8 741 000 17 392 000 29.3 9.8 19.5
1992 910 065 26 392 000 9 192 000 17 200 000 29.0 10.1 18.9

7/27/2019 Increase in Population
http://slidepdf.com/reader/full/increase-in-population 4/8
1993 928 226 26 640 000 8 633 000 18 007 000 28.7 9.3 19.4
1994 946 373 27 161 000 8 801 000 18 360 000 28.7 9.3 19.4
1995 964 486 27 295 000 8 680 000 18 615 000 28.3 9.0 19.3
1996 982 553 26 824 000 8 745 000 18 079 000 27.3 8.9 18.4
1997 1 000 558 27 215 000 8 905 000 18 310 000 27.2 8.9 18.3
1998 1 018 471 26 989 000 9 166 000 17 823 000 26.5 9.0
1999 1 036 259 26 943 000 9 015 000 17 928 000 26.0 8.7 17.3
2000 1 053 898 27 191 000 8 958 000 18 233 000 25.8 8.5 17.3
2001 1 071 374 27 213 000 9 000 000 18 213 000 25.4 8.4 17.0
2002 1 088 694 27 217 000 8 818 000 18 399 000 25.0 8.1 16.9
2003 1 105 886 27 426 000 8 847 000 18 579 000 24.8 8.0 16.8
2004 1 122 991 27 064 000 8 422 000 18 642 000 24.1 7.5 16.6
2005 1 140 043 27 133 000 8 664 000 18 469 000 23.8 7.6 16.2
2006 1 157 039 27 190 000 8 678 000 18 512 000 23.5 7.5 16.0
2007 1 173 972 27 119 000 8 687 000 18 432 000 23.1 7.4 15.7
2008 1 190 864 27 152 000 8 812 000 18 340 000 22.8 7.4 15.4
2009 1 207 740 27 174 000 8 817 000 18 357 000 22.5 7.3 15.2
2010 1 224 614 27 064 000 8 817 000 18 247 000 22.1 7.2 14.9
2011 1 242 738 27 092 000 8 823 000 18 268 000 21.8 7.1 14.7

7/27/2019 Increase in Population
http://slidepdf.com/reader/full/increase-in-population 5/8
Birth rate: 22.22 births/1,000 population (2009 est.)
Death rate: 1.4 deaths/1,000 population (2009 est.)
Life
expectancy:
68.89 years (2009 est.)
– male: 67.46 years (2009 est.)
– female: 72.61 years (2009 est.)
Fertility rate: 2.5 children born/woman (SRS 2010)[1] (82nd)
Infant
mortality
rate:
30.15 deaths/1,000 live births (2009 est.)
Age structure
0-14 years: 31.1% (male 190,075,426/female 172,799,553) (2009 est.)
15-64 years: 63.6% (male 381,446,079/female 359,802,209) (2009 est.)

7/27/2019 Increase in Population
http://slidepdf.com/reader/full/increase-in-population 6/8
65-over: 5.3% (male 29,364,920/female 32,591,030) (2009 est.)
Sex ratio
At birth: 1.12 male(s)/female (2009 est.)
Under 15: 1.10 male(s)/female (2009 est.)
15-64 years: 1.06 male(s)/female (2009 est.)
65-over: 0.90 male(s)/female (2009 est.)
Some activists believe India's 2011 census shows a serious decline in the number of girls under the age of seven -
activists fear eight million female foetuses may have been abortedbetween 2001 and 2011.[36]
These claims are
controversial. Scientists who study human sex ratios and demographic trends suggest that birth sex ratio between
1.08 to 1.12 can be because of natural factors, such as the age of mother at baby's birth, age of father at baby's
birth, number of babies per couple, economic stress, endocrinological factors, etc.[37]

7/27/2019 Increase in Population
http://slidepdf.com/reader/full/increase-in-population 7/8
Age structure
0 –14 years: 30.8%, male: 188,208,196, female: 171,356,024
15 –64 years: 64.3%, male: 386,432,921, female: 364,215,759
65+ years: 4.9%, male: 27,258,259, female: 30,031,289 (2007 est.)
Percent of the population under the poverty line
22% (2006 est.)
Unemployment Rate
7.8%
Life expectancy at birth
total population: 65.8 years (Source: UN Human Development Report 2013)
Scheduled Castes and Tribes
Scheduled Castes: 16.2% (2001 Census) Scheduled Tribes: 8.2% (2001 Census)
Population projections
India is projected to overtake China as the world's most populous nation by 2030. India's population growth has
raised concerns that it would lead to widespread unemployment and political instability.[57][58]
Note that these
projections make assumptions about future fertility and death rates which may not turn out to be correct in the event.
Source:
[59]
2020: 1,326,093,000
2030: 1,460,743,000
2040: 1,571,715,000
2050: 1,656,554,000
2020 Estimate]
Source:[60]
Year Under 15 15 – 64 65+ Total
2000 361 604 45 1010
2005 368 673 51 1093
2010 370 747 58 1175
2015 372 819 65 1256

7/27/2019 Increase in Population
http://slidepdf.com/reader/full/increase-in-population 8/8