Embed Size (px)
Citation preview
INCORPORATION OF BARCODE CAPABILITIES
TO EXISTING MUSEUM DATABASES
by
SUSAN E. FISHMAN-ARMSTRONG, B.S.
A THESIS
IN
MUSEUM SCIENCE
Submitted to the Graduate Faculty of Texas Tech University in
Partial Fulfillment of the Requirements for
the Degree of
MASTER OF ARTS
Approved
December, 2000

h/0 f^NP(^^Ll-i.
^ r ^ ACKNOWLEDGEMENTS
P /jQ jY^ I would like to express my deepest gratitude to the members of my committee:
'^Q' "^ Dr. R. Richard Monk, Mr. Gary F. Edson, and Ms. Nicola Ladkin for their constant
encouragement, guidance, and enthusiasm. I would like to add a special thanks to
Heath J. Gamer and Mathew O. Houle for adding their ideas and help with much ofthe
work for this project. Without the participation of any of these people, this project would
not have been possible.
I would like to extend a special thanks to Dr. R. Richard Monk for allowing me to
expand and apply his Ph.D. dissertation to other collections and other museums.
Dr. Monk's creative ideas and innovative museum data management procedures have
greatly enriched this project. I am especially thankful for the support, guidance, direction,
and motivation he offered me throughout this process.
I wish to thank those people in the Archeology Department at the PanHandle-
Plains Historical Museum (West Texas A&M University, Box 60967, Canyon, Texas,
79016) for working with me and allowing me to install the project at their facility,
specifically Jeff Indeck (Curator of Archeology), Millie Vanover (Archeology Assistant),
and Rolla Shaller (Assistant Curator of Archeology). I also wish to thank the staff at P-
PHM who have helped me to understand the needs ofthe DEP, including Monica Shaffer
(Registrar), Becky Livingston (Data Entry Clerk), and Kathy Upshaw (Data Entry Clerk).
I also wdsh to give a special thanks to those people in the Paleontology Division of
the Museum of Texas Tech University for helping me with the development of this
ii

project. I wish specifically to thank Dr. Sankar Chatterjee (Curator of Paleontology, Horn
Professor, Museum Science and Geosciences), Kyle McQuilken (Preparator), Amy
Hooker, Amy Policy, Kara Hurst, and Deborah Rose. I also wish to thank David Dean
(Associate Director for Museimi Operations and Programs, Adjunct Professor, Museum
Science) and Susan Baxevanis (Collection Manager Anthropology) and the staff and
students at the Museum of Texas Tech University (Texas Tech University, Box 3191,
Lubbock, Texas, 79409) for critiquing, testing, and helping with the revision of this
project. I also wdsh to include Dr. Eileen Johnson (Director of Lubbock Lake Landmark,
Curator of Anthropology, Professor, Museum Science) for her idea and inspiration to
tackle this project.
I would like to thank all of my co-workers and fiiends at the NSRL: Jessica
Carrillo, Jackie Chavez, Emma Dawson, Amy Halter, and Raegan King, for their constant
support in this project. I would also like to include Dr. Robert Baker (Director of NSRL
and Horn Professor of Biological Sciences) from TTU, Britney Hager (Collection
Manager) from the Dallas Museum of Natural History, and Dr. R. Zakreweski (Chief
Curator and Curator of Paleontology), Greg Liggett (Assistant Director), and
Cami Liggett (Museum Educator) from the Sternberg Museum of Natural KQstory in
Hays, Kansas, for adding their appreciation and perspective for database applications in
museum.
I would also like to thank those people who have given their time to help me solve
various technical database problems. Specifically, I would like to thank Bil Vernon
(Managing Director) and Chris Callaghan (Systems Analyst) for COLLECTION at
m

Vernon Systems Inc., in Auckland, New Zealand, and the technical operators at FileMaker
Pro® and the many people at Worth Data (623 Swift St., Santa Cruz, CA 95060).
Additional people I woukl like to thank include Avery Dee (Silicon Valley Bus Co., P.O.
Box 760, FaUbrook, CA 92088), TimRothroch (Azalea Software, 219 1st Ave. South,
Suite 410, Seattle, WA, 98104-3415) and C. J. Weigand (Life Success Institute, 356
Salem Tpke, Bozrah, CT 06334-1518 USA).
Lastly, I would like to thank my parents, Joyce and Morris Fishman, my sister,
Debra Bums, my husband Andrew Armstrong, and my extended femily. I would also like
to thank Cece and Gary Hill for reviewing this paper. Their support has meant a lot to
me.
IV

TABLE OF CONTENTS
ACKNOWLEDGEMENTS ii
ABSTRACT viii
LIST OF TABLES ix
LIST OF HGURES x
CHAPTER
I. E^TRODUCTION 1
History ofthe Project 2
The Project 7
n. PHASE I: DATABASE CORRELATION 13
III. PHASE II: UPGRADING THE DATABASE MANAGEMENT SYSTEM 15
Database Model 18 Multi-part and Multi-Valued Fields 21
IV: PHASE ni: BAR CODESFG 24
Criteria ofthe Collection's Database for Compatibility with Bar Code
System 25
Components ofthe Bar Code System 25
Unique Number 26 The Digits of a the Serial Number at MoTTU 28
Selecting a Bar Code Symbology 30 Bar Code Translator 32 Choosing a Bar Code Reader 35 Selecting a Bar Code Printer 37 System Operator 38 Database Management System 40

A Relational Database: COLLECTION 40
A Relational Database: FileMaker Pro® 43
V. PHASE IV: DESIGNING THE QUERIES/REPORTS 45
Views 47 Data Entry View 47 Single Find View 47 Multiple Find View 49
Reports 49 Proofreading Report 49 Creating Information Labels 50 Multiple Printing ofthe Same Record 53 Classification Report 54 Work Report 55 Inventory/Loan Report 56
VI PHASE V: PRINTING 57
VII PROBLEMS ENCOUNTERED 61
The Bar Code 61
Unfamiliarity with the Database Model 62
Specific Problems with the DBMS 66 Problems Related Specifically to COLLECTION 67
Problems Related Specifically to FileMaker Pro® 68
Vin. USE AND VALUE OF THE BAR CODE 70
IX. CONCLUSION 75
LITERATURE CITED 77
APPENDIX
A. DATA ENHANCEMENT PROJECT WITH BAR CODE CAPABILITIES AT PANHANDLE-PLAINS HISTORICAL MUSEUM. 79
VI

B. THE DATA ENHANCEMENT PROJECT: ESICORPORATING BAR CODE CAPABILITIES INTO EXISTING FILEMAKER PRO® DATABASES AT THE MUSEUM OF TEXAS TECH UMVERSITY 135
C. SELECTED DATA ENHANCEMENT TERMS 180
vu

ABSTRACT
An effective data management program saves time, money, and effort by
increasing the accuracy, speed, and usefulness ofthe database. A bar code system is part
of an effective data management system. Bar code capabilities were added at the
Archeology department at the Panhandle-Plains Historical Museum (P-PHM), in Canyon,
Texas (a PC environment), and the Paleontology Division at the Museum of Texas Tech
University (MoTTU), in Lubbock, Texas (a Macintosh environment). A bar code
generation utility was installed in the current databases and then used to print specimen
labels. Before labels are printed, however, the collection's data must be proofread for
erroneous data. The project consists of five Phases: (1) Database Correlation,
(2) Upgrading the Database Management System, (3) Installing the Bar Code Utility,
(4) Designing Views and Reports, and (5) Printing. The lasting effects ofthe project are
increased control of collection management operations, expanded research c^abilities,
updated labels on archival paper, standardized labels and data, and automated generation
of information tags.
vm

LIST OF TABLES
4.1 Required Parts of a Bar Code System and Their Corresponding Conditions. 24
4.2 Assigned Division Ordinals at MoTTU. 29
4.3 Size Differences Between Code 128, Code 39, and Code 2 of 5 with a Six-
and Ten-Digit Bar Code. 30
4.4 Exanq)les of Different Variabilities of Bar Code Readers Available. 36
5.1 Nine Views and Reports Used During the Data Enhancement Project. 46
IX
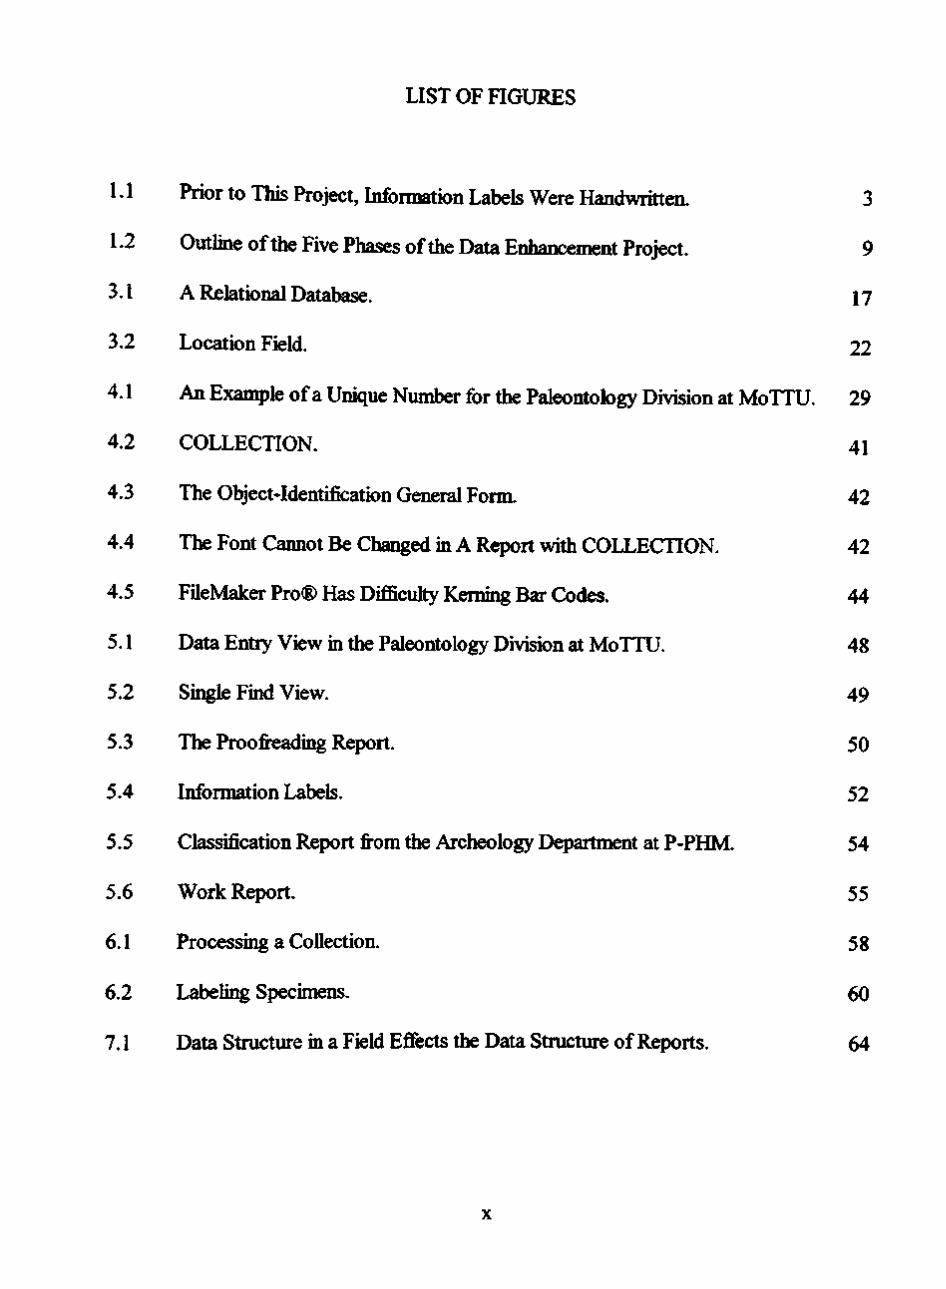
LIST OF HGURES
1.1 Prior to This Project, Information Labels Were Handwritten. 3
1.2 Outline ofthe Five Phases ofthe Data Enhancement Project. 9
3.1 A Relational Database. 17
3.2 Location Field. 22
4.1 An ExanaplQ of a Unique Number for the Paleontology Division at MoTTU. 29
4.2 COLLECTION. 41
4.3 The Object-Identification General Form 42
4.4 The Font Cannot Be Changed in A Report with COLLECTION. 42
4.5 FileMaker Pro® Has Difficulty Kerning Bar Codes. 44
5.1 Data Entry View in the Paleontology Division at MoTTU. 48
5.2 Single Find View. 49
5.3 The Proofreading Report. 50
5.4 Information Labels. 52
5.5 Classification Report from the Archeology Department at P-PHM. 54
5.6 Work Report. 55
6.1 Processing a Collection. 58
6.2 Labeling Specimens. 60
7.1 Data Stmcture in a Field Effects the Data Stmcture of Reports. 64

CHAPTER I
INTRODUCTION
The ideas and theories of a bar code system in a museum collection are sin:q)le.
However, the practice of installing a bar code system into a museum takes more time and
energy than one might initially realize. A bar code is simply a series of bars and spaces
that represent a number in a database. A bar code means nothing. This 'Sdsual Morse
code of a number" (Percon, 1998) can do nothing more than the actual number in the
database. For example, if the bar code represents a catalog number, then whatever a
catalog number is designed to do in the database, the bar code will do the same. If the
database allows searches by catalog number, then the database also will allow searches
with the bar code.
Adding bar code capabilities in a database and in a collection is "a long-term
solution to a problem with long-lasting effects" (McQuilken, pers. comm., 2000). There is
nothing magical about a bar code. A bar code system does not catalog, inventory,
accession, deaccession, or solve problems in a collection. It can, however, be designed to
complement the collection's database and help with these various duties in a museum
collection. It can be used to enter and retrieve information faster and without human
transposition errors in the database, thereby saving time and energy. The energy saved on
data input and retrieval can be concentrated on the actual collections.

History ofthe Project
In the summer of 1999, a project was begun to install a bar code system in the
Archeology Department at the Panhandle-Plains Historical Museum (P-PHM) and the
Paleontology Division at the Museum of Texas Tech University (MoTTU). Both
institutions were looking towards using bar codes to help fecilitate their immediate needs.
The Panhandle-Plains Historical Museum currently is undergoing renovation of its
collection's storage fecilities. The collections in the Archeology Department have been
placed in a temporary storage area. Over 114,500 records currently are entered in
COLLECTION, a database management system (DBMS), manufactured by Vemon
System Ltd. An incoming collection at P-PHM requires four forms: Database (inventory).
Registrar, Department, and a Label(s) for each specimen(s) (Indeck, pers. comm. Sept
1999). Currently, these forms are hand-written except for entry into the database. The
duplicate steps of writing and rewriting the same information greatly increases the time it
takes to process a collection, increases chances for error, and can be difficult to read
(Figure 1.1). The data from the paleontology and natural science collections have not yet
been into COLLECTION. The renovation provides a unique and ideal opportunity to
perform a comprehensive inventory of all ofthe collections in the Archeology Department,
to enter the information into the database, and to solve the problems associated with the
collection's data. In addition, the Archeology Department wanted an efficient way to
handle the data associated with incoming material.

^^^^^^^^^^^^^^ ^^^^^^^^^^H
^ ~ k ^ . ' 't ' L^^g^Mineral Collections ^ ^
CMIlof NOL i n S S ^ * ^ !<o ol SprrbMn 3C I - . . f -
NuDr
DMnlpti.ii _'„:i , - , t l j i ^ ! , ^ . c .-! - I ' - t f tc i O ^ d /
^•EoUectur n.iiH " ' i ^ - - -
Figure 1.1. Prior to This Project Information Labels Were Handwritten. The catalog card (left) is hard to read. Previous archeology labels (right) were written on a polyurethane bag and the amount of information available on the bag was limited.
Source: Archeology Department at P-PHM.
In the summer of 1999, the Paleontology Division at MoTTU began a
comprehensive inventory of its vertebrate paleontology, invertebrate paleontology,
mineralogy, and geology collections. The inventory was taken directly from the specimens
and then compared to the database. Information obtained during the survey included the
specimen's description, condition, number of parts, and its level of processing. By
comparing the database information with the collection information, the Paleontology
Division was given an opportunity to study the strengths and weaknesses of its database
management system. The results ofthe study include:
1. A need for standardization in the database;
2. Control over processing the collection;
3. A more efficient way of conducting inventories;
4. A need to automate the generation of information labels to ensure their
legibility and accuracy;
5. A need to control specimens that lacked a unique number and could not be
related back to the database by their catalog or accession number.

A bar code system would help eliminate the problems in the coUection's database by
forcing a review of its database and reduce the time and energy needed to conduct fiiture
inventories.
To deal with their individual problems or needs, the Archeology Department at P-
PHM and the Paleontology Division at MoTTU both began working on Data
Enhancement Projects (DEP) in June 1999. The purposes ofthe DEPs were to provide a
way to handle data more efficiently, eliminate the need to hand write catalog cards and
information labels (Figure 1.1), and to install a bar code system. A bar coding system
provides a means to minimize problems and maximize the use of a con:q)uter database
(Fishman-Armstrong, 2000). The time required to complete the comprehensive
inventories at both institutions (P-PHM and MoTTU) wiU significantly decrease with the
installation of a bar code system. Additionally, the ability to identify errors in the database
and in the collection is increased, allowing more effective collection management and
more accurate and accessible data for researchers.
This project is based on a Data Enhancement Project designed by R. Richard
Monk (Curator of Collections) at the Natural Science Research Laboratory (NSRL) at
MoTTU in Lubbock, Texas. The DEP initiated by Dr. Monk in 1996 included the use of
a bar code system for in the NSRL. Previous data handling procedures used in the NSRL
mammal collections were somewhat con:q)licated and time consuming, thereby creating
heavy workloads and high error rates (Monk, 1996, 1997).
Currently, the data management fimctions ofthe NSRL's relational database
management system are facilitated with bar codes on specimen tags, stickers, and labels

(Monk, 1998). The system utilized at NSRL is designed as a two-part database for both
field and in-house use and cannot be directly applied to the collection needs ofthe
Archeology Department at P-PHM, which requires the system only to be used in-house.
Use ofthe NSRL computer database for bar code and label generation not only reduces
time spent in multiple transcriptions of data, but it also ensures accuracy and consistency
between separate parts of each specimen and associated data (Dawson et al., 1999; Monk,
1998). )^thout such a system, risks to collections are increased by coir^jlicated processes
and himian error.
Though this system cannot be directly applied to other collections, the NSRL's
database provides a foundation for the DEP at P-PHM and the other divisions at MoTTU.
Work was begtm to modify the DEP at the NSRL for use in at both institutions. This
project allows a museum to use and add bar code capabilities to its existing database using
a one-pass system. The time required to conq)lete future comprehensive inventories at P-
PHM and MoTTU will significantly decrease with the installation of a bar code system.
Additionally, the ability to identify errors in the database and in the collections is
increased, allowing more effective collection management and more accurate and
accessible data for researchers.
Another challenge with this project was the differences between the collection's
databases at both institutions. Each institution used a different computer environment, a
different DBMS, and the collection's databases were stmctured differently.
The P-PHM uses a PC computer environment. Their main computer database is
COLLECTION by Vemon Systems Ltd., a relational collection management database. In

November 1999, COLLECTION was upgraded to a Windows environment. Every
department at P-PHM uses this database collectively. Because this database is created to
cover many different types of collections, not every field was appropriate or present for
every collection. Although this database was 'packaged', several changes were still
required to accon:q)lish this project to install the bar code system. Finally, because the
database dealt with every department, the system had to be developed to be conqjatible
with every department at the museum. The system could not allow any changes in the
database that would affect another collection in another department, even if that
department did not currently plan to install the system.
The Museum of Texas Tech University has six divisions in its organization,
including the Natural Science Research Laboratory (NSRL), Anthropology, Art,
Ethnology and Textiles, Paleontology, and History. The entire organization, except for
NSRL, is in a Macintosh environment, and uses a "flat" version of FileMaker Pro® as its
DBMS. In addition, every division has developed their own database model, and some
divisions have developed separate databases for each type of collection. The
Anthropology Division has a separate database for each accession number because ofthe
size of its collection and the inability to open the database when they were all merged
together.
Although the P-PHM and the MoTTU use different computer platforms,
databases, and types of collections, they do have similar needs from the bar code system.
Each organization has a need for more standardization in the database, control over
processing the collection, an efficient way for conducting inventories, and a need to

automate the generation of'information labels' to ensure their legibility. A result of
mstalling the bar code system is increased understanding for users ofthe database
management system, the collection's database, and database model.
The Project
In both organizations, the bar code system initially was planned for only one
division. Later, however, it became apparent that an effective bar code system would
result if an institution-wdde database model was used and appropriately updated. The
model provides the means for understanding and properly using the database. The model
includes every field, its definition (how it is used in the database), and its parameters.
Even if the bar code system is never installed in the other departments at either institution,
it is necessary to create/revise the database model institution-wide to fiilly exploit the
capabilities ofthe bar code system. To do this, the database itself also must be revised.
The bar code system at each institution, therefore, becomes a part of a larger Data
Enhancement Project.
Because ofthe need to encompass the needs of all ofthe departments at each
institution, the system was designed to be flexible. The system is designed not only to
meet the needs ofthe Archeology Department at P-PHM and the Paleontology Division of
MoTTU, but it is designed as a model for other departments at P-PHM and collections at
other institutions as well.
This project uses the basic model from the NSRL at MoTTU for the Data
Enhancement Project at the P-PHM and the other divisions at MoTTU. The focus ofthe

project is to revise the current database model for each institution and install a bar code
system. The project will provide more control of collection management, expand research
capabilities, and strengthen the fiduciary accountability in the museum. The Data
Enhancement Project consists of five phases (Figure 1.2). Phases I (Database Correlation)
and n (Upgrading the Database Management System) are concemed with how the
database model wiU be conducted at an iostitution-wdde level. Phases III (Installing the
Bar Code), IV (Designing View Types), and V (Printing) deal with the bar code system
and will be initiated at a divisional level.
8

FIVE PHASES OF THE
DATA ENHANCEMENT PROJECT
PHASE I: DATABASE CORRELATION
A. Inventory the collection.
B. Compare the inventory with the database.
C. Identify discrepancies.
D. Determine collection needs.
1. Consider physical needs.
2. Consider database needs.
PHASE H: UPGRADING THE DATABASE MANAGEMENT SYSTEM
A. Analyze the current database.
B. Create data structures.
C. Design the database model.
D. Determine the relationships.
E. Define business rules.
F. Complete transition from flat to relational.
G. Review data integrity.
PHASE IH: BAR CODESIG
A. Gather bar coding components.
1. Relational database.
2. The bar code.
3. Bar code hardware.
4. Bar code software.
5. System operator.
B. Install bar code.
C. Install related scripts.
Figure 1.2. Outline ofthe Five Phases ofthe Data Enhancement Project.
9

PHASE IV: DESIGN VIEWS AND REPORTS
A.
B.
C.
D.
E.
F.
G.
H.
I.
PHASE V:
A.
B.
C.
Data Entry.
Single Find.
Scan Find.
Proofreading Report.
Information Labels Report.
Multiple Print Report.
Classification Report
Work Report.
Loan Report.
PRINTING
Track Stage of a Collection.
Reports.
Information Labels.
Figure 1.2. Continued. Outline ofthe Five Phases ofthe Data Enhancement Project.
Phases I-II are to be conducted by the museum as a whole (Figure 1.2) and must
be completed before the rest ofthe system is installed; this maximizes the usefiilness ofthe
bar code system The first two phases ofthe project require that each museum
department's database fields be in agreement with each other, and with the collections
10

they represent. To this end, it is necessary that the museum-wdde database model
(provided by COLLECTION at P-PHM) is reviewed and the relationship between each
department is understood before any department attempts to implement the latter three
phases ofthe project.
Phases III-V are implemented by each department individually (Figure 1.2). The
Bar Code Phase III will not be conducted until the completion ofthe first two phases.
However, Phase IV does contain some views that can be utilized during Phase I
(e.g.. Proofreading and Work Report).
A database manager who is a single person in charge ofthe entire project must
monitor the Phases. This person acts as an "overseer" who is in charge of coordinating
the efforts of all others involved with the project including programmers, system
operators, data entry clerks, and database users. The database manager also programs the
computer to link the bar code to the object's data. Each division needs a system operator.
This person reports to the database manager. This person helps to develop the system to
address the needs ofthe collection, especially in Phases IV-V. A database committee
must be formed, consisting ofthe database manager, system operator(s), and other
person(s) involved (i.e., curators). Together, the database committee designs DEP to be
flexible to meet the future needs of each collection, including collection growth, not only
in terms of collection size, but in terms of also staff size.
This manual discusses the methodology and concerns for each phase. Inclusive
within the DEP is the notion that by the time Phase V is initiated, the person overseeing
11

the department's DEP (the system operator) will have a thorough understanding ofthe
relationship between the database management system and its collections.
The Data Enhancement Project provides for standardization ofthe database, better
control over processing the collections, increased efficiency for conducting inventories,
and the ability to automate the generation of 'information labels' to ensure their legibility.
In addition to enhancing specimen and data manipulation activities, an indirect result of
installing the bar code system is increased understanding for users ofthe database
management system, the collection's database, and an upgraded database model.
12

CHAPTER n
PHASE I: DATABASE CORRELATION
Phases I and II prepare the database for implementation ofthe bar code system.
The final product ofthe bar code system is docimientation generated directly from the
database such as information labels and inventories. The database needs to be designed to
meet the needs ofthe collection(s). The Database Management System is only as good as
the database in which it is incorporated. Because a database stores and "track(s) historical
and time-dependent data," it is vitally important that every field be standardized, and every
record be as correctly entered as possible (Hernandez, 1997). The following questions
need to be posed to the users during Phases I and II:
1. What information is useful for the collection?
2. What information is in the database?
3. What different types of inquiries are demanded by the collection?
4. How should the information in the database be presented?
Phase I ofthe DEP is 'database correlatioiL' This first phase provides the working
foimdation for the entire project. A comprehensive inventory ofthe collections is a major
conqjonent of this phase. The inventory allows the database to be compared to the data
associated wdth the specimens in the collections in an effort to ensure the accuracy ofthe
electronic database. Although the proofreading report (Figure 1.2) is designed as a last
effort to verify the accuracy ofthe information before information labels are created, it
13

also is usefiil for the inventory in Phase I, and, therefore, can be created early (see Chapter
V) to be used during Phase I.
This inventory also needs to include the number of information tags necessary for
each object. Some collections, like paleontology, often have objects too big to be housed
in one location or have multiple parts with the same catalog number. An information label
is needed for each individual part. Noting the number of tags needed for each specimen
during the inventory stage eliminates unnecessary back-tracking into the collection's
during Phase V (Fishman-Armstrong et al., 2000). Additional information also may be
obtained during the inventory, such as condition reports, general rehousing needs, etc.
Finally, the inventory conducted in Phase I helps determine ways for "the database
to be expanded and supplemented" (Fishman-Armstrong et al., 2000: 11) in Phase II.
Phase I provides the basic imderstanding required for establishing fields in the database
model and correcting recurring problems within the database in Phase II (Fishman-
Armstrong et al., 2000). Any discrepancies between the inventory report and the database
need to be noted. The incongmities between these two sources must be tracked down and
eliminated (Fishman-Armstrong et al., 2000). These discrepancies include misspellings,
erroneous data entries, incomplete records, and other incorrect information that may have
become associated with the specimen.
14

CHAPTER m
PHASE II: UPGRADESTG THE
DATABASE MANAGEMENT SYSTEM
The Database Enhancement Project wall result in a standardized database for each
collection. The goal is that every record in the database will be entered identically
regardless of whom actually does the data entry. Phase H consists of upgrading the
database model. This includes reviewing the current database model, creating the data
stmctures, upgrading to a relational database format, and reviewing data integrity (Figure
1.2). Phase I provides the basic understanding required for establishing fields in the
database model During Phase II, these recurring problems within the database are
corrected (Fishman-Armstrong et al., 2000). Any discrepancies between the inventory
report and the database need to be noted. These discrepancies include misspellings,
erroneous data entries, incomplete records, inappropriate abbreviations, and usefiilness of
each field in the database as it applies to the collection and use, and other incorrect
information that may have become associated with the specimeiL
If the database is not in a relational format, this is the ideal time to upgrade it. The
reasons for upgrading from a flat database to a relational database are many. A flat
database organizes information on a single table that looks like a spreadsheet. It stores all
information in the database in this table, but does not address the problem of redundant
data in the database. Every piece of information for each object is entered and stored
within the file, even if some ofthe information is duplicated between records. Information
15

storage of this type requires that data be entered multiple times, increasing the required
effort and error potential. Hard disk space and RAM required for data storage and
processing are greatly expanded when the flat format is used.
Relational databases manage data more efficiently than flat databases. Instead of
the entire record being stored on a single table, several tables contain fields related to
particular subjects (e.g., collecting location). These individual tables store unique field
data occurrences (e.g., each occurrence is stored only once). The various tables in the
database are related by unique numbers called keys. By handling data storage in this
manner, any record "using" information that already has been stored within the database
merely references the record in the related table instead of storing the same information
again. For example, consider a database that includes the name ofthe county from which
the object was collected. If the object was from Lubbock County, that information might
be entered into the database as Lubbock, Lbk, Lubb, Lubbock County, Lubbock Co,
LUBBOCK CO, or in any number of other different ways depending on the department
and the person entering the data into the database. Even if'Lubbock' were the only way
the data had been entered, each occurrence of 'Lubbock' wdthin a flat database would take
up disk space. In a database containing 1 million records, the storage ofthe word
'Lubbock' for all records would use 7MB (7 million bytes) of hard disk space (Fishman-
Armstrong et al., 2000). However, in a relational database, imique data are stored only
once and are linked to other tables (i.e.. Figure 3.1). Therefore, storage ofthe word
'Lubbock' would take up seven bytes of hard disk space, regardless ofthe number of
16

objects from that locahty. Most objects have much longer locaUty descriptions (Fishman-
Armstrong et al, 2000) so the amount of space saved can be very significant.
Upgrading from a flat database to a relational database has other benefits besides
dramaticaUy decreasing the size of stored database files and freeing up computer memory
resources. Files are smaller and information is processed through linked tables so data
retrieval is faster and the search capabiUties ofthe database are increased. In addition,
since much ofthe monotony of data entry can be eliminated, transcription errors wall be
reduced.
1 iS: Specimens
1
1 Genus 1 PEPOM'r SC:US PEROMYSCUS SIGMODON CHAETODIPUS DIPODOMYS MUSTEIA PEROMYSCUS CHAETODIPUS MICROTUS MEPHITIS
HfilD Species
LEUCOPUS LEUCOPUS Hl'SPtOUS " iHilSPiDUS ^ ORDII FRENATA MANICULATUS PARVUS MONTANUS MEPHITIS
Fieldnum 1 2
* " 3 A 5I 6 7 8
? 10
Sitenum 1 1 1 2 2' 3
"" 3 3 A A
JL,
lire Sites 1 SHenum
if
2 3 A
Location 3 Ml W 2 MIS LUBBOCK 5 Ml E 1 5 Ml N LUBBOCK WEST MOUNTAIN SOLDIER SUMMIT
1 County : LUBBOCKCO jLUBBOCK CO 1UTAH CO fWASATCH CO
1
State TEXAS TEXAS UTAH UTAH
1 Countiy i UNITED STATES 1 UNITED STATES jUNrrED STATES 1 UNITED STATES
!
li[S]Q -^
Figure 3.1. A Relational Database. A relational database links or relates a single record in a table to several records in a separate table, saving space and reducing data redimdancy.
Source: MUSM 5340 at Texas Tech University, http://mum202-2.musm.ttu.edu/ musni5340/images/SPECSITE.jpg.
17

Database Model
After the database has been upgraded to a relational format, the infomiation within
the database must be standardized on a museum-wide level. This aspect of Phase E
should be coordinated by the data enhancement committee and requires that aU ofthe
divisions ofthe museum agree on a single database model. The database model needs to
include aU ofthe required fields and their corresponding definitions. A database design
^ ^ ^ ' '^^^ ^ Database Design for Mere Mortals by Michael J. Hernandez (1997), can be
extremefy usefiil when creating or updating a database model. Hernandez (1997) defines
the seven basic steps for creating a database model. These steps include:
1. Defining a mission statement and mission objectives.
2. Analyzing the current database.
3. Creating the data stmctures.
4. Determining and establishing table relationships.
5. Determining and defining business rules.
6. Determining and establishing views, queries, and reports.
7. Reviewing data integrity.
Step one helps to formulate the purpose ofthe database and every field must apply
to this purpose. The database is reviewed in step two. Interviewing the users identifies
which fields are included and what type of data in the field is required. The users include
collection managers, curators, and researchers for every department. Questions need to
be asked to understand how the database is used, what fields require improvement, what
18

fields need to be added, and which fields are unnecessary. These questions can be
answered by reviewing the inventory from Phase I. Some usefiil questions include:
1. What is the purpose ofthe field?
2. Is the field being used in the collection as it was intended in the database?
3. What is the definition ofthe field?
4. How is the field to be used?
5. What standards need to be imposed on the field?
A list of every required field needs to be made. Not every department will use every field;
however, all ofthe fields should be listed to create the institution-wide database model.
The third step defined by Hernandez requires that the data stmcture be created.
The data stmcture includes designing tables by subject matter and assigning fields (listed
from step two) to the table that it best represents. Every field in the database must be
defined and imderstood for its purpose and specifications (Hernandez, 1997: 53). "Fields
are the basis of a database file. Fields store, calculate, and display the data [that have
been] entered or calculated. Fields can be defined as a text, number, date, time, graphic,
sound, movie, a calculation, or a summary ofthe values in the field for a group of records'
(FfleMaker Pro®, 1998: 1-4).
The specifications of a field in COLLECTION are found in the database model
provided by the software's manual. Databases at MoTTU generally do not have written
specifications. This situation needs to be addressed. Specifications of a field refer to the
data integrity of "validity, consistency, and accuracy" ofthe data. The "level of accuracy
ofthe information retrieved from the database is in direct proportion to the level of data
19

integrity in: )osed within the database (Hernandez, 1997: 53). According to Hernandez
(1997), there are six elements that should be considered when defining the fields in the
database:
1. It represents a characteristic ofthe subject.
2. It contains only a single value (e.g., city and not city, state).
3. It cannot be broken down into smaller components.
4. It does not contain a calculated or concatenated value.
5. It is unique within the entire database stmcture.
6. It retains all the characteristics if it appears in more than one [table].
To preserve and enhance data integrity, the database model must be directed with
business rules, designed in step five. In other words, the ways that data are stored and
used will be explicitly described for each field in the database. Business rules are
computer-imposed restrictions that govern the style and type of data that can be recorded
in each field (Hernandez, 1997). Without business rules, it is difficult to ensure that
different data entry persons will follow data entry standards. A variety of standards can be
imposed by business rules including but not limited to: restricting data to either alphabetic
or numeric characters, standardizing date and text entry formats, and eliminating multi
part and multi-value fields (Hernandez, 1997; FileMaker Pro®, 1998).
How the tables and fields are viewed on the computer screen is determined in step
six. The last step of designing a database model from Hernandez (1997) involves
reviewing the updated database for data integrity. This step is important because it
confirms that the database is working correctly. Every table in the database must meet its
20

'design criteria.' The fields must be reviewed for their pertinence and that they uphold
their field specifications. The field specifications must be reviewed to ensure they
correctly define each field. The relationships among the tables and the business rules must
be reviewed to identify if they are valid and work correctly.
Once created, the database model is not permanent. The database model may be
expanded at any time with the additional fields or altered definitions, but only with the
approval ofthe data enhancement committee. Only after every field has been evaluated
and deemed acceptable will the project proceed to Phases III, IV, and V.
Multi-Part and Multi-Valued Fields
Multi-part and multi-valued fields are of particular concem in a database. These
types of fields cause data redimdancy, are prone to high error rates, can cause data to be
lost in the database, and introduce difficulties ui retrieving data for reports. Special
attention is required to identify and eliminate multi-part and multi-valued fields. Query
fimctions are reduced in these types of fields and sorting is nearly impossible. Multi-part
and multi-valued fields reduce the research capabilities ofthe database. A collection is
only as good as the data associated with the objects. The better the documentation, the
more usefiil the collection, so it is important not to limit this usefulness ofthe collection by
using an ineffective database.
Data can easily become lost in the database because of multi-part and multi-valued
fields. For example, the 'Location' field for the Paleontology Division's database at
MoTTU was identified to be a multi-part field that had several different entry variations
21

(Figure 3.2). Although everything in the field referred to where the object was stored,
different people had entered the information differently. Since business mles had not been
established, it was difficult to ensure that different data entry persons would enter data the
same way. To solve this problem in the 'Location' field, the field was reduced and divided
into three separate fields (Figure 3.3) and business mles were applied to enforce the new
standardization.
Vertebrate Paleontology Records
Location P a l e o n t o l o g y , Cab9, Drawer3
Vertebrate Paleontology R.ecords
Location C a b i n e t ? , Drw3, P a l e o
Veitebrate Paleontology Recoids
Location Drawer©, Cab3
(a) Variations ofthe Location Field.
Veitebrate Paleontology Records
Location PALEO Cabinet 52 Diaver C
(b) The Updated Version ofthe Location Field.
Figure 3.2. Location Field. Many different variations of data in this muhi-part field resulted in difficulty with searches and designing reports.
Source: Paleontology Division at MoTTU.
22

Recurring problems such as multi-part or multi-valued fields or consistent errors
and inconsistencies within the database should be noted and corrected in Phase n. Many
database management systems have ways to correct recurring problems all at once instead
of in a record-by-record process, thus simplifyring the process of correcting the database.
Careful attention is required when changing fields from one type to another in the
collection's database because such changes potentialfy can lead to a loss of data.
Establishing the database model must be coiiq)leted before proceeding to
subsequent phases. Establishing the database model will help identify fields that need to
be modified to meet the needs ofthe collection. If a field in the database is not
appropriate for a collection, then it also will not be appropriate on an information card or
report when it is printed, because the information is the same as it is in the database.
Every department will find some fields that are not entirely appropriate for its collection(s)
that will need to be modified. These modifications need to be identified based on the
collection's needs and coordinated with the institution's database committee and the
system's programmer for ideas, suggestions, and limitations ofthe DBMS.
23

CHAPTER IV
PHASE IH: BAR CODESTG
In order to create the most effective bar code system, the Bar Code Phase ofthe
project should proceed only when the database model has been upgraded (a process
outlined and discussed in the first two phases ofthe DEP). If the data in the database
have not been standardized or checked for accuracy, then the information labels and
reports also will not be standardized and accurate because the data on these reports is
exactly the same as the data in the database. Once these tasks have been accomplished,
the components ofthe bar code system can be defined and discussed and the actual
procedures of installing the bar code system into the database may begin. Major
con^onents ofthe bar code system include: a unique number, a bar code symbology, a bar
code translator, a bar code reader, a bar code printer, a relational database, and a system
operator (Table 4.1).
Table 4.1. Required Parts of a Bar Code System and their Corresponding Conditions
PART
Unique Number:
Bar Ccxle Symbology:
Bar Code Translator:
Bar Code Reader:
Bar Code Printer:
Relational Database:
System Operator:
CONDITION(S)
Assigned by database committee
Code 128 or Code 39 Determined by the collection's needs Have both Code 128 Mode a-c and Code 39. Be compatible with the relational database Not wand/pen. Preferably laser. Meet needs ofthe collection
Laser printer. Archival paper and ink.
Addressed in Phase II. Be able to proofread database and design reports.
24

Criteria ofthe Collection's Database for Compatibility with Bar Code System
The bar code system is used in the same way as if the information was typed into
the keyboard. The bar code reader works like a fast keyboard when the bar code is
scarmed. Before installing the bar code system, three minimimi requirements are necessary
ofthe collection's database (Appendix D). One, the database must allow the user to
design customized reports, such as mailing labels. Two, the database must allow the user
to change fonts to individual fields in a report. Three, the database must provide a way
for the user to find multiple records at random by typing the "System ID" number and
pressing retum once to continue to the next search (see Multiple Find in Chapter V; Phase
IV). If the database does not meet any one ofthe preceding three criteria, then the
database needs to be adjusted to aUow for these minimum requirements.
Components ofthe Bar Code System
Phase III considers the actual components ofthe bar code system and their
relationship with the coUection. This phase helps users determine where and how the bar
code system will be placed and designed. Will the bar code reader need to be brought to
the specimens? If so, what is the maximum distance the bar code reader must travel?
Where will the computer be placed? It is helpfiil to have a map ofthe collections that
shows where the computer will be placed and anything else that must be installed,
including outlets and Ethernet parts. For example, the Paleontology Division at MoTTU
foimd that most of its collection is too large to move, requiring that the bar code reader to
be brought to the specimens. Therefore, a cordless bar code reader that can reach 80 feet
25

between the computer and the bar code reader was purchased (Appendix B). In addition,
the Paleontology Department also discovered that it was necessary to purchase another
computer specifically for the collection's area. The Archeology Department at P-PHM has
the computer in the offices and not in the collection's area. Most ofthe archeology
collections at P-PHM are in archival boxes that can be carried to the computer.
Therefore, a bar code reader with a short cable was purchased for use with the archeology
collection. However, for the collections that are too large to move and that require the
bar code reader to be brought to the specimens, bar code readers that can reach 80 feet
between the computer and the bar coded label are available.
Unique Number
The number chosen to become the bar code must be unique in every record in the
database. The nimiber is used to link the bar code to an individual record in the database
so unless each catalog nimiber ofthe museum is represented by a unique bar code nimiber,
the entire effort becomes confiised with duplicate entries.
It generally is simplest to choose a number (rather than alphabetic characters) for
the bar code. It is important to keep in mind the bar code has no meaning and is only used
as a reference number to access a particular record in the database. Both P-PHM and
MoTTU considered using their catalog number as the bar code, but each institution had
the problem that the stmcture ofthe catalog number varied greatly due to changes in its
format over the years and the many variations between the different collections. For
example, the format ofthe catalog number in the History Division at MoTTU has
26

undergone several changes over time. Catalog numbers can be found in the format of X-
1234, H-1234, 00001234, and TTU-H 1234. In addition, a great variety in format ofthe
catalog number exists between the various divisions. A "standard" catalog number from
the History Division is X-1234, Paleontology Division is TTU-P 1234, and the Geology
coUection is TTU-L 1234. The bar code chosen for MoTTU (Chapter IV, Appendix B)
does not allow alphanumeric characters. A different approach is necessary; therefore, to
maintain the ability to know to which division a specimen with catalog number '1234'
belongs if the prefix cannot be used in the bar code. A catalog number for an
archeological object at P-PHM is complex, such as '41SW23 (AREA 2) - SW23.868'.
This number is too long for a bar code: a 10-digit number using Code 39 is 1 1/2 inches
long. This number is 26 digits long, resulting in a bar code that is larger than 3 inches;
much greater than what can fit on most information labels.
The "System ID" field (a serial number) at P-PHM in their DMBS
(COLLECTION) was used as the number to be translated into the bar code. This decision
was based on the problems of using the catalog nimiber, because of its large variety of
formats in the museum and within each department. In addition, every Department at P-
PHM uses the same database, and therefore, the "System ID" nimiber would be
continuous in the database.
Unlike P-PHM, each division at MoTTU uses a separate catalog database. The
number chosen to become the bar code must be imique among all records in the
database(s) and throughout the entire institution. This number is used to link the bar code
on the object to an individual record in the database. The catalog numbers at MoTTU,
27

however, are highly variable in their design and are too difficult to use for the bar code. In
addition, because code 128 was chosen as the bar code symbology for MoTTU,
alphanumeric digits cannot be used and the unique number must contain an even number
of digits. Therefore, a serial number is being used to eliminate these problems. However,
unlike P-PHM where their serial number (System ID No) is continuous throughout their
mstitution, MoTTU needed a way to ensure that the serial number for each division was
not dupHcated. The duplication would occur if every division started with 1, resulting in
seven sets of bar codes at the same institution with the same number. To combat this
problem, a serial number was assigned to every division and a system was devised to
ensure that enough digits were available to every division for coUection growth.
The Digits of a the Serial Number at MoTTU
The serial number is divided into two parts: the division ordinal and the database
record number. Once installed, this number wiU automaticaUy be entered by the
coUection's database.
The purpose ofthe division ordinal is to ensure that bar codes are not dupUcated
between divisions within the museum. The division ordinal is a prefix number that is
assigned to each curatorial division; larger coUections may utUize more than one number.
For example, because of its size, the Anthropology Division was assigned '2' and '3 ' . To
this end, each Division of MoTTU has been assigned a prefixing number as shown in
Table 4.2.
28

Table 4.2. Assigned Division Ordinals at MoTTU
Division
NSRL Anthropology Ethnology Art Clothing and TextUes Paleontology History
Division Ordinal
(0, 1, 9) (2,3) (4) (5) (6) (7) (8)
The second part ofthe serial number is the database record number. Each division
is aUowed five coded digits. Because of their size, however, the Anthropology Division is
assigned seven digits.
When the division ordinal and the database record number are placed together as
the serial number, they provide a long range of avaUable numbers (Figure 4.1). For
example, the Anthropology Division's serial number wiU range from 20000001-
39999999, aUowing 19999999 records in its database. A contingency exists to aUow each
division to add additional numbers by notifying the database enhancement committee.
1 ' t
Division Ordinal
Seriial Nnmber
1 0 0 0 1
t Database Record Number
Figure 4.1. An Example of a Unique Number for the Paleontology Division at MoTTU.
29

Selecting a Bar Code Symbolopy
A bar code is a series of bars and spaces, different combinations of which represent
different characters. The Ught produced by the bar code reader is absorbed by the bars
and reflected by the spaces ofthe printed code and then converted into an electrical signal
that is interpreted by the computer (Worthington Data Solutions, 1998: 15). AU bar codes
require a start and stop character so that the bar code reader can translate the bar code to
the computer. In order for the bar code reader to find the start and stop characters the bar
code must have %" of white space on either end of it.
Table 4.3. Size Differences Between Code 128, Code 39, and Code 2 of 5 with a Six and Ten Digit Bar Code.
Code Names
Code 128
Code 39
Code 2 of 5
6 Digits
^i^^„ miijiiiiiii
1" iiiimiiuinniiiiiiiiiiiiiii
VS" IIIHIIIIItlll
10 Digits
9/ gjiiiiiiflmui
11/,'' iiniiiiniiiOHiiiiiiiiiiiiiiiMiiiiiiii
VA" iHimiiiuiiiitii
Many different bar code 'symbologies' or 'languages' exist. Each has its own
characteristics that make it useful for a particular appUcation. Code 128, code 39, and
code 2 of 5 are codes that are the most usefiil to museum coUections (Table 4.3). For
example, the symbology for code 128 for '1234' is ™,Br' and for code 39 is *1234*.
Each of these codes can be printed in three different densities: high, medium, and low.
Bar codes with the highest density are more compact and, therefore, have a greater risk of
30

being unreadable. It is important to choose the type of code that is most usefiil for the
coUection. The maximum aUowable size for the bar code on the smaUest label must be
considered.
The first type of code, code 128, can encode aU 128 ASCII characters
(Worthington Data Solutions, 1998). Code 128 was introduced in 1981 as a high-density,
alphaanumeric symbology. Since 1990, three modes of code 128 have been designed:
modes A, B, and C. Both modes A and B are alphanumeric, aUowing both alphabetic and
numeric characters; mode B aUows lower case letters whUe mode A does not. Mode C
aUows only numeric characters. The advantage of mode C is that it produces highly
compact bar codes by using an algorithm to process pairs of numbers together, thereby
greatly reducing the size ofthe bar code. The disadvantage is that this efficiency is lost if
an odd number of digits is coded (Percon, 1998). The Archeology Department at P-PHM
did not need a smaU bar code symbology. However, the system was designed to be
flexible to use code 128 if smaUer bar codes are required in other departments.
Code 39 is much larger than code 128 (Table 4.3). This code also can use aU
ASCII characters. Code 39 is a Uteral translation with an asterisk (*) as its start and stop
character so it is simpler to inclement. The main disadvantage of code 39 is that it
produces long bar codes (Table 4.3). The Paleontology Division at MoTTU began the
DEP by using code 39. The problem is that only code 39, medium density bitmap at a
12-point font size, wiU work with FUeMaker Pro® but it is too long for the vial labels.
However, the DEP was designed to aUow the upgrade from code 39 to code 128. The
Paleontology Division wdU convert to code 128 when it becomes avaUable. The
31
Archeology Department at P-PHM also is using code 39. However, the point size of code
39 can change and be sUghtly smaUer in its PC environment. Although code 39 is
appropriate for the Archeology Department's needs, it may be too large for other
coUections.
Code 2 of 5 aUows only numeric text. This code is larger than code 128 and
smaUer than code 39 (see Table 4.2 for comparison). Like code 128 mode C, code 2 of 5
requires an even number of digits. Code 2 of 5 is avaUable for most DBMS. However,
some bar code translators have trouble reading code 2 of 5 because it has a tendency to
cause the bar code reader to accept partial reads (Worthington Data Solutions, 1998),
making it less reUable than either code 128 or code 39. The trend in bar code technology
is moving from code 2 of 5 to code 128 (Weigand, 2000; Percon, 1998; Azalea Software,
1999).
Bar Code Translator
The bar code translator is a computer software program that translates the desired
characters (System ID at P-PHM) into the desired bar code symbology for printing. The
symbology then is printed as a font that is read by a bar code reader. For example, with
code 128 a bar code translator wiU change '1234' to its code, ^**,Br' which then displays
the bar code when the font is changed.
Most bar code translator software aUows the code to be translated in one of three
ways. The first two methods translate the numbers one at a time. The third method,
usefiil in a database, translates the contents ofthe bar code field for aU records in the
32

database. In the first method, the user types in the characters to be translated and then
cUcks the 'translate' key, "teUing" the software to proceed with the conversion The
characters then are translated and saved on the con:q)uter's cUpboard and the user can then
paste the translated bar code into the desired place such as a specimen label to be printed.
The second method of translating is by using a hot key. The user highUghts the characters
in the software program and then uses a combination of keys (e.g., ALT B) to translate
them in place. The problem with both of these methods is that they are labor intensive
since each code is processed individuaUy. The third method translates the required field
for aU records in the database at once. This method requires a programmed script that
either must be written into the database management system or be provided by the
software. Code 39 requires a simple, one-fine script and can be used in most DOS, PC, or
Macintosh programs such as Microsoft Access® and FUeMaker Pro®. The script for
Code 128 is not as readUy available for some Macintosh programs such as FUeMaker
Pro®, but this is changing (Weigand, 2000).
A bar code translator that is compatible with the database management system and
the bar code format (symbology) should be identified at this point. Fields may need to be
added or modified, depending on the translator's requirements, in which case the database
model must be changed to reflect those requirements. P-PHM requires the addition of
only one field, the bar code, to make the bar code system work (Appendix A). MoTTU,
however, required three fields to be added (Appendix B).
33
It is preferable that a bar code translator adds the code directfy to the coUection's
database and not requires exporting records to the translation software or other DBMS.
Software that has a variety of codes and font sizes wiU give added flexibUity to the system-
Bar code translators are avaUable for the DBMS at P-PHM (COLLECTION), but
it does not have the capabiUty to aUow for font changes in reports. As previously
discussed, one ofthe three minimum requirements for the bar code system is that the
DBMS aUow the font in individual fields to be changed. The font for the unique number
must be changed to the bar code font to create a readable bar code. The bar code
symbology was instaUed in COLLECTION by Chris Callaghan (systems analyst from
Vemon Systems Inc.). The font for any bar code symbology must be manuaUy changed
from Times font into code 39 bar code font (or other symbology font) to print the actual
bar code. However, because COLLECTION does not aUow the font for the bar code to
change, it cannot be used to print the bar codes and records must be exported to another
DMBS (i.e., Microsoft Access®) that does aUow fonts to change in order to bar codes.
The Archeology Department has purchased Bar Font for Windows® by Worth Data as its
bar code translator soflrware and it does have code 128 modes A, B, and C and code 39.
Programmers of COLLECTION are in the process of making improvements by aUowing
changes in the design of its reports (CaUaghan, pers. conun., November 2000). The P-
PHM hopes to stop using Microsoft Access® and produce bar codes directly from
COLLECTION for simpUcity and because ofthe problems associated with using
Microsoft Access® with COLLECTION (discussed in Chapter V).
34

AvaUable software for Code 128 Mode C for FUeMaker Pro® is Umited. The bar
code translator used in the Paleontology Division is Mac Bar Font by Worth Data
(formerly Worthington Data Solutions). However, this software does not have a
con^atible version of code 128 with FUeMaker Pro® (Worth Data, per comm, 1999). In
August, 2000, Life Success announced that it has the abUity to translate code 128 with
FUeMaker Pro® (Weigand, pers comm. 2000).
Choosing a Bar Code Reader
Many different types of bar code readers exist. AU bar code readers consist of a
reader (or wand) and a decoder (sometimes caUed a wedge). The decoder can be at the
hand-held unit or at a base station. The bar code reader can be cordless or corded. A
good read is detected by sound and/or a flashing light at the base station, computer, or at
the hand-held unit. The distance between the hand-held unit and the computer can vary
from several feet to 300 feet depending on the hardware (see Table 4.3 for some
examples). Types of bar code readers include wand/pen, gun, and omnidirectional.
The reader produces a Ught that either is reflected or absorbed depending on the
bars or spaces ofthe code. The decoder converts the data sent by the reader into the
electrical impulses and then translates the code so the computer can receive the data as
characters (Worthington Data Solution, 1998). The data sent from the decoder is
received by the computer just as is data from the keyboard.
The Ught produced in a bar code reader can be a Charged Coupled Device (CCD)
or laser. CCD readers are generaUy less expensive than laser readers. CCD readers,
35

however, are not as reUable as laser readers. Depending on the manufacturer, CCD may
or may not read around curved surfeces (Dee, pers. comm, 2000; PosDirect, pers.
comnL, 2000) and the reader must be held close to the bar code. Recently, however, the
technology for CCD readers has improved (Dee, pers. comm., 2000). The reader can be
placed several inches from the bar code (Worthington Data Solution, 1999) and some can
now read curved surfaces (Dee, pers. comm., 2000).
Table 4.4. Examples of Different VariabUities of Bar Code Readers Differences include distance from the base station to the type of good read, and type of decoder. AU of these bar laser and can decode code 39.
Available, coir^uter, wireless, code readers are
Companv
Amoican Microsystems, Ltd 1-800-648-4452 PosDirect 1-800-622-7670 BarCodeStore Metrologic www.metrolopic.com Worth Data 1-800-345-4220
Model
PSC Power Scan MS6130
LS3070 MS 6130
LZ202-RP laser Reader
Lensth
75 feet
30 feet
50 feet 30 feet
100 feet
Cable/ Wireless
Cable
Wireless
Wirdess Wireless
Wireless
Read tvpe
Visual at Unit
Audio
Waiting on answer Visual at unit
Audio at unit
Decoder type
Internal
Internal
Internal Intonal
External
Notes
"Rugged"
Qiarging stand; No ^>ecial opoating license S hours of battery life
8 readers/base station
No one type of bar code reader is good for aU coUections. A wand/pen bar code
reader, however, is not recommended because it requires physical contact with the bar
code. After numerous reads ofthe bar code, it potentiaUy could damage the bar code.
The type of reader required for each coUection depends on its needs. Table 4.4
shows some sources of bar code readers and some common variables. Limiting fectors of
the coUection such as the size, location, weight, stabUity, and physical location are aU
considerations (from Phase I) that should determine the type of bar code reader chosen.
In some instances, the reader must be taken to the objects whUe in other situations the
36

object(s) wUI be brought to the workstation. As previously mentioned in Chapter II, an
inventory map ofthe coUection's storage area can help determine the best bar code reader
for the coUectioiL
AdditionaUy, more than one bar code reader may be needed for the different uses
in various coUections in a department. An art coUection may require a hand-held reader
that can read the bar codes from relatively great distances so the artwork would not have
to be moved. The Paleontology Division at MoTTU requires a bar code reader that is
cordless and can travel up to 80 feet from the computer to the specimens. The NSRL
Vital Tissue coUection requires an omnidirectional laser reader so two hands can be used
whUe handling the frozen tissues. An omnidirectional reader also is useful for fragUe
objects that require two hands to handle it. The Archeology Department at P-PHM
requires a gun-type bar code reader working within a short distance ofthe computer
because scanning would be taking place at a workstation near the computer. It is
important to remember that other types of hardware may be purchased and added to the
system later, as necessary.
Selecting a Bar Code Printer
Two types of printed bar codes exist: pre-printed, or printed-on-demand. Pre
printed bar codes are produced by an outside con^any. The bar codes are pre-printed
either on the packaging (e.g., a cereal box) or on a label that must be attached to the
object (e.g., those used in Ubraries). Printed-on-demand labels are produced in-house
(Percon, 1998). Printing the labels in-house aUows the user to have more control over
37

what is included on the label, such as catalog number and accession number. In addition,
individual labels or codes may be printed, as needed; an option not possible with pre
printed codes.
The labels are taken to a printing company and cut to size at P-PHM and MoTTU.
The bar code can be printed with a bar code printer, a laser or Inkjet printer, or a label
printer. The bar code printer cannot add additional information from the database. This
type of printer is designed to print only the bar code. Laser and Inkjet printers aUow many
different combinations to be printed along with the bar code. Laser printers produce bar
codes that are more reliable because they create sharper bar codes and are more
permanent; the chances for the bar code to smear are greatly reduced. However, laser
printed codes are subject to abrasion and the toner could potentiaUy wear away. Inkjet
printed codes are subject to fading and smearing (are not waterproof). Dye sublimation
printed codes are permanent and waterproof, but the acidity of the ink is unknown (Monk,
pers. comm., 2000). Whatever printer is chosen, the ink/toner should be tested for
permanence (Williams and Monk, 1999).
System Operator
From the beginning of Phase III, it faUs to a single person in each department, the
system operator, to oversee and coordinate the bar coding efforts. The system operator
needs to be the curator or some other permanent feculty/staff member in the department.
Regardless of who is implementing the Bar Code Phase ofthe project within each
department, it is vital that aU problems, concerns, and important developments are both
38
documented properly and handled by the same individual. Having the project conducted
by a single person simpUfies coordination ofthe procedures and prevents misinformation
and error by having too many people involved. The duties that faU to the system operator
include:
1. Making sure that the databases adhere to the museum-wide database model
and have been upgraded into a relational format.
2. Installing the bar code.
3. Ensuring that bar code numbers are unique within and between departments.
4. Keeping in contact with the database manager, system operators from other
departments, and the institution's data management committee.
5. Coordinating any other efforts that involve the database.
In order to fiilfiU this role properly, it also is necessary that the system operator
understand the uses and problems inherent with the DBMS utilized by the department and
the institution.
UntU it is possible to change fonts and the design in printed reports directly from
COLLECTION, the system operator at P-PHM also wiU be in charge of con:q)Uing and
upkeeping a departmental folder. This manual wUl include what reports are created,
where the reports are stored, what field(s) and their orders are used, and a back up of
every report. It is vitaUy important that every report used in the department be fuUy
documented as to its use and what fields are involved (see Chapter IV). In order to fulfiU
this role properly, it also is necessary that the system operator understand the uses and
problems inherent with the DBMS utUized by the museum.
39

Database Management System
The restrictions ofthe Database Management System (DBMS) or coUection's
database significantly affect the bar code system. An understanding ofthe DBMS
limitations is cmcial when instaUing the bar code system into the database. The database
"that accepts the bar code data is in 95% control ofthe success or faUure" ofthe system
(Worthington Data Solutions, 1998). Phase IV includes designing views and reports for
the bar code system. Some of these views and reports may not be possible in some
databases and other databases may require scripts or programming to use some views and
reports. Therefore, it is important to rely on aU types of avaUable support such as printed
manuals, customer support, or the database programmer. At both institutions, the
programmer was contacted for help with the project. Since adding bar code capabiUties to
the database expands the programs' capabUities, the programmers were very happy to
assist (Vemon, per. comm. 1999-2000; FUeMaker Pro®, per. comm. 1999-2000).
A Relational Database: COLLECTION
The Panhandle-Plains Historical Museum (P-PHM) has over 114,500 records in
COLLECTION, a DBMS, manufectured by Vemon System Ltd. COLLECTION is a
relational database originaUy designed for registrar use. Every department at P-PHM
shares the same database for its coUections. COLLECTION has various forms used to
enter data Figures 4.2 and 4.3 are examples of two forms in COLLECTION. The first
form (Figure 4.2) is used to quickly locate and open other forms such as Identification
General, Administration, etc. Figure 4.3 shows the Identification General form.
40
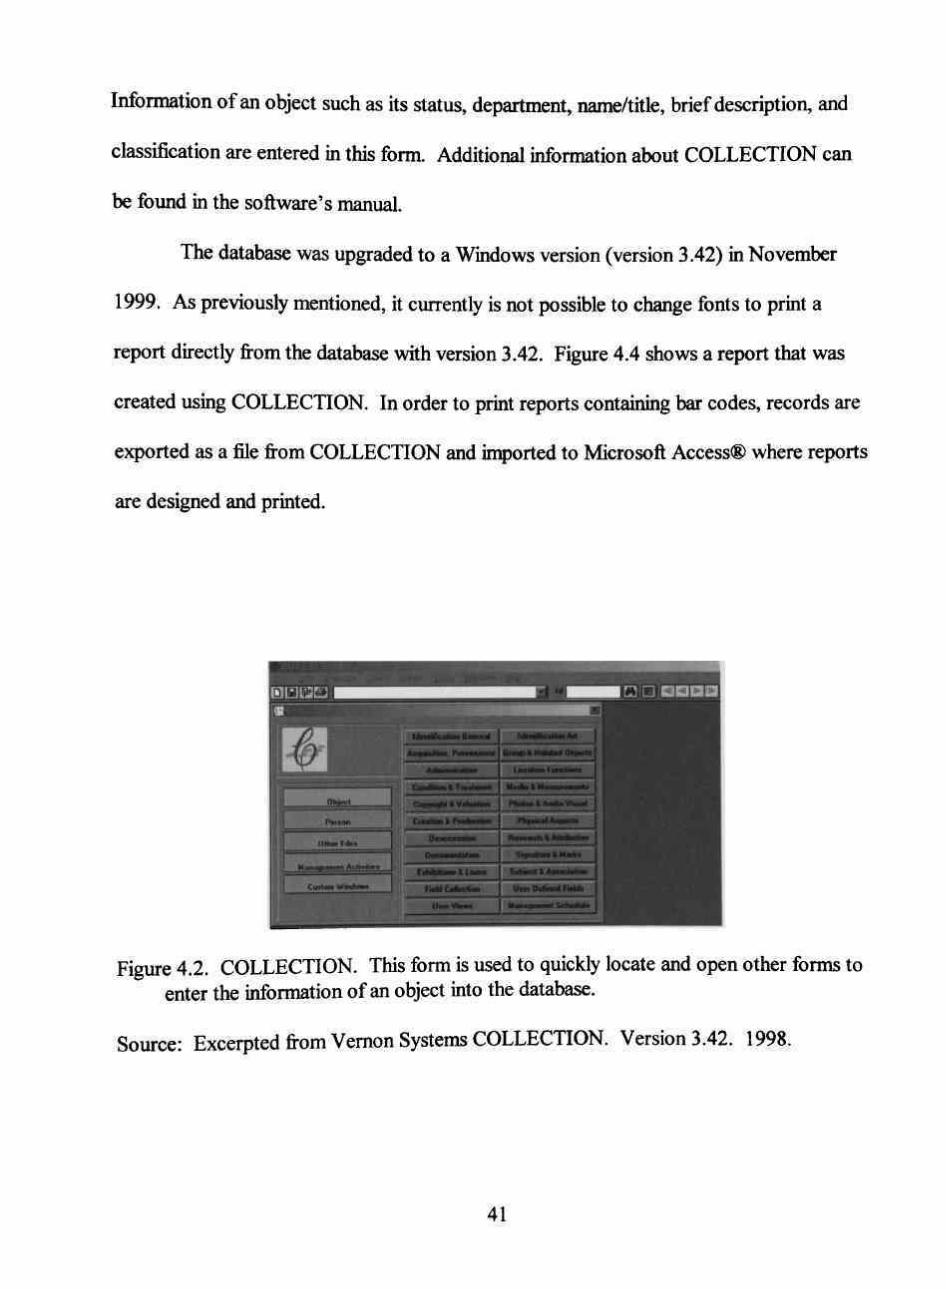
Information of an object such as its status, department, name/title, brief description, and
classification are entered in this form. Additional information about COLLECTION can
be found in the software's manual.
The database was upgraded to a Windows version (version 3.42) in November
1999. As previously mentioned, it currently is not possible to change fonts to print a
report directly from the database with version 3.42. Figure 4.4 shows a report that was
created using COLLECTION. In order to print reports containing bar codes, records are
exported as a file from COLLECTION and imported to Microsoft Access® where reports
are designed and printed.
>^mmi,
Obiecl
Manageraecrt Aclivrtie»
CtMom Window*
Identification 8 e f w | H |
A c q i u i t u r t Pi0v«fumc«
AdMnutration
Condition & Treatnent
Copvf ight & Valuatian
Ciaali im fc Piodudion
Deacces*ion
D o c u n e n l M n n
EshibAtaife»& Loans
Twtd Colection
I U H Views
H H j ^ l p c a t i o n Art
era i«>« HflWAd QbiBCit '
Location FundionK
Medw I I Measwcownts ,
Ptwhis & Audio V i u u l
Phfsical A*poc<a
Reseaich t AUnbution
St^naluift & Maifct
Subiect t Associalion
Usei Oeftned Fwldi
Manaqemenl Schetitdm
odiaa
Figure 4.2. COLLECTION. This form is used to quickly locate and open other forms to enter the information of an object into the database.
Source: Excerpted from Vemon Systems COLLECTION. Version 3.42. 1998.
41

Figure 4.3. The Object-Identification General Form. This form is used to enter basic information about an object. Note that the information in the classification field is entered from specific to broad and how it is a multi-part field for this archeological object.
Source: Excerpted from Vemon Systems COLLECTION. Version 3.42. 1998.
Tr,. (; ; r,Tr>ri,in'1li P :. i I. bf-J-Kl D i - . c r i p L i u i i t ; M l l tu!:k jpliotogrApri of bronze injLdn elephant u i th true luorji tUSRS pliotQ9r»f»h of branzff Indian elephant u i t h t rue iuori i tusks ; t ) laRk /« t i i tc . 11.7 K 1 ? . 6 en j a w t l l n tusk pbotoqrjplis of bronze Inilldi) e lvph in t u l tn rrue luori; tUSKS foot- p ieces nastodor) t e e t h ( I r l i tphot fanC) haopllna rusti r r jgnent of task nannatA task iRaiinottt ta&k funnotn rusk; co l l ec ted near P l a i n u i r v , Tex«s tusk; co l l ec ted I n S tCdt fo rd . Texat Rhinoceros tooth anrt tLSk i n s4Pie rwi t r ix ; eo l lgc ted nt,tr Uldteadoi i , Ivxi^ nafftodon tusk , f o s s i l , prepared and noonteil by Hr . C t idober l j in ; co l l ec ted Clarendon. TeK4S, 193* irwstodon tusk t tM phologr.kpti!» ut Q nunber A; s k u l l of four tusked nastodon, 1938; nen in photMiraph art Ben Chaptberlaln: Joe P i l l i ; N .J . Vaushn; John Lyncn or B t i l Rlauss ( four nen p i c t u r e d , f l u e nanes I d p f l t i f i P d ) : b l *ck *nd *<i i te pliatogi-4ph of s k u l l of « foJT tusxed nastoOon n i t h four inc lud l f ig : H .J . Uaughn; Joe P i l d l l ; Drn C ianber la ln ; Jne Lynch or B i l l Klauss; a t at on RO Ranch. 1938 r e p r i n t , " I h e Shovel Tuskers, RBebeladontinvie of jcent ra l A s i a " , Ihe Anerican Huseon iif Hdtura l R ls tor i ; , ftnerlr.in Hri'seon N o w i t a t f s , n in *e r <i/n. fli»ril t n . 1»31 .
. p( ; . i".-t,,-,-n r - i i j •^:. Ci J I g . ' l
Accession 9«tu.
Nar 24 1«Bt
Oct 2« 1926 sop 7? I M S
1V2B iosd ^uwter m ? Pre 19711 Pre t97ii Pre 1V7II Hnw ?0 1979 Oct 15 1932
Pre 197*
Aug 19 1933 tttir 06 19AB
tlar 06 1968
riar 06 1961
it^' , * * \
Figure 4.4. The Font Cannot Be Changed in a Report with COLLECTION.
Source: Excerpted from Vemon Systems COLLECTION. Version 3.42, 1998.
42

A Relational Database: FileMaker Pro®
Currently, the Museum of Texas Tech University uses three different versions of
FileMaker Pro®. Except for the Natural Science Research Laboratory, every division at
the Museum of Texas Tech University uses FileMaker Pro® as its DBMS. The actual
directions for installing the data enhancement system are foimd in Appendix B and are
modeled after FileMaker Pro® 4.1, but are still easily found in the other two versions.
FileMaker Pro® has four modes: Browse, Find, Layout, Preview. Each mode
serves a dijBFerent purpose in FileMaker. The last part of FileMaker Pro® used in the DEP
is a script. Scripts can be written in FileMaker Pro® to create shortcuts for longer
processes. The scripts can be written to change between modes and with finding, sorting,
and printing records. A script may be accessed after it has been written, through the
Script Menu or by creating a Script Button (FileMaker Pro®). Scripts may be used in the
DEP to override limitations in the program (see below).
Several problems exist when trying to incorporate the bar code system with
FileMaker Pro®. The problems include kerning, the multiple find fimction, and the
inability to perform validations when the auto-enter feature is activated.
Kerning refers to the space between letters. The first problem in FileMaker Pro®
is that it automatically justifies the kerning in non-bit map bar codes to be the uniform,
resulting in unreadable bar codes as seen in Figure 4.5. Only bar codes imported as a
bitmap (images) are readable in FileMaker Pro®.
43

Figure 4.5. FUeMaker Pro® Has Difficulty With Kerning Bar Codes.
Source: Excerpted from FileMaker Pro® 4.1.v3. 1984-1999.
The second problem in FileMaker Pro® is its inability to find a random set of
records by using one retum character to continue to the next search parameter (FileMaker
Pro®, 2000, pers comm.). This feature is one ofthe three minimum requirements (as
previously mentioned) that the DBMS must be able to perform to use the bar code system.
A bar code reader ends its read with a retum character. FileMaker Pro® translates the
retum character as an end of a fimction. A script must be written to make the retum
character from the bar code reader as part ofthe script, and not the end ofthe fimction.
Some readers can be programmed to omit the retum character from the scan, but a
different script must be written to tell the computer that the scan is conqjleted
Another problem in FileMaker Pro® is that it does not check for any validation
mles when data is auto-entered (FileMaker Pro®, 2000; per comm). When the Serial
Number is ready to rollover, changing the division ordinal, it cannot automatically be
stopped. Each division at MoTTU must become aware of this problem and report to the
database enhancement committee before this occurs. The database committee will keep
track ofthe number of records each division has on a yearly basis.
44
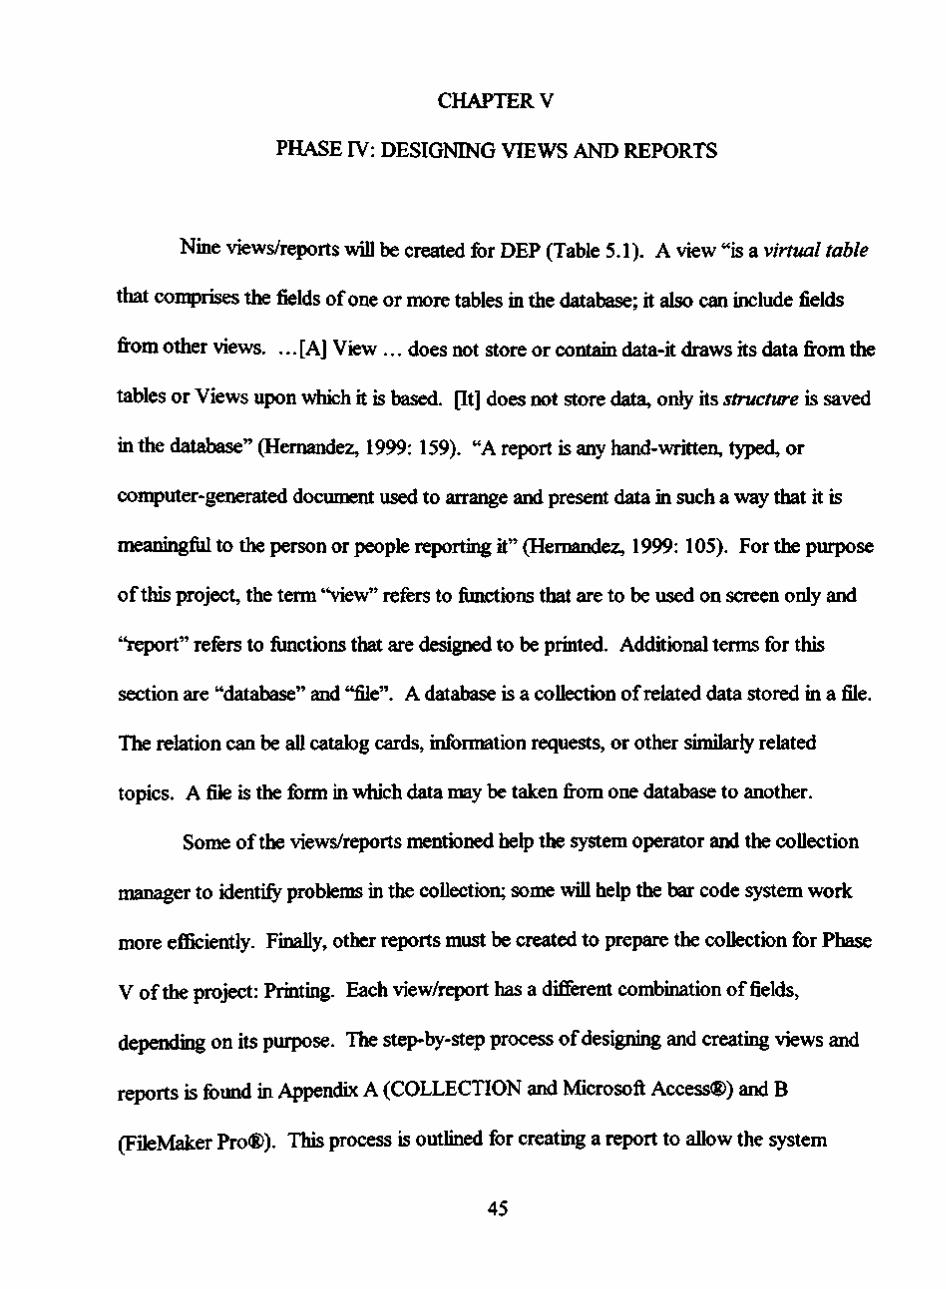
CHAPTER V
PHASE TV: DESIGNING VIEWS AND REPORTS
Nine views/reports will be created for DEP (Table 5.1). A view "is a virtual table
that comprises the fields of one or more tables in the database; it also can include fields
from other views. ... [A] View ... does not store or contain data-it draws its data from the
tables or Views upon which it is based. [It] does not store data, only its structure is saved
in the database" (Hernandez, 1999: 159). "A report is any hand-written, typed, or
computer-generated document used to arrange and present data in such a way that it is
meaningfiil to the person or people reporting it" (Hernandez, 1999: 105). For the purpose
of this project, the term 'Siew" refers to fimctions that are to be used on screen only and
"report" refers to fimctions that are designed to be printed. Additional terms for this
section are "database" and "file". A database is a collection of related data stored in a file.
The relation can be all catalog cards, information requests, or other similarly related
topics. A file is the form in which data may be taken from one database to another.
Some ofthe views/reports mentioned help the system operator and the collection
manager to identify problems in the collection; some will help the bar code system work
more efficiently. Finally, other reports must be created to prepare the collection for Phase
V ofthe project: Printing. Each view/report has a different combination of fields,
depending on its purpose. The step-by-step process of designing and creating views and
reports is found in Appendix A (COLLECTION and Microsoft Access®) and B
(FileMaker Pro®). This process is outlined for creating a report to allow the system
45

operator to gain a greater understanding of reports and their uses. Once the system
operator is comfortable with the view/report-maldng process, existing views/reports can
be altered to suit the department's needs and additional reports can be created.
Table 5.1. Nine Views or Reports Used in the Database Enhancement Project.
VIEW OR REPORT
Data Entry View
Single Find View
Multiple Find View
Proofreading Report
Information Label(s) Report
Multiple Print Report
Classification Report
Work Report
Inventory and Loan Report
USE
Used to enter information into the database.
Allows the bar cxxle reader to scan one record at a time.
Allows the bar code reader to scan numerous random records.
Can be printed to take to the collection to verify information before printing. The view for the catalog cards, accession cards, and specimen information labels.
Allows the database to print multiple copies ofthe same record.
Can be printed to sort and view information in groups for proofreading and research. Works in combination with Scan Find view. Can be printed to identify and solve collection management problems.
Identifies missing objects in a loan or comprehensive inventory.
Before creating a report, its purpose first must be defined and a 'rough draft' of
the report be created on paper. The draft must include what fields are needed from the
database, how it is to be designed (layout), and how it will be used. Fields are chosen for
their appropriateness to the report subject. Too many fields may cause confiision and
make the report hard to use.
46

Views
Data Entry View
The Data Entry View is the view where the data from the collection is entered.
This view needs to be made so data can be entered easily. This view needs to be updated
to reflect the fields that have been modified, or created in Phase II. If a field does not
belong on the View it must be deleted. Deleting a field in a view will not delete the
information associated with it. The data entry view was not changed at P-PHM.
However, this view dramatically changed in the Paleontology Division at MoTTU (Figure
5.1).
Single Find View
The Single Find view is written to enhance the performance ofthe bar code
system. This script allows the user to find only a single record at a time. The DBMS at P-
PHM, COLLECTION, afready has this view installed. The user must chck in the "System
ID" number field and then scan the bar code with the bar code reader (Appendix A).
FileMaker Pro® works in much the same way at MoTTU. In this DBMS, the script has
been expanded to find the record corresponding to the serial number scanned and then
change to another view/report (Appendix B).
47

iMftMht ^J<WkS,tn*
ivmiey
(a) Old Paleontology Data Entry View.
^ ^ 7 OMOact
L l ^ V ' l i - tobn i to P d l f o i i J o l o g y
KOO
PstvMnu Cdvtot t
r»)i»
awa
O n
I M «
pIBity
OtiJto
Sfcdn
Moqb
P n M B(«cA
Ac*
O D D K I U
Tik
U«t i iy
OotoJc
S«»
Co 0 x 7
Omip
COLLECTIONS
REPTILUk
THECOCXDrfrU
PCCCSAURDAE
POSTOSUCHUS
KIRKPATRICKI SKULL AI(D POSTCRA,»«Ll, AOU.T rCtVIDUAL
TBUSSIC
U T E T O A S S I C
MESOZOK;
SCtUTTERJEet.PAP'nf
1980 es POSTOUAflRT.MLLERRM^CH
a*RZA
TEXAS USA
DOCKUM
PecnMii. COOPea C A W O N
Mtabfi
R c r o i d i E S a « l » i
A s » x n n l I N M t
LOMtOA
C1m>»i'
an
latf
T « *
n n w k i
OFFICE O t m t D D n v n 6
OYi» Ol«» H t v 7 h ( C i » « k » ' O V w
• • • • PQ^I r^JB W^^^Jk ^ 10
lOLOTTPC -
M X O T Y P t . C H A n t f t J t E . S 1WS POSTOSUCMOS.ANEW THEOODOMTUM BEPTO. E FnOMTHE TRASSICOF TEXAS AMD TVE O f l O N Of T i f t * f l tO$AUf tS PtillOSOPHICAL TAANSACnOMS OF THE nOTAL SOCIETY OF LOMOOH 8 309 a S l M M
(b) Updated Paleontology Data Entry View.
Figure 5.1. Data Entry View in the Paleontology Division at MoTTU. The Data Entry View must be updated to reflect the changes in Phase IL The additional fields added during Phase II (e.g., 'Status) are placed into the new design to increase the efficiency of data entry.
Source: Excerpted from FileMaker Pro® 4.1.v3. 1984-1999.
48

Figure 5.2. Single Find View in COLLECTION.
Source: Excerpted Vemon Systems COLLECTION. Version 3.42. 1998.
Multiple Find View
This view is required for finding multiple records at random. COLLECTION has
this function built-in (Appendix A). FileMaker Pro®, however, requires three scripts to
be written to override its inherent programming (Appendix B). A bar code reader ends its
scan with a retum character. FileMaker Pro® interprets the retum character as an
instmction to find and not to continue entering numbers. (Note: some readers can be
programmed to omit the retum character from the scan, but a script must be written to
"tell" the computer that the scan is completed). The Multiple Find scripts (Start Find,
Perform Find, and Stop Find) are written to allow the user to scan a series of numbers
before exiting the script.
Reports
Proofreading Report
The Proofreading Report will help to identify errors in the database. This
report should be created and used before information tags are printed. A printed
information tag does not contain all ofthe information about the object and,
therefore should not be used to proofread the database. Data are printed using the
Proofreading Report and are compared with the collection. Additionally, this
49
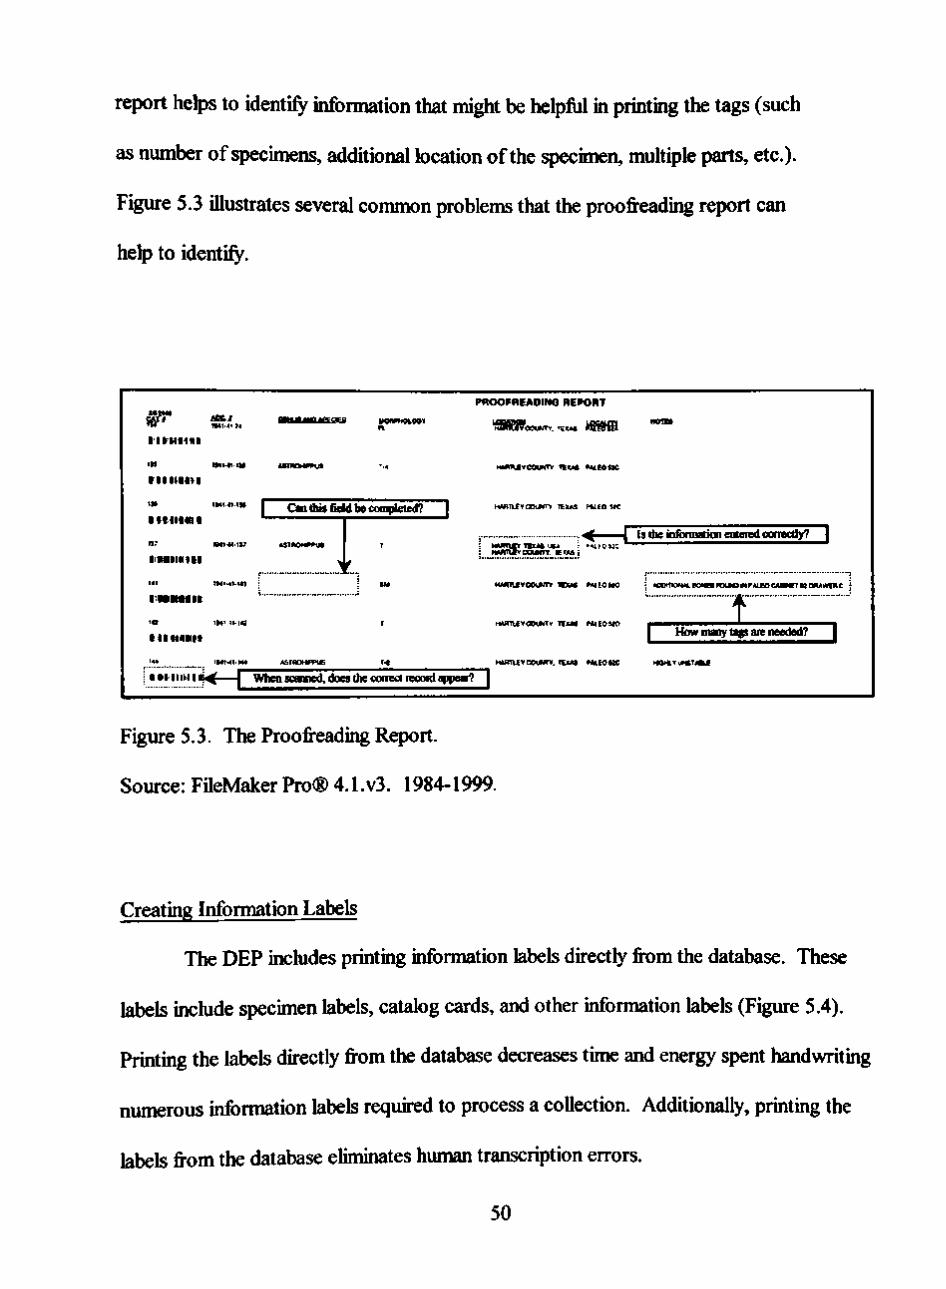
report helps to identify information that might be helpfiil in printing the tags (such
as number of specimens, additional location ofthe specimen, multiple parts, etc.).
Figure 5.3 illustrates several common problems that the proofreading report can
help to identify.
l l l ' I I I IH I
OS iMiai l u
l l l l l l « M
<M IMKVIM
l l l l l l l t l l
13^ 1941-41-137
•iimiiiiiKi
141 1941-41.141
Illl4)llllt«
144 1Mt-4l-144
i i t n i i i i i i r l ^ — T "
1
Wh
i
AST«0«PPUS
PROOFREADirMj REPORT
n. H«RTiEy<xx«Tv. TtxA« WTEOSU
•4 H»Bn£YCOUMTy TIXAS P/U.fOJ»C
CaQ tb is field b e completed? | MAfiTi£vc»i*jTY TEXAS PWEO SK
ASTROMPPUB
> f
*STf«OHPPlJS
en scanned, does the
.<—[ T HAPTTLEY TEXAS U6> : ^'^Lf0 53C
HJUnVEYCOUHnr. lEKAS-
SM «*RTL£rOOUNTY TEXAS PME0S4C
I-» MARTltY COUNTY. TEXAS PAIEOHC
conect reocHd appear? |
tram
Is the information entered oonecdy? |
1 ADOIHOMAI. BONES POUND IN P A l £ O C A B > C m » U W E t l C I
f 1 How many tags are needed? |
HOHLY JNSTA8LC
Figure 5.3. The Proofreading Report.
Source: FUeMaker Pro® 4.1.v3. 1984-1999.
Creating Information Labels
The DEP includes printing information labels directly from the database. These
labels include specimen labels, catalog cards, and other information labels (Figure 5.4).
Printing the labels directly from the database decreases time and energy spent handwriting
numerous information labels required to process a collection. Additionally, printmg the
labels from the database eliminates human transcription errors.
50

Specimen/object labels are created the same way as all other reports (Figure 5.4a).
Care must be given to the type of paper and ink used (Williams and Monk, 1999) and how
the labels will be attached to the specimens. Labels are attached to a specimen or object
according to current collection management policies as discussed in Chapter VI. Labels
can be printed front and back (e.g.. Figure 5.4b and Figure 5.4c) and can be redesigned to
print catalog cards (Figure 5.4d), accession cards, and other formats as needed. If the
information label is printed front and back, then the catalog number needs to be on both
sides to allow users to verify that the information on both sides refers to the same object
(Figure 5.4b and Figure 5.4c).
An information label is created the same way as the proofreading report. The
mailing label option is selected and the report is designed to optimize the use of paper.
Example reports are provided for the archeology catalog card, archeology tag, and a
natural science tag report. A copy ofthe table, fields list (in order), and specific
instmctions for each report must be included in the departmental folder for all reports
created.
51

(a) An Example Tag v^th a Bar Code.
M VERT
CAT. N0# NAME
MORPH.
LOCAUTY
FORMATION
COLLECTOR
iHIIIHIilll
USEUM OF TEXAS TECH UNIVERSrTY EBRATE PALEONTOLOGY COLLECTION
700.S ACCNO.«l 974-60 NYCTITHERIUM N
T-V-R-P4
SEROTINUM
POWDFR WASH; UTAH USA
CHATTERJEE
llilllllil
PERIOD
DATE LOCATION PALEO
PANHANDLE-PLAMS HISTORICAL MUSEUM Zoolfigyrtlatural Hisloiy
DeacripCon: Calamospiza meianocotys /tec. r 1999 37-il IIIIIHIIIIIIIIIIII
(b) Natural Science Card, Front Side.
Ace. 111:1999.373.1 Cat. ft 99 Description: Calamo^za melanocorys Sex CoN. end Date: Location:
(c) Natural Science Card, Back Side.
PANHANDLE-PLAINS HISTORICAL MUSEUM
Archeology
Ace. No.:Acce98ioned 1996 161 Cat. No: A2~A2.1
Classification: projectle point Na of Specimens; _1_
Provenience: Randal Countv/Texas: Provenlencg Surface
Description: Aibates. proiectle point. dartDointf?y corner-notched, tip and part of one barb missing
Collector Dr. Jack Hughes (Canyon) Date: May 11 1953
Dale Cataloged: Mayll 1953 System ID No.; 103214 l | | | | | | | | | l | |
(d) Catalog Card.
Figure 5.4. Information Labels.
Sources: (a) FileMaker Pro® 4.1.v3. 1984-1999. (b) Vemon Systems COLLECTION. Version 3.42. 1998; Microsoft Access®.
Version 2.00. 1994 (c) Vemon Systems COLLECTION. Version 3.42. 1998; Microsoft Access®.
Version 2.00. 1994 (d) Vemon Systems COLLECTION. Version 3.42. 1998; Microsoft
Access®. Version 2.00. 1994
52

Multiple Printing ofthe Same Record
Some objects may be large or have multiple parts and require more than one label
A concem is that the archival paper for the information labels is expensive so every effort
should be made not to print unnecessary labels and to maximize the number of labels
printed on a page. Not every collection's database is designed to allow multiple copies of
the same record to be printed. The problem is that there may be a different number of
labels required for each specimeiL The sinplest way to address this issue would be to
create duplicate records within the database. The difficulty with this is that the database
(if designed correctly) will not allow multiple records containing the same (unique) bar
code or serial number. If the collection's database does allow the entry of multiple
records with the same catalog number, it needs to be changed to ensure accuracy ofthe
bar code system by enforcing the uniqueness ofthe bar code number.
At both institutions, it was impossible to print multiple copies ofthe same record.
Two methods are available to print multiple copies ofthe same record. The first is to print
multiple copies (i.e., print all that need two copies twice, then those that need three copies
three times, etc.). The second is to export the records to another database that does not
have the uniqueness requirement. A separate database, specifically designed for multiple
printing, can be used by duplicating each record so the correct number of labels will be
produced. Exporting the records to another database does not delete or change records in
the main collection's database. However, special consideration must be given to ensure
that the bar code numbers remain the same for each record for both databases and that the
records (in the temporary database) are deleted after printing to avoid confiision. Under
53
no circumstances should the records in this temporary database be edited, as the main
database will not have been changed and changes will be lost.
Classification Report
The Classification Report is usefiil for responding to information requests and for
quickly identifying objects in the database. This report has the ability to group data in the
report reducing redundancy and increasing readability. Figure 5.5 shows a classification
report for the Archeology Department at P-PHM. This report groups objects by
Name/Title and then sorts by the accession number. The fields are not limited to the fields
shown in Figure 5.5 and many different combinations can be created for different
purposes. For additional ideas and help designing this report, refer to DBMS's user's
manual.
n.etii.<x> Archaology Classification Rsport
33/20
MSA03 Reoosiwv 4lsW23tAfaa cma** Pontrchen. d^oppv.coniiAm codnoMef*lesstfian 1*2of sjriBae outer PaMantsnca strati Opon «<«c.»»ag Zt-SfaiZtS n ^ l»l«i»l « ^ 1»l<«) •«( HigWI, !>«««) «J««J.!Smii tW Nl«-15(l«20.26 »»UntlHcntaog,mK i » « . i f j i K •ni«WBii(jto»oe*tar
S»5lBH_l Ooiea_aviM OdWjD ntmtnttt an*_DMeu>«oo F«ld_Co«_Plat«_No«« U«j«(J.OMK« IWli, o . _ C a r t
M«3«5 nepoulin 4tSW23iA«» cv» Po«wcn«l.eB» <»t»««ving(*!<wmoonKioo»»<tmo<»»ia<ih»»(il Prtntumx SIrMia Opan l „ _ . „ , . . 2t-Sy»231» sunta.oorrftn 1KKt»>ialnm22itmgmmall>txnrtllm C N t » - l » C » . 3 S tti**lgWicMala9r«M
I9m27.311 i02.«O««<knni mmnLfwUKiKelUafr
1)6356 RsiKtsilorv 41SW23[Ar»a owe POSH chert, owe cortex ainlKiigp«(ta»ni. ooniilBle cartel co«ni««(pftito( Picwemooco S»etuin Oser I ^ ^ ^ / 2I-3VV23908 svlaM, M i M ivnovadHm 79(ta0r«e«of t t^ iMnn*^ 73x10OHSfinim 0. N'SS-'fiOfE^SOO Siw>vgia?/^tf.tJtogtlffiw
iaW27 3111 ein«r*EiTipioT«e*ler
11«377 Reoo*«XT 4)SVV23HSrea OOIB P M U , * « i t core comKele Kigt^lacemrtMH plafcm e o * x ra.««« le«i Piovvaenca jSkMum Open ' . ~ ~ . . , 21-SW234S3 « i« i in iy« iHKe 1l•u•'eln!w^<llOln2TO«^«^«o(»^•l^w»now B. NIW- iSaCiMI) Slie'vn^ArertoloOT/Bes
1M« 27 31 '4 f ^ J , 8,74:aimm ..-«*lET*.»e.»to«<
iiBTMi R^noaXDiv 41SW23«*/»« coie I«is««,Mp«t « » cowpWi >"»•«««n«i«Ipl«lom> oortei oo»e™ e n Pianenanoe SInIa Open l ° - w w r w r 2,.sW2a«06 ininl««»lac«.a:»»s2o<3ll*e5ieno«od 37««ti2Jmm B.O N1S6-H*E2»^3C Sr«lyr»» cn«*.5»iB.i
1999 2T 31 15 •n«rtC<TiiM>ye»MHi
Figure 5.5. Classification Report From the Archeology Department at P-PHM.
Sources: (a) Vemon Systems COLLECTION. Version 3.42. 1998 (b) Microsoft Access®. Version 2.00. 1994
54

Work Report
The work report is used to help wdth identifying and tracking particular problems
(e.g., deterioration, requires consolidation, etc.) in a collection. The bar codes on the
labels are scanned (using the Multiple Find View) for those objects where the particular
problem is present. The Work Report then is used to create a list ofthe items needing
particular type of attention. The list then is printed as a report and/or can be saved in the
database. Figure 5.6 shows a work report used to identify objects that require
stabilization. The list was created by scanning the bar code labels of objects that need to
be stabilized. The list was then saved in FileMaker Pro® and a report was created. A
check box was added to each line ofthe report. The box is checked to indicate that the
task has been completed. This report may be modified to address many different possible
situations.
March 12, 2000
Calaloo #
2127
2128
2129
2130
2131
2132
A««n f 1972-242
1972-242
1972-242
1972-242
1972-242
1972-242
Work Report
Qanus and Soaciaa
ADJIDAUMO
ADJIDAUMO
ADJIDAUI^^
ADJIDAUMO
ADJIDAUMO
ADJinAllMO
Specimens needing stabilization
Location
paleo 1 1
paleo |~~J
paleo p ^
paiM •
pai«o r i
Figure 5.6, Work report is used to aid in collection management duties. A box at the right of 'Location' was added to allow space to mark when the task is completed.
55
Inventory/Loan Report
The Inventory/Loan Report is usefiil for identifying objects currently not in the
collection. This report can be used in a comprehensive inventory or with a large loan. A
"found set" of records is created (either in the main database or as a separate file). This
set will include all the specimens/objects that are supposed to be in the collection. The
bar codes ofthe objects that are actually in the collection then are scanned and each is
omitted fi-om the "found set". Once the scanning process is con^lete, only those objects
not found will remain in the "found set" and a report of these missing objects can be
printed. This process makes inventory control simpler and allows effort to be
concentrated on finding the missing object(s).
The Inventory and Loan Report also is useful for other reports (fi-om above),
especially when a larger report is created or when multiple reports are required fi-om the
same set of records. A Multiple Find is performed to locate a set of records. If time
prevents continuing, then the records are saved as a list and the list is reopened to finish
locating the records. When all ofthe records are located, a report is created the same way
as the work report.
56

CHAPTER VI
PHASE V: PRINTING
Printing information labels and bar code tags is the final part ofthe project.
Premature printing can be a waste of resources, especially if atten:q)ted before the data
model has been established or before the data associated with each label or report has been
proofread and verified. The purpose ofthe DEP is to reinforce and strengthen the
accuracy and control of information ofthe collections; initiating the printing phase outside
ofthe ordered sequence set forth herein nms coimter to the project's objectives. The
steps involved in Phase V include: working in organized groups, tracking the progress of
the groups, ensuring that the data printed is correct, and attaching the label. Phase V uses
the reports designed in Phase IV to help double check the data and to print the
information labels.
It is best to print out the information tags in small, organized lots as defined by the
department's system operator/collection manager. For example, it may be easier for one
department to print tags by catalog number, while another department prefers to print by
location ofthe objects, or by collection- Dividing the print jobs into sections allows the
task to be managed more carefiiUy. After information labels and tags are printed, the
information labels and labels must be cut and affixed to, or associated with, their
corresponding objects. The system operator needs to track the progress of each group to
prevent duplications or omissions (Figure 6.1).
57

Collection Processing Incoming collections
Deadman's Shelter
Accession? Catalog? Data Entry?
Half
Proofread?
N
Catalog Cards Done?
N
Tags Printed?
N
Match Tags?
N
Put Away?
N
Figure 6.1. Processing a Collection. The table used in the Archeology Department at P-PHM is used to track the stage of a collection during processing.
At times, there may be a need for multiple copies of a single label. Some objects
may be large or have multiple parts and require more than one label. A concem is that the
archival paper for the information labels is expensive so every effort should be made not to
print unnecessary labels and to maximize the number of labels printed on a page. To
maximize the paper space, the Multiple Printing ofthe Same Record Report (Chapter V)
can be used. Since not every collection's database is designed to allow printing of multiple
copies ofthe same record, the simplest way to address this issue is to create duplicate
records within the database. However, the database (if designed correctly) will not allow
multiple records containing the same (unique) bar code or serial number. As previously
mentioned in Chapter V, the collection's database must be designed not to allow the entry
of multiple records with the same catalog number to ensure the accuracy ofthe bar code
system. The decision of which altemative to use depends on the needs ofthe collection
and the methods chosen by the system operator for the collection.
Before data are printed, the data must undergo a final review to verify the records
are fi-ee of errors. This includes spellings, checking formats, making sure the bar code is
related to the correct record, and verifying that every field is complete. Printing labels
with errors or incomplete fields will result in having to reprint the labels in the future. The
58

data may be checked by using the Proofi-eading Report (Phase IV), because it is easier to
review a list than to look at individual labels. However, the information on the older
labels also should be checked to ensure that it corresponds with the database (a process
outlined in Phase I).
The decision of how to attach the tag is a collection management concem and
should follow established collection management policies and procedures. The placement
of bar code tags on objects generally is done in exactly the same manner that tags are
normally affixed to an object. The label can be placed inside the container with the object
(Figure 6.2). A laser bar code reader will scan a bar code through fluid such as ethanol
(e.g., for fluid-preserved specimens), thin plastic or glass vials, and polyurethane plastic
bags. If tags are normally sewn into the underside of a garment's hem, or if they are
physically tied to a specimen with string, then the association ofthe bar code tag with the
object is done in a similar manner.
Before each department starts the printing process, sample information tags, and
labels need to be printed to ensure the information card meets desired expectations and fits
in or on the object or container with which it will be associated. Printing sample
information labels assures that a stack of useless labels or labels is not produced by
mistake. If a bar code is on the information card, the ability ofthe bar code to scan
properly must be verified before begiiming a mass printing project. This includes checking
that there is adequate white space (1/4") around the code. If the bar code has trouble
scaiming, the amount of white space surrounding the bar code should be enlarged.
59

Finally, page layout for tags and labels should be checked to verify that they fit on the
page correctly and that the optimal page space for the report is being utilized. Two-sided
printing, if used, also should be checked for alignment.
Figure 6.2. Labeling Specimens. The bar code is included with the label. Provided that the label paper and ink are acid fi-ee, labels can be tied on, placed in the same box, inside the polyethylene bag or vial, or printed on a self-adhesive label and affixed to the object.
Source: a) NSRL at MoTTU b) Paleontology Division at MoTTU c) Archeology Department at P-PHM d) NSRL at MoTTU
60

CHAPTER Vn
PROBLEMS ENCOUNTERED
A bar code system tests the standards and strength ofthe database model fi-om
Phase II (Chapter III). Because the bar code system obtains its information fi"om the
database, it is impossible to begin the DEP without first reviewing the institution-wide
database model. The bar code system uses the data in the database to find records and
print information labels. If the database is not stmctured correctly, then it is hard to locate
fields and information labels can be printed with mistakes and are very difficult to design.
Problems encoimtered during this project mainly were due to a lack of understanding of
bar codes and the collection's database and how they interact with one another. Problems
with not knowing how the bar code worked with the database made it difficult to solve
many ofthe problems. In fact, most ofthe problems were not a result ofthe bar code, but
a non-standardized database model.
The Bar Code
Installing the bar code was simple at both institutions. A bar code software
program was purchased and then installed. However, at both institutions, it became
obvious that the collection was not ready to be bar coded. The problems resulted fi-om
not knowing:
1. What could be done with the bar code?
2. What exactly is a bar code?
61

3. How is a bar code produced?
4. How can the information be retrieved?
If a record cannot be found when it is queried using the keyboard, it is difficult to find
when installing and using the bar code system. Likewise, although a bar code is readable,
any reports will be worthless if the format ofthe information on it is not useable.
Unfamiliarity v^h the Database Model
Most ofthe problems existed because ofthe imfamiliarity with the DMBS and the
database model at both institutions. Fields that the user wanted to include on the report
could not be foimd, or the stmcture ofthe field was unusable (multi-part or multi-valued
fields). In addition, a database model that is not stmctured correctly results in difficulty
finding records, which is a problem when placing the information labels with their
corresponding specimen. The final problem was in assuming that just because the system
is being installed only in one department and only the needs of that department needed to
be considered.
A common problem at both institutions was unfemiliarity with the capabilities of
the collection's databases. This resulted in severe problems with not being able to
recognize the fiiU fimctionality ofthe DBMS and subsequently, how a bar code could be
used with it. For example, in the Archeology Department at P-PHM, the department did
not realize at the begiiming of this project that the collection's DBMS already had a built-
in fimction for inventories. Likewise, the Paleontology Division at MoTTU was not aware
that the collection's DMBS could perform complex search and sort functions.
62

The Panhandle-Plains Historical Museum's DBMS (COLLECTION) is based on a
sophisticated database model. Every field is defined as to its use and rules. However, a
stmctured database model has room for improvement. For example, when the natural
history labels were created, a field for Period could not be found. This field needed to be
added because the collection is sorted by Period in the collection area and would be usefiil
to have on the information label. Not only should this field exist for printing information
labels, but also often information requests are made based on Period. Without this field, it
is difficult to complete such requests.
Another example problem at P-PHM was that it was not known at the beginning of
this project all ofthe fields that existed in its database and which ones could be used for
the information tags, labels, and reports. When creating a report, specimen label, or
accession card, fields have to be chosen from the database. For example, the database at
P-PHM had two fields, "Other ID" and "Other Id" (Appendix A). When printed, both
fields produced similar information (i.e.. Other ID 1234 and Other Id 1234). After
investigation it was discovered that Other ID was the catalog number and Other Id was a
previously assigned number (i.e.. Field Number). Although the bar code existed in the
database and was ready to use, neither institution could start printing information tags and
other reports imtil the database had been standardized.
Both institutions had trouble with formats of fields. Figure 7.1 is an example of a
multi-part field that exists in COLLECTION. The data in the 'Classification' field are
entered into the field in reverse taxonomic order (Figtire 7.1a). This field caused three
problems for the natural science and paleontology collections. First, it was difficult to use
63

the search and sort fimctions in the database for data related to these types of collections.
Second, when the information labels were created the field was too long to fit on the
object's label (Figure 3.1b). Third, the Archeology Department wanted only the genus
and species on the label, not the entire taxonomic classification. These problems exist
because the 'Classification field' is a multi-part field and the information is taken exactly
how it is entered in COLLECTION (including misspellings) to create information labels
and reports. The only way to solve these problems is to change how the information is
stmctured in the database. To do this, fields must follow sound database design mles
(such as outlined by Hernandez 1999) and subjects in multi-part fields must be separated
into their own fields. To relieve the immediate problem ofthe 'Classification' field, genus
and species were placed in separate fields by Chris Callaghan (systems analyst from
Vemon Systems Inc.). Eventually, the rest ofthe 'Classification' field (kingdom, phylum,
class, order, and family) also must be divided.
Classification qramlneus/gramlnseus/Phoecetes/Fringlllidae/Passeres/Aves
(a) Data for the 'Classification' Field is a Multi-part Field.
PANHANDLE-PLAINS HISTORICAL MUSEUM Zoology/Natural History
Description gramineus/gramlnseus/Phoecetes/Fringlllidae/Pa
Ace NO 19993811 ill || il ||MI III I
(b) Information is Obtained Exactly From a Field to Create a Report.
Figure 7.1. Data Stmcture in a Field Effects the Data Stmcture of Reports. If the field is a multi-part field, such the 'Classification' field, then it can cause long and imdesirable reports such as this information label.
Sources: (a) Vemon Systems COLLECTION. Version 3.42. 1998 (b) Microsoft Access®. Version 2.00. 1994
64

Structure ofthe database model caused confiision at both institutions. Definition
and usage ofthe fields in the database was not clearly understood. Users had entered the
data ofthe provenance in the Paleontology Division at MoTTU of an object into two
different fields, locality and location, in the database. One field referred to provenance and
the other to where the object was stored in the collection. However, because ofthe
discrepancies in how the data was entered, it was not clear which field meant what, and
different users had entered the information in different fields. Another example in the
Paleontology Division at MoTTU is how the catalog number was entered. Different
versions of catalog number made searching for a number difficult, and thus resulted in
duplicate catalog numbers being assigned.
A database that is not standardized produces labels that are not standardized. At
MoTTU, information in the database had been entered in many different ways (see Table
3.1). The fields in the database were not standardized which allowed different users to
enter data differently. For example, in Figure 7.2, the 'Location Name' field is a multi
valued field which, in some ofthe records, includes the county, state, and coimtry. In
addition, some records, the Location Name Field included the particular site the specimen
came from, county, state, and country. Many of these same records also had each part the
provenance ofthe object was placed in their separate categories, in addition to being in the
Location Name Field. With the format ofthe information being different in the database,
their information labels also differed.
The final problem realized was how interdependent every department is to one
another. The same database at P-PHM is used by every department. Therefore, any
65

changes made to the database had to be accomplished with care not to disturb fields being
used by other departments. At MoTTU, it became impossible just to design a database
model for only the Paleontology Division. Although the system was supposed to be
installed only in the division, the registrars and any other persons in charge of database
stmcture had become involved with the project at each institution. The database model
must be created institution-wide, since another department may want to install a bar code
system. The requirement that the bar code number remain unique was discussed in
Chapter IV. In addition, the fiiture ofthe museum may require that the databases are
merged, and this project had to be handled with this possibility in mind.
Recurring problems such as multi-part or multi-valued fields or consistent errors
and inconsistencies v^thin the database should be noted and corrected in Phase II. Many
DBMS, including COLLECTION and FileMaker Pro®, have ways to correct recurring
problems all at once, instead of in a record-by-record process, thus simplifying the process
of correcting the database. Carefiil attention is required when changing fields from one
type to another in the collection's database, because such changes potentiaUy can lead to a
loss of data.
Specific Problems vyith the DBMS
Not all ofthe problems with the system, however, were related to the database
model. The DBMSs at both institutions had particular problems with using the bar code.
The problems are outlined below, and the step-by-step solutions for these problems are
found in Appendix A and Appendix B.
66

Problems Related Specifically to COLLECTION
COLLECTION is a relational database originally designed for registration
purposes. The database was upgraded to a windows version in November, 1999.
However, it is still inqjossible to change fonts to print a report directly from the database
(Appendix A). Different fonts are required to print the bar codes. To solve this problem
when creating reports requiring a bar code, the records are copied from COLLECTION
and imported into Microsoft Access®. Appendix A includes specific instmctions for
creating reports with COLLECTION. When exporting records and creating reports in
Microsoft Access®, the system operator has to be extremely organized about the order in
which the fields are exported. Once the fields are chosen and a report is created, the fields
always must be chosen in the exact same order thereafter. When files are imported into
Microsoft Access®, the files are assigned a number sequentially in the order they are
processed. The report specifically recognizes these field nimibers, not the names ofthe
fields. Microsoft Access® makes the names ofthe fields part ofthe actual table it creates,
and the names become their own record (Appendix A). If a report is specially designed
for a particular purpose, and the fields are not chosen in the same order, then the design of
the report will make little sense when printed. The system operator, therefore, has to keep
a divisional folder with all ofthe reports, their locations, their names, their export names,
and the order ofthe their fields.
67

Problems Related Specifically to FileMaker Pro®
Except for the Natural Science Research Laboratory, every division at the
Museum of Texas Tech University uses FileMaker Pro® as its DBMS. Several problems
exist when trying to incorporate the bar code system with FileMaker Pro®. The problems
include: kerning, the find scan fimction, and printing multiple copies ofthe same record.
Kerning is the space between letters. As mentioned in Chapter IV, the first
problem in FileMaker Pro®, is that it automatically justifies the kerning in non-bitmap bar
codes to be the same, resulting in unreadable bar codes as seen in Figure 4.3. Only bar
codes imported as a bitmap are readable in FileMaker Pro®. Code 39 can be used with
FileMaker Pro®, and, just recently. Code 128 became available in bitmap.
The second problem in FileMaker Pro® is its inability to find a random set of
records by 'typing' in one retum character to continue to the next search parameter
(FileMaker Pro®, 2000, pers comm). A bar code reader ends its read with a retum
character. FileMaker Pro® translates the retum character as an end to a fimction. Three
scripts must be written to make the retum character from the bar code reader as part of a
script, and not the end ofthe fimction (see Multiple Find in Appendix B).
FileMaker Pro® also has a problem in that it does not check for any validation
mles when datum is auto-entered (FileMaker Pro®, 2000; pers comm) and the division
ordinal cannot be prevented from 'rolling-over'. For example. Table 4.2 shows that the
Ethnology Division's Division Ordinal is '4'. When this division reaches 499999 records
and it is allowed to continue to record number 500000 the Division Ordinal has now
changed from a '4' to a '5'. This process cannot automatically be stopped. Each division
68

at MoTTU must become aware of this problem and report to the database enhancement
committee before this occurs. The database committee will keep track ofthe number of
records each division has on a yearfy basis.
Because ofthe unique validation ofthe serial number, FileMaker Pro® cannot
print multiple copies ofthe same record vdthout exporting the records to another
database. Several scripts are written to aid in this process (Appendix B).
69

CHAPTER vm
USE AND VALUE OF THE BAR CODE
An effective data management program saves time, money, and effort by
increasing the accuracy, speed, and usefulness ofthe database. A bar code system is part
of an effective data management system. A bar code system increases control of
collection management operations, expands research capabilities, updates labels to archival
paper, standardizes labels and data, and produces automated generation of information
labels. The problems associated with a bar code lie in misunderstandings and
misconceptions as to its use.
A bar code system increases the control of collection management procedures.
For example, with collection care, the collection manager can use the bar code system to
identify collection needs with use ofthe Work Report (Chapter V). Objects in need of
coUection care are scanned and a report can then be created, resulting in a list of objects in
need of repair. The records are automaticaUy obtained from the database of every object
that needs repair when it is scanned. The coUection manager can remove the objects and
take them out for repair. In addition, the coUection manager quickly can scan objects that
wiU be moved to another section ofthe museum or sent on loan.
A bar code system helps coUection management procedures to be more efficient.
For example, the bar code system can help retrieve information about objects and their
condition during an inventory. Inventories are one ofthe most laborious aspects of
coUection management. The records in the database must be compared one by one to the
70

specimens in the coUection to identify which objects are missing. To do this, many
institutions print out a Ust from the database, check which specimens are found, identify
discrepancies, and finaUy correct the errors in the database. A bar code system aUows one
person to go to the coUections, scan the bar codes, automaticaUy removing the record(s)
from the database. Any records not scanned means that the specimens may be
lost/misplaced. The summer inventory in the Paleontology Division at MoTTU was
conducted by four students working 20 hours a week for three months and the inventory
stiU is not coirq)leted. Someone stiU has to finish comparing the inventory with the
coUection's records in the database. The time it took to conqjlete the inventory wUl be
reduced dramaticaUy in the future. Furthermore, because the inventory procedures wiU be
less excmciating, "there wiU be less apprehension and resistance to begin fiiture
inventories" (McQuUken, pers comm., 2000).
A bar code system helps reduce error. At P-PHM, the "System ID" number was
physicaUy typed into the database. It was cumbersome to type in a large set of numbers to
retrieve a large group of records. Often, a number was typed incorrectly and it was often
not untU the end ofthe report that the user would become aware ofthe transcription error,
and would have to start the project over. Now, wdth the cUck of a button, the "System ID"
number(s) is entered automaticaUy without worry about typographical errors and
transpositions and the UkeUhood the report would have to be started over is greatly
reduced.
Before printing information labels with the bar code, the bar code system requires
that the data be proofread (Chapter V). Not aU ofthe errors are due to speUing. Some
71

errors require more investigation; for example, if the identity of an object is uncertain. It
is easier to print out a list of questionable identities from the database and take it to a
coUection and physicaUy look at the objects, than to bring the objects one by one to the
database. Information at both institutions now is taken directly from the database and the
information can quickly be proofread. The bar code was added on the proofreading sheets
(see Figure 5.3) at institutions to aUow an efficient way of correcting errors by aUowing
the record to be foimd quickly in the database and corrected in the computer.
FinaUy, a bar code system helps coUection management to be more standardized.
Labels are produced at both institutions from the database and errors due to iUegible
handwriting are eliminated. Human transposition errors are minimized because the
redundant and tedious task of writing and rewriting labels now is performed by the
computer.
A bar code system can be used, not only for inventories, but also for assisting with
cataloging a coUection. A fiiture step for both coUections is to use the bar code to catalog
coUections. NSRL at MoTTU already does this. The database can be designed to accept
the bar code for entering in new records. The bar code is scanned; again, eUminating the
chances for human transposition error.
The main weakness of bar code is the common misunderstanding people have that
bar codes mean something. A bar code is simply a series of Unes and spaces that represent
a number. A bar code is only a number without a prefix or any information attributed to
it. For example, at the Smithsonian Institute, the Herbarium Department, instaUed bar
codes on its specimens. Undemeath the bar code, the department placed the human-
72

readable text ofthe number that the bar code represented. Unfortunately, people saw this
number and not the specimen's catalog number that was directly above the bar code.
People mistook this number to mean something (Le., the catalog number) and pubUshed
using it.
Another problem is that because of misconceptions of what a bar code is, people
expect bar codes to do more than they were meant to do. A bar code only can increase
efficiency ofthe database; it is not a cure-aU. In fact, a bar code cannot do anything that a
number cannot do in the coUection's database. People become excited by the idea of
installing a bar code system into its database, but rarely do they stop and think what they
are going to use it for. An inactive coUection that does not process loans, do inventories,
create condition reports and rarely has incoming material may not need a bar code system,
and to attempt one would be a waste of time and money.
A special concem with bar codes is a result ofthe second misconception is the
ease at which the bar code can be instaUed and how quickly users can begin working with
the coUection. However, the coUection's database may have to be reconfigured or
additional programming may need to be instaUed. Depending on the program, a specialist
may need to be hired to make the bar code compatible with the program. Like many
projects, adding a bar code system needs to be thought out thoroughly. The time and
effort to instaU it need to be weighed with its fiiture uses by the end user.
The theory of bar codes is easy, but to apply it takes great care and thought.
Several concerns must be implemented when instaUing a bar code system by using good
data management practices to prevent many problems associated with a bad design. A bar
73

code is an extension ofthe coUection's database, and it must, therefore, be taken seriously.
A bar code system cannot be instaUed overnight. Planning must include the bar code's
use, particular code symbology, and how it wiU be attached to the specimen. If the system
is not thought out carefiiUy, and adequately tested, then it wiU be useless or difficult to use
in the coUection.
74
CHAPTER DC
CONCLUSION
An effective data management program wiU save time, money and effort because it
increases accuracy, speed, and the overaU database is easier to manage (Dawson et al.,
1999). The electronic database is a primary tool for coUection management to control the
massive amount of information associated with a coUection. To create an effective data
management program, each department at the institution needs to analyze its existing
documentation system, define any problems, sets goals, and determine a plan to achieve
these goals (determined in Phase I). Phase I is the foundation for the DEP. This phase
helps the department to understand the needs of each coUection(s) as concemed with the
database (Phase II), the bar code system (Phase III), reports (Phase IV), and the printing
process (Phase V). The project provides a imique opportunity for each department to
review and define every field in its database for their integrity and coUection's usefulness.
The results ofthe DEP are: improving the coUection management, increasing research
value, and decreasing time, money, and energy expenditures in each department. The
project also wiU aUow each department to be better prepared for handling unforeseen
coUection uses in the fiiture.
The lasting effects from the project wiU be the updating of aU labels on archival
paper, standardization ofthe labels and database, and automated generation of catalog
cards. Future plans may include using the bar code system in each division at MoTTU to
help catalog incoming materials and use ofthe system to help with control of incoming,
75

outgoing, and in-house loans. The project is designed as flexible so each department can
modify the views and reports from Phase IV and print from Phase V based on the needs of
the coUection. The instaUation steps for Phase IV and V were written to aUow the system
operator to understand the process and to be able to modify them for each coUection. A
combination of views and reports can be created to enhance the usefiilness ofthe DEP for
each department's needs.
The Data Enhancement Project, once completed, requires continual maintenance.
The new system wiU aUow an efficient way of identifying and correcting errors. This
project includes the installation of a bar code system, however, before bar codes are
printed on information labels, the data must be checked against coUection records to
ensure the accuracy ofthe database. The five phases outUned in this manual are proposed
as an effective means to accomplish this goal. The results ofthe DEP wiU provide long-
lasting benefits to aU Divisions at the institution.
76

LITERATURE CITED
Azalea Software. Summer 1999. Pers. comm
CaUaghan, C. November, 1999. Systems Analyst. Vemon Systems. Inc. Pers. comm.
Dawson, E.M., S.E. Fishman-Armstrong, and R. King. 1999. CoUections Management in the 21^ Century. American Association of Museums, Poster Presentation.
Dee, A. Summer 1999. SUicon VaUey Bus Co. Pers. comm
FUeMaker Pro® 4.1.v3. 1984-1999. FUeMaker, Inc. http://www.filemaker.com
FUeMaker Pro® 4.1.v3 User's Manual. 1999. FUeMaker, Inc.
FUeMaker Pro®. FaU 1999. Pers. comm
Fishman-Armstrong, S. E. 2000. Bar-coding at Panhandle Plains. CoUection Connections. Vemon Systems Ltd. Newsletter. No 37 (March 2000). pp6-8.
Fishman-Armstrong, S.E., H. Gamer, and M.O. Houle, 2000. Museum of Texas Tech University Data Enhancement Project. In-house manual.
Hernandez, M. J. March 1999. Database design for mere mortals. A hands on guide to relational database design. Addison-Wesley, Reading, Massachusetts. 440pp.
Houle, M. O. December 1999. Field specifications for the vertebrate paleontology database. unpubUshed Final Project. Texas Tech University. 45pp.
Indeck, Jeff. September 1999. Curator of Archeology. Panhandle-Plains Historical Museum. Pers. com.
Microsoft Access ®. Relational database management system for Windows, Version 2.0, Microsoft Corporation, 1994.
Monk, R. R. 1997. Automated Data Management in Systematics CoUections. Ui^ubUshed Ph.D. Dissertation, Texas Tech University. Vii +118pp.
Monk, R. R. 8 May 1998. Bar code use in the mammal coUection at the Museum of Texas Tech University. Muscology. Museum of Texas Tech University, 8:
77
Monk, R R. FaU 2000. Curator of CoUections. Museum of Texas Tech University, Natural Science Research Laboratory, Lubbock, Texas, Pers. comm.
Percon. 1998. Pers. com www.Percon.coni.
Rob, P. and C. Coronel. 1995. Database systems: Design, implementation, and management. Second Ed., Boyd and Eraser PubUshing Co., Danvers, Massachusetts. 713 pp.
Vemon Systems COLLECTION. User Manual. Version 3.42. Jan. 1998. Vemon Systems Ltd. Auckland, New Zealand. 415pp.
Weigand, CJ. 25 February 2000. Sales associate at Life Success institute. 256 Salem Tpke Buzzer CT 06334-1518 USA. Pers. Comm [email protected]
WiUiams, S.L., and R.R Monk. 1999. Testing Dry Documentation Media for permanent hard-copy coUection records. Pp225-354. in Managing the Modem herbarium. An inter-disciplinary approach. (D.A. Metsger, S.C. Byers eds.). Society for the Preservation of Natural History coUections.
Worthington Data Solutions. 1998. A Bar Code Primer. An introduction to bar coding symbologies, reading and appUcations. Worthington Data Solutions. Santa Cruz, California. 40pp.
78

APPENDIX A
DATA ENHANCEMENT PROJECT WITH BAR CODE
CAPABILITIES AT THE PANHANDLE-PLAINS
HISTORICAL MUSEUM
79

DATA ENHANCEMENT PROJECT WITH BAR CODE CAPABILITIES AT THE
PANHANDLE-PLAINS HISTORICAL
West Texas A&M University Box 60967
Canyon, Texas; 79016
7 December, 2000
80

APPENDIX A
DATA ENHANCEMENT PROJECT
WITH BAR CODE CAPABDLITEES AT THE
PANHANDLE-PLAINS HISTORICAL MUSEUM
This section is con^rised of excerpted chapters from the manual ofthe "Data
Enhancement Project with Bar Code CapabUities at the Panhandle-Plains Historical
Museum." Chapters IV, V, and Appendix A and B from this manual are provided to assist
with instaUing the bar code system Appendix Al is Chapter IV from the P-PHM manual
and it provides information ofthe relationship between the bar code and COLLECTION.
Appendix A2 is Chapter V from the P-PHM manual and it explains how to use the views
and reports with COLLECTION. Appendix A3 is Appendix A from the P-PHM manual
and it is a list of aU ofthe fields currently found in the database model at P-PHM.
Appendix A4 is Appendix B from the P-PHM manual and it lists the step-by-step
instmctions for creating reports and using the bar code system for Vemon Systems
CoUection Version 3.42. The instmctions are written to be flexible and to provide enough
information that can be modified for other coUections. Appendix A5 is Appendix C from
the P-PHM manual and it is a troubleshooting section and includes additional help from
Appendix B from the P-PHM manual, .^pendix A6 is Appendix D from the P-PHM
manual and it includes a brief discussion about the bar code system and Vemon Systems
CoUection Version 3.50a.
81

CHAPTER TV
PHASE m: THE BAR CODE
In order to create the most effective bar code system, the Bar Code Phase ofthe
project should proceed only when the database model has been upgraded (a process
outUned and discussed in the first two phases ofthe DEP). If the data in the database
have not been standardized or checked for accuracy, then the information labels and
reports also wiU not be standardized and accurate because the data on these reports is
exactly the same as the data in the database. Once these tasks have been accoirq)lished,
the components ofthe bar code system can be defined and discussed and the actual
procedures of installing the bar code system into the database may begin. Three criteria of
the coUection's database are required to instaU the bar code system. Major components of
the bar code system include: a unique number, a bar code symbology, a bar code
translator, a bar code reader, a bar code printer, a relational database, and a system
operator (Table 4.1).
Table 4.1. Required parts of a bar code system and their corresponding conditions.
PART
A Unique Number:
Bar Code Symbology:
Bar Code Translator:
Bar Code Reader:
Bar Code Printer:
Relational Database:
System Operator:
CONDITION(S)
Assigned by database committee
Code 128 or Code 39 Determined by the coUecti(xi's needs Have both Code 128 Mode a-c and Code 39. Be compatible with the relational database Not wand/pen. Preferably laser. Meet needs ofthe collection
Laser printer. Archival paper and ink.
Addressed in Phase II. Be able to proofread database and design rqx»ts.
82

Phase III considers the actual components and the instaUation ofthe bar code
system and their relationship with the coUection. This phase helps users determine where
and how the bar code system wiU be placed and designed. WUl the bar code reader need
to be brought to the specimens? If so, what is the maximum distance the bar code reader
must travel? Where wUl the computer be placed? It is helpful to have a map ofthe
coUections that shows where the con:q)uter wiU be placed and anything else that must be
instaUed, including outlets and Ethemet parts. The Archeology Department has the
coir )uter in the offices and not in the coUections area. Most ofthe archeology coUections
at P-PHM are in archival boxes that can be carried to the computer. Therefore, a bar code
reader with a short cable was purchased for use with the archeology coUection. However,
for the coUections that are too large to move and that require the bar code reader to be
brought to the specimens, bar code readers that can reach 80 feet between the computer
and the bar coded label are avaUable.
Criteria ofthe CoUection's Database for Compatibilitv with Bar Code System
The bar code system is used in the same way as if the information was typed into
the keyboard. The bar code reader works like a fast keyboard when the bar code is
scanned. Before instaUing the bar code system, three things are required ofthe coUection's
database (Appendix D). One, the database must aUow the user to design customized
reports, such as mailing labels. Two, the database must aUow the user to change fonts to
individual fields in a report. Three, the database must provide a way for the user to find
83
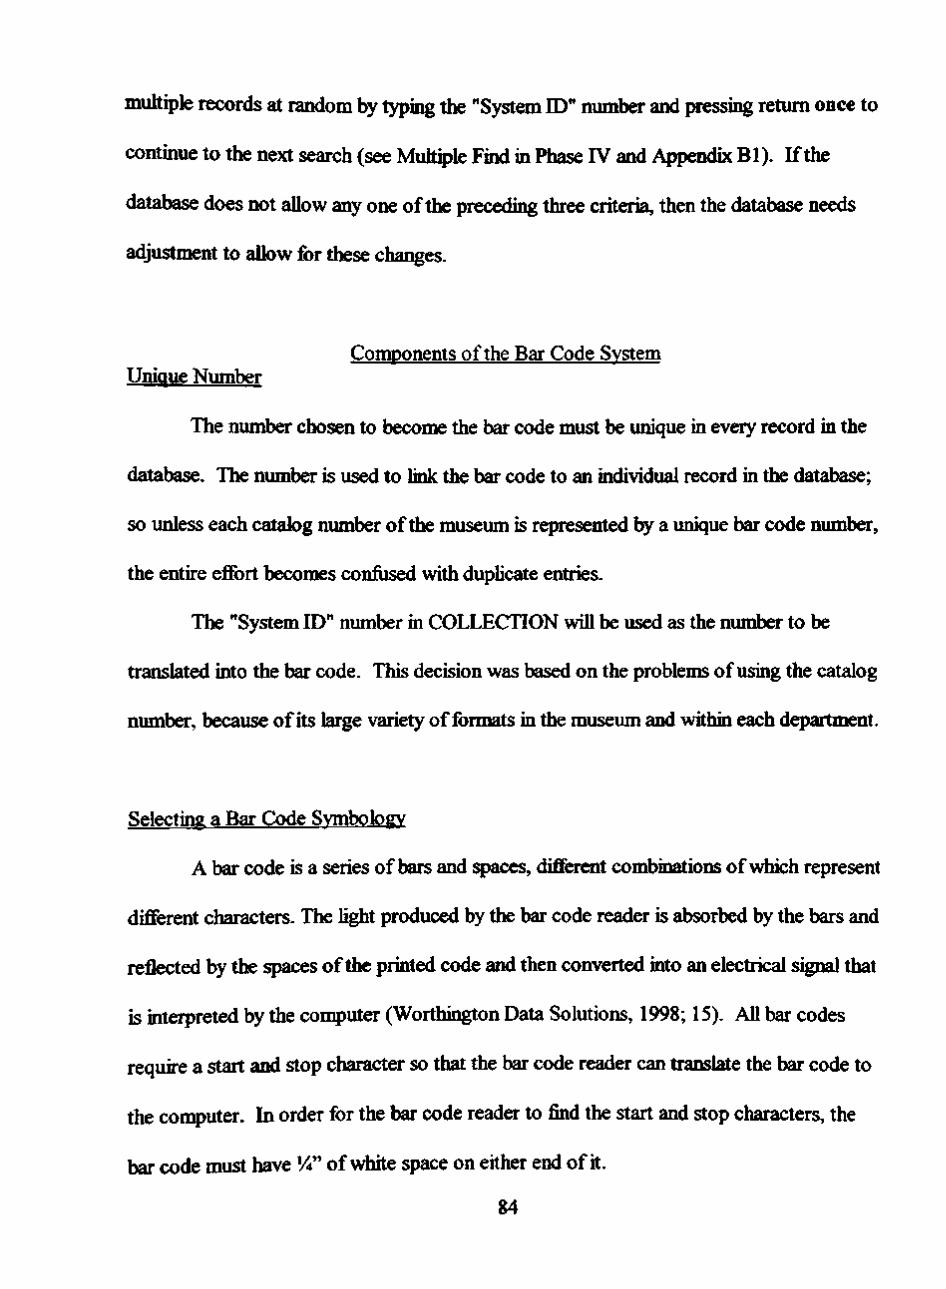
multiple records at random by typing the "System ID" number and pressing retum once to
continue to the next search (see Multiple Find in Phase IV and Appendix Bl). If the
database does not aUow any one ofthe preceding three criteria, then the database needs
adjustment to aUow for these changes.
Components ofthe Bar Code System Unique Number
The number chosen to become the bar code must be unique in every record in the
database. The number is used to Unk the bar code to an individual record in the database;
so unless each catalog number ofthe museum is represented by a unique bar code number,
the entire effort becomes confiised with dupUcate entries.
The "System ID" number in COLLECTION wiU be used as the number to be
translated into the bar code. This decision was based on the problems of using the catalog
number, because of its large variety of formats in the museum and within each department.
Selecting a Bar Code Symbology
A bar code is a series of bars and spaces, different combinations of which represent
different characters. The Ught produced by the bar code reader is absorbed by the bars and
reflected by the spaces ofthe printed code and then converted into an electrical signal that
is interpreted by the conqjuter (Worthington Data Solutions, 1998; 15). AU bar codes
require a start and stop character so that the bar code reader can translate the bar code to
the computer. In order for the bar code reader to find the start and stop characters, the
bar code must have %" of white space on either end of it.
84

Table 4.2. Size Differences Between Code 128, Code 39, and Code 2 of 5 widi a Six and Ten Digit Bar Code.
Code Names
Code 128
Code 39
Code 2 of 5
6 Digits
y^^„ itiinmiiii
r iimiiiitiniiiiiiiiijimiii
Vi' iniiintiiHi
10 Digits
9/j ,JIIIilllfllliBI
114" iiiiiuiniiiiiiniiiiiiitiiiniiiinilin
y/' inniiiiiiiiiiiHi
Many different bar code 'symbologies' or 'languages' exist. Each has its own
characteristics that make it usefiU for a particular appUcation. Code 128, code 39, and
code 2 of 5 are codes that are the most usefiU to museum coUections (Table 4.2). For
example, the symbology for code 128 for '1234' is ,Br' and for code 39 is *1234*.
Each of these codes can be printed in three different densities: high, medium, and low.
Bar codes with the highest density are more compact and, therefore, have a greater risk of
being unreadable. It is inportant to choose the type of code that is most useful for the
coUection. The maximum aUowable size for the bar code on the smaUest label must be
considered.
The first type of code, code 128, can encode aU 128 ASCII characters
(Worthington Data Solutions, 1998). Code 128 was introduced in 1981 as a high-density,
alphaanumeric symbology. Since 1990, three modes of code 128 have been designed:
modes A, B, and C. Both modes A and B are alphanumeric, aUowing both alphabetic and
numeric characters; mode B aUows lower case letters whUe mode A does not. Mode C
85

aUows onfy numeric characters. The advantage of mode C is that it produces highly
compact bar codes by using an algorithm to process pairs of numbers together, thereby
greatly reducing the size ofthe bar code. The disadvantage is that this efficiency is lost if
an odd number of digits is coded (Percon, 1998). The Archeology Department did not
need a smaU bar code symbology. However, code 128 can be used if smaUer bar codes
are required.
Code 39 is much larger than code 128 (Table 4.2). This code also can use aU
ASCn characters. Code 39 is a Uteral translation with an asterisk (*) as its start and stop
character so it is simpler to implement. The main disadvantage of code 39 is that it
produces long bar codes (Table 4.2). The Archeology Department at P-PHM is using
code 39. Although code 39 is appropriate for the Archeology Department's needs, it may
be too large for other coUections.
Code 2 of 5 aUows only numeric text. This code is larger than code 128 and
smaUer than code 39 (see Table 4.2 for comparison). LUce code 128 mode C, code 2 of 5
requires an even number of digits. Code 2 of 5 is available for most DBMS. However,
some bar code translators have trouble reading code 2 of 5 because it has a tendency to
cause the bar code reader to accept partial reads (Worthington Data Solutions, 1998),
making it less reUable than either code 128 or code 39. The trend in bar code technology
is moving from code 2 of 5 to code 128 (Weigand, 2000; Percon, 1998; Azalea Software,
1999).
86

Bar Code Translator
The bar code translator is a con:q)uter software program that translates the desired
characters ("System ID" at P-PHM) into the desired bar code symbology for printing. The
symbology then is printed as a font that is read by a bar code reader. For exan^le, with
code 128 a bar code translator wUl change '1234' to its code, ™,Br' which then displays
the bar code when the font is changed.
Most bar code translator software aUows the code to be translated in one of three
ways. The first two methods translate the numbers one at a time. The third method,
useful in a database, translates the contents ofthe bar code field for aU records in the
database. In the first method, the user types in the characters to be translated and then
cUcks the 'translate' key, "teUing" the software to proceed with the conversion. The
characters then are translated and saved on the conputer's cUpboard and the user can then
paste the translated bar code into the desired place such as a specimen label to be printed.
The second method of translating is by using a hot key. The user highlights the characters
in the software program and then uses a combination of keys (e.g., ALT B) to translate
them in place. The problem with both of these methods is that they are labor intensive
since each code is processed individuaUy. The third method translates the required field
for aU records in the database at once. This method requires a programmed script that
either must be written into the database management system or be provided by the
software. Code 39 requires a single, one-Une script and can be used in most DOS, PC, or
Macintosh programs such as Microsoft Access® and FUeMaker Pro®. The script for
87

Code 128 is not as readUy available for some Macintosh programs such as FUeMaker
Pro®, but this is changing (Weigand, 2000; pers. comm).
It is preferable that a bar code translator add the code directly to the coUection's
database and not require exporting records to the translation software or other DBMS.
Software that has a variety of codes and font sizes wiU give added flexibility to the system.
Bar code translators are avaUable for COLLECTION, however it does not have
the capabiUty to aUow for font changes in reports. The font must be changed to the bar
code font to create a readable bar code. As mentioned previously, Callaghan already has
written the script for code 39 into COLLECTION to be used, and therefore, only the font
for code 39 is needed from the bar code translator to create the bar code. The font must
be manuaUy changed from Times font into code 39 bar code font to print the actual bar
code. However, COLLECTION does not aUow the font for the bar code to change, it
cannot be used to print the bar codes and records must be exported to another DMBS (Le.
Microsoft Access®) that does aUow fonts to change in order to bar codes. The
symbology for code 128 is available for COLLECTION, but it was not instaUed. Code
128 has the same problem as code 39 which requires the font to be changed and must be
used in conjunction with Microsoft Access®. Code 128 can either be instaUed in
COLLECTION and then printed from Microsoft Access® (as with code 39) or instaUed
and printed only using Microsoft Access®. The Archeology Department has purchased
Bar Font for Windows® by Worth Data as its bar code translator software and it does
have code 128 modes A, B, and C and code 39. Programmers of COLLECTION are in
the process of making improvements by aUowing changes in the design of its reports
88
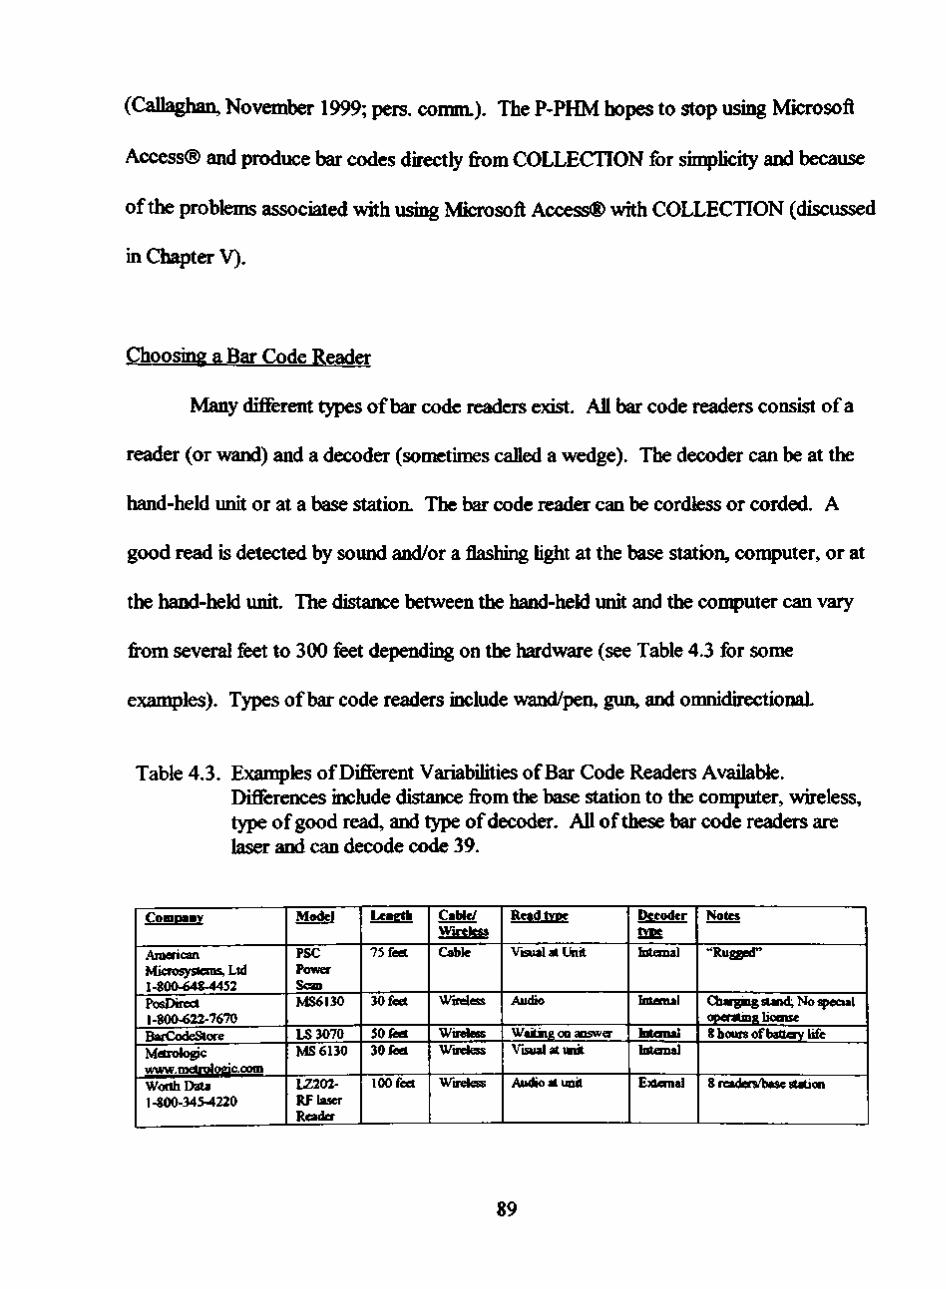
(CaUaghan, November 1999; pers. comm.). The P-PHM hopes to stop using Microsoft
Access® and produce bar codes directly from COLLECTION for sinqjUcity and because
ofthe problems associated with using Microsoft Access® with COLLECTION (discussed
in Chapter V).
Choosing a Bar Code Reader
Many different types of bar code readers exist. AU bar code readers consist of a
reader (or wand) and a decoder (sometimes caUed a wedge). The decoder can be at the
hand-held unit or at a base station. The bar code reader can be cordless or corded. A
good read is detected by sound and/or a flashing Ught at the base station, computer, or at
the hand-held unit. The distance between the hand-held unit and the computer can vary
from several feet to 300 feet depending on the hardware (see Table 4.3 for some
examples). Types of bar code readers include wand/pen, gun, and omnidirectional.
Table 4.3. Examples of Different VariabUities of Bar Code Readers Available. Differences include distance from the base station to the computer, wireless, type of good read, and type of decoder. AU of these bar code readers are laser and can decode code 39.
Comoanv
American Microsystems, Ltd 1-800-648-4452 PosDirect 1-800-622-7670 BaiCodeStore Metrologic www.metrolopc.oom Worth Data 1-800-345-4220
Model
PSC Power Scan MS6130
LS3070 MS 6130
LZ202-RF laser Reackr
Leneth
75 feet
30 feet
50 feet 30 feet
100 feet
CaMe/ Wireless
Cable
Wirdess
Wireless Wirdess
Wireless
Read tvoe
Visual at Unit
Audio
Waiting on answer Visual at unit
Audio at unit
Decoder type
Internal
Internal
Internal Inlemal
External
Notes
"Rugged"
Charging stand; No special operating hoense 8 hours of battery life
8 readers/base station
89

The reader produces a Ught that either is reflected or absorbed depending on the
bars or spaces ofthe code. The decoder converts the data sent by the reader into the
electrical impulses and then translates the code so the con^uter can receive the data as
characters (Worthington Data Solution, 1998). The data sent from the decoder is
received by the computer just as is data from the keyboard.
The Ught produced in a bar code reader can be a Charged Coupled Device (CCD)
or laser. CCD readers are generaUy less expensive than laser readers. CCD readers,
however, are not as reUable as laser readers. Depending on the manufecturer, CCD may
or may not read around curved surfaces (Dee, pers. comm., 2000; PosDirect, pers.
comm., 2000) and the reader must be held close to the bar code. Recently, however, the
technology for CCD readers has improved (Dee, pers. comm., 2000). The reader can be
placed several inches from the bar code (Worthington Data Solution, 1999) and some can
now read curved surfeces (Dee, pers. comm., 2000).
No one type of bar code reader is good for aU coUections. However, a wand/pen
bar code reader is not recommended because it requires physical contact with the bar
code. After numerous reads ofthe bar code, it potentiaUy could damage the bar code.
The type of reader required for each coUection depends on its needs. Table 4.3
shows some sources of bar code readers and some common variables. Limiting factors of
the coUection such as the size, location, weight, stabUity, and physical location are aU
considerations (from Phase I) that should determine the type of bar code reader chosen.
In some instances, the reader must be taken to the objects whUe in other situations the
object(s) wiU be brought to the workstation. As previously mentioned in Chapter II, an
90
inventory map ofthe coUection's storage area can help determine the best bar code reader
for the coUection.
AdditionaUy, more than one bar code reader may be needed for the different uses
in various coUections in a department. An art coUection may require a hand-held reader
that can read the bar codes from relatively great distances so the artwork would not have
to be moved. The paleontology coUection may require a bar code reader that is cordless
and can travel a great distance from the computer to the specimen. Another department
may require an omnidirectional laser reader to aUow both hands to be free, especiaUy when
handUng fragUe objects. The Archeology Department at P-PHM requires a gun-type bar
code reader working within a short distance ofthe computer because scanning would be
taking place at a workstation near the con:q)uter. It is important to remember that other
types of hardware may be purchased and added to the system later, as necessary.
Selecting a Bar Code Printer
Two types of printed bar codes exist: pre-printed, or printed-on-demand. Pre
printed bar codes are produced by an outside company. The bar codes are pre-printed
either on the packaging (e.g., a cereal box) or on a label that must be attached to the
object (e.g., those used in Ubraries). Printed-on-demand labels are produced in-house
(Percon, 1998). Printing the labels in-house aUows the user to have more control over
what is included on the label, such as catalog number and accession number. In addition,
individual labels or codes may be printed as needed; an option not possible with pre
printed codes.
91

AU bar coded labels wiU be printed in-house on archival paper with a laser printer
at P-PHM. The labels are taken to a printing company and cut to size. The bar code can
be printed with a bar code printer, a laser or Inkjet printer, or a label printer. The bar code
printer cannot add additional information from the database. This type of printer is
designed to print only the bar code. Laser and Inkjet printers aUow many different
combinations to be printed along with the bar code. Laser printers produce bar codes that
are more reliable because they create sharper bar codes and are more permanent; the
chances for the bar code to smear are greatly reduced. However, laser printed codes are
subject to abrasion and the toner could potentiaUy wear away. Inkjet printed codes are
subject to feding and smearing (are not waterproof). Dye subUmation printed codes are
permanent and waterproof but the acidity of the ink is unknown (Monk, pers. comm.,
2000). Whatever printer is chosen, the ink/toner should be tested for permanence
(WUUams and Monk, 1999).
System Operator
From the beginning of Phase HI, it fells to a single person in each department, the
system operator, to oversee and coordinate the bar coding efforts. The system operator
needs to be the curator or some other permanent feculty/staff member in the department.
Regardless of who is implementing the Bar Code Phase ofthe project within each
department, it is vital that aU problems, concerns, and important developments are both
documented properly and handled by the same individual. Having the project supervised
by a single person sin:q)lifies coordination ofthe procedures and prevents misinformation
92

and error by having too many people involved. The duties that M to the system operator
include:
1. Making sure that the databases adhere to the museum-wide database model
and have been upgraded into a relational format.
2. Installing the bar code.
3. Ensuring that bar code numbers are unique within and between departments.
4. Keeping in contact with the database manager, system operators from other
departments, and the institution's data management committee.
5. Coordinating any other efforts that involve the database.
In order to fiilfill this role properly, it also is necessary that the system operator
understands the uses and problems inherent with the DBMS (COLLECTION) utilized by
the department.
UntU it is possible to change fonts and the design in printed reports directly from
COLLECTION, the system operator also wiU be in charge of compUing and upkeeping a
departmental folder. This manual wiU include what reports are created, where the reports
are stored, what field(s) and their orders are used, and a back up of every report. It is
vitaUy important that every report used in the department be fiiUy documented as to its use
and what fields are involved (see Chapter IH).
A Relational Database: COLLECTION
COLLECTION is a relational database originaUy designed for registration use.
COLLECTION has various forms used to enter data. Figures 4.2 and 4.3 are exanqjles of
93

two forms in COLLECTION. The first form (Figure 4.2) is used to quickly locate and
open other forms such as Identification General, Administration, etc. Figure 4.3 shows
the Identification General form. Information of an object such as its status, department,
name/title, brief description and classification are entered in this form. Additional
information about COLLECTION can be found in the software's manual.
BQE3E
M ai>aawefi<_ Acj riMiet
Cuvtvni WpiKhMn
IdcntiRcalien GenerJ
Acqwtihon. PfcwanancA
Admin lb Mion
Condition 1 T ieataenI
CflpvngM & VakMlion
C f l i a n ft Piodudifkn
De«cc«*«*fm
Docuawnlahon
f i h i b i i o m ( Loam
H e U Cvlccl ian
UtmYmmt
lciei«ificaliiin Alt
Broup I HalitotI Obtaclt
Loc^bcMi Funchons
Me<id fc Measumaents
Photos 4 AiMbttVi tu^
Phytical AspMCta
R o t c w c h & Attiibutifin
SioM»ui» & M«ffct
SubfBcl % AsBoaahan
U s « Defined Tieldi
M M u q M M n l SclMNUe
c n naaa
Figure 4.2. COLLECTION. This form is used to quickly locate and open other forms to enter the information of an object into the database.
Source: Vemon Systems COLLECTION. Version 3.42. 1998.
The database was upgraded to the Windows version 3.42 in November 1999. As
previously mentioned, it currently is not used to change fonts to print a report directly
from the database. Figure 4.4 shows a report that was created using COLLECTION. In
order to print reports containing bar codes, records are exported as a file from
COLLECTION and imported to Microsoft Access® where reports are designed and
printed.
94

I999.63<.1(M 70. k m *
Depanma AJ-
Name/TM krrfi
Nanie/'Tllif
MoUi
Btid iXbSis. krde. edge f iagroit
OihetNaneCtl i Tjipe
|A205 I41 Bl 238
81238 69
Ottiold I Twe I State sue K
Calakguet
I Dace Status | Docunefyaiiofi | Nves
IBifacia^i wokeA^tone Tod/StoW, Mi . MieV»iov J i i l l 20C CataEit
Figure 4.3. The Object-Identification General Form. This form is used to enter basic information about an object. Note that the information in the classification field is entered from specific to broad and how it is a multi-part field for this archeological object.
Source: (a) Vemon Systems COLLECTION. Version 3.42. 1998.
Tush: Pantianne Pl4lBs Histor ical Hesrun Brlvf Dtscriptloa S M l l task phatogr«ph of brartze lndi«n plrphant v i t h t rue iwary
photograph of branzo Indian »l«phjDt ul i r i trur iuorii iBsIc;: btirk/wtiitr. I i . ? K 1J.4 en J a v f U n tuck pliatogr«phs of bronze In i l l j i i pirpfiaat u l rn trup iuarj; tasks faer* plvcos iMStodon t«atr i ( I r l i t p n a a o n t ) niapitiu rush fr^gfwnl of tusk AAonotli tusk »apinaUi ta^k nannotfi t u s k ; co l lec ted near Pla i r iv i rw, Texts tusk; co l l ec ted i n S t r a t f o r d , Ttxat RMnoceros tootti and tusk in s^ne t u t r i x ; r o l l a c t o d ne^r Cldrrndai i , lexd^ MStotfon tavk , f o s s i l , prepared and noonted by Hr. CTdMbFrlj i i i ; col lpctpi l Clarendon, Texas, 193t Mstodon task twt pbotoyr^pitL ur Q nunber 6: s k u l l of Tour tusKed nastoden. 1938; «ri> in pbotoqraph are len Chanberlalo: Jfif b i l l i : H.J . Uaugtu; Jarin Lyncn or t i l l i lau^s ( foor neii p i c t u r e d , f i v e aanps I d o ^ t i f i i - d ) : black and «h i te p^utDgt'Jph of s k u l l of a f u j i ' tusked nastMlon wi th taur l n c l a d l n 9 : H .J . Uaojltn: Joe P i l d U ; Ben C lanber la ln ; Joe Lynch or B i l l Kiaitss; at Q6 an RO Ranch, 19:it r e p r i n t , "Itie Slioeel Tuskers, Anebelodont in^e of Central Asia". Tne ftoerican Huseon of HaUral History. flnerJc.tn Huseon Nowitates, nuMer b/O. A p r i l 10, H 3 1 , by H.r. Osbars dud U. Granger
Har
Iter
Oct «.p
21
2 *
M 77
1921 m i Zvmmgr rrr Pre Prt mu Oct
Pr .
Au9 t(.r
ttir
i « n
i t t i
1«2« 1991
19!7 H 7 « 1»7« i ( ; « ?0 15
1939 1 9 »
I * ; *
19 06
m
1993 19«l
i 9 e (
n « 06 19«9
Figure 4.4. The Font Cannot Be Changed in a Report with COLLECTION.
Source: (a) Vemon Systems COLLECTION. Version 3.42. 1998.
95
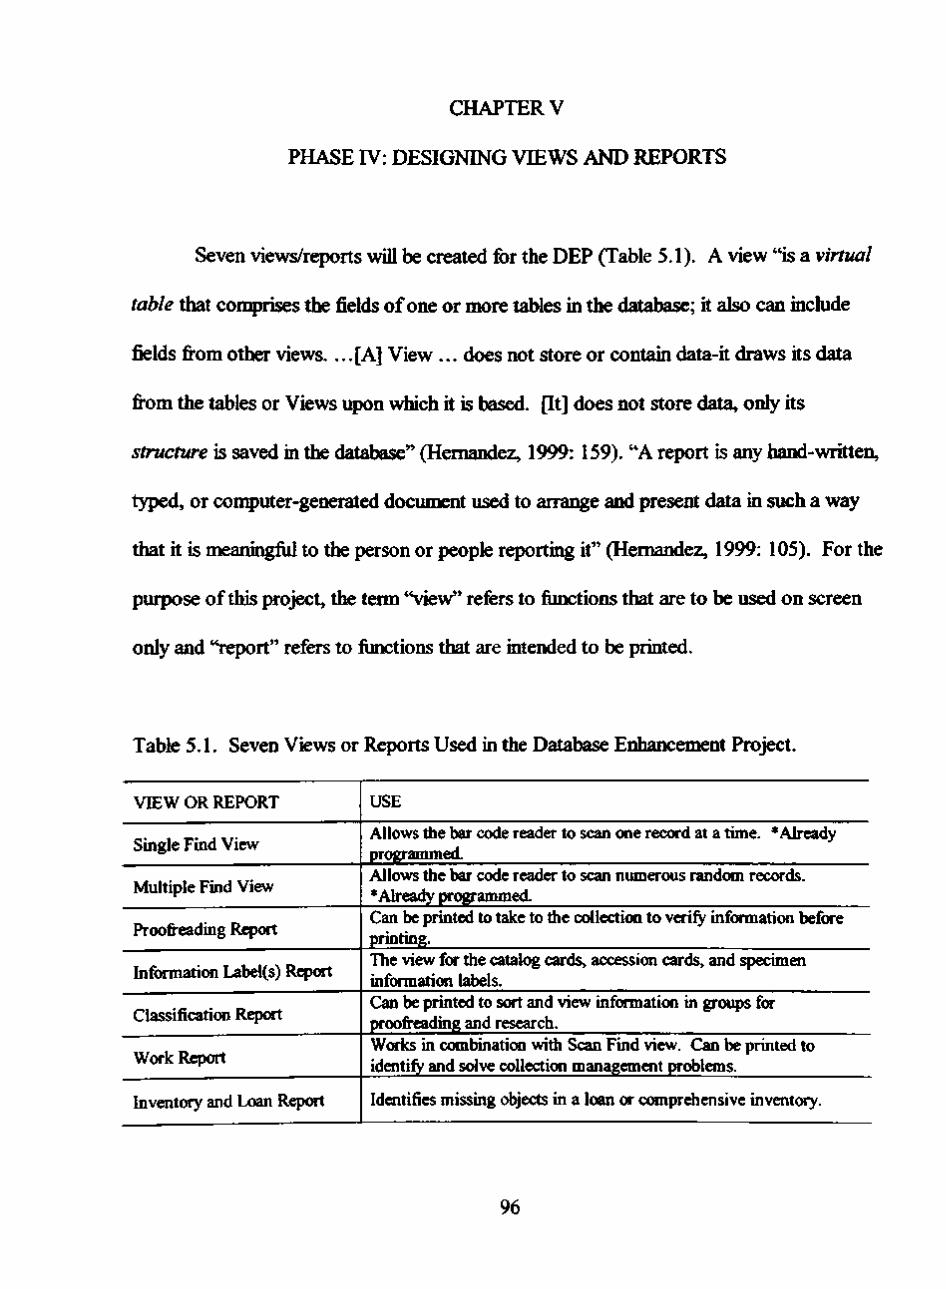
CHAPTER V
PHASE IV: DESIGNING VIEWS AND REPORTS
Seven views/reports wiU be created for the DEP (Table 5.1). A view "is a virtual
table that con^rises the fields of one or more tables in the database; it also can include
fields fi-om other views. ... [A] View ... does not store or contain data-it draws its data
fi-om the tables or Views upon which it is based. [It] does not store data, only its
structure is saved in the database" (Hernandez, 1999: 159). "A report is any hand-written,
typed, or conputer-generated document used to arrange and present data in such a way
that it is meaningfiil to the person or people reporting it" (Hernandez, 1999: 105). For the
purpose of this project, the term "view" refers to fimctions that are to be used on screen
only and "report" refers to fimctions that are intended to be printed.
Table 5.1. Seven Views or Reports Used in the Database Enhancement Project.
VIEW OR REPORT
Single Find View
Multiple Find View
Proofreading Report
Information Label(s) Report
Classification Report
Work Report
Inventory and Loan Report
USE
Allows the bar code reader to scan one record at a time. * Already programmed. Allows the bar code reader to scan numerous random records. *Already programmed. Can be printed to take to the collection to verify information before printing. The view for the catalog cards, accession cards, and specimen information labels. Can be printed to sort and view information in groups for proofreading and research. Works in ctxnbination with Scan Find view. Can be printed to identify and solve collection management problems.
Identifies missing objects in a loan OT comprehensive inventory.
96

Some ofthe views/reports mentioned help the system operator and the collection
manager to identify problems in the collection. Some ofthe views/reports are mandatory
for the bar code system to work. Some will help the bar code system work more
efficiently. Finally, other reports must be created to prepare the collection for Phase V of
the project: Printing. Each view/report has a different combination of fields, depending on
its purpose. The step-by-step process of designing and creating views and reports (foimd
in Appendix B) for creating a report allows the system operator to gain a greater
understanding of reports and their uses. Once the system operator is comfortable with the
view/report-making process, existing views/reports can be altered to suit the department's
needs and additional reports can be created. Because Vemon Systems Inc. is in the
process of updating COLLECTION so that the fonts can be directly changed in reports
from COLLECTION (see Appendix D), the DEP needs to be stmctured to allow for such
change. At that time, Microsoft Access® will no longer be needed.
Single Find View
The Single Find view is written to enhance the performance ofthe bar code
system. This script allows the user to find only a single record at a time. This view is
already a part of COLLECTION. To use this view, click in the "System ID" number field
(Figure 5.1), and then scan or type the number on the keyboard.
97

Figure 5.1. Single Find View in COLLECTION.
Source: (a) Vemon Systems COLLECTION. Version 3.42. 1998.
Multiple Find View
Like the Single Find view, the Multiple Find view is already a part of
COLLECTION. This view is required for finding multiple records at random. Scanning
multiple records takes place in the reporting fimction in COLLECTION. The report form
has five tags: Format, Selection, Display, Sorting, and Options. The selection tag is
chosen to find multiple random records. The "System ID" number is scanned or typed
into the selection area. (Figure 5.2).
P;5W?>>11S»5^
If no lecord* are selected, and a Li«t Name oi Saved Quety it not specified. Hie whole file Mia be selected.
Reconfe (6) 1996 12.2 ceiamic 1996 12.3: cetamic 1996.13.1, pfojcctfc port 199G 13.10, ceramic 199613.2, dni
le.
h ' % •
Reoidei
£k!M
List Li*tMarL Hi
Figure 5.2. Finding multiple records in COLLECTION by using the selection tag.
Source: Vemon Systems COLLECTION. Version 3.42. 1998.
General Directions for Designing and Creating a Report
Reports are created using COLLECTION, or if a font or design needs to change.
Microsoft Access® is used in combination with COLLECTION to produce reports. Each
98

version of Microsoft Access® is slightly different, but any version greater than 4.1 can be
used.
The general directions for creating a report in COLLECTION in conjunction with
Microsoft Access® is as follows. First, a set of records are found in COLLECTION using
the multiple scan view. Next, 'Headings Across the page' should be clicked with the
mouse and then the specific fields are chosen to be included in the report (le., 'Catalog
Number', 'Classification', 'Description', etc.). The set of records with their
corresponding fields then are saved as a temporary file. This file is exported to the C drive
on the desktop ofthe computer. The temporary file then is imported to the ^propriate
database in Microsoft Access®. Microsoft Access® converts the teiiqx)rary file into a
table and assigns numbers to the fields in the order they were selected. Finally, the table is
used to create and design a customized report.
Before creating a report, its purpose first must be defined; a 'rough draft' ofthe
report should be created on paper. The draft must include what fields are needed fi-om the
database, how it is to be designed (layout), and how it will be used. Fields are chosen for
their appropriateness to the report subject. Too many fields may cause confiision and
make the report hard to use.
Headings Across Versus Down the Page
'Headings Across the page' (in COLLECTION) provides more specific fields,
whereas, 'Headings Down the page' (Figure 5.3) combines fields. For example, when the
'Headings Down the page' option is chosen, provenience, coimty, and state are placed
99

must in a field called, 'Field_Coll_Place Details'. However, when 'Headings Across the
page' option is chosen, provenience is placed in a field called 'Field_Coll_Place_Name'
and county and state are together in the field 'FieldCollPlace'. It is easier to work with
more specific fields and, therefore, it is recommended that the 'Headings Across the page'
option is always chosen. Appendix A lists all ofthe fields found in COLLECTION with
the 'Headings Across the page' option.
FisldSub««t
I S«iec*w I Diiplw I Swirg
' H M A I Q I Down *w iMga ( HaaAigt Aonx (l» pag* <? E v « i
[:P~ Cipoil Heada
t R a l w M a a La i al Omitmr F iaUi fm jti— I C/Mte
B i
Figure 5.3. The Selection of'Headings Across the page' is Recommended when Creating a Report.
Source: (a) Vemon Systems COLLECTION. Version 3.42. 1998.
Modifications Required in Microsoft Access®
When importing records into Microsoft Access®, two modifications need to be
made. First, the text deliminator is changed to 'none' and second, the field separator must
be changed by typing in a '^' symbol. These two modifications must be made every time
one is importing fi"om COLLECTION to enable Microsoft Access® to recognize the
beginning and ending of each field. After these modifications have been made, they can be
100

saved in the database. The Archeology Department saves the modifications in each of its
databases in Microsoft Access® as 'bar code'. It is recommended that every department
adopt this name to reduce confiision as to its meaning
Problems Discovered with Importing Files From COLLECTION to Microsoft Access®
Using Microsoft Access® in conjunction with COLLECTION has three
disadvantages. The first problem is the need to use the same tenqx)rary file name every
time data are exported to Microsoft Access®. The second problem is the need to know
the database in Microsoft Access® to which it will be exported. The third problem is the
need to always choose the fields in the same order in COLLECTION after a report has
been created in Microsoft Access®. To solve these problems, the system operator needs
to keep a department record to document what temporary file names are to be used, to
organize the databases in Microsoft Access®, and to document the different types of
reports and the field orders required to create them in COLLECTION. The Archeology
Department has found it easiest to save and print the table created fi-om Microsoft
Access® fi-om the files just imported.
Consistent use ofthe same temporary file name is required. As previously
mentioned, the records and their corresponding fields are exported to the C drive from
COLLECTION as a temporary file c:\tenq)\NAME OF FILE.txt. The saved file then is
imported into Microsoft Access® and is converted into a table which it automatically
names NAME OF FILE.mdb. Reports in Microsoft® Access draw data fi-om these tables.
In order for a given report (created in Microsoft Access®) to recognize the table, it (the
101

table) always must have the same name (which was obtained fi-om the name ofthe
temporary file fi-om COLLECTION). Therefore, the data e^qjorted fi-om COLLECTION
always must be saved using the same file name.
The second problem is avoiding the situation of having too many databases.
Instead of creating a new database for every report that is needed, it is better to organize
reports by subject and place them in the same database. For example, the Archeology
Department has created three databases for which the formats for reports are stored,
(1) 'colltag' database, (2) 'collrep' database, and (3) 'catcard' database. Layout forms
for the information tags (except catalog cards) are placed in the first database for every
collection in the department. Various reports, including information requests,
proofi-eading reports, and inventory reports, are found in the second database. Layout
forms for the catalog cards for all ofthe collections are in the third database. Organizing
the databases this way prevented confiision conceming the database to which the
tenqjorary files needed to be exported. It also reduces the number of databases in use.
The name ofthe database, how it is used, and what reports are created in it are
documented in the department folder.
The third problem is the need to always select the fields in COLLECTION in the
same order before saving the temporary file. As mentioned previously, when
files are imported into Microsoft Access® a table is created. The fields for this table are
assigned a number sequentially (in the order they were selected in COLLECTION) and the
names ofthe fields are replaced with the number assigned (Figure 5.4 and Figure 5.5.a).
The field numbers are used (because they are now the names ofthe fields) to create the
102

report (Figure 5.5a and 5.5b). The report specifically recognizes these field numbers, not
the names ofthe fields (Figure 5.5a and 5.5b). Later, if another temporary file is created to
be used for the same report and the fields are not chosen in the same order (as they were
when the first report was created), then the information in the report will be scrambled
when the report is printed (Figure 5.5.c). Knowing the number assignments makes it
easier to design reports and helps with fiiture imports. The Archeology Department prints
out every table that Microsoft Access® assigns and places it in the department folder to
maintain control over the field order.
Field Name
Record 1
Record 2
Record 3
Record 4
1
System ID
116358
116377
116389
2
Accession No
1999.27.31.13
199927.31.16
1999.27.31.40
3
Name/Title
core
core
uni&ce
4
Other ID
41SW23
(AREA2)
41SW23
(AREA2)
41SW23
(AREA2)
5
Item Count
1
1
1
6
Field CoII Place
Name
7
Usual Location
Provenience: Stratum Open
Shelving/Arch
Provenience: Stratiun Open
Shelving/Arch
I^ovenience: Stratum Open
Shelving/Arch
Figure 5.4. Microsoft Access® Assigns a Number to Each Field to Create a Table. The field names become a record in the database. Note that 'Other ID' is the catalog number and 'Field Coll Place' is the field name in COLLECTION that refers to provenience
Sources: (a) Excerpted fi-om Vemon Systems COLLECTION. Version 3.42. 1998. (b) Excerpted fi-om Microsoft Access® Version 4.1.
103

(a) A Report in Microsoft Access® Uses the Number for Each Field to be Created.
ZH^tKOD Afchaology ClassificatkMi fteport
mJLJaL ct#
(b) The Number for Each Field Refers to the Field Names fi-om COLLECTION.
33.f»l}^
auL. fm» smjt
CsraMton*, Uwp»liMl<n>ontf*>clnglu||ln< Ofe|wnaaMuin
118349
116356
116377
1163BS
Repocikify
1999 27.31 1
Rapoalary
1999 2731.11
RepoalDry
1999.27 3114
Rapowkiiy
1989.27 31 IS
413W23(AiM 2I-5WZ3.169
41SW23(>Ma 2>>«WZa90l
41SW23 ( A m 2>-SW2]452
418W23(Araa
ztswasK
com
coia
cow
oofe
Archeology Classification Report
1 Potter ctwrt. com, oomt tHdng plattann oanax oovan m m than hal of turlace. UJiiiplWi. lUfcw gnucli tnm 226 J«g>«ai tt 9m pw«nt»». lOZaSIMOnini
Poaw diw^ cor« coital iMgng (talionn. cuiiMolo. ooHM oovan iMfarty of surlioa. htcM r a m w d •rem 70 dagrew of » • perimelcr. 72]<iaatS6nini
Paler Chen, oon, cniiptefc. eingift-tKat ttrWng pMlbmv cortei conera I a n •tan m 0) eurfaoe. • • ( • • icflwvad fnun 270 dq^aaa of the peninalar. 71.SK74x51n»n
TaooMa laapar, core. oompMto. am^e-acei ilnlung pWtonn, oortai eowaia ia«i tian 1/2 aurtaea. allaaat 2 or!IWte«lamoned 37)i41ii23>nni
Prmemenoa Sbatimi O.N1SO-196/E2S-30
PioMfiianca S M M n 0. N1S5-ia<VE26.3C
Pnwanianca iSbaUn B.N1SO'I5&E1S-20
Pnwananoa: SMia BID. N1S6-iea/E2»^
1
If i iMl 1 mr tmr Han CM
Opea 1 ShaMng/Aiohacilagi^aa MnBfWE fnpM>ystnAHi
Oper 1
aaisntfErnfiloyaaMMn
Opan 1 StMvingMRtiaalagylBai ««wanl>Einito>aa)Main
Opan 1 Shatnng/A>cheatogy<SM flnwntfcniployvcwton
(c) Fields Not Chosen in the Same Order From COLLECTION Result in Mixed-Up Reports.
23^M-O0 Archeology Classlflcetlon Report
mif rs$ Cat* Minflah apKPwrtfttw
CoraMona, Mw»»mU*S>ona/Aicl»aolcslB«* Ob|act<liiuaa<im
Dcre
com
core
core
«8poe*»»
199927 31 1
Repoailary
1999 27 31.11
RepoMofy
199927 31 14
RapoaiMY
198927 31 IS
41SMf23(Ana 2)-SW23.ie9
41SW23 (Area 2)'.SW23 B0«
41SW23IAIW 2>-SW23452
41SVV23(Ana 2hSW23 806
11S346
116356
116377
116366
Repocilory 199927 31 1
RapoaAvy
199927 31.11
Rapae4oiy
1999 27 31.14
Rapoailny
199927.31 15
Jgggjgg^
PcOer cfierl. oc •urtece, oompt lOSiSOiMniin
Poaarcliail,a turlaoa, naltai
Poller ctien. cc Van 1/2 of ami 71 Sx74x51n<(i
Taocwaajava nar l /2 i '
I't'HlhW tfV"
OpM
Open
Opar SMveigiArchaatogynat ament/EmployaawHin
Opan Shal»ing/Arcnealagy«aa aman«Efaploy«cM»n
Figure 5.5. Microsoft Access® assigns a number to each field in the order it was selected in COLLECTION.
Sources: (a) Vemon Systems COLLECTION. Version 3.42. 1998 (b) Microsoft Access®. Version 2.00. 1994
104

Steps in Creating a Customized Report
As previously mentioned, a report in Microsoft Access® uses the data fi-om a
table. The data in the table were imported as a file fi-om specified fields and records
selected in COLLECTION. Data in a table can be added, or appended to create a larger
table, or deleted and replaced by a new table. As long as the name ofthe table remains the
same, the report will be able to recognize where the data is stored in the database. The
rest of this chapter is devoted to describing the various uses and nature ofthe other six
reports. The specific installation instmctions are found in Appendix B.
Proofi-eading Report
The Proofi-eading Report will help to identify errors in the database. This
report should be created and used before information tags are printed. A printed
information tag does not contain all ofthe information about the object and,
therefore should not be used to proofi-ead the database. Data are printed using the
Proofreading Report and are conpared with the collection. Additionally, this
report helps to identify information that might be helpfiil in printing the tags (such
as number of specimens, additional location ofthe specimen multiple parts, etc.).
Figure 5.6 illustrates several common problems that the proofreading report can
help to identify.
Because this report is simply a layout used to print selected data, it can be used
multiple times once it has been designed. Files taken from COLLECTION can be
impoTtcd, appending them to the existing records, or to replace the records from
Microsoft Access® in the proofreading table. Instmctions for replacing data in a table
105

with a new file are outlined in Appendix B. An example ofthe finished report from
Microsoft Access® and the table specifications must be saved in the department folder.
Specific instmctions, if any, also should be included in the department folder.
C«T 1 ACC. J ' " IHI4VJ4
l l l i l l l l l l
1U tMI-41 I M
iMi i i iai i
' M IM1'4MM
I tKIMMI
137 104141.137
141 1Ml41.14t
•iirniiitii '4? <H14l't4I
iiKiiiinitt
144 194141-144
1 • in iH i i i i i i f i^—T"
:
flEM/8 M" APrcKi
ASmCMfvus
PH
) yOWPHOLOQY n.
T,4
Can this field be completed? |
ASTfOHPPUB T
i..
>M
t
When scanned, does the correct record appear?
OOFREADING REPORT
H*#in£VC«X«TV. TE1U4 PALEOUX
HOTTIEVCOUKTY. TEXAS PUEOUC
HARnfrCOlWTV. TEU8 PUEO SK
^ r ": 1 M*fm£Y. TWA*. U»A. : PMEOSK HAHTVer OOUHTT ItXAS :
HAnnfYOOtMTY 1EXAS PUEOUC
HARUETaoiarrv I E U B P W E O U D
HAinuvoouNTv. r e u s P U E O S K
: •OCHTIONM.BONB ROUND IN P M £ O C * a » C T H 0 f U W « I C i
"•••••"" f 1 Ho^v• many tags are needed?
>*at*.'i jmnatA
Figure 5.6. The Proofreading Report.
Source: FileMaker Pro® 4.1.v3. 1984-1999.
Information Label Report
The DEP includes printing information labels directly from the database. These
labels include specimen labels, catalog cards, and other information labels (Figure 5.7,
Figure 5.8, Figure 5.9). Printing the labels directly from the database decreases time and
energy spent handwriting numerous information labels required to process a collection.
Additionally, printing the labels from the database eliminates human transcription errors.
Specimen/object labels are created the same way as all other reports (Figure 5.8).
Care must be given to the type of paper and ink used (Williams and Monk, 1999) and how
the labels will be attached to the specimens. Labels are attached to a specimen or object
106

according to current collection management policies as discussed in Chapter VI. Labels
can be printed front and back (e.g.. Figure 5.9) and can be redesigned to print catalog
cards (Figure 5.7), accession cards, and other formats as needed.
An information label is created the same way as the proofreading report. The
mailing label option is selected and the report is designed to optimize the use of paper.
Example reports are provided for the archeology catalog card, archeology tag, and a
natural science tag report. A copy ofthe table, order of fields selected, and specific
instmctions for each report must be included in the departmental folder for all reports
created.
PANHANDLE-PLAINS HISTORICAL MUSEUM
Archeology
Ace. No Accesaoned 1996 18.1 Cat. No A2~A21
Classification: proiectle pomt No. of Specimens: J
Provenience: Randall Countvn-exas: Provenience: Surface
Description: Aibates. proiectlle poht dartpointm. corner-notched, tip and part of one barb missing
Collector: Dr.Jack Huglies (Canyon) Date: May 11 1953
D^e Cataloged: M a y l l 1953 System ID No.: 103214 l l l l l l l l l l l l
Figure 5.7. Catalog Card.
Sources: (a) Vemon Systems COLLECTION. Version 3.42. 1998 (b) Microsoft Access®. Version 2.00. 1994
107
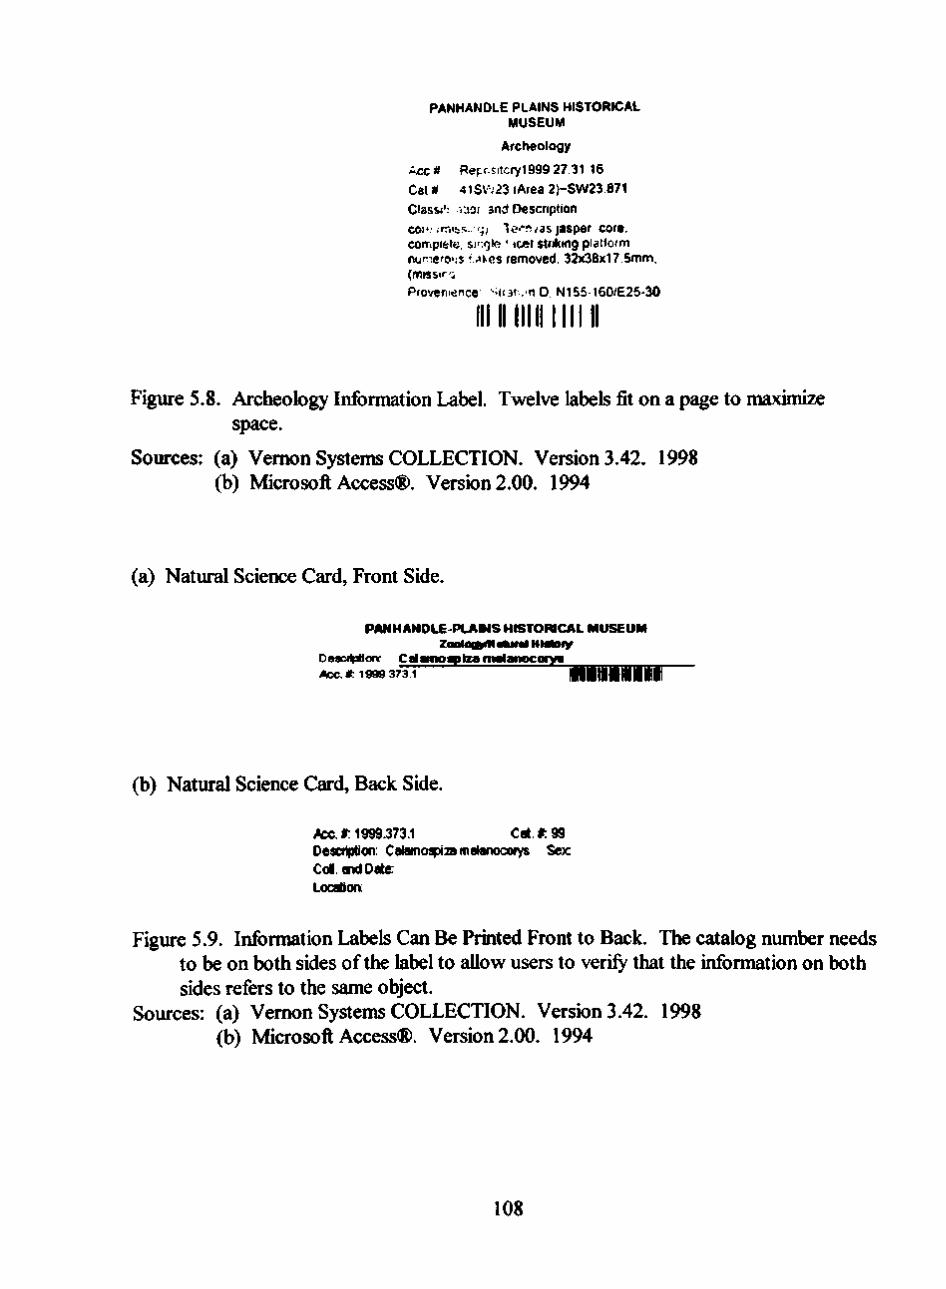
PANHANDLE PLAINS HISTORICAL MUSEUM
Archeology
Acc# ReFrsitcry1999 27 31 16 Cat # 41SV','23 (Area 2)~SW23.871 Classi': I'.iot and Description coi'/ rTMbs,. (j; T^'Tvasjaspcr core, con-.pifete, Si'-.qlp. ' jcet striking platform numero'.s ' ^Krs removed, 32x38x17 5mm, (missir j Provenience stofi.Ti D. N155-160/E25-30
llllllllllllllll
Figure 5.8. Archeology Information Label. Twelve labels fit on a page to maximize space.
Sources: (a) Vemon Systems COLLECTION. Version 3.42. 1998 (b) Microsoft Access®. Version 2.00. 1994
(a) Natural Science Card, Front Side.
PANHANDLE-PLAMS HISTORICAL MUSEUM Zoolaayilfltural Hiakiiy
Description: Calanioaiiza melanocorys Acc. *: 1999 3711 1 1 1 HIM 111111111
(b) Natural Science Card, Back Side.
AiX-iJi: 1999.373.1 Cat.* 99 Description: Caiamo^xa meianocorys Sex CoN. end Date: Location:
Figure 5.9. Information Labels Can Be Printed Front to Back. The catalog number needs to be on both sides ofthe label to allow users to verify that the information on both sides refers to the same object.
Sources: (a) Vemon Systems COLLECTION. Version 3.42. 1998 (b) Microsoft Access®. Version 2.00. 1994
108

Classification Report
The Classification Report is usefiil for responding to information requests and for
quickly identifying objects in the database. This report has the ability to group data in the
report reducing redundancy and increasing readability. Figure 5.13 shows a classification
report for the archeology collection at P-PHM. This report groups objects by Name/Title
and then sorts by the accession number. The fields are not limited to the fields shown in
Figure 5.10 and many different combinations can be created for different purposes.
Additional ideas and help designing this report can be found in the Microsoft Access®
user's manual.
Archeology Classification Report
1_ ] 11633 A(x<rs3arM uut butlala tuftHosiujttouitiiByArlnHSI209 i^r.i'iWMsiHandAMnlUanu
3X20
Cliapp«r/Slo«M Toolf9loiMJArclM«ilOf|4cal Otl)»0WmM*um I
MS4»3 RcpoMory 4ISW23 (Ana ehoppar PolH clan. CKCVPV. a m d m l » t » c w v a * • • «w< 1/2 of n r t m ovtor ProMnanc* SbaM Opan 1 19663731 32 2)-Syv:o/>< ngM M W edga KakM vid Ugmif ttn>i« l2ie2>2S>nm DIf •!"'• If^.TTO-K ShaMngfAiOiaotagylBM
•manVEnip)oy««M«r
C l a n W c i t n n |
Syi>M\_> Oli|e^_SMJ« OOiff ID Hint ". Biial^OMcrfiMn > cU .Cc l .P tKa .Mctn UsuM.LDCMIon
certfStoM. IMwcMliwlisioiwARMologiai Ot|MMnHMiim_
116346 Rapoeftvy 41SW23(Aras cor« ^MarcnwI.coa.cortuilrikingplatlamcartvxODwmn-o'.f t^wihalf ol ProveiWfKa Smkjm Qp4r , g _ , , , , , 2hS1M331S» M U C T , coiT litWB. M a t ttua *ar< 7» ifrtm d llw iMnna l i D. N1J0-1SVE26.30 Sh«hi-vAn:neoia«yfBai
11S396 RflPOMory 413W33(Ar«a cor* Ponerdwt csre coftex sirluiig piaVonn (xmctsla cortBx C3.«n rna«r%of PrDVsnwnca SViium Op«f' 1 » » 2 7 3 1 1 1 2hSW23.M» «i«t»,» daku r«. »..»d "-oni ro*jft«a»»e (vcmnnef 72«10O.S6«nm D. t«1S5^ie(yE2»-]0 S W I Y M H » ' A I C I H 0 I 0 1 | O I H
cwsnt/EfnptoyoaAIMt
116377 Ropcvtory 41SW23(Area oan Ponar cheit con. covnftela. aaigla-lacat fctnfcng piatft:*'-' C 7 1 H . cu.an kaa P m w n a m )9kalum O^an 1000^71114 2)-SV«234(S3 ltianlf2o<aurtBoa •a>aarenia«cdln>n270ae^reaaci'r«u<viMar B. N I S } . 1 t K 1 M 0 Shalmv'''<^'*<*>9«>^> i i i i » . ! / j i i 4 7i5«74i5i'^ an«r«£fTi|«r«aaMaai
11&3M RapoaiiDiy 41SW234>Waa oon Taoovae laapar oat coff'piali »f<9ba.aca(«tn» lu i.qtform. ooriai covers I'c^ Pfc^rtNoo* sima op«i • o c ^ - i T U K 2V-SVV23»0e Ilian1/2«4l«c« alleaB»2or3Bal<asr»~^va9 ...Ii23mni BJD Nl$6-ie(yas.3l> •!^•t<rv*'<:raolag>'Ba• ' * " * ' " " , I, , i . ( i - i , , . -
Figure 5.10. Classification Report fi-om the Archeology Department at P-PHM.
Sources: (a) Vemon Systems COLLECTION. Version 3.42. 1998 (b) Microsoft Access®. Version 2.00. 1994
109

Work Report
The Work Report is used to help with identifying and tracking particular problems
(e.g., deterioration, requires consolidation, etc.) in a collection. The bar codes on the
labels are scanned (using the Multiple Find View) for those objects where the particular
problem is present. The Work Report then is used to create a list ofthe items needing that
particular type of attention. The list then is printed as a report and/or saved in the
database. Figure 5.11 shows a work report used to identify objects that require
stabilization. The list was created by scanning the bar code labels (using the Multiple Find
view) of objects that needed to be stabilized. The list was then saved in COLLECTION,
exported, and a report was created using Microsoft Access®. A check box was added to
each line ofthe report. The box is checked to indicate that the task has been completed.
This report may be modified to address many different possible situations.
IVlarch 12,2000
Cataloa t
2127
2128
212d
2130
2131
2132
AfifilLf
1972-242
1972-242
1972-242
1972-242
1972-242
1972-242
Work R«port
Q«nu. and Spaciaa
ADJIDAUMO
ADJIDAUMO
ADJIDAUMO
ADJIDAUMO
ADJIDAUMO
ADJinAI IMO
Specimens needing stabilization
Locition 1 paleo Q
1 P-*" • 1 P» D
palm Q ]
j patM) • 1
Figure 5.11. Work Report is Used to Aid in Collection Management Duties. A box at the right of 'Location' was added to allow for space to mark when the task is completed.
110

Inventorv and Loan Report
The Inventory and Loan Report is usefiil for identifying missing objects currently
not present in the coUectioiL This report can be used in a comprehensive inventory or
with a large loan. A "found set" of records is created (either in the main database or as a
separate file). This set will include all the specimens/objects that are supposed to be in the
collection. The bar codes ofthe objects that are actually in the collection then are scanned
and each is omitted fi-om the "found set." Once the scanning process is complete, only
those objects not found will remain in the "found set" and a report of these missing
objects can be printed- This process makes inventory control simpler and allows effort to
be concentrated on finding the missing object(s).
The Inventory and Loan Report also is usefiil for the production of other reports
(other than those mentioned above), especially when a larger report must be created or
when multiple reports are required fi-om the same set of records. A Multiple Find is
performed to locate a set of records. If time prevents continuing, then the records are
saved as a list and the list is reopened to finish locating the records. When all ofthe
records are located, a report is created the same way as the work report.
I l l
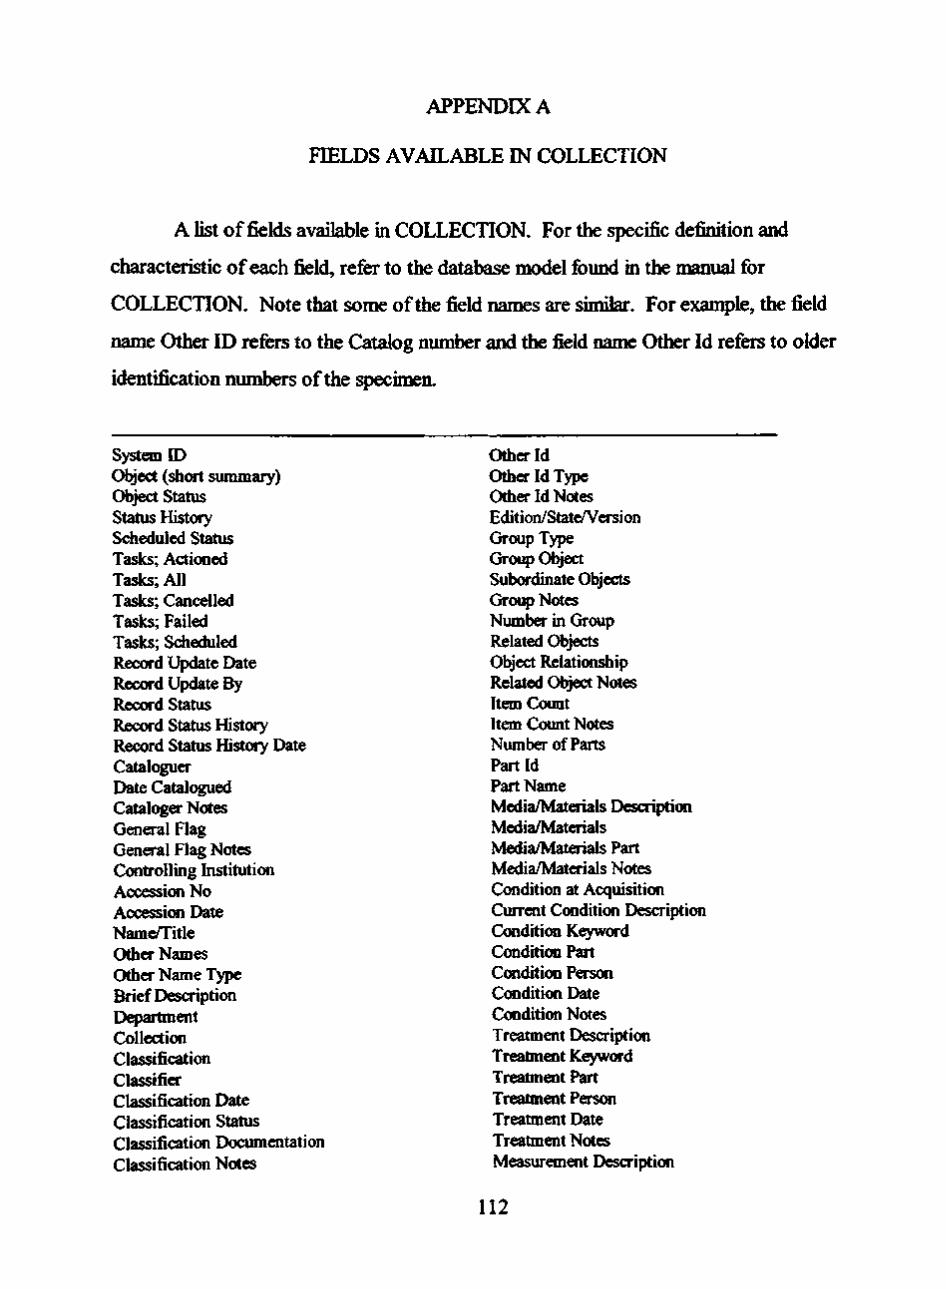
APPENDIX A
FIELDS AVAILABLE IN COLLECTION
A list of fields available in COLLECTION. For the specific definition and
characteristic of each field, refer to the database model found in the manual for
COLLECTION. Note that some ofthe field names are similar. For example, the field
name Other ID refers to the Catalog number and the field name Other Id refers to older
identification numbers ofthe specimen.
System ID Object (short summary) Object Status Status History Scheduled Status Tasks; Acticmed Tasks; All Tasks; Cancelled Tasks; Failed Tasks; Scheduled Record Update Date Record Update By Record Status Record Status History Record Status History Date Cataloguer Date Catalogued Cataloger Notes General Flag General Flag Notes Controlling Institution Accession No Accession Date Name/Title Other Names Other Name Type Brief Description Department Collection Classification Classifier Classification Date Classification Status Classification Documentation Classification Notes
Other Id Other Id Type Other Id Notes Edition/StateA^ersion Group Type Group Object Subordinate Objects Group Notes Number in Group Related Objects Object Relationship Related Object Notes Item Count Item Count Notes Number of Parts Part Id Part Name Media/Materials Descripticm Media/Materials Media/Materials Part Media/Materials Notes Condition at Acquisition Current Condition Description CcMidition Keyword Condition Part Ccmdition Person Condition Date Condition Notes Treatment Description Treatment Keyword Treatment Part Treatment Person Treatment Date Treatment Notes Measurement Description
112

Measurement Type (Y display only) Measurement Part (Y display only) Measurement Reading (Metric & Imp, Y display only) Measurement Reading (primary system, Y display only) Measurement Reading (secondary system, Y display only) Measurement Precision (Y display only) Measurement Date (Y display (mly) Measurement Notes (Y display cmly) Measurement Type (Y&N display Measurement Part (Y&N display) Measurement Reading (Metric & Imp, Y&N display) Measurement Reading (primary system, Y&N display) Measurement Reading (secondary system, Y&N display) Measurement Precision (Y&N display) Measurement Date (Y&N display) Measurement Notes (Y&N display) Measurement Display Flag Size Category Signature/Marks & Date Description Signature/Marks Notes (Y display only) Signature/Marks Type (Y display only) Signature/Marks Part (Y display CHily) Signature/Marks Method (Y display only) Signature/Marks Notes (Y&N display) Signature/Marks Type (Y&N display) Signature/Marks Part (Y&N display) Signature/Marks Method (Y&N display) Signature/Marks Display Flag Physical Description Shape Notes Shape Keywords Color Notes Color Keywords Surfece Notes Surfece Keywords I>ecoration Notes Decoration Keywords Age Notes Age Keywords Sex Notes Sex Keywords Form Notes Form Keywords Phase Notes Phase Keywords Scale Notes
Scale Keywords Language Notes Language Keywords Script Notes Script Keywords Style Notes Style Keywords OrientaticMi Description Orientation OthCT Physical Aspect Notes Other Physical Aspect Keywords Generic Origin (fiill details) Production-General Notes Primary Maker (name only) Primary Maker (name & role) Primary Maker (bio details) Primary Maker (biography) Primary Production Tedhnique Primary Production Place Primary Production Date Primary Production Earliest/Latest Dates Primary Production Period Secondary Production (full details) Field Coll Ref Field Coll Ref Person (name & role) Field Coll Ref Date & Time Field Coll Ref Site Details Field Coll Ref Place Details Field Coll Ref Stratigraphy Details Field Coll Ref Map Details Field Coll Ref Habitat Details Field Coll Ref Specimen Details Field Coll Ref Method Field Coll Ref Latitude Field Coll Ref Longitude Field Coll Ref Altitude Field Coll Ref Depth Field Coll Ref General Notes Subject Person (name only) Subject Person (name & role) Subject Person (full details) Subject Place Subject Event Subject Period Subject Date Subject Object Subject Category Subject Notes Associated Person Associated Person Details Associated Place Associated Event
113

Associated Date Associated Object Association Notes Disallow Movement? Usual Location (& part) Currait Location (foil details) InventOTy (location, date & part) Location History Support Description Storage Requirements Storage Method Packing Requirements Handling Requirements Display Requirements Current Owner Acquisition Method Acquisition Reason Acquisition Authority Acquisition Date Acquisition Depositor Acquisition Source (name & role) Acquisition Source & Address Price (caiginal) Acquisition Price Local Acquisition Valuation Acquisition Notes Acquisition Funding (foil details) Credit Line Provenance (foil details) Cq)yright (foil details) Restrictions (foil details) Valuation (latest value only) Valuation (latest only with details) Valuation (all values cmly) Valuation (all values with details) Insurance Value (latest value only) Insurance Value (latest only with details) All Internal Valuations All Insurance Valuations Attribution (foil details) Registrar Notes (foil details) Curator Notes (foil details) Researcher Notes (foil details) Documentation (short summary only) Documentation (short summary & notes) Documentation Display Documentation (foU details) Photo/Audio-Visual Details Exhibition Venue Exhibition Details Outward Loan Details Inward Loan Details
Deaccession Status Deaccession Reason Deaccession Date Deaccession Date Release Deaccession Method Transferred To Deaccession Proceeds Deaccession Authorizer Details Deaccession Notes User AuthOTity 1 User Authority 2 Usa- Authority 3 User Authority 4 User Authority 5 User Defined Value I User Defined Value 2 User Defined Value 3 User Defined Value 4 User Defined Value 5 User Defined Text 1 User Defined Text 2 User Defined Text 3 User Defined Text 4 User Defined Text 5 Provenance Place (foil details) Cultural Affiliation (foil details) User Authority 3 (AMV) User Authority 4 (AMV) User Authority 5 (AMV) User Sym 1 User Sym 2 User Sym 3 User Sym 4 User Sym 5 User Sym 6 UsCT Sym 7 Other ID Genus Species User Sym 11 Bar Code User Sym 13 User Sym 14 User Sym 15 User Sym 16 User Sym 17 User Sym 18 User Sym 19 User Sym 20 Exhibition Venue Activities Management Details
114

APPENDIX B
SPECinC E^STALLATION ESfSTRUCTIONS
This section is devoted to the actual installation and usage ofthe DEP using
Vemon Systems COLLECTION (version 3.42) and Microsoft Access® (version 2.00).
First, directions are provided for how to use the Multiple Scan find view (APPENDIX
Bl). Then instmctions are given for creating and using the reports (APPENDIX B2-B3),
as outlined in Chapter IV.
The instmctions include normal text, bold, bold and italicized, and highlighted
words. Words in bold refer to steps in the script that require clicking with the mouse. If
something is bold, italicized and in Arial font, it means that the user will type the
required information. FinaUy, highlighted text refers to special instmctions or concerns
that are not mentioned in the directions for how to create a general report and are specific
to the particular report.
APPENDIX Bl
'Directions for creating a file in COLLECTION' is provided for creating, saving,
and exporting a temporary file in COLLECTION. These instmctions are the same for
every report created and need to be followed before continuing to Microsoft Access®.
115

APPENDIX B2
'Directions for importing the field created fi-om collection into Microsoft Access®'
describes how to create a new database and import the ten^rary fiJe saved in the first set
of instmctions ('Directions for creating a file in COLLECTION'). Microsoft Access®
converts this temporary file into a table and adds it into the database.
The table then is used to create a report as described by the 'instmctions for
designing a new report in Microsoft Access®. These instmctions include how to change
the bar code font in step three.
The instmctions, 'subsequent imports into the same database', deal with how to
import more files into the same database as the one created previously. Additional tables
can be imported into this database to create a new report, or a table with the same type of
information can be imported to replace, or append a previously created table and used
with a previously created report.
It is vitally important that a back up for every report is saved. This process is
explained in the final section of Appendix B2, 'instmctions for creating a backup the
report in Microsoft Access®.
APPENDIX B3
The final set of instmctions are specific examples of reports created for the
Archeology Department using both COLLECTION and Microsoft Access®, including the
proofi-eading report, archeology tag report, catalog card report, natural science tag report,
classification report, and inventory and loan report. Although each report generally is
116

created the same way, some specific differences and/or special concerns make it helpfiil to
have these kistmctions.
117

APPENDIX Bl
Directions for Using Multiple Scan Find View
In COLLECTION;
I. Click on Report; choose Object.
II. Click on Selection tag.
III. Click on the top line and scan or type on the keyboard the System ID numbers. (See figure below).
Foimat T Selection Display T Soiling T Options
If no recoid* ate selected, and a List Name oi Saved Queiy is not specified, the «*hole file t*ii be selected.
1996 12.2: ceiamic 11996 12 3; ceiarmc Il996.13.1,p(0|cctile point 11996 13.10, ceiamic 199613.2. dull
flueiy
Raofdei
Deaf l.'JAiJJ.': J...g.>'t.' L^.^K^.'.UJiUJl^-'
I Name £etLi«t \ i j» tMan. |
Finding multiple records in COLLECTION by using the selection tag.
Source: Vemon Systems COLLECTION. Version 3.42. 1998
118

APPENDIX B2
Directions for Creating a File m COLLECTION
In COLLECTION:
I. Click on Report; choose Object.
II. Click on Export box (see figure below) and Click on Microsoft Word under the Export Format (see figure below)
III. Click on Headings Across the page box. (see figure below)
^rair i i^ r
FisldSul
I 5<i««en I Duplltl I So*>g |
^lllllifcuji niiwii lliii liijii ' HflMfcigs AcroAt Itw p«on - i ^.r.i
r EiyiNl Fienaaie
]i- -ri-r-r. ir. i - - argm.-
... f^ Eiqwil Heada i ri>Alin«l«nn<»LM<iiil>Mpl<vH.M<
Format Tag includes the Export, Export Filename, and Headings Across the page.
Source: Vemon Systems COLLECTION. Version 3.42. 1998
IV. Name the file C:\temp\name of file.txt (Remember to record the file name in the department folder) (see figure above)
V. Select the records to be copied and exported using the Multiple Scan Find view. A. Alternatively, use a query (see figure below) to find a specific collection by
title specifications by pressing the query button. Then choose the type of query to be performed.
119

VI.
Directions for Creating a File in COLLECTION (cont.)
Query.
Source: Vemon Systems COLLECTION. Version 3.42. 1998
Click on the Display tag and choose the fields to be included in the file for the report. Record the field order in the department folder.
Vll. Click on Sorting and choose the field(s) in the order to be sorted.
Vlll. Click on the Export icon box)
(Located in the top left comer ofthe reporting
IX. If asked about overwriting, click on Yes and overwrite. (It is overwriting the previously saved data.)
X. Finished.
120
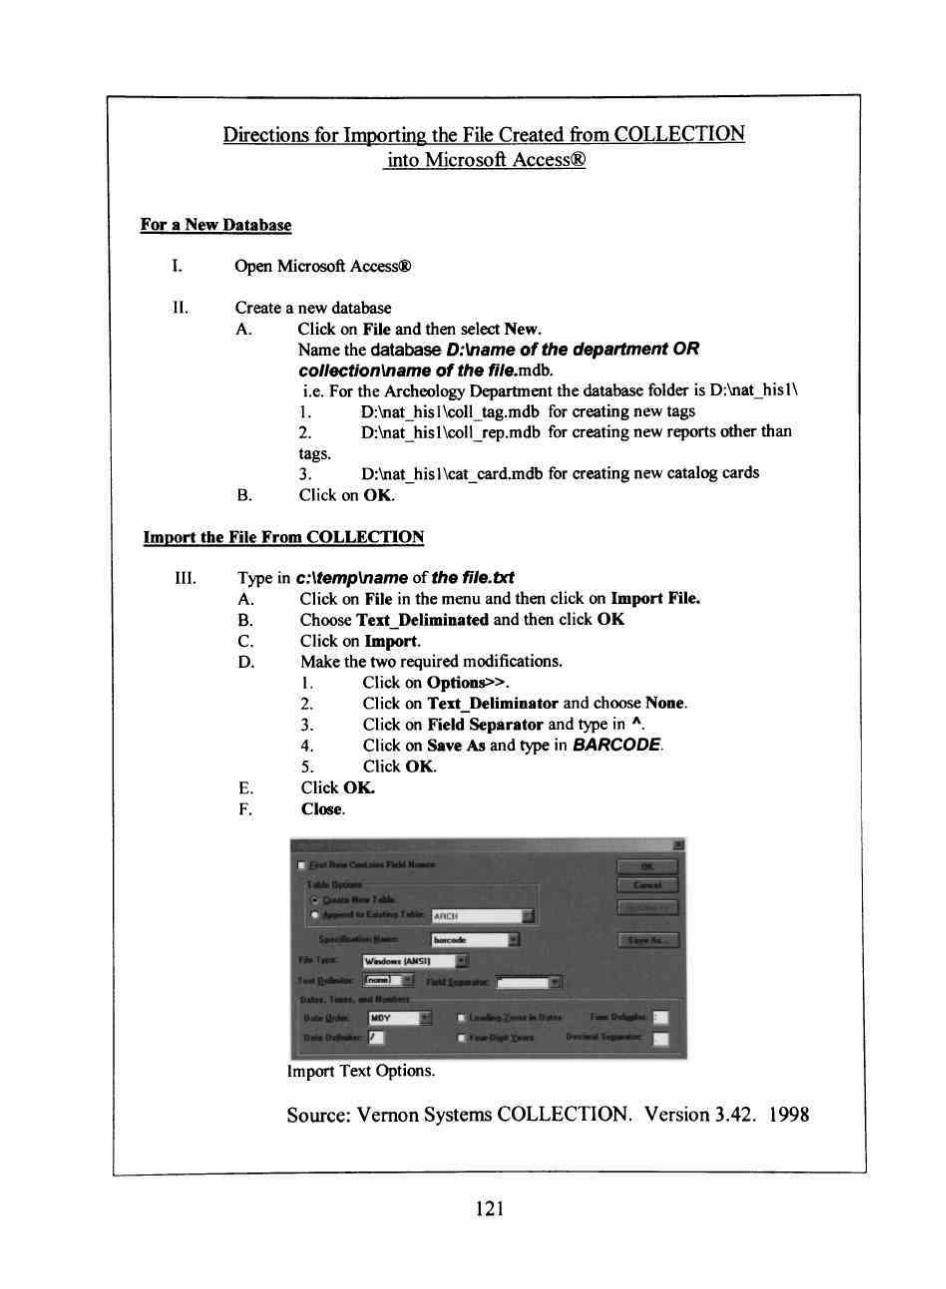
Directions for Importing the File Created fi-om COLLECTION into Microsoft Access®
For a New Database
I. Open Microsoft Access®
II. Create a new database A. Click on File and then select New.
Name the database D:\name ofthe department OR collection\name of the file.mdh. i.e. For the Archeology Department the database folder is D:\nat_hisl\ 1. D:\nat_hisl\coll_tag.mdb for creating new tags 2. D:\nat_hisl\coll_rep.mdb for creating new reports other than tags. 3. D:\nat_his l\cat_card.mdb for creating new catalog cards
B. Click on OK.
Import the File From COLLECTION
III. Type in c:\temp\name of the file.txt A. Click on File in the menu and then click on Import File. B. Choose Text_Deliminated and then click OK C. Click on Import. D. Make the two required modifications.
1. Click on Options». 2. Click on Text_Deliminator and choose None. 3. Click on Field Separator and type in ^. 4. Click on Save As and type in BARCODE. 5. Click OK.
E. Click OK. F. Close.
n n t Row Conlamt FieU NaaKi
Table Optiom
(• C>aa<a N a « Table
^ ^^pp«fid (o Existing T<
Specificalion daaie:
FileTHw: ^ W n d o o i |ANSI|
Tent CdbMler
Da(e>. T H W < , and Nuaben
Dalailfitar. | MOY ^ l ^ Leajfag^enMiwOale* I i a a O a l w l n
DateDeWlef : [ ^ | | ^ ^ ^ B T Fma-Ovt X « « « OeciMl SeeMXx^
Import Text Options.
Source: Vemon Systems COLLECTION. Version 3.42. 1998
121

Instmctions for Designing a New Report in Microsoft Access®
I. Print the table(s) that will be involved in creating the report. This step is helpful to view Mdiich fields correspond with the numbers that Microsoft Access® assigned. A. Open the table(s) and print. B. Note that the order the fields are chosen in COLLECTION determines the
field numbers assigned by Microsoft Access®. C. When importing records into a table the fields always must be chosen in
the same order as they were whai the table was first created.
II. Create a new report. A. Click on the Report icon and then click on New. B. Select the table(s) involved. C. Click on Report Wizard. D. Click on the type of report to be created.
1. Single Column: Creates a list. 2. *Group/Total: Groups the report into classifications. 3. Summary: For calculations, e.g., total number of objects. 4. Mailing Labels: For tags or catalog cards.
E. Follow the directions from the wizard in Microsoft Access®. Be sure to choose all the fields. Continue through the wizard by clicking Next.
F. Click on Finish
*If this is a Group/Total report - deselect the 'Calculate percentage ofthe total' and click on 'See all ofthe fields on one page' in the last page ofthe Wizard.
ni. Design the report. A. Design your report to make it usable by dragging the fields in the position
most useful for the purposes of report. Refer to the Microsoft Access® Manual for helpful hints on designing the report.
B. Changing the bar code font. 1. Code 39: Change the font in the field to 'C39 High 12 pt LJ4' and
the font size to 12. 2. Code 128: Make sure the fcmt and the font size agree. Refer to the
Bar Code Translator's Manual for fiirther instructions. rV. Print
122

Subsequent Imports into the Same Database
Importing an Additional Table in to a Preexisting Database.
I. Open Microsoft Access®
II. Open the correct existing database. (Created previously) A. In the File Menu click on Open
For the Archeology Department the database folder is D:\nat_his 1\ D:\nat_hisl\coll_tag.mdb for creating new tags D:\nat_hisl\coll_rep.mdb for creating new reports other than tags. D:\nat_hisl\cat card.mdb for creating new catalog cards
III. Importing a file from COLLECTION into the existing database A. Click on File in the menu and then click on Import File. B. Choose Text_Deliminated and then Click OK C. Type in C:\temp\name of file.txt. D. Click on Import E. Click on Options». F. Click on Specification name and choose the saved name BARCODE. G. Click OK. H. Close.
Replacing or Appending a Table in to a Preexisting Database.
I. Importing another file from COLLECTION to a previously existing table. A. Start in COLLECTION.
1. Follow the directions above for creating a file to export from COLLECTION to Microsoft Access®.
2. Be sure to select the fields in the same order as the fields as the existing table in Microsoft Access®.
II. Importing another file from COLLECTION to a previously existing table. A. Adding data to a table in Microsoft Access®.
1. Delete the preexisting table ofthe same name, by clicking on it and pressing the delete button.
BE SURE THE TABLE IS DELETED AND NOT THE REPORT! 2. Click on File in the menu and then click on Import File. 3. Choose Text_Deliminated and then Click OK 4. Type in C:\temp\name of file.txt. 5. Click on Import 6. Click on Options» 7. Click on Specification name and choose the saved name
BARCODE. B. Click OK. C. Close.
123
Instmctions for Creating a Backup of a Report in Microsoft Access®
I. Creating a backup on disk, zip, or the desktop. A. Create a new database. B. Click on File and select New. C. Name the database the same as above Drive letter (A, D, etc.) :\name of
the department OR collect/on\name ofthe file.mdb. Click on OK to save.
II. Import the tables and report into the backup disk. A. Click on the Import Icon B. Choose the tables and reports to be copied and imported. C. Click on OK.
124
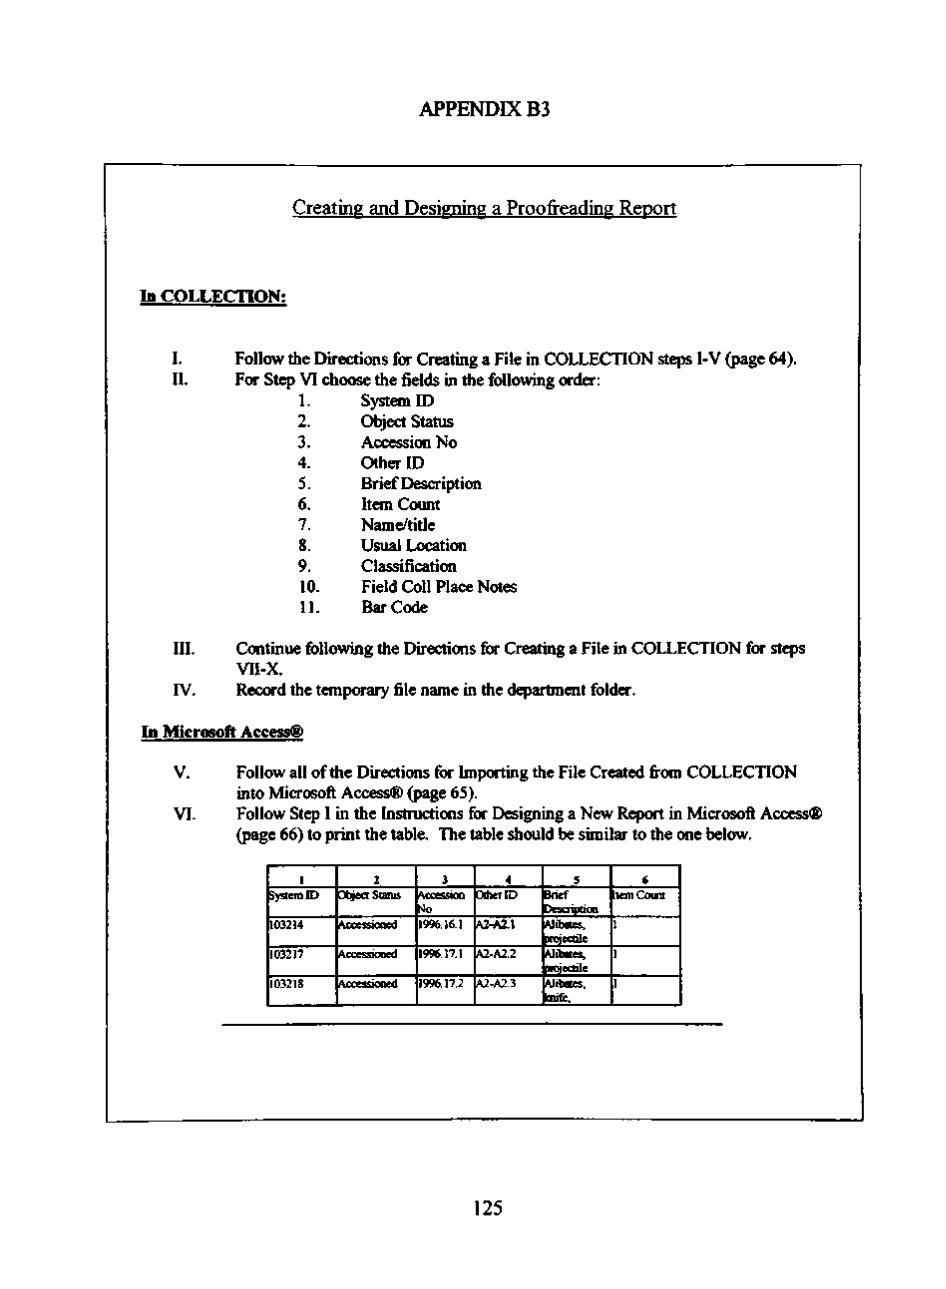
APPENDIX B3
Creating and Designing a Proofi-eading Report
In COLLECTION:
I. Follow the Directions for Creating a File in COLLECTION steps I-V (page 64). II. For Step VI choose the fields in the following order:
1. 2. 3. 4. 5. 6. 7. 8. 9. 10. 11.
System ID Object Status Accessicwi No Other ID Brief Description Item Count Name/title Usual Location Classification Field Coll Place Notes Bar Code
III. Continue following the Directions for Creating a File in COLLECTION for steps VII-X.
rV. Record the temporary file name in the department folder.
In Microsoft Access®
V. Follow all ofthe Directions for Importing the File Created from COLLECTION into Microsoft Access® (page 65).
VI. Follow Step 1 in the Instmctions for Designing a New Report in Microsoft Access® (page 66) to print the table. The table should be similar to the one below.
1 System ID
103214
103217
103218
2 Object Status
Accessioaed
Accessioned
Accessioned
3 Accession No 1996.16.1
1996.17.1
1996.17.2
4 Other ID
A2-A2.1
A2-A2.2
A2-A2.3
5 Brief Description Alibates, jTOJecdle Alibetes, projectile Alibates, Icnife,
6 [tem Count
1
1
1
125

Creating and Designing a Proofi-eading Report (cont.)
7 Name/Title
projectile point
prqiectile point
Knife
8 Usual Location
Open shelf
Open shelf
Open shelf
9 Classification
Tecovas jasper.
recovasjaq)er.
10 Field Cdl Place Notes Provenience: Stratum Provenience: Smface
Potter chert, core Provenience: Surface
11 Bar Code
•103214*
•103217*
* 103218*
Figure ofthe table from the Proofreading Report
VII. Continue following the directions for Instructions for Designing a new Report in Microsoft Access® (page 66) for Step IIA-F. A. Forll.C. The Proofreading Report is best if it is a single column or a
group/total report.
Vin. Design the Proofreading Report. A. Design your report to make it usable by dragging the fields in the position
most usefiil for the report. Refer to the Microsoft Access® Manual for helpfiil hints on designing the repot.
B. Changing the bar code font. 1. Code 39: Change the font in the field to 'C39 High 12 pt LJ4' and
the font size to 12. 2. Code 128: Make sure the fcmt and the font size agree. Refer to the
Bar Code Translator's Manual for fiirther instructions.
IX. Print and place a copy in the department folder.
X. Save and create a backup ofthe report.
126

Creating and Designing a Catalog Card Report.
In COLLECTION;
I. Follow the Directions for Creating a File in COLLECTION steps I-V (page 64). II. For Step VI choose the fields in the following order:
1. 2. 3. 4. 5. 6. 7. 8. 9. 10. 11. 12. 13. 14. 1 c
System ID Other ID Accession No Brief Description Object Status Department Name/title Item Count Field Coll Date Field Coll Person Field Coll Place Date Catalogued Bar Code Field Coll Place Notes
ID.
III. Continue following the Directions for Creating a File COLLECTION for steps VII X.
IV. Record the temporary file name in the department folder.
In Microsoft Access®
V. Follow all ofthe Directions for Importing the File Created from COLLECTION into Microsoft Access®(page 65).
VI. Follow Step I in the Instructions for Designing a New Report in Microsoft Access® (page 66) to print the table.
VII. Continue following the directions for Instructions for Designing a new Report in Microsoft Access® for Step II A-F (page 66). A. Forll.C. The Catalog Card Report is best if it is a mailing label. Choose
the 3/5 option, or the size needed. VIII. Print and place a copy in the department folder.
IX. Save and create a backup of the report.
127

Creating and Designing Information Label Report
Many different types of information labels are available. The following are the
instmctions for the natural science information labels, \\iiich includes instmctions
for printing fi-ont and back. Refer back to Chapter V for additional comments.
Try to place as many labels on a page as possible to maximize the paper use.
Twenty natural science tags can fit on one page. Most information labels are
created by using the mailing label option.
I. Follow all ofthe Directions for Creating a File in COLLECTION (page 64).
II. Follow all ofthe Directions for Importing the File Created from COLLECTION into Microsoft Access® (page 65).
III. Follow all ofthe Instructions for Designing a New Report in Microsoft Access® (page 66) and design the front side. Record the measurement for the label chosen when completed. A. For II.C. The Natural Science Tag is best when created as a mailing label.
IV. Repeat the Instructions for Designing a New Report in Microsoft Access® (page 66) and design the back side. Use the same measurement as the front side.
V. Open both the Front Side Report and the Back Side Report and modify the two so they are aligned.
VI. To Print A. Open both reports.
1. Click on the Report iccm and then click on the reports Nat_Hist_Tag Front_Side and Nat_Hist_Tag Back_Side.
B. Click on Preview to view both reports. C. Print one side and then turn the paper and place back in the printer before
printing the report for the backside. 1. For example, in order to align the natural history tags, the report
for the front side is printed and then the paper must be shuffled in reverse order and turned 180 degrees before it can be placed back in the printer. Finally, the report for the back side is printed.
VII. Save and create a backup of the report.
128

Creating a Classification Report
I. Follow all ofthe Directions for Creating a File in COLLECTION (page 64).
II. Follow all ofthe Directions for Importing the File Created from COLLECTION into Microsoft Access® (page 65).
III. Follow all ofthe Instructions for Designing a new Report in Microsoft Access® (page 66) Refer to the Microsoft Access® Manual for fiirther instructions for designing a group/total report. A. For n.C. Choose Group/Total. Unclick 'Calculate percentage ofthe total'
and Click on 'See all ofthe fields on one page' in the last page ofthe Wizard.
129

Inventorv and Loan Report
This is a set of instmctions for creating an inventory and loan report. These
directions can be used to produce other reports, especially when a larger report
must be created or when multiple reports are required fi^om the same set of
records. A multiple find is performed to locate a set of records (I-IH). If time
prevents continuing, the records are saved as a list (TV-V) and the list is reopened
to finish locating the records (VI-IX). When all ofthe records are located, a
report is created.
Creating an Inventorv and Loan Report
I. Click on Report and choose Object
II. Choose Heading Across the page.
III. Click on the Selection Tab and scan or tyf)e on the keyboard the System ID
numbers.
rV. Click on List Man. and in the File Menu choose List and then choose Save as List.
V. Name the new List File and Click OK twice.
Comparing the list with Another Inventory/loan.
I. Click on Report and choose Object.
II. Choose Heading Across the page.
III. Click on the Selection Tag.
rV. For adding records to the older list:
A. Click on List Man. and in Edit menu choose Add. B. Scan/type in the System ID number(s) and then click OK. C. Click on Function in the File Menu and choose Remove Duplicates. D. Click OK and save the modified list. E. Choose the list to compare. To delete the duplicated entries, choose XOR. F. Click OK. The new list can be saved, or directly printed as a report.
130

Inventory and Loan Report (cont.)
Designing the Inventory/Loan Report
I. This report can be printed as a list from COLLECTION, or designed as one ofthe
reports mentioned previously.
II. The fields required depend on the needs ofthe collection.
III. This report is modified in many different combinations and designs
131
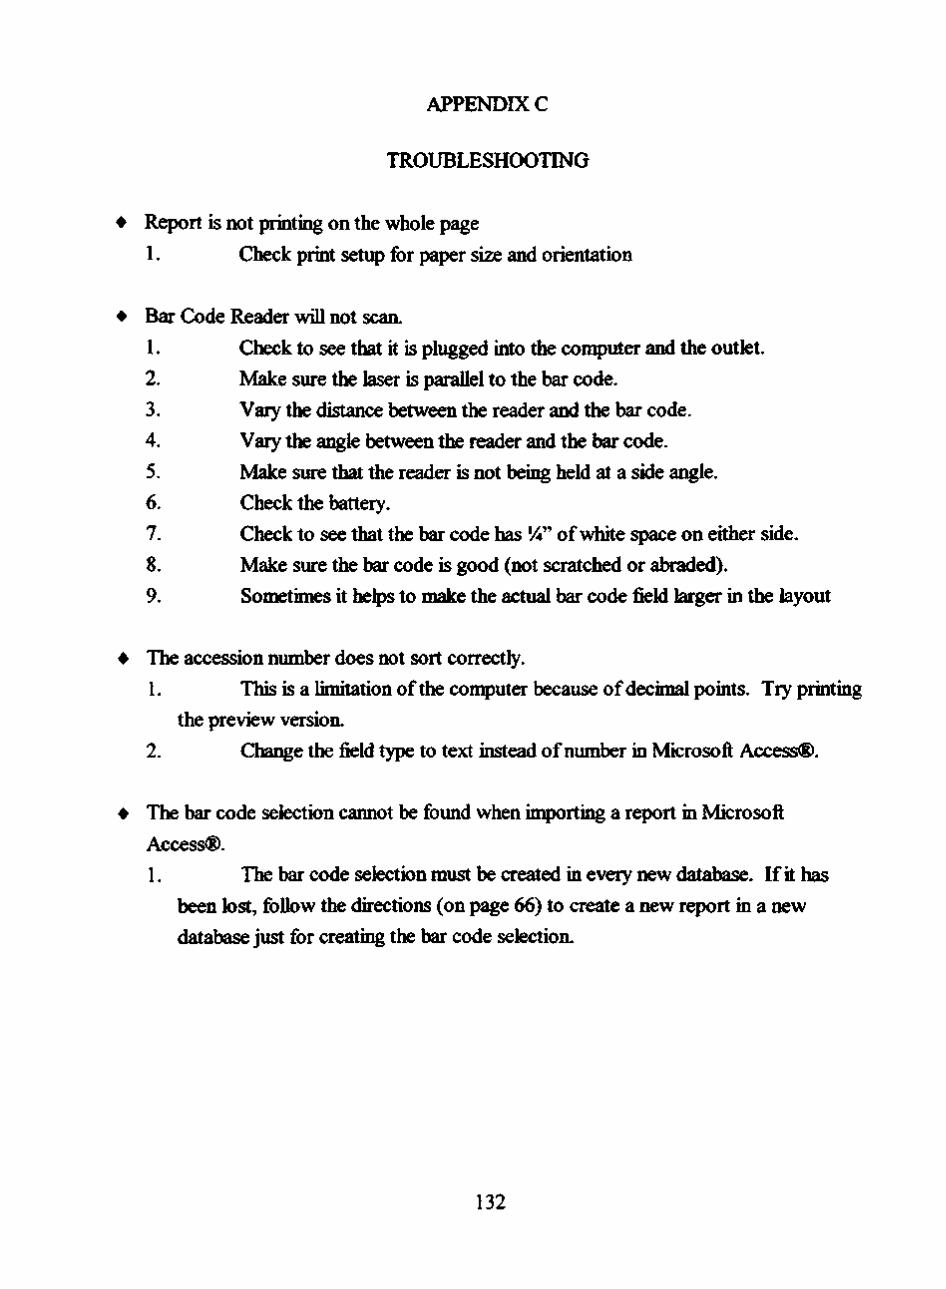
APPENDDC C
TROUBLESHOOTING
• Report is not printing on the whole page
1. Check print setup for paper size and orientation
• Bar Code Reader will not scan.
1. Check to see that it is plugged into the conq)uter and the outlet.
2. Make sure the laser is parallel to the bar code.
3. Vary the distance between the reader and the bar code.
4. Vary the angle between the reader and the bar code.
5. Make sure that the reader is not being held at a side angle.
6. Check the battery.
7. Check to see that the bar code has %" of white space on either side.
8. Make sure the bar code is good (not scratched or abraded).
9. Sometimes it helps to make the actual bar code field larger m the layout
• The accession number does not sort correctly. 1. This is a limitation ofthe computer because of decimal points. Try printing
the preview version.
2. Change the field type to text instead of number in Microsoft Access®.
• The bar code selection cannot be found when importing a report in Microsoft
Access®.
1. The bar code selection must be created in every new database. If it has
been lost, follow the directions (on page 66) to create a new report in a new
database just for creating the bar code selection.
132

APPENDDC D
THE BAR CODE SYSTEM AND
VERNON SYSTEMS COLLECTION VERSION 3.50A
The most recent version of COLLECTION is 3.50a It is noteworthy to mention
this version in this manual because of specific changes to the bar code system. As
mentioned in Chapter V, the five criteria for con:q)atibility of a database with the bar code
system are: ability to allow customized reports such as mailing labels, ability to change
fonts for individual fields, and the ability to find multiple random records with the process
"type in the System ID Number" pressing "retum" once, to continue to the next find.
Anytime a database is updated, these criteria must be reexamined.
Version 3.50a does allow some customized reports. However, the customized
reports are created in a word-processing program (Microsoft Word®) and does not allow
reports as complex as mailing labels to be created. It is recommended that Microsoft
Access® still be used in conjimction with this newer version of COLLECTION to satisfy
the first criteria. Simpler reports, such as the Proofi-eading Report, Work Report,
Classification Report, and Inventory/Loan Reports should be created through
COLLECTION and do not need to be exported to Microsoft Access®. However, if the
user still finds it usefiil to use Microsoft Access® with these reports, they may continue to
do so.
Version 3.50a con:q)letes the second criteria and allows the font for individual
fields to be changed. Because the bar code is just a font, it now can be created using
133

COLLECTION, and does not need to be exported to other programs, such as Microsoft
Access®. However, if mailing label reports need to be created, then Microsoft Access®
must be used because ofthe first criteria (as stated above).
The last criteria is the ability to find multq)le records at random by using only the
retum character once, each time the "System ID" number is typed. This feature is
required because the bar code reader works like a keyboard and separates each scan with
one retum character. The Multiple Find in version 3.50a does not fill this criteria. The
"System ID" number is typed and then return character must be pressed twice to find the
record and move down to the next line to continue. The only way around this feature at
this time is to scan every bar code twice so the Multiple Find view can work correctly.
134

APPENDDC B
THE DATA ENHANCEMENT PROJECT:
INCORPORATING BAR CODE CAPABILITIES
INTO EXISTING FILEMAKER PRO® DATABASES
AT THE MUSEUM OF TEXAS TECH UNIVERSITY
135

The Data Enhancement
Project:
Incorporating Bar Code Capabilities
Into Existing FileMal<er Pro®
DatalDases at tine IVIuseum of
TEXAS TECH UNIVERSITY
by: Susan E. Fishman-Armstrong,
Heath J. Geuner, and Matthew Owen Houle
MI!li;!!'l| p.iini|||.'
ifV !! l Ilii Museum of
TEXAS TECH UNIVERSITY Lubbock, Texas
136

APPENDIX B
This section contains chapters fi-om the "Museum of Texas Tech University Data
Enhancement Project" manual. Chapters V, and Appendices B and C fi-om the MoTTU
manual are included in this Appendix. Appendix Bl is Ch^ter V fi-om the MoTTU
manual and it explains how to use the views and reports with FileMaker Pro®. Appendix
B2 is Appendix B fi-om the manual and it is included because it contains the step-by-step
instmctions for installing and using the bar code system with FileMaker Pro®. Appendix
Bl explains how to look up fields and find data format discrepancies in fields. Appendix
B2 explains how to install the bar code and serial number. Appendix B3 describes the
instmctions for creating and using the views. Appendix B4 is the step-by-step process for
mstalling and using the reports. The instmctions are written to be flexible and to provide
enough information that can be modified for other collections. Appendix B3 is Appendix
C fi-om the MoTTU manual and includes and it is a troubleshooting section and includes
additional help fi-om Appendix B fi-om the MoTTU manual.
137

CHAPTER V
PHASE IV: DESIGNING VIEWS AND REPORTS
Nine views/reports will be created for DEP (Table 5.1). A view "is a virtual table
that comprises the fields of one or more tables in the database; it also can include fields
firom other views. ... [A] View ... does not store or contain data-it draws its data from the
tables or Views upon which it is based. [It] does not store data, only its structure is saved
in the database" (Hernandez, 1999; 159). "A report is any hand-written, typed, or
computer-generated document used to arrange and present data in such a way that it is
meaningfiil to the person or people reporting it" (Hernandez, 1999; 105). For the purpose
of this project, the term 'Sdew" refers to fimctions that are to be used on screen only and
"report" refers to fimctions that are designed to be printed. Additional terms for this
section are "database" and "file". A database is a collection of related data stored in a file.
The relation can be all catalog cards, information requests, or other similarly related
topics. A file is the form in which data may be taken from one database to another.
Some ofthe views/reports mentioned help the system operator and the collection
manager to identify problems in the collection. Some will help the bar code system work
more efficiently. Finally, other reports must be created to prepare the collection for Phase
V ofthe project: Printing. Each view/report has a different combination of fields,
depending on its purpose. The step-by-step process of designing and creating views and
reports is found in Appendix B. The step-by-step process for creating a report allows the
system operator to gain a greater understanding of reports and their uses. Once the
138

system operator is comfortable with the view/report-making process, existing
views/reports can be altered to suit the division's needs and additional reports can be
created.
Table 5.1. Nine Views or Reports Used in the Database Enhancement Project.
VIEW OR REPORT
Data Entry View
Single Find View
Multiple Find View
Proofreading Report
Information Label(s) Report
Multiple Print Report
Classification Report
Work Report
Inventory and Loan Report
USE
Used to enter information into the database.
Allows the bar code reader to scan one record at a time.
Allows the bar code reader to scan numerous random records.
Can be printed to take to the collection to verify infwmation before prmting. The view for the catalog cards, accession cards, and specimen information labels.
Allows the database to print multiple copies ofthe same record.
Can be printed to sort and view information in groups for proofreading and research. Works in combination with Scan Find view. Can be printed to identify and solve collection management problems.
Identifies missing objects in a loan or comprehensive inventory.
How to Use FileMaker Pro® for the DEP
Before creating a report, its purpose first must be defined; a 'rough draft' ofthe
report should be created on paper. The draft must include what fields are needed from the
database, how it is to be designed (layout), and how it will be used. Fields are chosen for
their appropriateness to the report subject. Too many fields may cause confiision and
make the report hard to use. For specific instmctions on how to design a view, see
Appendix B.
139

As mentioned in Chapter IV, FileMaker Pro® uses four modes. The Browse
Mode for editing and viewing records. Layout Mode, Find Mode, and Preview Mode.
Each mode serves a different purpose in FileMaker Pro®. The layout mode is used to
design views and reports. Different types of layouts are available to create reports such as
standard, columnar, extended columnar, single page form, labels, envelope, and blank.
Each type of layout is designed for a specific task. FileMaker Pro® automatically adds all
ofthe fields in the database for the standard layout option. The columnar report option
gives more control than the standard layout option, allows the user to specifically choose
which fields to be included, and creates a simple columnar design to the layout. An
extended columnar is the same as columnar, and it justifies the design for 8 Vz" x 14"
paper automatically. The single page form option is the same as a standard layout option,
except the header and footer is omitted automatically. After FileMaker Pro® has
generated the type of layout to be created, the user clicks and drags the fields into a usable
format. The Find Mode is used to locate records, either one at a time or a multiple set of
records. After records are found, the user can retum to the browse mode and edit the
information. The Preview mode works similar to print preview. This mode shows how
the report will look when it is printed. Additionally, any report that requires calculations
or grouping (i.e.. Classification Report) only can be seen in the Preview Mode.
The last element of FileMaker Pro® used in the DEP is a script. A script in
FileMaker Pro® creates a shortcut for longer processes or is used to override certain
limitations in the program. After it has been written, a script may be obtained, through the
Script Menu or by creating a Script Button (FileMaker Pro®).
140

Problems Discovered with Using FileMaker Pro® for the DEP
Except for the Natural Science Research Laboratory, every division at the
Museum of Texas Tech University uses FileMaker Pro® as its DBMS. Several problems
exist when trying to incorporate the bar code system with FileMaker Pro®. The problems
include kerning, the multiple find fimction, and the inability to perform validations when
the auto-enter feature is activated.
Kerning refers to the space between letters. The first problem in FileMaker Pro®
is that it automatically justifies the kerning in non-bitmap bar codes to be the same,
resulting in unreadable bar codes as seen in Figure 5.1. Only bar codes inqxtrted as a
bitmap (images) are readable in FileMaker Pro®. Code 39 can be used with FileMaker
Pro®, and, just recently. Code 128 became available in bitmap.
llllllllllll! nil 11II1 iiiiiiiiiiiiiii
Figure 5.1. FileMaker Pro® Has Difficulty With Kerning Bar Codes.
Source: Excerpted from FUeMaker Pro® 4.1.v3. 1984-1999.
The second problem in FileMaker Pro® is its inability to find a random set of
records with a retum character (FileMaker Pro®, 2000, pers comm.). This feature is one
ofthe three minimum requirements (as previously mentioned) that the DBMS must be able
141

to perform to use the bar code systeiiL A bar code reader ends its read with a retum
character. FileMaker Pro® translates the retum character as an end of a fimction. A
script must be written to make the retum character from the bar code reader as part ofthe
script, and not the end ofthe fimction (see Multiple Find view in Appendix B2). Some
readers can be programmed to omit the retum character from the scan, but a different
script must be written to teU the computer that the scan is completed.
FileMaker Pro® also has a problem in that it does not check for any validation
rules when datum is auto-entered (FileMaker Pro®, pers. comm. 2000) and the division
ordinal cannot be prevented from 'rolling-over'. For example. Table 4.2 shows that the
Ethnology Division's Division ordinal is '4'. When this division reaches 499999 records
and it is allowed to continue to record number 500000 the division ordinal has now
changed from a'4'to a'5'. This process cannot automatically be stopped. Each division
at MoTTU must become aware of this problem and report to the database enhancement
committee before this occurs. The database committee will keep track ofthe number of
records each division has on a yearly basis.
Because ofthe unique validation ofthe serial number FileMaker Pro® cannot
print multiple copies ofthe same record without exporting the records to another
database. Several scripts are written to aid in this process (Appendk B).
The rest of this chapter is devoted to describing the various uses and nature ofthe
nine views and reports in the sections following. The specific installation instmctions are
found in Appendix B.
142

Data Entrv View
The Data Entry View is the view where the data from the collection is entered.
This view needs to be made so data can be entered easily. This view needs to be updated
to reflect the fields that have been modified, or created in Phase n (Figure 5.2). If a field
does not belong on the View, it must be deleted. Deleting a field in a view will not delete
the information associated with it. Refer to the FileMaker Pro® manual for tips on
designing the layout.
Single Find View
The Single Find View is written to enhance the performance ofthe bar code
system. This script allows the user to find only a single record at a time. This view is
installed in the Data Entry View. This view finds one record at a time by clicking a button
and then scanning the bar code.
This view is created by designing a script to find a record through the serial
number field on the Data Entry View. A script button is created and added to the Data
Entry View. The 'Find' button on Figure 5.2b on the Data Entry View is the button used
to run the Single Find Script for the Paleontology Division's database. Appendix B3 lists
the instmctions for designing the script for the Scan Find View.
143

(a) Old Paleontology Data Entry View.
utrnxf
(b) Updated Paleontology Data Entry View.
O M t K i a:oo
rnnvwOmtot '
ririit
Sww
Claa OltK P a t ^ OtIJM
Hmt
P n M
Bpxii AM
O t k n u
D l * U a t f y
00017
S w
Oo«n7
COLLECTIONS
Re(*Dl.llk
THECOOOffTU POCOSAURDM
POSTOSUCWJS
Kin<p*Tnic«i SKULL AXO KOSTCRAMUl.
TRtASSiC LATE TRAS SIC MfSOZOC
S CKATTf «UEe U PAOTr
1910 IS K i S T O U M R r . M L l E R RANCH OAR7A
TEXAS USA
DOCKIAt
fcaaniu OOOPEfl CJkMYOJ
Hinl . i
>:iloloj:y
A A V J A I I
LocnoA
ClKl<d'
um
Inwi
T>f.
RmiMkf
;^..^«r<l-. FTiTHl i : i f t l j
I l » 8 M 9
Of FICE C*ta*< D Cmwi 8
Of" OlM NrvT^On9lr»> O Y n
^ ^ ^ ^ ^ ^ • H 1H la ^•H MOLOTtPt
MOLOTtPt, CMATTtnjtE. S 19K POSTOSyCMWS.AJCW THECODOfirUMREPDLE FnOMTHETIitASSICOr TEXAS AHD TVC OAKVN Ot TrnAHNOSAUftS PMlOSOPMICAl TRANS ACTONS OF T>« ROTAl SOCIETTOf lOMDOH B3o» m-ita
Figure 5.2. Data Entry View in the Paleontology Division at MoTTU. The Data Entry View must be updated to reflect the changes in Phase II. The additional fields added during Phase II (e.g., 'Status) are placed into the new design to increase the efficiency of data entry.
Source: Screen Capture. FUeMaker Pro® 4.1.v3. 1984-1999.
144

Multiple Find View
This view is required for finding multiple records at random (Figure 5.3).
FileMaker Pro® does not have the capability to allow the bar code reader to scan several
bar codes. A bar code reader ends its scan with a retum character. FileMaker Pro®
interprets the retum character as an instmction to find and not to continue entering
numbers. (Note: some readers can be programmed to omit the retum character from the
scan, but a script must be written to tell the computer that the scan is completed.) This
view is necessary, therefore, to allow more than one bar code to be scanned at one time.
In addition to finding multiple records with the bar code, this view also can be used to
find multiple records with any field in the collection's database, such as the catalog
number just by typing the information in the field(s) on the keyboard and pressing retum
each time.
The Multiple Find View is created in a separate layout, unlike the Scan Find View.
To override the problems ofthe retum character the Multiple Find View is created by
designing three script buttons (see Figure 5.3): (1) Start Find, (2) Perform Find, and (3)
Stop Find. The script for the first two buttons must be programmed in the database using
ScriptMaker—. The last button is created similar to the Scan Find View's script button.
Appendix B3 lists the specific instmctions for installing the Multiple Find View.
The figure below (5.3) shows an example of what the Multiple Find View looks like when
it is being used. The bar code field is to the left ofthe catalog number, but it is not visible
on this script because it is hidden to prevent confiision for the user. The Multiple Find
View works by first clicking on the Start Find Button ('Click here to start'). The bar
145

codes then are scarmed, or data for other records (e.g., catalog nimiber) are entered
followed by the retum key. Then the Perform Find Button ('Click here to perform the
find') is clicked to find the records. Finally, the Stop Find Button is clicked to teU the
database that the task has been completed. After all ofthe records are foimd, the user
changes to another layout to continue working.
• ^Cftek iMrt t * stwtr)
i CItefc M n viMii f M f l i * 4 j
Cat i Genus 134
«35 ASTROMIPPUS
I3« AST«OMIPPUS
I3f ASTROMIPPUS 141
142
144 ASTAOMIPPUS
146 ASTROMIPPUS
140 ASTAOHIPPUS
147 ASTROMIPPUS
140 ASTROMIPPUS
MULTIPLE SCANNING LAYOUT
8»C04C3
340 MESOMIPPUS
342 MYRACODON 343
34« ASTROMIPPUS
348 POCBROTMERIUM
347 MESOMIPPUS 340
3SI MESOMIPPUS
35' PSEOBOCYNODIOTU
301 ASTROMIPPUS
302 ASTROMIPPUS
Figure 5.3. Multiple Find View. This view is only used for finding multiple records at random.
Source: Screen Capture. FileMaker Pro® 4.1.v3. 1984-1999.
Proofreading Report
The Proofreading Report will help to identify errors in the database. This
report should be created and used before information tags are printed. A printed
information tag does not contain all ofthe information about the object and,
therefore, should not be used to proofread the database. Data are printed using
the Proofreading Report and are compared with the collection. Additionally, this
146

report helps to identify information that might be helpfiil in printing the tags (such
as number of specimens, additional location ofthe specimen, multiple parts, etc.).
Figure 5.4 illustrates several common problems that the proofreading report can
help to identify.
TO I M I 41 »
• l l l i l l l l l l
<U IM I «1 I H
• i t m i i i i i
13« 1MV41-IM r "
D i i i i m i i ^
117 iMi-4Mar
i i r i l lHI I I I
1*1 1M1-4M4I
V l l 11 III III
14J 1H14M4i
• l l l l l l l l l l l l
144 1M1-4I 144
»s™c»**^js
PR
PI
Can this field be completed? |
ASTROHPPUB
>
t
f SM
T
A'j1»OHPPlIE. 1-^
i 11 I'll III 1 t i | ^ 1 When scanned, does the correct record appear?
OOFREADING REPORT
HMmcrcouNTv. TEXM rauow
HIWTIIYCOUWTY. 1EWS P*lEO UC
H<mi£TO(XWTY TEXM nUEO UC
: " 1 HA»m£Y, TEOU. U»A : PHltOSJC MAXTlEYCOUHTr ItXAS •
HARTIIVOOUNTY TEXAS PIUEOSIC
HARUfvOOUNTV TEXAS PALEO StO
HAmuToovWTy. TEXAJ PALEO S I C
Is the infoimaticn entered correctly? |
i AODinoNAieoicsPcx*o IN PALEO CAMCTs DMAvaenc j
t H o w many tags are needed?
t«a>«.ru)«TAaLf
Figure 5.4. The Proofreading Report.
Source: Screen Capture. FileMaker Pro® 4.1.v3. 1984-1999.
Information Label Report
The DEP includes printing information labels directly from the database. These
labels include specimen labels, catalog cards, and other information labels (Figure 5.4).
Printing the labels directly from the database decreases time and energy spent handwriting
numerous information labels required to process a collection. Additionally, printing the
labels from the database eliminates human transcription errors.
147

Specimen/object labels are created the same way as all other reports. Care must be
given to the type of paper and ink used (Williams and Monk, 1999) and how the labels will
be attached to the specimens. Labels are attached to a specimen or object according to
current collection management policies as discussed in Chapter VI. Labels can be printed
front and back and can be redesigned to print catalog cards, accession cards, and other
formats as needed. If the information label is printed front and back, then the catalog
number needs to be on both sides to allow users to verify that the information on both
sides refers to the same object.
An information label is created the same way as the proofreading report. The
mailing label option is selected and the report is designed to optimize the use of paper. An
example Information Label report is provided for the Paleontology Tag (Figure 5.5 and in
Appendix B4.
M VERT
CAT. NO# NAME
MORPH.
LOCAUTY
FORMATION
COLLECTOR
IIIlilH ill'll
USEUM OF TEXAS TECH UNIVERSITY EBRATE PALEONTOLOGY COLLECTION
7Q05 ACCNO.« 974-60
NYCTITHERIUM N
T-V-R-P4
SEROTINUM
POWDER WASH UTAH IJRA
QHATTERJEE
mil IIII
PERIOD
DATE LOCATION PALEO
Figure 5.5. Information Label.
Source: Screen Capture. FileMaker Pro® 4.1.v3. 1984-1999.
148

Multiple Printing ofthe Same Record Report
Some objects may be large or have multiple parts and require more than one label
A concem is that the archival paper for the information labels is expensive so every effort
should be made not to print unnecessary labels and to maximize the number of labels
printed on a page. Not every collection's database is designed to allow multiple copies of
the same record to be printed. The problem is that there may be a different number of
labels required for each specimen. The simplest way to address this issue would be to
create duplicate records within the database. The diflSculty with this is that the database
(if designed correctly) will not allow multiple records containing the same (unique) bar
code or serial number. If the collection's database does allow the entry of multiple
records with the same catalog number, it needs to be changed to ensure accuracy ofthe
bar code system by enforcing the uniqueness ofthe bar code number.
Two methods are available to print multiple copies ofthe same record. The first is to print
multiple copies (Le., print all that need two copies twice, then those that need three copies
three times, etc.). The second is to export the records to another database that does not
have the uniqueness requirement. A separate database, specifically designed for multiple
printing, can be used by duplicating each record so the correct number of labels will be
produced. Exporting the records to another database does not delete or change records in
the main collection's database. However, special consideration must be given to ensure
that the bar code numbers remain the same for each record for both databases and that the
records (in the temporary database) are deleted after printing to avoid confiision. Under
149

no circumstances should the records in this ten^rary database be edited, as the main
database will not have been changed and changes will be lost.
To maintain the uniqueness ofthe bar code number, the Multiple Print View is
created as another layout in a database that does not have the uniqueness requirement and
is separate from the collection's database. Exporting the records to this database does not
delete or change records in the main collection's database. However, special consideration
must be given to ensure that the bar code numbers remain the same for each record for
both databases and that the records (in the 'temporary' database) are deleted to avoid
confiision after the labels have been printed.
The Multiple Print Report is used by importing a found set of records from the
collection's database to another database used specifically for allowing the catalog number
to be duplicated. Each record then is individually duplicated. Finally, the report is printed
in the Preview Mode. This report must be created after all ofthe Information Card
Reports are created, because the new database is created as a copy ofthe collection's
database and then modified. Care is required when installing this system to ensure that the
resulting 'information labels' have the same catalog number, serial number, and bar code
number as the collection's database.
Appendix B4 lists the instmctions for installing the Multiple Print Report. Four
scripts and script buttons will be installed to use this report. The script Multiple Print will
be installed in the main collection's database and is used to find the record(s) needing to be
duplicated and opens the database that has the Multiple Print Report. The scripts Import'
and T)uplicate' (Figure 5.6) will be installed in a Multiple Print database and then script
150
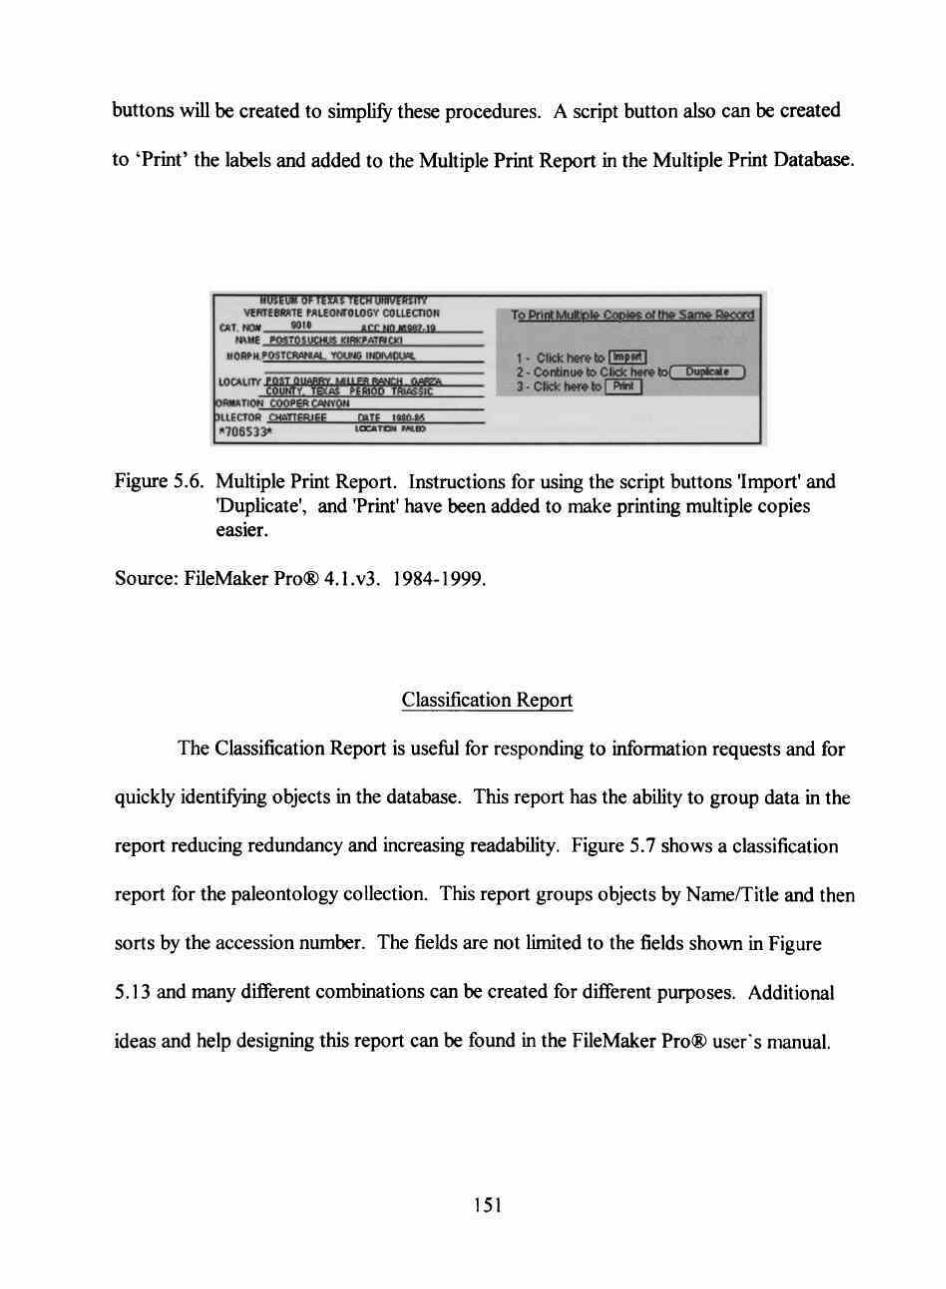
buttons will be created to simplify these procedures. A script button also can be created
to 'Print' the labels and added to the Multiple Print Report in the Multiple Print Database.
mmwwrn^rrrcfnjmmm— VERTEBWTE PALEOfffOLOOY COLLECTION
CAT NO* « ! • trrMnMOftMO WME POSTOSUCHUS KIWiPATBICKI
UOftt>aPOSTCRflMAl. YOUMO IHDMOIW. L0CALnY4flSU
COUrffY. Te<AS PERIOD TftlASSiC OfiMftTION 00OP£SC^Y0M
*706533* laCATIXl PALDO
To Print Multiple Copies of the Sam^ Record
1- Clickher&tojfcwpmi 2 • Continue to Click here tot Dupfcate ) 3 - Click here to | Print |
Figure 5.6. Multiple Print Report. Instmctions for using the script buttons 'Import' and 'Duplicate', and 'Print' have been added to make printing multiple copies easier.
Source: FileMaker Pro® 4.1.v3. 1984-1999.
Classification Report
The Classification Report is usefiil for responding to information requests and for
quickly identifying objects in the database. This report has the ability to group data in the
report reducing redundancy and increasing readability. Figure 5.7 shows a classification
report for the paleontology collection. This report groups objects by Name/Title and then
sorts by the accession number. The fields are not limited to the fields shown in Figure
5.13 and many different combinations can be created for different purposes. Additional
ideas and help designing this report can be found in the FileMaker Pro® user's manual.
151

Amaramis
Amphechinus
Amphicyon
Antphiiemur
Anacodon
O.ASSIFICATION REPORT
Gregoryi
Horndoudi
Horndoudi
Eocaenicus
Eocaenicus
Urisdeas
CAT#
1200
5008
5012
4881
1256
1259
1536
AOC#
19^2-227
1974-98
1974-98
1973-242
1972-227
1972-227
Figure 5.7. Classification Report from the Paleontology Division at MoTTU. This report is grouped by genus and sorted by species.
Source: Screen Capture. FileMaker Pro® 4.1.v3. 1984-1999.
Work Report
The Work Report is used to help with identifying and tracking particular problems
(e.g., deterioration, requires consolidation, etc.) in a collection. The bar codes on the
labels are scanned (using the Multiple Find View) for those objects where the particular
problem is present. The Work Report then is used to create a list ofthe items needing that
particular type of attention. The list then is printed as a report and/or can be saved in the
database. Figure 5.8 shows a work report used to identify objects that require
stabilization. The list was created by scanning the bar code labels of objects that need to
be stabilized. The list was then saved in FileMaker Pro® and a report was created. A
check box was added to each line ofthe report. The box is checked to indicate that the
152
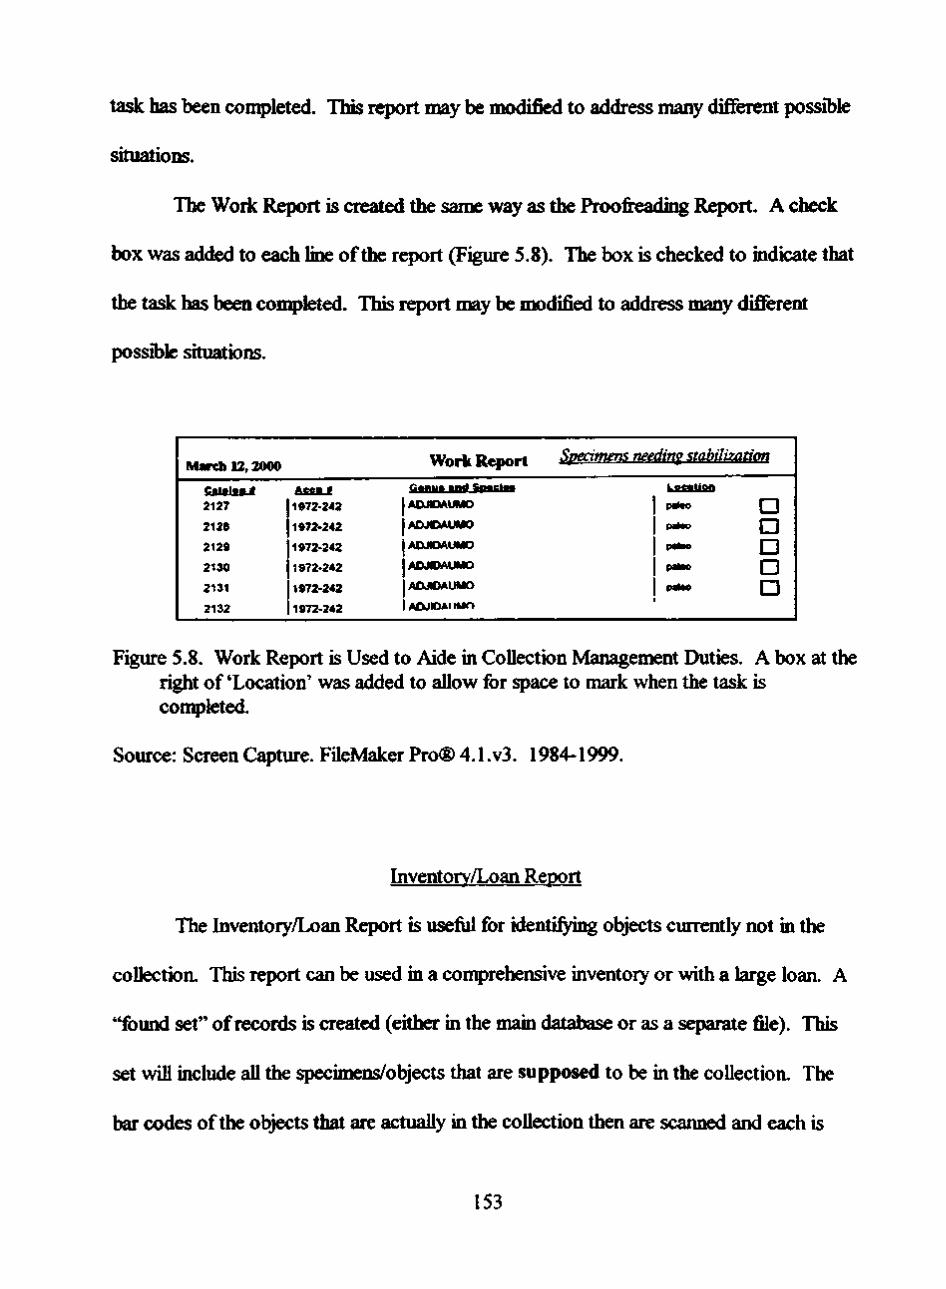
task has been completed. This report may be modified to address many different possible
situations.
The Work Report is created the same way as the Proofreading Report. A check
box was added to each line ofthe report (Figure 5.8). The box is checked to indicate that
the task has been completed. This report may be modified to address many different
possible situations.
March 12,2000
Cl1«l91l t 2127
2128
2129
2130
2131
2132
Aecn »
1972-242
1972-242
1972-242
1972-242
1972-242
1972-242
Work Report
Ganu« and SD*ci«i
1 ADJIDAUMO
iADJDAUMO
1 ADJIDAUMO
1 ADJIDAUMO
1 ADJIDAUMO
1 AOJIOAI n*'^
Specimens needing stabilization
l,ocation
1 paieo • 1 Pateo • 1 paleo • 1 P«toc •
1 P«^ • 1
Figure 5.8. Work Report is Used to Aide in Collection Management Duties. A box at the right of 'Location' was added to allow for space to mark when the task is completed.
Source: Screen Capture. FileMaker Pro® 4.1.v3. 1984-1999.
Inventory/Loan Report
The Inventory/Loan Report is usefiil for identifying objects currently not in the
collection. This report can be used in a comprehensive inventory or with a large loan. A
"found set" of records is created (either in the main database or as a separate file). This
set will include all the specimens/objects that are supposed to be in the collection. The
bar codes ofthe objects that are actually in the collection then are scanned and each is
153

omitted from the "found set". Once the scanning process is conq)lete, only those objects
not found will remain in the "found set" and a report of these missing objects can be
printed. This process makes inventory control simpler and allows effort to be
concentrated on finding the missing object(s).
The Inventoiy and Loan Report also is usefiil for other reports (from above),
especially when a larger report is created or when multiple reports are required from the
same set of records. A Multiple Find is performed to locate a set of records. If time
prevents continuing, the records are saved as a list and the list is reopened to finish
locating the records. When all ofthe records are located, a report is created the same way
as the work report.
Three different versions ofthe Inventory/Loan Report can be used, depending on
the collection's needs. Appendix B4 lists the specific instmctions for using each of these
methods. The first method is for comprehensive inventories for an entire database and is
completed in one sitting. As mentioned above, the objects are scanned by using the
Multiple Find view and each is omitted from the "found set" at the completion ofthe
inventory. The second method is used for comprehensive inventories for an entire
database that are completed over a period. This method works similar to the first method.
Instead of omitting the records, however, the found set is exported to a blank copy ofthe
collection's database to create a tenqx)rary inventory database. To continue the inventory
on another day, the user returns to the main collection's database and continues scanning
the objects. The found set of records then are added to the records found previously by
exporting them to the same database created the day earlier. This process continues
154
(adding additional found records to the teiiqwrary inventory database) until all ofthe
objects are scanned. To find objects the 'missing' objects, the entire collection's database
is iniported to the tenqxjrary inventory database. A search then is performed on the serial
number field to locate duplicate entries in the ten:qx)rary inventory database. The process
is completed the same as the first method from above and the found set of records are
omitted. The records not omitted represent objects in the database that were not scanned,
because they only appear once in the temporary collection's database. The final method is
used for loans or partial inventories. The objects to be loaned or to be inventoried are
found in the main collection's database by using the Multiple Find View. The found sets
of records are exported to a temporary inventory/loan database. To conplete the partial
inventory or identify what objects were not retumed from a loan, the objects are scanned
using Multiple Find View, in the temporary inventory/loan database, and the found set of
records are 'omitted'. It is not recommended that these temporary databases be saved on
the hard drive after its use is completed. It is desirable to print the report and then discard
the temporary database when the inventory or loan is conqjleted.
155

APPENDIX B
SPECIFIC INSTALLATION INSTRUCTIONS
This section is devoted to the actual installation and usage ofthe DEP. First,
directions are provided for how to identify the fields in the database (APPENDIX Bl).
Then, instmctions are given for installing the bar code (APPENDX B2) and instmctions
are given for creating and using the reports (APPENDIX B3-B4), as outlined in Chapter
IV.
The instmctions include normal text, bold, bold and italicized, and highlighted
words. Words in bold refer to steps in the script that require clicking with the mouse. If
something is bold, Italicized and in Arial font, it means that the user will type the
required information. Finally, highlighted text refers to special instmctions or concerns
that are not mentioned in the directions for how to create a general report and are more
specific to the particular report.
156

APPENDDC Bl
IDENTIFYING FIELDS IN FILEMAKER PRO®
Fields and their business rules can be identified easily in FileMaker Pro®. All of
the fields in the database are first listed and their purpose deciphered to create the
database model The following instmctions are used to identify the fields and the business
rules currently applied to them and to find data discrepancies in each field as described in
Chapter III.
Instmctions for Identifying the Fields in FileMaker Pro®.
Identifyiiifi the Fields
1. Go to the Browse Mode.
n. Click on File and dioose Define. A. Choose Fields. B. Create a chart and write down for each field, the inf<Mination seen on the
screen, including: Field Name, Type, and Options. C. Click on Done.
Identify Discrepancies in a Field
ni. Go to the Browse Mode.
IV. Click on a field to be indexed.
V. Choose Paste Special torn the Edit menu.
VI. Click on Insert fi-CMn the Index.
VII. Unclick Show Individual Words.
157

APPENDDC B2
CREATING THE BAR CODE
To install the bar code system into a FileMaker Pro® database, several steps must
be undertakeiL Appendix B2 lists the step-by-step instmctions for installing the Serial
Number field and the bar code field. The serial number will be used as the bar code
number as described in Chapter IV, and must be created befijre the bar code fieki. The
Serial Number includes the Division Ordinal and the Database Record Number (Figure
4.1). Use the Division Ordinal assigned by the Database Enhancement Committee to
create the Serial Number (discussed in Chapter IV). The bar code instmctions are
designed for code 39. To use code 128, create the serial number as instmcted and then
follow the manufacturer's instmctions.
158
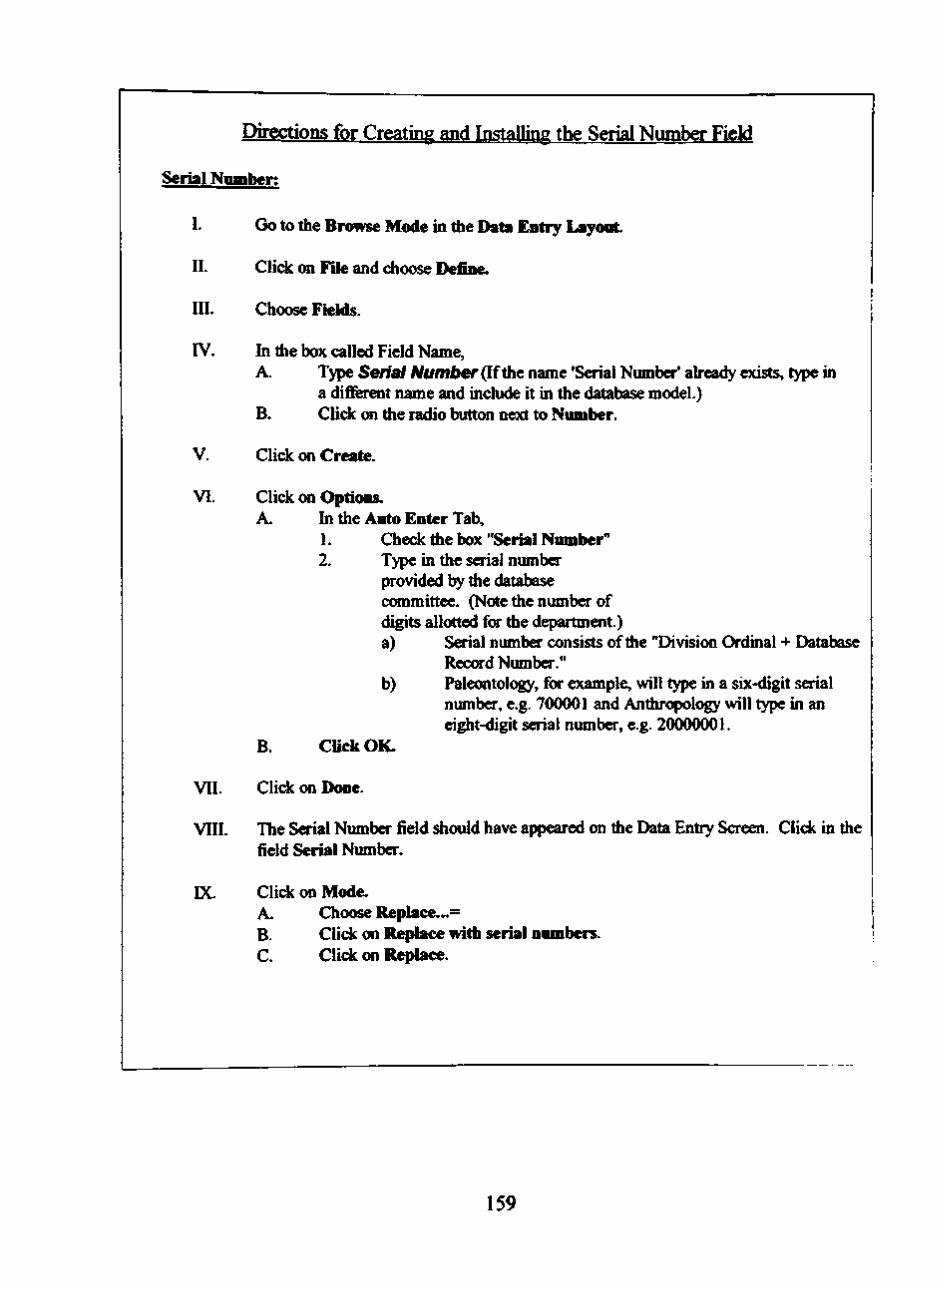
Directions for Creating and Installing the Serial Number Field
Serial Nnmlvr;
I. Go to the Browse Mode in the Data Entry Layout.
II. Click on File and choose Define.
III. Choose Fields.
rV. In the box called Field Name, A. Type Serial Number (If the name 'Serial Number' ah-eady exists, type in
a different name and include it in the database model.) B, Click on the radio button next to Number.
V. Click cm Create.
VI. Click on Options. A. In the Auto Enter Tab,
1. Check the box "Serial Number" 2. Type in the serial number
provided by the database committee. (Note the number of digits allotted for the department.) a) Serial number consists ofthe "Division Ordinal + Database
Record Number." b) Paleontology, for example, will type in a six-digit serial
number, e.g. 700001 and Anthropology will type in an eight-digit serial number, e.g. 20000001.
B. CUck OK.
VII. Click on Done.
VIII. The Serial Number field should have appeared on the Data Entry Screen. Click in the field Serial Nimiber.
EX. Click on Mode. A. Choose Replace...= B. Click (HI Replace with serial numbers. C. Click (XI Replace.
159
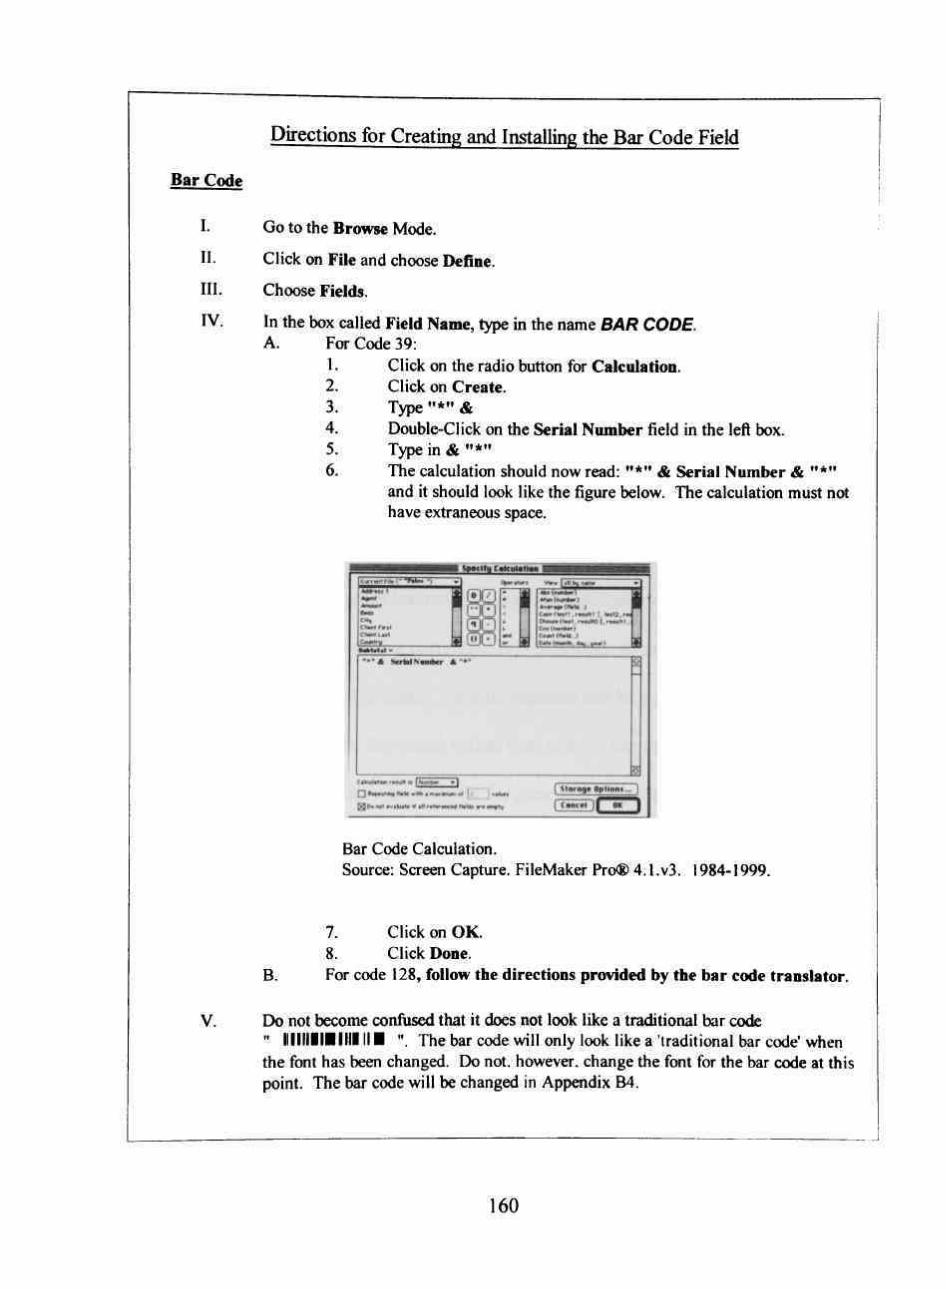
Directions for Creating and Installing the Bar Code Field
Bar Code
I. Go to the Browse Mode.
II. Click on File and choose Define.
III. Choose Fields.
IV. In the box called Field Name, type in the name BAR CODE. A. For Code 39:
1. Click on the radio button for Calculation. 2. Click on Create. 3. Type "*" & 4. Double-Click on the Serial Number field in the left box. 5. Type in & "*" 6. The calculation should now read: "*" & Serial Number & "*"
and it should look like the figure below. The calculation must not have extraneous space.
tp»CII|| C«4tllf H— I
1>.k.
B.41 Crtv
Cli.nl LMt
• ^ 4 . « . l -
I CM*<»Mtl .r»MHI (. *Mt2.r«i I
" A ScrtelN
^ [>. not . . .hMt. f .n r.t.r.nt.4 ft.td« . r . M..*v
[ iiuraft Bptiom .T7~)
[ C—ttl II OK
Bar Ccxie Calculation. Source: Screen Capture. FileMaker Pro® 4.1.v3. 1984-1999.
B.
7. Click on OK. 8. Click Done. For c(xle 128, follow the directions provided by the bar code translator.
Do not become confiised that it does not look like a traditional bar ccxle " llllllllllill II • ". The bar code will only look like a 'traditional bar code' when the font has been changed. Do not, however, change the font for the bar code at this point. The bar code will be changed in Appendix B4.
160
APPENDDC B3
INSTALLING THE VIEWS
To fiilly utilize the data within a database, it is necessary to establish different
views. TTie views are created for search purposes and generally are not used for printing.
This section includes the step-by-step instmctions for creating a basic view, installing the
Single Find view and the Multiple Find view. These views are used to maximize the
usefidness ofthe database and others will be created to assist the bar code system,
specifically the Multiple Find View, as discussed in Chapter V. The Single Find view is
installed as a part ofthe Data Entry view. For each view, the instmctions explain how to
install the script, create a script button(s) to maximize efficiency, and how to test the
views to ensure they are working correctly. It is important to note that these views are
not limited to use with the bar code. Various searches can be performed and the
information is typed, via the keyboard, rather than using a bar code reader. These views
are used in combination with Appendix B4 for generating reports and information labels.
161

Directions for Creating a Basic View
I. Decide on the purpose ofthe View.
II. Click on Mode and ch(x>se Layout
III. Click on Mode and chcx)se New Layout
rV. Choose the type of layout to be created. The layout options Standard, C<rfnmnar Report, Extended Columnar Report, Single Page Form, Labels, Envelope, and Blank will be offered. Select the Layout type that best suits the purpose ofthe View. FcM- more information about eacdi Layout type, refer to the FileMaker Pro® manual.
V. Click OK.
VI. Design the layout by clicking and dragging the fields into a usable format. Delete any extraneous fields or add those not found on the Layout.
vn. Change between Layout Mode and Preview Mode to see how the View will look in a printed RepcMt.
162

Directions for Creating and Testing the Single Find View
Creating the Single Find Rf Hpf
I.
11.
III.
IV.
V.
Click on Script Menu and choose Script Maker "'.
Type Single Find in the Script Name Box.
Click Create.
Click Clear All.
Create the script by double-clicking on the fields in the left-hand box and choosing, in this order, the following, so that they appear in the right-hand box. A. Enter Browse Mode B. Go to Layout
1. In the Specify box. Click on Data Entry. C. Enter Find Mode
1. In the Options box, unclick Store Find Request. 2. Click on Pause.
D. Goto Field 1. In the specify field, double click and choose Serial Number.
E. The Script Definition should look like the Figure below.
tcrt»>Pi>»<tl«iihr»tliiil»n«»«-
H I k . fit.H I M .
I M L M . *no* Ul . . M v l fi.tl/.«r Cwlir.
Oo«oL*«Mt
O. *• t .ut.4 »MWt 0 . . . P.rt.1 n»w c o r M W
Oa .a^ . .w0 f. ld Ct . . t ro . f .M .4 .
I UMrk-r.onMtll
t [>»««>»W|-«.rl|»i....i -I
O M T A I I 1 .• Ktovc >. !
! • •
IC
Single Find Script Source: Excerpted fi-om FileMaker Pro®.
VI. Click on OK.
A. If later this script is edited then a box will appear with Radio buttons. B. Click on the radio button next to Replace to change to the setting that was
just created.
VII. Click on Done.
163

Instmctions for Installing the Single Find View (cont.)
Creating a Script Button
I. Open the Data Entry View.
II. Select Layout Mode.
III. From the Tool Box, click on the Button Tool LizJ. A. Click anywhere on the Data Entry Layout and draw a small box. B. The "Specify Button" box will appear. Choose Perform Script.
1. In the Options Box specify Single Find. 2. Alternatively, specifying a different script in the Options Box wil
create a button for wiiatever script is selected. C. Click OK. D. Type in FIND. E. A button labeled FIND will now appear on the Data Entry View Layout.
Testing the Single Find View
I. Go to the Browse Mode ofthe Data Entry Layout
II. Click on the FIND button just created.
III. Scan, type in a serial number, or click in any other field to enter a find request.
IV. Click OK.
164
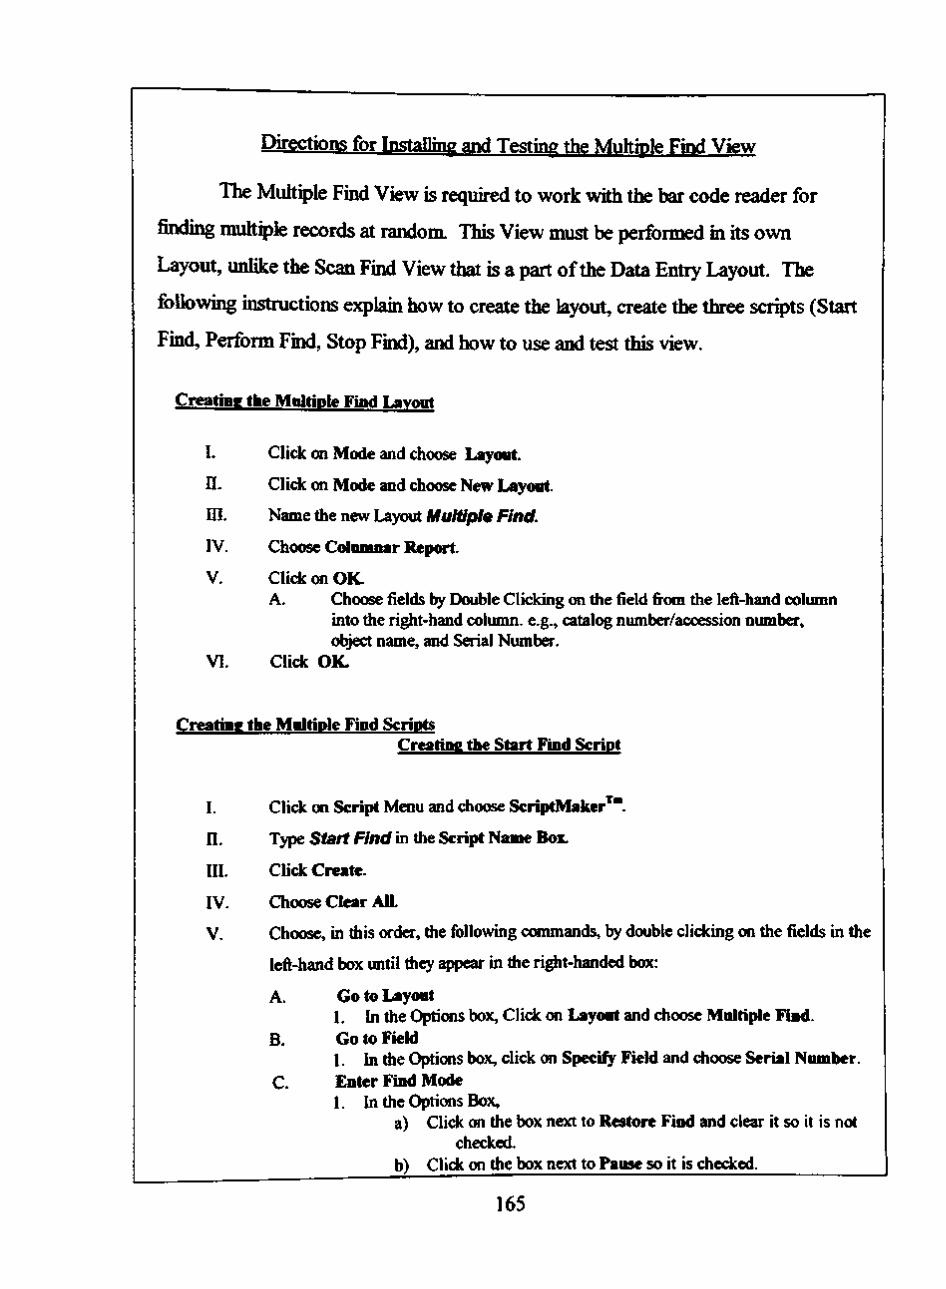
Directions for Installinp and Testing the Multiple Find View
The Muftiple Find View is required to work with the bar code reader for
finding multiple records at random. This View must be performed in its own
Layout, unlike the Scan Find View that is a part ofthe Data Entry Layout. The
following instmctions explain how to create the layout, create the three scripts (Start
Find, Perform Find, Stop Find), and how to use and test this view.
Creating the Multiple Find Lavont
I. Click on Mode and choose Layout.
n. Click on Mode and choose New Layout.
in. Name the new Layout Multiple Find.
IV. Choose Columnar Report.
V. Click on OK. A. Chcx)se fields by Double Clicking on the field fi-CMn the left-hand column
into the right-hand column, e.g., catalog number/accession number, object name, and Serial Number.
VI. Click OK.
Creating the Multiple Find Scripts Creating the Start Find Script
I. Click on Script Menu and choose ScriptMaker^".
n. Type Start Find in the Script Name Box.
III. Click Create.
IV. Choose Clear AIL
V. Chcx)se, in this order, the following ccMimiands, by double clicking on the fields in the
left-hand box until they appear in the right-handed box:
A. Go to Layout 1. In the OpticMis box. Click cm Layout and choose Multiple Find.
B. Go to Fiekl I. In the Options box, click on Specify Field and choose Serial Number.
C. Enter Find Mode I. In the Options Box,
a) Click CHI the box next to Restore Find and clear it so it is not checked
b) Click on the box next to Pause so it is checked.
165

Directions for Installinp and Testing the Multiple Find View cont.
D. Loop. E. New Record/Request F. Pause/Resume Script[ 1
1. In the Opticxis box, make sure nothing is checked. G. End Loop H. Click on OK
VI. Click on Done.
VII. Follow the Directions for Creating and Testing the Single Find View (Steps ll-m on page 163). Label the button Start Find.
Perform Find Script
I. Click on Script Menus and choose ScriptMaker "".
II. Type Perform Find in the script Name Box.
III. Click Create.
rV. Choose Clear AIL
V. Choose, in this order, the following by double clicking on the fields in the left-hand box until they appear in the right-handed box. A. Perform Find[ ]
1. In the Opticms box, make sure Restore Find Requests is not checked.
VI. Click on OK-
Vn. Click on Done.
Vni. Follow the Directions for Instructions for Installing the Single Find View (Steps II-III on page 163). Label the button Start Find.
Creating the Stop Find Script
I. Open the Multiple Find View.
II. Follow the Directions for Instructicms for bistalling the Single Find View (Steps Il-III.A on page 163).
in. Choose Cancel
rV. Label the button Stop Find.
166

Directions for Installing and Testing the Multiple Find View cont.
Testing the Multiple Find View
The bar code reader is not necessary to use this layout. The information can be
typed on the keyboard followed by a return, and other fields can be used as the search
field instead ofthe bar code field.
I. Click on the Start Find Button.
II. Scan or type on the kQlx)ard followed by retum a serial number or in another field,
ni. Click on the Perform Find Button wlien finished entering records to be found
rV. Click on Stop Find when finished
167
APPENDDC B4
INSTALLING THE REPORTS
The final set of instmctions are specific exan^les of reports created for the
Paleontology Division using FileMaker Pro® including the proofreading report,
information label report, multiple print report, classification report, and inventory and loan
report. The work report is created the same way as the proofreading report, and,
therefore, step-by-step instmctions are not provided. Although each report generally is
created the same way, some specific differences and/or special concerns make it helpfiil to
have these instmctions.
168
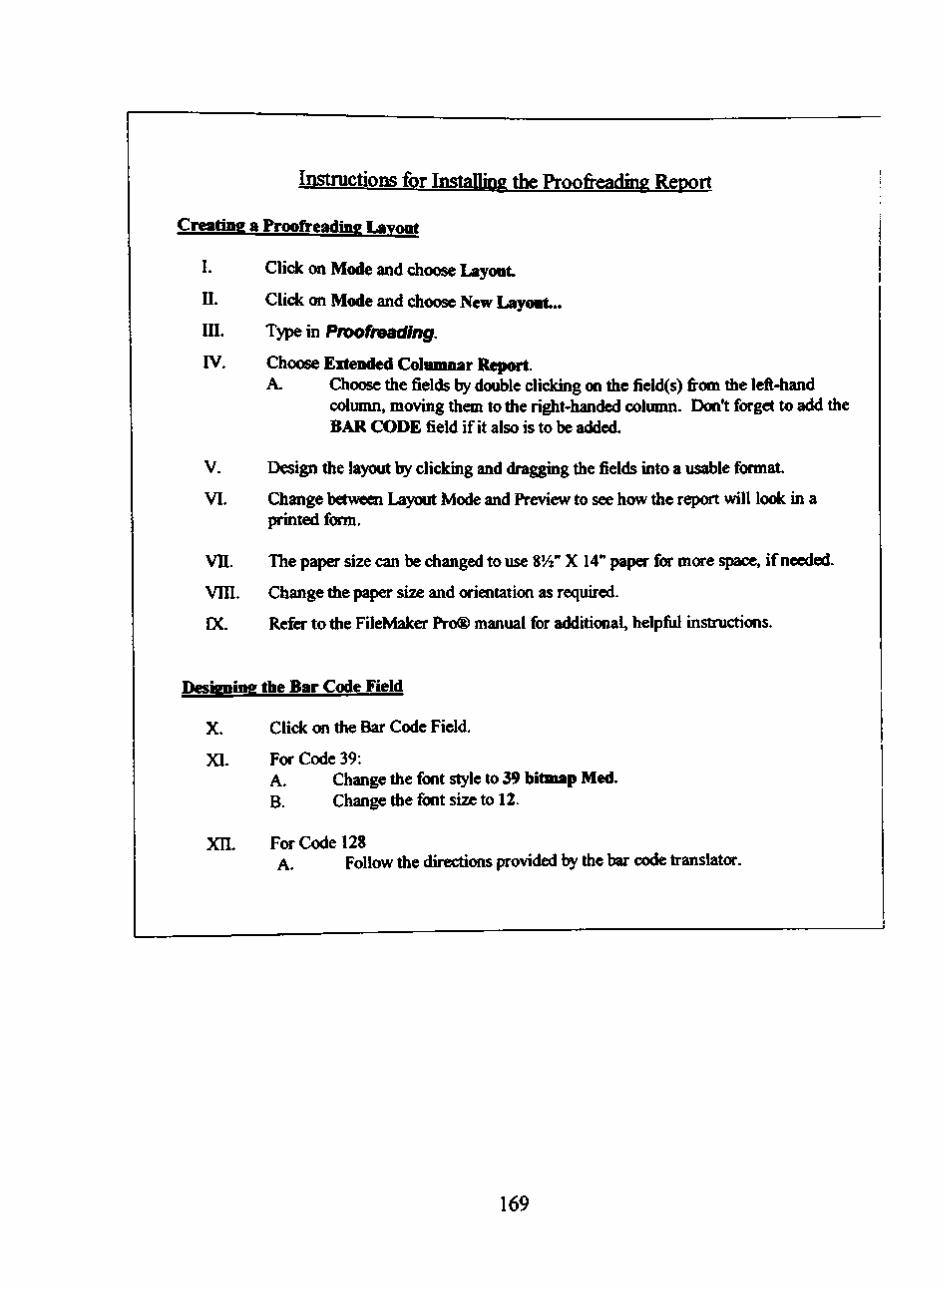
Instmctions for Installing the Proofreading Report
Creating a Proofreading Layout
I. Click on Mode and choose Layout
II. Click on Mode and chcx)se New Layout..
III. Type in Proofreading.
IV. Choose Extended Columnar Report. A. Chcx)se the fields by double clicking on the field(s) fi"om the left-hand
colimin, moving them to the right-handed column. Don't forget to add the BAR CODE field if it also is to be added.
V. Design the layout by clicking and dragging the fields into a usable format.
VI. Change between Layout Mode and Preview to see how the report will look in a printed form.
v n . The paper size can be changed to use 8'/a" X 14" paper for more space, if needed.
Vni. Change the paper size and cM entation as required.
EX. Refer to the FileMaker Pro® manual for additional, helpfiil instructions.
Designing the Bar Code Field
X. Click on the Bar Code Field.
XL For Code 39: A. Change the font style to 39 bitmap Med. B. Change the font size to 12.
Xn. For Code 128 A. Follow the directions provided by the bar ccxie translator.
169

Instmctions for Installing the Information Label Report
Creating an Information Label Layout
I. Follow the directions I-in in the Instructions for Installing the Proofi-eading Report
(page 169) and type in the name ofthe type of label that is being created,
n. Choose Mailing Labels.
UL Measure the size ofthe label needed and type in its measurements.
IV. Ccmtinue following steps V-XII.
V. Finish.
170
Directions for Installing and Testing the Multiple Print Report
This report involves creating another database (multiple print database). This
report is used for one or two records that require multiple copies of different
numbers. Several scripts are required to run this report. The report works by
clicking on a script button in the information label report's layout that would require
more than one copy ofthe same label. The script automatically will open the
multiple print database and help with performing a find for the label(s) that require
more than one copy. In the multiple print database, two script buttons will be added.
The first button will import the records and the second will duplicate them one at a
time. If many labels require multiple copies ofthe same number, it is recommended
that they be printed from the main collection's database as described on page 58 of
this manual.
Creating Multiple Print Database
I. Open the collection's database,
n. Open the FUe Menu and Choose Save As...
IIL In the box Create a copy name: Type <name of the collection's database>
Multiple Print.
IV. Click on Type and Choose Ctone (no records).
V. Click Save.
VI. Open the new Multiple Print database.
vn Open the Layout Mode. A Open the Data Entry layout. R Click on Layout Mode and choose Delete Layout. C. ContLe deleting ALL ofthe Uyouts EXCEPT for the Information Card
Layouts.
171
Directions for Installing and Testing the Multiple Print Report (cont.)
VIII. Delete all autcwnation and validation in the new database.
IX. Click on File and choose Define. A. Choose Serial Number.
1. Uncheck the box Serial Number. a) Make sure this field is clear.
2. In the Validation Table, a) Uncheck the box Unique.
B. Repeat steps for catalog number and any other field that requires a unique entry. C. Leave the Bar Code Field Alcme.
Creating the Scripts for the Multiple Print Report
Import Script is Installed in the Multiple Print Database
I. Open the Multiple Print Database. II. Adding the Import Script:
A. Click on Script Menus and choose ScriptMaker^"* B. Type Import in the script Name Box. C. Click Create and click Clear All. D. Choose, in this order, the following by double clicking on the fields in the
left-hand box until they appear in the right-hand box. 1. Enter Browse Mode.
a) In the Options box, unclick Pause. 2. Delete All Records.
a) In the Options box, check Perform without dialog. 3. Import Records.
a) In the Options box. Check Perform without dialc^ and uncheck Restore.
b) In the Options box. Click on Specify File and Choose <the collection's database>
4. Exit Script. E. Click on OK. F. Add an Import Button for the Import Script onto the Layout by following the
Directions for Instructions for Installing the Single Find View (Steps II-Ill on page 113). Label the button Multiple Print. Make sure the box next to "Perform without dialog" is checked for the import script button.
Duplication Script is Installed in the Multiple Print Database
III. Open the Multiple Print Database. IV. Adding the Record Duplication Button:
A. Create a Script Button for the Duplication by following the Directions for Instructions for Installing the Single Find View (Steps 11-111 on page 113). However, instead of choosing Perform a Script choose Duplicate Record/Request.
172

Directions for Installing and Testing the Multiple Print Report (cont.)
Multiple Print Script is Tnst«Ued in the Main Collection^ Database
1.
n.
m.
IV.
Open the Main Collection's Database (not the Multiple Print Database).
Open up a layout for an information card.
Change to Layout Mode.
B. C. D.
Create the script Multiple Print. A. Click on Script Menus and choose ScriptMaker^"*.
Type Multiple Print in the script Name Box. Click Create. Choose, in this order, the following by double clicking on the fields in the left-hand box until they appear in the right-handed box. 1. Go to Layout
a) In the Options box, Click on Layout and choose Data Entry.
2. Go to Field a) In the Options box, click on Catalog Number.
3. Enter Find Mode a) In the Options Box,
(1) Click on the box next to Restore Find and clear it so it is empty
(2) Click on the box next to Pause so it is checked. E. Open
1. In the Options box, click on Multiple Print database. F. Go to Layout
1. In the Options box, click on Layout and chcx)se the same information card layout as above.
G. Perform Find [ I 1. In the Options box, make sure no boxes are checked.
H. Click on OK. 1. Click on Done. The Script Definition should be similar to the Figure below.
Script
A..AAI* ^1.94 'f^mtntm^'
C l r . !
I* Vw. Efd «
( » • l « » If
0. (»«.UW4l>.Mr4
(>.<.ri.u G.I.Nr.'Ifl.W
CM.. I r . * * . MMI.
• l>M|'V»CCUECrain>KtM(n^aHMC<MruU'l
iiiz
\ artrM j Skwr. • Oupli. «<• CWK*4 DC 1
Multiple Print Script. Source: Screen Capture. FileMaker Pro® 4.1. v3. 1984-1999.
173
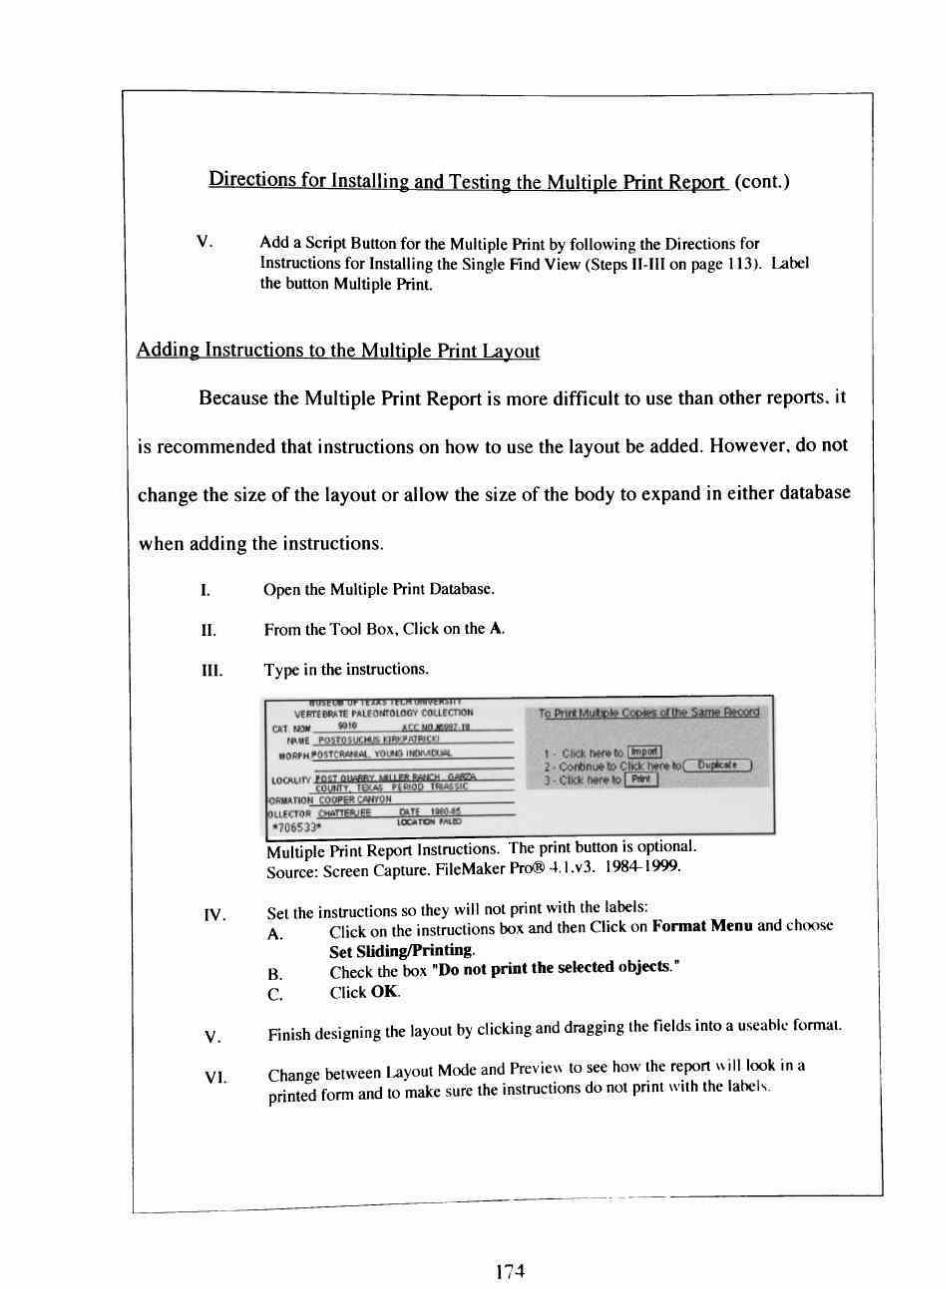
Directions for Installing and Tesfing the Multiple Print Report (cont)
Add a Script Button for the Multiple Print by following the Directions for Instructions for Installing the Single Rnd View (Steps II-Ill on page 113). Label the button Multiple Print.
Adding Instructions to the Multiple Print Layout
Because the Multiple Print Report is more difficult to use than other reports, it
is recommended that instmctions on how to use the layout be added. However, do not
change the size of the layout or allow the size of the body to expand in either database
when adding the instructions.
I.
n.
HI.
IV.
V.
VI.
Open the Multiple Print Database.
From the TCK)1 Box, Click on the A.
Type in the instructions.
VHBTEBJWTE PALEONTOLOGY COLLECTION
CAT NOW. 90t»
M»«f Pnarnsucwa KiwPArwcKi t i n f t m f O I T C f t a W A l . YOtJNO IMOMOMOL
COUWTY TEXAS PtRlOO TWASSIC
OfiMAnOH COQPirR r j ^ r O N
To Print Multiple Copies of the Same Fteoyd
1 • Click tt^« to l>"pw<l 2 • Conbnw to Click h*r» toC ftupfat* ) 3 - Click twr* to fWnt 1
«706533» lOCATON P'iBO
Multiple Print Report Instructions. The print button is optional. Source: Screen Capttire. FileMaker Pro® 4.1 .v3. 1984-1999.
Set the instructions so they will not print with the labels: A. Click on the instructions box and then Click on Format Menu and choose
Set SUding/Printing. B. Check the box "Do not print the selected objects." C. Click OK.
Finish designing the layout by clicking and dragging the fields into a useable format.
Change between Layout Mode and Preview to see how the report will look in a printed form and to make sure the instructions do not print with the labels.
174

Directions for Installing and Testing the Multiple Print Report (cont.)
vn. Continue fcjr each ofthe information card Layouts that may recjuire multiple copies. To avoid ccmfiision, make the instructions the same for evay information card Layout by cc^ying the instructicms and the script buttons and pasting them into the rest ofthe information card Layouts.
vm. Close the Multiple Print Database.
DC. InstructicKis also can be added fcjr the Main Database.
Testing the Multiple Print Report.
L Open the Collection's Database.
II. Open the Browse mode of an information card Layout.
III. Click on the Import Buttcm.
rV. EntCT the catalog number and press retum to find the record that needs a duplicate
tag.
V. Click on Windows Menu and Choose Multiple Printing.
VI. Change the layout mcxle to the type of information card that will be printed,
vn . Click on Import.
Vni. Click on Duplicate as many times as needed.
DC. Click on Print. X. Select Print Preview or Preview Mode before actually printing.
XI. After the tags have been printed, check to make sure that all of the information is the same, including the bar code. The bar code can be checked by using Microsoft Word®, or another word processing program and scanning the bar code.
175

Instructions for Installing the Classification Report
Creating the aassification Report T^ymit
I. Follow the directions I-in in the Instructions for Installing the Proofi-eading Report (page 169) and type in the name ofthe type of label that is being created.
II. Chcx)se Columnar Report.
A. Choose the fields by Double Clicking on the field from the left-hand column into the right-hand column.
B. Click O K
III. Design the Layout.
IV. Expand the size of the body by dragging the line down.
V. Drag all ofthe fields in the body down.
VI. Click on Part in the tool box and drag it into the body. A. Click on Sub-Summary when sorted by... B. Choose the fields to be groupecL C. Click O K
v n . Drag the fields that are to be grouped into the sub-summary section.
VIII. Continue following steps V-Xn.
DC. Finish.
Testing the Classification Report Layout
X. Go to the Browse Mcxle
XI. Sort the database by the field that is to be grouped.
XII. Go to Preview.
XIII. Print.
176

Inventory and Loan Report
Method 1: CcMonprehensive Inventorv Performed in One Day For Covering the Entire Database.
I. Find the Records A. Scan or type in the records by using Multiple Find View (on page 165).
II. Click on Select Menu. A. Choose Find Omitted.
ni. Use a pre-existing report, or generate a new cme to print the report.
Method 2: Comprehensive Inventorv Performed On Multiple Davs Covering the Entire Database.
I. First Day. A. Create a Blank Template of the Database.
1. Click on the File Menu 2. Click on Save a Copy As...
B. Save the Blank Template 1. Type in <name of the inventory>. 2. Click on Type
a) Choose Clone (no records) 3. Click on Save.
C. Open the Main Collection's Database (not the newly created blank template). D. Scan or type in the records by using Multiple Find View (on page 165). E. Import the found records to the Blank Template to save them for the day.
1. Open the Blank Template created from step I.A. 2. Click on the File Menu 3. Click on Import/Eiqiort
a) Choose Import Records... 4. Choose the Collection's Database. 5. Click on Import. 6. Click OK
n. Second, Third, Fourth Day(s), etc. until the inventory is completed. A. Follow steps I.B.-I.E.
ni. Comparing the collection's database to the blank template to find records not scanned
during the inventory. . . r . , A Find all ofthe records in the Main Collections Database.
1 Open up the Main Collection's Database 2. Click on the Select Menu.
a) Choose Find All.
177

Inventorv and Loan Report (cont.)
' sTeTrB*^ '^'^ ^"^^ "^ *' '^^'^^ ^ ^ ^ ' ° ^ " ^ ^^ ^ 1 • Follow the Instructions for Step LE.
C Find the records ncjt scanned. 1 • Open the Temporary Inventory Database. 2. Click on Mode Menu and choose Find 3. Click on the Serial Number Field 4. Click on Symbols on the left ofthe screen and choose Duplicate. 5. Click on Find.
D. Fmish by following the instructions for steps H-IV in Method 1 above.
Methcxl 3: Partial Inventory or Loan
I. Open the Main Collection's Database.
n. Follow all ofthe directions under step I in "Method 2: Comprehensive hiventory Performed On Multiple Days Covering the Entire Database".
III. When the loan comes back. A. Open the temporary inventory/loan database created in Step n above. B. Follow the instructions for Step H-IV in "Method 1: Comprehensive
Inventory Performed in One Day For Covering the Entire Database" on page 177) to find the omitted records.
178

APPENDDC C
TROUBLE-SHOOTING
• Report is not printing on the whole page
• Check Print Setup for paper size and orientation
• Bar Code Reader vdll not scan.
Check to see that it is plugged into the computer and the A/C outlet.
Make sure the laser is parallel with the bar code.
Vary the distance between the reader and the bar code.
Vary the angle between the reader and the bar code.
Make sure that the reader is not being held at a side angle.
If it is a cordless reader, the battery may need replacing.
Check to see that the bar code has 1/4" of white space on either side.
Sometimes it helps to make the actual bar code field larger in the Layouts
When printing multiple copies ofthe same record, the bar code is different numbers.
• Go to define fields and make sure that all automatic functions have been turned
off.
The space between the bars are the same
• Go to the Layout Mode. Make sure the BAR CODE field is a bitmap
style.
When scanning muhiple records, some ofthe fields do not appear after Multiple Find
view has been completed. • Check to see that the records exist in the database.
• Check to see that the bar code is the correct number - This can be checked
by scanning it into a word processing program like Microsoft Word® and then
comparing the number to the serial number in the database.
179

APPENDDC C
SELECTED DATA ENHANCEMENT TERMS
BAR CODE A series of bars and spaces whose combinations represent different ctiaracters.
BAR CODE READER The hardware that scans a bar code and then decodes it.
BAR CODE TRANSLATOR The software that converts numbers or characters into a bar code.
BUSINESS RULES A set of principles imposed by the database that govern tiie type of datum that may be entered into each database field. Business rules facilitate maintenance of data integrity and standardizatioiL
CHARGED COUPLED DEVISE (CCD) A type of bar code reader.
DATABASE A collection of related data.
DATABASE MANAGEMENT SYSTEM (DBMS) The software structure that stores maintains, and allows the user to access and manipulate information that has been entered into the database.
DATABASE MODEL Provides the basis for which a database's fields are established and standardizes the relationships for the data within the database.
DATA ENHANCEMENT A process through which data gathering, storage, and retrieval are augmented to its maximum efficiency.
DATA INTEGRITY Refers to the accuracy, consistency and validity of information within a database.
DATA INTEGRITY Refers to the accuracy, consistency, and validity of information within the database.
DATUM A value stored in a field.
DIVISION ORDINAL The first digit ofthe bar code number that indicates what division ofthe museum the object belongs to. The data enhancement committee assigns the divisional ordinals.
180
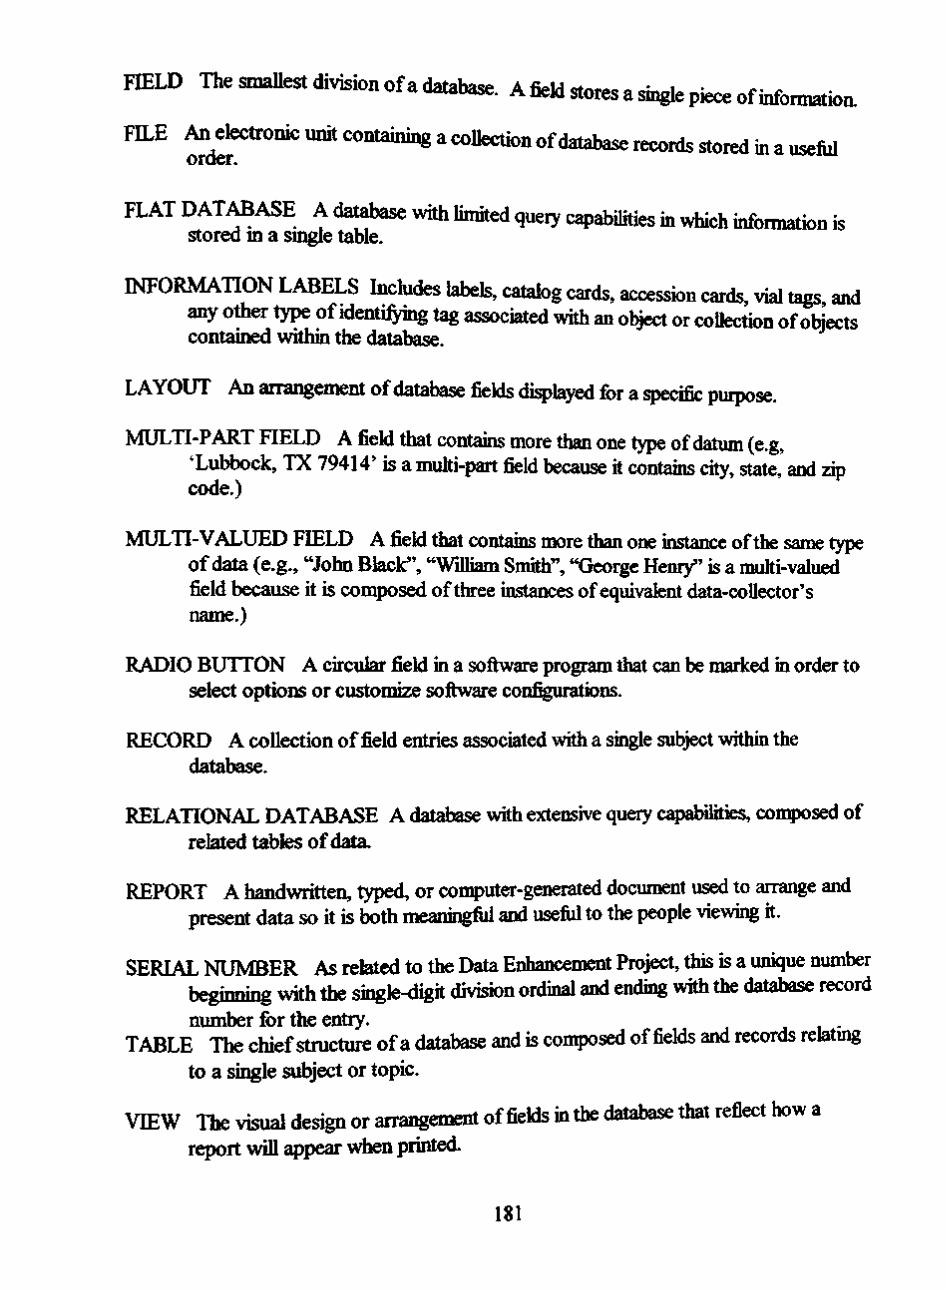
FIELD The smaUest division of a database. A field stores a single piece of information.
FILE An electronic unit containing a collection of database records stored in a use&l order. woi im
FLAT DATABASE A database with limited query capabilities in which information is Stored m a smgle table.
INFORMATION LABELS Includes labels, catalog cards, accession cards, vial tags and any other type of identifying tag associated with an object or coUection of objects contained within the database.
LAYOUT An arrangement of database fields displayed for a specific purpose.
MULTI-PART FIELD A field that contains more than one type of datum (e.g, 'Lubbock, TX 79414' is a multi-part field because it contains city, state, and zip code.)
MULTI-VALUED FIELD A field that contains more than one instance ofthe same type of data (e.g., "John Black", "William Smith", "George Henry" is a multi-valued field because it is composed of three instances of equivalent data-collector's name.)
RADIO BUTTON A circular field in a software program that can be marked in order to select options or customize software configurations.
RECORD A collection of field entries associated with a single subject within the database.
RELATIONAL DATABASE A database with extensive query capabilities, conqwsed of related tables of data.
REPORT A handwritten, typed, or computer-generated document used to arrange and present data so it is both meaningfiil and usefiil to the people viewing it.
SERIAL NUMBER As related to the Data Enhancement Project, this is a unique number beginning with the single-digit division ordinal and ending with the database record number for the entry.
TABLE The chief structure of a database and is composed of fields and records relating to a single subject or topic.
VIEW The visual design or arrangement of fields in the database that reflect how a
report will appear when printed.
181

PERMISSION TO COPY
In presenting this thesis in partial ftilfiUment ofthe requirements for a master's
degree at Texas Tech University or Texas Tech University Healtii Sciences Center, I
agree that the Library and my major department shaU make it freely available for
research purposes. Permission to copy this thesis for scholarly purposes may be
granted by the Director ofthe Library or my major professor. It is understood tiiat
any copying or publication of tiiis thesis for financial gain shaU not be allowed
vntiiout my further written permission and tiiat any user may be hable for copyright
infiingement.
Agree (Permission is granted.)
Student Signature Date
Disagree (Permission is not granted.)
Student Signature ^^^^