Embed Size (px)
Citation preview
Incorporating Male Sterility Increases Hybrid MaizeYield in Low Input African Farming SystemsSarah Collinson
Corteva AgricscienceEsnath Hamidziripi
International Maize and Wheat Improvement Centre (CIMMYT)Hugo De Groote
CIMMYTMichael Ndegwa
CIMMYT https://orcid.org/0000-0001-6751-8259Jill Cairns
International Maize and Wheat Improvement Centre (CIMMYT)Marc Albertsen
Corteva Agriscience https://orcid.org/0000-0003-3058-2366Dickson Ligeyo
Kenya Agricultural and Livestock Research Institute (KALRO)Kingstone Mashingaidze
Agricultural Research Council (ARC)Michael Olsen ( [email protected] )
CIMMYT https://orcid.org/0000-0002-8818-6238
Article
Keywords: hybrid, farmers, NPP, FNP
Posted Date: August 6th, 2021
DOI: https://doi.org/10.21203/rs.3.rs-753819/v1
License: This work is licensed under a Creative Commons Attribution 4.0 International License. Read Full License
1
Incorporating male sterility increases hybrid maize yield in low input African farming systems 1
Sarah Collinson1, Esnath Hamadzipiri2, Hugo De Groote3, Michael Ndegwa3, Jill E. Cairns2, Marc Albertsen4, 2
Dickson Ligeyo5, Kingstone Mashingaidze6, Michael Olsen7* 3
* Corresponding Author. Email: [email protected] 4
1Corteva Agricscience, Davis, California, USA 5
2 International Maize and Wheat Improvement Centre (CIMMYT), Harare, Zimbabwe 6
3 CIMMYT, Nairobi, Kenya 7
4 Corteva Agriscience, Johnson, Iowa, USA 8
5 Kenya Agricultural and Livestock Research Institute (KALRO), Kitale, Kenya 9
6 Agricultural Research Council (ARC), Potchefstroom, South Africa 10
7 CIMMYT, Nairobi, Kenya 11
12
13
2
Abstract 14
Maize is a staple crop in sub-Saharan Africa, but yields remain sub-optimal. Improved breeding and seed 15
systems are vital to increase productivity. We describe a novel hybrid seed production technology that 16
will benefit seed companies and farmers. This technology reduces the cost of seed production by 17
preventing the need for detasseling. The resulting hybrids segregate 1:1 for pollen production, conserving 18
resources for grain production and conferring a 200 kg ha-1 benefit across a range of yield levels. This 19
represents a 10% increase for farmers operating at national average yield levels in sub-Saharan Africa. 20
The yield benefit of fifty-percent non-pollen producing hybrids is equivalent to approximately six years of 21
progress in plant breeding. Benefits to seed companies in the form of reduced production cost and 22
improved seed purity will provide incentives to improve smallholder farmer access to higher quality seed 23
of climate-smart hybrids. Demonstrated farmer preference for these hybrids will help drive their 24
adoption. 25
26
Introduction 27
Increasing productivity of smallholder farmers in sub-Saharan Africa (SSA) is an important step towards 28
improving livelihoods and reducing risk (Hansen et al. 2018). Maize yields in SSA remain the lowest in the 29
world, with historical production increases are associated with an unsustainable increase in maize area. 30
At current yield levels, the area under maize cultivation must increase by 184% to meet future food 31
security needs (van Ittersum et al. 2016). Obsolete varieties that were developed for climate conditions 32
which have subsequently changed are still widely grown. Rapid-cycle breeding and faster varietal 33
replacement are essential to increasing yields under changing climates (Atlin et al. 2017). Progress in SSA 34
has been made through modernizing breeding programs, engagement with seed companies, and 35
development and delivery of elite, stress-tolerant varieties (Cairns and Prasanna, 2018). Improved maize 36
production in Ethiopia, through improved maize genetics and other agronomic inputs (Abate et al. 2015), 37
has helped lift an estimated 788,000 people out of poverty annually (Kassie et al. 2018). There is increasing 38
focus on improving the efficiency of public sector maize breeding (Cobb et al. 2019) but seed production 39
remains a key bottleneck in SSA (Prasanna et al. 2021). 40
41
Hybrids are maize varieties in which the seed is produced by two different parent lines, increasing the 42
yield through heterosis. Detasseling in hybrid seed production in SSA is manual, unlike other regions of 43
the world, leading to higher cost of the seed and issues with quality (Eritro et al. 2017; Gaffney et al. 2016). 44
3
Most commercially available hybrids in SSA are three-way hybrids which are formed by crossing two lines 45
together to form a single cross female parent and then crossing the single cross female to a third inbred 46
to produce commercial seed. Three-way cross hybrids are common in SSA since the cost of goods sold 47
(COGS) is lower due to the higher seed yield of single cross females compared with inbred lines. 48
Technologies to reduce both COGS and the complexity of producing high quality hybrids would offer 49
smaller seed companies greater opportunities to provide new hybrids to smallholder farmers. Seed 50
Production Technology (SPT) is a process previously used by Corteva Agriscience to produce commercial 51
hybrid maize seed in the United States. The original SPT system was based on a recessive male sterility 52
gene, Ms45, and utilized a transgenic maintainer cassette containing a gene to restore fertility to ms45 53
homozygous plants, an α-amylase gene to render transgenic pollen non-viable, and a seed color marker 54
gene (Wu et al. 2016). SPT enables the production of homozygous male sterile non-transgenic seed. 55
56
Subsequent development of an SPT system based on the dominant male sterility gene, Ms44, (Fox et al. 57
2017), enables seed increase of homozygous dominant NPP inbred and heterozygous NPP female single-58
cross parent plants. The Ms44-SPT system is well suited for three way hybrid production as it eliminates 59
the need for detasseling maize hybrid production fields during both hybridization steps. Three-way 60
hybrids produced using heterozygous NPP female parents segregate 1:1 pollen-producing (PP) and non-61
pollen-producing (NPP) and have been shown to increase yield by 4% when nitrogen was applied at only 62
66-112 kg ha-1 (compared to 224 kg N ha-1) in the US (Fox et al. 2017). Such hybrids are designated fifty-63
percent non-pollen-producing (FNP). Low fertilizer use (<17 kg ha-1) is a major factor contributing to the 64
yield gap in SSA (Leitner et al. 2020), particularly in female-managed plots (Farnworth et al. 2017) and is 65
exacerbated by low and variable returns on investment (Jayne et al. 2018). Here was investigate the 66
potential of FNP hybrids to increase maize yields under a range of conditions including low input and 67
drought stressed conditions commonly encountered by small holder farmers in SSA. Most agricultural 68
research only involves researchers, without any participation from farmers (Stathers et al. 2020). Working 69
with the primary beneficiaries is essential to ensure an understanding of what the user needs or wants in 70
order to facilitate adoption (Gaffney et al. 2016). For this reason, trials were conducted largely on-farm 71
with primary beneficiaries and farmer perceptions of FNP hybrids were evaluated. Finally we investigate 72
the mechanisms for the yield increase associated with the FNP trait. 73
4
74
Results 75
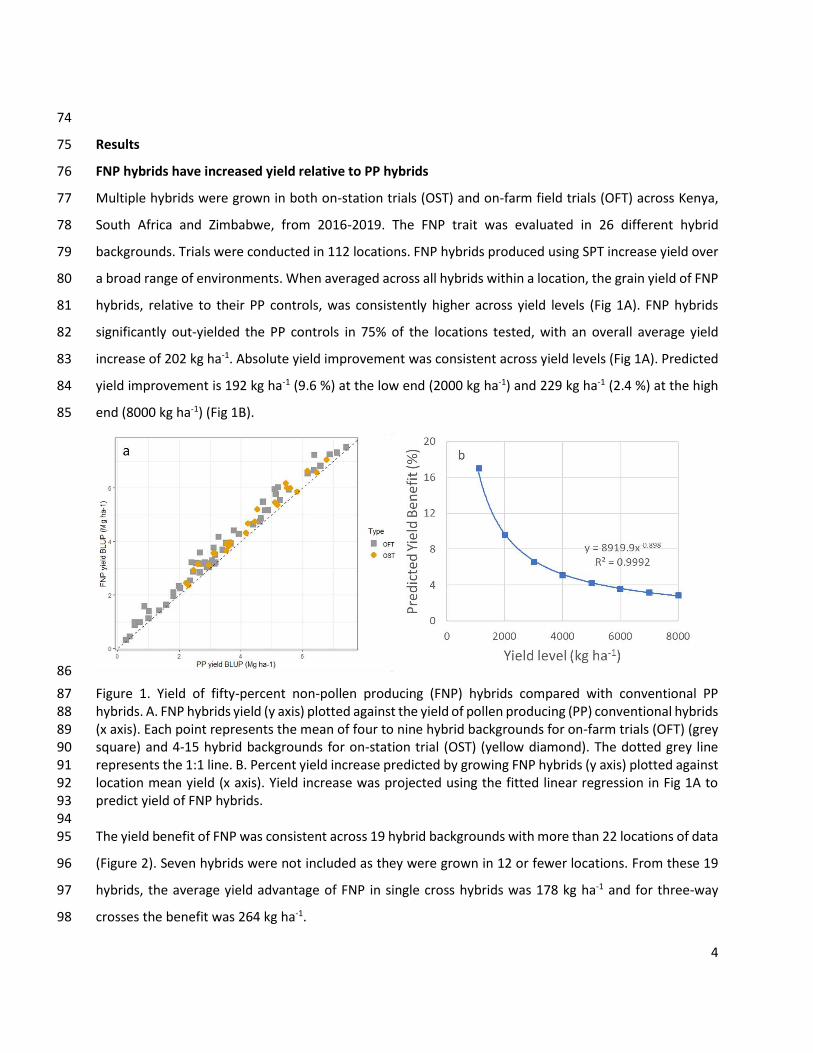
FNP hybrids have increased yield relative to PP hybrids 76
Multiple hybrids were grown in both on-station trials (OST) and on-farm field trials (OFT) across Kenya, 77
South Africa and Zimbabwe, from 2016-2019. The FNP trait was evaluated in 26 different hybrid 78
backgrounds. Trials were conducted in 112 locations. FNP hybrids produced using SPT increase yield over 79
a broad range of environments. When averaged across all hybrids within a location, the grain yield of FNP 80
hybrids, relative to their PP controls, was consistently higher across yield levels (Fig 1A). FNP hybrids 81
significantly out-yielded the PP controls in 75% of the locations tested, with an overall average yield 82
increase of 202 kg ha-1. Absolute yield improvement was consistent across yield levels (Fig 1A). Predicted 83
yield improvement is 192 kg ha-1 (9.6 %) at the low end (2000 kg ha-1) and 229 kg ha-1 (2.4 %) at the high 84
end (8000 kg ha-1) (Fig 1B). 85
86
Figure 1. Yield of fifty-percent non-pollen producing (FNP) hybrids compared with conventional PP 87
hybrids. A. FNP hybrids yield (y axis) plotted against the yield of pollen producing (PP) conventional hybrids 88
(x axis). Each point represents the mean of four to nine hybrid backgrounds for on-farm trials (OFT) (grey 89
square) and 4-15 hybrid backgrounds for on-station trial (OST) (yellow diamond). The dotted grey line 90
represents the 1:1 line. B. Percent yield increase predicted by growing FNP hybrids (y axis) plotted against 91
location mean yield (x axis). Yield increase was projected using the fitted linear regression in Fig 1A to 92
predict yield of FNP hybrids. 93
94
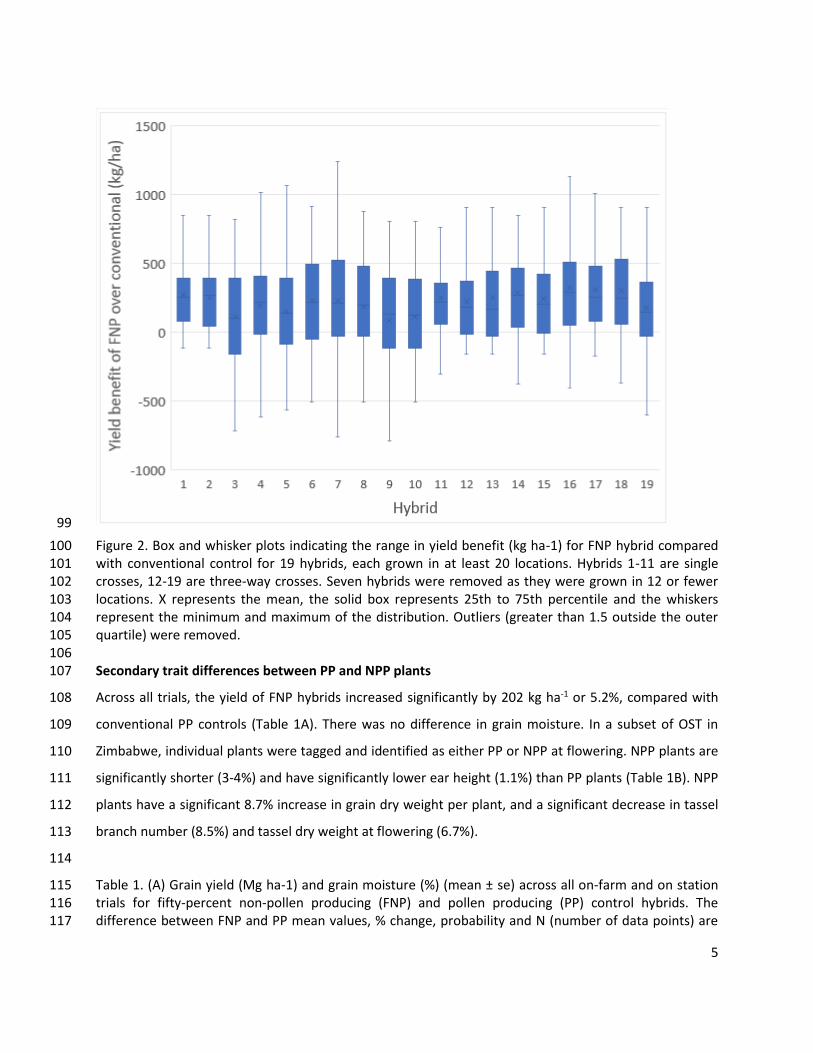
The yield benefit of FNP was consistent across 19 hybrid backgrounds with more than 22 locations of data 95
(Figure 2). Seven hybrids were not included as they were grown in 12 or fewer locations. From these 19 96
hybrids, the average yield advantage of FNP in single cross hybrids was 178 kg ha-1 and for three-way 97
crosses the benefit was 264 kg ha-1. 98
5
99
Figure 2. Box and whisker plots indicating the range in yield benefit (kg ha-1) for FNP hybrid compared 100
with conventional control for 19 hybrids, each grown in at least 20 locations. Hybrids 1-11 are single 101
crosses, 12-19 are three-way crosses. Seven hybrids were removed as they were grown in 12 or fewer 102
locations. X represents the mean, the solid box represents 25th to 75th percentile and the whiskers 103
represent the minimum and maximum of the distribution. Outliers (greater than 1.5 outside the outer 104
quartile) were removed. 105
106
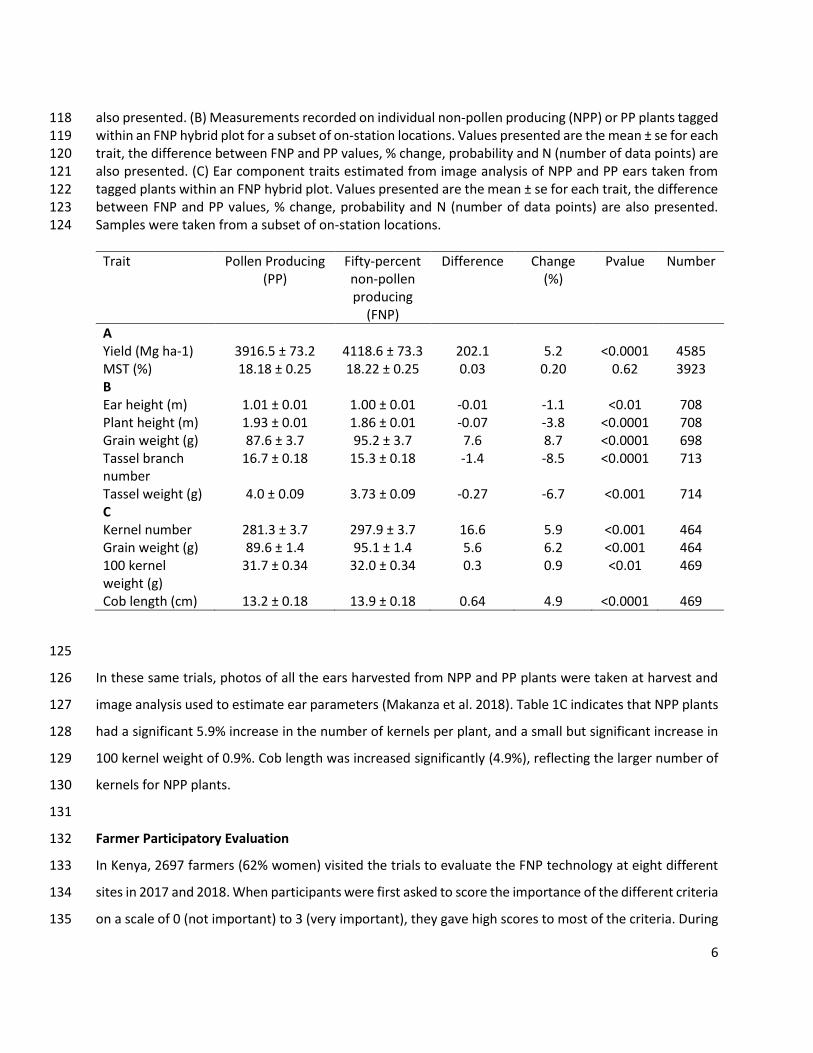
Secondary trait differences between PP and NPP plants 107
Across all trials, the yield of FNP hybrids increased significantly by 202 kg ha-1 or 5.2%, compared with 108
conventional PP controls (Table 1A). There was no difference in grain moisture. In a subset of OST in 109
Zimbabwe, individual plants were tagged and identified as either PP or NPP at flowering. NPP plants are 110
significantly shorter (3-4%) and have significantly lower ear height (1.1%) than PP plants (Table 1B). NPP 111
plants have a significant 8.7% increase in grain dry weight per plant, and a significant decrease in tassel 112
branch number (8.5%) and tassel dry weight at flowering (6.7%). 113
114
Table 1. (A) Grain yield (Mg ha-1) and grain moisture (%) (mean ± se) across all on-farm and on station 115
trials for fifty-percent non-pollen producing (FNP) and pollen producing (PP) control hybrids. The 116
difference between FNP and PP mean values, % change, probability and N (number of data points) are 117
6
also presented. (B) Measurements recorded on individual non-pollen producing (NPP) or PP plants tagged 118
within an FNP hybrid plot for a subset of on-station locations. Values presented are the mean ± se for each 119
trait, the difference between FNP and PP values, % change, probability and N (number of data points) are 120
also presented. (C) Ear component traits estimated from image analysis of NPP and PP ears taken from 121
tagged plants within an FNP hybrid plot. Values presented are the mean ± se for each trait, the difference 122
between FNP and PP values, % change, probability and N (number of data points) are also presented. 123
Samples were taken from a subset of on-station locations. 124
Trait Pollen Producing
(PP)
Fifty-percent
non-pollen
producing
(FNP)
Difference Change
(%)
Pvalue Number
A
Yield (Mg ha-1) 3916.5 ± 73.2 4118.6 ± 73.3 202.1 5.2 <0.0001 4585
MST (%) 18.18 ± 0.25 18.22 ± 0.25 0.03 0.20 0.62 3923
B
Ear height (m) 1.01 ± 0.01 1.00 ± 0.01 -0.01 -1.1 <0.01 708
Plant height (m) 1.93 ± 0.01 1.86 ± 0.01 -0.07 -3.8 <0.0001 708
Grain weight (g) 87.6 ± 3.7 95.2 ± 3.7 7.6 8.7 <0.0001 698
Tassel branch
number
16.7 ± 0.18 15.3 ± 0.18 -1.4 -8.5 <0.0001 713
Tassel weight (g) 4.0 ± 0.09 3.73 ± 0.09 -0.27 -6.7 <0.001 714
C
Kernel number 281.3 ± 3.7 297.9 ± 3.7 16.6 5.9 <0.001 464
Grain weight (g) 89.6 ± 1.4 95.1 ± 1.4 5.6 6.2 <0.001 464
100 kernel
weight (g)
31.7 ± 0.34 32.0 ± 0.34 0.3 0.9 <0.01 469
Cob length (cm) 13.2 ± 0.18 13.9 ± 0.18 0.64 4.9 <0.0001 469
125
In these same trials, photos of all the ears harvested from NPP and PP plants were taken at harvest and 126
image analysis used to estimate ear parameters (Makanza et al. 2018). Table 1C indicates that NPP plants 127
had a significant 5.9% increase in the number of kernels per plant, and a small but significant increase in 128
100 kernel weight of 0.9%. Cob length was increased significantly (4.9%), reflecting the larger number of 129
kernels for NPP plants. 130
131
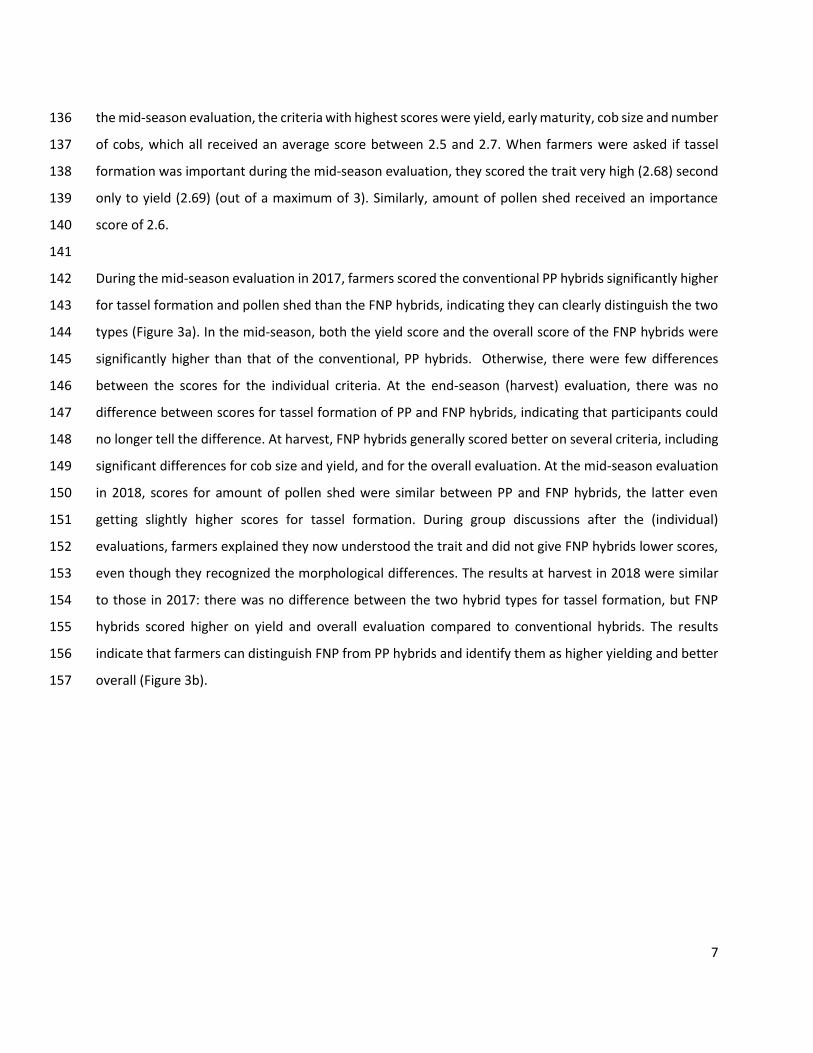
Farmer Participatory Evaluation 132
In Kenya, 2697 farmers (62% women) visited the trials to evaluate the FNP technology at eight different 133
sites in 2017 and 2018. When participants were first asked to score the importance of the different criteria 134
on a scale of 0 (not important) to 3 (very important), they gave high scores to most of the criteria. During 135
7
the mid-season evaluation, the criteria with highest scores were yield, early maturity, cob size and number 136
of cobs, which all received an average score between 2.5 and 2.7. When farmers were asked if tassel 137
formation was important during the mid-season evaluation, they scored the trait very high (2.68) second 138
only to yield (2.69) (out of a maximum of 3). Similarly, amount of pollen shed received an importance 139
score of 2.6. 140
141
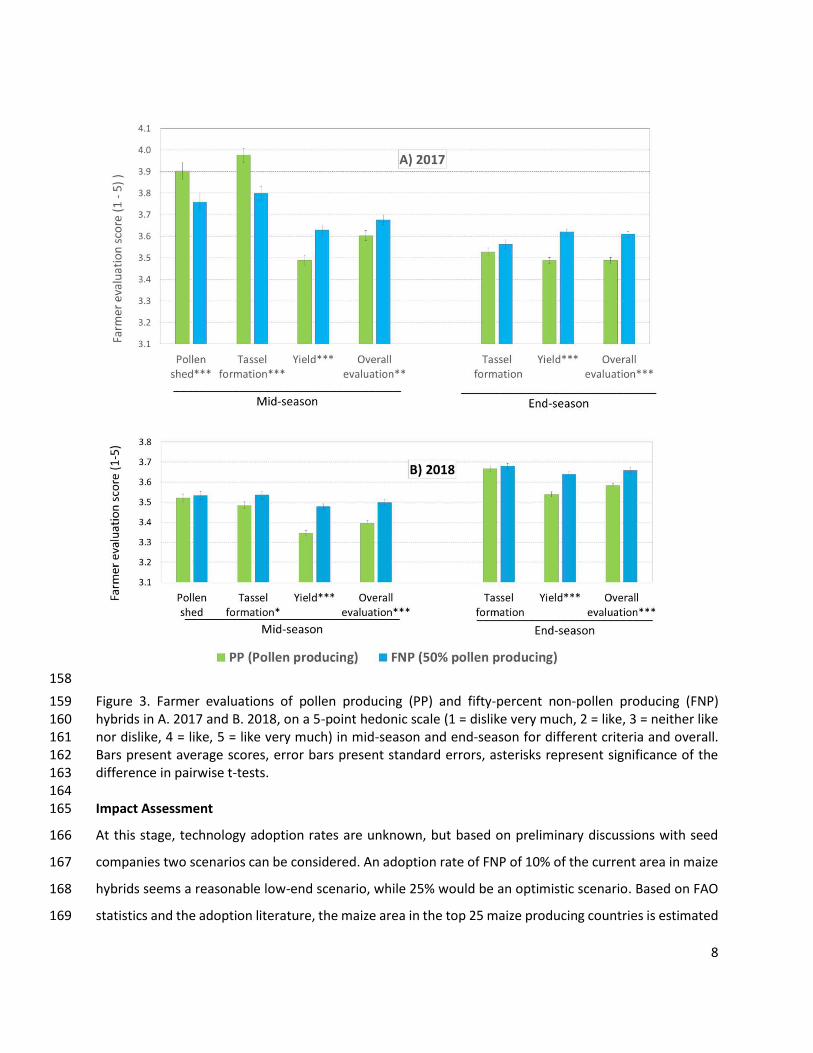
During the mid-season evaluation in 2017, farmers scored the conventional PP hybrids significantly higher 142
for tassel formation and pollen shed than the FNP hybrids, indicating they can clearly distinguish the two 143
types (Figure 3a). In the mid-season, both the yield score and the overall score of the FNP hybrids were 144
significantly higher than that of the conventional, PP hybrids. Otherwise, there were few differences 145
between the scores for the individual criteria. At the end-season (harvest) evaluation, there was no 146
difference between scores for tassel formation of PP and FNP hybrids, indicating that participants could 147
no longer tell the difference. At harvest, FNP hybrids generally scored better on several criteria, including 148
significant differences for cob size and yield, and for the overall evaluation. At the mid-season evaluation 149
in 2018, scores for amount of pollen shed were similar between PP and FNP hybrids, the latter even 150
getting slightly higher scores for tassel formation. During group discussions after the (individual) 151
evaluations, farmers explained they now understood the trait and did not give FNP hybrids lower scores, 152
even though they recognized the morphological differences. The results at harvest in 2018 were similar 153
to those in 2017: there was no difference between the two hybrid types for tassel formation, but FNP 154
hybrids scored higher on yield and overall evaluation compared to conventional hybrids. The results 155
indicate that farmers can distinguish FNP from PP hybrids and identify them as higher yielding and better 156
overall (Figure 3b). 157
8
158
Figure 3. Farmer evaluations of pollen producing (PP) and fifty-percent non-pollen producing (FNP) 159
hybrids in A. 2017 and B. 2018, on a 5-point hedonic scale (1 = dislike very much, 2 = like, 3 = neither like 160
nor dislike, 4 = like, 5 = like very much) in mid-season and end-season for different criteria and overall. 161
Bars present average scores, error bars present standard errors, asterisks represent significance of the 162
difference in pairwise t-tests. 163
164
Impact Assessment 165
At this stage, technology adoption rates are unknown, but based on preliminary discussions with seed 166
companies two scenarios can be considered. An adoption rate of FNP of 10% of the current area in maize 167
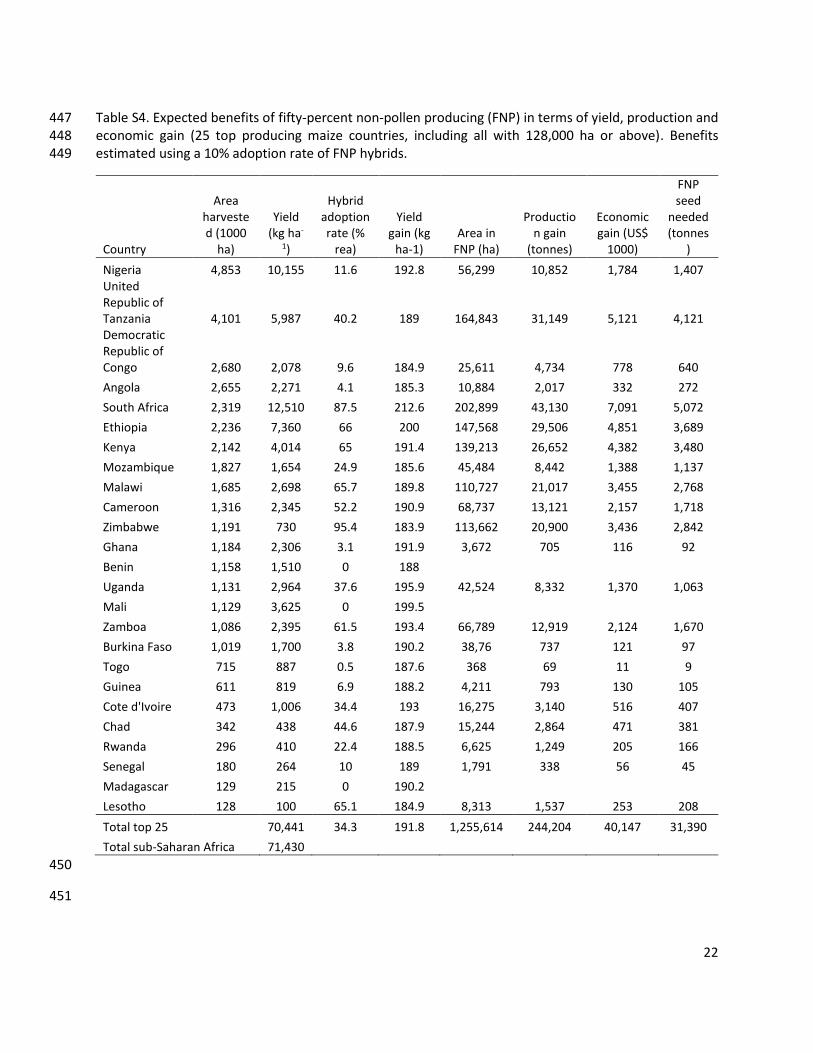
hybrids seems a reasonable low-end scenario, while 25% would be an optimistic scenario. Based on FAO 168
statistics and the adoption literature, the maize area in the top 25 maize producing countries is estimated 169
9
at 36.6 M ha, of which 34.2% or 12.6 M ha is planted to hybrids. The total seed needed for the low scenario 170
(10% adoption by hybrid users) is calculated at 31,390 tonnes, and 78,000 tonnes at the high scenario 171
(25% adoption). At an adoption rate of 10%, only 11 countries have a demand of more than 1000 tonnes 172
(and 17 a demand of > 100 tonnes). The total demand for FNP seed for these 11 countries adds up to 173
27,906 tonnes, 93% of the total. 174
175
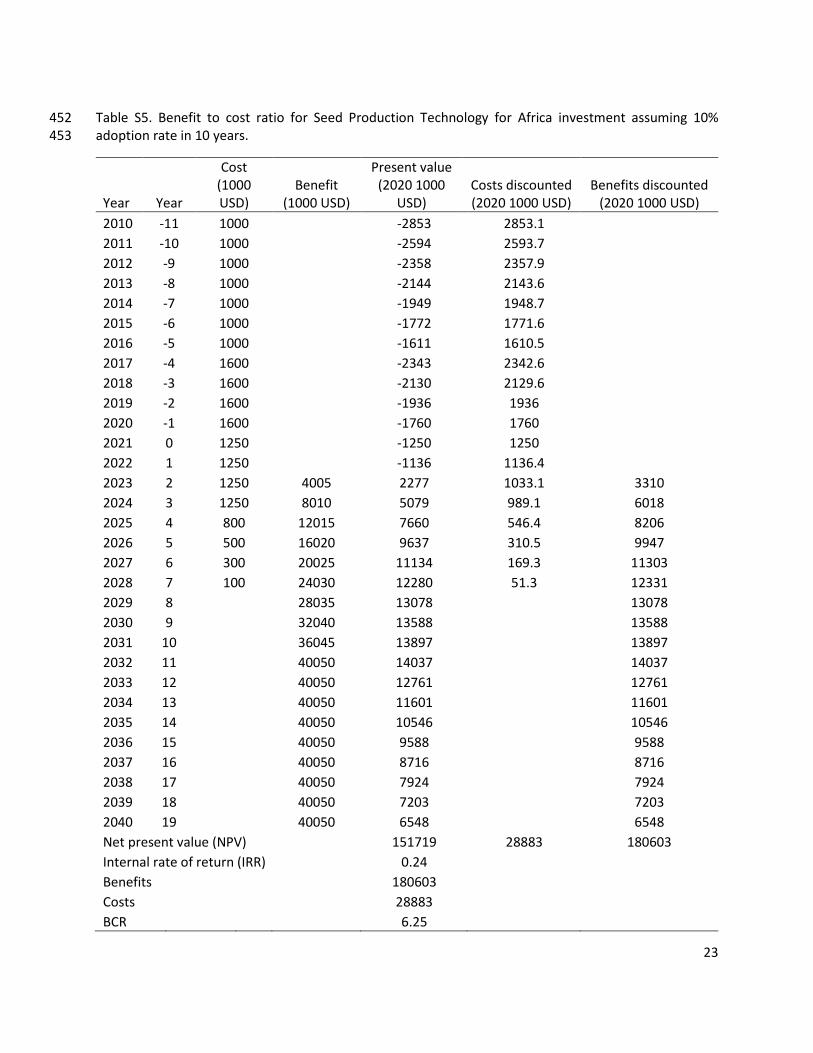
To compare the benefits to the cost, we use net present value (NPV), internal rate of return (IRR) and 176
benefit cost ratio (BCR) (Gitner, 1982) (Table S5). Based on the current cost of the development of the 177
technology, from 1 to 1.6 million $/year, the discounted cost comes to 28.9 million. For the benefits, we 178
assume the technology to be on the market in 2023, and to take 10 years to reach the target 10% adoption 179
(market penetration of FNP hybrids as a percentage of hybrid seed), keeping maize production constant. 180
Under this basic scenario, maize production is expected to increase by 244,204 tonnes per year at the 181
target adoption rate, valued at $40 million. The discounted benefits, up to 2040, are estimated at 180 M$. 182
The NPV is calculated at 152 M$, the BCR at 6.25, and the IRR at 24%. Under the optimistic scenario, the 183
adoption rate of FNP reaches 25% of total hybrid use, and the extra production is estimated at 610,511 184
tonnes annually, valued at $100 million. Under this scenario, the discounted benefits up to 2040 are 185
estimated at $452 million, the NPV at $423 million, the BCR at 16 and the IRR at 32%. 186
187
Discussion 188
In farmers’ fields across hybrid backgrounds in Africa, we demonstrate that FNP hybrids, segregating for 189
Ms44, increase yield by approximately 200 kg ha-1 at current SSA yield levels. There is an urgent need to 190
increase genetic gain for yield under low fertility conditions; observed rates of genetic gain under drought 191
are 23-32 kg ha-1 yr-1 and low nitrogen 21 kg ha-1 yr-1 (Masuka et al. 2017). The yield benefit of FNP hybrids 192
under stress conditions represents at least six years of progress in plant breeding. This study 193
demonstrates the ability of FNP hybrids to deliver 10-20% yield increase under extremely stressful 194
growing conditions faced by millions of small holder maize farmers. The stability of the yield benefit across 195
genetic backgrounds indicates that FNP can be successfully deployed across an array of hybrids to meet 196
the needs of farmers in various agroecological zones throughout SSA. 197
198
On-farm trials are being increasingly scrutinized due to high input and yield levels that are not 199
representative of the actual realities of the farmers testing the technologies (e.g. de Roo et al. 2017; Laajaj 200
10
et al. 2020). Our aim was to evaluate yield benefits at close to national average yield levels by targeting 201
farmer managed on-farm trials with minimal nitrogen inputs, typical of many smallholder farmers. 202
Participatory research was a key component given the visual differences of FNP hybrids compared to 203
conventional hybrids. Kenyan farmers interviewed during participatory evaluation of these trials could 204
observe the differences in tassel and pollen formation but favored FNP hybrids overall due to the 205
improved ear size and increased yield. As the technology broadens to other African countries it will be 206
important to continue to seek farmer feedback on FNP hybrids. 207
208
Yield improvement was correlated with reduced tassel size prior to anthesis and lack of production of 209
pollen, as formation of tassel structure and pollen competes for resources with grain production. Reducing 210
this competition also reduces anthesis silking interval (ASI) under stress (Duvick, 1999). Reduced ASI has 211
also occurred during selection for yield in SSA (Masuka et al. 2017). In FNP hybrids, 50% of the plants do 212
not produce pollen and partitioning of resources within the plant early on in development is shifted from 213
the tassel in favor of the ear, leading to earlier silk protrusion and reducing ASI under stress. This change 214
in partitioning results in more efficient use of nitrogen, a scarce resource for many smallholder farmers. 215
Therefore, an added benefit of FNP hybrids is that they do not increase total N uptake but improve 216
nitrogen utilization efficiency by reducing partitioning from the tassel in favor of the ear, increasing 217
kernels per ear and kernel weight (Fox et al. 2017). The adoption of modern FNP hybrids and the 218
realization of associated yield benefits will still require nutrient inputs, given that current production 219
largely relies on mining of nutrients which is unsustainable (ten Berge et al. 2019; Pasley el al. 2020). 220
221
Widespread acceptance of FNP hybrids will be dependent on adoption by both farmers and seed 222
companies. In this paper we have described yield benefits to the farmer (about 200 kg per ha) and 223
highlighted farmer acceptance, indicating the hybrids are likely to be adopted quickly. Under the 224
conservative scenario (adoption of FNP in 10% of current maize hybrid area), we estimate that FNP would 225
increase maize production in Africa by 0.245 Mt per year, valued at $40M. While this increase is relatively 226
modest, for example when compared to the benefits of Bt maize (De Groote et al. 2011), the benefits 227
would still outweigh the cost by more than 6:1, indicating a good return to the research investment. 228
229
Apart from benefits to farmers, the technology also provides benefits to seed companies. These include: 230
no detasseling costs, as the NPP females will not require detasseling during seed production; improved 231
11
seed purity, as there is no self-pollination during seed production; and increased kernel numbers, leading 232
to reduced seed production costs. Kernel number was increased by 6% in NPP plants under low N in these 233
studies, but was not measured under favorable conditions more typical of seed production. In US trials, 234
kernel number was increased by 9.6% in plants with NPP tassels compared with wild type controls under 235
optimum conditions (Fox et al. 2017). This will be evaluated in African germplasm under seed production 236
practices in SSA, but the expected increase in seed production of about 10% is an additional anticipated 237
benefit to seed companies. The benefits to seed companies are also expected to help catalyse a shift 238
towards more modern hybrids, improving the selection and purity of climate smart hybrids available to 239
smallholder farmers by providing incentives for seed companies to replace older, lower-yielding varieties 240
with more recent higher-yielding ones. 241
242
The replacement of older hybrids in the market will have added benefits for farmers, on top of those 243
predicted from the ~200 kg ha-1 benefit of growing FNP hybrids. We plan to collect additional data on the 244
average age of hybrids that will be replaced, but assuming the average age of replacement is 10 years, 245
this would reflect an additional 275 kg ha-1 benefit to the farmer using conservative estimates of genetic 246
gain. Therefore, the adoption of FNP hybrids would benefit farmers growing at the 2 Mg ha-1 yield level 247
by almost 25%, or 0.5 Mg ha-1, approximately $76 ha-1 in added income. 248
249
In conclusion, the Ms44-SPT system provides a unique opportunity to transform the maize hybrid seed 250
industry in Africa, providing recognizable benefits to both seed companies and farmers. The FNP trait 251
delivered using the Ms44-SPT system can deliver economic benefit in the form of improved input use 252
efficiency to small holder maize farmers faced both with limited ability to purchase recommended 253
quantity of fertilizer and the uncertainty of drought stress. 254
255
Materials and Methods 256
Germplasm and incorporation of Ms44 257
The dominant male-sterile allele Ms44 was backcrossed into five inbred maize lines. Two were dose 6 258
(BC5) and two were dose 4 (BC3) for the numbers of crosses to the recurrent parent. Four to five ear 259
sources were selected for increase based upon positive marker calls for a donor insertion site and 260
decreased insertion size. The five converted Ms44 female inbred parental lines were each crossed to 3-4 261
male inbred parental lines to produce 18 hybrids. In the nursery, plants were tagged pollen-producing 262
12
(PP) and non-pollen producing (NPP) based on phenotype at flowering. Ears were harvested separately 263
for PP and NPP plants. The F1 hybrid seed harvested from NPP plants segregated 1:1 for pollen producing 264
(PP) and non-pollen producing (NPP) and was used for yield trials. These hybrids will be referred to as 265
FNP, or fifty percent non-pollen-producing. The F1 hybrid seed harvested from PP plants was used as 100% 266
PP controls to compare in yield trials. Eight three-way cross hybrids were produced by planting F1 seed 267
harvested from NPP plants and crossing these to inbred PP males, resulting in three-way crosses 268
segregating 1:1 PP and NPP plus the 100% PP controls. 269
270
Yield testing 271
From 2017-2019, yield trials were planted both on-station (OST) and researcher-managed on-farm (OFT) 272
in Kenya, South Africa and Zimbabwe (Figure S1 and Table S1). Trials at experimental stations (OST) were 273
conducted under optimal, low-N, heat and drought stress. Optimal, heat and drought stress sites were 274
optimally fertilized based on local recommendations and received recommended weed and insect control 275
measures. Optimal trials were planted during the main maize growing seasons, irrigated twice at planting 276
and emergence, and supplemental irrigation was applied as needed to avoid drought stress. Managed 277
drought trials were planted in the dry season and irrigation was withheld approximately 2 weeks prior to 278
mid-anthesis. Delayed planting in the dry season allowed for high temperatures at reproductive stage for 279
heat stress trials. In low-N, fields had been depleted of nitrogen for at least 4-seasons. Rescue irrigation 280
was only applied to avoid total crop loss when required. Depletion was achieved by applying no N fertiliser 281
to plots and removing stover from the field after grain was harvested. 282
283
Experiments were in a randomized complete block with a split plot design, with main plot as hybrid 284
pedigree and sub-plot as trait (PP or FNP). Different hybrid combinations were grown in different years 285
and locations depending on seed availability. On-station trials were 2-4 row plots of 5 m length and 0.75 286
cm between rows. There were 4-6 reps per location and usually more hybrid pedigrees planted across 287
fewer locations. 288
289
At selected OST locations, plants in the middle two rows were tagged at flowering according to phenotype: 290
NPP for non-pollen-producing and PP for pollen producing. When all PP plants shed, the tassels from two 291
PP and two NPP tagged plants in each plot were removed and the number of tassel branches recorded. 292
The tassel was cut at one inch above the flag leaf, oven dried to zero moisture and dry weight recorded. 293
13
At 2-3 weeks after flowering, ear height (from ground surface to the highest ear node) and plant height 294
(to the tip of the tassel) were recorded for 4 PP and 4 NPP plants per plot. 295
296
At OST locations in Zimbabwe, ear photos were taken and images analyzed (Makanza et al. 2018) to 297
estimate cob length, kernel number, 100 kernel weight and grain weight per plant. Photos were taken 298
using a tripod with the camera fixed at least 50 cm above the ears. Dehusked ears were placed on a black 299
background, with 15-20 ears per photo. A 30 cm ruler was placed in the same orientation as the ears to 300
be used as a reference. 301
302
For on-farm trials, smallholder farmers were identified by agricultural extension agents in each country. 303
Extension agents were given a small monetary amount to cover all expenses related to trials. In Zimbabwe, 304
additional seed and inputs were given as compensation to farmers. On-farm trials were 2-4 row plots, 5 305
m rows with 0.75 m between rows. Plots were double planted and thinned, leaving an intra-row spacing 306
of 25 cm. There were 2 reps per location and multiple locations per year (Fig. 5?). In each country, project 307
partners worked alongside extension agents and directly with farmers. Researcher-managed trials 308
implemented by farmers are often higher yielding than farmers’ own fields (de Roos et al. 2017), thus 309
farmers were asked to use appropriate pest and weed management, but not to apply N fertiliser. Target 310
yields were less than 4 t ha-1, based on the average yield of target farmers. Harvesting was conducted by 311
hand, ears were shelled and grain weight and moisture recorded. Yield on an area basis was calculated 312
and adjusted to 155 g kg-1 moisture. 313
314
Statistical analysis 315
Analysis was conducted using ASREML (VSN International Ltd). In the analysis for grain yield, main effect 316
of trait is considered as fixed effects and hybrid background and interaction between trait and hybrid 317
background are treated as random effects. Location and interaction between location and trait are 318
considered fixed. The blocking factors such as replicates, as random. Yield for trait within hybrid was 319
predicted using best linear unbiased predictor (BLUP), as hybrid effect was treated as random. Yield for 320
trait across hybrids was predicted using best linear unbiased estimates (BLUE), trait is considered a fixed 321
effect. Differences between the 100% PP and the FNP trait were considered significant at the 5% 322
confidence level. 323
324
14
Farmer evaluations 325
Farmer evaluations were organized in eight trial sites in Kenya in the main season of 2017 and 2018. The 326
original sites were randomly selected from the trial sites in 2017. In 2018, two of the sites were dropped 327
from the trials, so for farmer evaluations they were replaced by nearby suitable sites. The evaluations 328
were conducted twice in each year/season, mid-season (June - July) and end season (July - August). While 329
breeders observed yield and other traits in the field, social scientists invited farmers to come and evaluate 330
the entries in a subset of trials. The evaluations were double blind: plots were identified by number and 331
neither farmers nor facilitators/enumerators knew the treatments. For the participatory evaluations in 332
2017, 8 OFT sites were randomly selected from the trial sites, 4 in Central Kenya and 4 in Western Kenya 333
in 2017. In 2018, 2 sites in Central Kenya were replaced, the other six maintained. 334
335
In each site, neighboring farmers were identified through farmer groups, local administration and 336
extension officers, and invited to come and see the trials. In Kenya, women often tend to the farms while 337
men are more likely to look for employment elsewhere, and it is common to have more female farmers 338
participate (Worku et al. 2020). The participants, 2697 in total, of which 62% women, were adults from 339
all ages (from 17 to 88). Most participants were experienced farmers, with an average of 17 years of 340
farming experience. Most had also finished primary education, with on average eight years of formal 341
education. Most participants owned their farm, with an average size of almost one ha (0.85), more than 342
half of which (0.5 ha) was planted in maize. Most participants practice a mixed crop/livestock system, with 343
about two thirds owning cattle, and a quarter oxen. Average cash income over the previous year was KES 344
92,617 (almost $1000), of which about half came from agriculture. 345
346
Procedure 347
Farmers’ evaluation of new technologies, including varieties, is a two-step procedure, where first the 348
selection criteria or traits important to farmers are identified, followed by an evaluation of the new 349
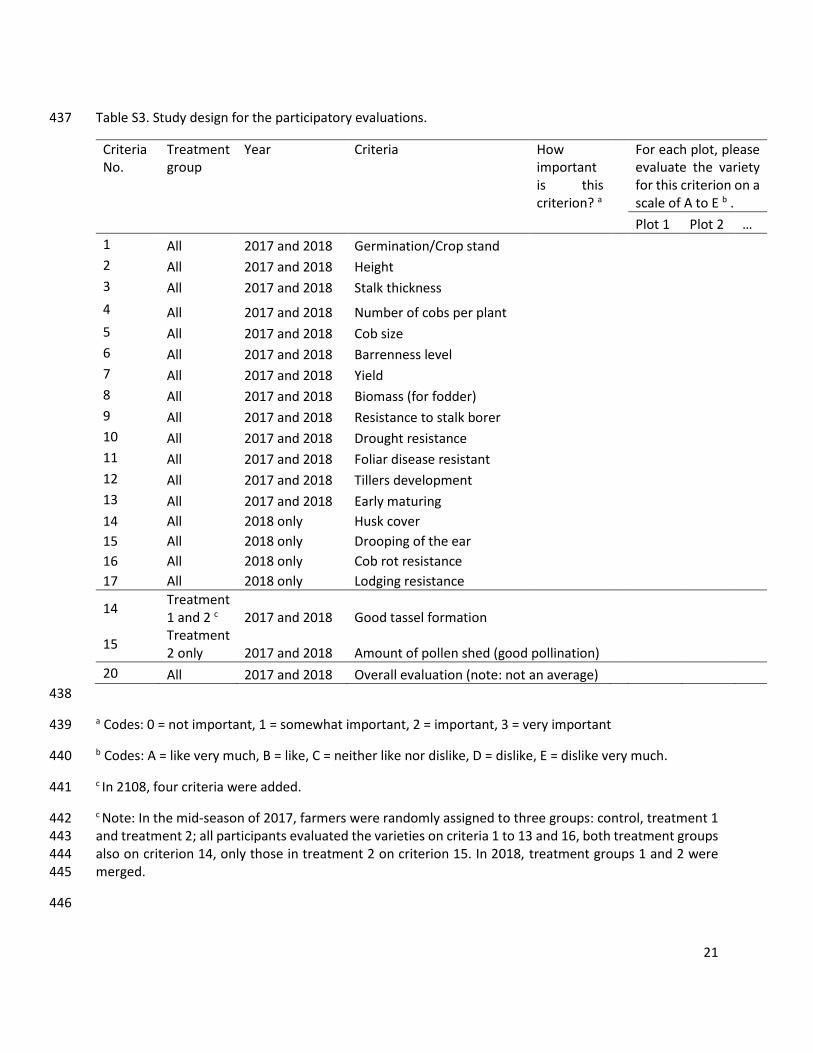
technologies or varieties on those criteria. Criteria during the first year were set and, based on discussions 350
with farmers, four more criteria were added in 2018 (Table S3) (De Groote et al. 2005). To confirm the 351
importance of these criteria to the participants of this study, we asked them, individually, to give these a 352
score for importance (0 = not important, 1 = somewhat important, 2 = important, 3 = very important) 353
(Table S3). 354
355
15
Participants were asked to evaluate the different entries on these criteria. In 2017, they evaluated the 356
eight entries and two reps, so all 16 plots in total. In 2018 there were 16 entries and the participants only 357
evaluated one of the two reps each, randomly assigned. To score the entries, they used a 5-point hedonic 358
scale, following previous experience (De Groote et al. 2010). Experience has shown that using numbers 359
for the scores can be confusing, as “1” can indicate both a very good or a very poor score. Therefore, letter 360
scores were used, which correspond to the Kenyan school system and hence are easy for farmers to 361
understand. The options were A (like very much), B (like), C (neither like nor dislike), D (dislike), E (dislike 362
very much) (Worku et al. 2020). In 2017, farmers were randomly assigned to the control (without 363
evaluations of tassel or pollen), treatment 1 (including the criterion "good tassel formation"), or treatment 364
2 (including both the tassel criterion and the criterion "amount of pollen shed"). As the results of 2017 365
indicated treatments 1 and 2 were very similar, they were merged in 2018, with only one treatment group, 366
whose members evaluated the entries on tassel and pollen. All criteria were expressed in both English 367
and Kiswahili on the questionnaire, the national languages in Kenya. In the different counties, depending 368
on the situation, the criteria were translated into local languages. 369
370
To analyze the scores, the alphabetical scores were converted to numerical scores (from A = 5 to E = 1), 371
mean scores were calculated for all criteria and the mean scores for FNP and PP hybrids compared through 372
pairwise t-test. 373
374
Impact assessment 375
To estimate maize area and production in SSA we used the FAOSTAT data from 2018 which include 50 376
countries) with an area of 37.55 M ha a production of 70.51 M tonnes and an average yield of 1.92 tonnes 377
t/ha 1. For levels of adoption of improved maize varieties and hybrids we searched the literature and found 378
data from the top 25 countries (De Groote et al. 2015; Hassan et al. 2001; Abate et al. 2017; Dao et al. 379
2017; Feed the Future, 2016; Smale et al. 2011; Timothy et al. 1988). These 25 countries, including all 380
countries with a maize area of more than 100 kha (except for Burundi and South Sudan) (Table S4 in 381
supplementary material) plant 36.6 M ha (97.4% of maize area in SSA) with a production of 70.4 M t. 382
Multiplying adoption rates of improved maize varieties by country with their 2018 maize area 1, resulted 383
in an estimated total area in improved maize varieties of 19.3 M ha (52.6%). Similarly, multiplying the % 384
in hybrids for each country with the maize area lead to an estimated area planted in hybrids in these 385
countries at 12.6 M ha (34%). The yield benefit for each country was estimated using the regression from 386
16
Figure 1 (Δy=0.006x + 180.2). The weighted average (for the 25 countries with adoption figures, and area 387
in hybrids used as weight) comes to 193 kg ha-1. 388
389
To compare the benefits to the cost, we use the following project performance parameters: net present 390
value (NPV), internal rate of return (IRR) and benefit cost ratio (BCR) (Gittner, 1982) (Table S5). The cost 391
of the development of the technology is estimated by the annual cost of the FNP project, US$ 1million per 392
year from 2010 to 2016 and US$ 1.6 million from 2017 to 2020. For the future, we expect the further 393
development cost to be about $1.25 million per year from 2021 to 2024, after which the cost will gradually 394
reduce from $0.8 million in 2025 to 0.1 in 2028. For the benefits, we assume the technology to be on the 395
market in 2023, and to take 10 years to reach the target 10% adoption (market penetration of FNP hybrids 396
as a percentage of hybrid seed), keeping maize production constant. 397
398
Acknowledgments 399
This work was supported by the Bill & Melinda Gates Foundation project Seed Production Technology for 400
Africa (grant number OPP1137722), and the CGIAR Research Program on Maize (MAIZE). The CGIAR 401
Research Program MAIZE receives W1&W2 support from the Governments of Australia, Belgium, Canada, 402
China, France, India, Japan, Korea, Mexico, Netherlands, New Zealand, Norway, Sweden, Switzerland, 403
U.K., U.S., and the World Bank. We also recognize broad contributions of CIMMYT, Corteva Agriscience, 404
KALRO and ARC as collaborators in the project. We acknowledge our colleagues at the research stations, 405
farmers and extension agents in Kenya, South Africa and Zimbabwe who conducted yield trials. 406
407
Author Contributions 408
MO led and conceptualised the study with inputs from SC, JEC and MA. EH, JEC, DL, KM led the field trials. 409
HDG and MN led the farmer preference study. All authors contributed to interpretation of the results and 410
manuscript revisions. 411
412
Competing Interests 413
All authors declare that they have no known competing financial interests or personal relationships that 414
could have appeared to influence the work reported in this paper. 415
416
Materials and Correspondence 417

17
Correspondence to M Olsen 418
419
18
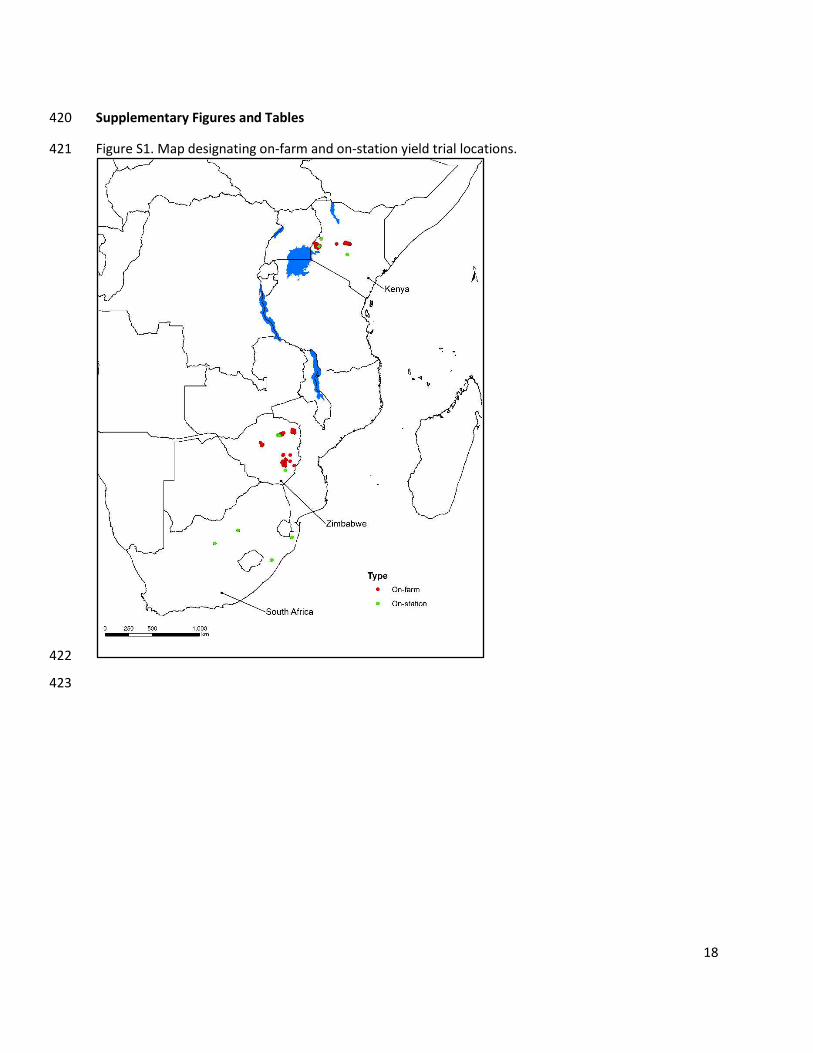
Supplementary Figures and Tables 420
Figure S1. Map designating on-farm and on-station yield trial locations.421
422
423
19
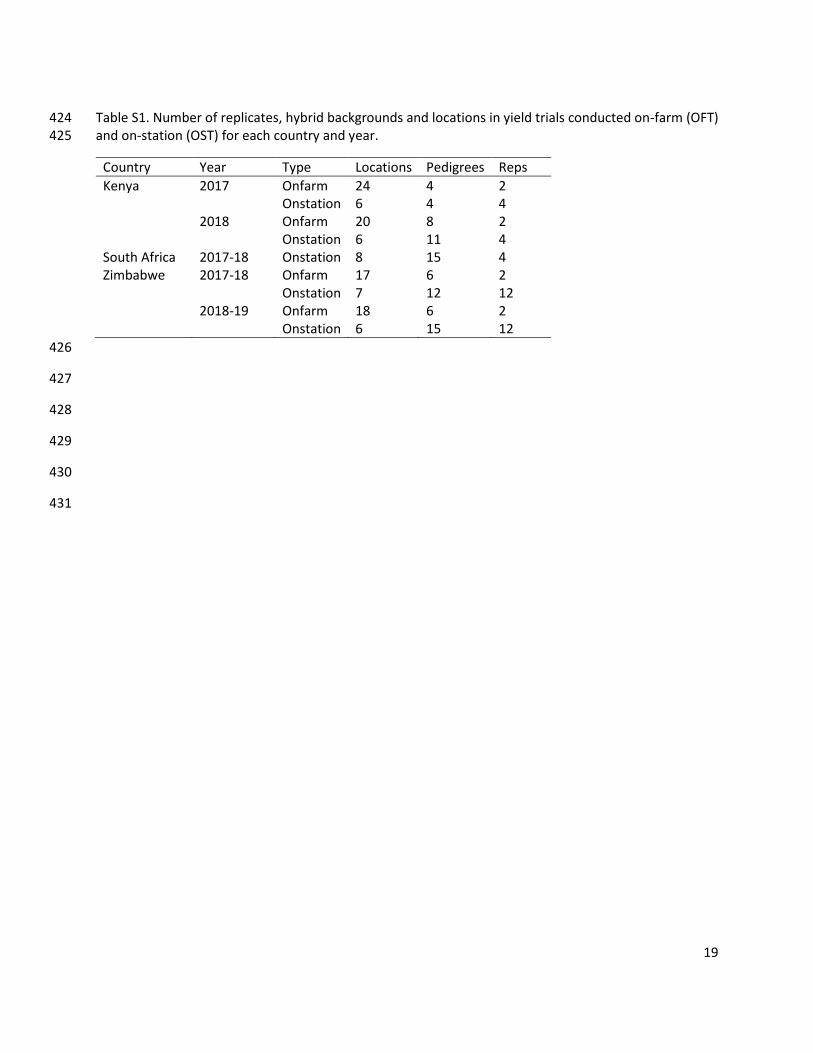
Table S1. Number of replicates, hybrid backgrounds and locations in yield trials conducted on-farm (OFT) 424
and on-station (OST) for each country and year. 425
Country Year Type Locations Pedigrees Reps
Kenya 2017 Onfarm 24 4 2
Onstation 6 4 4
2018 Onfarm 20 8 2
Onstation 6 11 4
South Africa 2017-18 Onstation 8 15 4
Zimbabwe 2017-18 Onfarm 17 6 2
Onstation 7 12 12
2018-19 Onfarm 18 6 2
Onstation 6 15 12
426
427
428
429
430
431
20
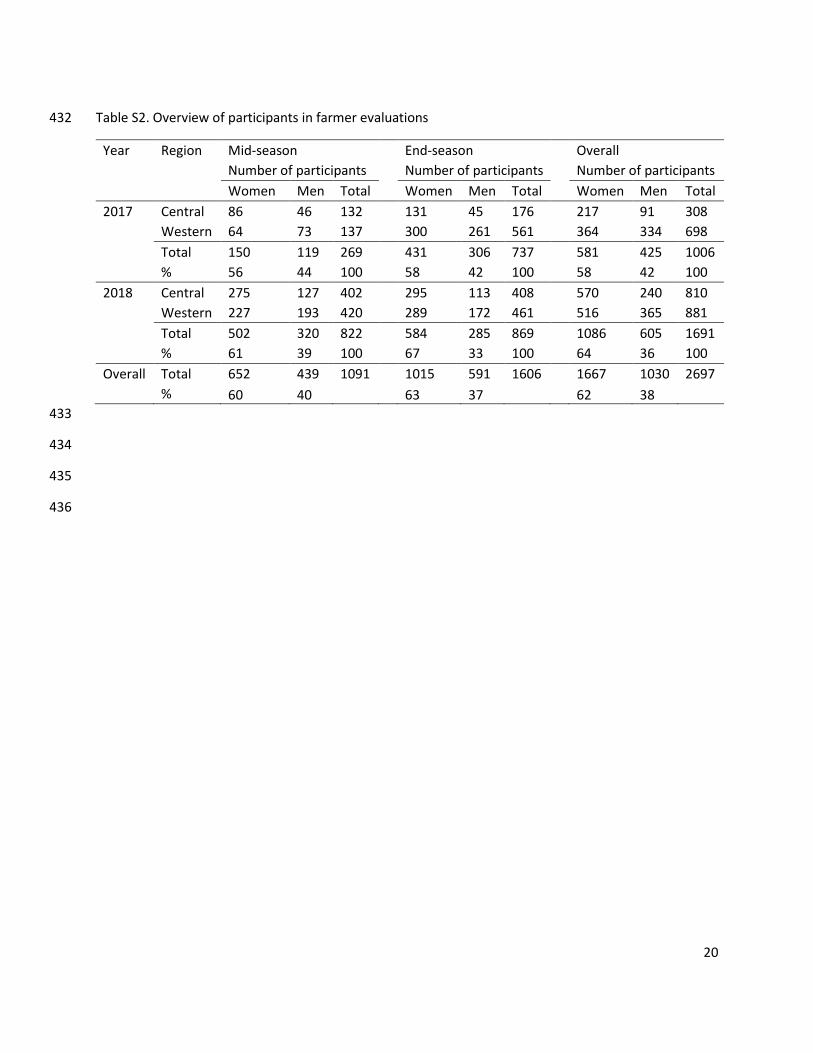
Table S2. Overview of participants in farmer evaluations 432
Year Region Mid-season End-season Overall
Number of participants Number of participants Number of participants
Women Men Total Women Men Total Women Men Total
2017 Central 86 46 132 131 45 176 217 91 308
Western 64 73 137 300 261 561 364 334 698
Total 150 119 269 431 306 737 581 425 1006 % 56 44 100 58 42 100 58 42 100
2018 Central 275 127 402 295 113 408 570 240 810
Western 227 193 420 289 172 461 516 365 881
Total 502 320 822 584 285 869 1086 605 1691 % 61 39 100 67 33 100 64 36 100
Overall Total 652 439 1091 1015 591 1606 1667 1030 2697
% 60 40 63 37 62 38
433
434
435
436
21
Table S3. Study design for the participatory evaluations. 437
Criteria
No.
Treatment
group
Year Criteria How
important
is this
criterion? a
For each plot, please
evaluate the variety
for this criterion on a
scale of A to E b .
Plot 1 Plot 2 …
1 All 2017 and 2018 Germination/Crop stand
2 All 2017 and 2018 Height
3 All 2017 and 2018 Stalk thickness
4 All 2017 and 2018 Number of cobs per plant
5 All 2017 and 2018 Cob size
6 All 2017 and 2018 Barrenness level
7 All 2017 and 2018 Yield
8 All 2017 and 2018 Biomass (for fodder)
9 All 2017 and 2018 Resistance to stalk borer
10 All 2017 and 2018 Drought resistance
11 All 2017 and 2018 Foliar disease resistant 12 All 2017 and 2018 Tillers development 13 All 2017 and 2018 Early maturing 14 All 2018 only Husk cover 15 All 2018 only Drooping of the ear 16 All 2018 only Cob rot resistance 17 All 2018 only Lodging resistance
14 Treatment
1 and 2 c 2017 and 2018 Good tassel formation
15 Treatment
2 only 2017 and 2018 Amount of pollen shed (good pollination)
20 All 2017 and 2018 Overall evaluation (note: not an average)
438
a Codes: 0 = not important, 1 = somewhat important, 2 = important, 3 = very important 439
b Codes: A = like very much, B = like, C = neither like nor dislike, D = dislike, E = dislike very much. 440
c In 2108, four criteria were added. 441
c Note: In the mid-season of 2017, farmers were randomly assigned to three groups: control, treatment 1 442
and treatment 2; all participants evaluated the varieties on criteria 1 to 13 and 16, both treatment groups 443
also on criterion 14, only those in treatment 2 on criterion 15. In 2018, treatment groups 1 and 2 were 444
merged. 445
446
22
Table S4. Expected benefits of fifty-percent non-pollen producing (FNP) in terms of yield, production and 447
economic gain (25 top producing maize countries, including all with 128,000 ha or above). Benefits 448
estimated using a 10% adoption rate of FNP hybrids. 449
Country
Area
harveste
d (1000
ha)
Yield
(kg ha-
1)
Hybrid
adoption
rate (%
rea)
Yield
gain (kg
ha-1)
Area in
FNP (ha)
Productio
n gain
(tonnes)
Economic
gain (US$
1000)
FNP
seed
needed
(tonnes
)
Nigeria 4,853 10,155 11.6 192.8 56,299 10,852 1,784 1,407
United
Republic of
Tanzania 4,101 5,987 40.2 189 164,843 31,149 5,121 4,121
Democratic
Republic of
Congo 2,680 2,078 9.6 184.9 25,611 4,734 778 640
Angola 2,655 2,271 4.1 185.3 10,884 2,017 332 272
South Africa 2,319 12,510 87.5 212.6 202,899 43,130 7,091 5,072
Ethiopia 2,236 7,360 66 200 147,568 29,506 4,851 3,689
Kenya 2,142 4,014 65 191.4 139,213 26,652 4,382 3,480
Mozambique 1,827 1,654 24.9 185.6 45,484 8,442 1,388 1,137
Malawi 1,685 2,698 65.7 189.8 110,727 21,017 3,455 2,768
Cameroon 1,316 2,345 52.2 190.9 68,737 13,121 2,157 1,718
Zimbabwe 1,191 730 95.4 183.9 113,662 20,900 3,436 2,842
Ghana 1,184 2,306 3.1 191.9 3,672 705 116 92
Benin 1,158 1,510 0 188 Uganda 1,131 2,964 37.6 195.9 42,524 8,332 1,370 1,063
Mali 1,129 3,625 0 199.5 Zamboa 1,086 2,395 61.5 193.4 66,789 12,919 2,124 1,670
Burkina Faso 1,019 1,700 3.8 190.2 38,76 737 121 97
Togo 715 887 0.5 187.6 368 69 11 9
Guinea 611 819 6.9 188.2 4,211 793 130 105
Cote d'Ivoire 473 1,006 34.4 193 16,275 3,140 516 407
Chad 342 438 44.6 187.9 15,244 2,864 471 381
Rwanda 296 410 22.4 188.5 6,625 1,249 205 166
Senegal 180 264 10 189 1,791 338 56 45
Madagascar 129 215 0 190.2 Lesotho 128 100 65.1 184.9 8,313 1,537 253 208
Total top 25 70,441 34.3 191.8 1,255,614 244,204 40,147 31,390
Total sub-Saharan Africa 71,430
450
451
23
Table S5. Benefit to cost ratio for Seed Production Technology for Africa investment assuming 10% 452
adoption rate in 10 years. 453
Year Year
Cost
(1000
USD)
Benefit
(1000 USD)
Present value
(2020 1000
USD)
Costs discounted
(2020 1000 USD)
Benefits discounted
(2020 1000 USD)
2010 -11 1000 -2853 2853.1 2011 -10 1000 -2594 2593.7 2012 -9 1000 -2358 2357.9 2013 -8 1000 -2144 2143.6 2014 -7 1000 -1949 1948.7 2015 -6 1000 -1772 1771.6 2016 -5 1000 -1611 1610.5 2017 -4 1600 -2343 2342.6 2018 -3 1600 -2130 2129.6 2019 -2 1600 -1936 1936 2020 -1 1600 -1760 1760 2021 0 1250 -1250 1250 2022 1 1250 -1136 1136.4 2023 2 1250 4005 2277 1033.1 3310
2024 3 1250 8010 5079 989.1 6018
2025 4 800 12015 7660 546.4 8206
2026 5 500 16020 9637 310.5 9947
2027 6 300 20025 11134 169.3 11303
2028 7 100 24030 12280 51.3 12331
2029 8 28035 13078 13078
2030 9 32040 13588 13588
2031 10 36045 13897 13897
2032 11 40050 14037 14037
2033 12 40050 12761 12761
2034 13 40050 11601 11601
2035 14 40050 10546 10546
2036 15 40050 9588 9588
2037 16 40050 8716 8716
2038 17 40050 7924 7924
2039 18 40050 7203 7203
2040 19 40050 6548 6548
Net present value (NPV) 151719 28883 180603
Internal rate of return (IRR) 0.24 Benefits 180603 Costs 28883 BCR 6.25

24