Embed Size (px)
Citation preview
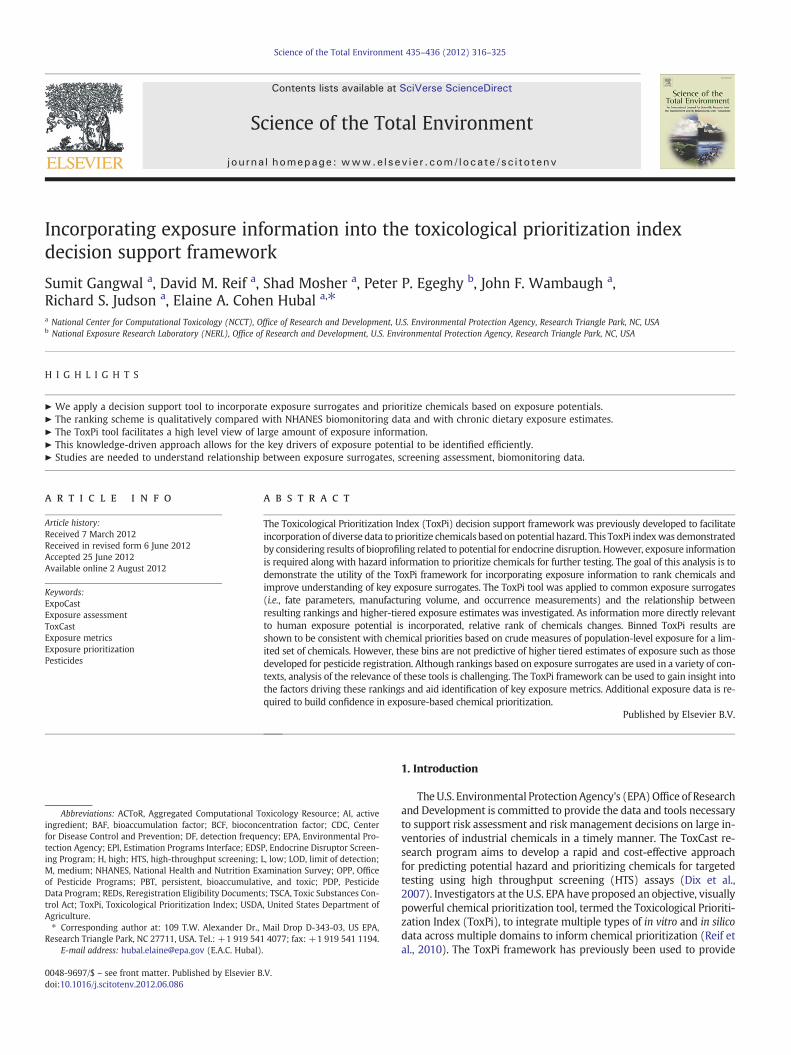
Science of the Total Environment 435–436 (2012) 316–325
Contents lists available at SciVerse ScienceDirect
Science of the Total Environment
j ourna l homepage: www.e lsev ie r .com/ locate /sc i totenv
Incorporating exposure information into the toxicological prioritization indexdecision support framework
Sumit Gangwal a, David M. Reif a, Shad Mosher a, Peter P. Egeghy b, John F. Wambaugh a,Richard S. Judson a, Elaine A. Cohen Hubal a,⁎a National Center for Computational Toxicology (NCCT), Office of Research and Development, U.S. Environmental Protection Agency, Research Triangle Park, NC, USAb National Exposure Research Laboratory (NERL), Office of Research and Development, U.S. Environmental Protection Agency, Research Triangle Park, NC, USA
H I G H L I G H T S
► We apply a decision support tool to incorporate exposure surrogates and prioritize chemicals based on exposure potentials.► The ranking scheme is qualitatively compared with NHANES biomonitoring data and with chronic dietary exposure estimates.► The ToxPi tool facilitates a high level view of large amount of exposure information.► This knowledge-driven approach allows for the key drivers of exposure potential to be identified efficiently.► Studies are needed to understand relationship between exposure surrogates, screening assessment, biomonitoring data.
Abbreviations: ACToR, Aggregated Computational Tingredient; BAF, bioaccumulation factor; BCF, bioconcfor Disease Control and Prevention; DF, detection frequtection Agency; EPI, Estimation Programs Interface; EDSing Program; H, high; HTS, high-throughput screening;M, medium; NHANES, National Health and Nutrition Exof Pesticide Programs; PBT, persistent, bioaccumulatiData Program; REDs, Reregistration Eligibility Documenttrol Act; ToxPi, Toxicological Prioritization Index; USDAAgriculture.⁎ Corresponding author at: 109 T.W. Alexander Dr.,
Research Triangle Park, NC 27711, USA. Tel.: +1 919 54E-mail address: [email protected] (E.A.C. Hubal)
0048-9697/$ – see front matter. Published by Elsevier Bdoi:10.1016/j.scitotenv.2012.06.086
a b s t r a c t
a r t i c l e i n f oArticle history:Received 7 March 2012Received in revised form 6 June 2012Accepted 25 June 2012Available online 2 August 2012
Keywords:ExpoCastExposure assessmentToxCastExposure metricsExposure prioritizationPesticides
The Toxicological Prioritization Index (ToxPi) decision support framework was previously developed to facilitateincorporation of diverse data to prioritize chemicals basedon potential hazard. This ToxPi indexwas demonstratedby considering results of bioprofiling related to potential for endocrine disruption. However, exposure informationis required along with hazard information to prioritize chemicals for further testing. The goal of this analysis is todemonstrate the utility of the ToxPi framework for incorporating exposure information to rank chemicals andimprove understanding of key exposure surrogates. The ToxPi tool was applied to common exposure surrogates(i.e., fate parameters, manufacturing volume, and occurrence measurements) and the relationship betweenresulting rankings and higher-tiered exposure estimates was investigated. As information more directly relevantto human exposure potential is incorporated, relative rank of chemicals changes. Binned ToxPi results areshown to be consistent with chemical priorities based on crude measures of population-level exposure for a lim-ited set of chemicals. However, these bins are not predictive of higher tiered estimates of exposure such as thosedeveloped for pesticide registration. Although rankings based on exposure surrogates are used in a variety of con-texts, analysis of the relevance of these tools is challenging. The ToxPi framework can be used to gain insight intothe factors driving these rankings and aid identification of key exposure metrics. Additional exposure data is re-quired to build confidence in exposure-based chemical prioritization.
Published by Elsevier B.V.
oxicology Resource; AI, activeentration factor; CDC, Centerency; EPA, Environmental Pro-P, Endocrine Disruptor Screen-L, low; LOD, limit of detection;amination Survey; OPP, Officeve, and toxic; PDP, Pesticides; TSCA, Toxic Substances Con-, United States Department of
Mail Drop D-343-03, US EPA,1 4077; fax: +1 919 541 1194..
.V.
1. Introduction
TheU.S. Environmental Protection Agency's (EPA) Office of Researchand Development is committed to provide the data and tools necessaryto support risk assessment and risk management decisions on large in-ventories of industrial chemicals in a timely manner. The ToxCast re-search program aims to develop a rapid and cost-effective approachfor predicting potential hazard and prioritizing chemicals for targetedtesting using high throughput screening (HTS) assays (Dix et al.,2007). Investigators at the U.S. EPA have proposed an objective, visuallypowerful chemical prioritization tool, termed the Toxicological Prioriti-zation Index (ToxPi), to integrate multiple types of in vitro and in silicodata across multiple domains to inform chemical prioritization (Reif etal., 2010). The ToxPi framework has previously been used to provide
317S. Gangwal et al. / Science of the Total Environment 435–436 (2012) 316–325
chemical rankings based on data domains having putative endocrinerelevance including a subset of ToxCast in vitro assay data, chemicalproperties and disease and biological pathway information. The ToxPitool is amenable to integration of additional relevant data beyond haz-ard potential to enhance the ability to effectively screen compounds forrisk (Reif et al., 2010).
Population and individual-level human exposure data complementhazard data in determining a chemical's ultimate risk profile. Suchdata alsomay play a key role in guiding, interpreting and using informa-tion produced by novel HTS toxicity testing programs (NRC, 2007).Alongside the new toxicity testing approaches, theU.S. EPA is also devel-oping novel approaches and tools as part of the ExpoCast project forscreening, evaluating and classifying chemicals, based on the potentialfor biologically-relevant human exposure (Cohen Hubal, 2009; CohenHubal et al., 2010). Information from ExpoCast is being combined withinformation from ToxCast to aid in chemical and nanomaterial prioriti-zation based on potential risk to human health (Gangwal et al., 2011).A key aspect of ExpoCast is the development of appropriate exposuremetrics to augment the often putative surrogates currently being usedto represent exposure for rapid prioritization and efficient screening.
A number of prioritization schemes have been developed by govern-ment agencies and private industries for ranking environmental con-taminants (NRC, 1999). The assessment of exposure in most of theseprioritization schemes is typically based on three surrogates of exposure:(1) quantity produced or released; (2) persistence, bioaccumulation po-tential, and/or mobility, and (3) quantity or frequency of occurrence inthe environment (NRC, 1999). Health Canada used a tiered system to cat-egorize industrial chemicals based on potential exposure for further riskevaluation; relying on production volume, number of producers, and usecategories for thefirst tier, and consumer use scenarios, chemical proper-ties, and bioavailability for the second tier (Health Canada, 2005; Meekand Armstrong, 2007). Under the Toxic Substances Control Act (TSCA,1976), EPA has also relied on additional surrogates, including chemicalrelease, product formulation, use category, and physical and chemicalproperties. Recently, 2034 substances were evaluated according to haz-ard and exposure criteria for a European framework directive (Daginnuset al., 2010) based on total production volume, use index, persistenceand bioaccumulation. Despite the common use of these surrogates, therelationship between exposure surrogates and results of more detailedexposure assessments is notwell understood. In addition, there is uncer-tainty associated with prioritization results based on these surrogatesfor relevance to potential human exposure.
In the first phase of ToxCast, compounds profiled in the HTS assayswere primarily food-use pesticide active ingredients (AI). Due to regis-tration requirements, significant in vivo toxicity data are available forthese compounds. In addition, registrants have provided exposure esti-mates for many of these pesticides based on a tiered assessment proto-col. As a result, these chemicals may provide insight into key surrogatesdriving exposure-based ranking that could be applied to inform futureassessments of data limited industrial compounds. Here, we evaluatethe utility of the ToxPi framework for: (1) incorporating diverse expo-sure informationwith hazard data to compare chemicals; (2) providingknowledge-driven understanding of how key exposure surrogates im-pact chemical rankings; and (3) binning chemicals of concern basedon exposure potential for further risk-based analyses.
2. Methods and data
2.1. General approach
The ToxCast Phase I chemical list was used as the basis for this anal-ysis. Exposure surrogates were selected based on historical use of met-rics and on availability of data. The metrics evaluated include the threeexposure potential determinants commonly used for exposure prioriti-zation: environmental fate parameters (persistence, bioaccumulation/bioconcentration factors (BAF/BCF)), agricultural use amount (as a
surrogate for manufacturing volume), and fruit and vegetable residuedata (as a surrogate for occurrence in environmental media).
Data were transformed, normalized, and incorporated into the ToxPidecision support framework, which provides a dimensionless indexscore for each chemical. The index score incorporates all exposure poten-tial metrics and is described in detail below. Visually, ToxPi is represent-ed as component slices of a unit circle, with each slice representing onepiece (or related pieces) of information (Reif et al, 2010). For each slice,distance from the origin is proportional to the normalized value of thecomponent data points comprising that slice, and the width indicatesthe relativeweight of that slice in the overall ToxPi calculation. Chemicalswere ranked and visualized using ToxPi to facilitate knowledge-drivenexploration of exposure surrogates. To better understand the relation-ship between the simple surrogates of exposure potential (environmen-tal fate parameters, etc.) and higher tiers of exposure information, ToxPirankings were binned (to high,medium and low priority) and evaluatedfor consistency with detection frequency of corresponding biologicalmarkers in the National Health and Nutrition Examination Survey(NHANES) and with exposure limits provided in the EPA Office of Pesti-cide Programs Reregistration Eligibility Documents (REDs).
2.2. Environmental fate parameter data
Environmental fate parameters for all 309 ToxCast Phase I chemicalsincluding BCF, BAF, chemical half life in air and water, and overall per-sistence time were obtained from EPA's Estimation Programs Interface(EPI Suite v4.0), a Windows-based suite of physical chemical propertyand environmental fate estimation programs (U.S. EPA, 2007; U.S.EPA, 2011a). Chemical half lives in soil and sediment were not used asthese values are merely multiples of the half life in water. BCF is empir-ically determined or estimated from log Kow and BAF is obtained by theArnot–Gobas model (Arnot and Gobas, 2003). Half life in air is based onestimated hydroxyl radical and ozone rate constants provided by theAOPWIN programwithin EPI Suite, and the half life inwater value is de-termined using the ultimate biodegradation expert surveymodel of theBIOWIN program. Overall persistence is calculated using the Level III fu-gacity model within EPI Suite by predicting partitioning of a chemicalbetween air, soil, sediment and water assuming steady-state but notequilibrium conditions.
2.3. Agricultural use data
Manufacturing volumes for many of the ToxCast Phase I chemicalsare not readily available. Based on querying EPA's Aggregated Computa-tional Toxicology Resource (ACToR) to find potential chemical risks tohuman health and the environment (http://actor.epa.gov database ver-sion actor_2010q4a, accessed on August 30, 2011; Judson et al., 2008,2012), only 49 out of 309 chemicals have production and import volumeinformation from the EPA Inventory Update Reporting (IUR) program(for four-year reporting periods from 1986 to 2006) or the High Produc-tion Volume Information Systems. Agricultural pesticide use for 220 ofthe 309 chemicals was obtained from EPA's Office of Pesticide Programs(OPP), and used as a surrogate for manufacturing volume. Estimates ofthe quantity of agricultural use of each active ingredient on over 50crop types at a national level is collected in Agro Trak, a proprietary data-base maintained by the private market research firm GfK Kynetec. Thedatabase does not include information on non-agricultural home andgarden use, which was not available andmay introduce bias into the in-terpretation of the results. The reported pounds of AI applied per year(agricultural use) from 1998 to 2008 were summed over 11 years.
2.4. Fruit and vegetable residue data
Fruit and vegetable pesticide residue data for 156 of the 309 ToxCastPhase I compoundswas obtained from theU.S. Department of Agriculture(USDA) Pesticide Data Program (PDP) 2008 summary report (USDA,
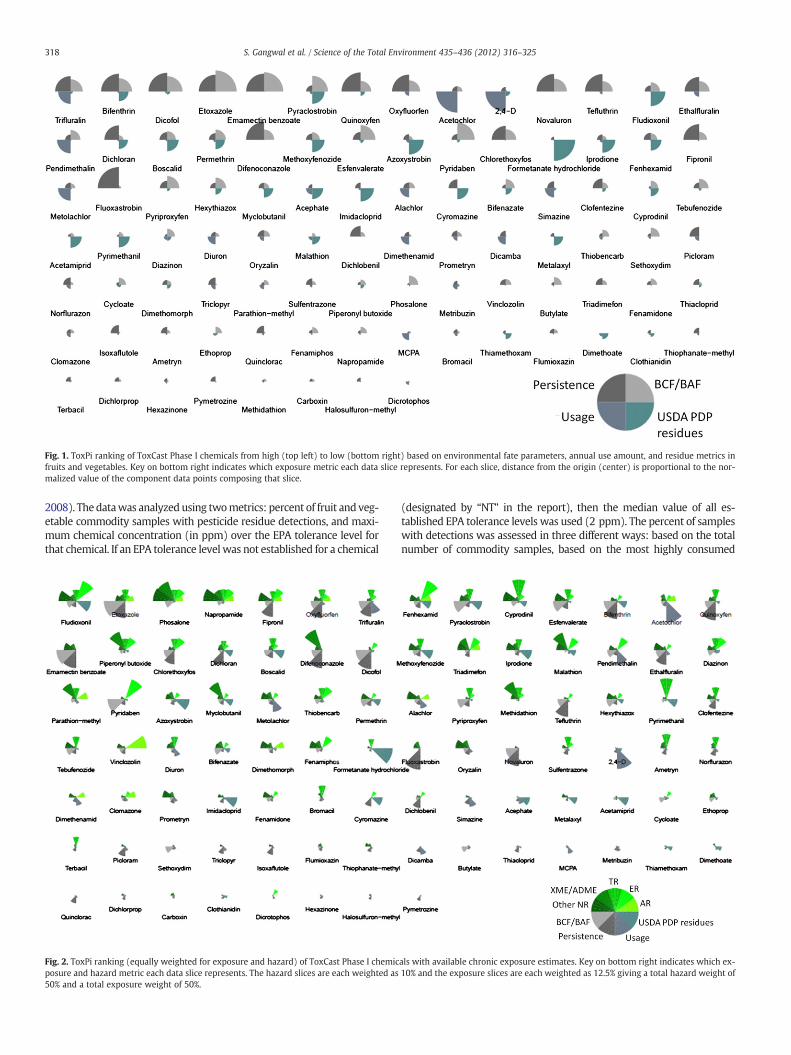
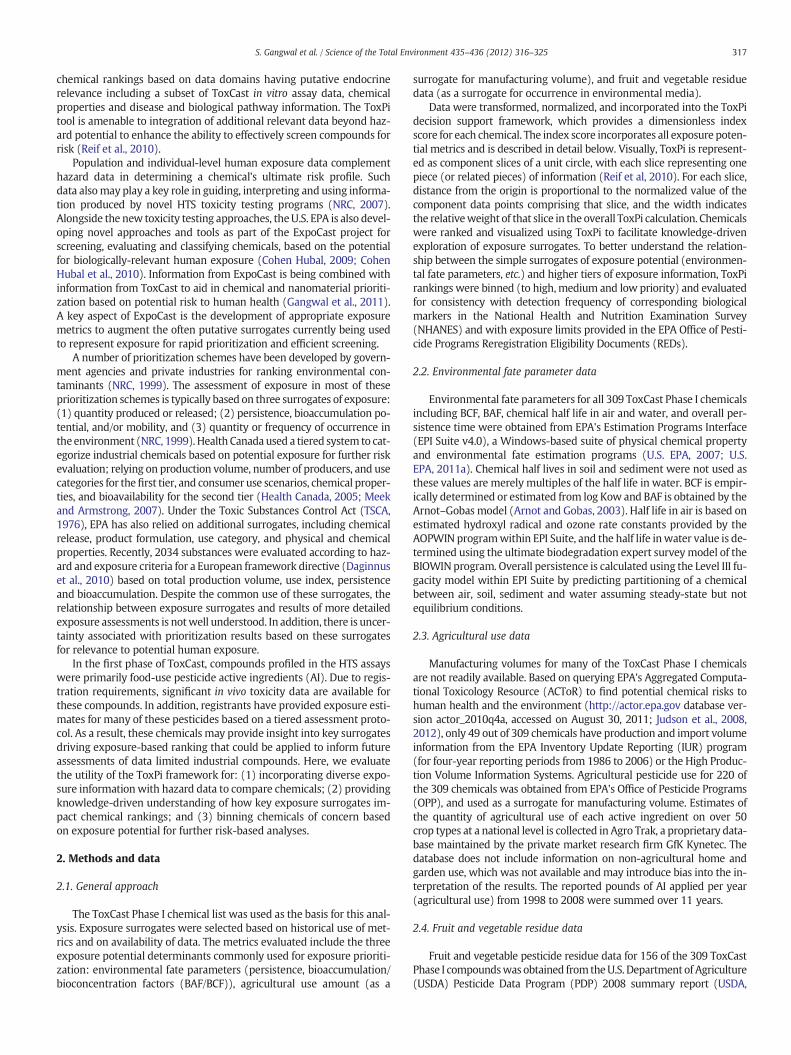
Fig. 1. ToxPi ranking of ToxCast Phase I chemicals from high (top left) to low (bottom right) based on environmental fate parameters, annual use amount, and residue metrics infruits and vegetables. Key on bottom right indicates which exposure metric each data slice represents. For each slice, distance from the origin (center) is proportional to the nor-malized value of the component data points composing that slice.
318 S. Gangwal et al. / Science of the Total Environment 435–436 (2012) 316–325
2008). The datawas analyzed using twometrics: percent of fruit and veg-etable commodity samples with pesticide residue detections, and maxi-mum chemical concentration (in ppm) over the EPA tolerance level forthat chemical. If an EPA tolerance level was not established for a chemical
Fig. 2. ToxPi ranking (equally weighted for exposure and hazard) of ToxCast Phase I chemicposure and hazard metric each data slice represents. The hazard slices are each weighted as50% and a total exposure weight of 50%.
(designated by “NT” in the report), then the median value of all es-tablished EPA tolerance levels was used (2 ppm). The percent of sampleswith detections was assessed in three different ways: based on the totalnumber of commodity samples, based on the most highly consumed
als with available chronic exposure estimates. Key on bottom right indicates which ex-10% and the exposure slices are each weighted as 12.5% giving a total hazard weight of
319S. Gangwal et al. / Science of the Total Environment 435–436 (2012) 316–325
fruits and vegetables per capita, and based on themost highly consumedfruits and vegetables by infants and toddlers. The Exposure Factors Hand-book was used to identify the top fruits and vegetables consumed percapita and by infants/toddlers (US EPA, 2011b).
2.5. Data transformation, normalization and combination for ToxPiframework
A ToxPi score is a weighted combination of discrete data sourcesto represent a formalized, rational integration of information fromdifferent domains. Data sets are transformed, normalized and combinedaccording to the methodology described in Reif et al. (2010). Briefly,each individual chemical data set was transformed (i.e., convertedusing log10, square root, fourth root, or other operator) to allow thesets to be integrated within the ToxPi framework. The operator for thedata transform was chosen to produce a distribution skewed to theright (confirmed visually with a histogram), allowing for chemicalswith large values to be highlighted. For example, BCF was transformedas log10(BCF), summed agricultural use data as ag_use0.5, etc. The datasets were then normalized to values between 0 and 1. This allowedcombination of disparate data into the ToxPi framework with the fol-lowing slices: bioaccumulation/concentration (using BCF and BAF), per-sistence (using half life air, half life water, persistence time), use (usingsummed agricultural application quantity), and USA PDP residue occur-rence (using percent of fruits and vegetable samples with detects [total,top consumed per capita, top consumed by infants/toddlers] and maxi-mum residue concentration over EPA Tolerance level).
2.6. REDs chronic exposure estimates
Exposure estimates were extracted from available EPA Office of Pes-ticide Programsdocuments and Federal Register notices and are provid-ed in Wetmore et al. (2012). The exposure assessments are conductedfor pesticide registration using a tiered approach and are based on thedietary pathway. The exposure estimates extracted for this analysiswere developed using data collected from 1994 to 2010 depending onthe chemical (see Supplemental Table 7 of Wetmore et al., 2012.) Themajority of these estimates came from Reregistration Eligibility Docu-ments (REDs) that contained residue levels and estimated aggregate ex-posures from food and/or drinking water sources organized by variousage groups and subpopulations including: general U.S. population, chil-dren (agesb1 year, 1–2 years, 3–5 years, 1–6 years, 6–12 years), youth(aged 13–19 years), adults (20–49 years and 50+ years), and females(aged 13–49 years). The group/subpopulation with the highest chronicoral exposure estimate was considered.
Tier one chronic exposure estimates are based on labeled maxi-mum application rates, tolerance-level residues of a pesticide, and la-beledminimum pre-harvest intervals (PHIs). This tier is considered tobe conservative since residues will likely be less than the tolerancelevel at the point of consumption. Tier two is typically based on actualpercent crop treated (rather than 100% crop treated) and residues atthe tolerance levels. Higher tier (tiers three and four) exposure esti-mates may involve probabilistic techniques (i.e., Monte Carlo analysesfor acute assessment), often incorporating processing factors (e.g.,washing, cooking data), degradation data (for stored commodities),market basket survey information, and other information that allowsthe U.S. EPA's OPP to more fully consider likely distributions of resi-due values. Information to identify the analysis tier used by
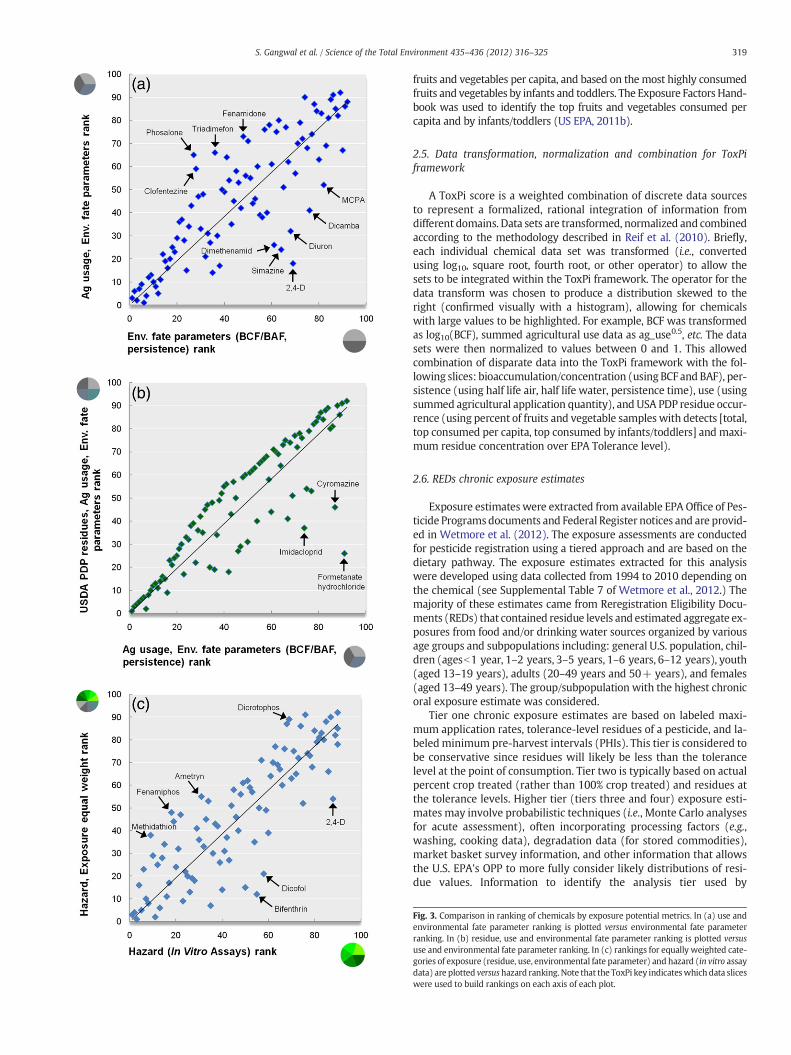
Fig. 3. Comparison in ranking of chemicals by exposure potential metrics. In (a) use andenvironmental fate parameter ranking is plotted versus environmental fate parameterranking. In (b) residue, use and environmental fate parameter ranking is plotted versususe and environmental fate parameter ranking. In (c) rankings for equally weighted cate-gories of exposure (residue, use, environmental fate parameter) and hazard (in vitro assaydata) are plotted versushazard ranking.Note that the ToxPi key indicateswhich data sliceswere used to build rankings on each axis of each plot.
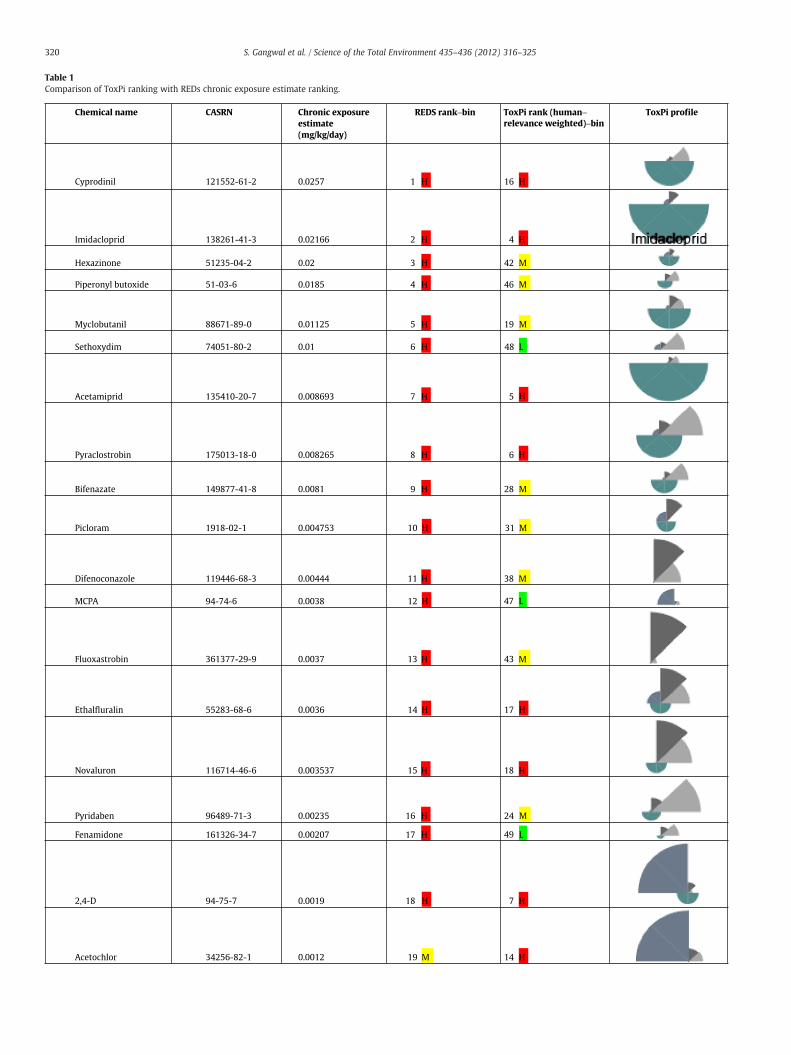
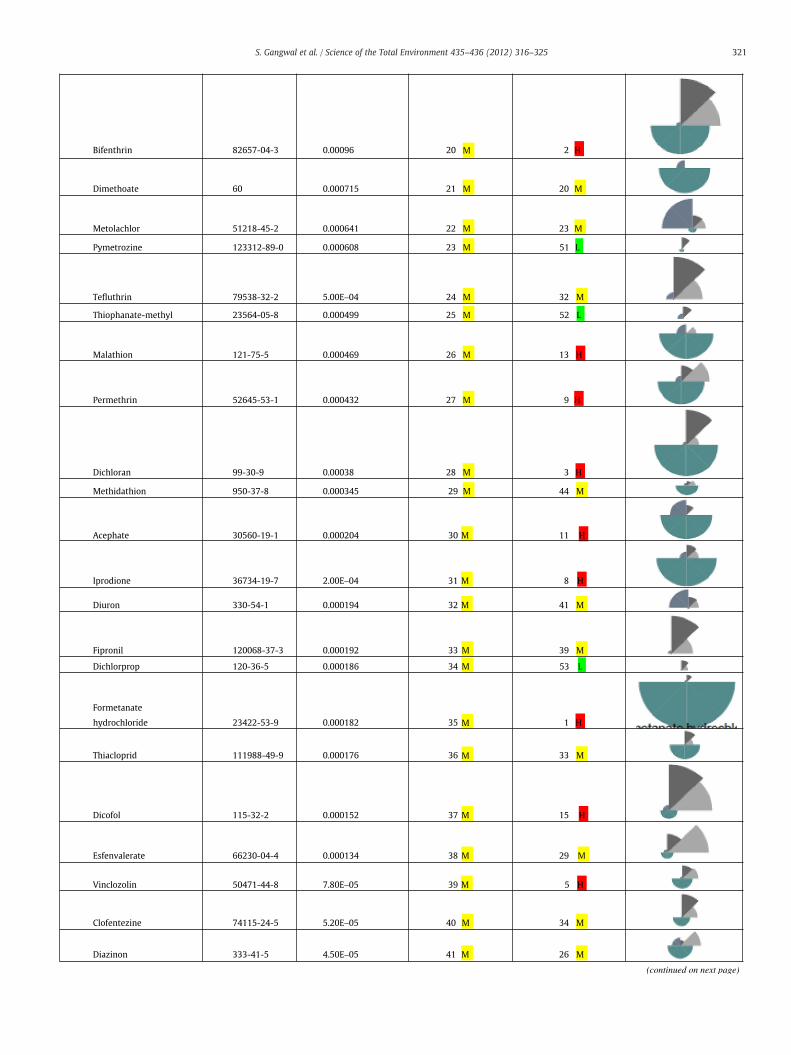
Table 1Comparison of ToxPi ranking with REDs chronic exposure estimate ranking.
Chemical name CASRN Chronic exposure
estimate
(mg/kg/day)
REDS rank−bin ToxPi rank (human−
relevance weighted)−bin
ToxPi profile
Cyprodinil 121552-61-2 0.0257 1 H 16 H
Imidacloprid 138261-41-3 0.02166 2 H 4 H
Hexazinone 51235-04-2 0.02 3 H 42 M
Piperonyl butoxide 51-03-6 0.0185 4 H 46 M
Myclobutanil 88671-89-0 0.01125 5 H 19 M
Sethoxydim 74051-80-2 0.01 6 H 48 L
Acetamiprid 135410-20-7 0.008693 7 H 5 H
Pyraclostrobin 175013-18-0 0.008265 8 H 6 H
Bifenazate 149877-41-8 0.0081 9 H 28 M
Picloram 1918-02-1 0.004753 10 H 31 M
Difenoconazole 119446-68-3 0.00444 11 H 38 M
MCPA 94-74-6 0.0038 12 H 47 L
Fluoxastrobin 361377-29-9 0.0037 13 H 43 M
Ethalfluralin 55283-68-6 0.0036 14 H 17 H
Novaluron 116714-46-6 0.003537 15 H 18 H
Pyridaben 96489-71-3 0.00235 16 H 24 M
Fenamidone 161326-34-7 0.00207 17 H 49 L
2,4-D 94-75-7 0.0019 18 H 7 H
Acetochlor 34256-82-1 0.0012 19 M 14 H
320 S. Gangwal et al. / Science of the Total Environment 435–436 (2012) 316–325
Dimethoate 60 0.000715 21 M
M
20 M
Metolachlor 51218-45-2 0.000641 22 M 23 M
Pymetrozine 123312-89-0 0.000608 23 M 51 L
Tefluthrin 79538-32-2 5.00E−04 24 M 32 M
Thiophanate-methyl 23564-05-8 0.000499 25 M 52 L
Malathion 121-75-5 0.000469 26 M 13 H
H
Permethrin 52645-53-1 0.000432 27 M 9 H
Dichloran 99-30-9 0.00038 28 M 3 H
Methidathion 950-37-8 0.000345 29 M 44 M
Acephate 30560-19-1 0.000204 30 M 11 H
Iprodione 36734-19-7 2.00E−04 31 M 8 H
Diuron 330-54-1 0.000194 32 M 41 M
Fipronil 120068-37-3 0.000192 33 M 39 M
Dichlorprop 120-36-5 0.000186 34 M 53 L
Formetanate
hydrochloride 23422-53-9 0.000182 35 M 1 H
Thiacloprid 111988-49-9 0.000176 36 M 33 M
Dicofol 115-32-2 0.000152 37 M 15 H
Esfenvalerate 66230-04-4 0.000134 38 M 29 M
Vinclozolin 50471-44-8 7.80E−05 39 M 5 H
Clofentezine 74115-24-5 5.20E−05 40 M 34 M
Diazinon 333-41-5 4.50E−05 41 M 26 M
Bifenthrin 82657-04-3 0.00096 20 2
(continued on next page)
321S. Gangwal et al. / Science of the Total Environment 435–436 (2012) 316–325
Emamectin benzoate 155569-91-8 2.55E−05 42 M 25 M
Oryzalin 19044-88-3 2.40E−05 43 M 27 M
Isoxaflutole 141112-29-0 2.00E−05 44 M 22 M
Ametryn 834-12-8 1.80E−05 45 M 36 M
Oxyfluorfen 42874-03-3 1.20E−05 46 M 12 H
Parathion-methyl 298-00-0 2.00E−06 47.5 L 30 M
Phosalone 2310-17-0 2.00E−06 47.5 L 50 L
Dicrotophos 141-66-2 1.00E−06 50 L 45 M
Ethoprop 13194-48-4 1.00E−06 50 L 40 M
Fenamiphos 22224-92-6 1.00E−06 50 L 37 M
Chlorethoxyfos 54593-83-8 6.00E−07 52 L 21 M
Simazine 122-34-9 0 53 L 10 H
Chemical name CASRN Chronic exposure
estimate
(mg/kg/day)
REDS rank−bin ToxPi rank (human−
relevance weighted)−bin
ToxPi profile
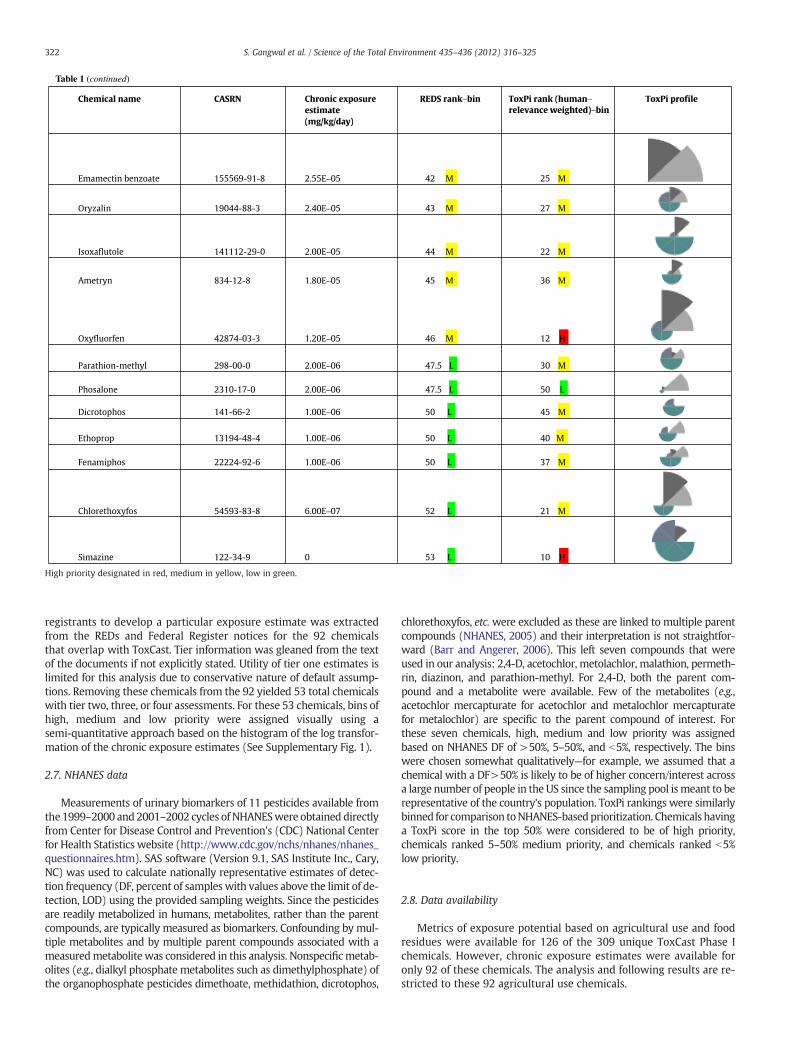
Table 1 (continued)
High priority designated in red, medium in yellow, low in green.
322 S. Gangwal et al. / Science of the Total Environment 435–436 (2012) 316–325
registrants to develop a particular exposure estimate was extractedfrom the REDs and Federal Register notices for the 92 chemicalsthat overlap with ToxCast. Tier information was gleaned from the textof the documents if not explicitly stated. Utility of tier one estimates islimited for this analysis due to conservative nature of default assump-tions. Removing these chemicals from the 92 yielded 53 total chemicalswith tier two, three, or four assessments. For these 53 chemicals, bins ofhigh, medium and low priority were assigned visually using asemi-quantitative approach based on the histogram of the log transfor-mation of the chronic exposure estimates (See Supplementary Fig. 1).
2.7. NHANES data
Measurements of urinary biomarkers of 11 pesticides available fromthe1999–2000 and 2001–2002 cycles of NHANESwere obtained directlyfrom Center for Disease Control and Prevention's (CDC) National Centerfor Health Statistics website (http://www.cdc.gov/nchs/nhanes/nhanes_questionnaires.htm). SAS software (Version 9.1, SAS Institute Inc., Cary,NC) was used to calculate nationally representative estimates of detec-tion frequency (DF, percent of samples with values above the limit of de-tection, LOD) using the provided sampling weights. Since the pesticidesare readily metabolized in humans, metabolites, rather than the parentcompounds, are typically measured as biomarkers. Confounding by mul-tiple metabolites and by multiple parent compounds associated with ameasuredmetabolite was considered in this analysis. Nonspecificmetab-olites (e.g., dialkyl phosphate metabolites such as dimethylphosphate) ofthe organophosphate pesticides dimethoate, methidathion, dicrotophos,
chlorethoxyfos, etc.were excluded as these are linked to multiple parentcompounds (NHANES, 2005) and their interpretation is not straightfor-ward (Barr and Angerer, 2006). This left seven compounds that wereused in our analysis: 2,4-D, acetochlor, metolachlor, malathion, permeth-rin, diazinon, and parathion-methyl. For 2,4-D, both the parent com-pound and a metabolite were available. Few of the metabolites (e.g.,acetochlor mercapturate for acetochlor and metalochlor mercapturatefor metalochlor) are specific to the parent compound of interest. Forthese seven chemicals, high, medium and low priority was assignedbased on NHANES DF of >50%, 5–50%, and b5%, respectively. The binswere chosen somewhat qualitatively—for example, we assumed that achemical with a DF>50% is likely to be of higher concern/interest acrossa large number of people in the US since the sampling pool ismeant to berepresentative of the country's population. ToxPi rankings were similarlybinned for comparison toNHANES-basedprioritization. Chemicals havinga ToxPi score in the top 50% were considered to be of high priority,chemicals ranked 5–50% medium priority, and chemicals ranked b5%low priority.
2.8. Data availability
Metrics of exposure potential based on agricultural use and foodresidues were available for 126 of the 309 unique ToxCast Phase Ichemicals. However, chronic exposure estimates were available foronly 92 of these chemicals. The analysis and following results are re-stricted to these 92 agricultural use chemicals.
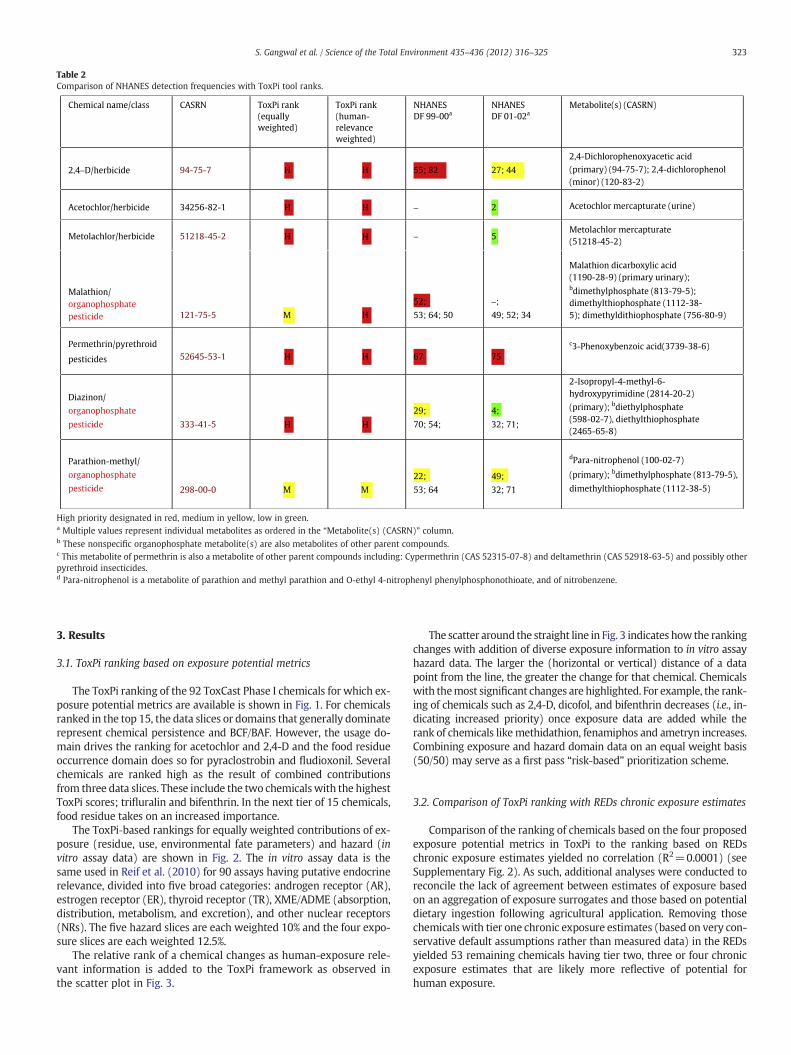
Table 2Comparison of NHANES detection frequencies with ToxPi tool ranks.
Chemical name/class CASRN ToxPi rank
(equally
weighted)
ToxPi rank
(human-
relevance
weighted)
NHANES
DF 99-00a
NHANES
DF 01-02a
Metabolite(s) (CASRN)
2,4−D/herbicide 94-75-7 H H 55; 82 27; 44
2,4-Dichlorophenoxyacetic acid
(primary) (94-75-7); 2,4-dichlorophenol
Acetochlor/herbicide 34256-82-1 H H 2 Acetochlor mercapturate (urine)
Metolachlor/herbicide 51218-45-2 H H − 5Metolachlor mercapturate
(51218-45-2)
Malathion/
organophosphate
pesticide 121-75-5 M H
52;
53; 64; 50
−;
49; 52; 34
Malathion dicarboxylic acid
(1190-28-9) (primary urinary);bdimethylphosphate (813-79-5);
dimethylthiophosphate (1112-38-
5); dimethyldithiophosphate (756-80-9)
Permethrin/pyrethroid
pesticides 52645-53-1 H H 67 75
c3-Phenoxybenzoic acid(3739-38-6)
Diazinon/
organophosphate
pesticide 333-41-5 H H
29;
70; 54;
4;
32; 71;
2-Isopropyl-4-methyl-6-
hydroxypyrimidine (2814-20-2)
(primary); bdiethylphosphate
(598-02-7), diethylthiophosphate
(2465-65-8)
Parathion-methyl/
organophosphate
pesticide 298-00-0 M M
22;
53; 64
49;
32; 71
dPara-nitrophenol (100-02-7)
(primary); bdimethylphosphate (813-79-5),
dimethylthiophosphate (1112-38-5)
−
(minor) (120-83-2)
High priority designated in red, medium in yellow, low in green.a Multiple values represent individual metabolites as ordered in the “Metabolite(s) (CASRN)” column.b These nonspecific organophosphate metabolite(s) are also metabolites of other parent compounds.c This metabolite of permethrin is also a metabolite of other parent compounds including: Cypermethrin (CAS 52315-07-8) and deltamethrin (CAS 52918-63-5) and possibly otherpyrethroid insecticides.d Para-nitrophenol is a metabolite of parathion and methyl parathion and O-ethyl 4-nitrophenyl phenylphosphonothioate, and of nitrobenzene.
323S. Gangwal et al. / Science of the Total Environment 435–436 (2012) 316–325
3. Results
3.1. ToxPi ranking based on exposure potential metrics
The ToxPi ranking of the 92 ToxCast Phase I chemicals for which ex-posure potential metrics are available is shown in Fig. 1. For chemicalsranked in the top 15, the data slices or domains that generally dominaterepresent chemical persistence and BCF/BAF. However, the usage do-main drives the ranking for acetochlor and 2,4-D and the food residueoccurrence domain does so for pyraclostrobin and fludioxonil. Severalchemicals are ranked high as the result of combined contributionsfrom three data slices. These include the two chemicalswith the highestToxPi scores; trifluralin and bifenthrin. In the next tier of 15 chemicals,food residue takes on an increased importance.
The ToxPi‐based rankings for equally weighted contributions of ex-posure (residue, use, environmental fate parameters) and hazard (invitro assay data) are shown in Fig. 2. The in vitro assay data is thesame used in Reif et al. (2010) for 90 assays having putative endocrinerelevance, divided into five broad categories: androgen receptor (AR),estrogen receptor (ER), thyroid receptor (TR), XME/ADME (absorption,distribution, metabolism, and excretion), and other nuclear receptors(NRs). The five hazard slices are each weighted 10% and the four expo-sure slices are each weighted 12.5%.
The relative rank of a chemical changes as human-exposure rele-vant information is added to the ToxPi framework as observed inthe scatter plot in Fig. 3.
The scatter around the straight line in Fig. 3 indicates how the rankingchanges with addition of diverse exposure information to in vitro assayhazard data. The larger the (horizontal or vertical) distance of a datapoint from the line, the greater the change for that chemical. Chemicalswith themost significant changes are highlighted. For example, the rank-ing of chemicals such as 2,4-D, dicofol, and bifenthrin decreases (i.e., in-dicating increased priority) once exposure data are added while therank of chemicals likemethidathion, fenamiphos and ametryn increases.Combining exposure and hazard domain data on an equal weight basis(50/50) may serve as a first pass “risk-based” prioritization scheme.
3.2. Comparison of ToxPi ranking with REDs chronic exposure estimates
Comparison of the ranking of chemicals based on the four proposedexposure potential metrics in ToxPi to the ranking based on REDschronic exposure estimates yielded no correlation (R2=0.0001) (seeSupplementary Fig. 2). As such, additional analyses were conducted toreconcile the lack of agreement between estimates of exposure basedon an aggregation of exposure surrogates and those based on potentialdietary ingestion following agricultural application. Removing thosechemicals with tier one chronic exposure estimates (based on very con-servative default assumptions rather than measured data) in the REDsyielded 53 remaining chemicals having tier two, three or four chronicexposure estimates that are likely more reflective of potential forhuman exposure.
324 S. Gangwal et al. / Science of the Total Environment 435–436 (2012) 316–325
We also considered alternative approaches for weighting contribu-tions of the exposure surrogates to the overall ToxPi ranking (i.e.,adjusting relative weights of the ToxPi domains or slices) to reflect amore realistic understanding of determinants of exposure. First, an at-tempt was made to use REDs exposure estimates to inform ToxPiweights. Here, weights were adjusted and resulting ToxPi-based binswere correlated to REDs-based bins. Due to the semiquantitative andsparse nature of these data sets, optimal weights could not be deter-mined. For equallyweighteddomains of all four components (as plottedin Fig. 1), the Spearman's rank correlation had a p-value of 0.707 (indi-cating no correlation). Optimization of the metric weights conductedvia the Nelder–Mead simplex method, resulted in optimized weightsof 96% residues, 3%, persistence, 1% bioaccumulation, and 0.07% use,however the correlation p-value remained nearly identical (0.7046).
Contributions of the ToxPi domains were then adjusted to be moreconsistent with potential human relevance of associated exposure in-formation. Based on the chemical source-to-dose continuum (CohenHubal et al., 2000), we assumed that chemical residue concentrationsfound on fruits and vegetables may better reflect potential for humanexposure to the general population than does total agricultural use.Further, we assumed that agricultural use may be a more directly rel-evant human-exposure-potential metric than the environmental fateparameters, particularly for this set of pesticide active ingredients. Asa result, the fate parameters (BCF/BAF and persistence) slices wereeach weighted as 12.5%, the agricultural use as 25%, and the residueamount as 50%. The ToxPi ranking based on this human-relevanceweighting scheme is presented in Supplementary Fig. 3.
We further binned chemicals to facilitate comparison of the human-relevance weighted ToxPi-based ranking with the REDs-based ranking.The tier two, three and four chemicals are listed in Table 1 with theREDs chronic exposure estimate (mg/kg/day), human-relevance weight-ed ToxPi rank and visual profile. The list is sorted by chronic exposure es-timate from high to low. The chemicals are binned as high, medium andlow priority based on the log transformation of the chronic exposure esti-mates (See Supplementary Fig. 1). The ToxPi ranks based on exposuremetrics are also binned with chemicals ranked 1–18 set as high priority,chemicals ranked 19–46 as medium priority, and chemicals ranked47–53 as low priority. Comparing the “REDs rank-bin” with the “ToxPirank-bin” column in Table 1, it can be observed that the high, mediumand low bins based on the ToxPi rank are spread throughout the REDsrank chronic exposure estimate bins. The inter-rater agreement betweenREDs- and ToxPi-derived bins of high, medium and low was assessedusing theweighted kappa coefficient availablewith SAS software (version9.3, SAS Institute Inc., Cary, NC, USA). It is generally accepted that a valueof 0.75 or above reflects excellent agreement, a value of less than 0.4 indi-cates poor agreement, and a value of 0 suggests only chance agreement(Fleiss, 1981). The weighted kappa coefficient of agreement betweenREDs- and ToxPi-derived bins of high, medium and low was 0.034 (95%confidence interval−0.17 to 0.24) indicating poor agreement.
Each individual data component that was incorporated into theToxPi framework slices were further binned and compared to REDs-based bins. Supplementary Fig. 4 shows the number of correctly priori-tized chemicals for each of the data components based on high,mediumand low priority bins for the 53 ToxCast chemicals. Each individual datacomponent predicted a similar amount of chemicals by bins. The fewestnumber of chemicals correctly predicted was for the agricultural usedata component at 19, whereas the highest number correctly predictedwas 28 for the residue on fruits and vegetables component.
3.3. Comparison of ToxPi with frequency of detection in NHANES
Further investigation is needed to understand whether or not rank-ings based on simple exposure potential metrics prioritize chemicalsconsistent with real-world chemical exposure. A significant issue isthe lack of easily interpretable, quantitative exposure data sets acrossmany chemicals and many individuals. NHANES provides the best
such data set today, although it is not directly comparable with the ex-posure rankings provided here, as will be discussed further. Levels ofenvironmental chemicals in human biological fluids available throughthe NHANES program can be used to check that the exposure prioritiza-tions based on exposure potential metrics are qualitatively consistent.The detection frequency (DF) of chemicals in NHANES blood serumand urine samples may serve as a crude but important indicator thatthe general U.S. population aged 6–59 years is being exposed to partic-ular chemicals and can be used to inform the prioritization of chemicals.This approach is complicated however by a lack of specificity of themeasured metabolites, differences in the pharmacokinetic characteris-tics of the pesticides, and spatial and temporal variability in use patternsand human activity patterns in relation to these chemicals.
Results of the comparison between the prioritization based onNHANES detection frequency and that based on the ToxPi ranking forthe seven chemicals that have data across all domains are presentedin Table 2.
Six out of these 7 chemicals have human-relevance weighted ToxPirankings of high priority. Since chemicals are selected for measurementin NHANES due to public health risk concerns, the high ToxPi priorityranking for these chemicals is qualitatively consistent with the prioriti-zation efforts in NHANES.
4. Discussion
4.1. Limitations and future research
Here, we have applied the ToxPi decision support tool to incorporatesimple exposure surrogates to informprioritization of chemicals based onhuman exposure potential. The prioritization scheme has been qualita-tively compared with NHANES biomonitoring data and further withchronic dietary exposure estimates based on tiered exposure assessment.A goal in development of a useful exposure-based prioritization schemeis to incorporate key aspects of “exposure space” through surrogates ofthese elements that can be efficiently measured or estimated. Elementsof an exposure space include physicochemical properties, product char-acteristics, emissions characteristics, pathways, and receptor characteris-tics (Egeghy et al, 2011). As noted previously, the incorporated metricswere selected based on historical use to evaluate exposure potentialand on availability of data. As such, there are important limitations tothe coverage of exposure space provided by these metrics. In particular,exposure pathways (e.g. routes of exposure) as well as receptor charac-teristics (e.g., activity patterns) were captured only superficially.
Using detection frequencies from NHANES to check consistency ofprioritization approaches has important limitations. DFs represent ameasure of potential exposure at the population level, but these donot equal direct chemical exposure. The limits of detection (LOD) varyacross chemicals. As a result, assignment to bins may be an artifact ofdifferences in these limits rather than a function of exposure. The DFsmay also change over timedue to improvements in analytical chemistrytechniques (resulting in changes in LOD), leading to assignment to dif-ferent bins based on particular NHANES cycle.
Certainly amore quantitative treatment of theNHANESdatawould bedesirable, i.e. reconstruction of the timing andmagnitude (mg/kg BW) ofthe exposures leading to products observed in urine of NHANES subjects.NHANES levels are an integrated result of exposure and kinetics, which isnot incorporated into the current ToxPi analysis, but we are developingexperimental and modeling approaches that will allow for this addition(Wetmore et al., 2012). For limited numbers of chemicals where the ab-sorption, distribution, metabolism and elimination – pharmacokinetics –of compounds are all well known, reverse dosimetry can be used to backcalculate the exposure implied by the presence of compounds in urine(Clewell et al., 2008). Unfortunately, few NHANES chemicals have suffi-cient pharmacokinetic data available, preventing comparison to prioriti-zations of large numbers of chemicals. With simplifying assumptions,including total absorption and steady-state exposure (amount in urine
325S. Gangwal et al. / Science of the Total Environment 435–436 (2012) 316–325
is constant and equal to a constant exposure) urine concentrations can, insome cases, be converted to parent exposures (Lakind and Naiman,2008). However, since many urine compounds monitored by NHANESare metabolites that potentially result from multiple different parentcompound exposures, this steady-state approach requires large numbersof unknown relationships between parent exposures and products mon-itored in urine. The NHANES detection frequencies allowed evaluation ofthe ToxPi analysis without requiring the development of new pharmaco-kinetic analyses for large numbers of chemicals.
Interpretation of the REDs exposure estimates presented additionalchallenges. The chronic exposure estimates are based on dietary and/ordrinking water media for the highest subpopulation, which is a conser-vative exposure estimate approach. Limiting to tiers three and fourcould improve utility of these values for modeling and comparison pur-poses. However, information in the REDs did not allow this distinction.Additional limitations of the semiquantitative analysis described hereinclude approaches used to weigh data domains in ToxPi as well asto select bins for prioritization. Clearly, more quantitative approachescould be applied given higher quality data. Further, the exposure surro-gate data is not necessarily from the same time period as the REDs data,which may impact the results of our analysis.
Nevertheless, even these semiquantitative approaches provide in-sight into the factors driving exposure potential for any given com-pound and could be adjusted based on the objectives of a particularprioritization or decision making exercise. Future research should beconducted using data-rich compounds to optimize ToxPi weighting toaddress particular prioritization and risk assessment questions. Forexample, prioritization of chemicals based on potential for near-fieldand/or indoor environment exposures could include ToxPi domainsfor chemical levels in house dust and indoor air of residential environ-ments. By evaluating for consistency against biomonitoring conductedon subjects residing in those environments, more directly human rele-vant surrogates for exposure might be developed that could be extrap-olated for prioritization of data poor compounds.
5. Conclusion
Application of the ToxPi decision support approach to evaluate expo-sure potential facilitates a high level viewof large amounts of information,semi-quantitative analysis of the value of available exposure surrogatesfor comparing chemicals, and efficient identification of chemicals of con-cern. By using this type of knowledge-driven approach, key drivers for ex-posure potential can be identified and resources focused on the mostsignificant gaps in understanding measurement data. The ToxPi platformprovides context for incorporation of exposure data alongwith hazard in-formation into chemical prioritization schemes as well as for the applica-tion and further development of exposure models. In general, however,the analyses conducted here for relatively data rich compounds demon-strate the need for further studies to understand the relationship betweensimple exposure surrogates, tiered screening-level exposure assessments,and population-level biomonitoring data. Capturing the complex source-to-dose system in an efficient prioritization schemewill require selectionand development of metrics and surrogates that can confidently be usedto predict key elements of exposure space.
Competing interests
The authors declare that they have no competing interests.
Disclaimer
The views expressed in this article are those of the authors and donot necessarily reflect the views or policies of the U.S. EPA. Mention oftrade names or commercial products does not constitute endorse-ment or recommendation for use.
Acknowledgments
We thank Drs. Katherine Stebbins and Jack Housenger (U.S. EPAOffice of Pesticide Programs) for sharing the agricultural use informa-tion on ToxCast chemicals. We thank Dr. Jon Sobus (U.S. EPA) for his in-sightful review.
Appendix A. Supplementary data
Supplementary data to this article can be found online at http://dx.doi.org/10.1016/j.scitotenv.2012.06.086.
References
Arnot JA, Gobas FAPC. A generic QSAR for assessing the bioaccumulation potential oforganic chemicals in aquatic food webs. QSAR Comb Sci 2003;22:337–45.
Barr DB, Angerer J. Potential uses of biomonitoring data: a case study using the organophos-phorus pesticides chlorpyrifos and malathion. Environ Health Perspect 2006;114(11):1763–9.
Clewell HJ, Tan YM, Campbell JL, Andersen ME. Quantitative interpretation of humanbiomonitoring data. Toxicol Appl Pharmacol 2008;23(1):122–33.
Cohen Hubal EA, Sheldon LS, Zufall MJ, Burke JM, Thomas KW. The challenge ofassessing children's residential exposure to pesticides. J Exposure Anal EnvironEpidemiol 2000;10(6):638–49.
Cohen Hubal EA. Biologically relevant exposure science for 21st century toxicity test-ing. Toxicol Sci 2009;111(2):226–32.
Cohen Hubal EA, Richard A, Aylward L, Edwards S, Gallagher J, Goldsmith MR, et al.Advancing exposure characterization for chemical evaluation and risk assessment. JToxicol Environ Health B 2010;13(2–4):299–313.
Daginnus K, Gottardo S, Paya-Perez A, Whitehouse P, Wilikinson H, Zaldivar JM. Amodel-based prioritisation exercise for the European water framework directive.Int J Environ Res Public Health 2010;8(2):435–55.
Dix DJ, Houck KA,MartinMT, Richard AM, Setzer RW, Kavlock RJ. The ToxCast program forprioritizing toxicity testing of environmental chemicals. Toxicol Sci 2007;95(1):5-12.
Egeghy PP, Judson R, Gangwal S, Mosher S, Smith D, Vail J, et al. The exposure data land-scape for manufactured chemicals. Sci Total Environ 2011. http://dx.doi.org/10.1016/j.scitotenv.2011.10.046. [Available online 20 November].
Fleiss JL. Statistical methods for rates and proportions. 2nd ed. New York: Wiley; 1981.p. 212–34.
Gangwal S, Brown JS, Wang A, Houck KA, Dix DJ, Kavlock RJ, et al. Informing selection ofnanomaterial concentrations for ToxCast in vitro testing based on occupational ex-posure potential. Environ Health Perspect 2011.
Health Canada. A proposal for priority setting for existing substances on the domesticsubstances list under the Canadian Environmental Protection Act, 1999, greatestpotential for human exposure. Available from: http://www.hc-sc.gc.ca/ewh-semt/pubs/contaminants/exposure/index-eng.php2005.
Judson R, Richard A, Dix D, Houck K, Elloumi F, Martin M, et al. ACToR—aggregatedcomputational toxicology resource. Toxicol Appl Pharmacol 2008;233(1):7-13.
Judson RS, Martin MT, Egeghy P, Gangwal S, Reif DM, Kothiya P, et al. Aggregating datafor computational toxicology applications: the U.S. Environmental ProtectionAgency (EPA) Aggregated Computational Toxicology Resource (ACToR) system.Int J Mol Sci 2012;13:1805–31.
Lakind JS, Naiman DQ. Bisphenol A (BPA) daily intakes in the United States: estimatesfrom the 2003–2004 NHANES urinary BPA data. J Expo Sci Environ Epidemiol2008;18:608–15.
MeekME, Armstrong VC. In: Leeuwen CJV, Vermeire TG, editors. The assessment and man-agement of industrial chemicals in Canada risk assessment of chemicals. Netherlands:Springer; 2007. p. 591–621.
NHANES. Department of Health and Human Services Centers for Disease Control and Pre-vention. Third national report on human exposure to environmental chemicals; 2005.
NRC (National Research Council of the National Academies). Review of existing chem-ical prioritization schemes. Setting priorities for drinking water contaminants.Washington, DC: The National Academies Press; 1999. p. 21–46.. 2.
NRC (National Research Council of theNational Academies). Toxicity testing in the 21st cen-tury: a vision and a strategy. Washington, DC: The National Academies Press; 2007.
Reif DM, Martin MT, Tan SW, Houck KA, Judson RS, Richard AM, et al. Endocrine profil-ing and prioritization of environmental chemicals using ToxCast data. EnvironHealth Perspect 2010;118(12):1714–20.
TSCA (Toxic Substances Control Act of 1976). 15 USC §2601 et seq. Public Law; 1976.p. 94-469.
U.S. EPA. http://www.epa.gov/sab/pdf/sab-07-011.pdfEPA-SAB-07-011 Science AdvisoryBoard (SAB) review of the estimation programs interface suite (EPI SuiteTM); 2007.
U.S. EPA. reference: http://www.epa.gov/opptintr/exposure/pubs/episuite.htm 2011a.(accessed March 5, 2010).
U.S. EPA. Exposure factors handbook 2011 edition (final). Washington, DC: U.S. Envi-ronmental Protection Agency; 2011b. EPA/600/R-09/052F.
USDA. USDA pesticide data program annual summary, calendar year 2008. http://www.ams.usda.gov/AMSv1.0/pdp 2008. [accessed September 16, 2010].
Wetmore BA,Wambaugh JF, Ferguson SS, SochaskiMA, Rotroff DM, Freeman K, et al. Inte-gration of dosimetry, human exposure and high-throughput screening data in thetoxicity assessment of environmental chemicals. Toxicol Sci 2012;125(1):157–74.