Embed Size (px)
Citation preview

Incorporating a Microbiome Aim: What You Should Know for a Successful ProposalMIRANDA KROEHL, PHD
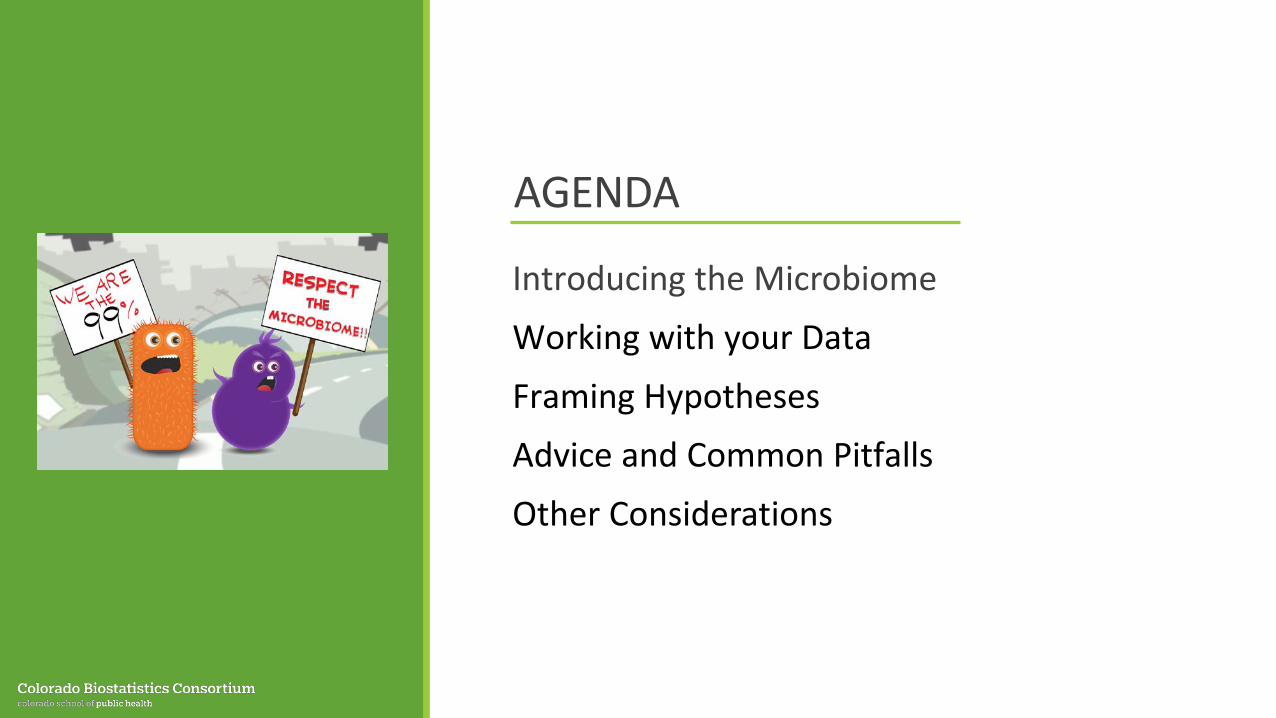
AGENDA
Introducing the Microbiome
Working with your Data
Framing HypothesesAdvice and Common Pitfalls
Other Considerations
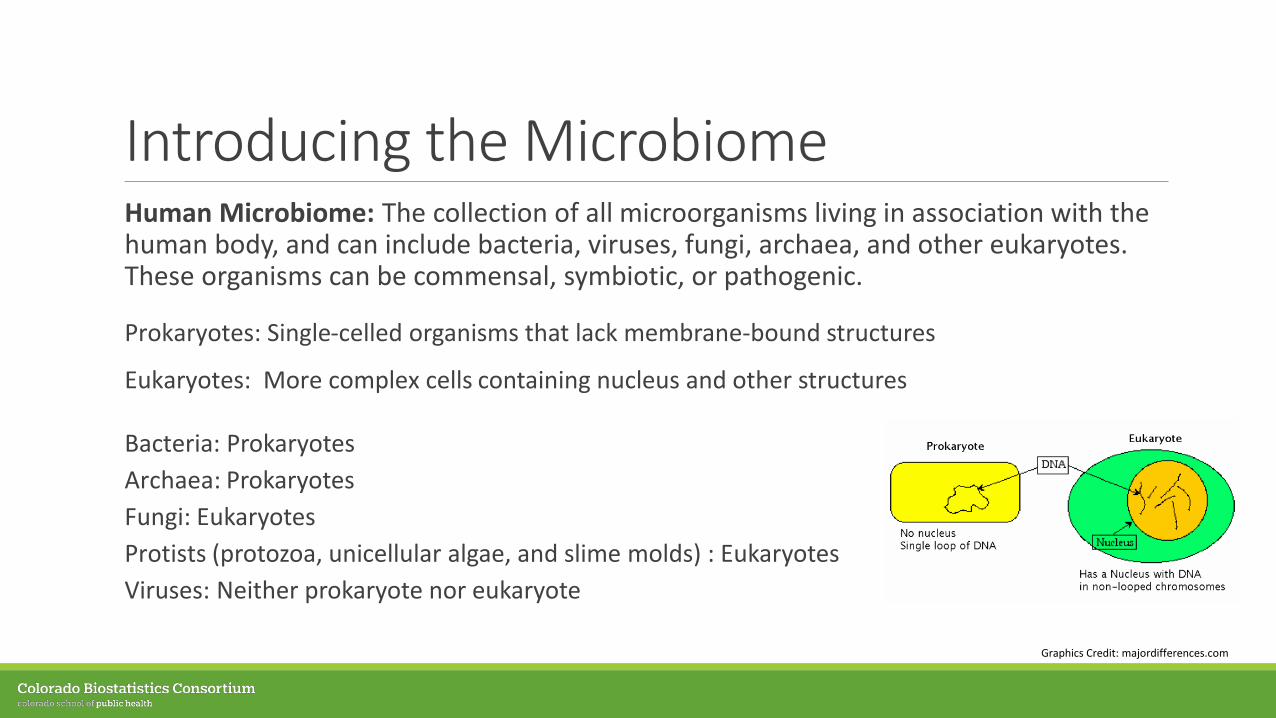
Introducing the MicrobiomeHuman Microbiome: The collection of all microorganisms living in association with the human body, and can include bacteria, viruses, fungi, archaea, and other eukaryotes. These organisms can be commensal, symbiotic, or pathogenic.
Prokaryotes: Single-celled organisms that lack membrane-bound structures
Eukaryotes: More complex cells containing nucleus and other structures
Bacteria: ProkaryotesArchaea: Prokaryotes Fungi: EukaryotesProtists (protozoa, unicellular algae, and slime molds) : EukaryotesViruses: Neither prokaryote nor eukaryote
Graphics Credit: majordifferences.com
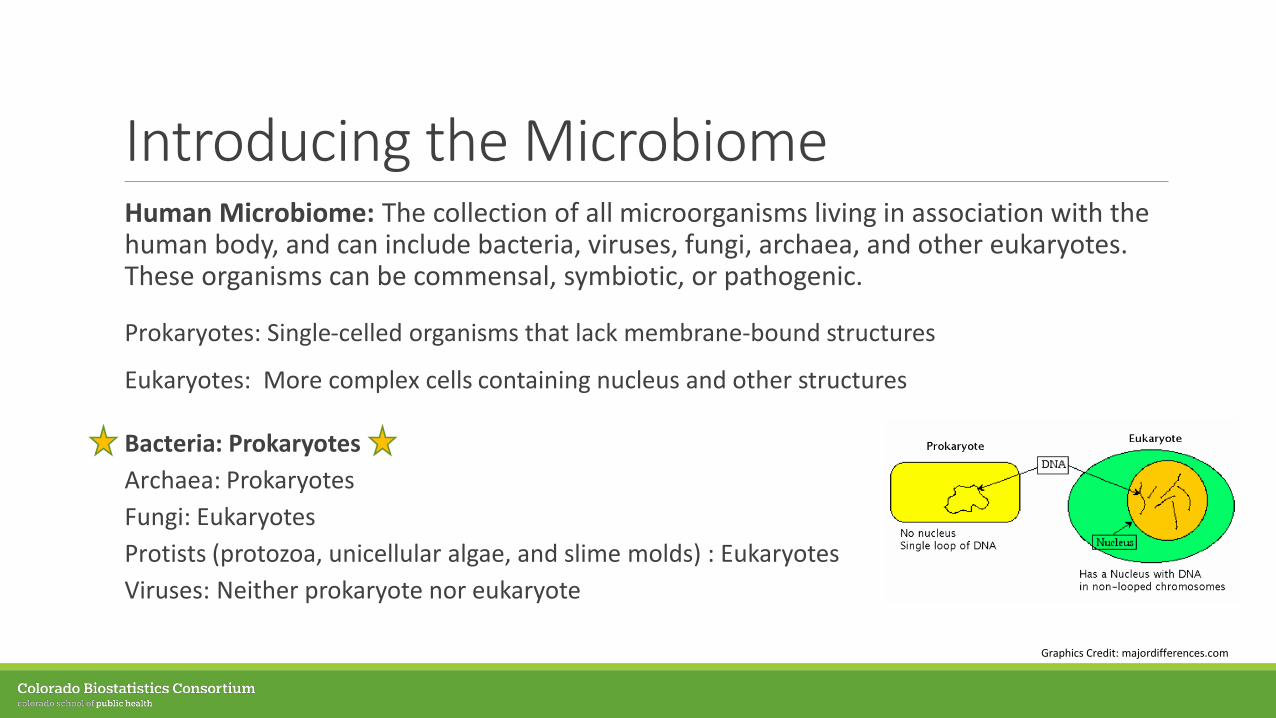
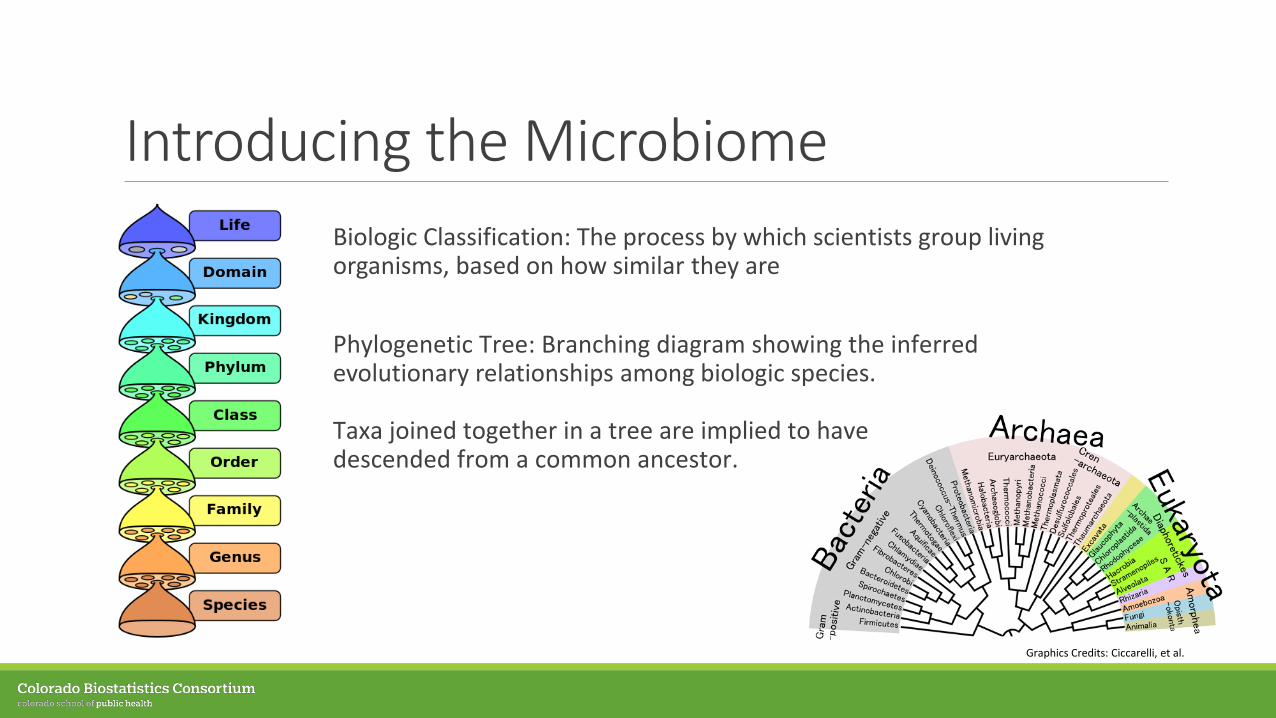
Introducing the MicrobiomeBiologic Classification: The process by which scientists group living organisms, based on how similar they are
Phylogenetic Tree: Branching diagram showing the inferred evolutionary relationships among biologic species.
Taxa joined together in a tree are implied to have descended from a common ancestor.
Graphics Credits: Ciccarelli, et al.
Introducing the Microbiome
https://www.youtube.com/watch?time_continue=15&v=5DTrENdWvvM
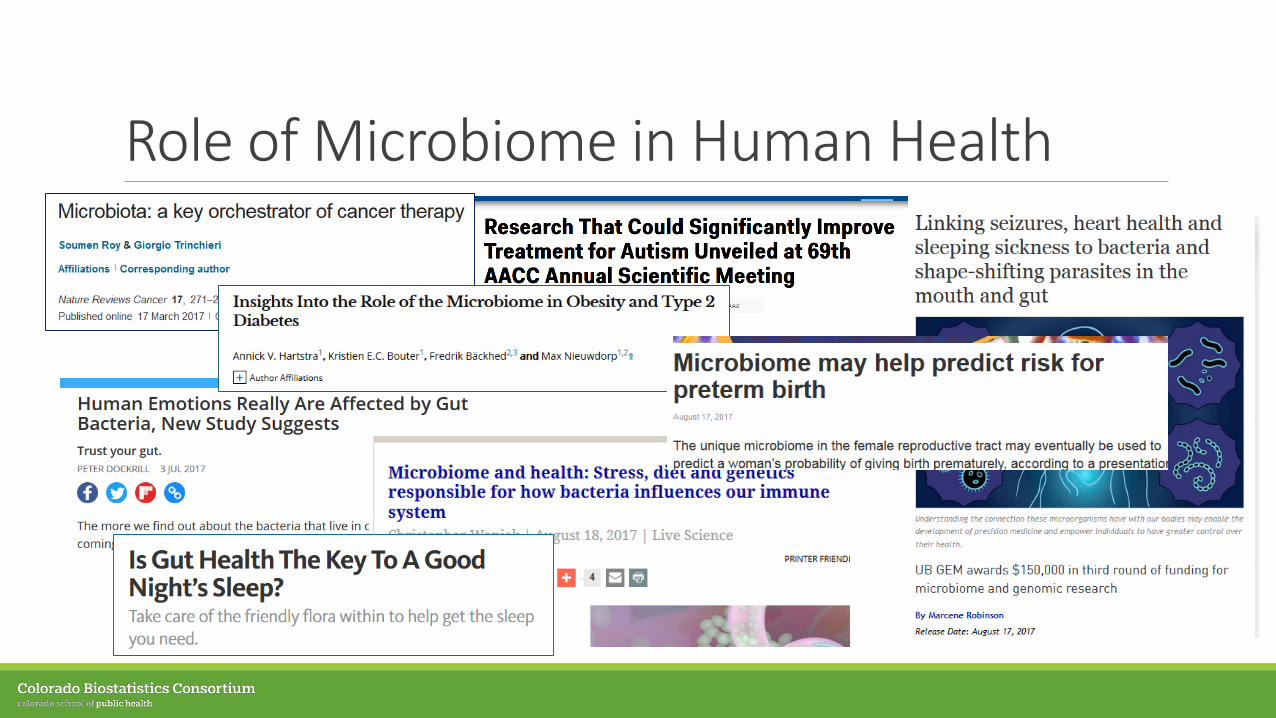
Role of Microbiome in Human Health
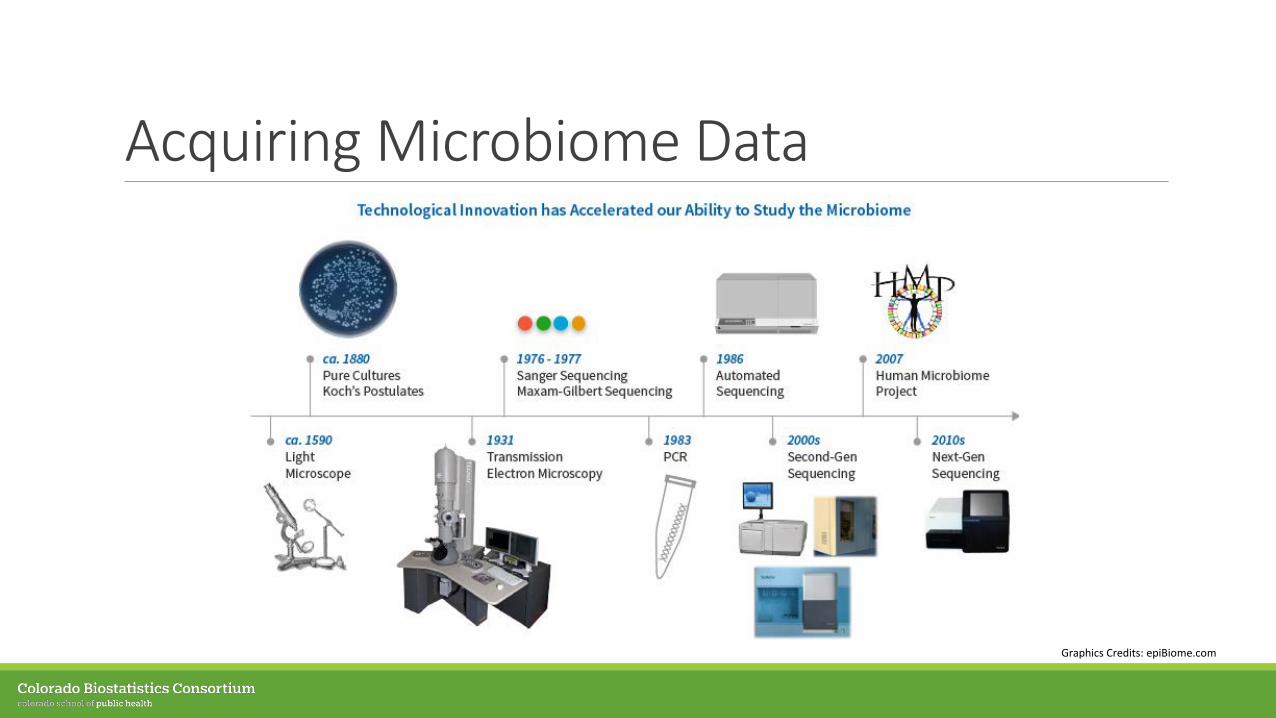
Acquiring Microbiome Data
Graphics Credits: epiBiome.com
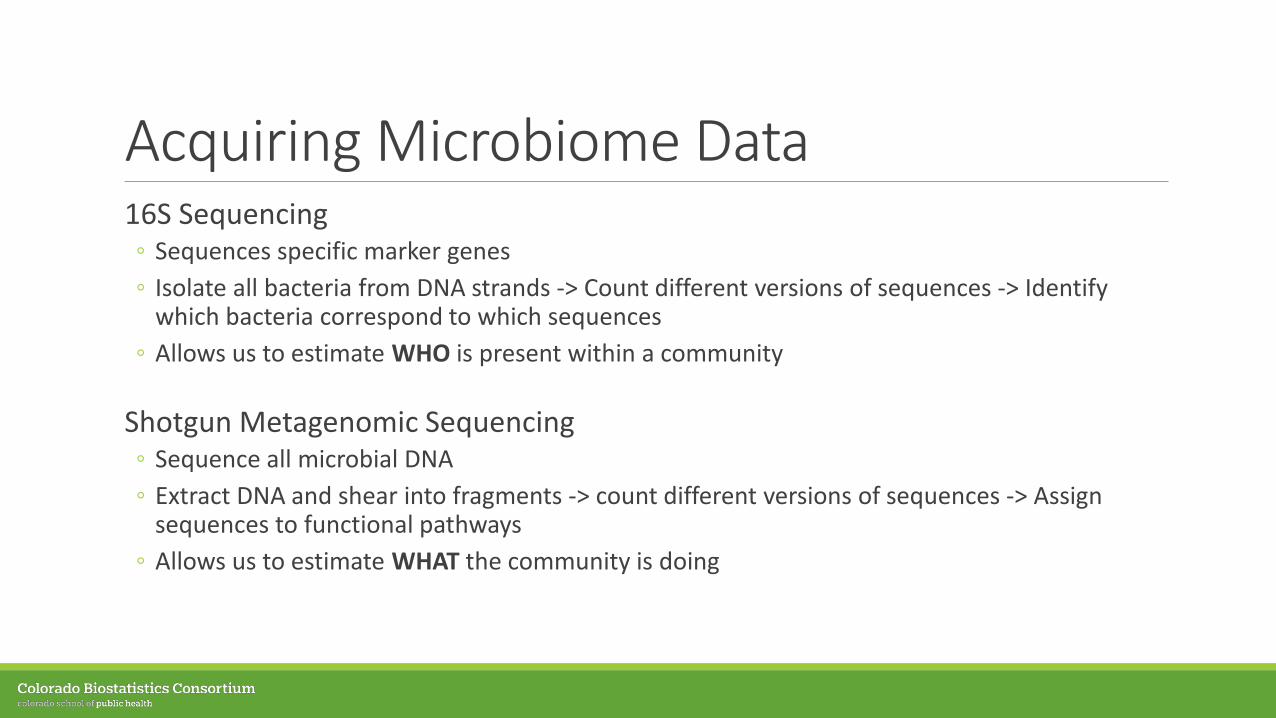
Acquiring Microbiome Data16S Sequencing◦ Sequences specific marker genes◦ Isolate all bacteria from DNA strands -> Count different versions of sequences -> Identify
which bacteria correspond to which sequences ◦ Allows us to estimate WHO is present within a community
Shotgun Metagenomic Sequencing◦ Sequence all microbial DNA◦ Extract DNA and shear into fragments -> count different versions of sequences -> Assign
sequences to functional pathways ◦ Allows us to estimate WHAT the community is doing
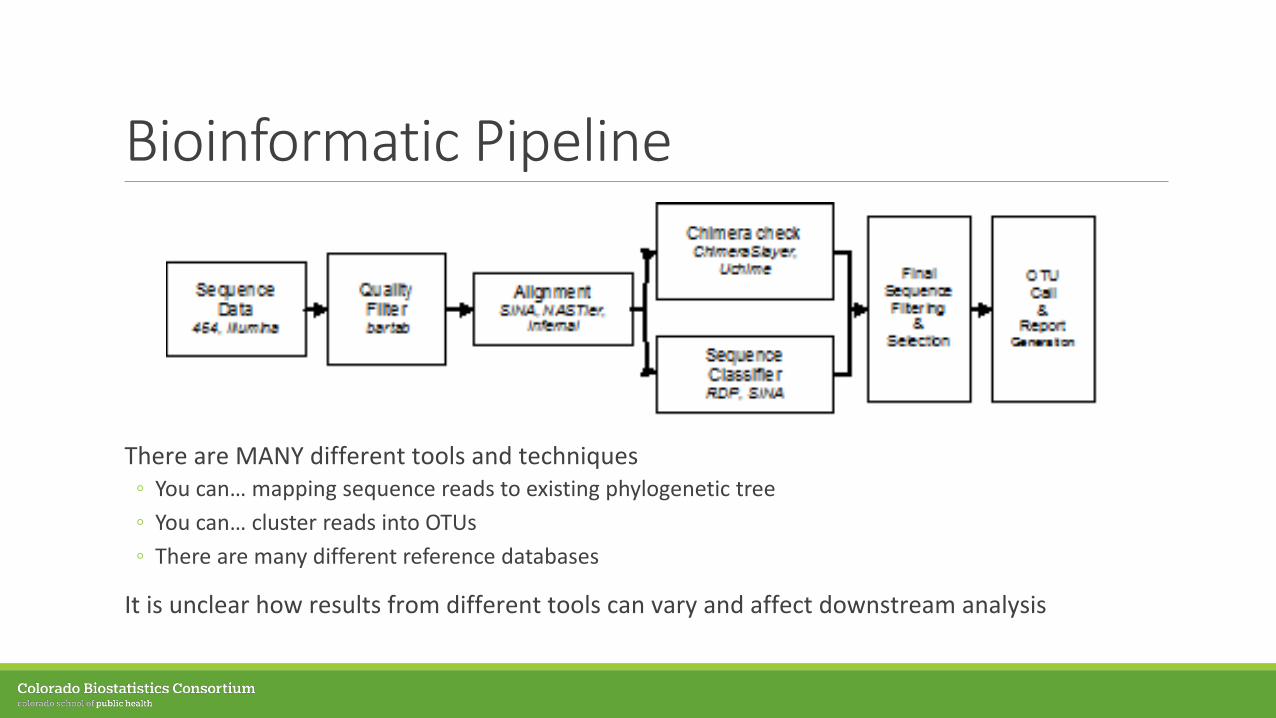
Bioinformatic Pipeline
There are MANY different tools and techniques◦ You can… mapping sequence reads to existing phylogenetic tree◦ You can… cluster reads into OTUs◦ There are many different reference databases
It is unclear how results from different tools can vary and affect downstream analysis
Some Words of CautionBioinformatics pipelines are also rapidly changing◦ Software and tools are constantly being updated◦ New tools are continually being developed and integrated into pipelines
Reference databases can change
We are lacking thorough evaluations of tools, methods, and pipelines in order to develop recommendations and best practices
What can you do?
Some Words of CautionBioinformatics pipelines are also rapidly changing◦ Software and tools are constantly being updated◦ New tools are continually being developed and integrated into pipelines
Reference databases can change
We are lacking thorough evaluations of tools, methods, and pipelines in order to develop recommendations and best practices
What can you do? Assemble a Knowledgeable Team
Graphics Credit: Noshir Contractor
Some Words of CautionBioinformatics pipelines are also rapidly changing◦ Software and tools are constantly being updated◦ New tools are continually being developed and integrated into pipelines
Reference databases can change
We are lacking thorough evaluations of tools, methods, and pipelines in order to develop recommendations and best practices
What can you do? Document EVERYTHING!
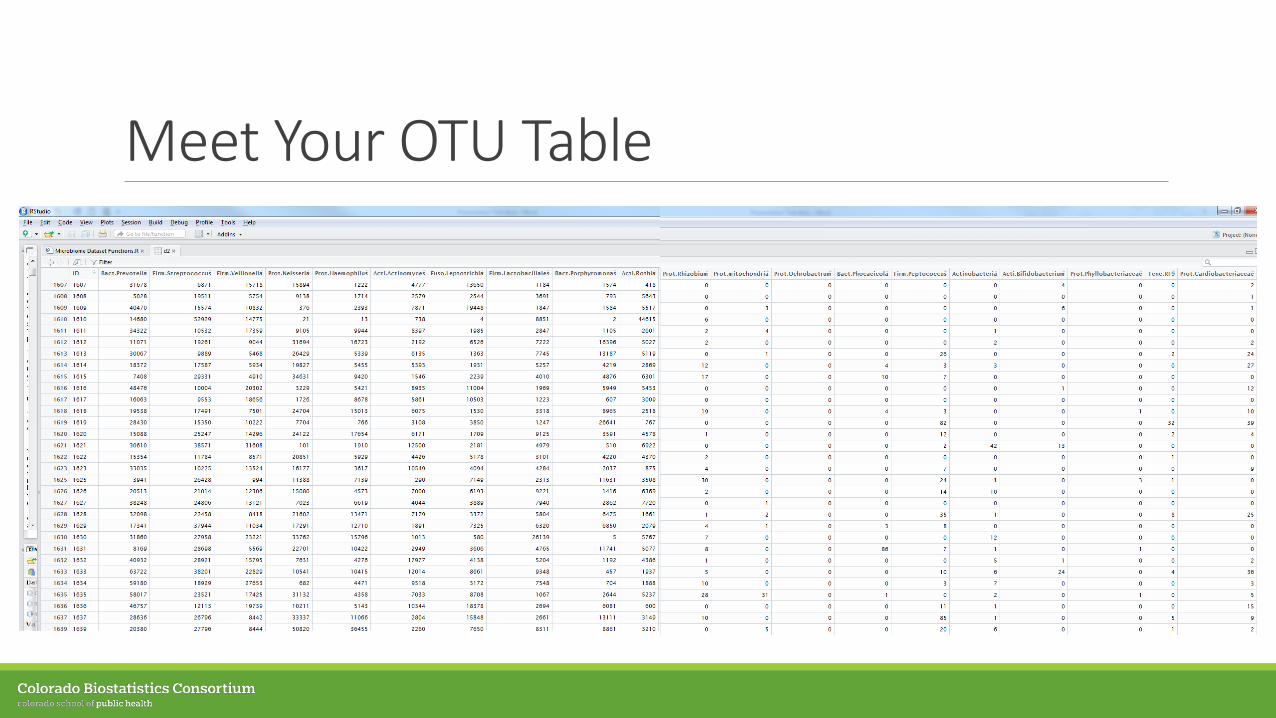
Meet Your OTU Table
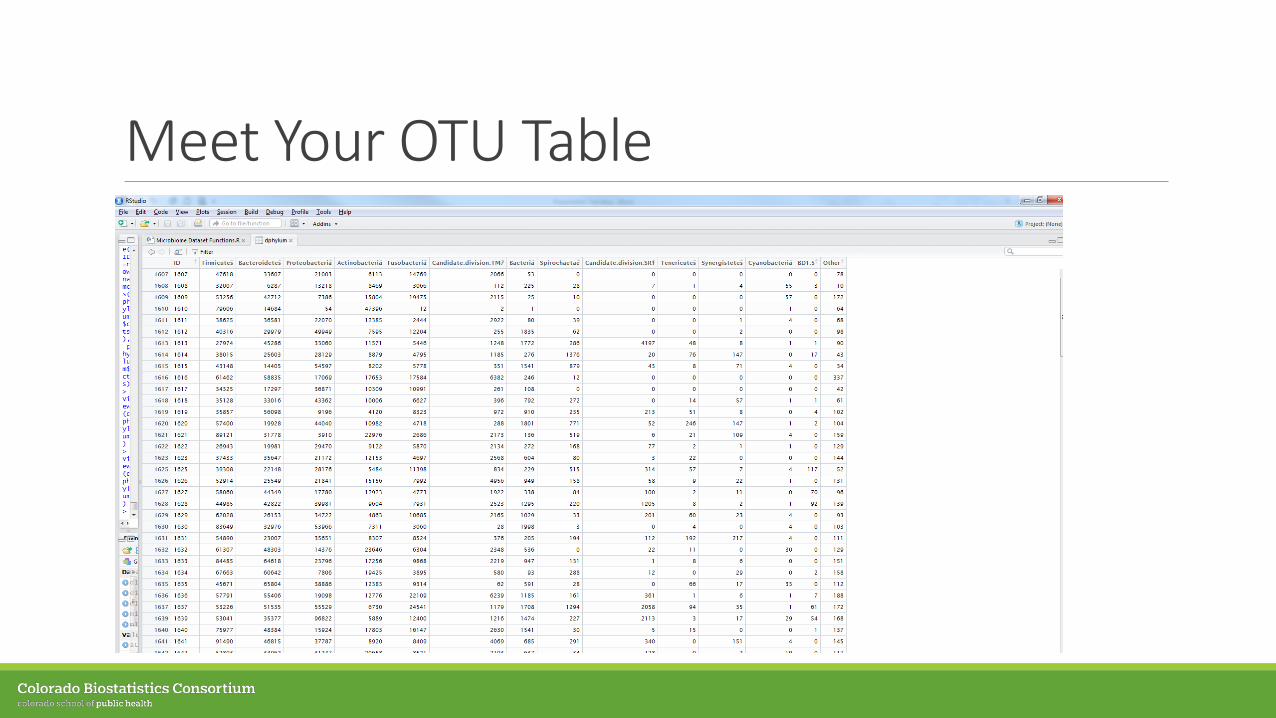
Meet Your OTU Table
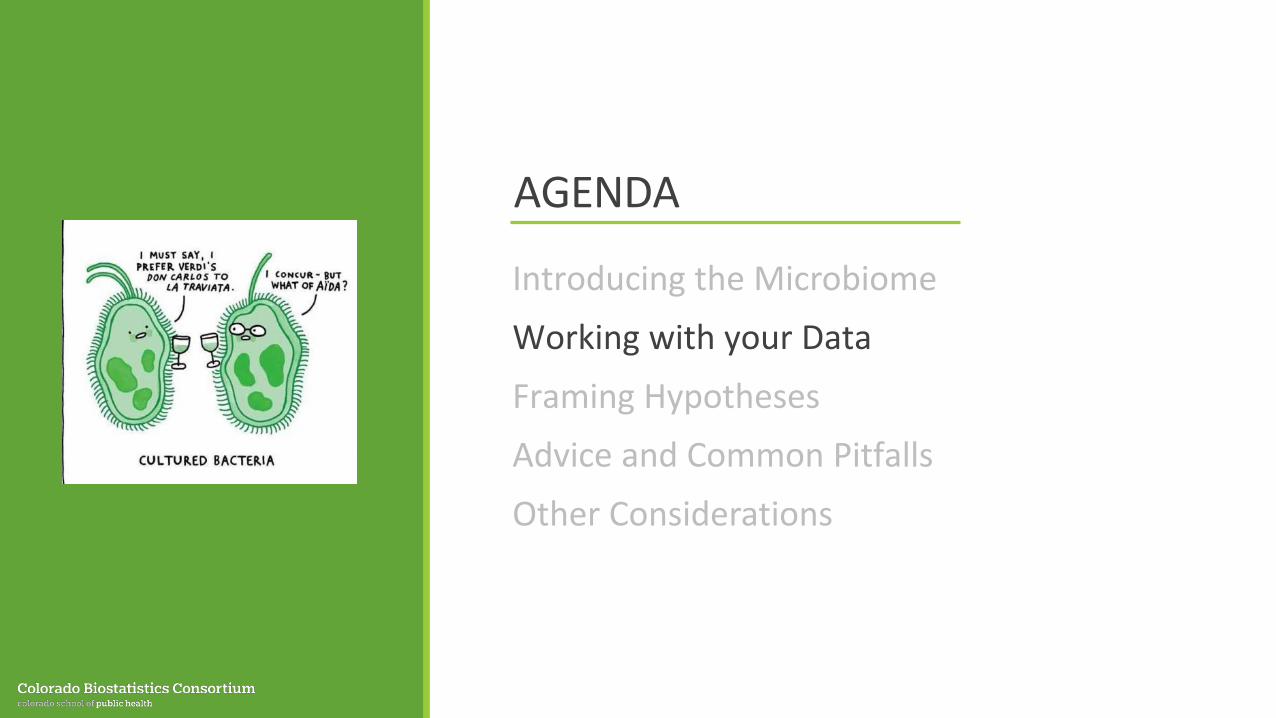
AGENDA
Introducing the Microbiome
Working with your Data
Framing HypothesesAdvice and Common Pitfalls
Other Considerations
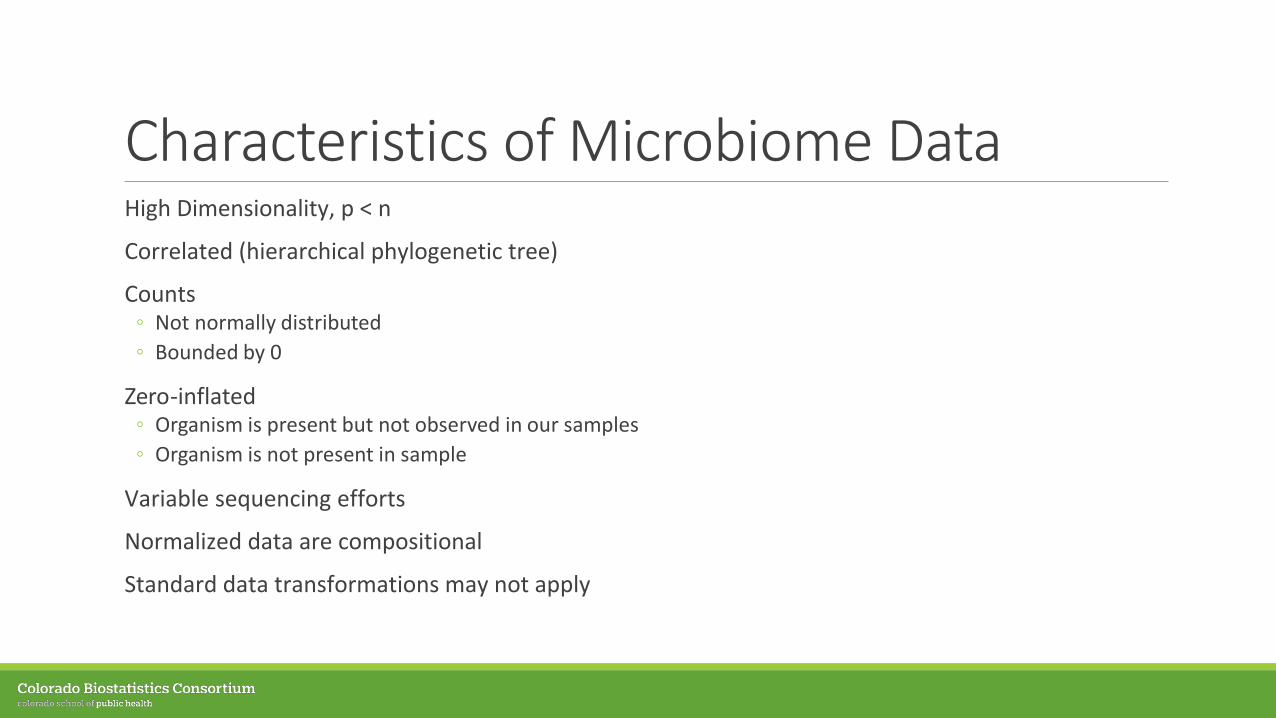
Characteristics of Microbiome DataHigh Dimensionality, p < n
Correlated (hierarchical phylogenetic tree)
Counts◦ Not normally distributed◦ Bounded by 0
Zero-inflated◦ Organism is present but not observed in our samples◦ Organism is not present in sample
Variable sequencing efforts
Normalized data are compositional
Standard data transformations may not apply
Characteristics of Microbiome Data
“Microbial data has been known to present unique statistical challenges that defy most conventional models” ~ Tang and Nicolae
Ignoring these characteristics by using common statistical methods can…◦ Bias estimated parameters and standard errors ◦ Result in spurious (not real) correlations among your taxa◦ Produce misleading conclusions
There is plenty of room for statistical methods work!
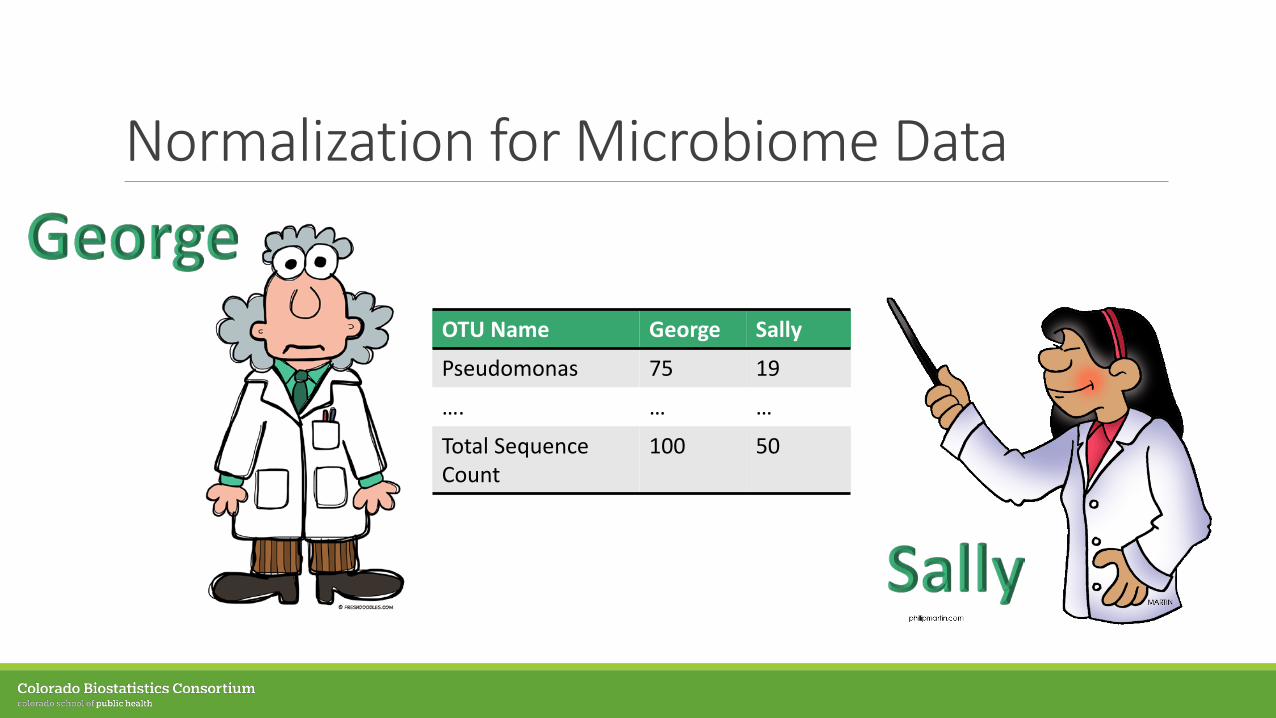
Normalization for Microbiome Data
OTU Name George Sally
Pseudomonas 75 19
…. … …
Total Sequence Count
100 50
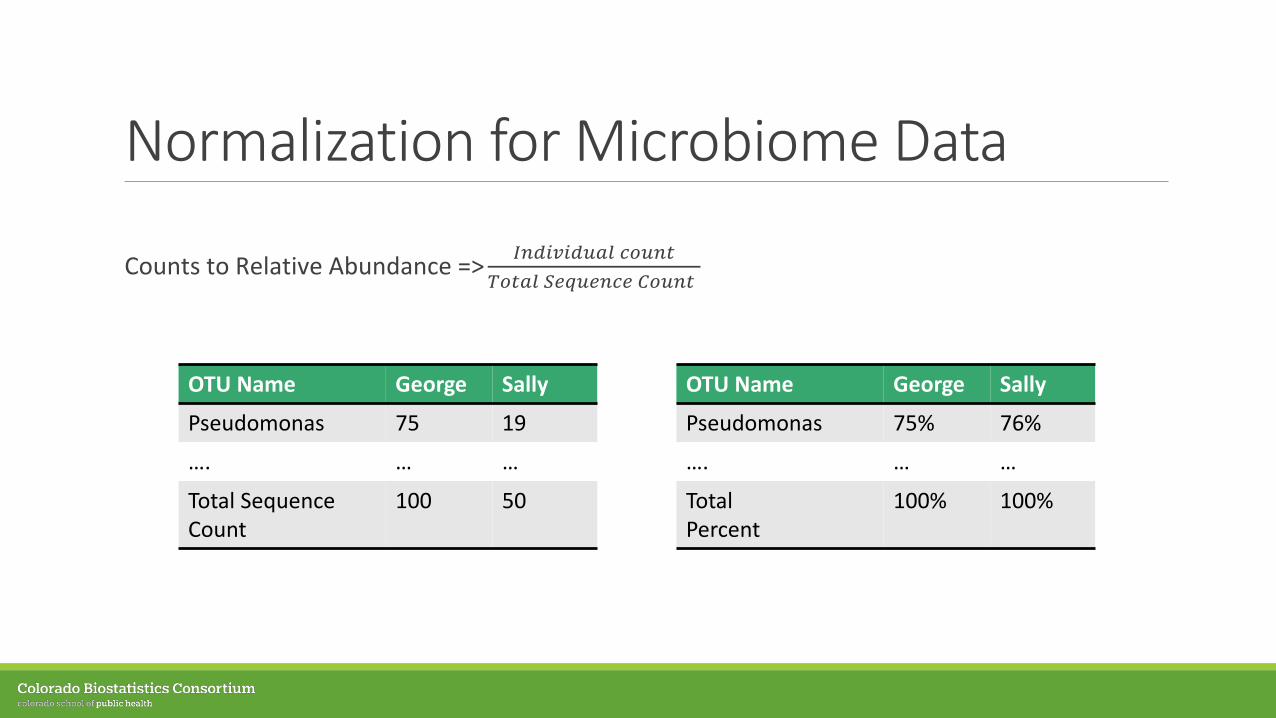
Normalization for Microbiome Data
Counts to Relative Abundance => 𝐼𝐼𝐼𝐼𝐼𝐼𝐼𝐼𝐼𝐼𝐼𝐼𝐼𝐼𝐼𝐼𝐼𝐼𝐼𝐼 𝑐𝑐𝑐𝑐𝐼𝐼𝐼𝐼𝑐𝑐𝑇𝑇𝑐𝑐𝑐𝑐𝐼𝐼𝐼𝐼 𝑆𝑆𝑆𝑆𝑆𝑆𝐼𝐼𝑆𝑆𝐼𝐼𝑐𝑐𝑆𝑆 𝐶𝐶𝑐𝑐𝐼𝐼𝐼𝐼𝑐𝑐
OTU Name George Sally
Pseudomonas 75 19
…. … …
Total Sequence Count
100 50
OTU Name George Sally
Pseudomonas 75% 76%
…. … …
Total Percent
100% 100%
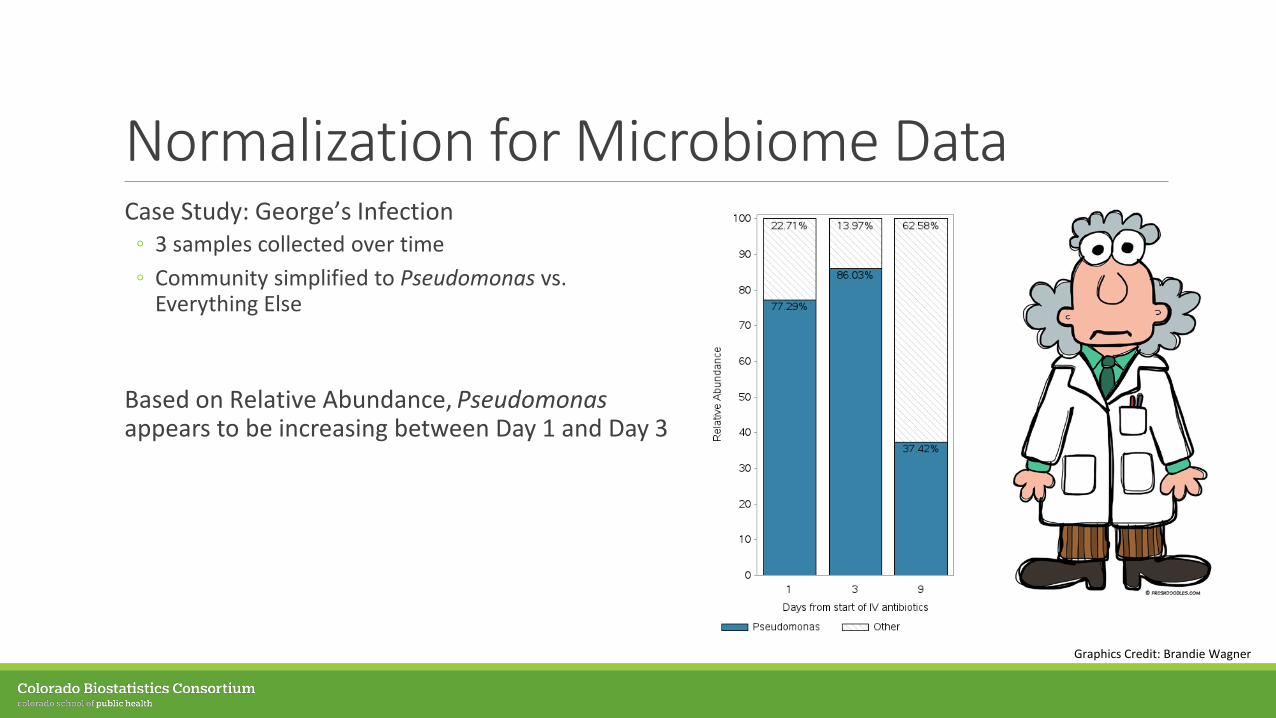
Normalization for Microbiome DataCase Study: George’s Infection◦ 3 samples collected over time ◦ Community simplified to Pseudomonas vs.
Everything Else
Based on Relative Abundance, Pseudomonasappears to be increasing between Day 1 and Day 3
Graphics Credit: Brandie Wagner
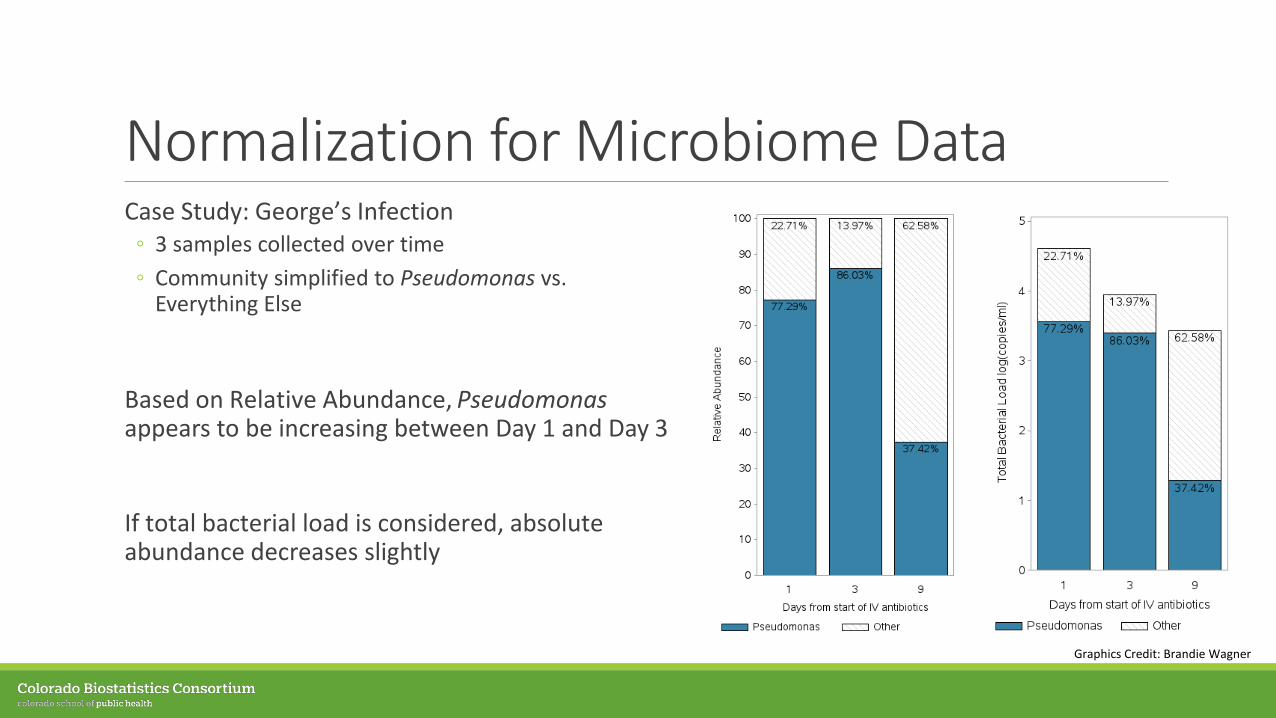
Normalization for Microbiome DataCase Study: George’s Infection◦ 3 samples collected over time ◦ Community simplified to Pseudomonas vs.
Everything Else
Based on Relative Abundance, Pseudomonasappears to be increasing between Day 1 and Day 3
If total bacterial load is considered, absolute abundance decreases slightly
Graphics Credit: Brandie Wagner
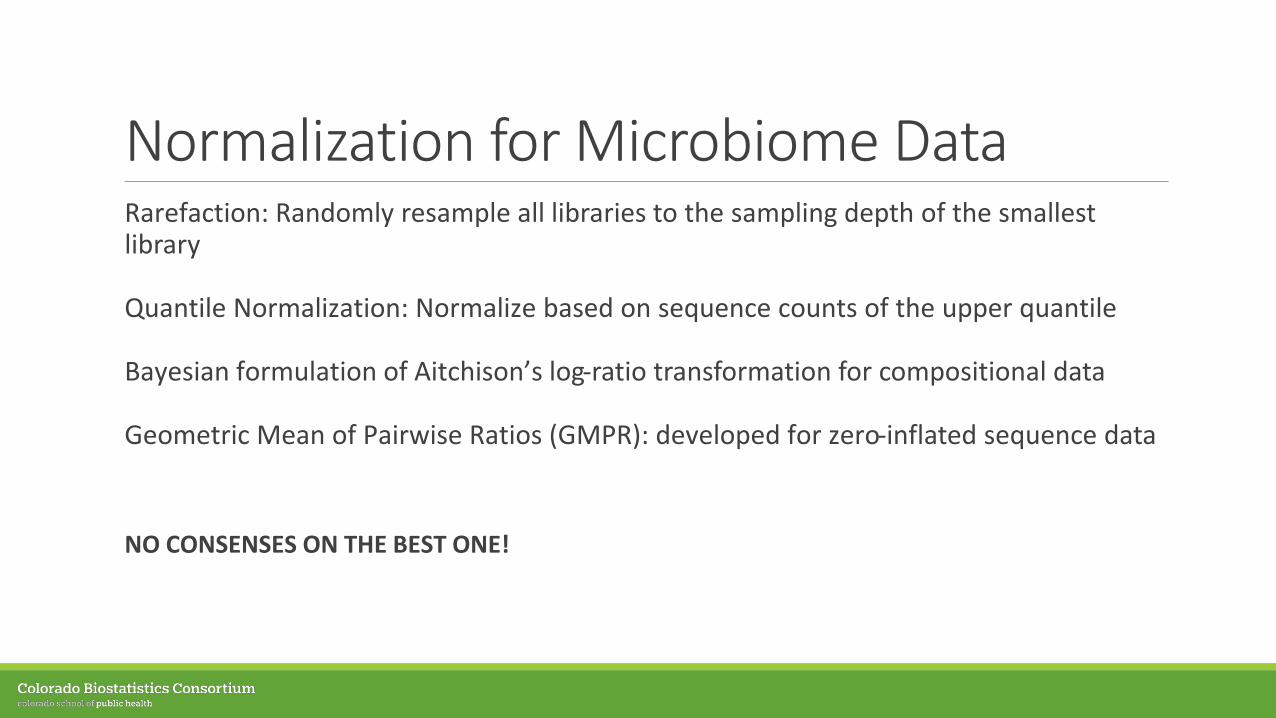
Normalization for Microbiome DataRarefaction: Randomly resample all libraries to the sampling depth of the smallest library
Quantile Normalization: Normalize based on sequence counts of the upper quantile
Bayesian formulation of Aitchison’s log-ratio transformation for compositional data
Geometric Mean of Pairwise Ratios (GMPR): developed for zero-inflated sequence data
NO CONSENSES ON THE BEST ONE!
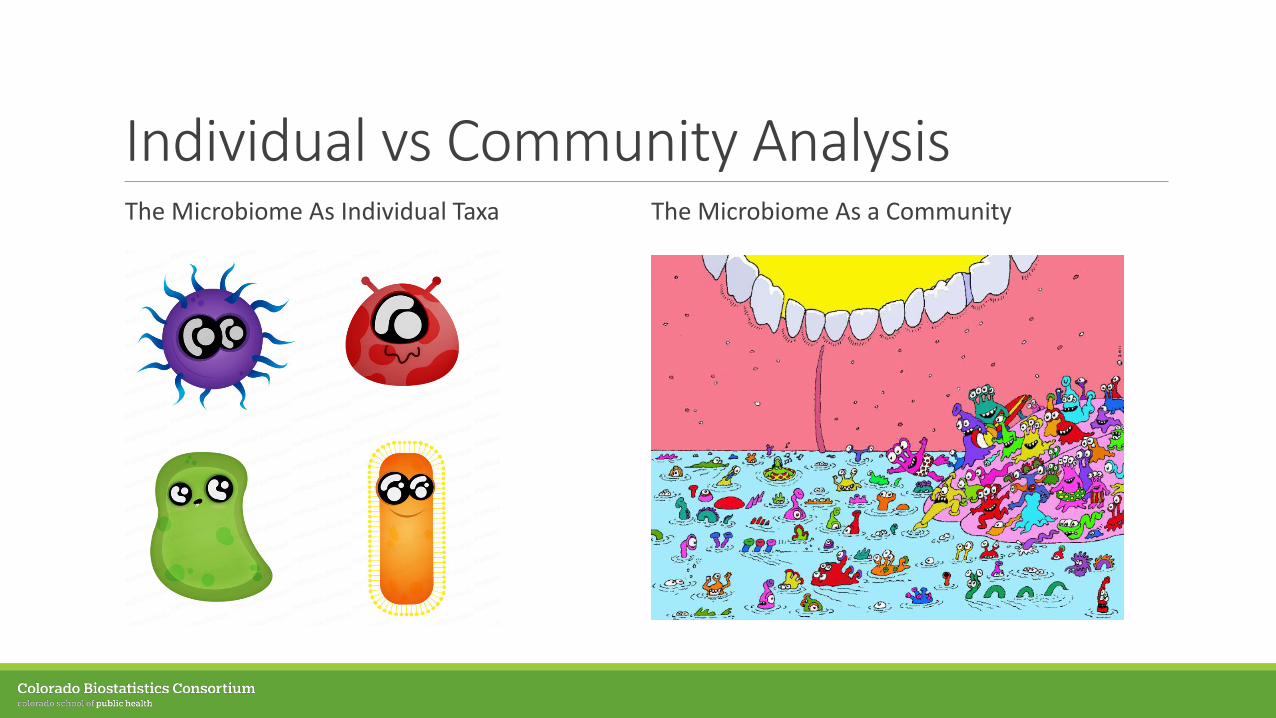
Individual vs Community AnalysisThe Microbiome As a CommunityThe Microbiome As Individual Taxa
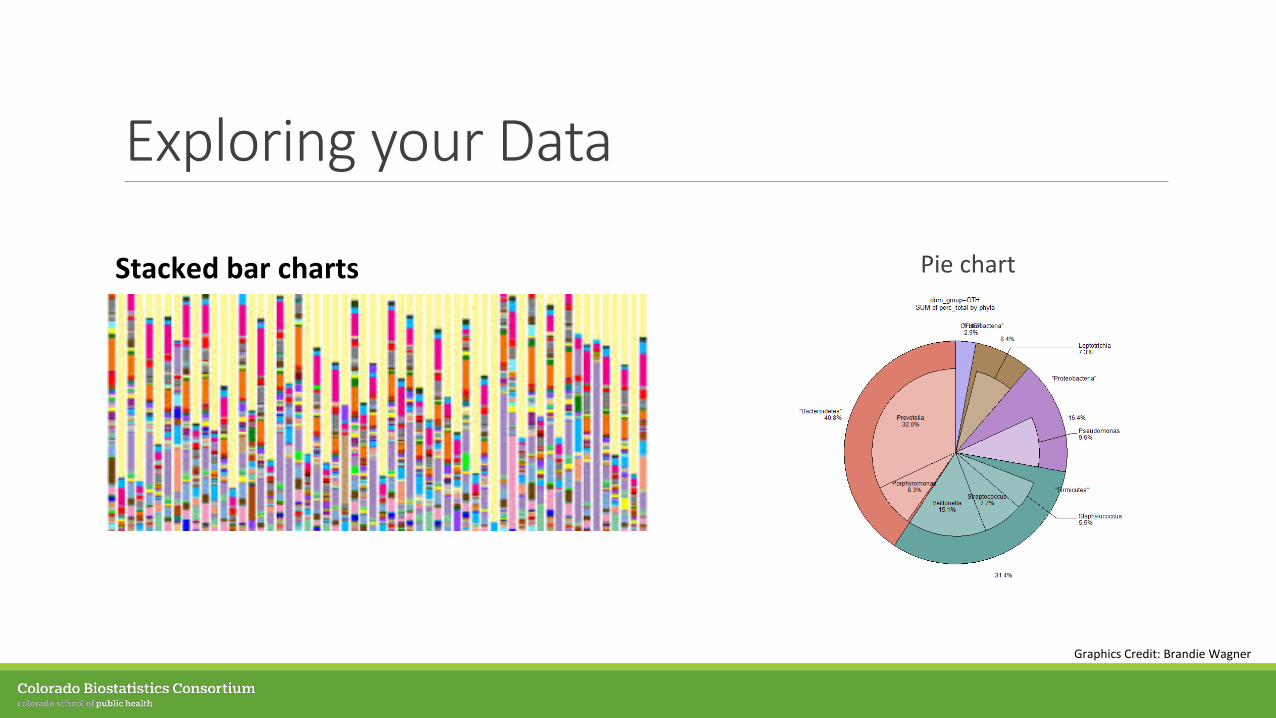
Exploring your Data
Stacked bar charts Pie chart
Graphics Credit: Brandie Wagner
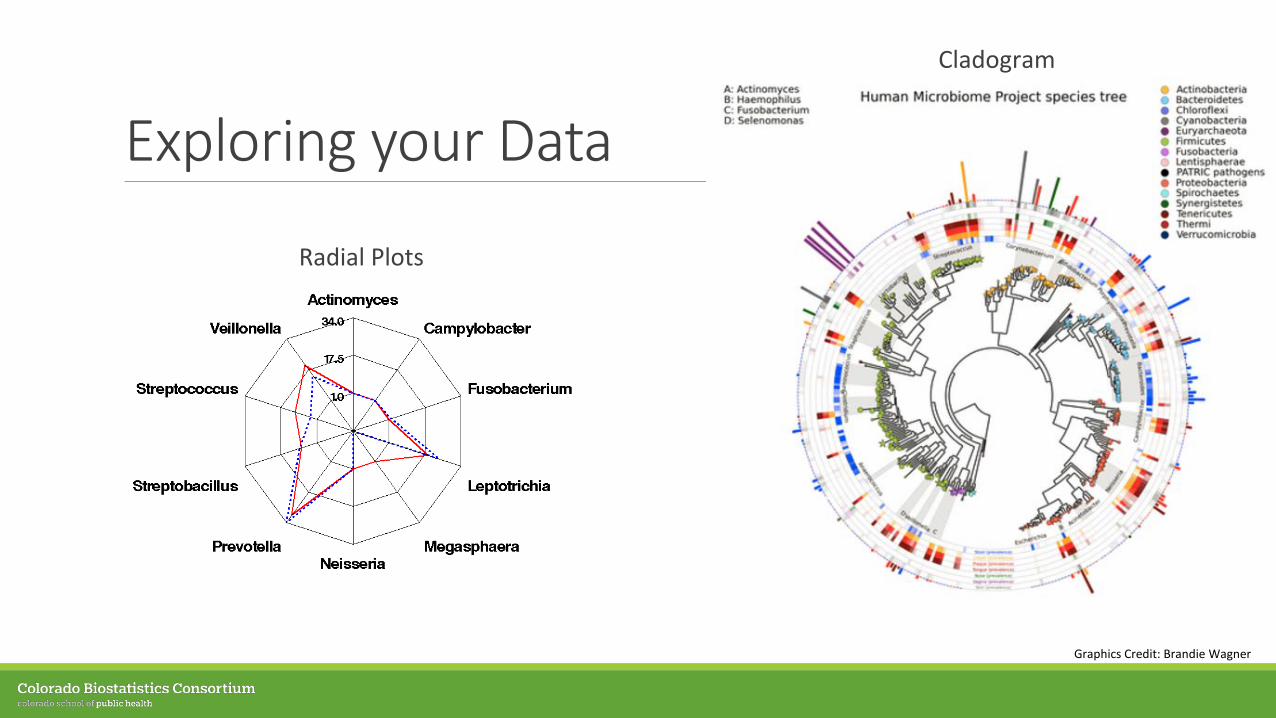
Exploring your Data
Graphics Credit: Brandie Wagner
Radial Plots
Cladogram
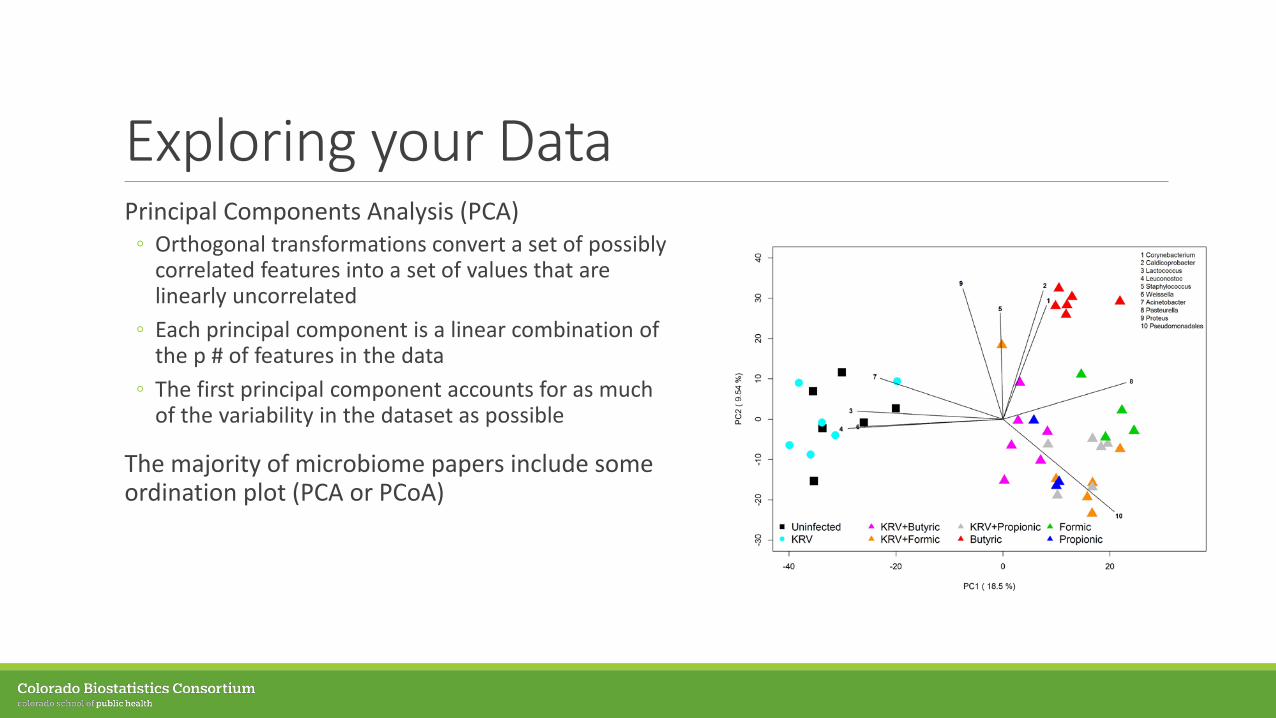
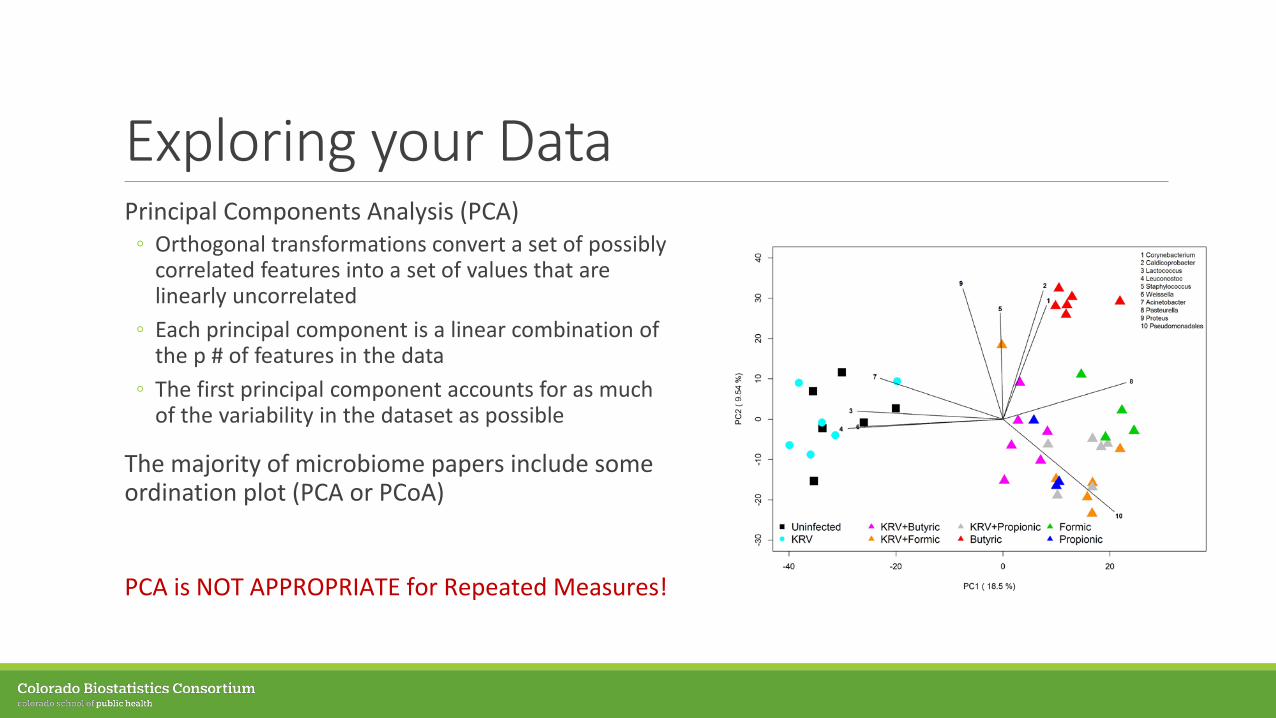
Exploring your DataPrincipal Components Analysis (PCA)◦ Orthogonal transformations convert a set of possibly
correlated features into a set of values that are linearly uncorrelated
◦ Each principal component is a linear combination of the p # of features in the data
◦ The first principal component accounts for as much of the variability in the dataset as possible
The majority of microbiome papers include some ordination plot (PCA or PCoA)
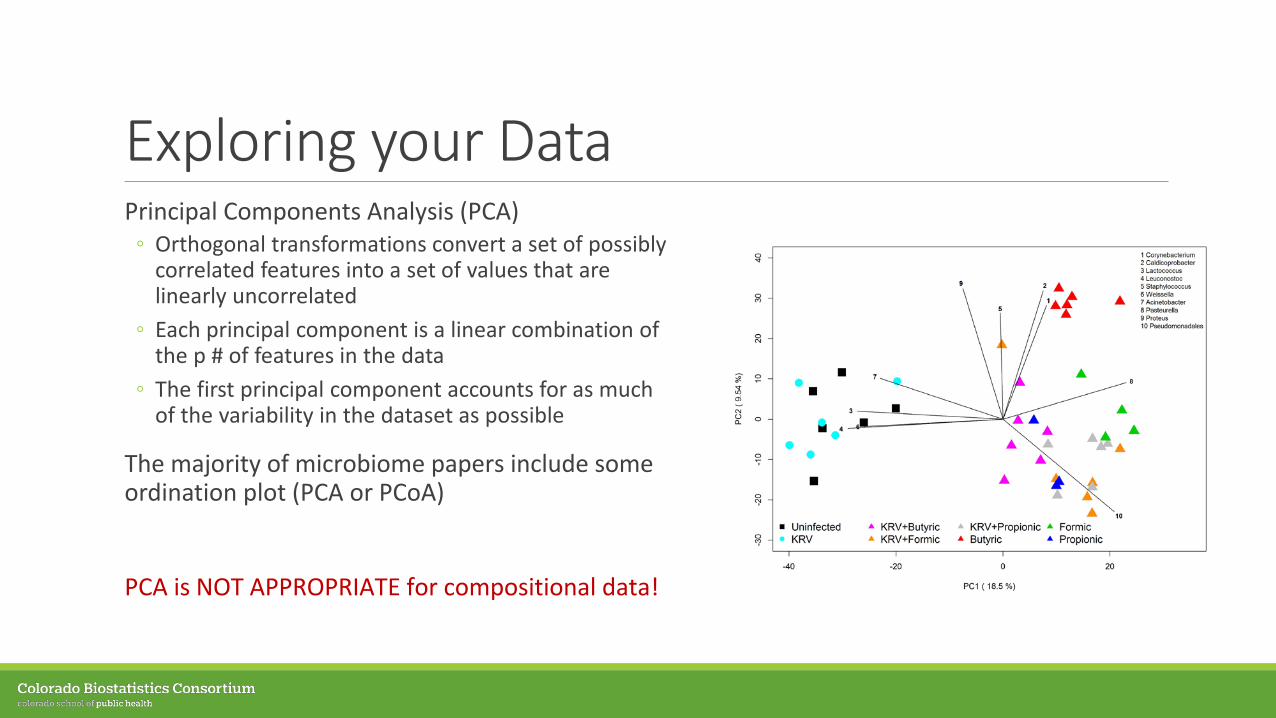
PCA is NOT APPROPRIATE for compositional data!
Exploring your DataPrincipal Components Analysis (PCA)◦ Orthogonal transformations convert a set of possibly
correlated features into a set of values that are linearly uncorrelated
◦ Each principal component is a linear combination of the p # of features in the data
◦ The first principal component accounts for as much of the variability in the dataset as possible
The majority of microbiome papers include some ordination plot (PCA or PCoA)
PCA is NOT APPROPRIATE for Repeated Measures!
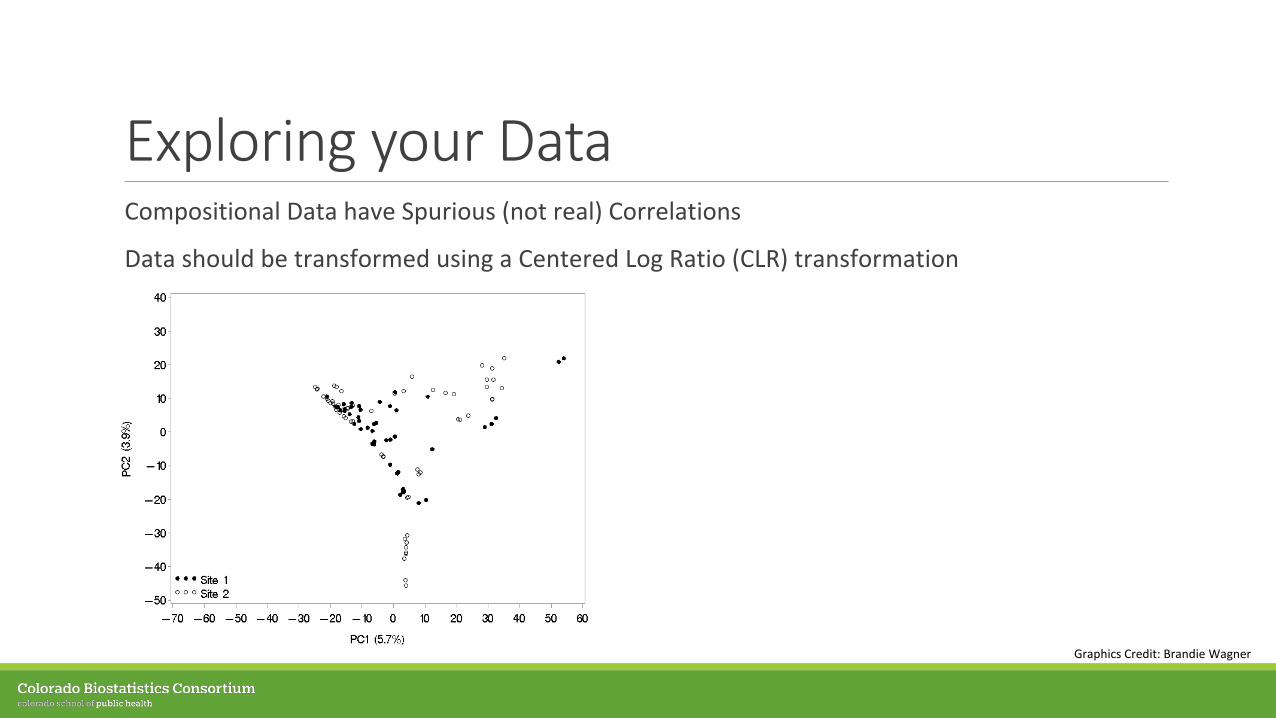
Exploring your DataCompositional Data have Spurious (not real) Correlations
Data should be transformed using a Centered Log Ratio (CLR) transformation
Graphics Credit: Brandie Wagner
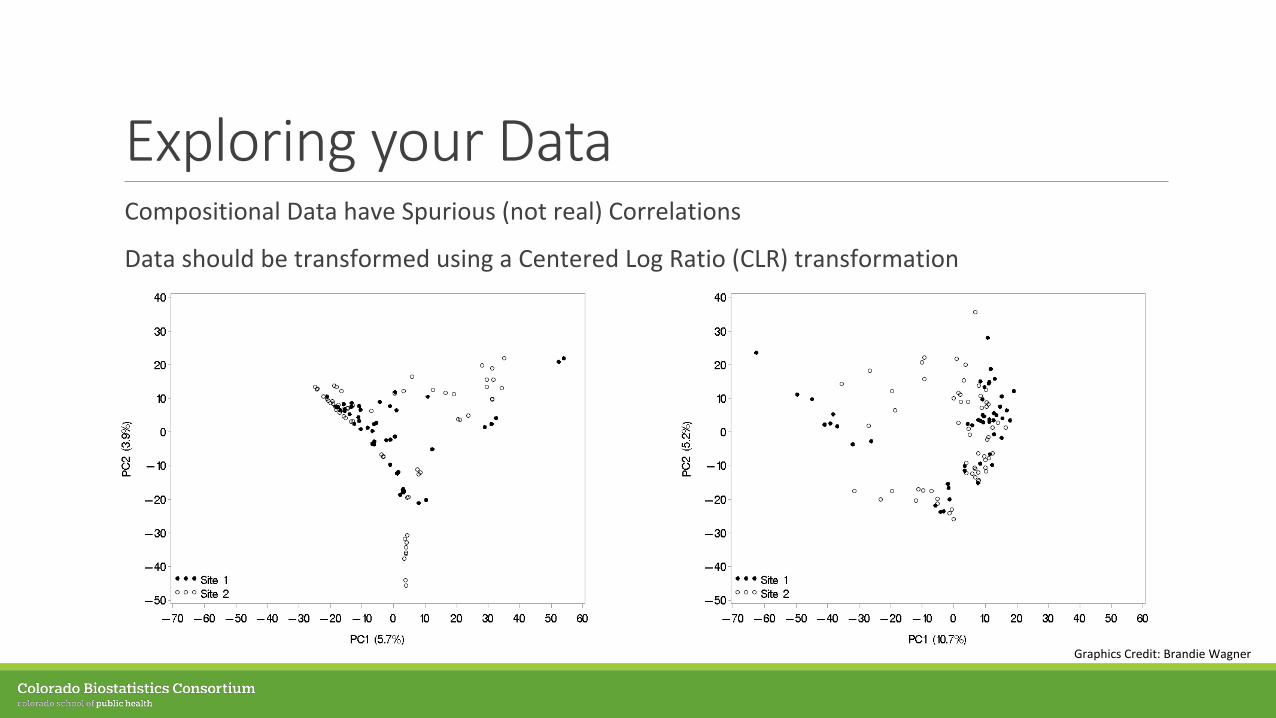
Exploring your DataCompositional Data have Spurious (not real) Correlations
Data should be transformed using a Centered Log Ratio (CLR) transformation
Graphics Credit: Brandie Wagner
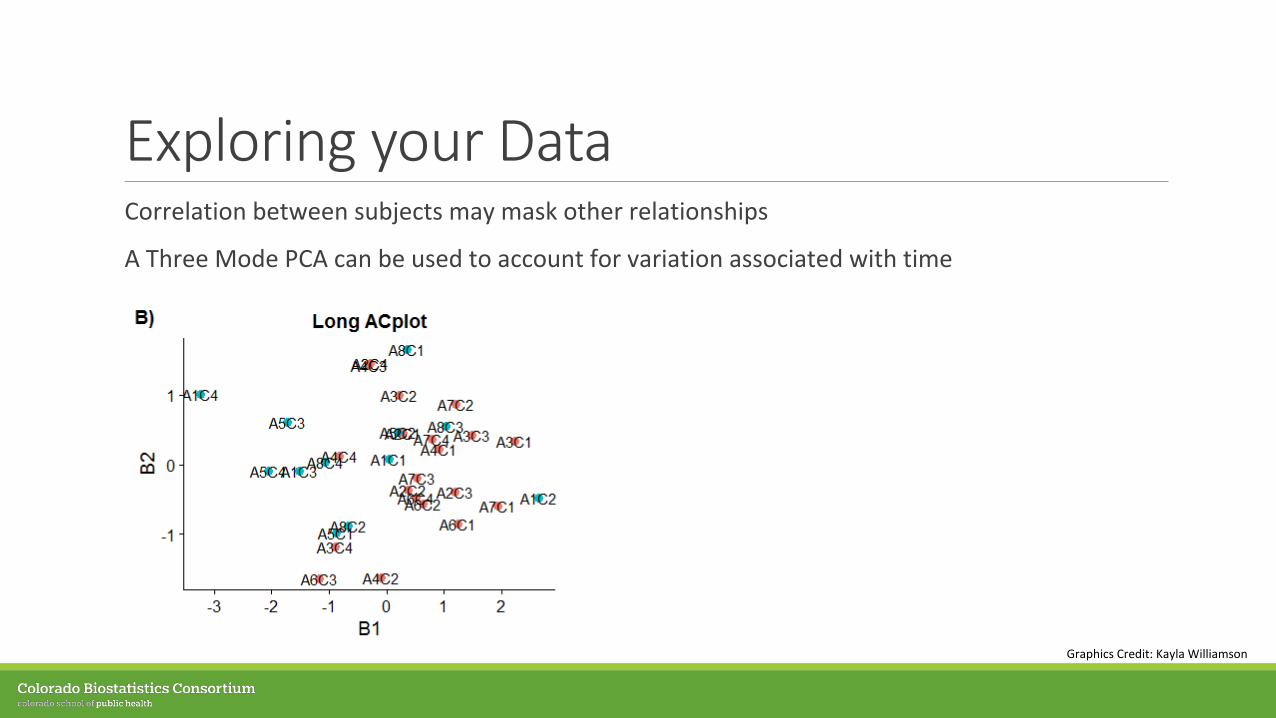
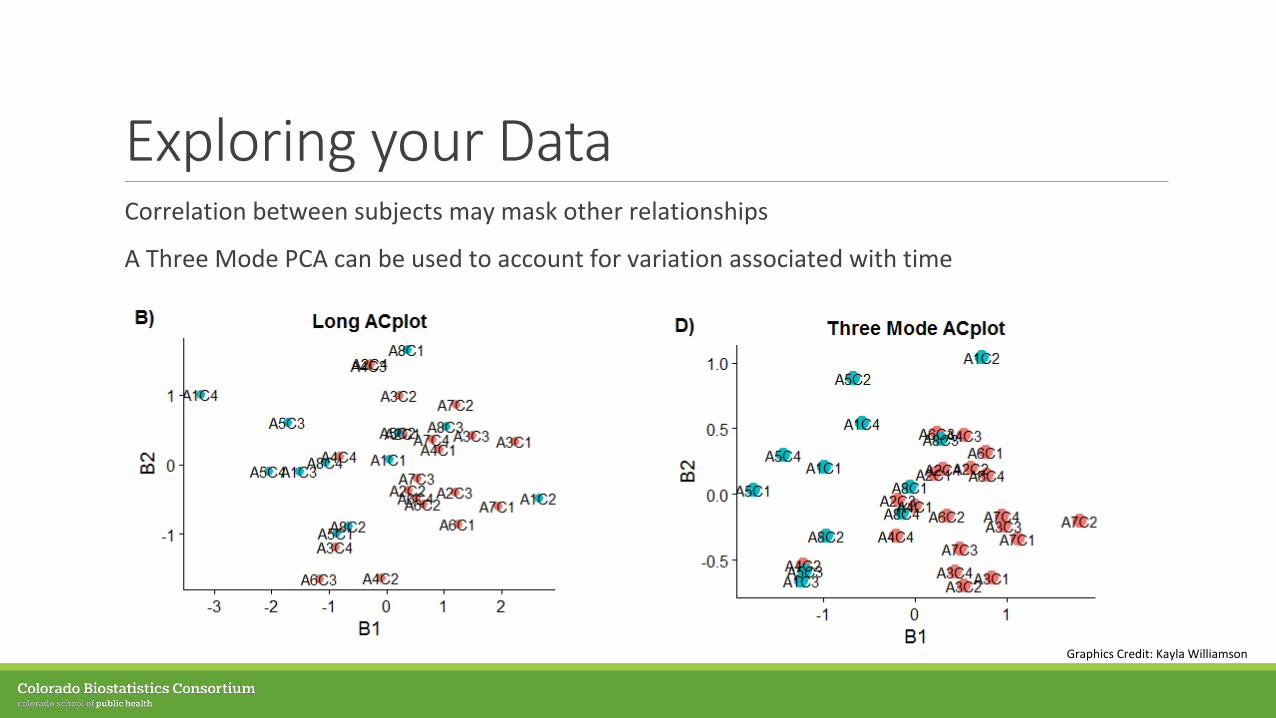
Exploring your DataCorrelation between subjects may mask other relationships
A Three Mode PCA can be used to account for variation associated with time
Graphics Credit: Kayla Williamson
Exploring your DataCorrelation between subjects may mask other relationships
A Three Mode PCA can be used to account for variation associated with time
Graphics Credit: Kayla Williamson
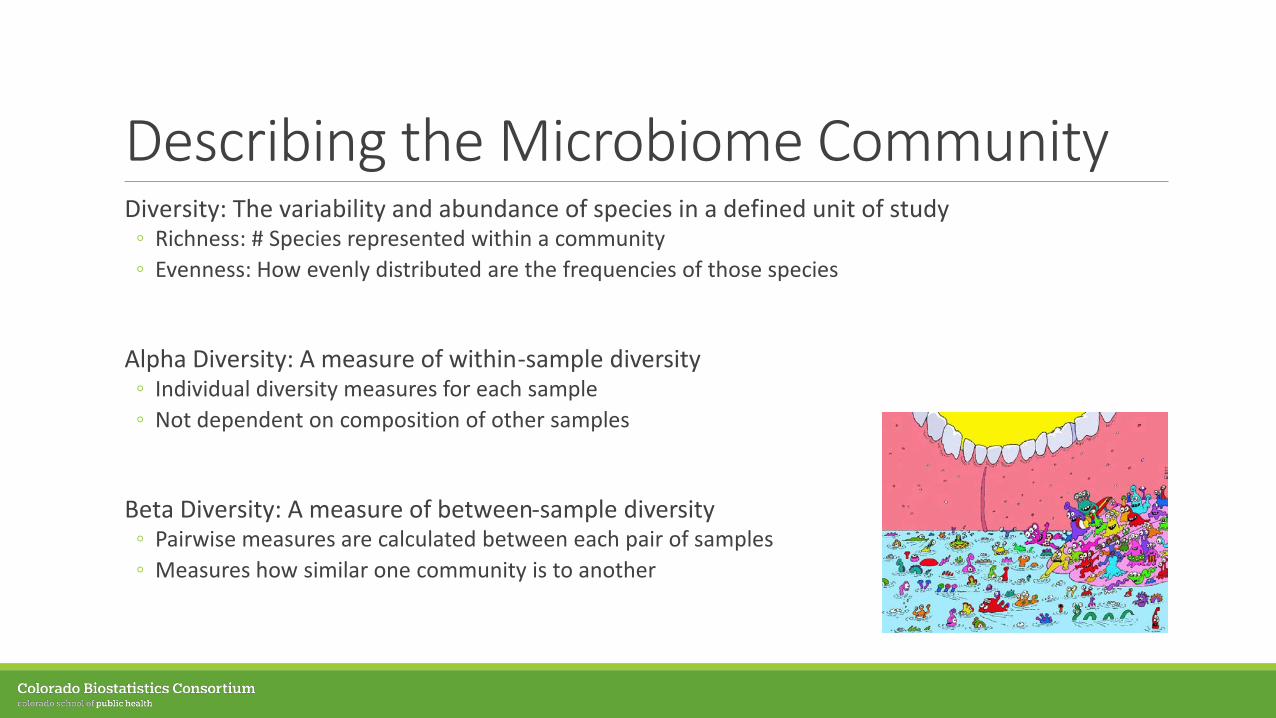
Describing the Microbiome CommunityDiversity: The variability and abundance of species in a defined unit of study◦ Richness: # Species represented within a community◦ Evenness: How evenly distributed are the frequencies of those species
Alpha Diversity: A measure of within-sample diversity◦ Individual diversity measures for each sample◦ Not dependent on composition of other samples
Beta Diversity: A measure of between-sample diversity◦ Pairwise measures are calculated between each pair of samples◦ Measures how similar one community is to another
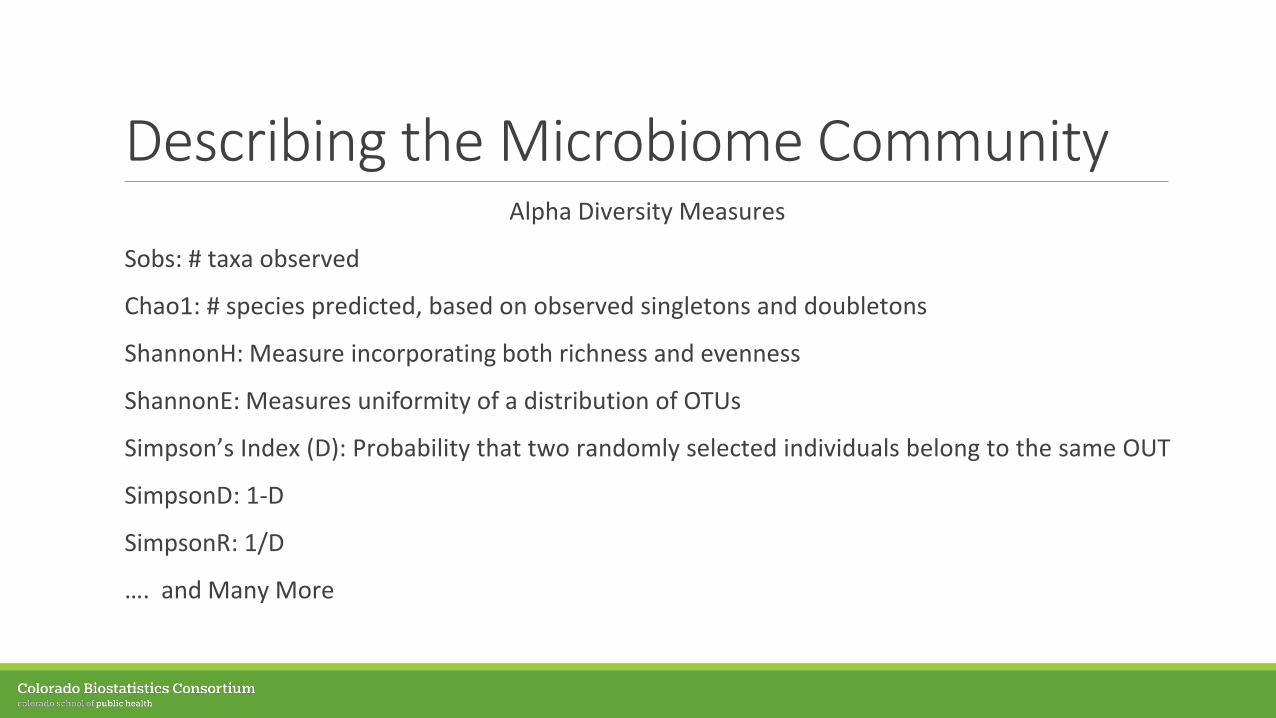
Describing the Microbiome CommunityAlpha Diversity Measures
Sobs: # taxa observed
Chao1: # species predicted, based on observed singletons and doubletons
ShannonH: Measure incorporating both richness and evenness
ShannonE: Measures uniformity of a distribution of OTUs
Simpson’s Index (D): Probability that two randomly selected individuals belong to the same OUT
SimpsonD: 1-D
SimpsonR: 1/D
…. and Many More
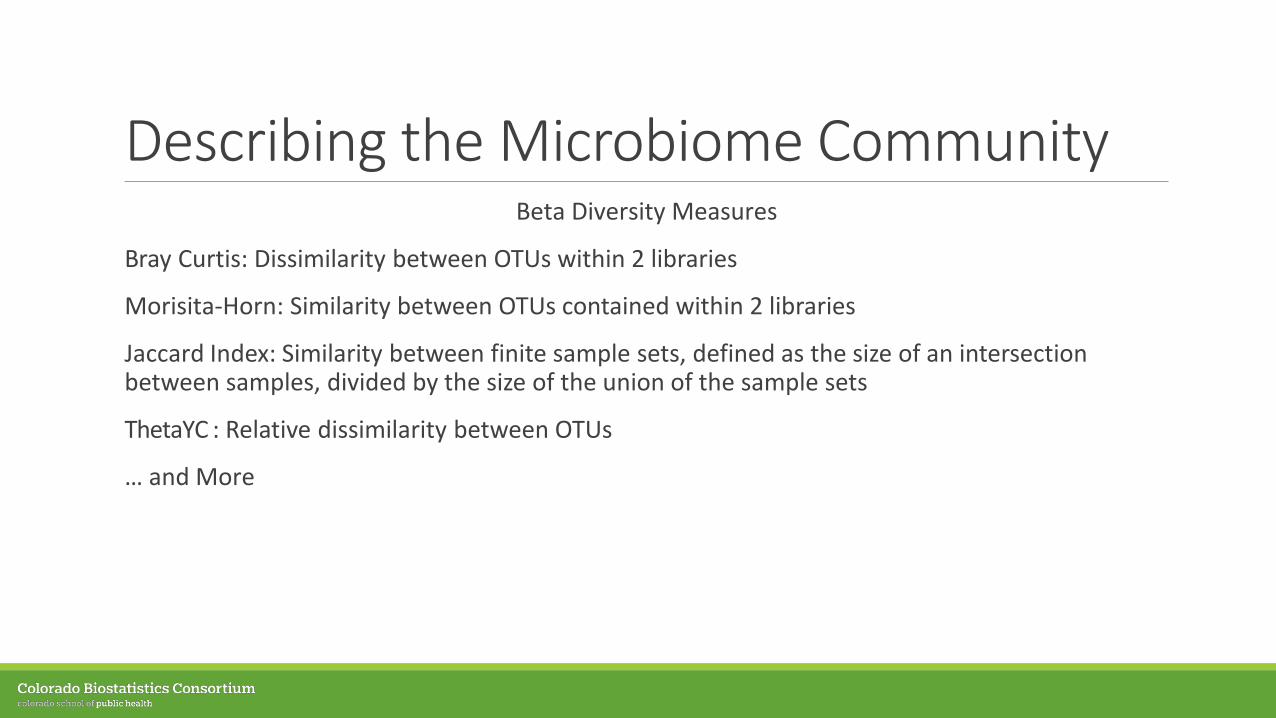
Describing the Microbiome CommunityBeta Diversity Measures
Bray Curtis: Dissimilarity between OTUs within 2 libraries
Morisita-Horn: Similarity between OTUs contained within 2 libraries
Jaccard Index: Similarity between finite sample sets, defined as the size of an intersection between samples, divided by the size of the union of the sample sets
ThetaYC : Relative dissimilarity between OTUs
… and More
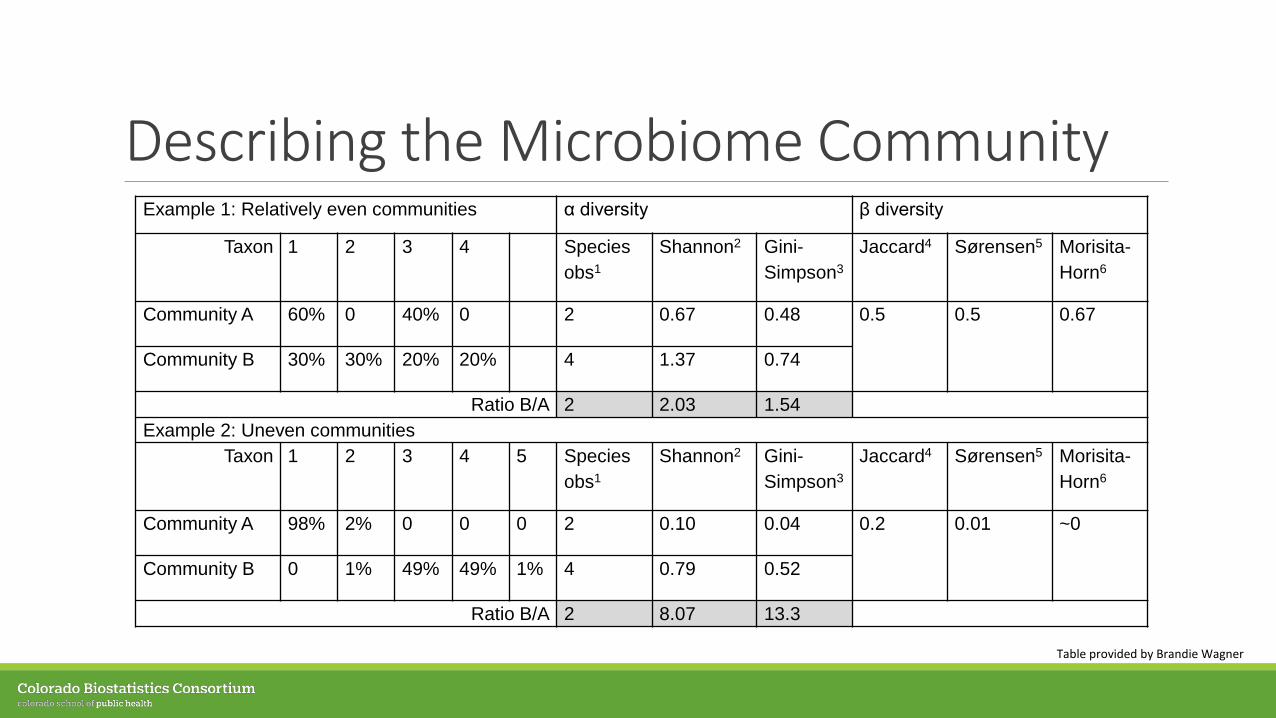
Describing the Microbiome CommunityExample 1: Relatively even communities α diversity β diversity
Taxon 1 2 3 4 Species obs1
Shannon2 Gini-Simpson3
Jaccard4 Sørensen5 Morisita-Horn6
Community A 60% 0 40% 0 2 0.67 0.48 0.5 0.5 0.67
Community B 30% 30% 20% 20% 4 1.37 0.74
Ratio B/A 2 2.03 1.54Example 2: Uneven communities
Taxon 1 2 3 4 5 Species obs1
Shannon2 Gini-Simpson3
Jaccard4 Sørensen5 Morisita-Horn6
Community A 98% 2% 0 0 0 2 0.10 0.04 0.2 0.01 ~0
Community B 0 1% 49% 49% 1% 4 0.79 0.52
Ratio B/A 2 8.07 13.3
Table provided by Brandie Wagner
Community Level AnalysisAlpha Diversity: Testing depends on the diversity measure used◦ Sobs is count data◦ Shannon’s tends to look normal, may fit assumptions for standard regressions
PERMANOVA◦ Permutation-based ANOVA using beta diversity measures (e.g. Bray Curtis)◦ Assess effect of independent variables on the microbiome community
MiRKAT◦ Kernal machine learning approach based on beta diversity measures◦ Kernal methods are a class of algorithms to study general relationships in datasets◦ Outcome is our variable / classifier of interest, microbiome (diversity) is our predictor
This is a field of ongoing research and new methods are in progress!
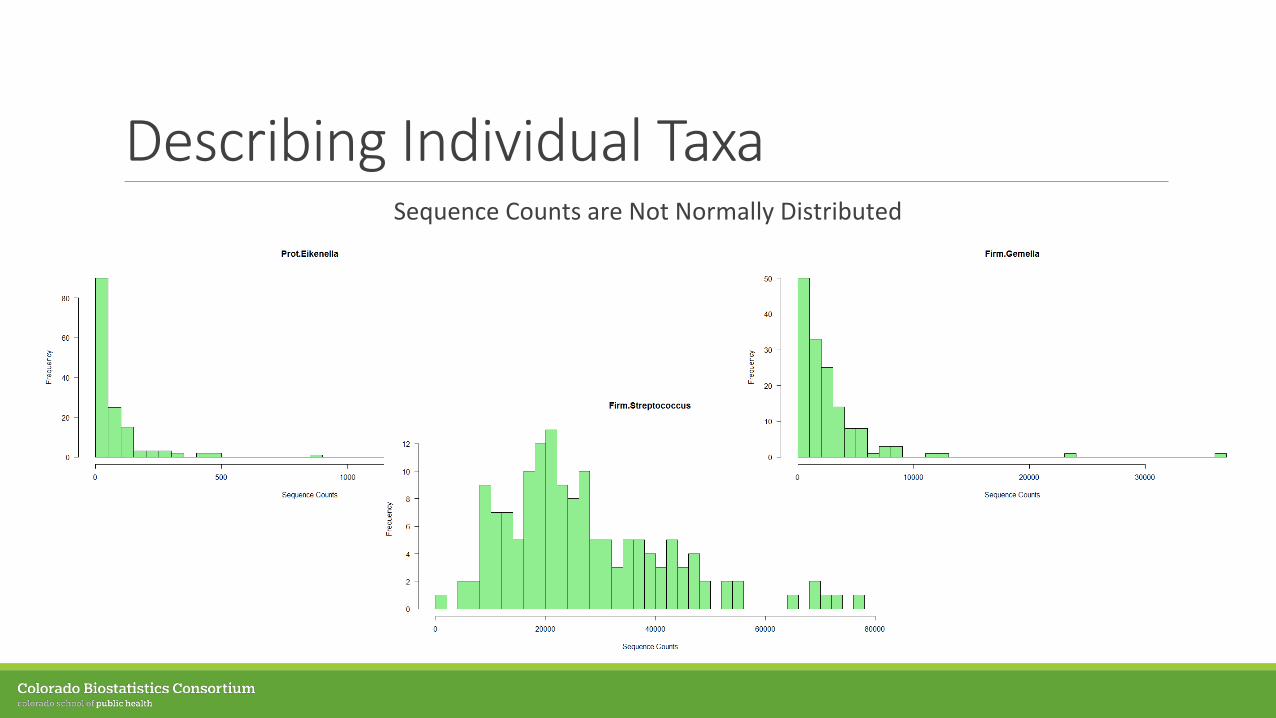
Describing Individual TaxaSequence Counts are Not Normally Distributed
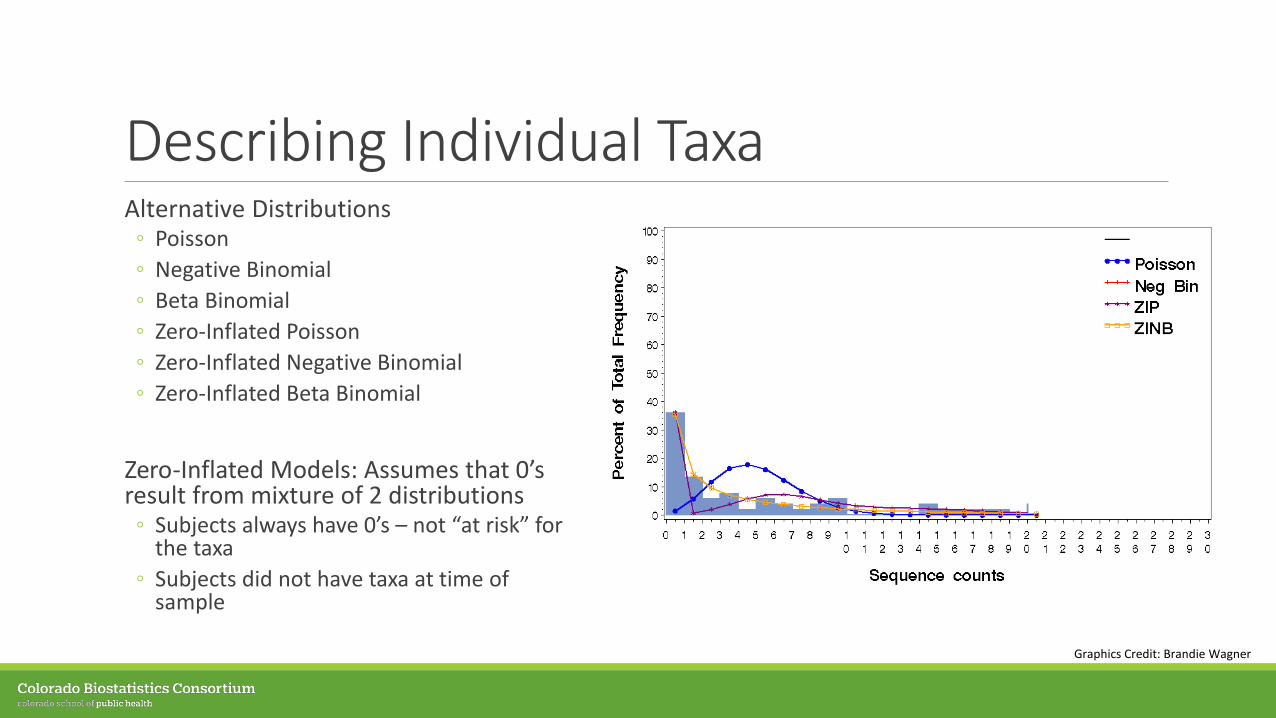
Describing Individual TaxaAlternative Distributions◦ Poisson◦ Negative Binomial◦ Beta Binomial◦ Zero-Inflated Poisson◦ Zero-Inflated Negative Binomial◦ Zero-Inflated Beta Binomial
Zero-Inflated Models: Assumes that 0’s result from mixture of 2 distributions◦ Subjects always have 0’s – not “at risk” for
the taxa◦ Subjects did not have taxa at time of
sample
Graphics Credit: Brandie Wagner

Individual Taxa AnalysisWilcoxon Rank Sum Tests
Individual Regression Models◦ Microbiome as Outcome: assume appropriate distribution (e.g. NB, ZINB, etc.)◦ Microbiome as Predictor: appropriate model depends on outcome choice
Dirichlet-multinomial Model◦ Overall test between predictor of interest and individual taxa◦ Currently unable to identify which taxa account for group differences◦ Limited to small # of taxa (<10)
Data Mining / Machine Learning◦ Random Forest◦ LASSO◦ Network Analyses◦ Plenty more….
This is a field of ongoing research and new methods are in progress ! Things to keep an eye out for:DKAT and GAMuT from Michael Wu’s group, OMiAT from Huilin Li’s group, Testing Dispersion in ZINB models from Jun Chen, and More!
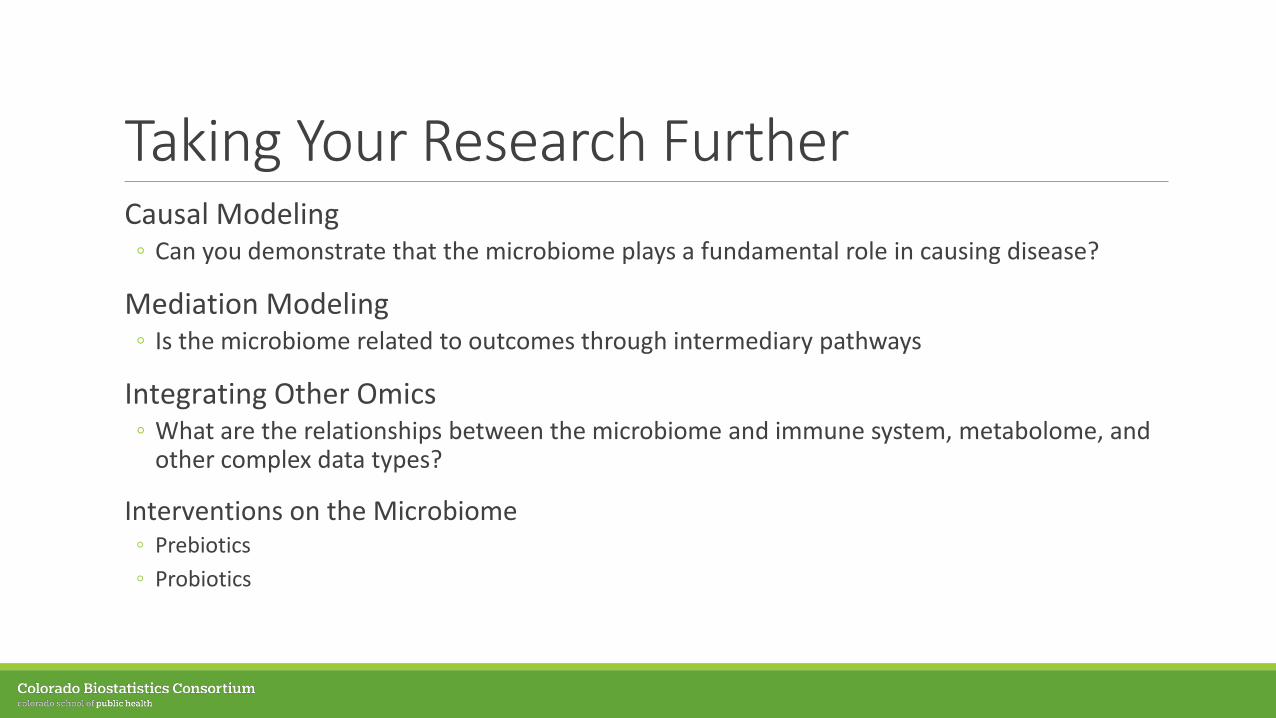
Taking Your Research FurtherCausal Modeling◦ Can you demonstrate that the microbiome plays a fundamental role in causing disease?
Mediation Modeling◦ Is the microbiome related to outcomes through intermediary pathways
Integrating Other Omics◦ What are the relationships between the microbiome and immune system, metabolome, and
other complex data types?
Interventions on the Microbiome◦ Prebiotics ◦ Probiotics

AGENDA
Introducing the Microbiome
Working with your Data
Framing HypothesesAdvice and Common Pitfalls
Other Considerations
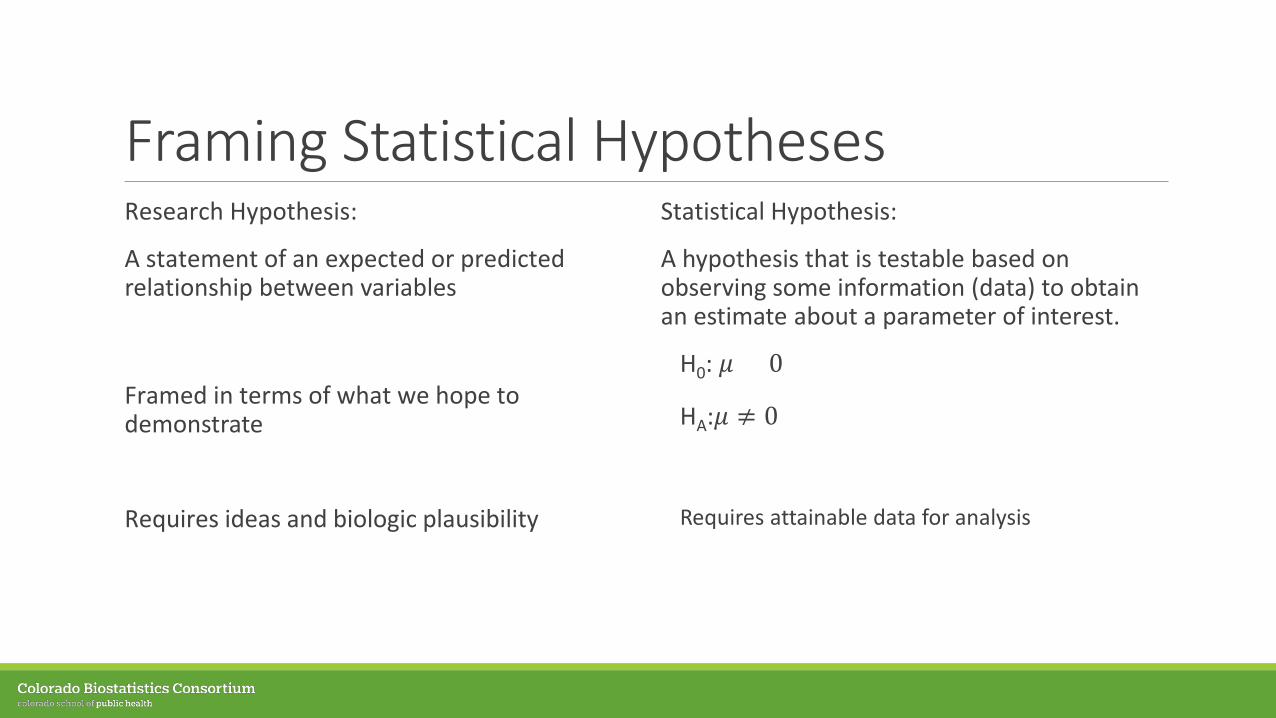
Framing Statistical HypothesesResearch Hypothesis:
A statement of an expected or predicted relationship between variables
Framed in terms of what we hope to demonstrate
Requires ideas and biologic plausibility
Statistical Hypothesis:
A hypothesis that is testable based on observing some information (data) to obtain an estimate about a parameter of interest.
H0: 𝜇𝜇 = 0
HA:𝜇𝜇 ≠ 0
Requires attainable data for analysis
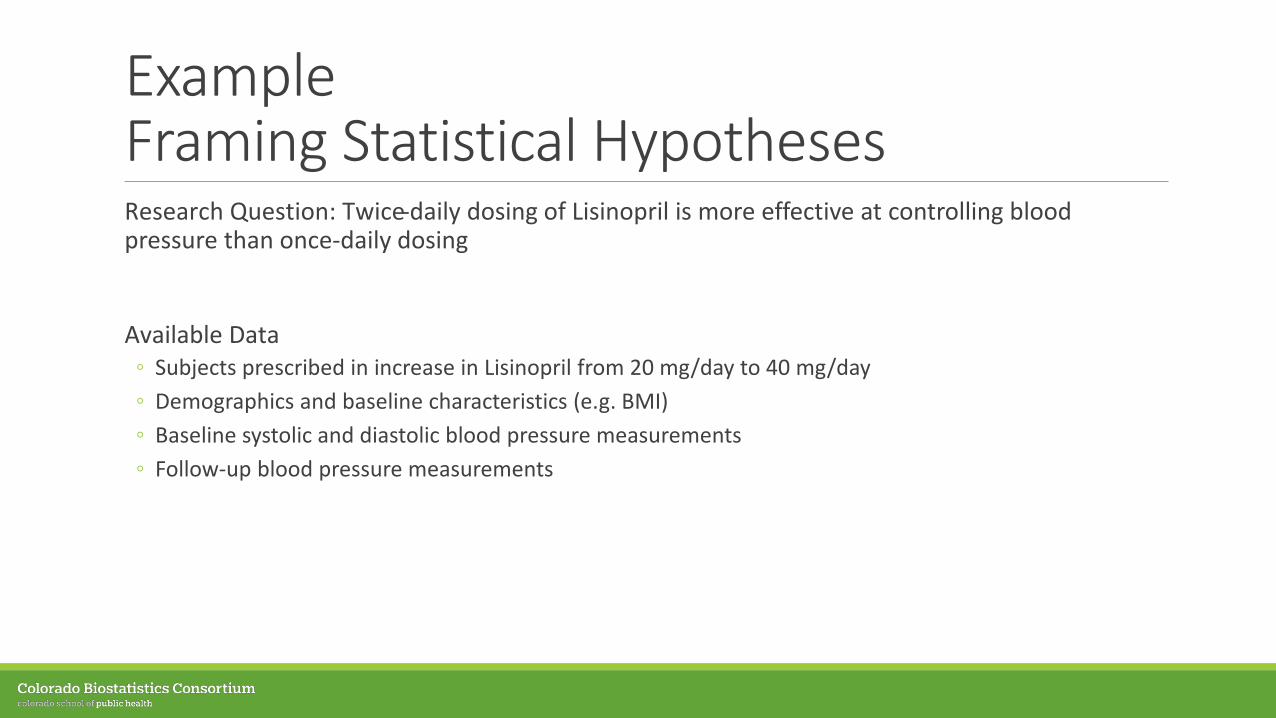
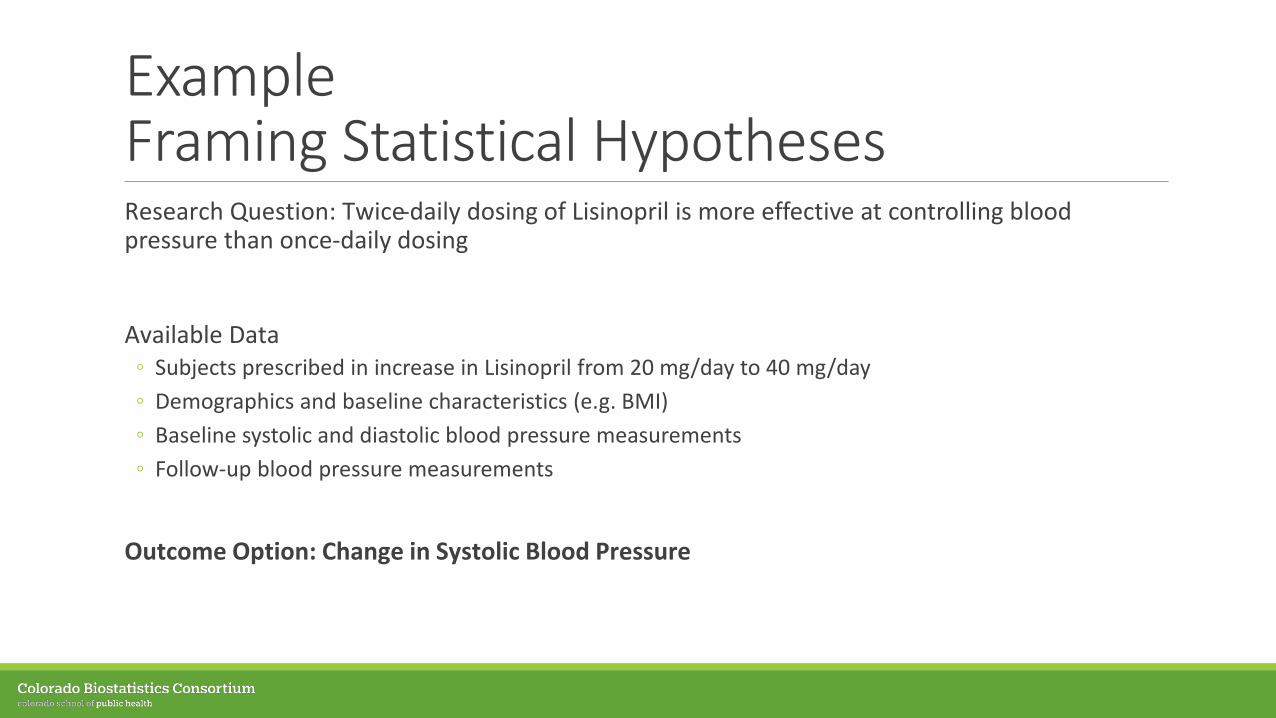
ExampleFraming Statistical HypothesesResearch Question: Twice-daily dosing of Lisinopril is more effective at controlling blood pressure than once-daily dosing
Available Data◦ Subjects prescribed in increase in Lisinopril from 20 mg/day to 40 mg/day◦ Demographics and baseline characteristics (e.g. BMI)◦ Baseline systolic and diastolic blood pressure measurements◦ Follow-up blood pressure measurements
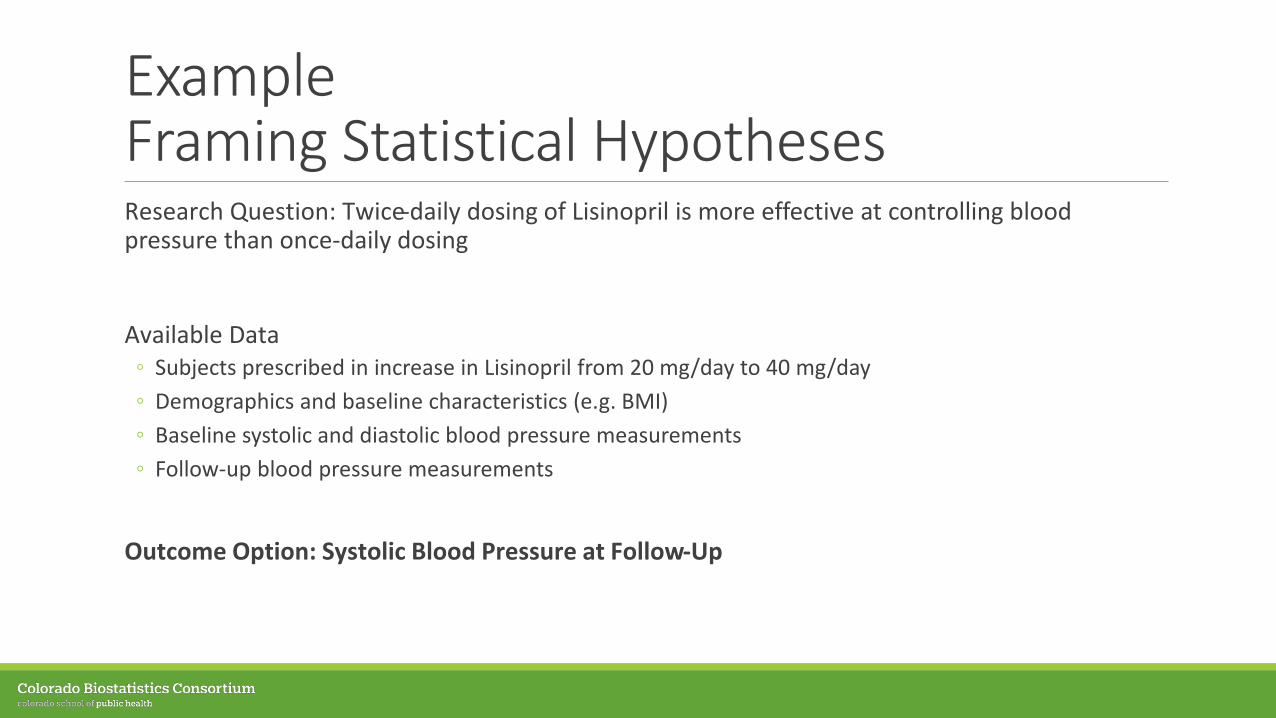
Outcome Option: Systolic Blood Pressure at Follow-Up
ExampleFraming Statistical HypothesesResearch Question: Twice-daily dosing of Lisinopril is more effective at controlling blood pressure than once-daily dosing
Available Data◦ Subjects prescribed in increase in Lisinopril from 20 mg/day to 40 mg/day◦ Demographics and baseline characteristics (e.g. BMI)◦ Baseline systolic and diastolic blood pressure measurements◦ Follow-up blood pressure measurements
Outcome Option: Change in Systolic Blood Pressure
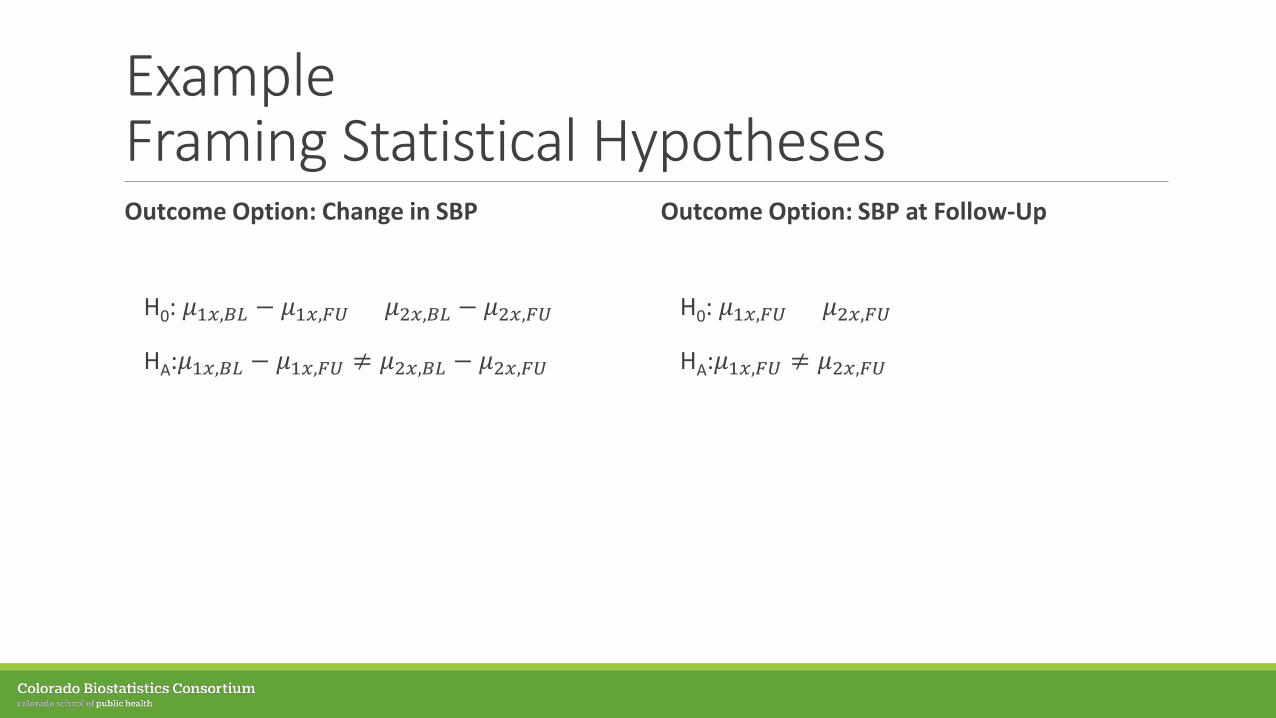
ExampleFraming Statistical HypothesesOutcome Option: Change in SBP
H0: 𝜇𝜇1𝑥𝑥,𝐵𝐵𝐵𝐵 − 𝜇𝜇1𝑥𝑥,𝐹𝐹𝐹𝐹 = 𝜇𝜇2𝑥𝑥,𝐵𝐵𝐵𝐵 − 𝜇𝜇2𝑥𝑥,𝐹𝐹𝐹𝐹
HA:𝜇𝜇1𝑥𝑥,𝐵𝐵𝐵𝐵 − 𝜇𝜇1𝑥𝑥,𝐹𝐹𝐹𝐹 ≠ 𝜇𝜇2𝑥𝑥,𝐵𝐵𝐵𝐵 − 𝜇𝜇2𝑥𝑥,𝐹𝐹𝐹𝐹
Outcome Option: SBP at Follow-Up
H0: 𝜇𝜇1𝑥𝑥,𝐹𝐹𝐹𝐹 = 𝜇𝜇2𝑥𝑥,𝐹𝐹𝐹𝐹
HA:𝜇𝜇1𝑥𝑥,𝐹𝐹𝐹𝐹 ≠ 𝜇𝜇2𝑥𝑥,𝐹𝐹𝐹𝐹
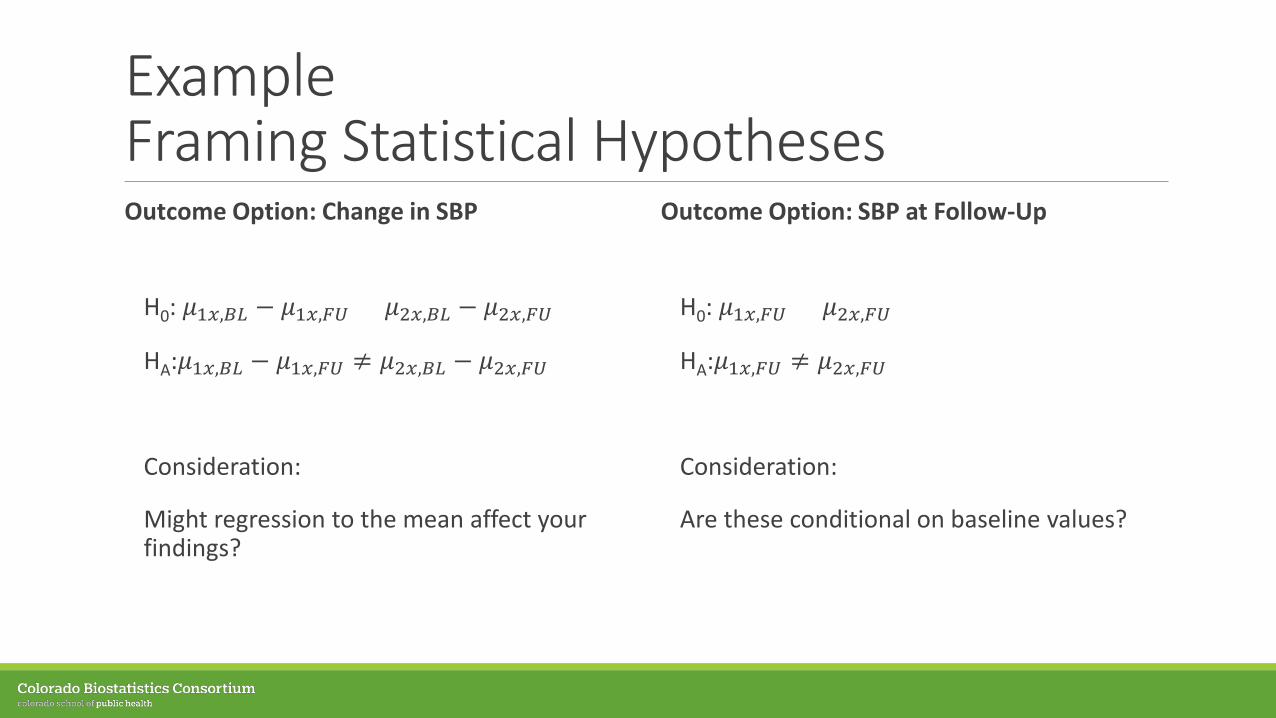
ExampleFraming Statistical HypothesesOutcome Option: Change in SBP
H0: 𝜇𝜇1𝑥𝑥,𝐵𝐵𝐵𝐵 − 𝜇𝜇1𝑥𝑥,𝐹𝐹𝐹𝐹 = 𝜇𝜇2𝑥𝑥,𝐵𝐵𝐵𝐵 − 𝜇𝜇2𝑥𝑥,𝐹𝐹𝐹𝐹
HA:𝜇𝜇1𝑥𝑥,𝐵𝐵𝐵𝐵 − 𝜇𝜇1𝑥𝑥,𝐹𝐹𝐹𝐹 ≠ 𝜇𝜇2𝑥𝑥,𝐵𝐵𝐵𝐵 − 𝜇𝜇2𝑥𝑥,𝐹𝐹𝐹𝐹
Consideration:
Might regression to the mean affect your findings?
Outcome Option: SBP at Follow-Up
H0: 𝜇𝜇1𝑥𝑥,𝐹𝐹𝐹𝐹 = 𝜇𝜇2𝑥𝑥,𝐹𝐹𝐹𝐹
HA:𝜇𝜇1𝑥𝑥,𝐹𝐹𝐹𝐹 ≠ 𝜇𝜇2𝑥𝑥,𝐹𝐹𝐹𝐹
Consideration:
Are these conditional on baseline values?
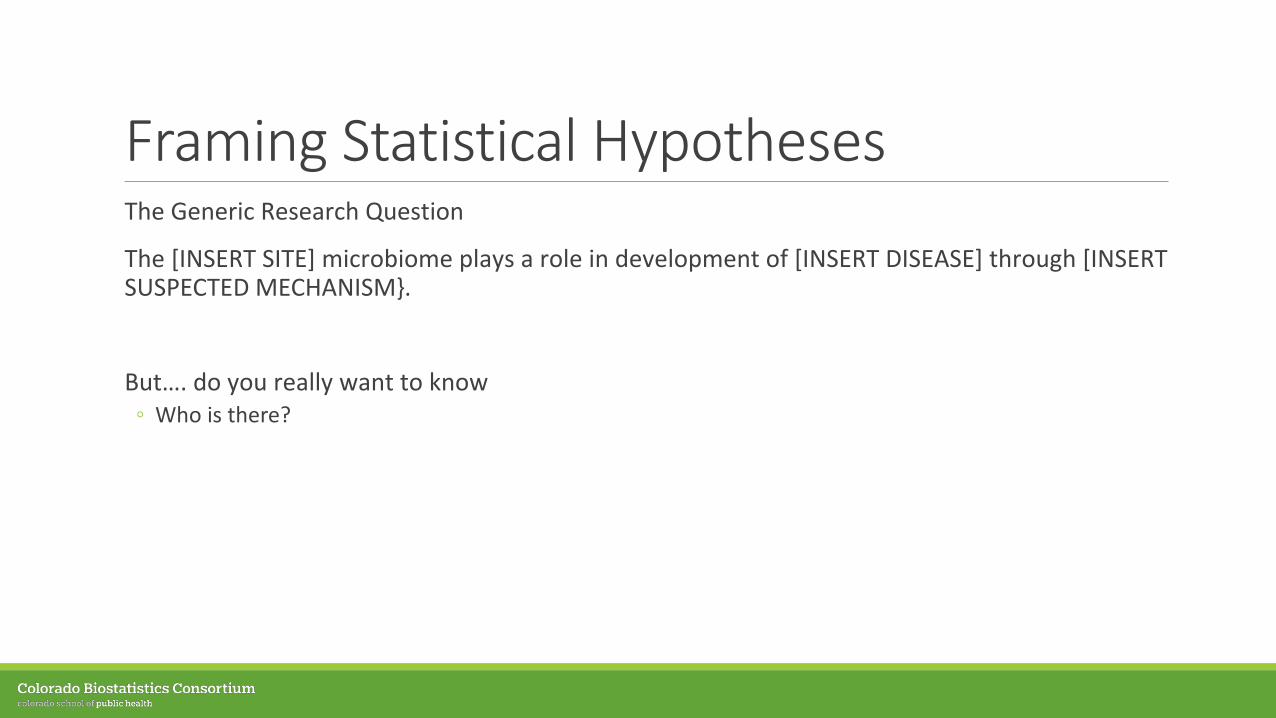
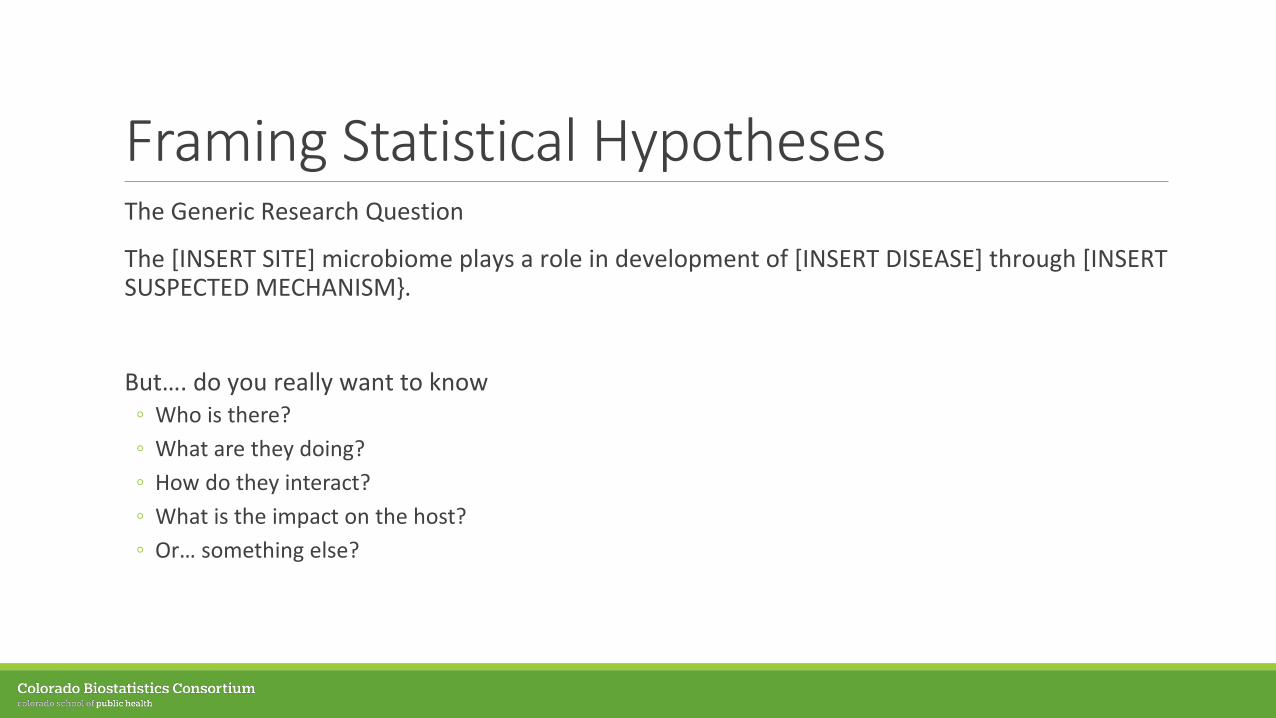
Framing Statistical HypothesesThe Generic Research Question
The [INSERT SITE] microbiome plays a role in development of [INSERT DISEASE] through [INSERT SUSPECTED MECHANISM}.
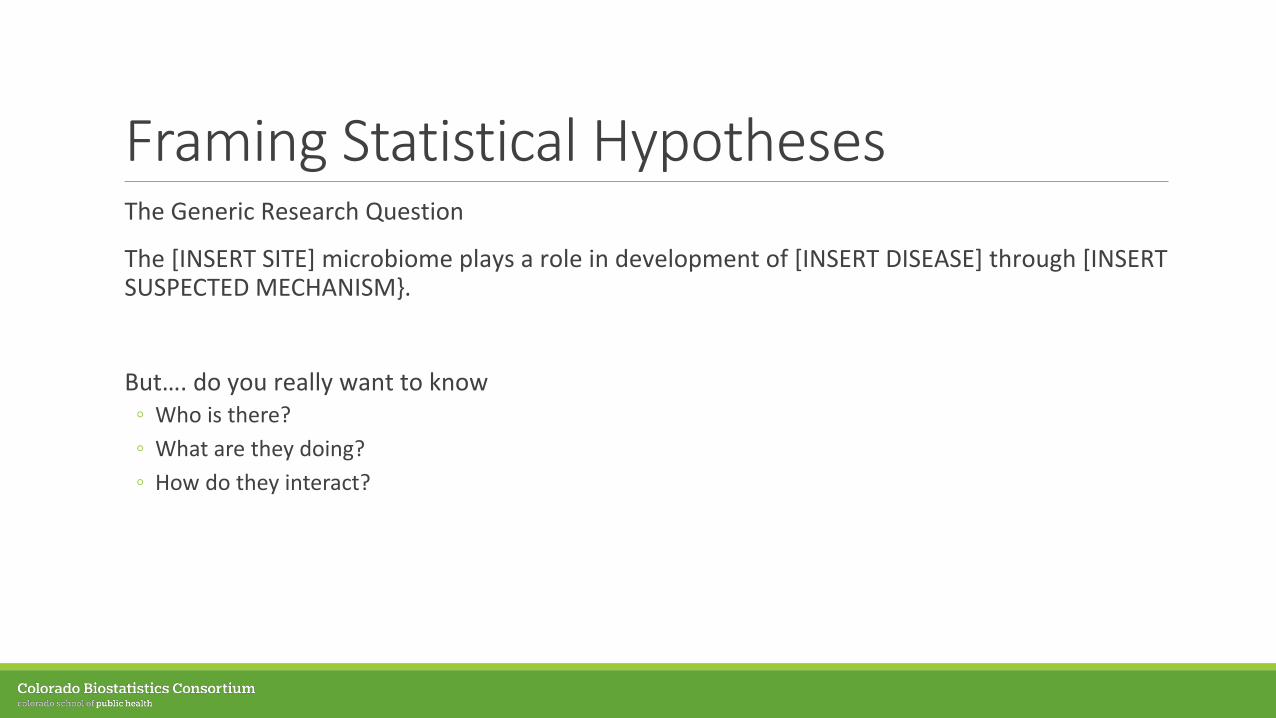
Framing Statistical HypothesesThe Generic Research Question
The [INSERT SITE] microbiome plays a role in development of [INSERT DISEASE] through [INSERT SUSPECTED MECHANISM}.
But…. do you really want to know ◦ Who is there?
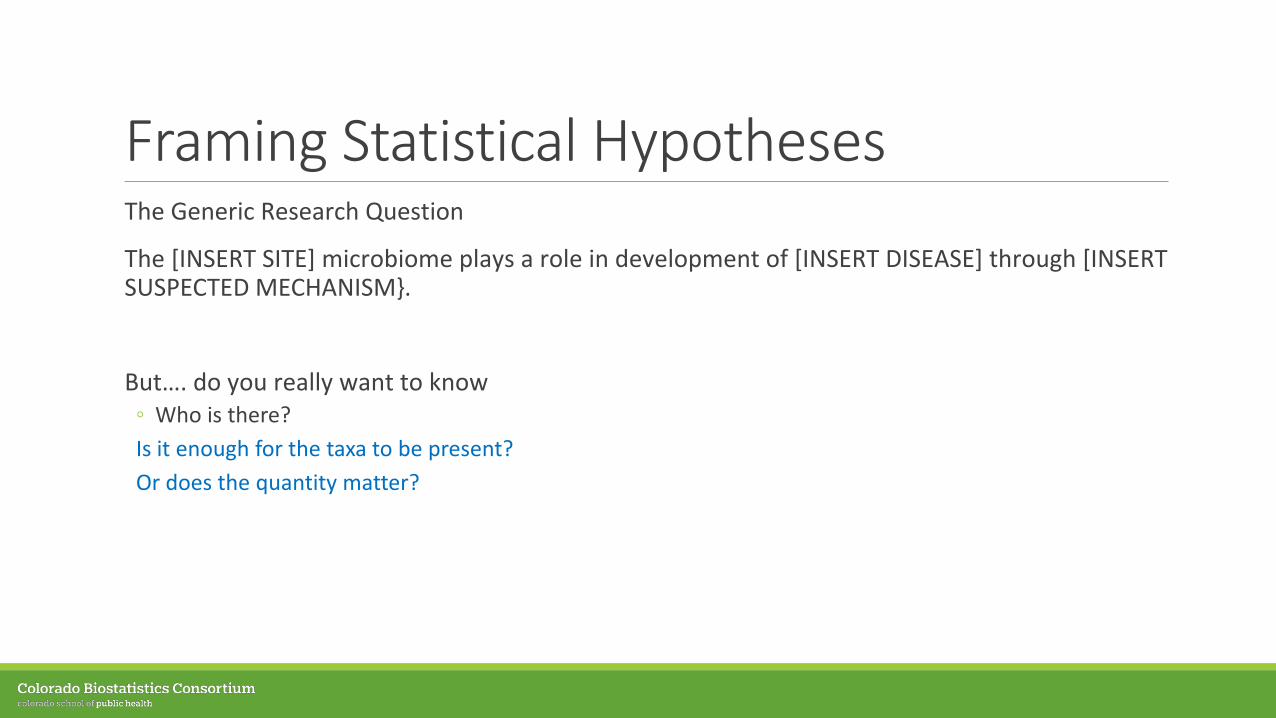
Framing Statistical HypothesesThe Generic Research Question
The [INSERT SITE] microbiome plays a role in development of [INSERT DISEASE] through [INSERT SUSPECTED MECHANISM}.
But…. do you really want to know ◦ Who is there?Is it enough for the taxa to be present?Or does the quantity matter?
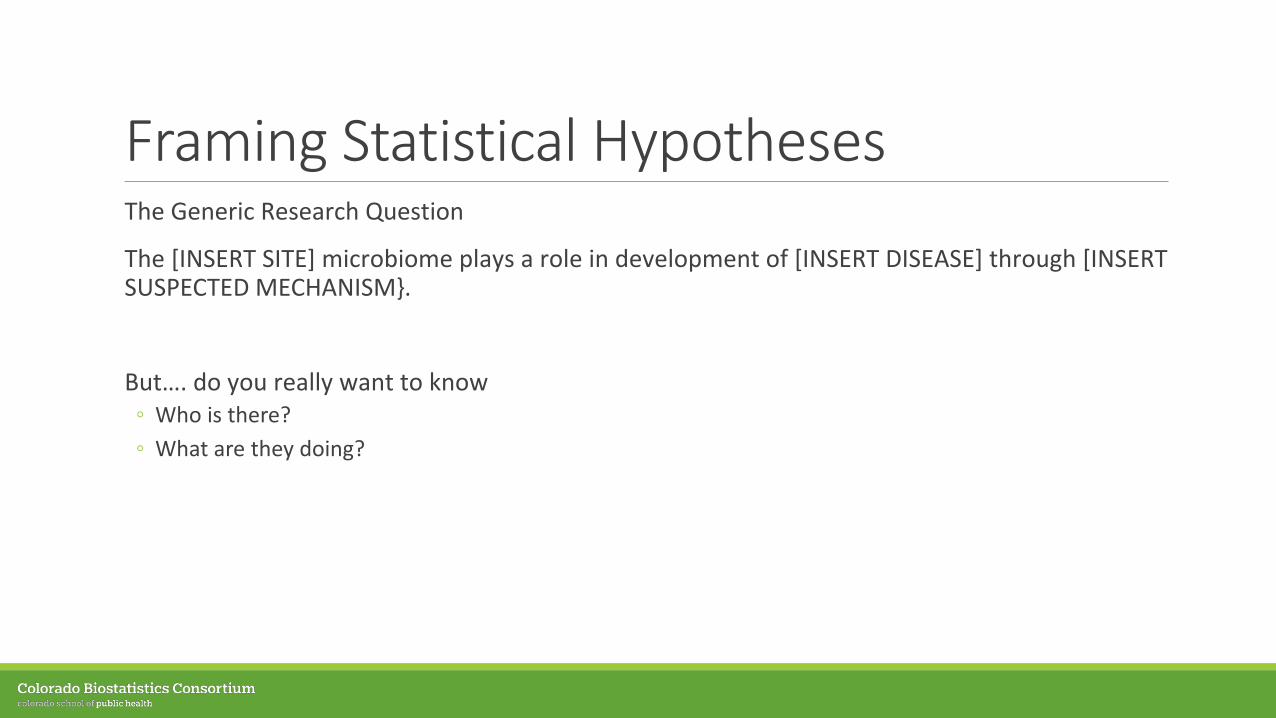
Framing Statistical HypothesesThe Generic Research Question
The [INSERT SITE] microbiome plays a role in development of [INSERT DISEASE] through [INSERT SUSPECTED MECHANISM}.
But…. do you really want to know ◦ Who is there?◦ What are they doing?
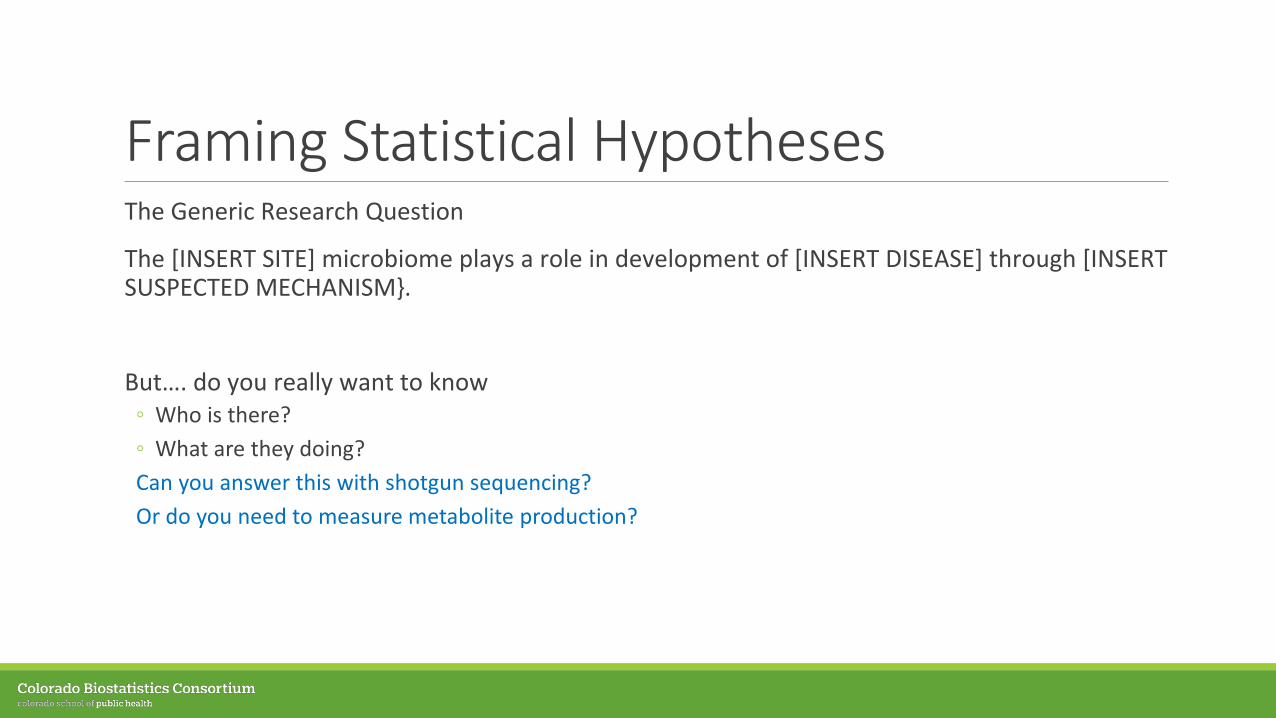
Framing Statistical HypothesesThe Generic Research Question
The [INSERT SITE] microbiome plays a role in development of [INSERT DISEASE] through [INSERT SUSPECTED MECHANISM}.
But…. do you really want to know ◦ Who is there?◦ What are they doing?Can you answer this with shotgun sequencing? Or do you need to measure metabolite production?
Framing Statistical HypothesesThe Generic Research Question
The [INSERT SITE] microbiome plays a role in development of [INSERT DISEASE] through [INSERT SUSPECTED MECHANISM}.
But…. do you really want to know ◦ Who is there?◦ What are they doing?◦ How do they interact?
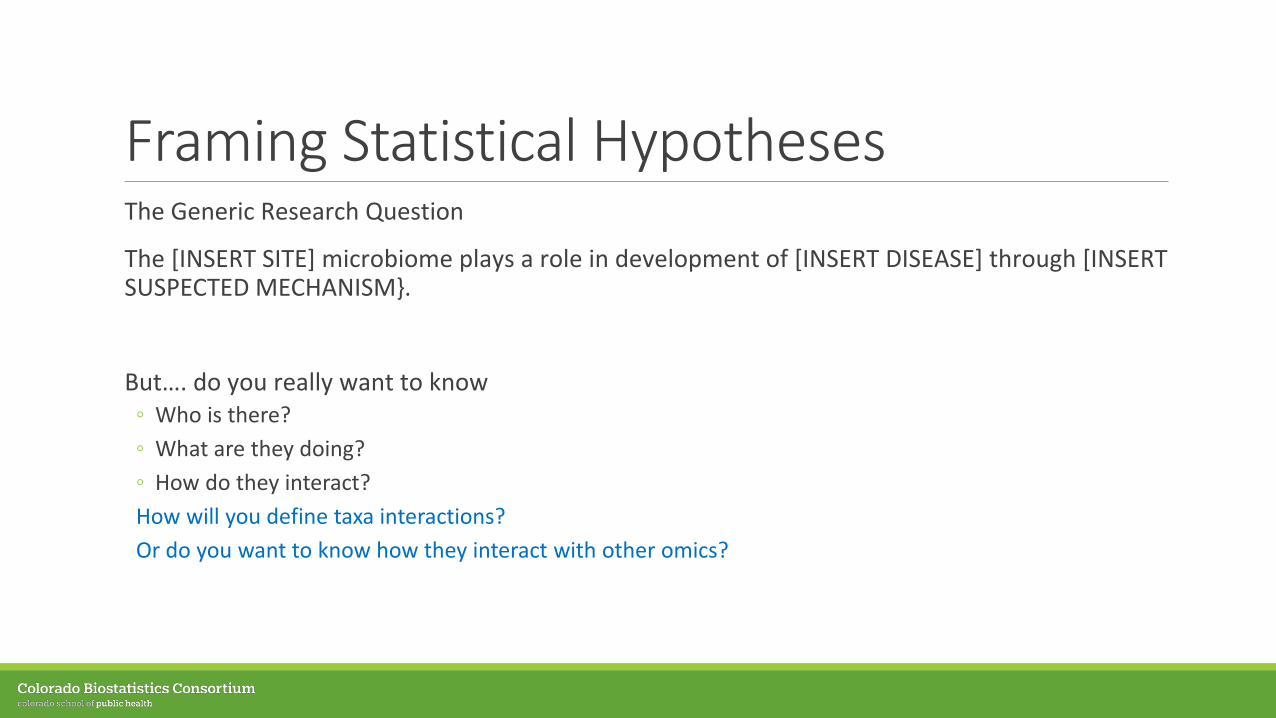
Framing Statistical HypothesesThe Generic Research Question
The [INSERT SITE] microbiome plays a role in development of [INSERT DISEASE] through [INSERT SUSPECTED MECHANISM}.
But…. do you really want to know ◦ Who is there?◦ What are they doing?◦ How do they interact?How will you define taxa interactions?Or do you want to know how they interact with other omics?
Framing Statistical HypothesesThe Generic Research Question
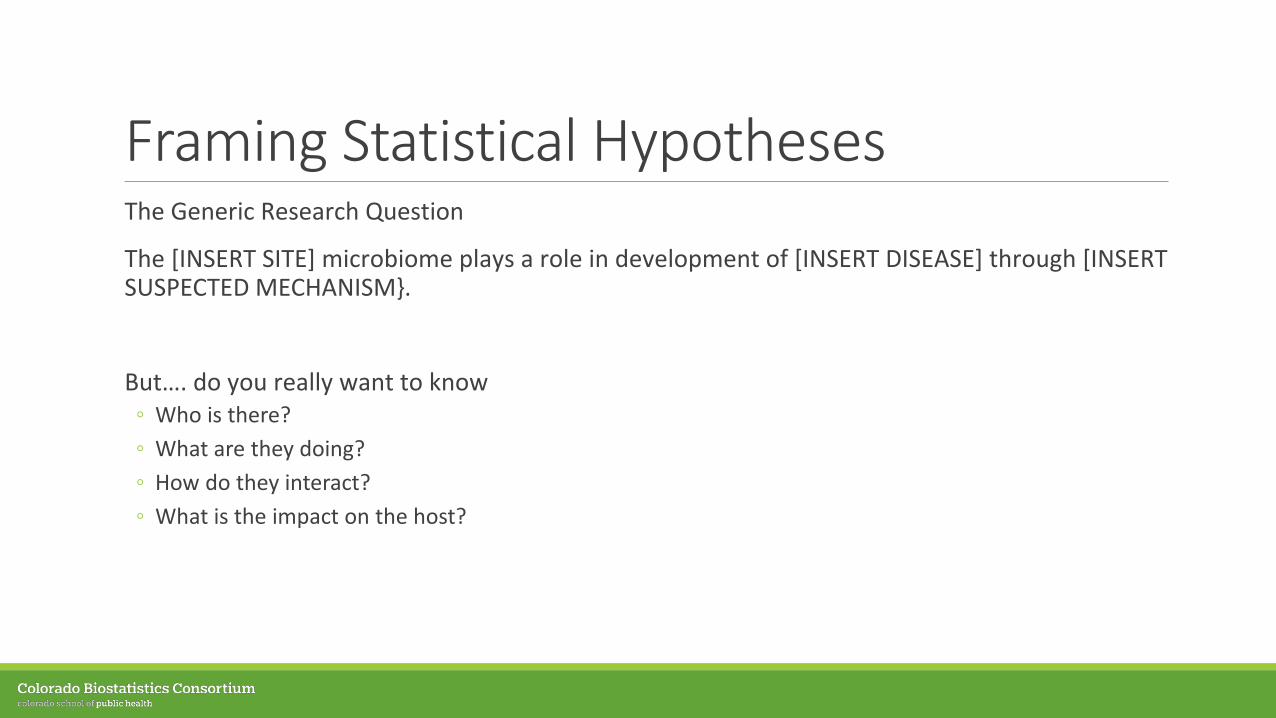
The [INSERT SITE] microbiome plays a role in development of [INSERT DISEASE] through [INSERT SUSPECTED MECHANISM}.
But…. do you really want to know ◦ Who is there?◦ What are they doing?◦ How do they interact?◦ What is the impact on the host?
Framing Statistical HypothesesThe Generic Research Question
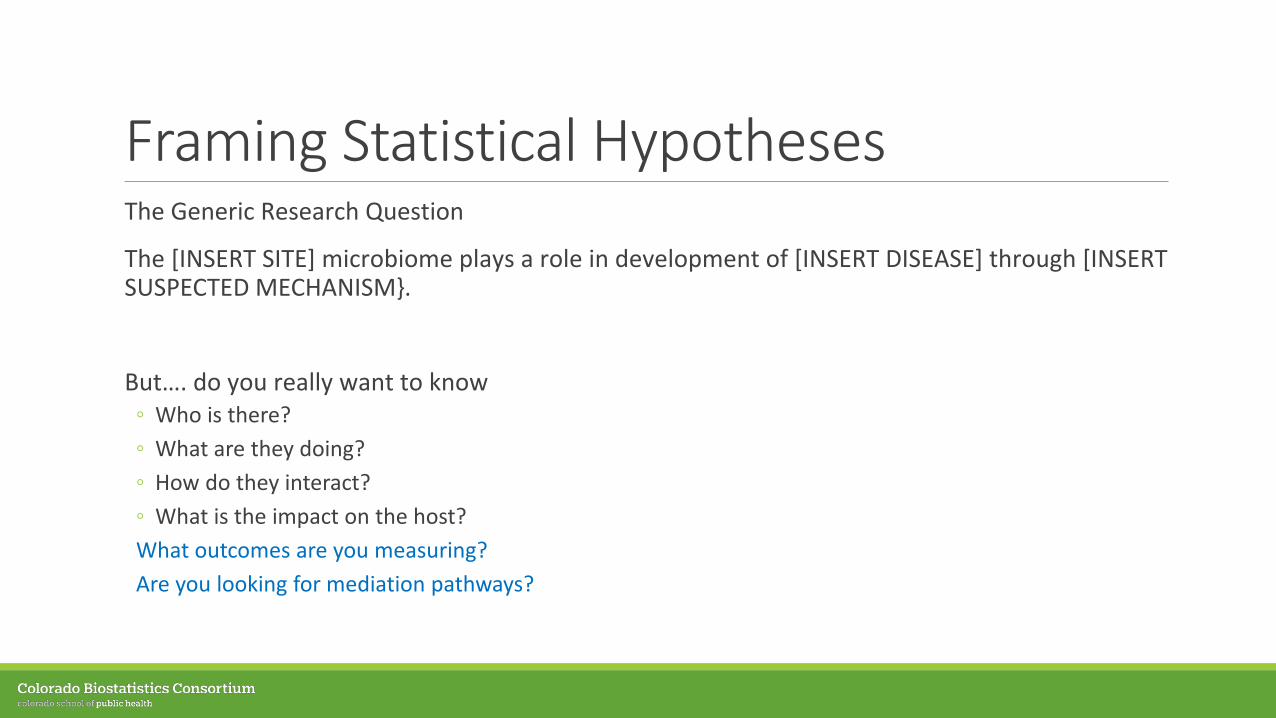
The [INSERT SITE] microbiome plays a role in development of [INSERT DISEASE] through [INSERT SUSPECTED MECHANISM}.
But…. do you really want to know ◦ Who is there?◦ What are they doing?◦ How do they interact?◦ What is the impact on the host?What outcomes are you measuring? Are you looking for mediation pathways?
Framing Statistical HypothesesThe Generic Research Question
The [INSERT SITE] microbiome plays a role in development of [INSERT DISEASE] through [INSERT SUSPECTED MECHANISM}.
But…. do you really want to know ◦ Who is there?◦ What are they doing?◦ How do they interact?◦ What is the impact on the host?◦ Or… something else?

Team Science Plug
Graphics Credit: Noshir Contractor
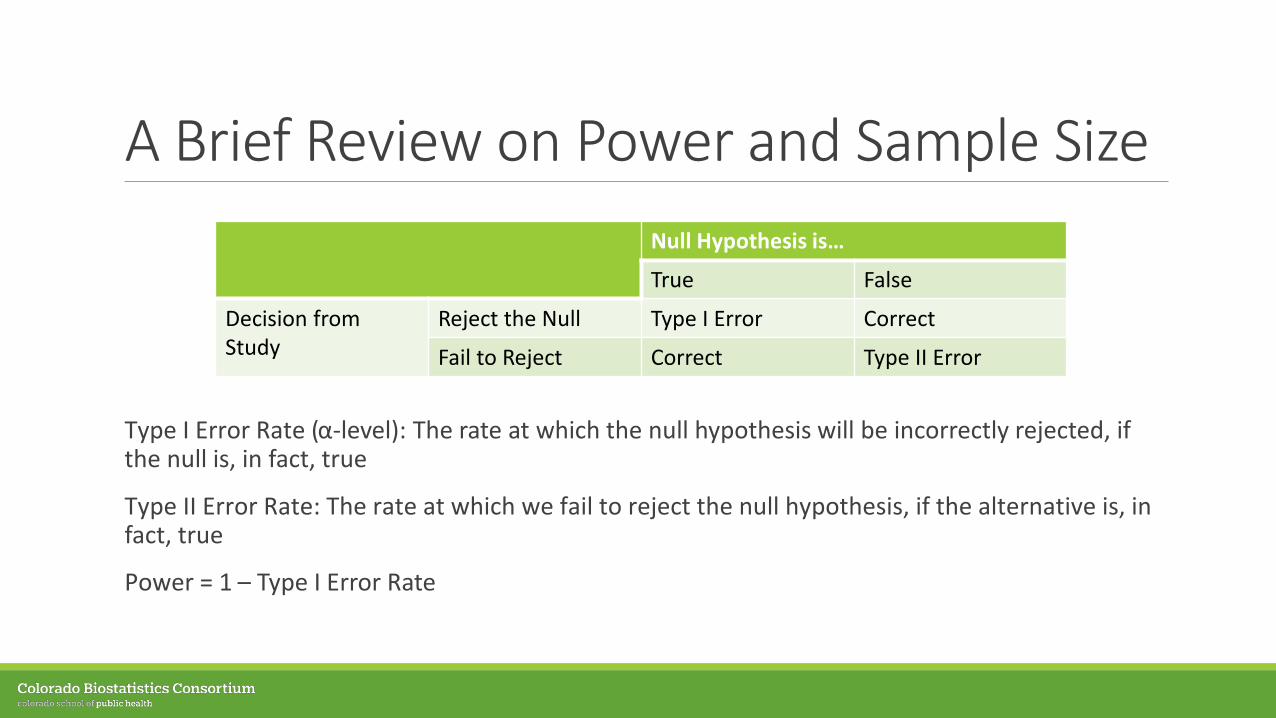
A Brief Review on Power and Sample Size
Type I Error Rate (α-level): The rate at which the null hypothesis will be incorrectly rejected, if the null is, in fact, true
Type II Error Rate: The rate at which we fail to reject the null hypothesis, if the alternative is, in fact, true
Power = 1 – Type I Error Rate
Null Hypothesis is…
True False
Decision from Study
Reject the Null Type I Error Correct
Fail to Reject Correct Type II Error
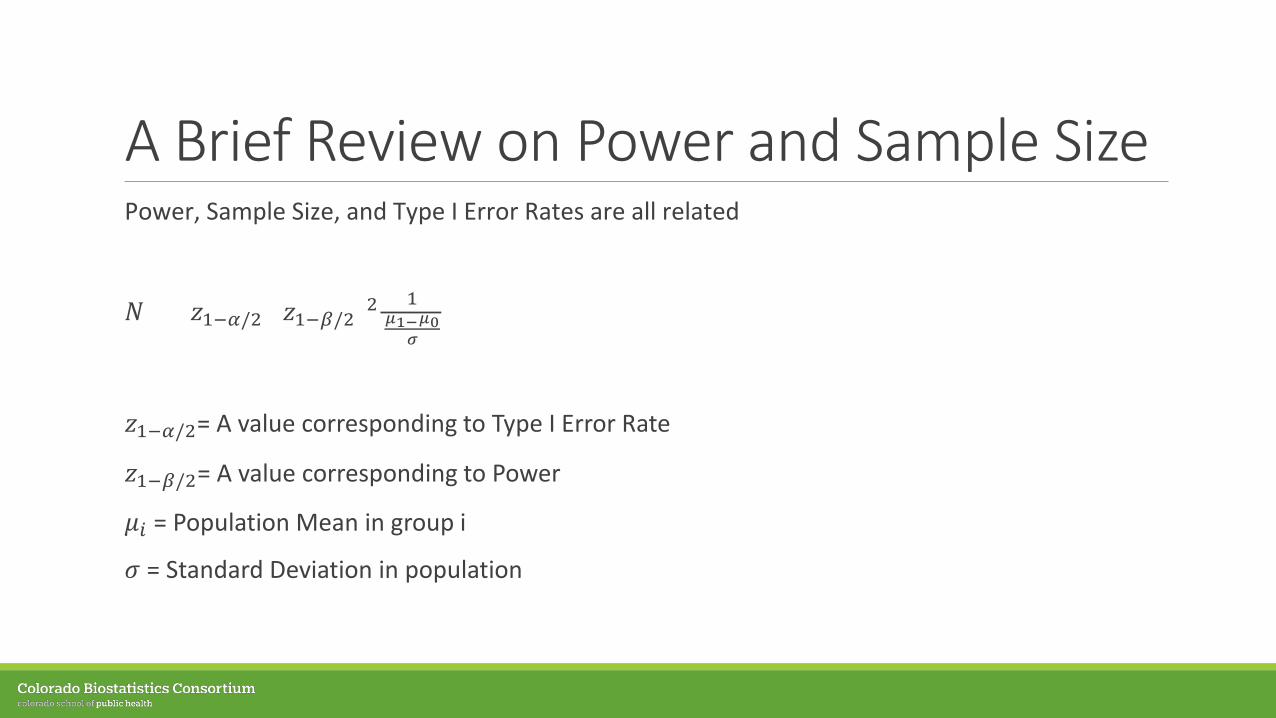
A Brief Review on Power and Sample SizePower, Sample Size, and Type I Error Rates are all related
𝑁𝑁 = (𝑧𝑧1−𝛼𝛼/2+𝑧𝑧1−𝛽𝛽/2)2 1𝜇𝜇1−𝜇𝜇0
𝜎𝜎
𝑧𝑧1−𝛼𝛼/2= A value corresponding to Type I Error Rate
𝑧𝑧1−𝛽𝛽/2= A value corresponding to Power
𝜇𝜇𝐼𝐼 = Population Mean in group i
𝜎𝜎 = Standard Deviation in population
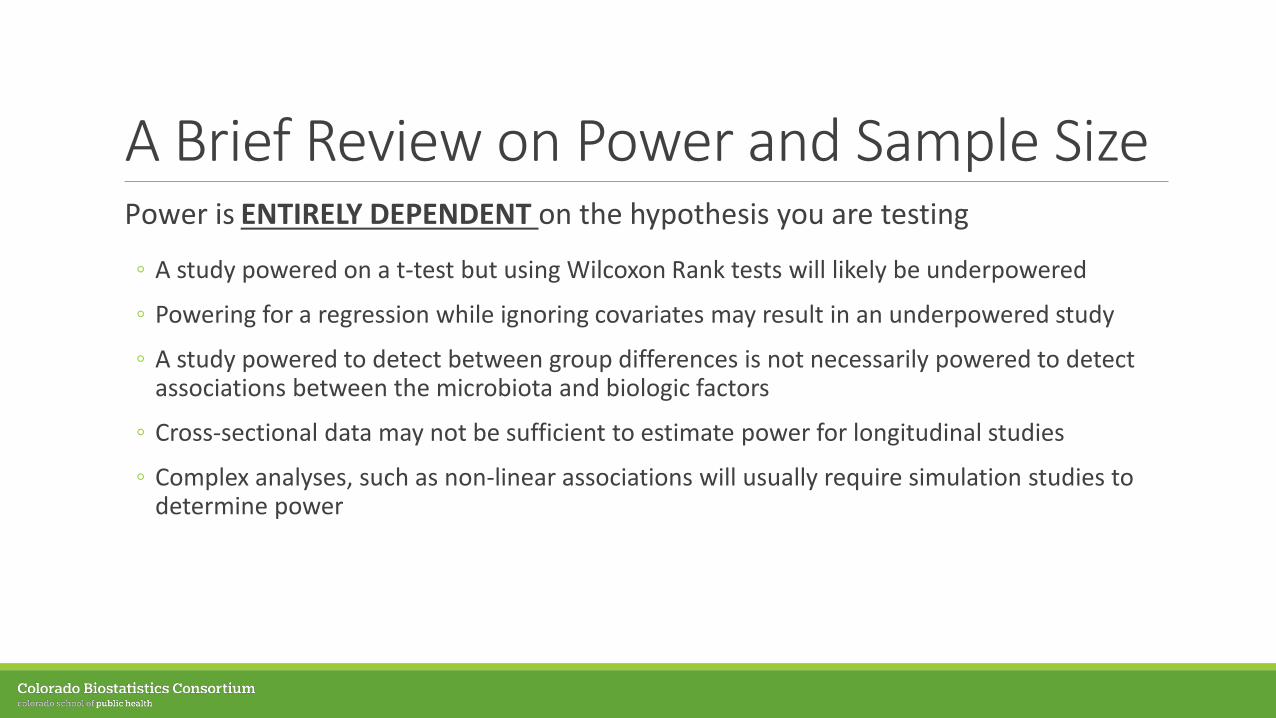
A Brief Review on Power and Sample SizePower is ENTIRELY DEPENDENT on the hypothesis you are testing
◦ A study powered on a t-test but using Wilcoxon Rank tests will likely be underpowered
◦ Powering for a regression while ignoring covariates may result in an underpowered study
◦ A study powered to detect between group differences is not necessarily powered to detect associations between the microbiota and biologic factors
◦ Cross-sectional data may not be sufficient to estimate power for longitudinal studies
◦ Complex analyses, such as non-linear associations will usually require simulation studies to determine power
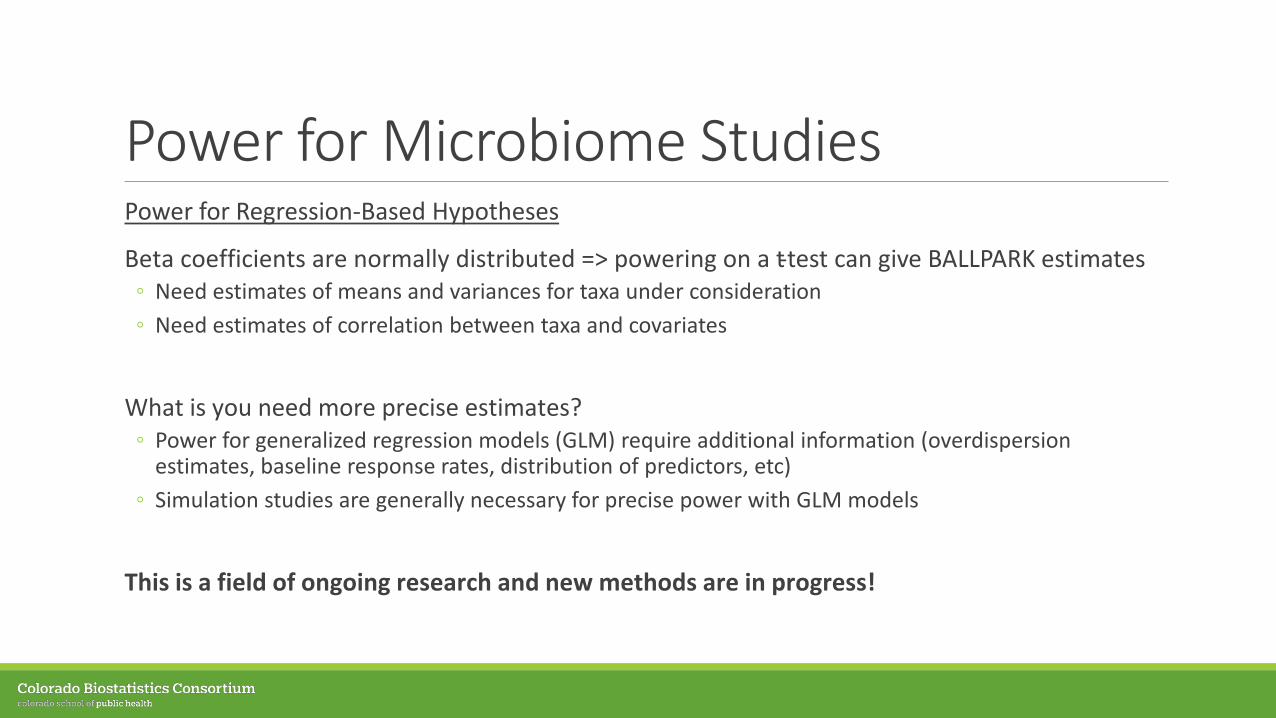
Power for Microbiome StudiesPower for Regression-Based Hypotheses
Beta coefficients are normally distributed => powering on a t-test can give BALLPARK estimates◦ Need estimates of means and variances for taxa under consideration◦ Need estimates of correlation between taxa and covariates
What is you need more precise estimates? ◦ Power for generalized regression models (GLM) require additional information (overdispersion
estimates, baseline response rates, distribution of predictors, etc)◦ Simulation studies are generally necessary for precise power with GLM models
This is a field of ongoing research and new methods are in progress!

Power for Microbiome StudiesPower for PERMANOVA analysis◦ Only valid if using this method (PERMANOVA) for analyses◦ Requires estimates of the distance / diversity measure of interest◦ Uses HMP data for estimating unweighted Jaccard distances◦ Other distance matrices need to be simulated / estimated by the user
Power for Dirchlet-Multinomial analysis◦ Only valid if using this method for analyses◦ Estimated taxa frequencies◦ Estimated amount of overdispersion (increase in variance with respect to mean)
This is a field of ongoing research and new methods are in progress!
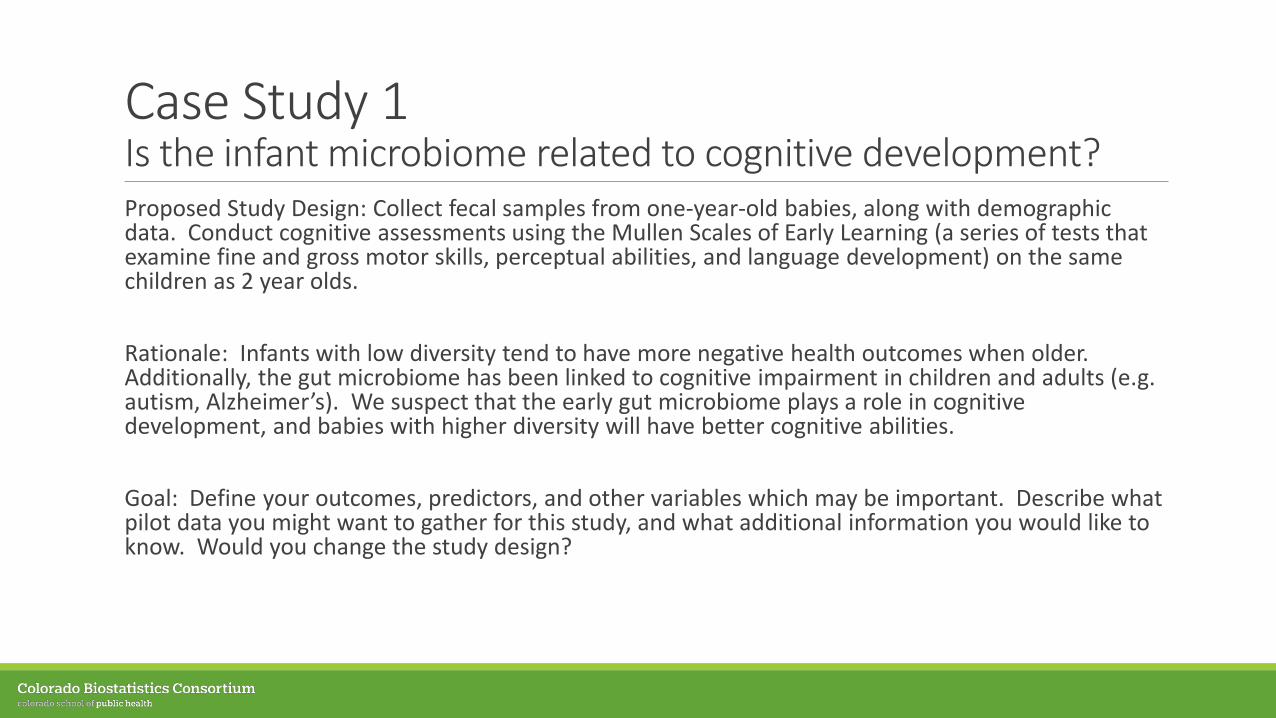
Case Study 1Is the infant microbiome related to cognitive development?Proposed Study Design: Collect fecal samples from one-year-old babies, along with demographic data. Conduct cognitive assessments using the Mullen Scales of Early Learning (a series of tests that examine fine and gross motor skills, perceptual abilities, and language development) on the same children as 2 year olds.
Rationale: Infants with low diversity tend to have more negative health outcomes when older. Additionally, the gut microbiome has been linked to cognitive impairment in children and adults (e.g. autism, Alzheimer’s). We suspect that the early gut microbiome plays a role in cognitive development, and babies with higher diversity will have better cognitive abilities.
Goal: Define your outcomes, predictors, and other variables which may be important. Describe what pilot data you might want to gather for this study, and what additional information you would like to know. Would you change the study design?
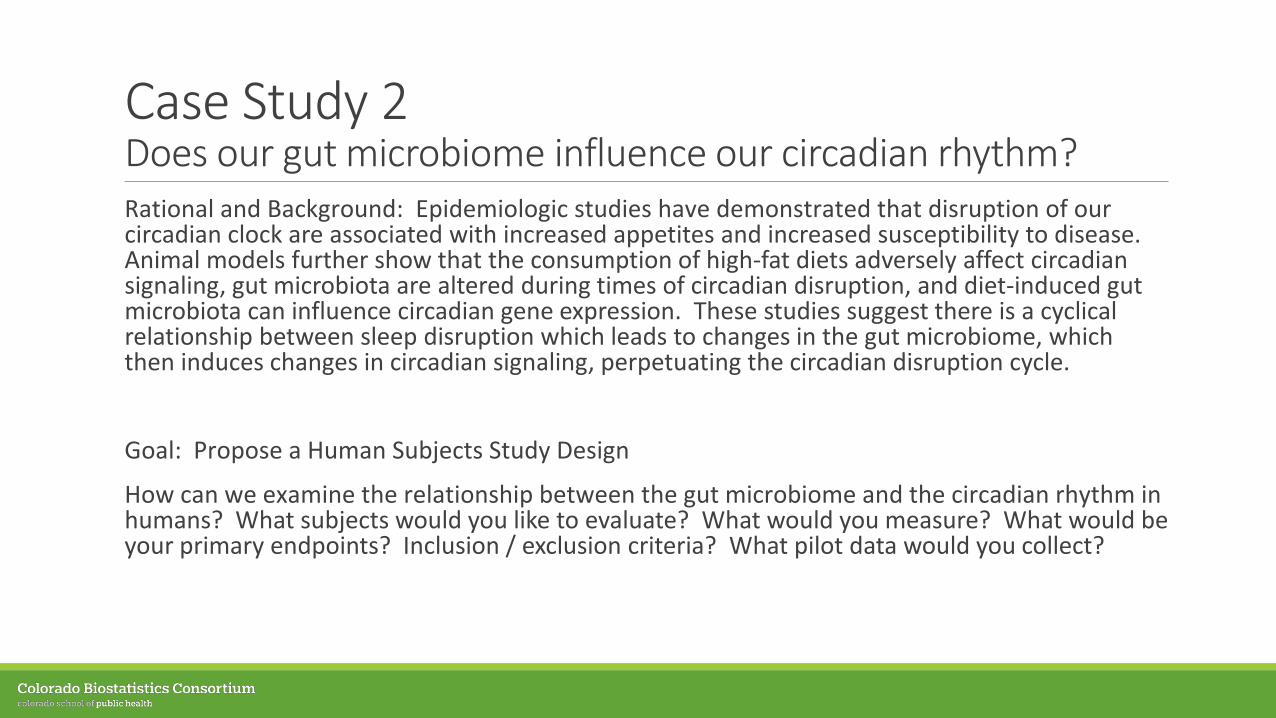
Case Study 2Does our gut microbiome influence our circadian rhythm?Rational and Background: Epidemiologic studies have demonstrated that disruption of our circadian clock are associated with increased appetites and increased susceptibility to disease. Animal models further show that the consumption of high-fat diets adversely affect circadian signaling, gut microbiota are altered during times of circadian disruption, and diet-induced gut microbiota can influence circadian gene expression. These studies suggest there is a cyclical relationship between sleep disruption which leads to changes in the gut microbiome, which then induces changes in circadian signaling, perpetuating the circadian disruption cycle.
Goal: Propose a Human Subjects Study Design
How can we examine the relationship between the gut microbiome and the circadian rhythm in humans? What subjects would you like to evaluate? What would you measure? What would be your primary endpoints? Inclusion / exclusion criteria? What pilot data would you collect?
AGENDA
Introducing the Microbiome
Working with your Data
Framing HypothesesAdvice and Common Pitfalls
Other Considerations
Advice from Jennifer CouchProgram Officer, Division of Cancer BiologyJennifer’s List of Do’s:
◦ Talk to a program director before sending in your project
◦ Consider your reviewer audience
◦ Try to consider your proposal from the reviewer’s perspective
◦ Make sure your team’s expertise is obvious to the reviewers
◦ Work as a team when writing your proposal

Advice from Jennifer CouchProgram Officer, Division of Cancer BiologyJennifer’s List of Do’s:
◦ Talk to a program director before sending in your project
◦ Contact any of us with a short description of your planned project and we will email it to colleagues until we find you the program director with the right expertise to help you best with your potential application. If you don’t hear back in a week, send a reminder – we get a lot of email and it sometimes just gets lost.
Advice from Jennifer CouchProgram Officer, Division of Cancer BiologyJennifer’s List of Do’s:
◦ Consider your reviewer audience
◦ Consider who is reviewing the grant and what expertise they, as a group, will have. For example, if your application is something like “network dynamics of human microbiome in early infant development”, you might wan that reviewed by people who understood the math, the microbiome, and child development experts. But, likely a study section will be heavy on one of those areas and light on the others. So, consider which seems right, and account for the sparse expertise in other areas by over explaining the importance, difficult, and what makes your approach special and interesting.

Advice from Jennifer CouchProgram Officer, Division of Cancer BiologyJennifer’s List of Do’s:
◦ Try to consider your proposal from the reviewer’s perspective
◦ If you received this application from another person that you didn’t know and were asked to review it, what would you find compelling? Where would you find annoying details left out? Have someone you trust, who is not part of the project, read your proposal and provide feedback.
Advice from Jennifer CouchProgram Officer, Division of Cancer BiologyJennifer’s List of Do’s:
◦ Make sure your team’s expertise is obvious to the reviewers
◦ Often projects are criticized for lack of a biologist, lack of a clinician, or lack of a data science expert. Sometimes, projects do have those expertise areas but it was not clear from the biosketch or titles of the people, OR it was not clear from the way the project was written.
Advice from Jennifer CouchProgram Officer, Division of Cancer BiologyJennifer’s List of Do’s:
◦ Work as a team when writing your proposal
◦ Make sure all aspects of the proposal are written clearly so that an expert in that area will be convinced. One person can write the whole grant application, but they need to use the right language and way of describing the parts they may be less familiar with (often the statistics or the technology). Work as a team to write it.
Graphics Credit: Noshir Contractor
Advice from Jennifer CouchProgram Officer, Division of Cancer BiologyJennifer’s List of Don’ts:
◦ Include too many variables and technologies
◦ Be overly ambitious
◦ Assume you should do an R21 simply because you have no preliminary data
◦ If you’re an early stage investigator planning a multi-PI project, don’t have a seasoned investigator as your co-PI
◦ Propose large screening studies with no focus

Advice from Jennifer CouchProgram Officer, Division of Cancer BiologyJennifer’s List of Don’ts:
◦ Include too many variables to investigate
◦ We often see a new, untested, technology that will be used to investigate a new biological hypothesis or do discovery work. How do we know the technology worked if the biology is also unknown? Or how do we trust the biology if we don’t know that the technology worked? We have funding opportunities that focus on technology development, as well as those that focus on the biological discovery. Choose the right one, ask a program director for help, and don’t try to smash everything together into one project.
Advice from Jennifer CouchProgram Officer, Division of Cancer BiologyJennifer’s List of Don’ts:
◦ Be overly ambitious
◦ New investigators are often criticized for being “overly ambitious”. Provide proof that you and your team have the cumulative expertise and resources to pull off what you propose, in the time you propose. If it sounds like it might be too much, leave parts out.
Advice from Jennifer CouchProgram Officer, Division of Cancer BiologyJennifer’s List of Don’ts:
◦ Assume you should do an R21 simply because you have no preliminary data
◦ An R21 is a pilot or feasibility study, and they are often very competitive. “No data” is not a good reason to choose this mechanism.
Advice from Jennifer CouchProgram Officer, Division of Cancer BiologyJennifer’s List of Don’ts:
◦ If you’re an early stage investigator planning a multi-PI project, don’t have a seasoned investigator as your co-PI
◦ NIH gives breaks, sometimes formally and sometimes informally, for early stage investigators (ESI). This only happens if ALL PIs can be considered early stage. If not, reconsider who needs to be a PI and whether the multi-PI option is enough of a strength to outweigh the ESI advantage, and talk with your program director about it.

Advice from Jennifer CouchProgram Officer, Division of Cancer BiologyJennifer’s List of Don’ts:
◦ Propose large screening studies with no focus
◦ You need to convince the reviewers that there is a good reason that you should be given a lot of money to find something new (you want to avoid the “this is just fishing” comment). Explain why are you are fishing? How will you distinguish the good fish from the bad fish? Have you found good fish in this pond before?
◦ AND, really important, what will you do with this information? Large consortia are sometimes supported to generate information as an end-goal, but rarely smaller projects. Smaller projects need to have a focus, discussion of validations in the lab, etc.
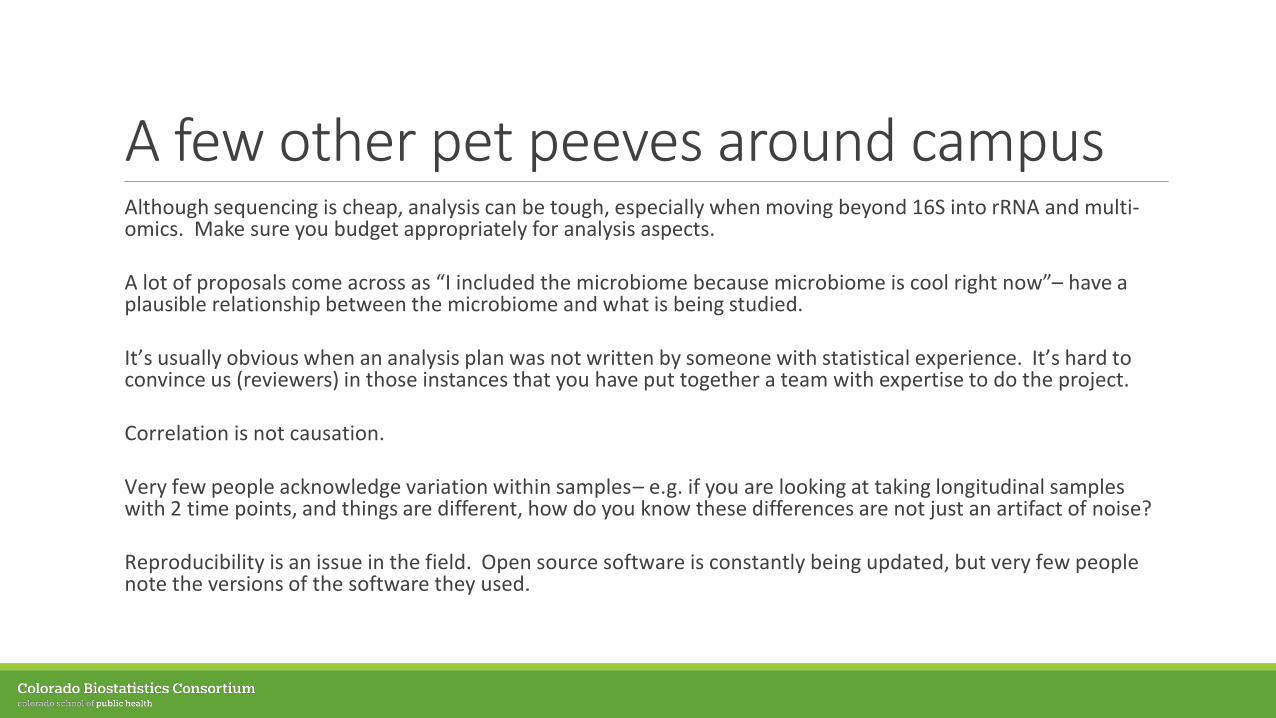
A few other pet peeves around campusAlthough sequencing is cheap, analysis can be tough, especially when moving beyond 16S into rRNA and multi-omics. Make sure you budget appropriately for analysis aspects.
A lot of proposals come across as “I included the microbiome because microbiome is cool right now” – have a plausible relationship between the microbiome and what is being studied.
It’s usually obvious when an analysis plan was not written by someone with statistical experience. It’s hard to convince us (reviewers) in those instances that you have put together a team with expertise to do the project.
Correlation is not causation.
Very few people acknowledge variation within samples – e.g. if you are looking at taking longitudinal samples with 2 time points, and things are different, how do you know these differences are not just an artifact of noise?
Reproducibility is an issue in the field. Open source software is constantly being updated, but very few people note the versions of the software they used.

AGENDA
Introducing the Microbiome
Working with your Data
Framing HypothesesAdvice and Common Pitfalls
Other Considerations
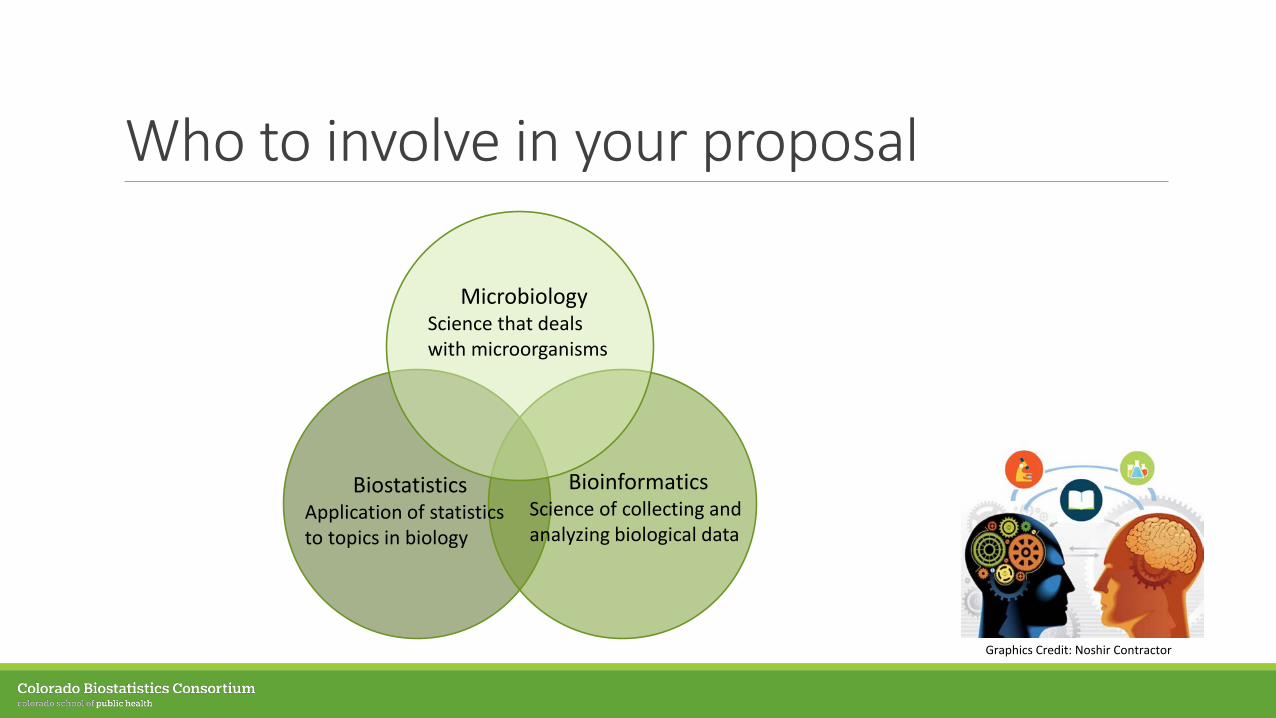
Who to involve in your proposal
MicrobiologyScience that deals with microorganisms
BiostatisticsApplication of statistics to topics in biology
BioinformaticsScience of collecting and analyzing biological data
Graphics Credit: Noshir Contractor
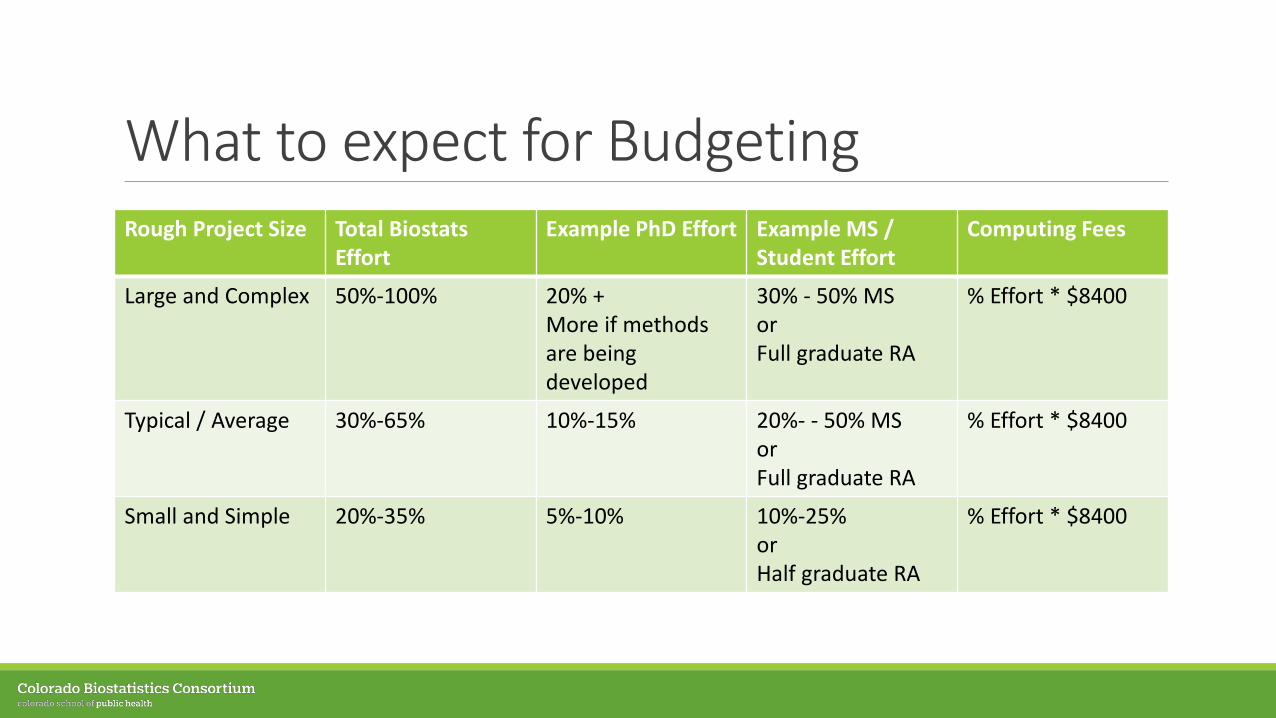
What to expect for BudgetingRough Project Size Total Biostats
EffortExample PhD Effort Example MS /
Student EffortComputing Fees
Large and Complex 50%-100% 20% +More if methods are being developed
30% - 50% MSorFull graduate RA
% Effort * $8400
Typical / Average 30%-65% 10%-15% 20%- - 50% MSor Full graduate RA
% Effort * $8400
Small and Simple 20%-35% 5%-10% 10%-25%or Half graduate RA
% Effort * $8400
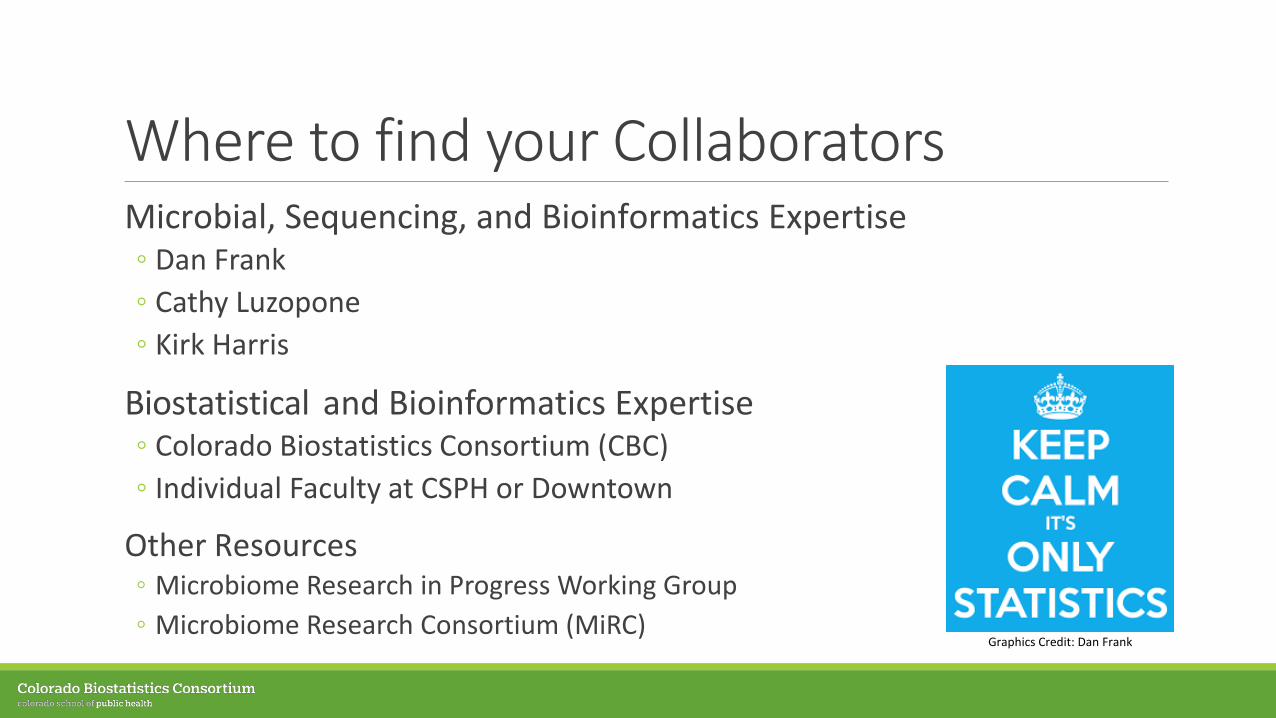
Where to find your CollaboratorsMicrobial, Sequencing, and Bioinformatics Expertise◦ Dan Frank◦ Cathy Luzopone◦ Kirk Harris
Biostatistical and Bioinformatics Expertise◦ Colorado Biostatistics Consortium (CBC) ◦ Individual Faculty at CSPH or Downtown
Other Resources◦ Microbiome Research in Progress Working Group◦ Microbiome Research Consortium (MiRC)
Graphics Credit: Dan Frank
When to start conversationsAs soon as you have an idea!
Involve your entire team in the development of your proposal ◦ Biostats and Bioinformatics typically should be included as Co-Investigators
It takes time to acquire pilot data ◦ Discuss realistic timelines for obtaining, sequencing, and analyzing these data
It takes time to understand the science to come up with appropriate power calculations◦ The week before the budget is due is NOT enough time for your biostatistician to get up to speed
If engaging the CBC / BERD for statistical support, please let us know at least 6-8 weeks in advance of your deadline◦ Resources are limited, and we often allocate on a first come first serve basis
Why
Graphics Credit: Noshir Contractor & NPR