Embed Size (px)
Citation preview
Section 9Importance of Social Security
Relative to Total Income (Beneficiary Aged Units
and Aged Persons in Beneficiary Families Only)
286 ♦ Income of the Population 55 or Older, 2014
Importance of Social Security Relative to Total Income (Beneficiary Aged Units and Aged Persons in Beneficiary Families Only)
Key Terms and Concepts for Section 9 1
Age. Age classification is based on the age of the person at his or her last birthday as of March 2015. A married couple’s age is defined as the age of the husband—unless he is under age 55 and the wife is 55 or older, in which case it is the age of the wife.Aged unit. With age 55 as the cutoff, aged units are defined as married couples living together—at least one of whom is 55 or older—and non-married persons 55 or older.Marital status. Married persons are married and living with their spouse. Nonmarried per-sons may be divorced, widowed, never mar-ried, separated, or married but living apart from their spouse.Race. The categories White alone, Black alone, and Asian alone reflect respondents who reported only one race. Because of changes to the race category, data on race are not directly comparable to editions prior to 2002. A person’s race is his or her reported race. A married cou-ple’s race is defined as the race of the husband.
Hispanic origin. Persons of Hispanic origin may be of any race. A married couple is of His-panic origin if the husband is of Hispanic origin.Family. A family is a group of two or more people (one of whom is the householder) related by birth, marriage, or adoption and residing together; all such people (including related sub-family members) are considered as members of one family.Social Security beneficiary. A beneficiary may be receiving retired-worker benefits, depen-dents’ or survivor benefits, disability benefits, or transitionally insured benefits.Per capita income. Per capita income is total family income divided by the number of persons in the family.Relative Importance of Income Source. The relative importance of a source is the ratio of the amount of income from a given source to total income for an aged unit or family. These tables are distributions of persons or aged units by the importance of a given source at the individual unit level.
Poverty. The Census Bureau uses a set of money income thresholds that vary by family size and composition to detect who is poor. If a family’s total income is less than that family’s threshold, then that family, and every individual in it, is considered poor. The poverty thresh-olds do not vary geographically, but they are updated annually for inflation with the Con-sumer Price Index (CPI-U). The official poverty definition counts money income before taxes and excludes capital gains and noncash ben-efits (such as public housing, Medicaid, and SNAP benefits).
1 For more information, consult the Glossary at the front of this publication.
Relative Importance of Social Security for Beneficiary Aged Units
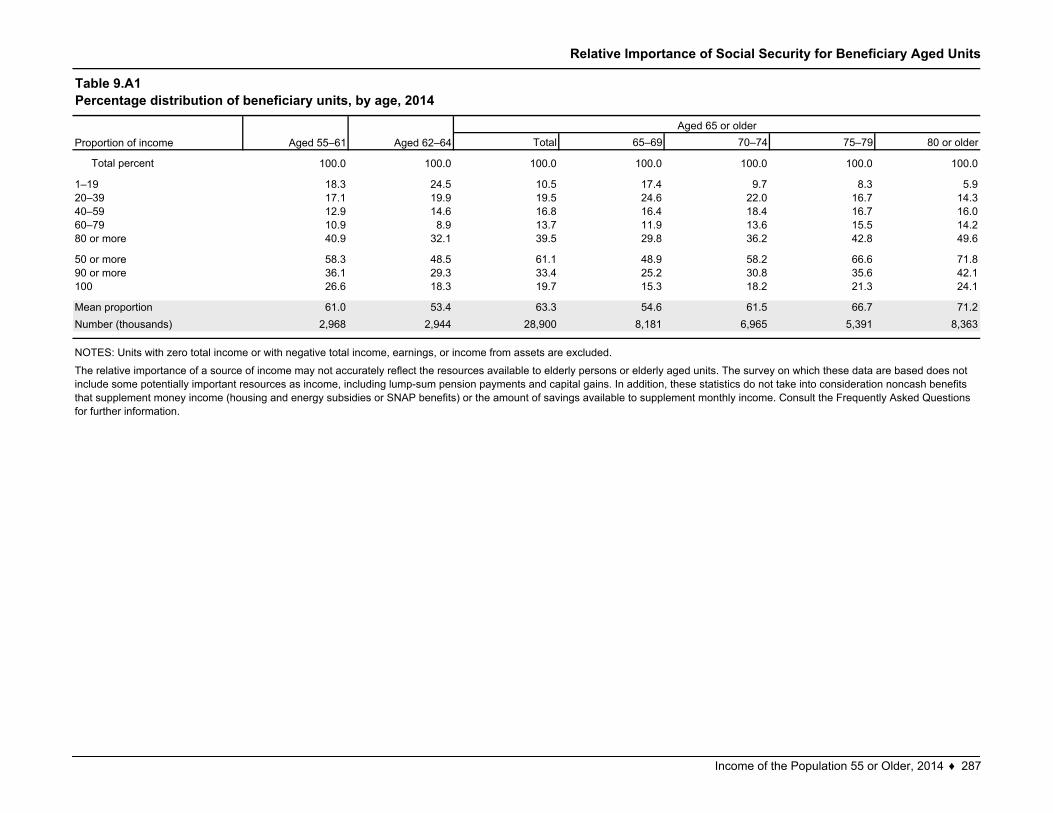
Total 65–69 70–74 75–79 80 or older
Total percent 100.0 100.0 100.0 100.0 100.0 100.0 100.0
18.3 24.5 10.5 17.4 9.7 8.3 5.917.1 19.9 19.5 24.6 22.0 16.7 14.312.9 14.6 16.8 16.4 18.4 16.7 16.010.9 8.9 13.7 11.9 13.6 15.5 14.240.9 32.1 39.5 29.8 36.2 42.8 49.6
58.3 48.5 61.1 48.9 58.2 66.6 71.836.1 29.3 33.4 25.2 30.8 35.6 42.126.6 18.3 19.7 15.3 18.2 21.3 24.1
61.0 53.4 63.3 54.6 61.5 66.7 71.22,968 2,944 28,900 8,181 6,965 5,391 8,363
The relative importance of a source of income may not accurately reflect the resources available to elderly persons or elderly aged units. The survey on which these data are based does not include some potentially important resources as income, including lump-sum pension payments and capital gains. In addition, these statistics do not take into consideration noncash benefits that supplement money income (housing and energy subsidies or SNAP benefits) or the amount of savings available to supplement monthly income. Consult the Frequently Asked Questions for further information.
90 or more100
Mean proportionNumber (thousands)
NOTES: Units with zero total income or with negative total income, earnings, or income from assets are excluded.
Table 9.A1Percentage distribution of beneficiary units, by age, 2014
Aged 55–61 Aged 62–64Aged 65 or older
Proportion of income
50 or more
1–1920–3940–5960–7980 or more
Income of the Population 55 or Older, 2014 ♦ 287
Relative Importance of Social Security for Beneficiary Aged Units
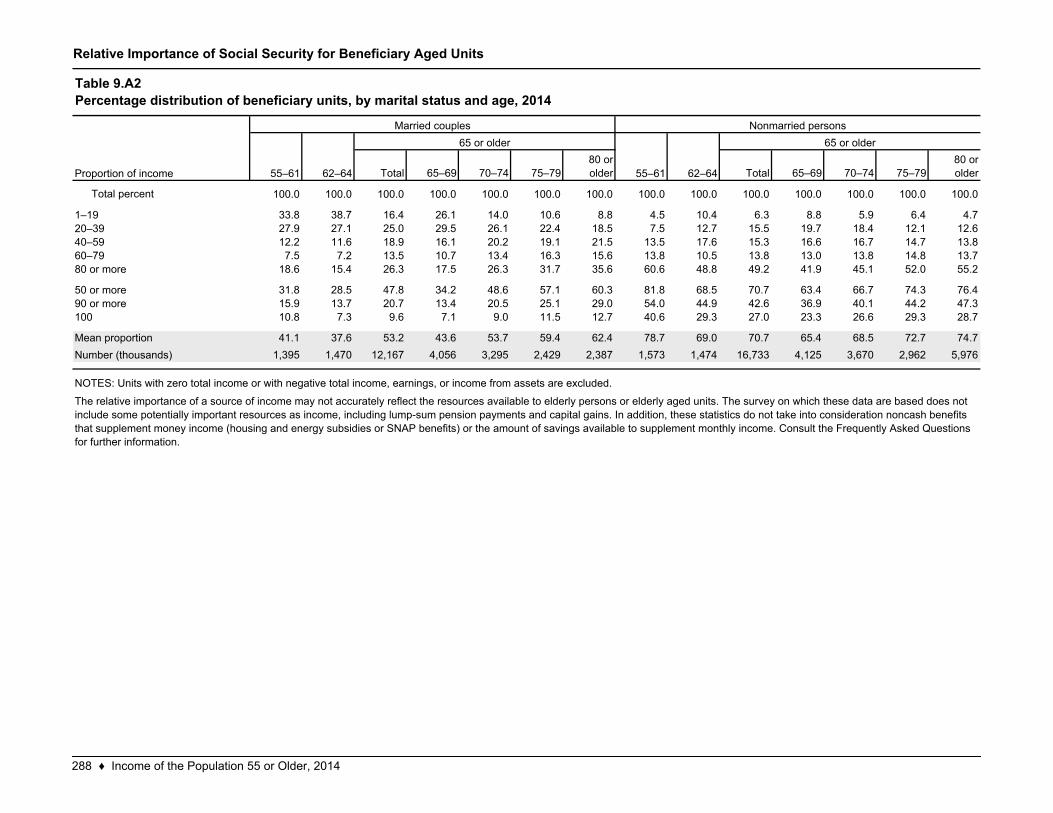
Total 65–69 70–74 75–7980 or older Total 65–69 70–74 75–79
80 or older
Total percent 100.0 100.0 100.0 100.0 100.0 100.0 100.0 100.0 100.0 100.0 100.0 100.0 100.0 100.0
33.8 38.7 16.4 26.1 14.0 10.6 8.8 4.5 10.4 6.3 8.8 5.9 6.4 4.727.9 27.1 25.0 29.5 26.1 22.4 18.5 7.5 12.7 15.5 19.7 18.4 12.1 12.612.2 11.6 18.9 16.1 20.2 19.1 21.5 13.5 17.6 15.3 16.6 16.7 14.7 13.87.5 7.2 13.5 10.7 13.4 16.3 15.6 13.8 10.5 13.8 13.0 13.8 14.8 13.7
18.6 15.4 26.3 17.5 26.3 31.7 35.6 60.6 48.8 49.2 41.9 45.1 52.0 55.2
31.8 28.5 47.8 34.2 48.6 57.1 60.3 81.8 68.5 70.7 63.4 66.7 74.3 76.415.9 13.7 20.7 13.4 20.5 25.1 29.0 54.0 44.9 42.6 36.9 40.1 44.2 47.310.8 7.3 9.6 7.1 9.0 11.5 12.7 40.6 29.3 27.0 23.3 26.6 29.3 28.7
41.1 37.6 53.2 43.6 53.7 59.4 62.4 78.7 69.0 70.7 65.4 68.5 72.7 74.71,395 1,470 12,167 4,056 3,295 2,429 2,387 1,573 1,474 16,733 4,125 3,670 2,962 5,976
Mean proportion
40–59
62–64
65 or older
NOTES: Units with zero total income or with negative total income, earnings, or income from assets are excluded.
The relative importance of a source of income may not accurately reflect the resources available to elderly persons or elderly aged units. The survey on which these data are based does not include some potentially important resources as income, including lump-sum pension payments and capital gains. In addition, these statistics do not take into consideration noncash benefits that supplement money income (housing and energy subsidies or SNAP benefits) or the amount of savings available to supplement monthly income. Consult the Frequently Asked Questions for further information.
65 or older
55–61Proportion of income
1–1920–39
Number (thousands)
60–7980 or more
50 or more90 or more100
Table 9.A2Percentage distribution of beneficiary units, by marital status and age, 2014
Married couples Nonmarried persons
55–61 62–64
288 ♦ Income of the Population 55 or Older, 2014
Relative Importance of Social Security for Beneficiary Units 65 or Older
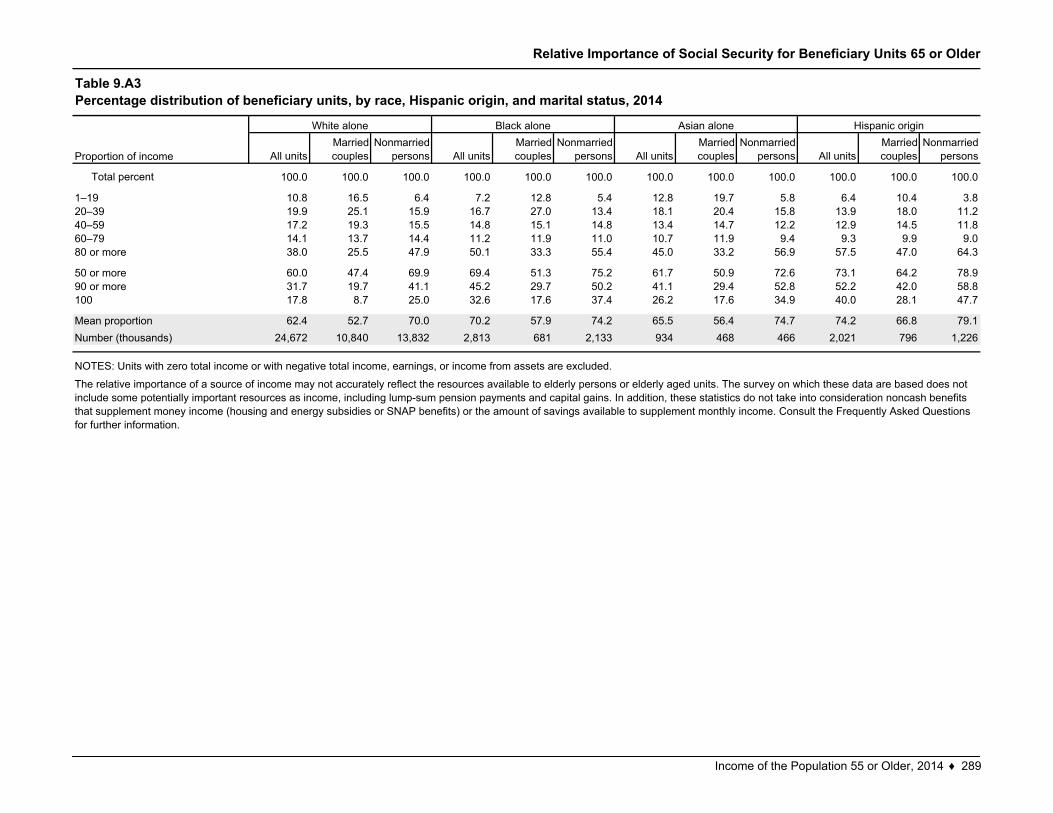
All unitsMarried couples
Nonmarried persons All units
Married couples
Nonmarried persons All units
Married couples
Nonmarried persons All units
Married couples
Nonmarried persons
Total percent 100.0 100.0 100.0 100.0 100.0 100.0 100.0 100.0 100.0 100.0 100.0 100.0
10.8 16.5 6.4 7.2 12.8 5.4 12.8 19.7 5.8 6.4 10.4 3.819.9 25.1 15.9 16.7 27.0 13.4 18.1 20.4 15.8 13.9 18.0 11.217.2 19.3 15.5 14.8 15.1 14.8 13.4 14.7 12.2 12.9 14.5 11.814.1 13.7 14.4 11.2 11.9 11.0 10.7 11.9 9.4 9.3 9.9 9.038.0 25.5 47.9 50.1 33.3 55.4 45.0 33.2 56.9 57.5 47.0 64.3
60.0 47.4 69.9 69.4 51.3 75.2 61.7 50.9 72.6 73.1 64.2 78.931.7 19.7 41.1 45.2 29.7 50.2 41.1 29.4 52.8 52.2 42.0 58.817.8 8.7 25.0 32.6 17.6 37.4 26.2 17.6 34.9 40.0 28.1 47.7
62.4 52.7 70.0 70.2 57.9 74.2 65.5 56.4 74.7 74.2 66.8 79.124,672 10,840 13,832 2,813 681 2,133 934 468 466 2,021 796 1,226
NOTES: Units with zero total income or with negative total income, earnings, or income from assets are excluded.
The relative importance of a source of income may not accurately reflect the resources available to elderly persons or elderly aged units. The survey on which these data are based does not include some potentially important resources as income, including lump-sum pension payments and capital gains. In addition, these statistics do not take into consideration noncash benefits that supplement money income (housing and energy subsidies or SNAP benefits) or the amount of savings available to supplement monthly income. Consult the Frequently Asked Questions for further information.
1–1920–3940–5960–7980 or more
50 or more90 or more100
Mean proportionNumber (thousands)
Table 9.A3Percentage distribution of beneficiary units, by race, Hispanic origin, and marital status, 2014
White alone Black alone Asian alone Hispanic origin
Proportion of income
Income of the Population 55 or Older, 2014 ♦ 289
Relative Importance of Social Security for Beneficiary Units 65 or Older
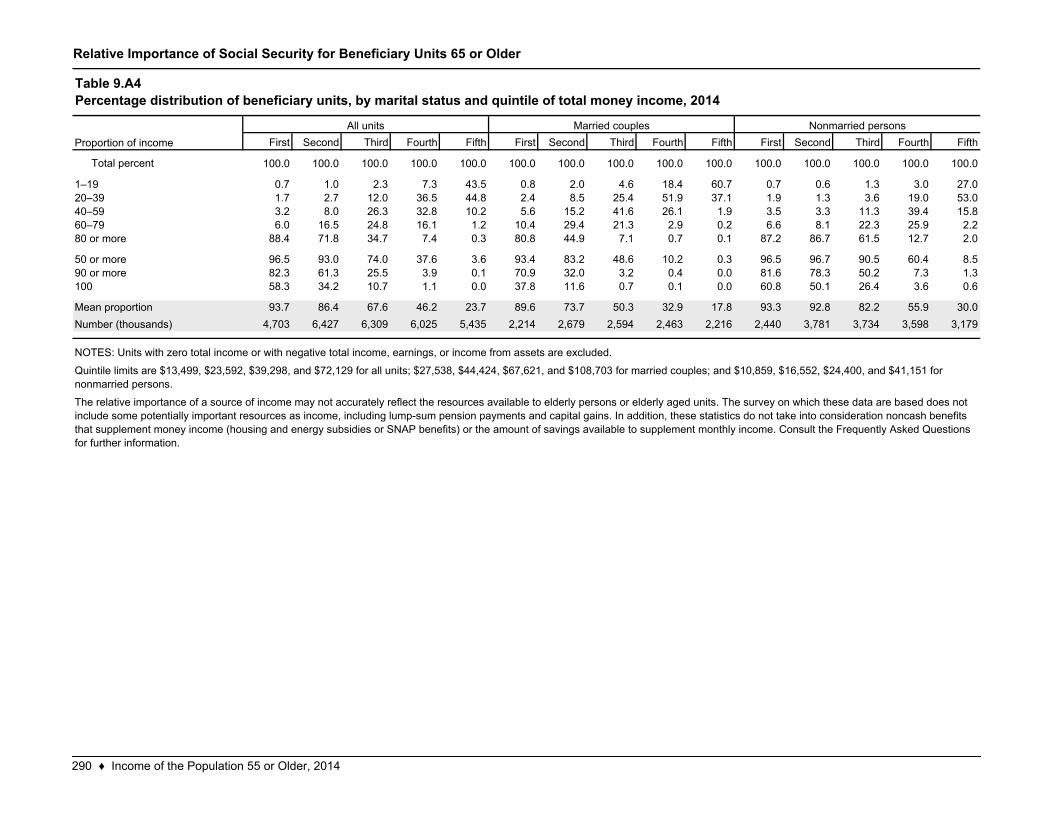
First Second Third Fourth Fifth First Second Third Fourth Fifth First Second Third Fourth Fifth
Total percent 100.0 100.0 100.0 100.0 100.0 100.0 100.0 100.0 100.0 100.0 100.0 100.0 100.0 100.0 100.0
0.7 1.0 2.3 7.3 43.5 0.8 2.0 4.6 18.4 60.7 0.7 0.6 1.3 3.0 27.01.7 2.7 12.0 36.5 44.8 2.4 8.5 25.4 51.9 37.1 1.9 1.3 3.6 19.0 53.03.2 8.0 26.3 32.8 10.2 5.6 15.2 41.6 26.1 1.9 3.5 3.3 11.3 39.4 15.86.0 16.5 24.8 16.1 1.2 10.4 29.4 21.3 2.9 0.2 6.6 8.1 22.3 25.9 2.2
88.4 71.8 34.7 7.4 0.3 80.8 44.9 7.1 0.7 0.1 87.2 86.7 61.5 12.7 2.0
96.5 93.0 74.0 37.6 3.6 93.4 83.2 48.6 10.2 0.3 96.5 96.7 90.5 60.4 8.582.3 61.3 25.5 3.9 0.1 70.9 32.0 3.2 0.4 0.0 81.6 78.3 50.2 7.3 1.358.3 34.2 10.7 1.1 0.0 37.8 11.6 0.7 0.1 0.0 60.8 50.1 26.4 3.6 0.6
93.7 86.4 67.6 46.2 23.7 89.6 73.7 50.3 32.9 17.8 93.3 92.8 82.2 55.9 30.04,703 6,427 6,309 6,025 5,435 2,214 2,679 2,594 2,463 2,216 2,440 3,781 3,734 3,598 3,179
NOTES: Units with zero total income or with negative total income, earnings, or income from assets are excluded.
Quintile limits are $13,499, $23,592, $39,298, and $72,129 for all units; $27,538, $44,424, $67,621, and $108,703 for married couples; and $10,859, $16,552, $24,400, and $41,151 for nonmarried persons.
The relative importance of a source of income may not accurately reflect the resources available to elderly persons or elderly aged units. The survey on which these data are based does not include some potentially important resources as income, including lump-sum pension payments and capital gains. In addition, these statistics do not take into consideration noncash benefits that supplement money income (housing and energy subsidies or SNAP benefits) or the amount of savings available to supplement monthly income. Consult the Frequently Asked Questions for further information.
1–1920–3940–5960–7980 or more
50 or more90 or more100
Mean proportionNumber (thousands)
Table 9.A4Percentage distribution of beneficiary units, by marital status and quintile of total money income, 2014
All units Married couples Nonmarried personsProportion of income
290 ♦ Income of the Population 55 or Older, 2014
Relative Importance of Social Security for Persons in Beneficiary Families
55–61 62–64 65 or older 55–61 62–64 65 or older 55–61 62–64 65 or older
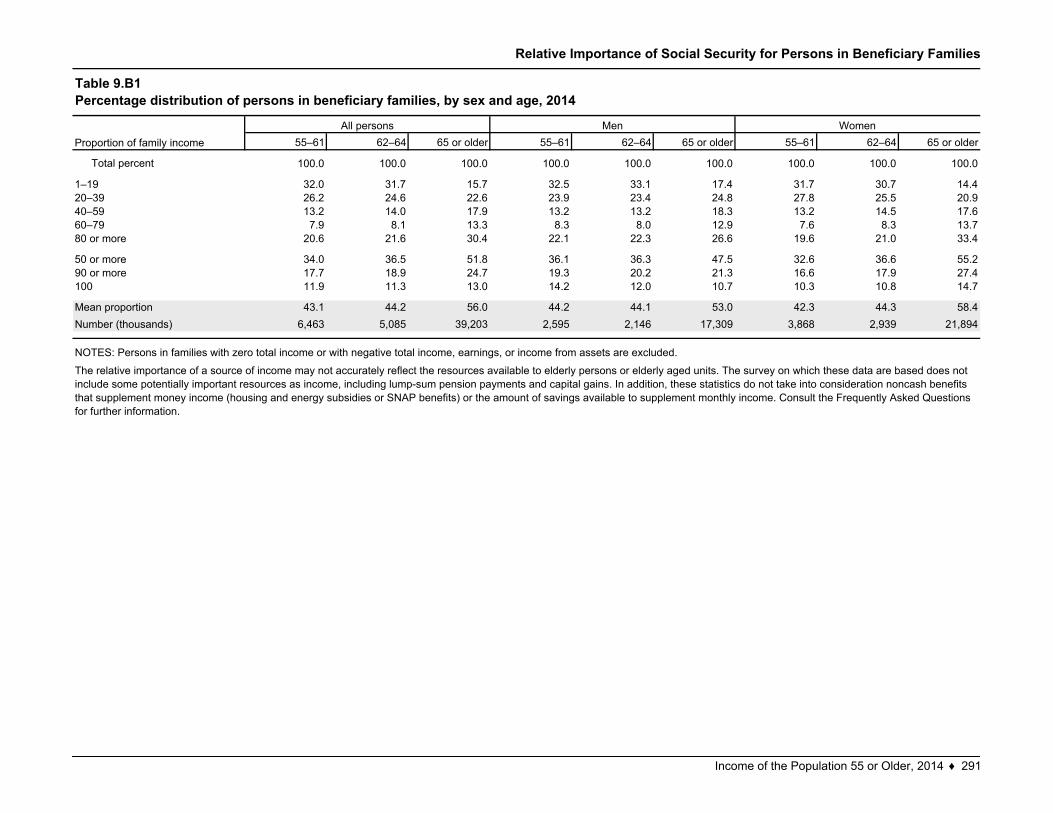
Total percent 100.0 100.0 100.0 100.0 100.0 100.0 100.0 100.0 100.0
32.0 31.7 15.7 32.5 33.1 17.4 31.7 30.7 14.426.2 24.6 22.6 23.9 23.4 24.8 27.8 25.5 20.913.2 14.0 17.9 13.2 13.2 18.3 13.2 14.5 17.67.9 8.1 13.3 8.3 8.0 12.9 7.6 8.3 13.7
20.6 21.6 30.4 22.1 22.3 26.6 19.6 21.0 33.4
34.0 36.5 51.8 36.1 36.3 47.5 32.6 36.6 55.217.7 18.9 24.7 19.3 20.2 21.3 16.6 17.9 27.411.9 11.3 13.0 14.2 12.0 10.7 10.3 10.8 14.7
43.1 44.2 56.0 44.2 44.1 53.0 42.3 44.3 58.46,463 5,085 39,203 2,595 2,146 17,309 3,868 2,939 21,894
The relative importance of a source of income may not accurately reflect the resources available to elderly persons or elderly aged units. The survey on which these data are based does not include some potentially important resources as income, including lump-sum pension payments and capital gains. In addition, these statistics do not take into consideration noncash benefits that supplement money income (housing and energy subsidies or SNAP benefits) or the amount of savings available to supplement monthly income. Consult the Frequently Asked Questions for further information.
90 or more100
Mean proportionNumber (thousands)
NOTES: Persons in families with zero total income or with negative total income, earnings, or income from assets are excluded.
Table 9.B1Percentage distribution of persons in beneficiary families, by sex and age, 2014
All persons Men WomenProportion of family income
50 or more
1–1920–3940–5960–7980 or more
Income of the Population 55 or Older, 2014 ♦ 291
Relative Importance of Social Security for Persons 65 or Older in Beneficiary Families
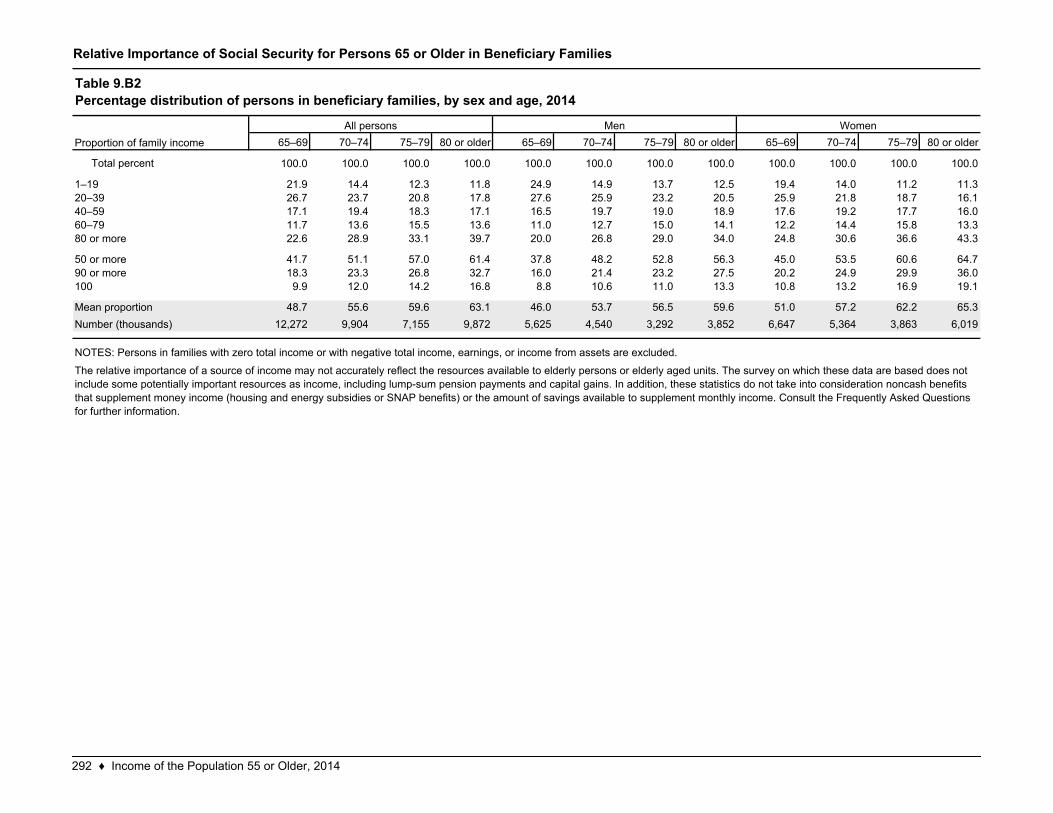
65–69 70–74 75–79 80 or older 65–69 70–74 75–79 80 or older 65–69 70–74 75–79 80 or older
Total percent 100.0 100.0 100.0 100.0 100.0 100.0 100.0 100.0 100.0 100.0 100.0 100.0
21.9 14.4 12.3 11.8 24.9 14.9 13.7 12.5 19.4 14.0 11.2 11.326.7 23.7 20.8 17.8 27.6 25.9 23.2 20.5 25.9 21.8 18.7 16.117.1 19.4 18.3 17.1 16.5 19.7 19.0 18.9 17.6 19.2 17.7 16.011.7 13.6 15.5 13.6 11.0 12.7 15.0 14.1 12.2 14.4 15.8 13.322.6 28.9 33.1 39.7 20.0 26.8 29.0 34.0 24.8 30.6 36.6 43.3
41.7 51.1 57.0 61.4 37.8 48.2 52.8 56.3 45.0 53.5 60.6 64.718.3 23.3 26.8 32.7 16.0 21.4 23.2 27.5 20.2 24.9 29.9 36.09.9 12.0 14.2 16.8 8.8 10.6 11.0 13.3 10.8 13.2 16.9 19.1
48.7 55.6 59.6 63.1 46.0 53.7 56.5 59.6 51.0 57.2 62.2 65.312,272 9,904 7,155 9,872 5,625 4,540 3,292 3,852 6,647 5,364 3,863 6,019
The relative importance of a source of income may not accurately reflect the resources available to elderly persons or elderly aged units. The survey on which these data are based does not include some potentially important resources as income, including lump-sum pension payments and capital gains. In addition, these statistics do not take into consideration noncash benefits that supplement money income (housing and energy subsidies or SNAP benefits) or the amount of savings available to supplement monthly income. Consult the Frequently Asked Questions for further information.
90 or more100
Mean proportionNumber (thousands)
NOTES: Persons in families with zero total income or with negative total income, earnings, or income from assets are excluded.
Table 9.B2Percentage distribution of persons in beneficiary families, by sex and age, 2014
All persons Men WomenProportion of family income
50 or more
1–1920–3940–5960–7980 or more
292 ♦ Income of the Population 55 or Older, 2014
Relative Importance of Social Security for Persons 65 or Older in Beneficiary Families
Total Widowed DivorcedNever
married Total Widowed DivorcedNever
married Total Widowed DivorcedNever
married
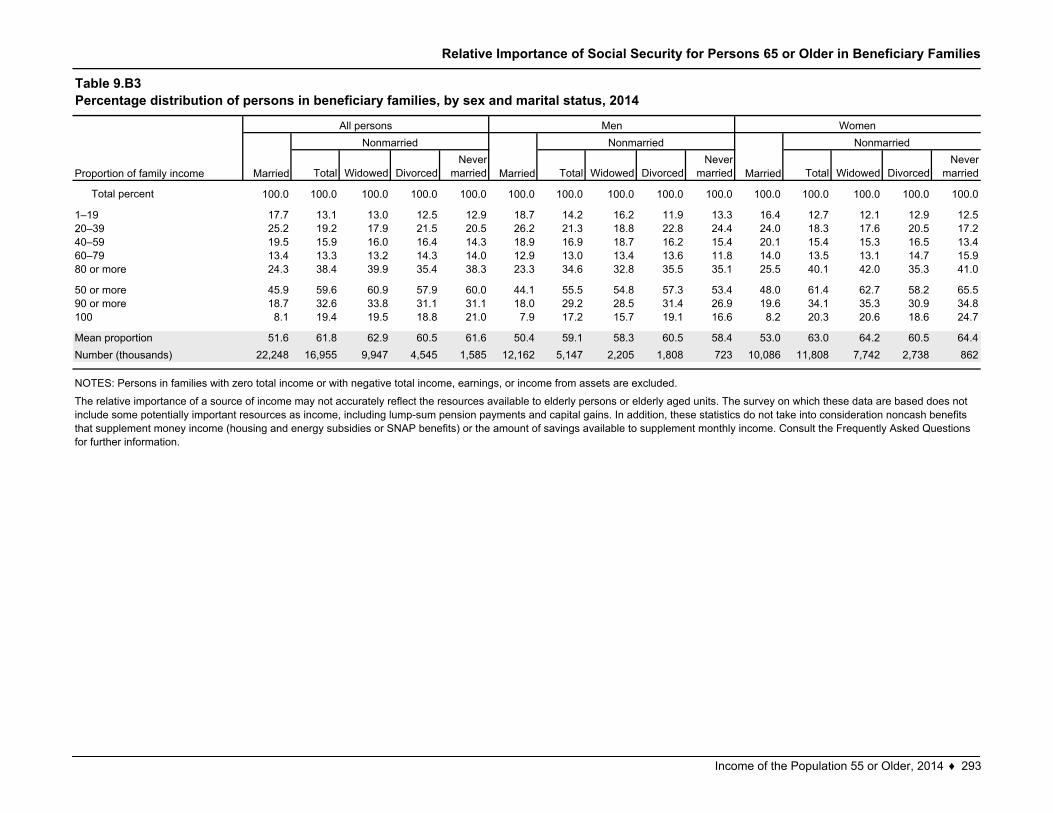
Total percent 100.0 100.0 100.0 100.0 100.0 100.0 100.0 100.0 100.0 100.0 100.0 100.0 100.0 100.0 100.0
17.7 13.1 13.0 12.5 12.9 18.7 14.2 16.2 11.9 13.3 16.4 12.7 12.1 12.9 12.525.2 19.2 17.9 21.5 20.5 26.2 21.3 18.8 22.8 24.4 24.0 18.3 17.6 20.5 17.219.5 15.9 16.0 16.4 14.3 18.9 16.9 18.7 16.2 15.4 20.1 15.4 15.3 16.5 13.413.4 13.3 13.2 14.3 14.0 12.9 13.0 13.4 13.6 11.8 14.0 13.5 13.1 14.7 15.924.3 38.4 39.9 35.4 38.3 23.3 34.6 32.8 35.5 35.1 25.5 40.1 42.0 35.3 41.0
45.9 59.6 60.9 57.9 60.0 44.1 55.5 54.8 57.3 53.4 48.0 61.4 62.7 58.2 65.518.7 32.6 33.8 31.1 31.1 18.0 29.2 28.5 31.4 26.9 19.6 34.1 35.3 30.9 34.88.1 19.4 19.5 18.8 21.0 7.9 17.2 15.7 19.1 16.6 8.2 20.3 20.6 18.6 24.7
51.6 61.8 62.9 60.5 61.6 50.4 59.1 58.3 60.5 58.4 53.0 63.0 64.2 60.5 64.422,248 16,955 9,947 4,545 1,585 12,162 5,147 2,205 1,808 723 10,086 11,808 7,742 2,738 862
NOTES: Persons in families with zero total income or with negative total income, earnings, or income from assets are excluded.
The relative importance of a source of income may not accurately reflect the resources available to elderly persons or elderly aged units. The survey on which these data are based does not include some potentially important resources as income, including lump-sum pension payments and capital gains. In addition, these statistics do not take into consideration noncash benefits that supplement money income (housing and energy subsidies or SNAP benefits) or the amount of savings available to supplement monthly income. Consult the Frequently Asked Questions for further information.
1–19
60–7980 or more
50 or more90 or more100
Mean proportionNumber (thousands)
20–3940–59
Table 9.B3Percentage distribution of persons in beneficiary families, by sex and marital status, 2014
All persons Men Women
Married
Nonmarried
MarriedProportion of family income
Nonmarried
Married
Nonmarried
Income of the Population 55 or Older, 2014 ♦ 293
Relative Importance of Social Security for Persons 65 or Older in Beneficiary Families
All persons Men Women All persons Men Women All persons Men Women All persons Men Women
Total percent 100.0 100.0 100.0 100.0 100.0 100.0 100.0 100.0 100.0 100.0 100.0 100.0
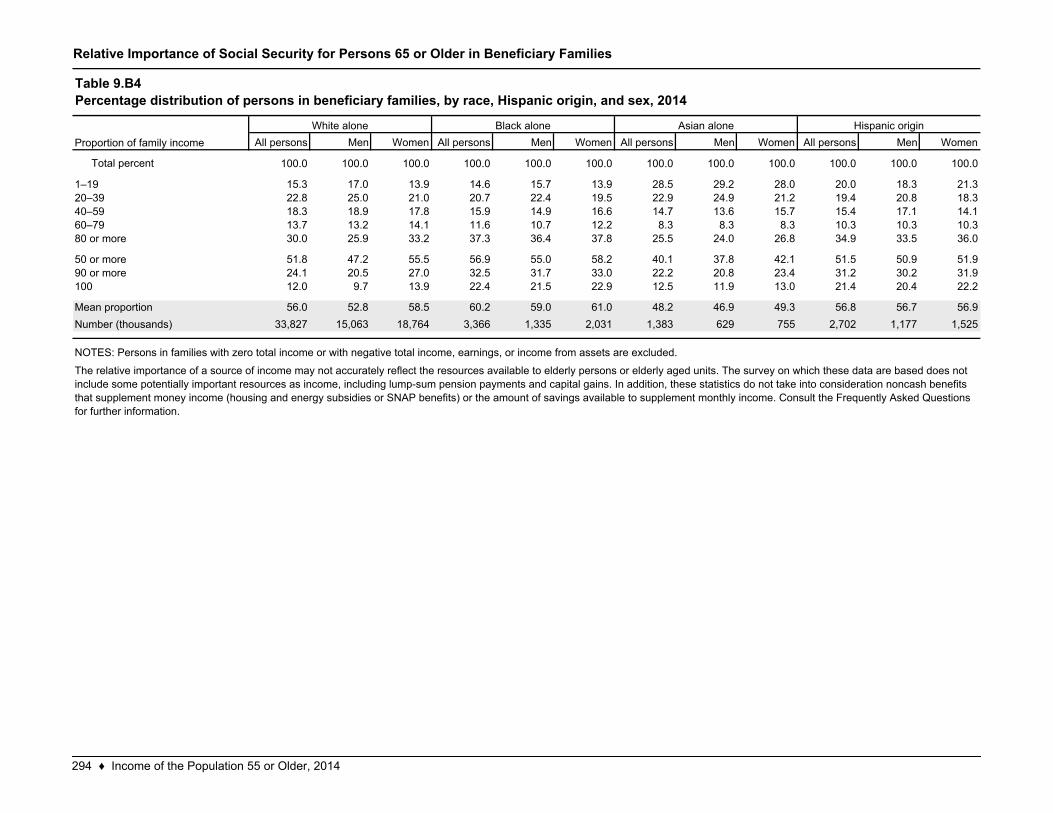
15.3 17.0 13.9 14.6 15.7 13.9 28.5 29.2 28.0 20.0 18.3 21.322.8 25.0 21.0 20.7 22.4 19.5 22.9 24.9 21.2 19.4 20.8 18.318.3 18.9 17.8 15.9 14.9 16.6 14.7 13.6 15.7 15.4 17.1 14.113.7 13.2 14.1 11.6 10.7 12.2 8.3 8.3 8.3 10.3 10.3 10.330.0 25.9 33.2 37.3 36.4 37.8 25.5 24.0 26.8 34.9 33.5 36.0
51.8 47.2 55.5 56.9 55.0 58.2 40.1 37.8 42.1 51.5 50.9 51.924.1 20.5 27.0 32.5 31.7 33.0 22.2 20.8 23.4 31.2 30.2 31.912.0 9.7 13.9 22.4 21.5 22.9 12.5 11.9 13.0 21.4 20.4 22.2
56.0 52.8 58.5 60.2 59.0 61.0 48.2 46.9 49.3 56.8 56.7 56.933,827 15,063 18,764 3,366 1,335 2,031 1,383 629 755 2,702 1,177 1,525
NOTES: Persons in families with zero total income or with negative total income, earnings, or income from assets are excluded.
The relative importance of a source of income may not accurately reflect the resources available to elderly persons or elderly aged units. The survey on which these data are based does not include some potentially important resources as income, including lump-sum pension payments and capital gains. In addition, these statistics do not take into consideration noncash benefits that supplement money income (housing and energy subsidies or SNAP benefits) or the amount of savings available to supplement monthly income. Consult the Frequently Asked Questions for further information.
1–1920–3940–5960–7980 or more
50 or more90 or more100
Mean proportionNumber (thousands)
Table 9.B4Percentage distribution of persons in beneficiary families, by race, Hispanic origin, and sex, 2014
White alone Black alone Asian alone Hispanic originProportion of family income
294 ♦ Income of the Population 55 or Older, 2014
Relative Importance of Social Security for Persons 65 or Older in Beneficiary Families
MarriedNon-
married MarriedNon-
married MarriedNon-
married MarriedNon-
married MarriedNon-
married MarriedNon-
married MarriedNon-
married MarriedNon-
married
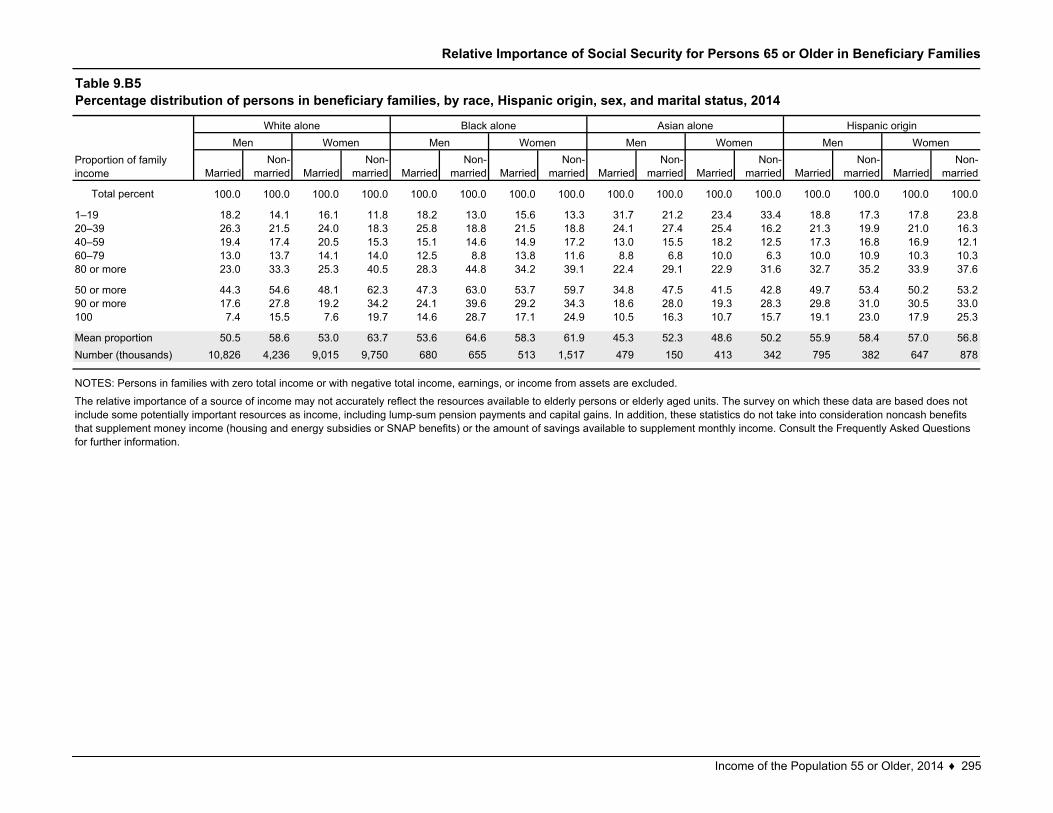
Total percent 100.0 100.0 100.0 100.0 100.0 100.0 100.0 100.0 100.0 100.0 100.0 100.0 100.0 100.0 100.0 100.0
18.2 14.1 16.1 11.8 18.2 13.0 15.6 13.3 31.7 21.2 23.4 33.4 18.8 17.3 17.8 23.826.3 21.5 24.0 18.3 25.8 18.8 21.5 18.8 24.1 27.4 25.4 16.2 21.3 19.9 21.0 16.319.4 17.4 20.5 15.3 15.1 14.6 14.9 17.2 13.0 15.5 18.2 12.5 17.3 16.8 16.9 12.113.0 13.7 14.1 14.0 12.5 8.8 13.8 11.6 8.8 6.8 10.0 6.3 10.0 10.9 10.3 10.323.0 33.3 25.3 40.5 28.3 44.8 34.2 39.1 22.4 29.1 22.9 31.6 32.7 35.2 33.9 37.6
44.3 54.6 48.1 62.3 47.3 63.0 53.7 59.7 34.8 47.5 41.5 42.8 49.7 53.4 50.2 53.217.6 27.8 19.2 34.2 24.1 39.6 29.2 34.3 18.6 28.0 19.3 28.3 29.8 31.0 30.5 33.07.4 15.5 7.6 19.7 14.6 28.7 17.1 24.9 10.5 16.3 10.7 15.7 19.1 23.0 17.9 25.3
50.5 58.6 53.0 63.7 53.6 64.6 58.3 61.9 45.3 52.3 48.6 50.2 55.9 58.4 57.0 56.810,826 4,236 9,015 9,750 680 655 513 1,517 479 150 413 342 795 382 647 878
The relative importance of a source of income may not accurately reflect the resources available to elderly persons or elderly aged units. The survey on which these data are based does not include some potentially important resources as income, including lump-sum pension payments and capital gains. In addition, these statistics do not take into consideration noncash benefits that supplement money income (housing and energy subsidies or SNAP benefits) or the amount of savings available to supplement monthly income. Consult the Frequently Asked Questions for further information.
Men Women
Number (thousands)
90 or more100
20–3940–5960–7980 or more
50 or more
Women
1–19
Mean proportion
Proportion of family income
NOTES: Persons in families with zero total income or with negative total income, earnings, or income from assets are excluded.
Men Women Men Women Men
Table 9.B5Percentage distribution of persons in beneficiary families, by race, Hispanic origin, sex, and marital status, 2014
White alone Black alone Asian alone Hispanic origin
Income of the Population 55 or Older, 2014 ♦ 295
Relative Importance of Social Security for Persons 65 or Older in Beneficiary Families
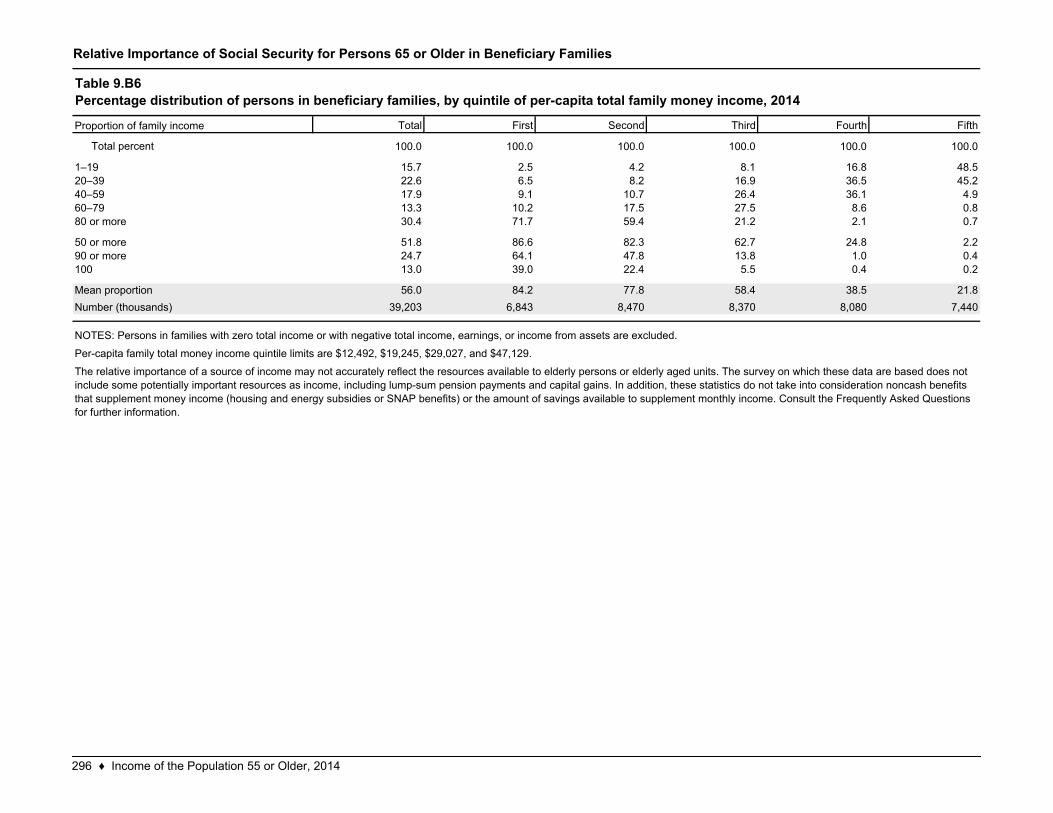
Total First Second Third Fourth Fifth
Total percent 100.0 100.0 100.0 100.0 100.0 100.0
15.7 2.5 4.2 8.1 16.8 48.522.6 6.5 8.2 16.9 36.5 45.217.9 9.1 10.7 26.4 36.1 4.913.3 10.2 17.5 27.5 8.6 0.830.4 71.7 59.4 21.2 2.1 0.7
51.8 86.6 82.3 62.7 24.8 2.224.7 64.1 47.8 13.8 1.0 0.413.0 39.0 22.4 5.5 0.4 0.2
56.0 84.2 77.8 58.4 38.5 21.839,203 6,843 8,470 8,370 8,080 7,440
Table 9.B6Percentage distribution of persons in beneficiary families, by quintile of per-capita total family money income, 2014
NOTES: Persons in families with zero total income or with negative total income, earnings, or income from assets are excluded.
Per-capita family total money income quintile limits are $12,492, $19,245, $29,027, and $47,129.
The relative importance of a source of income may not accurately reflect the resources available to elderly persons or elderly aged units. The survey on which these data are based does not include some potentially important resources as income, including lump-sum pension payments and capital gains. In addition, these statistics do not take into consideration noncash benefits that supplement money income (housing and energy subsidies or SNAP benefits) or the amount of savings available to supplement monthly income. Consult the Frequently Asked Questions for further information.
Proportion of family income
1–1920–3940–59
Number (thousands)
60–7980 or more
50 or more90 or more100
Mean proportion
296 ♦ Income of the Population 55 or Older, 2014
Relative Importance of Social Security for Persons 65 or Older in Beneficiary Families
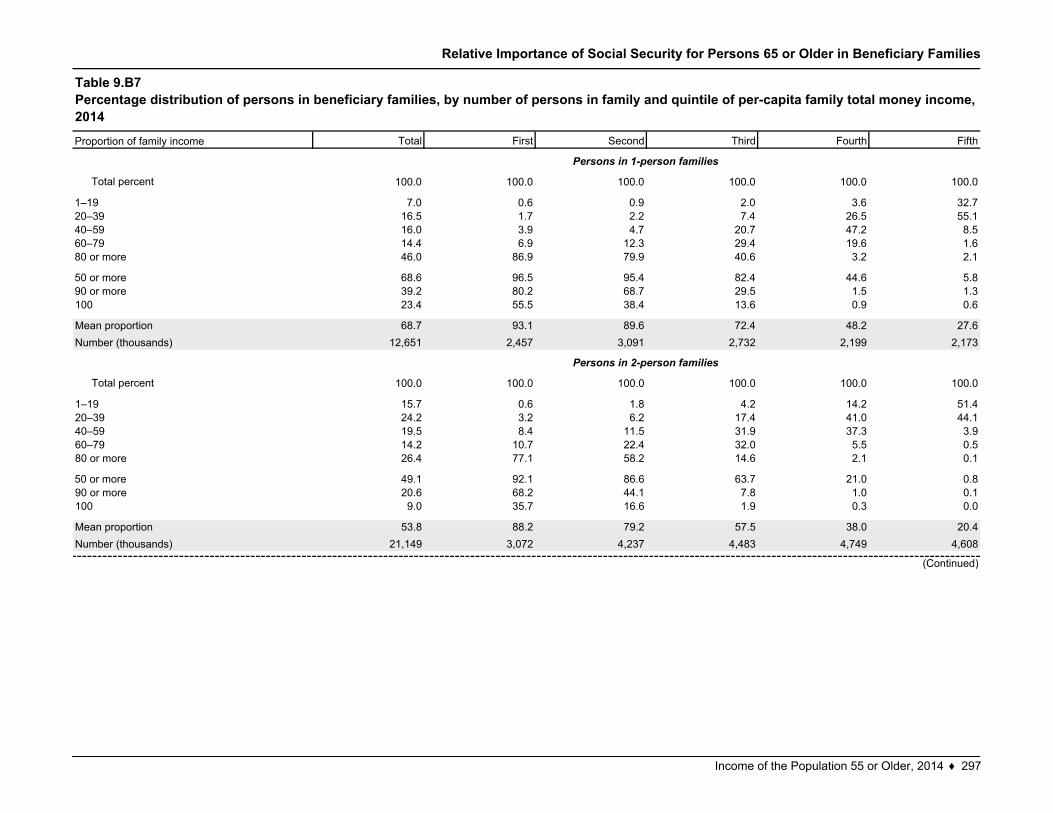
Total First Second Third Fourth Fifth
Total percent 100.0 100.0 100.0 100.0 100.0 100.0
7.0 0.6 0.9 2.0 3.6 32.716.5 1.7 2.2 7.4 26.5 55.116.0 3.9 4.7 20.7 47.2 8.514.4 6.9 12.3 29.4 19.6 1.646.0 86.9 79.9 40.6 3.2 2.1
68.6 96.5 95.4 82.4 44.6 5.839.2 80.2 68.7 29.5 1.5 1.323.4 55.5 38.4 13.6 0.9 0.6
68.7 93.1 89.6 72.4 48.2 27.612,651 2,457 3,091 2,732 2,199 2,173
Total percent 100.0 100.0 100.0 100.0 100.0 100.0
15.7 0.6 1.8 4.2 14.2 51.424.2 3.2 6.2 17.4 41.0 44.119.5 8.4 11.5 31.9 37.3 3.914.2 10.7 22.4 32.0 5.5 0.526.4 77.1 58.2 14.6 2.1 0.1
49.1 92.1 86.6 63.7 21.0 0.820.6 68.2 44.1 7.8 1.0 0.19.0 35.7 16.6 1.9 0.3 0.0
53.8 88.2 79.2 57.5 38.0 20.421,149 3,072 4,237 4,483 4,749 4,608
40–5960–7980 or more
90 or more100
Mean proportionNumber (thousands)
100
Mean proportionNumber (thousands)
1–1920–39
Table 9.B7Percentage distribution of persons in beneficiary families, by number of persons in family and quintile of per-capita family total money income, 2014
Persons in 1-person families
Persons in 2-person families
Proportion of family income
1–1920–3940–5960–79
(Continued)
50 or more
80 or more
50 or more90 or more
Income of the Population 55 or Older, 2014 ♦ 297
Relative Importance of Social Security for Persons 65 or Older in Beneficiary Families
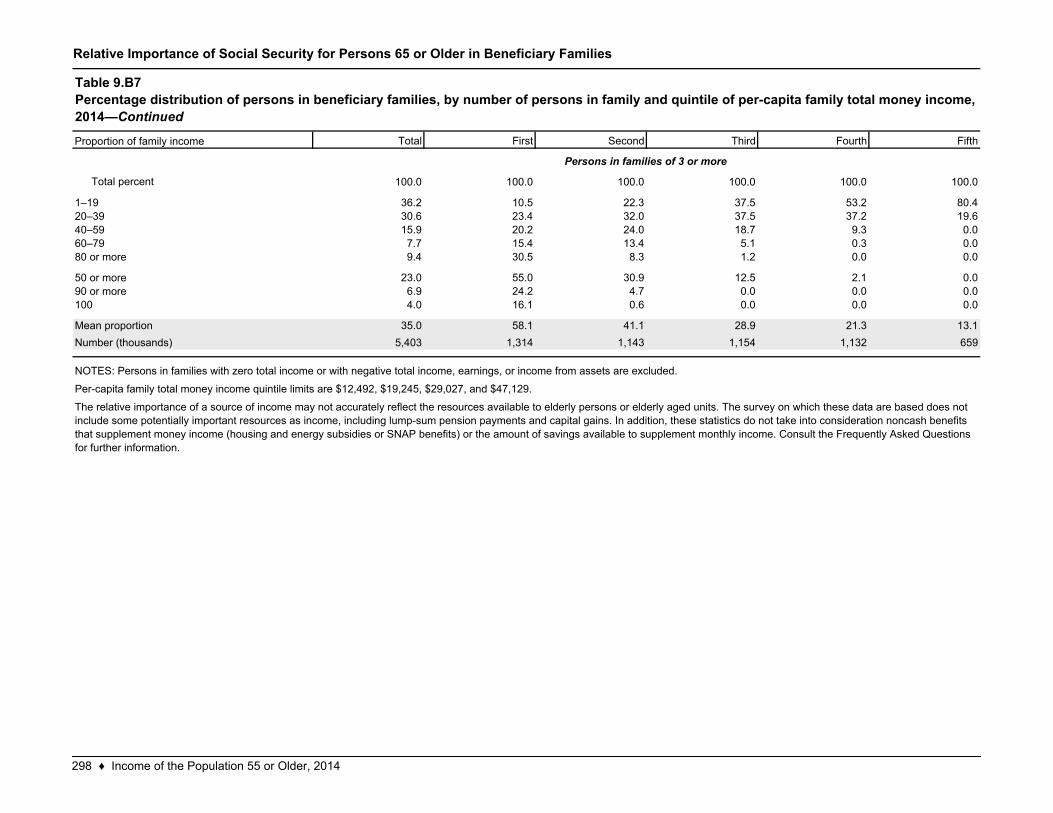
Total First Second Third Fourth Fifth
Total percent 100.0 100.0 100.0 100.0 100.0 100.0
36.2 10.5 22.3 37.5 53.2 80.430.6 23.4 32.0 37.5 37.2 19.615.9 20.2 24.0 18.7 9.3 0.07.7 15.4 13.4 5.1 0.3 0.09.4 30.5 8.3 1.2 0.0 0.0
23.0 55.0 30.9 12.5 2.1 0.06.9 24.2 4.7 0.0 0.0 0.04.0 16.1 0.6 0.0 0.0 0.0
35.0 58.1 41.1 28.9 21.3 13.15,403 1,314 1,143 1,154 1,132 659
Mean proportionNumber (thousands)
NOTES: Persons in families with zero total income or with negative total income, earnings, or income from assets are excluded.
Per-capita family total money income quintile limits are $12,492, $19,245, $29,027, and $47,129.
The relative importance of a source of income may not accurately reflect the resources available to elderly persons or elderly aged units. The survey on which these data are based does not include some potentially important resources as income, including lump-sum pension payments and capital gains. In addition, these statistics do not take into consideration noncash benefits that supplement money income (housing and energy subsidies or SNAP benefits) or the amount of savings available to supplement monthly income. Consult the Frequently Asked Questions for further information.
100
1–1920–3940–5960–7980 or more
50 or more90 or more
Persons in families of 3 or more
Table 9.B7Percentage distribution of persons in beneficiary families, by number of persons in family and quintile of per-capita family total money income, 2014—Continued
Proportion of family income
298 ♦ Income of the Population 55 or Older, 2014
Relative Importance of Social Security for Persons 65 or Older in Beneficiary Families
Under 1.00
1.00–1.24
1.25–1.49
1.50–1.99
2.00 or more
Under 1.00
1.00–1.24
1.25–1.49
1.50–1.99
2.00 or more
Under 1.00
1.00–1.24
1.25–1.49
1.50–1.99
2.00 or more
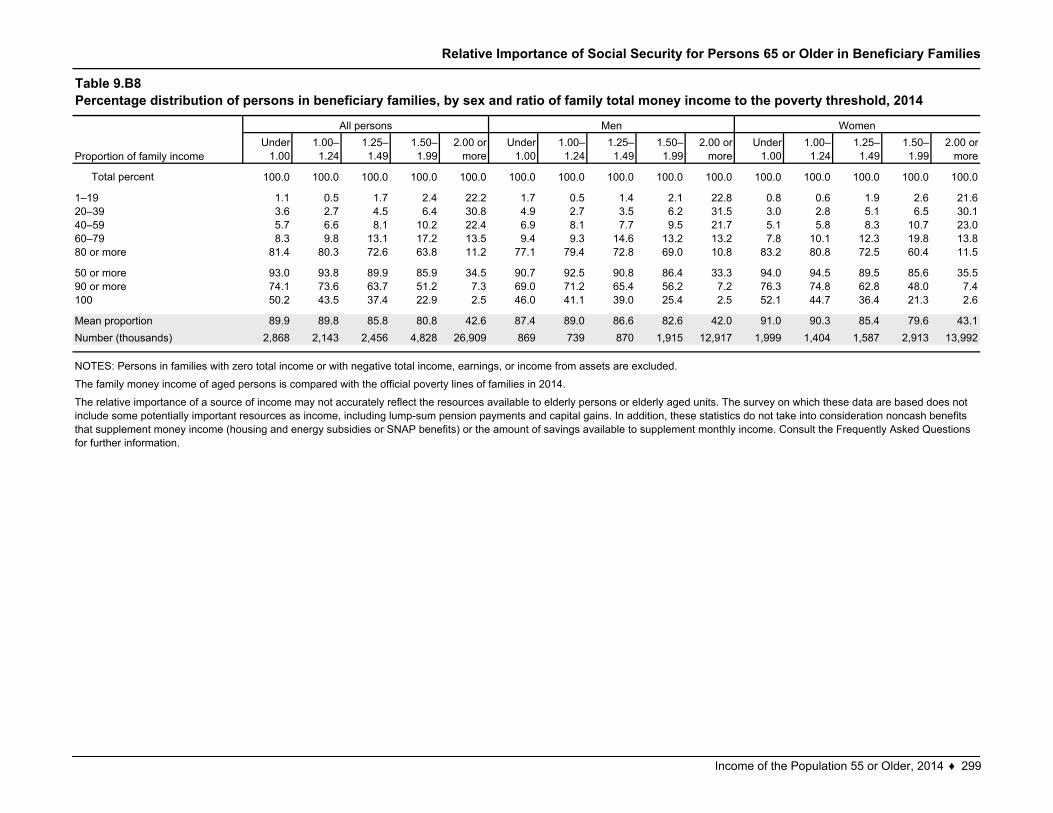
Total percent 100.0 100.0 100.0 100.0 100.0 100.0 100.0 100.0 100.0 100.0 100.0 100.0 100.0 100.0 100.0
1.1 0.5 1.7 2.4 22.2 1.7 0.5 1.4 2.1 22.8 0.8 0.6 1.9 2.6 21.63.6 2.7 4.5 6.4 30.8 4.9 2.7 3.5 6.2 31.5 3.0 2.8 5.1 6.5 30.15.7 6.6 8.1 10.2 22.4 6.9 8.1 7.7 9.5 21.7 5.1 5.8 8.3 10.7 23.08.3 9.8 13.1 17.2 13.5 9.4 9.3 14.6 13.2 13.2 7.8 10.1 12.3 19.8 13.8
81.4 80.3 72.6 63.8 11.2 77.1 79.4 72.8 69.0 10.8 83.2 80.8 72.5 60.4 11.5
93.0 93.8 89.9 85.9 34.5 90.7 92.5 90.8 86.4 33.3 94.0 94.5 89.5 85.6 35.574.1 73.6 63.7 51.2 7.3 69.0 71.2 65.4 56.2 7.2 76.3 74.8 62.8 48.0 7.450.2 43.5 37.4 22.9 2.5 46.0 41.1 39.0 25.4 2.5 52.1 44.7 36.4 21.3 2.6
89.9 89.8 85.8 80.8 42.6 87.4 89.0 86.6 82.6 42.0 91.0 90.3 85.4 79.6 43.12,868 2,143 2,456 4,828 26,909 869 739 870 1,915 12,917 1,999 1,404 1,587 2,913 13,992
Table 9.B8Percentage distribution of persons in beneficiary families, by sex and ratio of family total money income to the poverty threshold, 2014
All persons Men Women
Proportion of family income
NOTES: Persons in families with zero total income or with negative total income, earnings, or income from assets are excluded.
The family money income of aged persons is compared with the official poverty lines of families in 2014.
The relative importance of a source of income may not accurately reflect the resources available to elderly persons or elderly aged units. The survey on which these data are based does not include some potentially important resources as income, including lump-sum pension payments and capital gains. In addition, these statistics do not take into consideration noncash benefits that supplement money income (housing and energy subsidies or SNAP benefits) or the amount of savings available to supplement monthly income. Consult the Frequently Asked Questions for further information.
1–1920–3940–5960–7980 or more
50 or more90 or more100
Mean proportionNumber (thousands)
Income of the Population 55 or Older, 2014 ♦ 299