Embed Size (px)
Citation preview

Please cite this paper as:
Harding, M. (2013), “Taxation of Dividend, Interest, andCapital Gain Income”, OECD Taxation Working Papers,No. 19, OECD Publishing.http://dx.doi.org/10.1787/5k3wh96w246k-en
OECD Taxation Working Papers No. 19
Taxation of Dividend,Interest, and Capital GainIncome
Michelle Harding

1
OECD CENTRE FOR TAX POLICY AND ADMINISTRATION
OECD TAXATION WORKING PAPERS SERIES
This series is designed to make available to a wider readership selected studies drawing on the work of the
OECD Centre for Tax Policy and Administration. Authorship is usually collective, but principal writers are
named. The papers are generally available only in their original language (English or French) with a short
summary available in the other.
The opinions expressed and arguments employed in these papers are the sole responsibility of the author(s)
and do not necessarily reflect those of the OECD or of the governments of its member countries.
Comments on the series are welcome, and should be sent to either [email protected] or the Centre for
Tax Policy and Administration, 2, rue André Pascal, 75775 PARIS CEDEX 16, France.
Applications for permission to reproduce or translate all, or part of, this material should be sent to OECD
Publishing, [email protected] or by fax 33 1 45 24 99 30.
Copyright OECD 2013
2
ABSTRACT
This paper provides an overview of the differing ways in which capital income is taxed across the
OECD. It provides an analytical framework which summarises the statutory tax treatment of dividend
income, interest income and capital gains on shares and real property across the OECD, considering where
appropriate the interaction of corporate and personal tax systems. It describes the different approaches to
the tax treatment of these income types at progressive stages of taxation and concludes the discussion of
each income type by summarising the different systems in diagrammatic form. For each income type, the
paper presents worked calculations of the maximum combined statutory tax rates in each OECD country,
under the tax treatment and rates applying as at 1 July 2012. These treatments and rates may have changed
since this date and the paper should not be interpreted as reflecting the current taxation of capital income in
OECD countries.
RÉSUMÉ
Ce document donne un aperçu des diverses formes d’imposition des revenus du capital dans les pays
de l’OCDE. Il offre un cadre d’analyse qui résume le traitement fiscal légal des dividendes, des intérêts
perçus et des plus-values réalisées sur les actions et sur les biens immobiliers dans les pays de l’OCDE, en
tenant compte le cas échéant de l’interaction entre le régime de l’impôt sur les sociétés et celui de l’impôt
sur le revenu des personnes physiques. Il décrit les différentes approches du traitement fiscal de ces types
de revenu à différents niveaux du barème progressif et conclut l’analyse de chaque type de revenu par des
diagrammes qui résument les différents systèmes existants. Pour chaque type de revenu, ce document
présente des calculs élaborés des taux maximums d’imposition combinés en vigueur dans chaque pays de
l’OCDE, en fonction du régime fiscal et des taux applicables au 1er juillet 2012. Ces régimes et taux ont
peut-être été modifiés depuis cette date, de sorte que ce document ne reflète pas nécessairement la situation
actuelle de la fiscalité des revenus du capital dans les pays de l’OCDE.

3
FOREWORD
The author thanks Delegates to Working Party No. 2 on Tax Policy Analysis and Tax Statistics of the
Committee of Fiscal Affairs (CFA) of the OECD, and Delegates of the CFA itself, for their helpful
comments on earlier drafts. It is related to the broader project on savings income being undertaken by the
Secretariat’s Centre for Tax Policy and Administration.The author is also grateful to Bert Brys for
comments on previous versions of the paper, as well as to Violet Sochay and Michael Sharratt for help
with preparing the paper for publication. The arguments employed and opinions expressed in this paper do
not necessarily reflect the official views of the Organisation or of the governments of its member countries.
The author is responsible for any remaining errors.

4
TAXATION OF DIVIDEND, INTEREST, AND CAPITAL GAIN INCOME
Michelle Harding1
TABLE OF CONTENTS
OECD CENTRE FOR TAX POLICY AND ADMINISTRATION ............................................................... 1
ABSTRACT .................................................................................................................................................... 2
RÉSUMÉ ......................................................................................................................................................... 2
FOREWORD ................................................................................................................................................... 3
1. Introduction .............................................................................................................................................. 5 Purpose ................................................................................................................................................ 5 Assumptions ........................................................................................................................................ 6 Outline of paper ................................................................................................................................... 6
2. Dividend Income ...................................................................................................................................... 7 Overview of dividend taxation and combined statutory tax rates ....................................................... 7 Corporate level treatment .................................................................................................................... 9 Individual level treatment .................................................................................................................. 10 Combined statutory tax rates and rates of return ............................................................................... 18
3. Interest Income....................................................................................................................................... 22 Overview of interest taxation and statutory rates .............................................................................. 22 Taxable individual income ................................................................................................................ 23 Tax payable by the individual ........................................................................................................... 25
4. Capital Gain Income .............................................................................................................................. 29 Overview of capital gains taxation and combined rates .................................................................... 29 Corporate level treatment of gains on shares ..................................................................................... 32 Individual level treatment .................................................................................................................. 32 Combined statutory tax rates and rates of return ............................................................................... 39
5. Conclusion ............................................................................................................................................. 44
REFERENCE LIST ....................................................................................................................................... 47
ANNEX A EXPLANATION OF DIAGRAMMATIC REPRESENTATION OF TAX SYSTEMS ........... 48
ANNEX B COMBINED TAX RATES IN EACH OECD COUNTRY ....................................................... 50
ANNEX C CHANGE IN TAX TREATMENT GIVEN PROPORTION OF OWNERSHIP ....................... 53
OECD TAXATION WORKING PAPERS ................................................................................................... 54
THE OECD TAXATION WORKING PAPERS SERIES ON LINE ........................................................... 56
Boxes
Box 1. Interaction between personal and corporate taxes .......................................................................... 16 Box 2. Taxation of capital gains on section 1250 property in the United States ....................................... 37
1 Michelle Harding is a Tax Economist in the Tax Policy and Statistics Division at the OECD Centre for Tax Policy and
Administration. Contact e-mail: [email protected].

5
1. Introduction
Purpose
Many individuals, especially employees and pensioners, do not generate capital income from their
own business activity, but they may have capital income from holding funds in deposit accounts or bonds,
or from the ownership of shares or real property. The tax systems applied to these forms of income differ
within and across OECD countries according to the nature, timing and source of the revenue, and the
income level and characteristics of the income-earner.
As a first step toward a comparative, descriptive analysis of the differing regimes for the taxation of
capital income in OECD countries, this paper provides an analytical framework which summarises the
different types of tax systems applied to three simple types of capital income earned by resident individuals
in a domestic setting:
Dividend income from ordinary shares;
Interest income from cash deposits and government bonds; and
Capital gains realised on real property and shares.
The paper uses this framework to describe the different types of tax systems that can apply to these
types of income, noting those used in each OECD country and considering, where appropriate, the
interaction between corporate and personal taxation. It calculates the maximum statutory combined tax
burden on each income type: tracing the impact of different tax treatments from pre-tax income, through
the relevant corporate and personal tax systems, to the post-tax income received by a representative
individual. The descriptions of the different progressions are supplemented with diagrammatic and
algebraic presentations and worked examples for each country.
The tax rates presented in this paper represent the maximum possible burden on capital income under
the relevant tax systems and statutory rates, rather than the effective tax rates on these different income
types. At the individual level, the paper assumes the taxpayer to pay the highest marginal rate of tax and
does not consider personal circumstances, such as the existence of family tax credits, that may reduce
effective income tax rates. At the corporate level, the impact of deductions or tax planning in reducing
effective tax rates is also not considered. Two related OECD work streams will calculate effective tax rates
on capital income: the first will consider effective tax rates on corporate income, including the impact of
tax planning; and the second, effective tax rates on savings income at the individual level for a broader
range of tax payers and savings opportunities than this paper.
The paper’s descriptions and analysis are somewhat stylised in order to distil the main features of
what are often complex tax regimes, but it provides an overview of:
The differing ways in which dividends, interest and capital gains are taxed;
How far the relative taxation of dividends, interest, and capital gains varies in each country and
from country to country; and
The differing ways in which so-called double taxation of dividends (and possibly, capital gains)
at corporate and individual levels is attenuated.
6
Assumptions
The paper discusses income and gains received by individuals on savings placed directly in three
types of representative assets:
Equity in a domestic public quoted company;2
Deposits in retail banking institutions and government bonds, where the return consists only of
interest; and
Residential property which has been rented to tenants.
Three types of capital income from these assets have been considered: dividend income from shares,
interest income from deposits and bonds, and capital gains on shares and residential property. For each, the
most basic form of the income type has been considered, as the tax treatment of these sets the foundation
from which the tax treatment of more complex forms of the same type of income may vary. The rate of
return is assumed to be 4%, which affects the tax rates shown for Belgium, Italy (for new equity only), the
Netherlands, and Norway. The impact of varying rates of returns on the combined statutory rates in each of
these countries is discussed more fully later in the report. The report considers taxes on the income from
these assets but not taxes on the value of the investment (wealth taxes). Where wealth taxes exist, these
would increase the tax burden on these assets.
The paper assumes that the investor is resident in the particular country and is not related to the source
of income. The investor considered is assumed to pay the top rate of any progressive rate scale applicable.3
Financial assets are assumed to be held outside tax-preferred accounts (such as pensions, retirement
accounts or investment funds). As the importance of these accounts varies across countries, cross-country
comparisons should be made with caution. The impact of inflation on the real amount of the post-tax return
is described qualitatively, as are systems which index certain types of income for inflation, but is not taken
into account in the calculation of the combined rates. Capital gains on shares are assumed to derive entirely
from retained profits, whereas capital gains on property are assumed to derive from property that is directly
held by the investor. Tax rates are current as of 1 July 2012.4
Information used in the analysis has been taken from data supplied by countries for the OECD Tax
Database (in particular, Tables I.7, II.1 and II.4); returns to the questionnaire on the tax treatment of
household savings; the IBFD Tax Database; consultations with member countries; and where necessary,
country-specific source data.
Outline of paper
Section 2 of this paper discusses the taxation of dividend income at the corporate and shareholder
levels; noting the method of integration between the two levels of taxation. Section 3 considers the tax
treatment of interest income earned by individuals. Section 4 considers the tax treatment of capital gains on
shares and on real property, including discussion of the integration of the corporate and personal taxation
of shares; the applicable tax rates; and the impact of holding period tests on the tax treatment. At the
conclusion of each section a diagram is presented which summarises the different tax treatments in OECD
2 This is assumed to be a minority shareholding. For a summary of how tax rules change based on the proportion of
ownership, see Annex C. 3 Across countries, the top rate will apply to different numbers of taxpayers depending on the position of the relevant
threshold in the income distribution of each country. The proportion of taxpayers paying the top rate can therefore vary markedly between countries.
4 Tax rates in many countries will have changed since this date. See the OECD Tax Database for the most recently available information.

7
countries for that type of income. Section 5 concludes and sets out summary results for each of the income
types across OECD countries.
Annex A provides further explanation of the diagrams used to summarise the tax treatment of each
form of income. Annex B contains graphs for each country showing the different statutory tax rates on
each form of income. Annex C provides a brief overview of how country tax rules for capital gains and
dividends vary depending on the percentage of the company owned by a shareholder.
2. Dividend Income
The combined statutory tax rate on dividend income is a function of the tax systems and rates that
apply at the corporate and individual levels and of the interaction between these two levels. Dividends are
taxed firstly as corporate income and are then distributed to the shareholder where they may be taxed again
as personal income. The integration between the amount of corporate tax paid and the tax paid at the
individual level is thus a critical factor in determining the combined statutory tax rate on dividend income.5
OECD countries use a range of approaches at the individual level to integrate corporate tax paid.
Overview of dividend taxation and combined statutory tax rates
The combined personal and corporate statutory tax rates on dividends in OECD countries range from
61% in France to 19% in the Slovak Republic, with an OECD simple average6 of 41.8% as shown in
Figure 1. Table 1 summarises the calculation of these figures (which is set out in full at Table 4), noting the
different types of treatment applied in each. A schematic of the calculation is shown at Figure 6.
Figure 1: Combined statutory corporate and shareholder tax rates on dividends as at 1 July 20127
5 For simplicity, this paper assumes that the statutory rate of corporate tax has been paid. 6 This average uses the combined tax rate for dividends from new equity in Italy, rather than from existing equity. If the
combined tax rate on existing equity were used instead, the simple average combined tax rate across the OECD would
be 42.3%. 7 Figure 1 shows the combined statutory tax rates calculated in Tables 1 and 4. ITAex shows the combined tax rate on
existing equity; ITAnew shows the combined tax rate on new equity. The underlying assumptions are set out in the footnotes to Table 1.
0%
10%
20%
30%
40%
50%
60%
FR
A
DN
K
NLD IR
L
CH
E
US
A
GB
R
KO
R
CA
N
ES
P
PR
T
DE
U
SW
E
AU
S
AU
T
ISR
JPN
LUX
ITA
ex
OE
CD
FIN
NO
R
CH
L
GR
C
ISL
SV
N
PO
L
TU
R
NZ
L
HU
N
BE
L
CZ
E
ME
X
ITA
new
ES
T
SV
K
Estimated combined statutory tax rate

8
Table 1: Tax payable on dividends at the corporate and individual level as at 1 July 20128
Country Treatment Corporate
tax payable
Taxable income to
shareholder
Personal tax payable Post-tax shareholder
income
Combined statutory
rate Final
withholding Shareholder
Australia IM 30.00 100.00
16.50 53.50 47%
Austria FW 25.00 75.00 18.75
56.25 44%
Belgium ACE 8.50 91.50 22.88
68.63 31%
Canada IM* 26.14 101.93
23.41 50.45 50%
Chile IM 20.00 100.00
20.00 60.00 40%
Czech Republic FW 19.00 81.00 12.15
68.85 31%
Denmark CL^ 25.00 75.00
31.50 43.50 57%
Estonia DD 21.00
79.00 21%
Finland9 PI 24.50 52.85
16.91 58.59 41%
France FW 34.43 65.57 26.56
39.01 61%
Germany10
FW 30.18 69.83 18.42
51.41 49%
Greece FW 20.00 80.00 20.00
60.00 40%
Hungary FW 19.00 81.00 12.96
68.04 32%
Iceland CL 20.00 80.00
16.00 64.00 36%
Ireland CL 12.50 87.50
42.00 45.50 55%
Israel CL^ 25.00 75.00
18.75 56.25 44%
Italy (new equity)11
ACE 6.88 93.13 18.63
74.50 26%
Italy (old equity) FW 27.50 72.50 14.50 58.00 42%
Japan CL^ 37.00 63.00
6.30 56.70 43%
Korea IM* 24.20 84.14
25.91 49.89 50%
Luxembourg PI 28.80 35.60
13.87 57.33 43%
Mexico IM 30.00 100.00
70.00 30%
Netherlands PR 25.00 100.00
30.00 45.00 55%
New Zealand IM 28.00 100.00
5.00 67.00 33%
Norway RRA 28.00 44.50
12.46 59.54 40%
Poland FW 19.00 81.00 15.39
65.61 34%
Portugal FW 31.50 68.50 17.13
51.38 49%
Slovak Republic NT 19.00
81.00 19%
Slovenia CL 18.00 82.00
16.40 65.60 34%
Spain CL 30.00 70.00
18.90 51.10 49%
Sweden CL 26.30 73.70
22.11 51.59 48%
Switzerland CL 21.17 78.83
31.51 47.32 53%
Turkey PI 20.00 40.00
14.00 66.00 34%
United Kingdom12
IM^ 24.00 84.44
27.44 48.56 51%
United States13
CL^ 39.10 60.90
12.97 47.93 52%
8 Table 1 shows worked calculations of the tax rates shown in Figure 1. Fuller details of the calculation are set out in
Table 4. The assumed rate of return is 4%. The impact of other rates of return on the rates for Belgium, new equity in Italy, the Netherlands and Norway are shown in Figures 5 and 6.
9 In Finland, the shareholder tax rate is 32% for incomes exceeding EUR 50 000 and 30% for incomes under this
amount. 10 The withholding rate applied for Germany includes the 25% withholding rate and the 1% solidarity surcharge. 11 For new equity, Italy applies an allowance for corporate equity at the corporate level and a final withholding tax at the
individual level. 12 Tax rates on dividends and interest in the United Kingdom were reduced by 5% from 1 April 2013. 13 The analysis assumes that the Alternative Minimum Tax does not apply. Tax rates in the United States were changed as
of 1 January 2013 under the American Taxpayer Relief Act of 2012. For a description of these changes, see OMB (2013) at p 175.

9
As dividends are taxed first at the corporate level and then at the personal level, the amount of pre-tax
income earned can be split into three components: portion paid to the government as corporate tax, the
portion paid in personal tax, and the portion received by the shareholder. Using the information shown in
Table 1, Figure 2 shows this division for each OECD country. For example, in Sweden, 26.3% of pre-tax
corporate income is paid in corporate taxes (the corporate tax rate C); 22.1% is paid in personal taxes (the
shareholder tax rate on distributed income S(1-C)) and the remaining 51.6% is received by the shareholder
as post-tax income.
For imputation systems, Figure 2 assumes, simply because of the order of progression in the
framework proposed by this paper, that the full amount of corporate tax is paid and imputation or dividend
tax credits offset personal tax. Equally, the figure could assume the imputation and dividend tax credits
offset the amount of corporate tax paid and that the full amount of personal tax is payable. For countries
where the rate of return is used in the calculation of tax payable (Belgium, Italy (new equity only) the
Netherlands and Norway) the composition of the pre-tax return will differ depending on the rate of return
assumed. The impact of different rates of return on the composition of pre-tax revenue in these countries is
set out in Figures 4 and 5.
Figure 2: Composition of pre-tax dividend income (with tax rates as at 1 July 2012)
Corporate level treatment
The return on equity in the form of dividends is first subject to taxation at the corporate level as
company profits, reducing the amount of the income distributed to the shareholder. OECD countries use
three approaches to taxation at the corporate level: no corporate taxation, a standard corporate income tax,
and allowing a deduction for corporate equity to be made against the corporate income tax.
No taxation
Among OECD countries, Estonia does not tax retained corporate profits under a corporate income tax
regime, but instead applies a tax on distribution. At the shareholder level, the full amount of the
distribution is treated as taxable income. The distribution tax is paid at the point of distribution and is
therefore similar to a final withholding tax. No further tax is payable at the shareholder level on distributed
income.
The distribution tax is shown in Figure 6 as a tax at the individual level given that it is linked more
directly to distributed income than to company income. Shareholders receive pre-tax corporate income, A,
less the amount of distribution tax paid, D, at the corporate level. The amount of tax paid is DA and the
combined tax rate, relative to pre-tax corporate income, is the amount of distribution tax, D.
0%
20%
40%
60%
80%
100%
SV
K
ES
T
ITA
new
ME
X
CZ
E
BE
L
HU
N
NZ
L
TU
R
PO
L
SV
N
ISL
CH
L
GR
C
NO
R
FIN
ITA
ex
LUX
JPN
AU
T
ISR
AU
S
SW
E
DE
U
PR
T
ES
P
CA
N
KO
R
GB
R
US
A
CH
E
IRL
NLD
DN
K
FR
A
% received by shareholder as pre-tax income % paid as corporate tax % paid as personal tax
Pre-tax income

10
Taxation at the corporate level
Most OECD countries tax net corporate income at the corporate level under a corporate income tax
regime. For these systems, the amount of corporate tax payable is shown in the fourth column of Figure 6
as the applicable corporate tax rate, C, multiplied by pre-tax corporate income A. Post-tax corporate profit,
available for distribution to shareholders or for reinvestment into the company, is shown on Figure 6 in the
fifth column as A(1-C). This formula also can be written as A-AC: the initial amount of pre-tax corporate
income, A, less corporate tax paid on that income, CA.
A(1-C) forms the basis for the taxable income at the shareholder level in all but three countries:
Estonia, discussed above; the Slovak Republic, where no tax is payable at the individual level; and the
Netherlands, where the amount of taxable income is a deemed return on the shareholder’s equity.
Allowance for corporate equity treatment
A variant on the corporate income tax is the allowance for corporate equity (ACE) used in Belgium,
and from 2012, for new equity in Italy. Under this approach, corporations may make a deduction against
corporate tax based on the level of corporate equity. The rate of the allowance is intended to approximate
the risk-free return on equity and thus to exempt the risk-free return from corporate taxation – equivalent to
a cash-flow tax at the corporate level. If pre-tax corporate profit is equal to the risk-free return on corporate
equity, this system eliminates double taxation.
In Figure 6, corporate equity is shown as E in the first column. The allowable deduction is shown as
ZE (see the second column of Figure 6), where Z is the prescribed risk-free rate of return on equity. The
allowance for corporate equity is offset against the corporate tax liability, which reduces the tax payable at
the corporate level from CA to C(A-ZE). The post-tax corporate profit available for distribution is the
company’s pre-tax profits, reduced by tax paid on extra-normal returns.
The impact of the ACE system on post-tax corporate profits is shown in the fifth column of Figure 6
as A-C(A-ZE). When expanded, this becomes A-CA+CZE. The difference between a standard corporate
income tax and a system which allows a deduction for corporate equity is seen in the final term, CZE: an
allowance for corporate equity reduces tax paid on pre-tax corporate profits, relative to standard corporate
taxation, by an amount equal to the corporate tax rate multiplied by the allowance for corporate equity.
Other options to integrate personal and corporate tax at the corporate level
Although not currently used in OECD countries, other options exist at the corporate level to integrate
corporate and personal tax systems. Companies could be permitted to make deductions for distributed
income, allowing corporate tax paid on dividends to be recovered by the company and, in effect,
distributed dividends to be made from pre-tax income. If shown on Figure 6, post-tax corporate profits
under this system would be equal to A. A split-rate system could also be used, where distributed profits
would be taxed at a lower rate at the corporate level than retained profits. Under a split-rate system,
distributed profits would be equal to corporate profits reduced by the lower tax rate: A(1-C^). The
reduction in corporate tax paid, relative to a standard corporate tax, would be (1-S)(C-C^).
Individual level treatment
After taxation at the corporate level, post-tax corporate profits can be distributed to the shareholder or
reinvested. If distributed, the combined tax rate will be determined by two aspects of the tax treatment at
the individual level: the amount of distributed income that is treated as taxable to the shareholder and the
rate applied.

11
Amount of distributed income treated as taxable shareholder income
The starting point to determine the amount of taxable income to the shareholder in most OECD
systems is the amount of post-tax corporate income received. With the exception of the Slovak Republic
and the Netherlands,14
all OECD countries base the amount of taxable income at the shareholder level on
the amount of post-tax corporate income distributed to the shareholder, by treating all or part of the
distributed as taxable to the shareholder, or by grossing-up the amount of the distribution to approximate
pre-tax corporate income.
Full inclusion
Most commonly, the full amount of the distribution is treated as taxable income at the shareholder
level, although in many countries a small fixed amount may be exempt from taxation. Austria, Belgium,
the Czech Republic, Denmark, France, Germany, Greece, Hungary, Iceland, Ireland, Israel, Italy, Japan,
Poland, Portugal, Slovenia, Spain, Sweden, Switzerland, and the United States treat distributed post-tax
corporate income as taxable to the shareholder and tax the distribution under the relevant personal income
tax rates. These rates and the mechanisms of taxation applied are discussed further below.
The amount of taxable income at the shareholder level in these countries is therefore A(1-C), with the
exception of Belgium and for new equity in Italy, where taxable income to the shareholder is the full
amount of post-tax corporate income (including the allowance for corporate equity): A-C(A-ZE).
Partial inclusion
A second approach is to exempt part of the distribution from taxation at the individual level. Finland,
Luxembourg and Turkey include only a proportion of the distribution as taxable income to the shareholder,
reducing the combined tax rate on dividend income relative to full inclusion. Table 2 sets out the amount of
post-tax corporate income included as taxable income at the shareholder level in these countries, as well as
the impact of partial inclusion in reducing the combined tax rate on dividend income relative to full
inclusion.
Table 2: Partial inclusion and impact on combined tax rates
Proportion treated as
taxable income Combined tax rate with
partial inclusion Combined tax rate if full distribution was taxable
Finland 70% 41% 49%
Luxembourg 50% 43% 57%
Turkey 50% 34% 48%
The proportion of post-tax corporate profits that is taxable to the shareholder is denoted by XA(1-C)
on Figure 6, where X is the proportion of the profits included in the shareholder’s tax base. The tax paid
under this type of system is the amount of corporate tax paid, CA, plus the additional tax payable at the
shareholder level SXA(1-C). The combined tax rate on dividend income is therefore C+SX(1-C).
Partial inclusion of post-tax corporate profits is equivalent to lowering the rate of tax applying to
dividends at the shareholder level by the same proportion. It reduces the double-tax element inherent under
a classical system by S(1-C)(1-X)), as it lowers the tax rate applied at the shareholder level by the
proportion excluded, X.
14 The Slovak Republic does not apply further taxation at the individual level. The Netherlands calculates taxable income
to the individual based on a presumptive return, independent of the amount of dividend income received.

12
A variant of partial inclusion is used in Norway. In Norway, shareholders are allowed a shielding
deduction which reduces their taxable dividend income. This shielding deduction is calculated based on the
cost price of the shareholding and a set rate of interest. Similar to the allowance for corporate equity, this
deduction is equivalent to an individual level cash-flow tax. The allowance for shareholder equity system
exempts the normal return on equity from taxation at the shareholder level and reduces double taxation.
The rate of return allowance in Norway reduces the combined tax rates on dividend income, relative
to full inclusion, by the amount of shareholder tax multiplied by the allowance for shareholder equity,
divided by pre-tax corporate income. The taxable income base to the shareholder is post-tax corporate
profits, less an allowance for the normal rate of return and can be expressed as A(1-C)-RO. This amount
cannot be below zero and any unused proportion of an allowance is carried forward to apply to future
income from the same source. If the amount of distributed corporate profits is less than the allowance (i.e.
if A(1-C)≤RO), no further tax is payable at the individual level and the combined tax rate will be the
corporate tax rate. If distributed profits are greater than the allowance (i.e. if A(1-C)>RO), shareholder tax
is payable on the excess. Tax paid is the corporate tax, CA plus the individual level tax SA(1-C)-SRO; and
the combined tax rate relative to A is C+S(1-C)-SRO/A. Compared to the combined tax rate under a
classical dividend system, the combined rate is reduced by a factor equal to the tax saved through the
deduction for the normal return.
Imputation systems
Corporation and individual level taxation may also be integrated using an imputation system. Under
imputation systems, taxable income at the shareholder is the amount of distributed dividend income
grossed-up to approximate pre-tax corporate income. The tax payable on the grossed-up dividend is
reduced by a tax credit which offsets all or part of the corporate tax paid on the distributed profits.
Corporate tax is effectively a prepayment against the tax on dividend income applied at the individual
level.
Full imputation systems are used in Australia, Canada, Chile, Korea, Mexico, and New Zealand. The
United Kingdom applies a partial imputation system where tax credits received at the shareholder level
partially offset tax paid at the corporate level.
Imputation systems differ in two ways (as summarised in Table 3):
Gross-up of post-tax corporate income is up at the shareholder level: Australia, Chile, Mexico,
and New Zealand gross up distributed profits by the statutory corporate tax rate to arrive at
taxable shareholder income. Canada, Korea and the United Kingdom apply a set gross-up factor,
rather than the corporate tax rate, to derive taxable income to the shareholder.15
Reliance of the tax credit on corporate tax paid: In Australia, Chile, Mexico and New Zealand,
the shareholder tax credit is dependent on the amount of tax paid at the corporate level. Under
these systems, dividend income that has not been taxed at the corporate level does not give rise to
a tax credit at the shareholder level. In Canada, Korea, and the United Kingdom, the tax credit at
the shareholder level is not dependent on corporate tax paid, but is applied to all dividends at the
shareholder level.16
15 In Canada, due to the interaction of federal and state-level corporate taxes, the gross-up factor is set at a rate to
approximate the total (weighted average) corporate tax paid by corporations. 16 In Canada, the tax credit at the shareholder level is set in two proportions; with a 18% credit on grossed-up income
being applied at the federal level and an additional credit applying at the local level (for example at 7.7% in Ontario) to offset local corporate tax paid.

13
Table 3: Summary of imputation systems in OECD countries
Gross-up factor
Amount of corporate tax paid Specified in legislation
Imputation credit
Dependent on corporate tax effectively paid
Australia Chile Mexico New Zealand
Not dependent on corporate tax effectively paid
Canada Korea United Kingdom
Under imputation systems that gross-up income by the amount of corporate tax paid, the combined
tax rate on dividend income is the corporate tax rate plus the shareholder tax rate less the imputation rate:
C+S-I. The amount of shareholder tax payable, SA, is reduced by the available imputation credits, IA, so
that the amount of shareholder tax is SA-IA. The total tax paid on the dividends is corporate tax plus the
personal tax paid: CA+SA-IA. When divided by pre-tax corporate income, A, this gives a combined tax rate
of C+S-I.
Australia, Chile, Mexico and New Zealand operate full imputation systems that gross-up post-tax
corporate income by the amount of corporate tax paid and allow imputation credits for corporate tax paid at
the shareholder level. Corporations receive imputation credits for tax paid at the corporate level which are
retained in the company’s imputation credit account and can be attached to distributions to shareholders17
when they are made, subject to rules to prevent arbitrage such as imputation credit streaming.18
Examples
of rules used to prevent dividend streaming include:
Australia and New Zealand apply a benchmark rule to distributions which requires all dividends
paid by a company in a particular year to have the same imputation credit ratio. This prevents
differing levels of imputation credit being attached to different distributions to direct credits
toward or away from groups of taxpayers (who may be more or less able to utilise the credit).
Disclosure requirements require companies disclose the balance of and changes in their
imputation accounts; and so that each dividend distribution clearly sets out the amount of the
dividend, the attached imputation credit and the imputation credit ratio being applied.
A maximum imputation ratio (set at the corporate tax rate) prevents over-imputation.
In Mexico, shareholders can credit the tax paid by the corporation, which is determined as the
distributed dividend multiplied by a gross-up factor, and then multiplied by the corporate income
tax rate.
Full imputation entirely offsets the corporate tax paid: I will be equal to C and the combined tax rate
is the shareholder tax rate S. Partial imputation, where the imputation rate is lower than the corporate tax
rate (as in the United Kingdom), results in a combined tax rate which is equal to the shareholder rate plus
the difference between the company rate and the imputation rate.
17 In Mexico, imputation credits are not included in the distribution made by the company; rather, it is the shareholder
who must calculate the imputation credit by using the gross-up factor. 18 Imputation credit streaming is the distribution of imputation credits to shareholders in unequal proportions so that those
shareholders that can use them to offset other tax liabilities get more credits, and those that cannot use them to offset
tax liabilities get less or no credits; e.g. distribution of a higher number of credits to a taxpayer with a high marginal personal tax rate but not to non-resident shareholders.

14
Rather than using the corporate tax rate to gross-up the distribution, Canada and Korea use a specified
gross-up factor rather than by the corporate tax rate. Taxable income to the shareholder is GA(1-C), where
G is the gross-up factor that applies. Shareholders’ tax liabilities are offset by the applicable the imputation
credit: (S-I)(GA(1-C)). Total tax paid is therefore CA+GA(S-I)(1-C) and the combined tax rate is C+G(S-
I)(1-C).19
In Canada, Korea and the United Kingdom, the amount of the imputation credit is not dependent on
the amount of tax paid at the corporate level but is a set percentage of grossed-up income. Where
companies pay an average tax rate below the corporate tax rate (i.e. where C<I), taxpayers will receive
more imputation credits than needed to offset corporate tax paid and the combined tax rate will decrease by
the difference between the corporate tax rate and the tax rate of the distributing company.
Presumptive return on shareholder equity
Dividend income on minority shareholdings in the Netherlands (and other Box 3 income) is not based
on distributed post-tax corporate income but rather on a presumed return on shareholder equity. The
presumed return is designed to approximate the risk-free rate of return and is a fixed percentage of
shareholder equity. The shareholder’s tax liability in relation to listed shares is calculated by applying a flat
30% tax rate to a deemed 4% return on investment, which generates to a tax rate of 1.2% on the value of
the investment.20
The value of the investment is calculated by reference to the market value of the shares
(stock exchange value for listed shares) as at 1 January of the fiscal year. A withholding tax of 15% applies
to distributions and is creditable against personal income tax payable. Excess withholding taxes are
refunded. The dividend tax is also creditable against tax payable on Box 1 and Box 2 income.
A similar system applies on an optional basis in Sweden for certain financial assets, including
exchange-traded stocks, shares in investment funds, deposits and bonds. If held under the investment
savings account system, dividends, interest, and capital gains from these assets are taxed using a
presumptive return to a taxable base. The taxable base is the average of the total value of the assets in the
investment savings account and is measured four times during the year. The presumptive return is
calculated at the rate of return on five-year Swedish Treasury bills. Tax is payable at a rate of 30% on the
presumptive return and losses are not deductible. There is no tax on withdrawals of assets from an
investment savings account.
Under a presumptive capital tax, the income received by the shareholder will be post-tax corporate
profits, less the amount of the tax on the deemed return. This can be shown by A(1-C)-SPO. When divided
by pre-tax corporate income A, this means that the combined tax rate on dividend income received by
individuals will be the sum of the corporate tax rate and the tax rate on the deemed return divided by post-
tax company profits). This can be shown as C+SPO/A. Because the amount of tax paid is linked to the
value of equity rather than to the return on equity, the effective tax rate on dividend income decreases as
the rate of return increases.
19 The difference between this and situations where the gross-up is the corporate tax rate is seen in the way the gross-up
factor, G, in the preceding formula interacts with shareholder tax payable, GA(S-I)(1-C), as where G and 1/(1-C)
(gross-up by the corporate tax rate) are equivalent, shareholder tax payable is simply S-I as in the case where post-tax
corporate profits are grossed up by the corporate tax rate. 20 As elsewhere in the paper, the tax rate assumed to apply is the rate applicable to top marginal rate payers. This rate will
apply to different numbers of taxpayers depending on the position of the relevant threshold in the income distribution of each country.

15
Tax payable by the shareholder
Once the amount of taxable income to the shareholder has been determined, OECD countries tax that
income in three primary ways: classical taxation, where the income is taxed in the hands of the shareholder
at the applicable personal tax rates; final withholding taxes; and imputation systems (discussed above).
Classical taxation
A classical tax system includes all distributed dividend income to the shareholder and taxes this in the
hands of the shareholder at their normal personal income tax rates. Under a classical system, there is no
integration between corporate and personal taxes. Classical systems are used in Denmark,21
Iceland,
Ireland, Israel, Japan, Slovenia, Spain,22
Sweden, Switzerland, and the United States.
The amount of tax paid under a classical system is the amount of distributed income multiplied by the
shareholder’s tax rate, S. Shareholder tax payable is SA(1-C), and the amount of profit received by the
individual shareholder is A(1-C)(1-S). When the tax paid at the corporate level is considered, the combined
tax rate on dividend income under a classical system is C+S(1-C) or, if fully expanded, C+S-SC. Dividend
income is double-taxed: the full rates of both corporate and shareholder tax apply to pre-tax corporate
profits, subject to a reduction which is equal to the multiplication of these rates. In effect, SC represents the
proportion of the pre-tax corporate profit that is not taxed at shareholder rates because it is taxed at the
corporate level and therefore not received by the shareholder. Given this, a one percentage point increase in
either tax rate will increase the combined tax rate by a percentage point less the other rate multiplied by
that percentage point (e.g. by ∆C-∆C*S or by ∆S-∆S*C).23
The classical approach may be modified to apply lower tax rates to dividend income, in order to
partially alleviate double taxation. In Figure 6, this is denoted as a modified classical system and is used in
Denmark, Israel, Japan and the United States. Although the lower rate applied at the individual level
reduces the combined tax rate, dividend income is still double-taxed under this approach.
At the shareholder level, the classical approach also applies in Belgium, although against a taxable
income base of A-C(A-ZE) rather than A(1-C) as a result of the allowance for corporate equity. Shareholder
tax payable is generated by multiplying the shareholder rate against the taxable income base (and is given
by S(A-C(A-ZE)). The combined tax rate is given by C-CZE+S(1-C+CZE). This formula also shows the
same double taxation element inherent in the classical system: corporate tax, C-CZE and shareholder tax,
S, both apply to the pre-tax corporate income earned and are reduced by the amount of tax paid at the
corporate level multiplied by the shareholder tax rate: S(C-CZE).
21 Denmark applies a preliminary withholding tax at source at 27%. For share income under DKK 48300 no further tax is
payable; incomes over this amount pay an additional tax of 15%. 22 In Spain dividends are exempt up to EUR 1 500 per year. 23 For example, with a corporate tax rate of 30%, and a personal tax rate of 35%, the combined tax rate on dividends will
be: 0.3+0.35-0.3*0.35=0.545. A one-percentage point change in the corporate tax rate will generate: 0.31+0.35-
.31*.35=0.5515. Increasing the corporate tax rate by one percentage point results in an increase in the combined
statutory rate of 0.65%; which is equivalent to the change in the corporate tax rate, less the change in the corporate tax rate multiplied by the shareholder tax rate: 0.01-0.01*0.35=0.0065.

16
Box 1. Interaction between personal and corporate taxes
The interaction of personal and corporate taxation is illustrated in Figure B1. The net-of-corporate tax rate (1-C) is shown on the horizontal axis, and the net-of-personal tax rate (1-S) is shown on the vertical axis. The total square therefore represents the total amount of pre-tax corporate income, A. Each individual square represents 1% of pre-tax corporate income, A. Figure B1 Interaction between personal and corporate taxation. Figure B1 shows a hypothetical country which has a corporate tax rate of 30% and a personal tax rate of 40%. For this example:
The area in the bottom left rectangle is the amount of income retained by the individual after personal and corporate taxes are taken into account ((1-C)(1-S); in this example, 42%);
Tax paid is seen in the rectangle across the top of the graph (the amount of personal tax payable, S (40%)) and the rectangle at the right of the graph (the amount of corporate tax payable, C (30%)), less the area at the top right of the graph, which is the overlap between S and C, SC (12%). SC is equivalent to the amount of double-taxation under a classical system.
Figure A : Interaction between personal and corporate taxation
Figure B2 shows the combined tax rates on dividend income for all OECD countries. The amount of post-tax income to the individual in each country in Figure B2 is the area to the left and below the dot representing that country. Countries with the lowest level of post-tax income to the individual (and therefore the highest combined statutory tax rate) are shown toward the bottom left corner of the graph. Those with the lowest combined statutory tax rates are shown at the top right. Due to the impact of different rates of return on the combined statutory tax rate, Belgium, Italy, the Netherlands and Norway are not shown in this figure.

17
Figure B: Levels of personal and corporate taxation in OECD countries as at 1 July 201224
Final withholding taxes
Austria,25
the Czech Republic, France, Germany, Greece, Italy (for both new and existing equity),
Hungary, Poland, and Portugal tax shareholder income via a final withholding system. Under these
systems, the taxable income base to the individual is the post-tax corporate profits A(1-C). Tax is withheld
either by the distributing company or by the withholding agent on behalf of the shareholder and no further
tax is payable at the shareholder level. The amount of tax withheld at the corporate level is expressed on
Figure 6 as WA(1-C): the withholding rate multiplied by the taxable income base to the individual. The
combined tax rate relative to pre-tax corporate profits, A, is the corporate tax paid plus the withholding tax
paid, divided by the pre-tax corporate profits and can be written as C+W(1-C).
Under this approach the same element of double taxation applies as under a classical system.
However, as withholding taxes require the income to be assessed separately from other income, they can
allow the rate of tax paid on dividends to be lowered relative to other income, which reduces (but does not
remove) the impact of double taxation.
24 The X and Y axes have been truncated to improve readability, but retain the measurement that each individual box on
the graph represents 1 % of pre-tax corporate income. 25 In Austria, an individual may opt for taxation within the personal income tax system, in which case their dividend,
interest, or capital gains income muse be declared. In practice, as the lowest marginal personal tax rate is 36.5% and the final withholding tax rate is 25%, this is very rare.
18
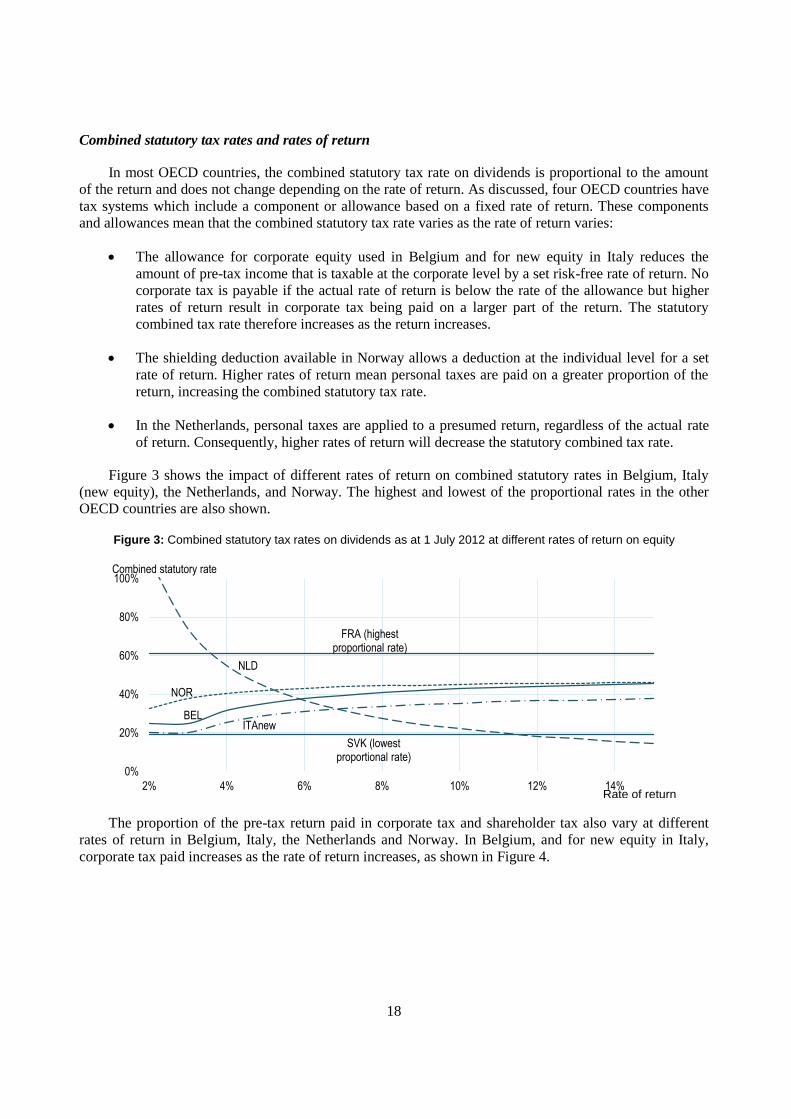
Combined statutory tax rates and rates of return
In most OECD countries, the combined statutory tax rate on dividends is proportional to the amount
of the return and does not change depending on the rate of return. As discussed, four OECD countries have
tax systems which include a component or allowance based on a fixed rate of return. These components
and allowances mean that the combined statutory tax rate varies as the rate of return varies:
The allowance for corporate equity used in Belgium and for new equity in Italy reduces the
amount of pre-tax income that is taxable at the corporate level by a set risk-free rate of return. No
corporate tax is payable if the actual rate of return is below the rate of the allowance but higher
rates of return result in corporate tax being paid on a larger part of the return. The statutory
combined tax rate therefore increases as the return increases.
The shielding deduction available in Norway allows a deduction at the individual level for a set
rate of return. Higher rates of return mean personal taxes are paid on a greater proportion of the
return, increasing the combined statutory tax rate.
In the Netherlands, personal taxes are applied to a presumed return, regardless of the actual rate
of return. Consequently, higher rates of return will decrease the statutory combined tax rate.
Figure 3 shows the impact of different rates of return on combined statutory rates in Belgium, Italy
(new equity), the Netherlands, and Norway. The highest and lowest of the proportional rates in the other
OECD countries are also shown.
Figure 3: Combined statutory tax rates on dividends as at 1 July 2012 at different rates of return on equity
The proportion of the pre-tax return paid in corporate tax and shareholder tax also vary at different
rates of return in Belgium, Italy, the Netherlands and Norway. In Belgium, and for new equity in Italy,
corporate tax paid increases as the rate of return increases, as shown in Figure 4.
BEL
FRA (highest proportional rate)
NLD
NOR
SVK (lowest proportional rate)
ITAnew
0%
20%
40%
60%
80%
100%
2% 4% 6% 8% 10% 12% 14%Rate of return
Combined statutory rate

19
Figure 4: Composition of pre-tax return in Belgium (LHS) and new equity in Italy (RHS)
In Norway, the amount of personal tax paid decreases as the return increases, as shown in Figure 5
(LHS). Figure 5 (RHS) shows the composition of pre-tax income in the Netherlands at different rates of
return. The presumed rate of return means that the shareholder will have to pay tax in excess of the return
if the rate of return is under 2.2%, and will pay less personal tax as the return increases.
Figure 5: Composition of pre-tax return in Norway (LHS) and the Netherlands (RHS)
0%
20%
40%
60%
80%
100%
2% 4% 6% 8% 10% 12% 14%
% received by s/holder % paid in personal tax% paid in corporate tax
Percentage of pre-tax return
Rate of return
Belgium
-20%
0%
20%
40%
60%
80%
100%
2% 4% 6% 8% 10% 12% 14%
% received by s/holder % paid in personal tax% paid in corporate tax
Percentage of pre-tax return
Rate of return
The Netherlands
0%
20%
40%
60%
80%
100%
2% 4% 6% 8% 10% 12% 14%
% received by s/holder % paid in personal tax% paid in corporate tax
Percentage of pre-tax return
Rate of return
Norway
0%
20%
40%
60%
80%
100%
2% 4% 6% 8% 10% 12% 14%
% received by s/holder % paid in personal tax
% paid in corporate tax
Percentage of pre-tax return
Rate of return
Italy (new equity)

20
Figure 6: Schematic diagram of the tax treatment of dividend income as at 1 July 2012 in OECD countries26
26 Figure 6 provides a diagrammatic and algebraic representation of the calculations made in Table 4. See Annex A for an explanation of the diagram.
Shareholder/ corporate equity
O,E
Equity allowance or return
R,P,Z
Pre-tax corporate profit
A
Corporate tax payable
C
Post-tax corporate profit
(distributed)
Taxable shareholder
incomeG,X
Imputation, dividend credits,
withholdingI,W
Shareholder tax payable
S
Post-tax shareholder
incomeCombined tax
rate
Tax on distributed dividendsEST
No shareholder taxationSVK
Final withholdingAUT CZE FRA DEU GRC HUN ITAex POL PRT
Partial inclusionFIN LUX TUR
ClassicalISL IRL SVN ESP SWE CHEModified classicalDNK ISR JPN USA
Full imputationAUS CHL MEX NZLPartial imputationGBR (DTC)
Full imputation (gross-up factor)CAN KOR
Rate of return allowanceNOR
Presumptive capital returnNLD
Allowance for corporate equityBEL ITA
A(1-C)
A(1-C)-S[A(1-C)-RO]
SA(1-C)
IGA(1-C)GA(1-C)
WA(1-C)
XA(1-C) SXA(1-C)
If A(1-C)>RO:A(1-C)-RO
S[A(1-C)-RO]
O(A)
RO
PO
A(1-C)-GA(S-I)(1-C)
GA(S-I)(1-C)
C(A-ZE) S[A-C(A-ZE)]A-C(A-ZE)
PO SPO A(1-C)-SPO
E(A) ZE
C+S-I
C+S(1-C)
C+SX(1-C)
C+W(1-C)
C
C+S(1-C)-SRO/A
C+G(S-I)(1-C)
S+(C-CZE)(1-S)
C+SPO/A
A(1-S)(1-C)
A(1-SX)(1-C)
(1-S)[A-C(A-ZE)]
A(1-W)(1-C)
A(S-I)A IA
CA A(1-C)
A(1-C-S+I)
A
DDA A(1-D)

21
Table 4: Calculation of tax payable on dividend income at the corporate and individual levels as at 1 July 201227
Type of dividend treatment
Pre-tax corporate
profit
Corporate tax rate
Corporate tax payable
Post-tax corporate profit
Proportion of income taxable
Taxable s/holder income
Final with-holding tax
rate
Final withholding tax payable
S/holder tax rate
S/holder tax payable
Post-tax shareholder
income
Combined tax rate
AUS IM 100.00 30% 30.00 70.00 143% 100.00
47% 16.50 53.50 46.5%
AUT FW 100.00 25% 25.00 75.00 100% 75.00 25% 18.75
56.25 43.8%
BEL ACE 100.00 34% 8.50 91.50 100% 91.50 25% 22.88
68.63 31.4%
CAN IM* 100.00 26% 26.14 73.86 138% 101.93
48% 23.41 50.45 49.6%
CHL IM 100.00 20% 20.00 80.00 125% 100.00
40% 20.00 60.00 40.0%
CZE FW 100.00 19% 19.00 81.00 100% 81.00 15% 12.15
68.85 31.2%
DNK CL^ 100.00 25% 25.00 75.00 100% 75.00
42% 31.50 43.50 56.5%
EST DD 100.00 21% 21.00 79.00
79.00 21.0%
FIN PI 100.00 25% 24.50 75.50 70% 52.85
32% 16.91 58.59 41.4%
FRA FW 100.00 34% 34.43 65.57 100% 65.57 41% 26.56
39.01 61.0%
DEU FW 100.00 30% 30.18 69.83 100% 69.83 26% 18.42
51.41 48.6%
GRC FW 100.00 20% 20.00 80.00 100% 80.00 25% 20.00
60.00 40.0%
HUN FW 100.00 19% 19.00 81.00 100% 81.00 16% 12.96
68.04 32.0%
ISL CL 100.00 20% 20.00 80.00 100% 80.00
20% 16.00 64.00 36.0%
IRL CL 100.00 13% 12.50 87.50 100% 87.50
48% 42.00 45.50 54.5%
ISR CL^ 100.00 25% 25.00 75.00 100% 75.00
25% 18.75 56.25 43.8%
ITA (new) ACE 100.00 28% 6.88 93.13 100% 93.13 20% 18.63
74.50 25.5%
ITA (ex) FW 100.00 28% 27.50 72.50 100% 72.50 20% 14.50 58.00 42.0%
JPN CL^ 100.00 37% 37.00 63.00 100% 63.00
10% 6.30 56.70 43.3%
KOR IM* 100.00 24% 24.20 75.80 111% 84.14
42% 25.91 49.89 50.1%
LUX PI 100.00 29% 28.80 71.20 50% 35.60
39% 13.87 57.33 42.7%
MEX IM 100.00 30% 30.00 70.00 143% 100.00
30%
70.00 30.0%
NLD PR 100.00 25% 25.00 75.00 100% 100.00
30% 30.00 45.00 55.0%
NZL IM 100.00 28% 28.00 72.00 139% 100.00
33% 5.00 67.00 33.0%
NOR RRA 100.00 28% 28.00 72.00 100% 44.50
28% 12.46 59.54 40.5%
POL FW 100.00 19% 19.00 81.00 100% 81.00 19% 15.39
65.61 34.4%
PRT FW 100.00 32% 31.50 68.50 100% 68.50 25% 17.13
51.38 48.6%
SVK NT 100.00 19% 19.00 81.00
81.00 19.0%
SVN CL 100.00 18% 18.00 82.00 100% 82.00
20% 16.40 65.60 34.4%
ESP CL 100.00 30% 30.00 70.00 100% 70.00
27% 18.90 51.10 48.9%
SWE CL 100.00 26% 26.30 73.70 100% 73.70
30% 22.11 51.59 48.4%
CHE CL 100.00 21% 21.17 78.83 100% 78.83
40% 31.51 47.32 52.7%
TUR PI 100.00 20% 20.00 80.00 50% 40.00
35% 14.00 66.00 34.0%
GBR IM^ 100.00 24% 24.00 76.00 111% 84.44
43% 27.44 48.56 51.4%
USA CL^ 100.00 39% 39.10 60.90 100% 60.90
21% 12.97 47.93 52.1%
27 Table 4 provides the full calculation of the combined statutory tax rates that are summarised in Figure 1 and Table 1. The underlying assumptions are set out in the first section of the paper and the
footnotes for Table 1. For AUS, CAN, CHL, KOR, MEX, NZL and GBR imputation or dividend tax credits have been applied to tax payable at the shareholder level.

22
3. Interest Income
This section summarises the tax treatment of interest income on deposits in retail banking
institutions across the OECD and provides tax rates on interest income in each OECD country.
Overview of interest taxation and statutory rates
Statutory tax rates on interest income from retail deposit institutions in the OECD range
from 50% in the United Kingdom to 0% in Estonia, with an OECD simple average of 27.0% as
shown in Figure 7. Table 5 summarises the calculation of these figures (which is set out in full
at Table 8), noting the different types of treatment applied in each country. A schematic of the
calculation is shown at Figure 8.
Figure 7: Statutory tax rates on interest as at 1 July 201228
Table 5: Tax payable on interest at the individual level as at 1 July 201229
Country Treatment Taxable
income to individual
Personal tax payable Post-tax individual
income
Statutory rate
Final withholding
Personal
Australia FI 100.00
46.50 53.50 47%
Austria FW 100.00 25.00
75.00 25%
Belgium30
FW 100.00 25.00
75.00 25%
Canada FI 100.00
47.97 52.03 48%
Chile PI^ 100.00
40.00 60.00 40%
Czech Republic FW 100.00 15.00
85.00 15%
Denmark FI 100.00
45.50 54.50 46%
Estonia NT
100.00
Finland FW 100.00 30.00
70.00 30%
France FW 100.00 44.00
56.00 44%
28 Figure 7 shows the combined statutory tax rates calculated in Tables 5 and 8. The underlying assumptions
are set out in the footnotes to Table 5. 29 Table 5 shows worked calculations of the tax rates shown in Figure 7. Fuller details of the calculation are
set out in Table 8. The assumed rate of return is 4%. 30 In 2012, a preliminary tax rate of 21% applied in Belgium. This became final at assessment under the PIT
return if the level of qualifying savings income was less than EUR 20 020. Income over this amount was
subject to a surtax of 4%. Investors could opt to pay the extra 4% at source, in which case no threshold verification was made. These two rates have been summed to arrive at 25%.
0%
10%
20%
30%
40%
50%
60%
GB
R
CA
N
AU
S
DN
K
FR
A
US
A
CH
L
CH
E
NZ
L
FIN IRL
ME
X
NLD
SW
E
NO
R
OE
CD
ES
P
DE
U
AU
T
BE
L
ISR
PR
T
ISL
ITA
JPN
SV
N
PO
L
SV
K
HU
N
KO
R
CZ
E
TU
R
GR
C
LUX
ES
T
Estimated statutory tax rate

23
Country Treatment Taxable
income to individual
Personal tax payable Post-tax individual
income
Statutory rate
Final withholding
Personal
Germany31
FW 100.00 26.00
74.00 26%
Greece FW 100.00 10.00
90.00 10%
Hungary FW 100.00 16.00
84.00 16%
Iceland FI 100.00
20.00 80.00 20%
Ireland FW 100.00 30.00
70.00 30%
Israel32
FW^ 100.00 25.00
75.00 25%
Italy FW 100.00 20.00
80.00 20%
Japan FW 100.00 20.00
80.00 20%
Korea FW 100.00 15.40
84.60 15%
Luxembourg FW 100.00 10.00
90.00 10%
Mexico PI^ 100.00
30.00 70.00 30%
Netherlands PR 100.00
30.00 70.00 30%
New Zealand FI 100.00
33.00 67.00 33%
Norway FI 100.00
28.00 72.00 28%
Poland FW 100.00 19.00
81.00 19%
Portugal FW 100.00 25.00
75.00 25%
Slovak Republic FW 100.00 19.00
81.00 19%
Slovenia FW 100.00 20.00
80.00 20%
Spain FI 100.00
27.00 73.00 27%
Sweden FI 100.00
30.00 70.00 30%
Switzerland FI 100.00
39.97 60.03 40%
Turkey FW 100.00 15.00
85.00 15%
United Kingdom33
FI 100.00
50.00 50.00 50%
United States34
FI 100.00
41.85 58.15 42%
Taxable individual income
With the exception of the Netherlands and Estonia, all OECD countries assess the amount
of taxable interest income based on the amount of interest income received: with all or part of
the received interest income being taxable. In the Netherlands, tax on interest income from retail
bank deposits is paid on the presumed capital return, as described above. Estonia does not tax
interest income from these sources, although interest income from other sources may be taxable.
Full inclusion
All OECD countries except Chile, Estonia, Israel and Mexico tax the full amount of
nominal interest income received. On Figure 8, this is shown as A. Several of these countries
provide an exemption for a fixed amount of interest income and the Dutch presumptive tax on
capital income also contains a basic allowance. These systems are seen as full inclusion systems
because the exemption does not impact the tax rate applied to marginal interest income after the
de minimus threshold is exceeded.
31 The withholding rate applied for Germany includes the 25% withholding rate and the 1% solidarity
surcharge. 32 Israel indexes interest income for inflation so that the nominal rather than real return is taxed. This
reduces the effective tax rate on nominal interest income. Israel estimates that given recent inflation rates
and rates of return in Israel, a 25% rate on real income would equate to around a 14-15% rate on nominal income.
33 Tax rates on dividends and interest in the United Kingdom were reduced by 5% from 1 April 2013. 34 Tax rates in the United States were changed as of 1 January 2013 under the American Taxpayer Relief
Act of 2012. For a description of these changes, see OMB (2013) at p 175.

24
Partial inclusion and indexation
No OECD countries provide an exemption for a percentage of interest income. If used, this
approach would tax only a part of the income received, so that individual taxable income on
Figure 8 would be XA.
However, Chile, Mexico and Israel index interest income for inflation. Indexation exempts
the inflationary component of interest income from taxation, lowering the final tax rate on
nominal income in the presence of inflation. Indexation can be accomplished by either adjusting
the amount of the initial deposit and calculating the interest that would be payable on the
adjusted deposit or by adjusting the rate of return, as summarised in Table 6.
Table 6: Indexation of interest income for inflation
Adjustment of initial deposit Taxable interest = nominal interest rate * initial investment / (1+ inflation rate)
Adjustment of rate of return Real interest rate = nominal interest rate – inflation rate Real interest income = (nominal interest rate – inflation rate) * initial
investment
In Figure 8, inflation indexing is denoted by A’. The tax rate on nominal interest income is
the tax payable on the real component, divided by the nominal income received by the
individual: SA’/A.
Presumptive return on shareholder equity
In the Netherlands, the amount of taxable interest income is based on a presumptive return
on the amount of the deposit, calculated in the same way as for dividend income. Tax paid on
interest income is based on the amount of the initial investment, O, the presumptive rate of
return, P, and the individual’s tax rate, S; and the tax rate for interest income is the tax payable
on the deemed return divided by the amount of income received: SPO/A. Tax paid is therefore
not linked to the amount of interest income received but on the value of the deposit, and is akin
to a tax on wealth. When measured against income, the tax rate is positively correlated to
changes in the individual’s tax rate, S, and the presumed rate of return, P, and negatively
correlated to any changes to the amount of the interest income, A, relative to the investment, O.
No taxation at the individual level
In Estonia, although interest is normally included as taxable income and subject to a
withholding tax rate, interest from financial institutions in the European Union is exempt.
In Mexico, interest income from bank accounts and government bonds is taxed. However,
there is an exemption for interest paid to individuals from financial institutions on checking
accounts for the deposit of wages, pensions and savings provided that the account average
balance does not exceed five times the amount of the annual general minimum salary in the
Federal District (MXN 113 752 in 2012).
In many OECD countries a fixed amount of savings income is not taxable. For example in
Belgium, the bulk of interest bearing savings are tax exempted: in 2012 the first 1 830 euro of
interest stemming from ordinary savings were earned tax free; since interest rates were
particularly low, this corresponded to tax exempted balances of approximately 100 000 euro per
individual. The figures for Belgium, and all other countries, consider the tax treatment of a unit
of savings after the fixed threshold has been exceeded.

25
Tax payable by the individual
At the individual level, interest income may be taxed under personal income taxes through
assessment at the individual level or through the use of final withholding rates.
Assessment at the individual level
Interest income may be assessed for taxation at the individual level and tax paid on that
income according to the individual’s marginal rate or a specific rate on capital income. In
Australia, Canada, Denmark, Norway, the United Kingdom and the United States, interest
income is taxed only in the hands of the individual. The tax paid is the individual’s tax rate
multiplied by the taxable income, SA. Where taxable income is the full amount of interest
received, the statutory tax rate will be equivalent to the individual’s tax rate, S.
Preliminary withholding taxes may be used prior to assessment at the individual level.
These are merely mechanical and do not impact the overall level of tax paid as the total amount
of tax payable is still based on the individual’s applicable rate.35
Preliminary withholding taxes
are used in Iceland. New Zealand, Spain, Sweden, Switzerland, and the United Kingdom at the
rates set out in Table 7 below. In addition to these countries, Mexico applies a 0.6% preliminary
withholding tax based on the value of the investment balance, which is creditable against the
taxpayer’s tax liability on the real interest income from this balance. This rate can be final for
individuals with interest income of less than MXN 100 000 if their total income is less than
MXN 400 000.
Table 7: Preliminary withholding tax rates on interest income
as at 1 July 2012
Iceland 20%
New Zealand 33%
Spain 21%
Sweden 30%
Switzerland 35%
United Kingdom36
20%
Under a preliminary withholding system, provided the individual’s tax rate is higher than
the withholding rate, the tax paid at the individual level is the tax payable for the individual at
their applicable rate S (assuming that the full amount of interest income is taxable). For lower-
rate marginal taxpayers in some countries, W may be higher than S. In these cases, the final tax
rate will depend on the particular tax system. If the tax system allows the excess withholding tax
to be refunded, or applied against other income, the final tax rate will continue to be the
individual’s tax rate. If the difference is not refunded, the tax rate will be the withholding rate
for these taxpayers. For the taxpayers who pay a marginal rate of personal tax at a higher rate
than W, their personal rate, S, will apply.
35 Systems where the individual can elect to have their income assessed (e.g. Portugal) but where this is not
required, are included as final withholding countries. 36 This rate is the Basic Rate of Tax (BRT) which may be deducted under the Tax Deduction Scheme for
Interest (TDSI) in the United Kingdom. TDSI requires deposit takers and building societies to deduct
BRT from interest payments on deposits held by resident individuals. It does not apply to a range of other
savings vehicles such as government or corporate bonds. Investors who are unlikely to be liable to pay
income tax for the tax year in which interest is paid may register their accounts so that interest may be paid without BRT deducted.

26
In some countries, the preliminary withholding system may be a hybrid where assessment
at the individual level is not required unless the amount of interest income reaches a particular
threshold. For example, in New Zealand, preliminary withholding taxes are final unless tax paid
on interest exceeds a particular level. New Zealand also approximates a progressive tax system
by requiring individuals to notify financial institutions of the applicable marginal withholding
rate to apply to their interest income.
Final withholding rates
Austria,37
Belgium,38
the Czech Republic, Finland, France, Germany, Greece, Hungary,39
Ireland, Israel, Italy, Korea,40
Japan, Korea, Luxembourg, Poland, Portugal, the Slovak
Republic, Slovenia and Turkey tax interest income via a final withholding system. Individual
level taxes, W, are withheld by the institution and no further tax is payable or assessment
required at the individual level.
37 In Austria, an individual may opt for taxation within the personal income tax system, in which case their
dividend, interest, or capital gains income muse be declared. In practice, as the lowest marginal personal
tax rate is 36.5% and the final withholding tax rate is 25%, this is very rare. 38 In 2012, a preliminary tax rate of 21% applied. This became final at assessment under the PIT return if
the level of qualifying savings income was less than EUR 20 020. Income over this amount was subject to
a surtax of 4%. Investors could opt to pay the extra 4% at source, in which case no threshold verification was made. These two rates have been summed to arrive at 25%.
39 Hungary applies a reduced rate to interest on investments held for more than 3 years (10%, rather than
16%) and no interest rate to interest on deposits held for more than 5 years. This is not shown in the
calculations. 40 In Korea, income over 40 million KRW (approximately 27 000 EUR) derived from dividends and interest
is taxed as global income at 38.5%. Income less than this amount is taxed at a final withholding tax of
15.4% (including local taxes). However, very few people earn interest over this level. Therefore, Korea is classified as a final withholding system.

27
Figure 8: Schematic diagram of the tax treatment of interest income in OECD countries as at 1 July 201241
41 Figure 8 provides a diagrammatic and algebraic representation of the calculations made in Table 8. See Annex A for an explanation of the diagram.
Value of investment
O
Investment income
A
Taxable individual incomeA*, P, X
Withholding tax payable
W
Individual tax payable
S
Post-tax individual income Overall tax rate
Not taxedEST
Full inclusionAUS CAN DNK ISL NZL NOR ESP SWE CHE GBR USA
Inflation adjustmentCHL MEX
Final withholdingAUT BEL CZE FIN FRA DEU GRC HUN IRL ITA JPN KOR LUX POL PRT SVK SVN TUR
Final withholding (inflation adjustment)ISR
Partial inclusion
Presumptive capital returnNLD
A’ SA’ SA’/AA-SA’
A
SA
WA
XA SXA
O(A) SPO A-SPO
SX
W
SPO/A
A(1-S)
A(1-SX)
A(1-W)A
PO
S
WA’ WA’/WA- WA’

28
Table 8: Calculation of tax payable on interest income at the individual level as at 1 July 201242
Country Treatment Pre-tax income
Taxable individual
income
Final with-holding tax rate
Final withholding tax
payable
Top personal tax rate
Personal tax payable (at top
rate)
Post-tax individual
income
Combined tax rate
AUS FI 100.00 100%
47% 46.50 53.50 47%
AUT FW 100.00 100% 25% 25.00
75.00 25%
BEL FW 100.00 100% 25% 25.00
75.00 25%
CAN FI 100.00 100%
48% 47.97 52.03 48%
CHL PI^ 100.00 100%
40% 40.00 60.00 40%
CZE FW 100.00 100% 15% 15.00
85.00 15%
DNK FI 100.00 100%
46% 45.50 54.50 46%
EST NT 100.00
100.00
FIN FW 100.00 100% 30% 30.00
70.00 30%
FRA FW 100.00 100% 44% 44.00
56.00 44%
DEU FW 100.00 100% 26% 26.00
74.00 26%
GRC FW 100.00 100% 10% 10.00
90.00 10%
HUN FW 100.00 100% 16% 16.00
84.00 16%
ISL FI 100.00 100%
20% 20.00 80.00 20%
IRL FW 100.00 100% 30% 30.00
70.00 30%
ISR FW^ 100.00 100% 25% 25.00
75.00 25%
ITA FW 100.00 100% 20% 20.00
80.00 20%
JPN FW 100.00 100% 20% 20.00
80.00 20%
KOR FW 100.00 100% 15% 15.40
84.60 15%
LUX FW 100.00 100% 10% 10.00
90.00 10%
MEX PI^ 100.00 100%
30% 30.00 70.00 30%
NLD PR 100.00 4%
30% 30.00 70.00 30%
NZL FI 100.00 100%
33% 33.00 67.00 33%
NOR FI 100.00 100%
28% 28.00 72.00 28%
POL FW 100.00 100% 19% 19.00
81.00 19%
PRT FW 100.00 100% 25% 25.00
75.00 25%
SVK FW 100.00 100% 19% 19.00
81.00 19%
SVN FW 100.00 100% 20% 20.00
80.00 20%
ESP FI 100.00 100%
27% 27.00 73.00 27%
SWE FI 100.00 100%
30% 30.00 70.00 30%
CHE FI 100.00 100%
40% 39.97 60.03 40%
TUR FW 100.00 100% 15% 15.00
85.00 15%
GBR FI 100.00 100%
50% 50.00 50.00 50%
USA FI 100.00 100%
42% 41.85 58.15 42%
42 Table 8 provides the full calculation of the combined statutory tax rates that are summarised in Figure 7 and Table 5. The underlying assumptions are set out in the first section of the paper and the
footnotes for Table 5.

29
4. Capital Gain Income
This section considers the tax treatment of nominal capital gains made on shares and on
nominal gains made on the sale of real property that has been rented to tenants that were
realised after the expiry of any applicable holding period test. The tax rates used are the highest
marginal rate payable by an individual on their capital gains income. The statutory tax rates can
therefore be considered as the maximum rates applicable to nominal gains on long-held assets.
The impact of the holding period on the tax rate paid is not considered.
Capital gains on shares are assumed to have resulted entirely from the reinvestment of
post-tax corporate profits such that the market value of shares is increased by the amount of the
retention. The statutory tax rates on capital gains on shares are therefore a function of the
corporate and personal tax systems that apply as well as of the interaction between these tax
systems. Capital gains on property are taxed only at the individual level.
Overview of capital gains taxation and combined rates
Including both the corporate and individual levels of taxation, combined statutory rates on
gains on long-held shares in the OECD range from 8% in Belgium (where gains are taxed only
at the corporate level and the allowance for corporate equity applies) to 60% in France. Across
the OECD, the simple average combined rate on gains on shares is 36.8% as shown in Figure
9.43
Table 9 summarises the calculation of these figures (which is set out in full at Table 14),
noting the different types of treatment applied in each country. A schematic of the calculation is
shown at Figure 12.
Figure 9: Combined statutory tax rates on capital gains on shares as at 1 July 201244
43 This average uses the combined tax rate for dividends from new equity in Italy, rather than from existing
equity. If the combined tax rate on existing equity were used instead, the simple average combined tax
rate across the OECD would be 37.3%.
44 Figure 9 shows the combined statutory tax rates calculated in Tables 9 and 14. ITAex shows the
combined tax rate on existing equity; ITAnew shows the combined tax rate on new equity. The underlying assumptions are set out in the footnotes to Table 9.
0%
10%
20%
30%
40%
50%
60%
FR
A
DN
K
NLD IR
L
US
A
ES
P
FIN
PR
T
DE
U
SW
E
AU
S
GB
R
CA
N
AU
T
JPN
ITA
ex
NO
R
ISR
ES
T
OE
CD
ISL
PO
L
SV
K
ME
X
LUX
NZ
L
ITA
new
KO
R
SV
N
CH
E
CH
L
GR
C
TU
R
CZ
E
HU
N
BE
L
Estimated combined statutory tax rate

30
Table 9: Tax payable on capital gains on shares at the corporate and individual level as at 1 July 201245
Country Treatment Corporate
tax payable
Taxable income to
shareholder
Personal tax payable Post-tax shareholder
income
Statutory rate
Final withholding
Shareholder
Australia PI* 30.00 35.00
16.28 53.73 46%
Austria FW 25.00 75.00 18.75
56.25 44%
Belgium ACE 8.50 91.50
91.50 8%
Canada PI 26.14 36.93
17.72 56.14 44%
Chile NT* 20.00 80.00
80.00 20%
Czech Republic NT* 19.00
81.00 19%
Denmark CL 25.00 75.00
31.50 43.50 57%
Estonia CL 21.00 79.00
16.59 62.41 38%
Finland46
CL* 24.50 75.50
24.16 51.34 49%
France ST 34.43 65.57
25.57 40.00 60%
Germany47
FW 30.18 69.83 18.42
51.41 49%
Greece NT 20.00
80.00 20%
Hungary NT* 19.00
81.00 19%
Iceland CL 20.00 80.00
16.00 64.00 36%
Ireland ST 12.50 87.50
42.00 45.50 55%
Israel PI^ 25.00 75.00
15.00 60.00 40%
Italy (new equity)48
ACE 6.88 93.13
18.63 74.50 26%
Italy (old equity) ST 27.50 72.50 14.50 58.00 42%
Japan ST 37.00 63.00
6.30 56.70 43%
Korea NT 24.20
75.80 24%
Luxembourg NT* 28.80
71.20 29%
Mexico NT 30.00
70.00 30%
Netherlands PR 25.00 100.00
30.00 45.00 55%
New Zealand NT 28.00
72.00 28%
Norway RRA 28.00 44.50
12.46 59.54 40%
Poland ST 19.00 81.00
15.39 65.61 34%
Portugal49
FW 31.50 68.50 17.13
51.38 49%
Slovak Republic CL 19.00 81.00
15.39 65.61 34%
Slovenia ST 18.00 82.00
4.10 77.90 22%
Spain CL 30.00 70.00
18.90 51.10 49%
Sweden CL 26.30 73.70
22.11 51.59 48%
Switzerland NT 21.17
78.83 21%
Turkey NT* 20.00
80.00 20%
United Kingdom ST 24.00 76.00
21.28 54.72 45%
United States50
ST* 39.10 60.90
12.97 47.93 52%
45 Table 9 shows worked calculations of the tax rates shown in Figure 9. Fuller details of the calculation are
set out in Table 14. The assumed rate of return is 4%. The impact of other rates of return on the calculations for Belgium, new equity in Italy, the Netherlands and Norway are shown in Figures 5 and 6.
46 In Finland, the shareholder tax rate is 32% for incomes exceeding EUR 50 000 and 30% for incomes
under this amount. 47 The withholding rate applied for Germany includes the 25% withholding rate and the 1% solidarity
surcharge. 48 For new equity, Italy applies an allowance for corporate equity at the corporate level and separate taxation
at the personal level. 49 The taxpayer can opt to have tax aid at the personal level in which case the tax withheld is not treated as
final. 50 The analysis assumes that the Alternative Minimum Tax does not apply. Tax rates in the United States
were changed as of 1 January 2013 under the American Taxpayer Relief Act of 2012. For a description of these changes, see OMB (2013) at p 175.

31
Statutory tax rates on capital gains from long-held property arise only from personal
taxation, although many OECD countries do not tax these gains at all. The tax rates therefore
range from 0% in many countries to 45.5% in Denmark, with a simple average combined rate of
14.4% as shown in Figure 10. Table 10 summarises the calculation of these figures (which is set
out in full at Table 15), noting the different types of treatment applied in each country. A
schematic of the calculation is shown at Figure 13.
Figure 10: Combined statutory tax rates on real property as at 1 July 201251
Table 10: Tax payable on capital gains on property at the individual level as at 1 July 201252
Treatment Taxable income to individual
Personal tax payable
Post-tax individual
income
Statutory rate
Australia PI* 100.00 23.25 76.75 23%
Austria ST* 100.00 12.50 87.50 13%
Belgium NT* 100.00
100.00
Canada PI 100.00 23.99 76.02 24%
Chile NT* 100.00
100.00
Czech Republic NT* 100.00
100.00
Denmark FI 100.00 45.50 54.50 46%
Estonia FI 100.00 21.00 79.00 21%
Finland53
FI* 100.00 32.00 68.00 32%
France NT* 100.00
100.00
Germany NT* 100.00
100.00
Greece NT 100.00
100.00
Hungary NT* 100.00
100.00
Iceland FI 100.00 20.00 80.00 20%
Ireland ST 100.00 30.00 70.00 30%
Israel54
PI^ 100.00 25.00 75.00 25%
51 Figure 10 shows the combined statutory tax rates calculated in Tables 10 and 15. The underlying
assumptions are set out in the footnotes to Table 10. The tax rate on gains on real property in the United
States varies under a number of assumptions and the United States are therefore not shown in this figure. See Box 2 for a description of the tax system and an estimated rate for a particular set of assumptions.
52 Table 10 shows worked calculations of the tax rates shown in Figure 10. Fuller details of the calculation are set out in Table 15. The assumed rate of return is 4%.
53 In Finland, the shareholder tax rate is 32% for incomes exceeding EUR 50 000 and 30% for incomes under this amount.
0%
10%
20%
30%
40%
50%
60%
DN
K
FIN IRL
ME
X
NLD
SW
E
KO
R
NO
R
GB
R
ES
P
ISR
PR
T
CA
N
AU
S
ES
T
ISL
JPN
OE
CD
AU
T
LUX
BE
L
CH
L
CZ
E
FR
A
DE
U
GR
C
HU
N
ITA
NZ
L
PO
L
SV
K
SV
N
CH
E
TU
R
Estimated statutory tax rate

32
Treatment Taxable income to individual
Personal tax payable
Post-tax individual
income
Statutory rate
Italy NT* 100.00
100.00
Japan ST* 100.00 20.00 80.00 20%
Korea PI* 100.00 29.26 70.74 29%
Luxembourg FI* 100.00 10.00 90.00 10%
Mexico PI^ 100.00 30.00 70.00 30%
Netherlands PR 100.00 30.00 70.00 30%
New Zealand NT 100.00
100.00
Norway FI 100.00 28.00 72.00 28%
Poland NT* 100.00
100.00
Portugal PI^ 100.00 24.50 75.50 25%
Slovak Republic NT* 100.00
100.00
Slovenia NT* 100.00
100.00
Spain PI^ 100.00 27.00 73.00 27%
Sweden PI 100.00 30.00 70.00 30%
Switzerland NT 100.00
100.00
Turkey NT* 100.00
100.00
United Kingdom ST 100.00 28.00 72.00 28%
United States55
ST* 100.00 * * *
Corporate level treatment of gains on shares
As with dividend income, capital gain income on shares that is derived from reinvested
corporate profits is taxed first as corporate income and then again at the individual level when
realised. The tax paid at the corporate level will reduce the amount of the gain to the shareholder
relative to the pre-tax gain. Given this, in Figure 12, pre-tax corporate profit is designated as A
and is a function of corporate equity, E. After corporate income taxes, post-tax corporate profits
are shown as A(1-C), except for Belgium and Italy, the allowance for corporate equity means
post-tax corporate profits are A-C(A-ZE).
Individual level treatment
Calculation of taxable capital gains
All OECD countries that tax capital gains do so on realisation. Taxation is triggered by the
sale of the relevant asset or by prescribed circumstances such as when an asset is gifted or
bequeathed to another owner or when the majority of shares in a company are purchased. With
the exception of the United States (see Box 2), the amount of the capital gain is the difference in
value between the date of acquisition and the date of realisation. Adjustments may be made for
acquisition and interest costs or depreciation. The nominal capital gain is represented as A in
Figures 12 and 13.
With five exceptions, OECD countries tax the nominal amount of the capital gain.56
In the
Netherlands, the presumptive return is deemed to include capital gains on the asset and gains are
54 Israel indexes interest income for inflation so that the nominal rather than real return is taxed. This will
reduce the effective tax rate on nominal interest income. Israel estimates that given recent inflation rates
and rates of return in Israel, a 25% rate on real income would equate to around a 14-15% rate on nominal income.
55 The tax rate on gains on real property in the United States varies under a number of assumptions. See Box 2 for a description of the tax system and an estimated rate for a particular set of assumptions.

33
not taxed further on realisation. Chile, Israel, Mexico and Portugal tax the real rather than the
nominal amount of certain capital gains by adjusting the amount of the acquisition price for
inflation over the holding period.
No taxation of capital gains
At the individual level, Greece, New Zealand and Switzerland do not tax capital gains on
shares and real property on either shares or real property except in particular circumstances such
as where the asset was bought for the purposes of resale. In addition, Belgium, Korea, and
Mexico57
do not tax gains realised on shares at the individual level.
Holding period tests prior to sale
Several OECD countries apply a holding period test which reduces or eliminates taxation
of capital gains on an asset that has been held for longer than a certain period. The length and
nature of these tests differ considerably between countries. Some holding period tests provide a
single point in time, while others apply progressively.58
Table 11 shows the longest holding
period test in each country.
Table 11: Length of holding period tests (years) as at 1 July 2012
Shares Real property
Australia 1 Australia 1
Chile 1 Austria 35
Czech Republic 0.5 Belgium 5
Finland 10 Chile 1
Hungary 5 Czech Republic 5
Luxembourg 0.5 Finland 10
Slovenia 20 France 30
Turkey 1 Germany 10
United States 1 Hungary 15
Italy 5
Japan 5
Korea 10
Luxembourg 2
Poland 5
Slovakia 5
Slovenia 20
Turkey 5
United States 1
The most common impact of a holding period test is that capital gains on assets held for
longer than the fixed period are exempt from taxation. Other OECD countries apply a more
favourable tax treatment on gains on assets that are realised after the expiry of the applicable
56 In some OECD countries an allowance may be made against the nominal amount of the gain for
maintenance or improvement costs. For example, Denmark provides an allowance for maintenance and improvement costs of DKK 10 000 per year of ownership.
57 In Mexico the exemption is not applicable when: ownership exceeds 10% of the corporation’s capital and
over 10% has been sold in a 24 month period; a controlling shareholding is sold in a 24 month period; or
the sale of shares did not take place in a recognised stock market. 58 For example, in France, gains on shares held for less than 5 years are fully taxed; from 6 years to 18
years, the tax base is reduced by an additional 2% per year; from 18 to 24 years, it is reduced by an
additional 4%, and from 24 to 30 years, at 8% per year until completely exempt after a holding period of 30 years.

34
holding period, removing penalty rates that applied prior to this or applying a reduced rate. In
other countries, the type of tax treatment will change to a more favourable form after the
prescribed holding period has expired. Examples include:
Partial inclusion of gains from long-held assets: In Australia, gains on assets held for
at least a year qualify for a partial exemption from taxation. Gains on assets held for
less than a year are fully taxable at marginal rates. Similarly, Austria progressively
reduces the amount of the gain on property that is taxable after a period of 10 years, up
to a maximum of 50%.
Finland applies a minimum deduction of 20% of the sales price; but if the property has
been held for at least ten years, the minimum deduction is 40%.
Portugal indexes gains made on assets held for more than 2 years for inflation and
Spain indexes the acquisition price of immovable properties held for more than one
year prior to sale for inflation.
Application of different tax rate structure: In the United States, gains on assets held for
less than one year are taxed as part of global income at the applicable marginal tax
rates, whereas after this period a lower separate capital gains tax rate applies. Chile
taxes gains on shares held for less than a year under the First Category Tax and either
Complementary Global tax or Additional Tax; after this are taxed under a flat tax at
the rate of the First Category Tax (20%).
Table 12: Summary of nature and impact of holding period tests
Many OECD countries do not vary the tax treatment of capital gains based on the length of
time for which the asset was held prior to sale, including Canada, Denmark, Estonia, Iceland,
Ireland, Israel, Mexico, Norway, Spain, Sweden and the United Kingdom. In addition, France,
Germany, Italy, Japan, Poland, Portugal, the Slovak Republic and Slovenia do not apply holding
tests for gains on shares.
59 In Belgium, gains made by individuals on assets held other than for business purposes are taxable only in
the case of real property sold within either 5 or 8 years (with the length of time depending on whether the
property has buildings).
60 Capital gains on the transfer or sale of shares of Chilean corporations that are regularly traded on the
stock market and were acquired through the stock market are exempt from taxation, provided the shares
have been held for more than one year. Given the assumptions underlying this paper, Chile has been
classified as non-taxation, after a holding period. However, in other circumstances, capital gains on shares are taxable under the First Category Tax at 20%.
Change in tax treatment after longest holding period
Reduced rate Exempt Change in system
Type of holding
period test
Single-point test
Finland Japan (property) Luxembourg (property)
Belgium (property)59
Chile
60
Czech Republic Italy (property) Luxembourg (shares) Poland (property) Slovak Republic (shares) Turkey
Australia Austria (property) Portugal (property) United States
Progressive change
Korea (property) France (property) Hungary Slovenia

35
Inclusion of capital gains as taxable income to the individual
Full inclusion
Where capital gains are taxed, most OECD countries treat the full amount of the nominal
gain as taxable to the individual. A few countries, including Ireland, Luxembourg, the Slovak
Republic, and the United Kingdom, allow an exemption up to a fixed amount, which does not
impact the marginal tax rate on gains exceeding this amount. For capital gains on shares, the
taxable gain to the shareholder is therefore A(1-C). For capital gains made on property, the full
amount of the gain, A, is treated as taxable.
Partial inclusion
Several OECD countries include only part of the capital gain as taxable to the individual.
Australia and Canada treat 50% of the received capital gain on both shares and real property as
taxable and tax this proportion at regular income rates. Sweden provides a 26.7% exemption for
real property gains on residential property held by individuals. Portugal includes 50% of gains
on real property as taxable income and further allows indexation if the gain is derived from a
property that has been held for two years or more.61
Partial inclusion of a gain as taxable to the
individual is denoted as XA(1-C) on Figure 12 for gains on shares and as XA on Figure 13 for
gains on property.
For shares, the combined tax rate on the capital gain is the corporate tax rate applied at the
corporate level less the tax paid at the individual level: C+SX(1-C). The combined tax rate will
reduce individual level tax by the excluded proportion. For gains on property, tax paid will
reduce by an amount equal to the applicable tax rate multiplied by the proportion of gain
excluded from taxation, 1-X. The resulting combined tax rate on the capital gain is the
individual’s tax rate multiplied by the proportion of the gain that is taxable to the individual, SX.
Partial inclusion is often intended to partly offset the impact of inflation. Several OECD
countries explicitly adjust for inflation by adjusting the acquisition price of the asset for
inflation. Chile, Israel, Mexico, Portugal and Spain adjust taxable income to the individual to
allow for inflation:
Portugal, Chile and Spain adjust the acquisition price of the asset for inflation. Chile
uses the change in the consumer price index between acquisition and transfer to adjust
the acquisition price.62
Portugal uses an indexation factor based on the year of
purchase that is published each year, to adjust the value of real property held for over
two years prior to sale. In Spain, the acquisition price of immoveable property is
adjusted for inflation using a statutorily set indexation factor based on the year of
purchase.
Israel calculates the capital gain on shares and real property by dividing real from the
nominal gain. The nominal gain is calculated by adjusting the acquisition price of the
asset using the Israeli Consumer Price Index. Only the real proportion of the gain is
taxed.
Mexico provides an inflation adjustment by deducting the cost of land from the
acquisition price. The remaining cost of the buildings (or 80%, if this cannot be
61 Portugal also applies a 50% exemption for capital gains on shares in micro or small companies. 62 However, in Chile, the sale of immoveable property and shares acquired on the stock exchange are
exempt once the one-year holding period has expired.

36
determined) is reduced by 3% for each year the property was held, up to a maximum
of 20%. Both the land and the adjusted building costs, together with improvements
and enlargements, notarial expenses and losses from sale of properties, are adjusted by
an inflation factor accounting for the number of months the property was held. This is
subtracted from the sale price to estimate taxable gains. The fiscal gain calculated is
then divided by the number of years for which the property was held (up to a
maximum of 20). This result is added to the taxpayer´s other income in the current
fiscal year and the income tax is calculated63
The remainder of the gain is multiplied
by either the average taxpayer’s tax rate or the average rate of the last five tax years.
Although in Mexico shares are exempt from taxation under certain circumstances,
shares that are not exempt are adjusted for inflation by reducing the gains by the
average value of the shares held by the taxpayer in the company, rather than their
acquisition price.
Table 13: Summary of calculation of inflation-adjusted acquisition cost in OECD countries64
Shares Property
Chile Acquisition cost * CPI adjustment Acquisition cost * CPI adjustment
Israel Acquisition cost * CPI adjustment Acquisition cost * CPI adjustment
Mexico Average cost of shares adjusted for inflation
[(Cost of buildings * [1 – Years held * 3%]) + Cost of land] * Inflation factor
Portugal Not adjusted Acquisition cost * Indexation factor
Spain Not adjusted Acquisition cost * indexation factor from annual Budget Law
The adjusted amount of the capital gain is denoted as A’(1-C) in relation to capital gains on
shares in Figure 12 and as A* in relation to capital gains on property in Figure 13, regardless of
how the adjustment takes place. The (nominal) tax rate on capital gains under this approach is
therefore the tax payable on the real component of the gain, divided by the nominal income
received by the individual: SA’ (1-C)/A for shares and SA’/A for real property).
The shielding treatment applied against dividend income in Norway also applies to capital
gains on shares. Under this treatment, the taxable income base to the individual is post-tax
corporate profits, less an allowance for the normal rate of return and can be expressed as A(1-
C)-RO. If A(1-C) is greater than RO no further tax is payable at the corporate level and the
combined tax rate will be the corporate tax rate, C. If not, the tax paid will be corporate tax and
individual level tax CA+SA(1-C)-SRO; and the combined tax rate relative to A is C+S(1-C)-
SRO/A.
Another option for taxation at the individual level that is not currently used in OECD
countries is to attach imputation credits to capital gains on shares for tax paid at the corporate
level. Administration and compliance can be very difficult under this system due to the need to
monitor tax paid on retained earnings and to identify the proportion of capital gains resulting
from retained earnings. The mismatch between the accrual of the gains and the realisation of the
gains also contributes to this complexity.
63 In Mexico an exemption applies to the sale of the taxpayer’s residence if the amount of the compensation
obtained does not exceed an amount equivalent to around MXN 7 million. If there is any excess, the
profit and tax shall be determined. This exemption applies as long as the taxpayer has not transferred another dwelling within the five years immediate preceding such transfer.
64 Because of the exemptions provided for Chile (shares acquired on the stock exchange and real property
after a holding period test) and Mexico (shares) are not shown in the diagram as inflation adjusted systems, but rather as “NT*”.

37
Tax rates at the individual level
At the individual level, most OECD countries tax both gains on property and shares
through assessment at the individual level through personal income taxes or separate capital
gains taxes. However, Austria65
Germany and Portugal66
apply a final withholding tax to capital
gains on shares through resident intermediaries.
In countries where the gain is assessed at the individual level, Denmark, Estonia, Finland,
Iceland, Luxembourg, the Slovak Republic, Spain and Sweden tax the gain at the applicable
marginal or flat tax rate for that tax base and taxpayer. With the exception of the United States,
discussed below at Box 2, the remaining OECD countries (France, Ireland, Italy, Japan, Poland,
Slovenia and the United Kingdom) tax capital gains separately from other income received by
the individual at particular capital gain rates. For example, Ireland taxes capital gains at a fixed
rate of 30%; and in the United Kingdom, the tax on capital gains is set at either 18% or 28%
depending on the income level and source of the taxpayer receiving the gains. Other countries
may apply preferential rates to the capital gains.
Box 2. Taxation of capital gains on section 1250 property in the United States
Gains made on the sale of residential rental property owned by an individual in a personal capacity in the United States are generally taxable subject to of the U.S. Internal Revenue Code. Under this section, gains made on residential rental property must be apportioned between the gains on improvements and gains on land. The two components of the gain are treated separately for tax purposes at the federal level.
The amount of the capital gain on improvements is calculated by deducting the depreciated value of the improvements from their portion of the sale price. To calculate the tax payable on the resulting gain, the amount of the gain corresponding to the amount of depreciation deducted (or, if the total gain is lower than the depreciation claimed, the full amount of the gain) is taxed at general income tax rates, subject to a cap of 25%. This portion of the gain is taxed in this way to “recapture” depreciation that has previously been claimed against the property at marginal tax rates. The remaining portion of the gain, if any, is taxed at the capital gains tax rate (15% in 2012, 20% starting in 2013).
Since land is not depreciable, the gain is the difference between the portion of the purchase price allocated to land and the sale value of the portion relating to land. The gain on land is taxable at the federal level at the capital gains rate of 15%.
State tax is also payable on the capital gain on land and depreciated improvement value and can be deducted against federal tax at the individual’s personal rate.
Under this system, the total combined tax payable on capital gains on property will depend on a number of factors including the size of the gain, the apportionment of the original purchase price and the sales price between land and improvements, the length of time for which the property has been held, and the tax rates applicable at state and federal levels.
For this reason, no tax rate has been shown for the United States in Tables 10 and 15. A worked example of this tax treatment is shown below, under certain stylised assumptions.
65 In Austria, an individual may opt for taxation within the personal income tax system, in which case their
dividend, interest, or capital gains income muse be declared. In practice, as the lowest marginal personal tax rate is 36.5% and the final withholding tax rate is 25%, this is very rare.
66 In Portugal, taxpayers may choose to have capital gains on shares included in their taxable income and taxed at the applicable marginal rates rather than the final withholding tax.

38
Figure C: Illustrative example of capital gains treatment of real property in the United States67
Under the the example shown in Figure C, using a weighted state average rate of 6.85% (the same rate that has been used throughout the paper for the United States) and allowing state taxes to be offset against personal tax at the top marginal federal rate applicable in 2012 (35%), the total effective tax rate on the gains on this property is 21.6%.
For shares, the combined amount of tax paid is the sum of corporate tax paid and the
individual tax paid on of the proportion of post-tax profits treated as taxable income to the
individual. The combined tax rates will therefore be either C+S(1-C) or C+SX(1-C). For real
property, the tax paid is the applicable tax at the individual level (S) multiplied by the taxable
base. Where the full amount of the gain is taxable, tax paid is SA and the tax rate is S; where
only part of the gain received is taxable, the taxable base is XA: the tax paid and tax rates are
SXA and SX respectively. Where inflation adjustments are applied the tax paid and tax rates are
SA’ and SA’/A.
Mexico calculates the tax on the capital gain from shares at the shareholder level in a
different way. To calculate tax payable at the individual level, there are a number of steps: 68
a) the capital gain is divided by the number of years for which the asset was held (up
to 20);
67 This example was prepared by the OECD based on information provided by the United States Department
of the Treasury. Assumptions include a purchase price of $200 000 ($50 000 land; $150 000
improvements); a sale price of $400 000 ($140 000 land; $260 000 improvements); a holding period of 10
years, over which depreciation was claimed under a straight-line method using a 27.5 year useful life
basis; top marginal tax rates applying in 2012; and that the property was owned entirely by the individual in a personal capacity.
68 Therefore, shareholder tax payable is given by: (A’/n)*MTR+((n–1)A’/n))*ATR, where: A’ is the real
capital gain (the nominal gain with the acquisition price adjusted for inflation), n is the number of years
that the asset was held prior to sale n≤20, MTR is the applicable marginal tax rate, and ATR is the
applicable average tax rate once the proportion of the capital gain (generated by A’/n) is taken into account.

39
b) this amount is included in an individual’s taxable income to calculate the amount
of income tax due on the individual’s taxable income (including other income);
c) tax due on the individual’s income is divided by the income to arrive at an average
tax rate; and
d) this average tax rate (or an average rate for the previous five years) is applied to
the remaining proportion of the capital gain.
Therefore, in the first year of ownership, the taxpayer pays their applicable marginal rate
on the full amount of the capital gain. In subsequent years, as the average tax rate will be lower
than the applicable marginal rate in a progressive tax system, the tax rate applied to capital gains
will decrease and converge on the taxpayer’s average tax rate until the shares have been held for
twenty years.
Combined statutory tax rates and rates of return
In most OECD countries, the combined statutory tax rate on capital gains is proportional to
the amount of the income received and does not change depending on the rate of return.
However, the allowance for corporate equity used in Belgium and for new equity in Italy, the
shielding deduction in Norway, and the presumptive rate of return in the Netherlands change the
proportion of capital gains on shares that is taxable, varying the combined statutory tax rate as
the rate of return varies. The impact of these four systems on the combined statutory rate on
capital gains on shares at different rates of return is shown in Figure 11, together with the
highest proportional rate in the other OECD countries.
Figure 11: Combined statutory tax rates as at 1 July 2012 at different rates of return on investment
BEL
FRA (highest proportional rate)
NLD
NOR
CZE & HUN (lowest proportional rates, where
taxed)
ITAnew
0%
20%
40%
60%
80%
100%
2% 4% 6% 8% 10% 12% 14% 16% 18% 20% 22% 24%Rate of return
Combined statutory rate

40
Figure 12: Schematic diagram of the tax treatment of capital gains on shares in OECD countries as at 1 July 201269
69 Figure 12 provides a diagrammatic and algebraic representation of the calculations made in Table 14. See Annex A for an explanation of the diagram.
Shareholder/ corporate equity
O,E
Equity allowance or return
R,Z
Pre-tax corporate profit
A
Corporate tax payable
C
Post-tax corporate profit (retained)
Holding period testH
Taxable individual income
R,X
Withholding at entity level
W
Individual tax payable
S
Post-tax individual income
Combined tax rate
Allowance for corp. equityBEL ITAnew
No taxationGRC KOR MEX NZL CHE
No taxation (holding period) CHL CZE HUN LUX TUR
Partial inclusionAUS CAN
Inflation adjustmentISR
Classical (holding period) FIN Separate taxation (holding period) USA
ClassicalDNK EST ISL SVK ESP SWESeparate taxationFRA IRL ITAex JPN POL SVN GBR
Rate of return allowanceNOR
Final withholdingAUT DEU PRT
A(1-C) C
>H
>H
O(A)
CA
A(1-C) C
XA(1-C) SXA(1-C) C+SX(1-C)A(1-SX)(1-C)
SA(1-C) C+S(1-C)A(1-S)(1-C)
SA(1-C) C+S(1-C)A(1-S)(1-C)
A(1-C)-S[A(1-C)-RO]
A(1-C)-RO S[A(1-C)-RO](1-S)(1-C)-
SRO/A
WA(1-C) C+W(1-C)A(1-W)(1-C)
1-(A-C(A-ZE)) C(A-ZE)C(A-ZE) A-C(A-ZE)
A
E(A) ZE
RO
A(1-C) SA(1-C)’ C+SA(1-C)’/AA-SA(1-C)’
A(1-C)

41
Table 14: Calculation of tax payable on capital gains on shares at the corporate and individual levels as at 1 July 201270
Treatment
Pre-tax corporate
profit
Corporate tax rate
Corporate tax payable
Retained post-tax
profit
Longest holding
period (yrs)
Proportion included in
income
Taxable individual income
Final withholding Shareholder Post-tax shareholder
income
Combined tax rate Tax rate Tax payable Tax rate Tax payable
AUS PI* 100.00 30% 30.00 70.00 1.00 50% 35.00 47% 16.28 53.73 46.28% AUT FW 100.00 25% 25.00 75.00 100% 75.00 25% 18.75 56.25 43.75% BEL ACE 100.00 34% 8.50 91.50 100% 91.50 91.50 8.50% CAN PI 100.00 26% 26.14 73.86 50% 36.93 48% 17.72 56.14 43.86% CHL NT* 100.00 20% 20.00 80.00 1.00 100% 80.00 80.00 20.00% CZE NT* 100.00 19% 19.00 81.00 0.50 81.00 19.00% DNK CL 100.00 25% 25.00 75.00 100% 75.00 42% 31.50 43.50 56.50% EST CL 100.00 21% 21.00 79.00 100% 79.00 21% 16.59 62.41 37.59% FIN CL* 100.00 25% 24.50 75.50 10.00 100% 75.50 32% 24.16 51.34 48.66%
FRA ST 100.00 34% 34.43 65.57 100% 65.57 39% 25.57 40.00 60.00% DEU FW 100.00 30% 30.18 69.83 100% 69.83 26% 18.42 51.41 48.59% GRC NT 100.00 20% 20.00 80.00 80.00 20.00% HUN NT* 100.00 19% 19.00 81.00 5.00 81.00 19.00%
ISL CL 100.00 20% 20.00 80.00 100% 80.00 20% 16.00 64.00 36.00% IRL ST 100.00 13% 12.50 87.50 100% 87.50 48% 42.00 45.50 54.50% ISR PI^ 100.00 25% 25.00 75.00 100% 75.00 20% 15.00 60.00 40.00%
ITA (new) ACE 100.00 28% 6.88 93.13 100% 93.13 20% 18.63 74.50 25.50% ITA (ex) ST 100.00 28% 27.50 72.50 100% 72.50 20% 14.50 58.00 42.00%
JPN ST 100.00 37% 37.00 63.00 100% 63.00 10% 6.30 56.70 43.30% KOR NT 100.00 24% 24.20 75.80 75.80 24.20% LUX NT* 100.00 29% 28.80 71.20 0.50 71.20 28.80% MEX NT 100.00 30% 30.00 70.00 70.00 30.00% NLD PR 100.00 25% 25.00 75.00 100% 100.00 30% 30.00 45.00 55.00% NZL NT 100.00 28% 28.00 72.00 72.00 28.00%
NOR RRA 100.00 28% 28.00 72.00 100% 44.50 28% 12.46 59.54 40.46% POL ST 100.00 19% 19.00 81.00 100% 81.00 19% 15.39 65.61 34.39% PRT FW 100.00 32% 31.50 68.50 100% 68.50 25% 17.13 51.38 48.63% SVK CL 100.00 19% 19.00 81.00 100% 81.00 19% 15.39 65.61 34.39% SVN ST 100.00 18% 18.00 82.00 20.00 100% 82.00 5% 4.10 77.90 22.10% ESP CL 100.00 30% 30.00 70.00 100% 70.00 27% 18.90 51.10 48.90%
SWE CL 100.00 26% 26.30 73.70 100% 73.70 30% 22.11 51.59 48.41% CHE NT 100.00 21% 21.17 78.83 78.83 21.17% TUR NT* 100.00 20% 20.00 80.00 1.00 10% 10% 80.00 20.00% GBR ST 100.00 24% 24.00 76.00 100% 76.00 28% 21.28 54.72 45.28% USA ST* 100.00 39% 39.10 60.90 1.00 100% 60.90 21% 12.97 47.93 52.07%
70 Table 14 provides the full calculation of the combined statutory tax rates that are summarised in Figure 9 and Table 9. The underlying assumptions are set out in the first section of the paper and the
footnotes for Table 9.

42
Figure 13 | Schematic diagram of the tax treatment of capital gains on real property in OECD countries as at 1 July 201271
71 Figure 13 provides a diagrammatic and algebraic representation of the calculations made in Table 15. See Annex A for an explanation of the diagram.
Nominal capital gain on accrual
O
Nominal capital gain on realisation
AHolding period test
H
Taxable individual income
A’, X
Individual taxpayable
S
Post-tax individual income Overall tax rate
No taxationGRC NZL CHE
No taxation (holding period) BEL CHL CZE FRA DEU HUN ITA POL SVK SVN TUR
Partial inclusionCAN SWE
Partial inclusion (holding period)AUS KOR
Inflation adjustmentISR MEX PRT ESP
Full inclusion (holding period)LUX FINSeparate taxation (holding period) AUT JPN USA
Full inclusion DNK EST ISL NORSeparate taxationIRL GBR
SA
XA SXA SX
A(1-S)
A(1-SX)
S
A>H
A
>H
SA A(1-S) S
A’ SA’ SA’/A1-SA’
XA SXA SXA(1-SX)>H∆O A

43
Table 15: Calculation of tax payable on capital gains on real property at the individual level as at 1 July 201272
Type of interest
treatment
Nominal capital gain on
realisation
Longest holding period
(yrs)
Proportion included as
taxable
Taxable individual
income
Personal tax rate
Personal tax payable
Post-tax individual
income
Combined tax rate
AUS PI* 100.00 1.00 50% 50.00 47% 23.25 76.75 23%
AUT ST* 100.00 35.00 50% 50.00 25% 12.50 87.50 13%
BEL NT* 100.00 5.00
100.00
CAN PI 100.00
50% 50.00 48% 23.99 76.02 24%
CHL NT* 100.00 1.00
100.00
CZE NT* 100.00 5.00
100.00
DNK FI 100.00
100% 100.00 46% 45.50 54.50 46%
EST FI 100.00
100% 100.00 21% 21.00 79.00 21%
FIN FI* 100.00 10.00 100% 100.00 32% 32.00 68.00 32%
FRA NT* 100.00 30.00
100.00
DEU NT* 100.00 10.00
100.00
GRC NT 100.00
100.00
HUN NT* 100.00 15.00
100.00
ISL FI 100.00
100% 100.00 20% 20.00 80.00 20%
IRL ST 100.00
100% 100.00 30% 30.00 70.00 30%
ISR PI^ 100.00
100% 100.00 25% 25.00 75.00 25%
ITA NT* 100.00 5.00
100.00
JPN ST* 100.00 5.00 100% 100.00 20% 20.00 80.00 20%
KOR PI* 100.00 10.00 70% 70.00 42% 29.26 70.74 29%
LUX FI* 100.00 2.00 100% 100.00 10% 10.00 90.00 10%
MEX PI^ 100.00
100% 100.00 30% 30.00 70.00 30%
NLD PR 100.00
100% 100.00 30% 30.00 70.00 30%
NZL NT 100.00
100.00
NOR FI 100.00
100% 100.00 28% 28.00 72.00 28%
POL NT* 100.00 5.00
100.00
PRT PI^ 100.00
50% 50.00 49% 24.50 75.50 25%
SVK NT* 100.00 5.00
100.00
SVN NT* 100.00 20.00
100.00
ESP PI^ 100.00
100% 100.00 27% 27.00 73.00 27%
SWE PI 100.00
100% 100.00 30% 30.00 70.00 30%
CHE NT 100.00
100.00
TUR NT* 100.00 5.00
100.00
GBR ST 100.00
100% 100.00 28% 28.00 72.00 28%
USA ST* 100.00
100.00
72 Table 5 provides the full calculation of the combined statutory tax rates that are summarised in Figure 10 and Table 10. The underlying assumptions are set out in the first section of the paper and the
footnotes for Table 10.

44
5. Conclusion
OECD countries apply a range of approaches to the taxation of the different forms of
capital income considered in this paper: dividends on shares, interest income, and capital gains
and shares on property. These approaches can be classified into a number of distinct types of
system based on the tax base at various stages of taxation, the mechanisms used to assess and
apply personal level taxation, and, for dividends and capital gains on shares, the approach to
integration between corporate and personal level taxation. The different systems, and the tax
rates applied within each, determine the combined statutory tax rate on each type of income.
Dividends and capital gains on shares are subject to taxation at both the corporate and
personal levels and the integration between these two levels of taxation influences the overall
rate of taxation applied. Different methods to integration adopted across the OECD include: no
integration, where all post corporate-tax income is taxable at the personal level; partial
inclusion, where only part of post corporate tax income is taxable; imputation systems, where
post corporate-tax income is grossed up to approximate pre-tax income and credits offset
corporate tax at the personal level. At the personal level, the amount of income determined as
taxable to the shareholder can be taxed under general income tax rates, reduced rates applied to
capital income, separate capital gain rates, or final withholding rates.
Similarly, a range of approaches to taxation at the personal level are applied to interest
income and capital gains on shares across the OECD. All or part of these forms of income may
be taxable; through a range of mechanisms including general income taxation, final withholding
rates on interest or separate capital tax rates on capital gains. In addition, capital gains on
property are often untaxed, particularly if realised after the conclusion of a defined holding
period.
The different approaches to the taxation of each of these asset types and the resulting
combined statutory tax rates are shown in Table 16 on the next page for each OECD country.
The combined statutory rates are also shown in Figure 14.

45
Table 16: Interest, dividends, and capital gains tax systems and combined statutory rates in OECD
countries as at 1 July 201273
Dividends Interest Gains on shares Gains on property
Treatment Rate Treatment Rate Treatment Rate Treatment Rate
AUS IM 47% FI 47% PI* 46% PI* 23%
AUT FW 44% FW 25% FW 44% ST* 13%
BEL ACE 31% FW 25% ACE 8% NT* 0%
CAN IM* 50% FI 48% PI 44% PI 24%
CHL IM 40% PI^ 40% NT* 20% NT* 0%
CZE FW 31% FW 15% NT* 19% NT* 0%
DNK CL^ 57% FI 46% CL 57% FI 46%
EST DD 21% NT 0% CL 38% FI 21%
FIN PI 41% FW 30% CL* 49% FI* 32%
FRA FW 61% FW 44% ST 60% NT* 0%
DEU FW 49% FW 26% FW 49% NT* 0%
GRC FW 40% FW 10% NT 20% NT 0%
HUN FW 32% FW 16% NT* 19% NT* 0%
ISL CL 36% FI 20% CL 36% FI 20%
IRL CL 55% FW 30% ST 55% ST 30%
ISR CL^ 44% FW^ 25% PI^ 40% PI^ 25%
ITA74
ACE 26% FW 20% ACE 26% NT* 0%
JPN CL^ 43% FW 20% ST 43% ST* 20%
KOR IM* 50% FW 15% NT 24% PI* 29%
LUX PI 43% FW 10% NT* 29% FI* 10%
MEX IM 30% PI^ 30% NT 30% PI^ 30%
NLD PR 55% PR 30% PR 55% PR 30%
NZL IM 33% FI 33% NT 28% NT 0%
NOR RRA 40% FI 28% RRA 40% FI 28%
POL FW 34% FW 19% ST 34% NT* 0%
PRT FW 49% FW 25% FW 49% PI^ 25%
SVK NT 19% FW 19% CL 34% NT* 0%
SVN CL 34% FW 20% ST 22% NT* 0%
ESP CL 49% FI 27% CL 49% PI^ 27%
SWE CL 48% FI 30% CL 48% PI 30%
CHE CL 53% FI 40% NT 21% NT 0%
TUR PI 34% FW 15% NT* 20% NT* 0%
GBR IM^ 51% FI 50% ST 45% ST 28%
USA75
CL^ 52% FI 42% ST* 52% ST* 76
73 The information shown in Table 16 is also shown in graphical form in Figure 14. The assumed rate of
return in is 4%. The impact of other rates of return on the calculations for Belgium, new equity in Italy, the Netherlands and Norway are shown in Figures 5 and 6.
74 For Italy, Table 16 shows the treatment of new corporate equity for which an allowance for corporate
equity is applied at the corporate level. A final withholding tax system (for dividends) and a separate
taxation system (for capital gains on shares) apply at the individual level. The treatment of existing equity differs for dividends and capital gains on shares and is described in the respective sections of this paper.
75 Tax rates in the United States were changed as of 1 January 2013 under the American Taxpayer Relief Act of 2012. For a description of these changes, see OMB (2013) at p 175.
76 The tax rate on gains on real property in the United States varies under a number of assumptions. See Box 2 for a description of the tax system and an estimated rate for a particular set of assumptions.

46
Figure 14: Combined statutory tax rates on interest, dividends, and capital gains as at 1 July 201277
77 The data used to calculate Figure 14 is shown in tabular form in Table 16. The underlying assumptions
are set out in the footnotes to Table 14. The tax rate on gains on real property in the United States varies
under a number of assumptions and is therefore not shown in this figure. See Box 2 for a description of the tax system and an estimated rate for a particular set of assumptions.
USA
GBR
TUR
CHE
SWE
ESP
SVN
SVK
PRT
POL
NOR
NZL
NLD
MEX
LUX
KOR
JPN
ITA…
ISR
IRL
ISL
HUN
GRC
DEU
FRA
FIN
EST
DNK
CZE
CHL
CAN
BEL
AUT
AUS
Country tax rate OECD average tax rate
Dividends Interest Capital gains (shares) Capital gains (property)
0% 20% 40% 60% 0% 20% 40% 60% 0% 20% 40% 60% 0% 20% 40% 60%

47
REFERENCE LIST
Country responses to questionnaire on the Tax Treatment of Household Savings.
Country responses to questionnaires on Tax Policy Developments.
IBFD database, at http://www.ibfd.org/.
OECD (1994) Taxation and household saving, OECD Publishing, Paris.
OECD (2012), Taxing Wages, OECD Publishing, Paris.
OECD (2013) Tax Database, http://www.oecd.org/tax/taxpolicyanalysis/oecdtaxdatabase.htm.
OMB (2013) Analytical Perspectives,
http://www.whitehouse.gov/omb/budget/Analytical_Perspectives

48
Annex A
EXPLANATION OF DIAGRAMMATIC REPRESENTATION OF TAX SYSTEMS
Figures 2, 4, 7, and 8 illustrate how the tax base for different forms of income differs
depending on the particular system of taxation employed. Each diagram sets out pre-tax income
A at the left and traces the tax treatment through to the individual’s post-tax income. The final
column of each diagram shows the combined tax rate, relative to pre-tax income. The types of
systems are listed at the right hand side of the diagrams.
In the diagrams, each horizontal line follows a particular type of tax system through a
number of stages between pre-tax (corporate or individual) income and the individual’s post-tax
income. These stages are shown in Table A1.
Table A1: Progression of pre-tax income to post-tax individual income
Dividends Interest Capital gains (shares) Capital gains (real
property)
Corporate level
Pre-tax profit Tax payable Post-tax profit
Pre-tax profit Tax payable Post-tax profit (retained)
Individual level
Taxable income Imputation, dividend credits, withholding taxes Tax payable Post-tax income
Investment income Taxable income Withholding taxes Tax payable Post-tax income
Nominal capital gain on realisation Taxable income Withholding taxes Tax payable Post-tax income
Nominal capital gain on realisation Taxable income Tax payable Post-tax income
The boxes illustrate the impact of the tax system on the income flow as set out in the prior
box. Not all stages may be relevant to a particular tax system and may apply differently between
different tax systems depending on their particular rules, as indicated in mathematical terms in
the boxes at each stage. The rounded boxes represent an amount of profit or income: the squared
boxes represent an amount of tax or tax credit. The vertical placement of the boxes indicates the
applicable tax system.
Where the tax system does not affect a particular stage, the column in the diagrams
representing that stage is left blank and the line passes through the column. A solid line in the
diagrams represents a link from one box to the next. A dotted line on the diagrams shows an
indirect link between the first box on the line and the last.
Pre-tax corporate profit is designated as A in the diagrams and shown in the third column
of the diagrams relating to the tax treatment of dividend income and capital gains on shares.
Pre-tax corporate profit is a function of corporate equity, which is denoted in the diagrams as E.
Corporate and shareholder equity are shown in the first column of the diagram. Where these
have a direct impact on the combined tax rate (for example, as is the case in Norway, the
Netherlands and Belgium) this is shown explicitly on the graph (connected by dotted lines to the
first point of impact).

49
The tax rate and rules that apply at the corporate level are not shown further than this in the
diagram. In particular, rules around depreciation, deductibility of expenses, and other corporate
tax rules are not considered. This leads to the post corporate tax position being shown as A(1-C)
for all countries excluding Belgium and Italy, where the allowance for corporate equity is taken
into account.
Four factors that determine the tax applied at individual level are summarised in Table A3.
Of these, only those in the top row are included in the diagrams.
Table A2: Factors influencing the tax applied at individual level and options for each
A. Base B. Rate
1. Included in diagrams
A1. Amount of post-tax dividend or capital gains income included in individual income
Full inclusion
Partial inclusion
Grossing-up
No inclusion
B1. Withholding rates and imputation credits
Preliminary withholding rates
Final withholding rates
Imputation or dividend tax credits
No withholding rates or imputation or dividend tax credits
2. Not included in diagrams
A2. Tax base that the post-tax dividend or capital gains income is included in:
Global income (both capital and labour income)
Capital income
A subset of capital income
Separate taxation
B2. Nature of tax rate applied at individual level (S):
Progressive rate structure
Flat rate structure
Preferential rate
No tax applied at individual level
The options in each box can be combined with the options in each other box. For example,
if the full amount of post-tax dividend or capital gains received by the individual is considered
taxable (A1), this could be included with any tax base (under A2): a global income tax base; a
capital income tax base; some subset of this; or it could be taxed entirely separately. However,
some of the options above have prerequisites in other areas, or limit the options available under
other factors. An example of this is a final withholding tax (B1), which requires that the income
is taxed separately from other income (A2) and in practice, means the income is taxed at a flat
rate (B2).

50
Annex B
COMBINED TAX RATES IN EACH OECD COUNTRY
Figures B1 to B34: Combined tax rates across interest, dividends, capital gains, personal and corporate
income in each OECD country as at 1 July 2012
IM FI PI*
PI*
0% 1% 2% 3% 4% 5% 6%
0%
20%
40%
60%
Div. Int. CG-eq. CG-prop. Pers. Corp.
Overall tax rateFigure B1 | Australia
FW
FW
FW
ST*
0% 1% 2% 3% 4% 5% 6%
0%
20%
40%
60%
Div. Int. CG-eq. CG-prop. Pers. Corp.
Overall tax rateFigure B2 | Austria
ACEFW
ACE
NT*
0% 1% 2% 3% 4% 5% 6%
0%
20%
40%
60%
Div. Int. CG-eq. CG-prop. Pers. Corp.
Overall tax rateFigure B3 | Belgium
IM* FIPI
PI
0% 1% 2% 3% 4% 5% 6%
0%
20%
40%
60%
Div. Int. CG-eq. CG-prop. Pers. Corp.
Overall tax rateFigure B4 | Canada
IM PI^
NT*
NT*
0% 1% 2% 3% 4% 5% 6%
0%
20%
40%
60%
Div. Int. CG-eq. CG-prop. Pers. Corp.
Overall tax rateFigure B5 | Chile
FW
FWNT*
NT*
0% 1% 2% 3% 4% 5% 6%
0%
20%
40%
60%
Div. Int. CG-eq. CG-prop. Pers. Corp.
Overall tax rateFigure B6 | Czech Republic
CL^
FI
CL
FI
0% 1% 2% 3% 4% 5% 6%
0%
20%
40%
60%
Div. Int. CG-eq. CG-prop. Pers. Corp.
Overall tax rateFigure B7 | Denmark
DD
NT
CL
FI
0% 1% 2% 3% 4% 5% 6%
0%
20%
40%
60%
Div. Int. CG-eq. CG-prop. Pers. Corp.
Overall tax rateFigure B8 | Estonia
PI
FW
CL*
FI*
0% 1% 2% 3% 4% 5% 6%
0%
20%
40%
60%
Div. Int. CG-eq. CG-prop. Pers. Corp.
Overall tax rateFigure B9 | Finland
FW
NT*
0% 1% 2% 3% 4% 5% 6%
0%
20%
40%
60%
Div. Int. CG-eq. CG-prop. Pers. Corp.
Overall tax rateFigure B10 | France

51
FW
FW
FW
NT*
0% 1% 2% 3% 4% 5% 6%
0%
20%
40%
60%
Div. Int. CG-eq. CG-prop. Pers. Corp.
Overall tax rateFigure B11 | Germany
FW
FW
NT
NT
0% 1% 2% 3% 4% 5% 6%
0%
20%
40%
60%
Div. Int. CG-eq. CG-prop. Pers. Corp.
Overall tax rateFigure B12 | Greece
FW
FW NT*
NT*
0% 1% 2% 3% 4% 5% 6%
0%
20%
40%
60%
Div. Int. CG-eq. CG-prop. Pers. Corp.
Overall tax rateFigure B13 | Hungary
CL
FI
CL
FI
0% 1% 2% 3% 4% 5% 6%
0%
20%
40%
60%
Div. Int. CG-eq. CG-prop. Pers. Corp.
Overall tax rateFigure B14 | Iceland
CL
FW
ST
ST
0% 1% 2% 3% 4% 5% 6%
0%
20%
40%
60%
Div. Int. CG-eq. CG-prop. Pers. Corp.
Overall tax rateFigure B15 | Ireland
CL^
FW^
PI^
PI^
0% 1% 2% 3% 4% 5% 6%
0%
20%
40%
60%
Div. Int. CG-eq. CG-prop. Pers. Corp.
Overall tax rateFigure B16 | Israel
ACE
FW
FWACE
ST
NT*
0% 1% 2% 3% 4% 5% 6% 7%
0%
20%
40%
60%
Div.(new)
Div. (old) Int. CG-eq.(new)
CG-eq.(old)
CG-prop. Pers. Corp.
Overall tax rateFigure B17 | Italy
CL^
FW
ST
ST*
0% 1% 2% 3% 4% 5% 6%
0%
20%
40%
60%
Div. Int. CG-eq. CG-prop. Pers. Corp.
Overall tax rateFigure B18 | Japan
IM*
FWNT
PI*
0% 1% 2% 3% 4% 5% 6%
0%
20%
40%
60%
Div. Int. CG-eq. CG-prop. Pers. Corp.
Overall tax rateFigure B19 | Korea
PI
FW
NT*
FI*
0% 1% 2% 3% 4% 5% 6%
0%
20%
40%
60%
Div. Int. CG-eq. CG-prop. Pers. Corp.
Overall tax rateFigure B20 | Luxembourg
IM PI^ NT PI^
0% 1% 2% 3% 4% 5% 6%
0%
20%
40%
60%
Div. Int. CG-eq. CG-prop. Pers. Corp.
Overall tax rateFigure B21 | Mexico
PR
PR
PR
PR
0% 1% 2% 3% 4% 5% 6%
0%
20%
40%
60%
Div. Int. CG-eq. CG-prop. Pers. Corp.
Overall tax rateFigure B22 | Netherlands

52
IM FINT
NT
0% 1% 2% 3% 4% 5% 6%
0%
20%
40%
60%
Div. Int. CG-eq. CG-prop. Pers. Corp.
Overall tax rateFigure B23 | New Zealand
RRA
FI
RRA
FI
0% 1% 2% 3% 4% 5% 6%
0%
20%
40%
60%
Div. Int. CG-eq. CG-prop. Pers. Corp.
Overall tax rateFigure B24 | Norway
FW
FW
ST
NT*
0% 1% 2% 3% 4% 5% 6%
0%
20%
40%
60%
Div. Int. CG-eq. CG-prop. Pers. Corp.
Overall tax rateFigure B25 | Poland
FW
FW
FW
PI^
0% 1% 2% 3% 4% 5% 6%
0%
20%
40%
60%
Div. Int. CG-eq. CG-prop. Pers. Corp.
Overall tax rateFigure B26 | Portugal
NT FW
CL
NT*
0% 1% 2% 3% 4% 5% 6%
0%
20%
40%
60%
Div. Int. CG-eq. CG-prop. Pers. Corp.
Overall tax rateFigure B27 | Slovak Republic
CL
FW ST
NT*
0% 1% 2% 3% 4% 5% 6%
0%
20%
40%
60%
Div. Int. CG-eq. CG-prop. Pers. Corp.
Overall tax rateFigure B28 | Slovenia
CL
FI
CL
PI^
0% 1% 2% 3% 4% 5% 6%
0%
20%
40%
60%
Div. Int. CG-eq. CG-prop. Pers. Corp.
Overall tax rateFigure B29 | Spain
CL
FI
CL
PI
0% 1% 2% 3% 4% 5% 6%
0%
20%
40%
60%
Div. Int. CG-eq. CG-prop. Pers. Corp.
Overall tax rateFigure B30 | Sweden
CL
FI
NT
NT
0% 1% 2% 3% 4% 5% 6%
0%
20%
40%
60%
Div. Int. CG-eq. CG-prop. Pers. Corp.
Overall tax rateFigure B31 | Switzerland
PI
FWNT*
NT*
0% 1% 2% 3% 4% 5% 6%
0%
20%
40%
60%
Div. Int. CG-eq. CG-prop. Pers. Corp.
Overall tax rateFigure B32 | Turkey
IM^ FIST
ST
0% 1% 2% 3% 4% 5% 6%
0%
20%
40%
60%
Div. Int. CG-eq. CG-prop. Pers. Corp.
Overall tax rateFigure B33 | United Kingdom
CL^
FI
ST*
ST*
0% 1% 2% 3% 4% 5% 6%
0%
20%
40%
60%
Div. Int. CG-eq. CG-prop. Pers. Corp.
Overall tax rateFigure B34 | United States

53
Annex C
CHANGE IN TAX TREATMENT GIVEN PROPORTION OF OWNERSHIP
Type of income Threshold Effect of substantial holding
Czech Republic Gains on shares 5% (ownership or voting) Gains exempt from tax after 5 years (rather than 6 months); prior to this a 15% tax rate applies
France Gains on shares Shareholder active in entity Treated as a business portfolio gain
Germany Interest 10% ownership Progressive tax rates apply (rather than the flat capital rate)
Gains on shares 1% directly or indirectly held (over last 5 years)
Treated as business income; 60% is taxable.
Ireland Dividends Closely held company (less than 5 owners) Treated as employment income
Interest Shareholders/directors in some circumstances
Treated as dividends
Israel Dividends & Gains on shares
10% ownership or means of control (year of sale or prior year)
Taxed at 30% (rather than 25%)
Italy Dividends & Gains on shares
Listed companies: 2% of voting rights or 5% of ownership. Otherwise: 20% voting rights and 25% ownership
49.72% of the income is included from the tax base which is taxed at X (rather than under a final withholding rate or a separate tax rate of 20%)
Korea Gains on shares 3% ownership (including related parties) Taxed at 20% or 30% (rather than exempt)
Luxembourg Dividends 10% ownership, (including partner and minor children, over last 5 years)
May be treated as a dividend
Gains on shares 10% ownership, (including partner and minor children, over last 5 years)
Exemption after 6 month holding period does not apply
Mexico Gains on shares 10% ownership (directly or indirectly) if more than 10% of company disposed of within 2 years
Exemptions from capital gains tax do not apply
Netherlands Dividends and capital gains (shares)
5% ownership Treated as box 2 income (and taxed at 25%) rather than as box 3 income
Sweden Dividends and Gains on shares
Shareholder active in company Payment or gain below a prescribed amount is taxed as capital income at 2/3 of the standard statutory capital tax rate (flat); payment or gain in excess of the prescribed amount is taxed as labour income (progressive)
Switzerland Dividends and Gains on shares
10% ownership If held for less than one year, 50% are taxable (rather than exempt)
United Kingdom Gains on shares 5% (ownership and voting) and employment within the company
Gains are subject to capital gains tax at 10% at the personal level (rather than 28%), for up to £10 million per individual on a lifetime basis.

54
OECD TAXATION WORKING PAPERS
No. 1 Tax reform trends in OECD countries
Bert Brys, Stephen Matthews and Jeffrey Owens
No. 2 What is a competitive tax system?
Stephen Matthews
No. 3 Making fundamental tax reform happen
Bert Brys
No. 4 Trends in top incomes and income inequality and the implications for tax policy
Stephen Matthews
No. 5 The evaluation of the effectiveness of tax expenditures: a novel approach. An
application to the regional tax incentives for business investments in Italy
Antonella Caiumi
No. 6 Corporate taxation and SMEs: the Italian experience
Marco Manzo
No. 7 Consumption taxation as an additional burden on labour income
Fidel Picos-Sánchez
No. 8 Non-tax compulsory payments as an additional burden on labour income
Bert Brys
No. 9 Taxation and innovation
Pamela Palazzi
No. 10 Wage income tax reforms and changes in tax burdens: 2000-2009
Bert Brys
No. 11 Shifting from social security contributions to consumption taxes: the impact on low-
income earner work incentives
Alastair Thomas and Fidel Picos-Sánchez

55
No. 12 Trends in personal income tax and employee social security contribution schedules
Carolina Torres, Kirsti Mellbye and Bert Brys
No. 13 Taxes and investment in skills
Carolina Torres
No. 14 Modelling the tax burden on labour income in Brazil, China, India, Indonesia and
South Africa
Luca Gandullia, Nicola Iacobone, Alastair Thomas
No. 15 Average personal income tax rate and tax wedge progression in OECD countries
Dominique Paturot, Kirsti Mellbye and Bert Brys
No. 16 Effective personal tax rates on marginal skills investments in OECD countries: a new
methodology
Bert Brys and Carolina Torres
No. 17 The tax policy landscape five years after the crisis
Pierre LeBlanc, Stephen Matthews and Kirsti Mellbye
No. 18 Tax policy and tax reform in the People’s Republic of China
Bert Brys, Stephen Matthews, Richard Herd and Xiao Wang

56
THE OECD TAXATION WORKING PAPERS SERIES ON LINE
The OECD Taxation Working Papers Series may be found at:
The OECD Centre for Tax Policy and Administration website:
http://www.oecd.org/ctp/tax-policy/tax-policy-working-papers.htm
The OECD’s online iLibrary: http://www.oecd-ilibrary.org/
The Research Papers in Economics (RePEc) website: www.repec.org
For further information on the OECD Taxation Working Papers Series, please write to: