Embed Size (px)
Citation preview

Income Inequality, Poverty, and Discrimination
Chapter 20
McGraw-Hill/Irwin Copyright © 2009 by The McGraw-Hill Companies, Inc. All rights reserved.

Chapter Objectives
• Income inequality in the U.S. • Sources of income inequality• Income inequality since 1970• Economic arguments regarding
income inequality• Poverty measurement and
incidence• The U.S. income-maintenance
program• Labor market discrimination
20-2

Facts About Income Inequality
• Average household income–$66,570 in 2006
–Among highest in the world
• Distribution by quintiles
• Income mobility–People change quintiles
• Government redistribution–Taxes and transfers 20-3

Facts About Income Inequality
(1)Quintile
(2)Percentage ofTotal Income
Lowest 20%
Second 20%
Third 20%
Fourth 20%
Highest 20%
Total
Distribution by Quintiles, 2006
3.4
8.6
14.5
22.9
50.5
100.0
Source: Bureau of the Census
(3)Upper
Income Limit
$20,035
37,774
60,000
97,032
No Limit
20-4

Income Inequality
• Lorenz Curve and Gini Ratio
20 40 60 80 100
20
40
60
80
100
0
Perfect Equality
Lorenz Curve(Actual Distribution)
Complete Inequality
A B
ab
c
d
e
f
Gini Ratio =Area A
Area A + Area B
Percentage of Households
Per
cen
tag
e o
f In
co
me
20-5

Government Redistribution
20 40 60 80 100
20
40
60
80
100
0
Lorenz CurveBefore Taxes and
Transfers
Percentage of Households
Per
cen
tag
e o
f In
co
me
Lorenz CurveAfter Taxes and
Transfers
Impact of Government Taxes and Transfers20-6

Causes of Income Inequality
• Ability• Education and training• Discrimination• Preferences and risks• Unequal distribution of wealth• Market power• Luck, connections, and
misfortune
20-7

Income Inequality Over Time
• Rising income inequality since 1970
• Causes of growing inequality–Greater demand for highly skilled
workers–Demographic changes–International trade, immigration,
and decline in unionism
20-8

Income Inequality
ColumbiaBrazil
South AfricaGuatemala
MexicoUnited States
ItalyJapan
SwedenGermany
0 10 20 30 40 50
Source: United Nations, Human Development Report, 2007/2008
Percentage Total Income Received by Top One-Tenth of Receivers, Selected Nations 2007
20-9

Equality Versus Efficiency
• The case for equality –Maximizing total utility
• The case for inequality–Incentives and efficiency
• The equality-efficiency tradeoff
20-10

The Utility-Maximizing Distribution of Income
Anderson’s MarginalUtility From Income
Brooks’ MarginalUtility From Income
0 0M
arg
inal
Uti
lity
Mar
gin
al U
tilit
y
Income Income
$5000 $5000$2500 $7500
MUBMUA
a
a’ b’
b
Utility Gain(Entire Blue Area)
Utility Loss(Entire Red Area)
Equality Versus Efficiency
20-11
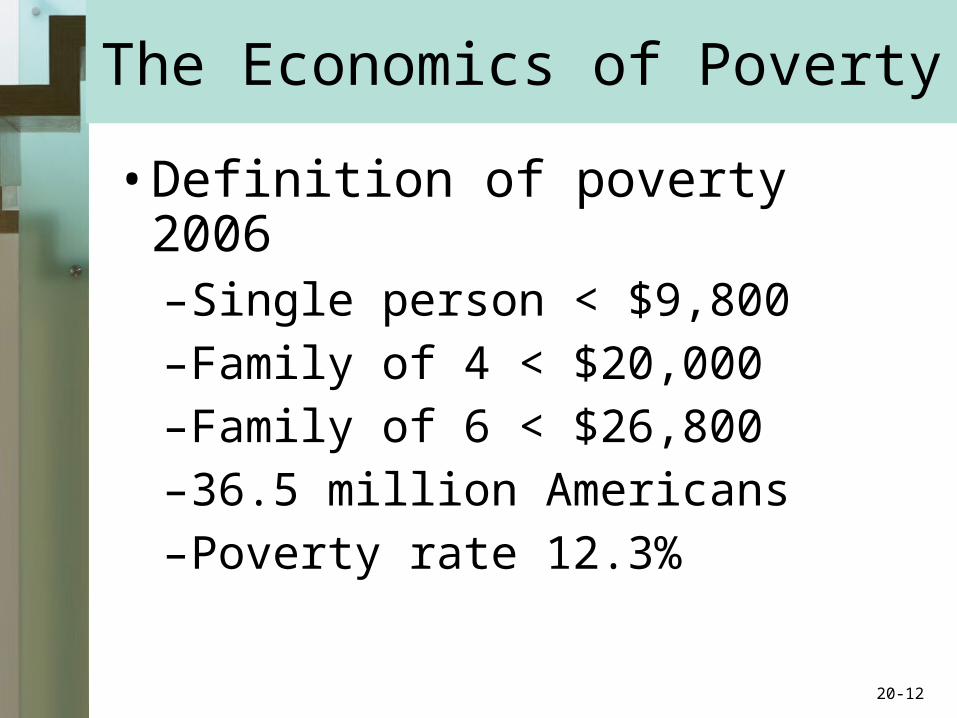
The Economics of Poverty
• Definition of poverty 2006–Single person < $9,800–Family of 4 < $20,000–Family of 6 < $26,800–36.5 million Americans–Poverty rate 12.3%
20-12
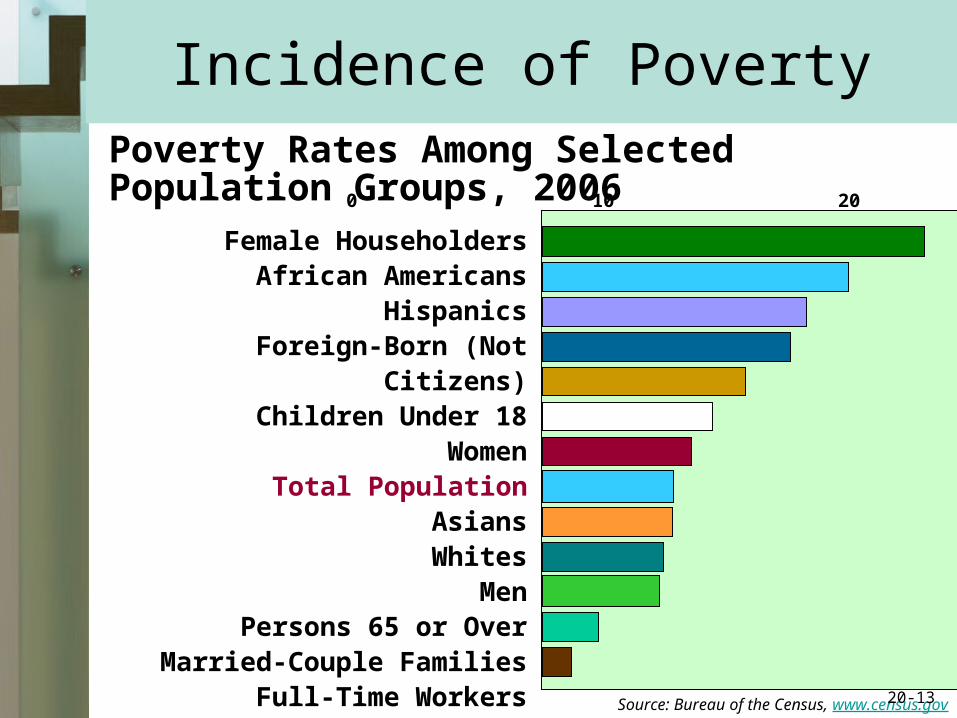
Incidence of Poverty
Female HouseholdersAfrican Americans
HispanicsForeign-Born (Not Citizens)
Children Under 18Women
Total PopulationAsiansWhites
MenPersons 65 or Over
Married-Couple FamiliesFull-Time Workers
0 10 20 30
Poverty Rates Among Selected Population Groups, 2006
Source: Bureau of the Census, www.census.gov20-13

The Economics of Poverty
• Poverty rate trends–Significant decline 1959-1969–Stable in 11-13% range since–Rises with recession
• Measurement issues–Arbitrary threshold–Consumption vs. income
20-14

Income-Maintenance System
• Entitlement programs–All those eligible receive aid
• Social insurance programs–Social security and Medicare–Unemployment compensation
• Public assistance programs–Welfare
20-15

Public Assistance Programs
• Supplemental security income• Temporary assistance for needy
families• Food stamp program• Medicaid• Earned Income Tax Credit
20-16

Discrimination
• Inferior treatment• Taste-for-discrimination model
–Prejudice people receive disutility–Willing to pay to avoid–Discrimination coefficient–Prejudice and the market African-
American-White wage ratio–Competition and discrimination
20-17

Taste for Discrimination Model
Afr
ican
-Am
eric
an W
age
Rat
e(D
oll
ars)
African-American Employment (Millions)
0
D3
D2
D1
S
12 16 18
6
$98
MoreDiscrimination
LessDiscrimination
20-18

Discrimination
• Statistical discrimination–Judged on average group
characteristics
–Labor market example
–Profitable, undesirable, but not malicious
20-19

Discrimination
• Occupational segregation–The crowding model–Crowd certain groups into less
desirable occupations–Effects of crowding–Elimination of crowding
Discrimination
20-20

Occupational Segregation
Wag
e R
ate
B BBM M
W
3 4 3 4 64
Dx Dy Dz
Occupation X Occupation Y Occupation Z
Quantity of Labor(Millions)
Quantity of Labor(Millions)
Quantity of Labor(Millions)
By crowding women into one occupation (Z)…
Men enjoy higher wages in the other occupations (X and Y)
000
20-21

U.S. Family Wealth
Median and Average Family Wealth, 1995-2004 In 2004 Dollars
Year Median Average
1995199820012004
$70,80083,10091,70093,100
$260,800327,500421,500448,200
• Family wealth rose rapidly between 1995 and 2004
20-22

• Family wealth became more unequal between 1995 and 2004
Percentage of Total Family Wealth Held by Different
Percentile Groups, 1995-2004
1995199820012004
32.2%31.430.230.5
34.6%33.932.733.4
Year Bottom 90% Top 1%Bottom 10%
Percentile of Wealth Distribution
67.8%68.669.869.5
U.S. Family Wealth
20-23

Key Terms• income inequality
• Lorenz curve
• Gini ratio
• income mobility
• noncash transfers
• equality-efficiency trade-off
• poverty rate
• entitlement programs
• social insurance programs
• Social Security
• Medicare
• Unemployment compensation
• public assistance programs
• Supplemental Security Income (SSI)
• Temporary Assistance for Needy Families (TANF)
• food-stamp program
• Medicaid
• earned-income tax credit
• Discrimination (EITC)
• taste for discrimination model
• discrimination coefficient
• statistical discrimination
• occupational segregation 20-24

Next Chapter Preview…
The Economicsof Health Care
20-25


