Embed Size (px)
DESCRIPTION
May 2013. Income Inequality in the United States and Oklahoma. Income Inequality among Households. Oklahoma = 8.0. Map credit: Center on Budget and Policy Priorities and Economic Policy Institute, “Pulling Apart: A State-by-State Analysis of Income Trends,” November 15, 2012. - PowerPoint PPT Presentation
Citation preview
Income Inequality in the United States and Oklahoma
May 2013
2
Income Inequality among Households

3
Oklahoma = 8.0
Map credit: Center on Budget and Policy Priorities and Economic Policy Institute, “Pulling Apart: A State-by-State Analysis of Income Trends,” November 15, 2012.
4
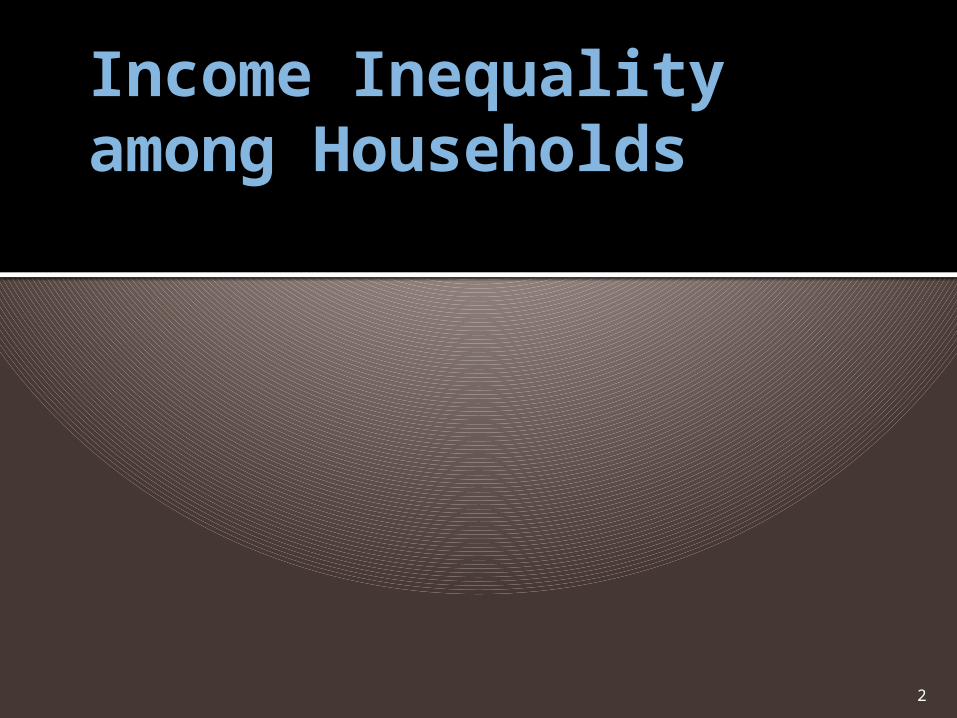
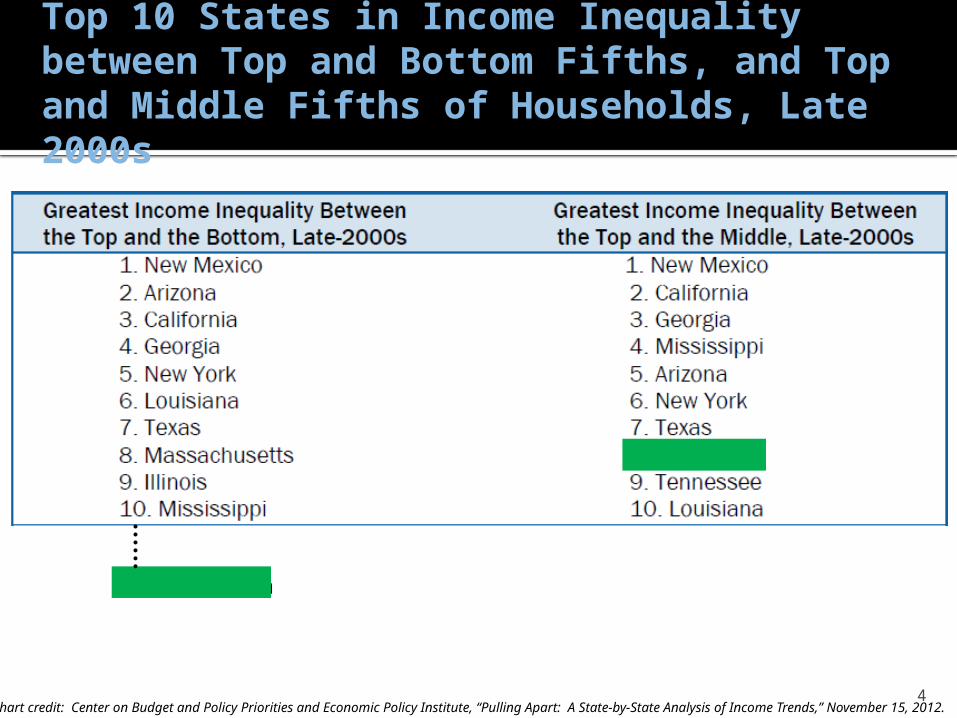
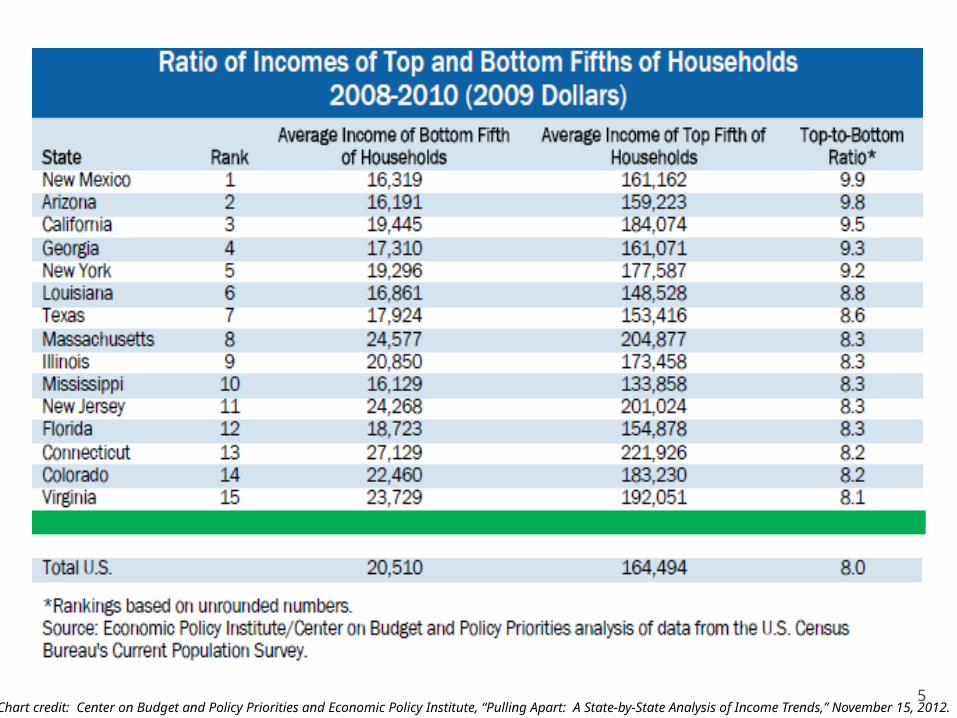
Top 10 States in Income Inequality between Top and Bottom Fifths, and Top and Middle Fifths of Households, Late 2000s
16. Oklahoma
Chart credit: Center on Budget and Policy Priorities and Economic Policy Institute, “Pulling Apart: A State-by-State Analysis of Income Trends,” November 15, 2012.
5Chart credit: Center on Budget and Policy Priorities and Economic Policy Institute, “Pulling Apart: A State-by-State Analysis of Income Trends,” November 15, 2012.
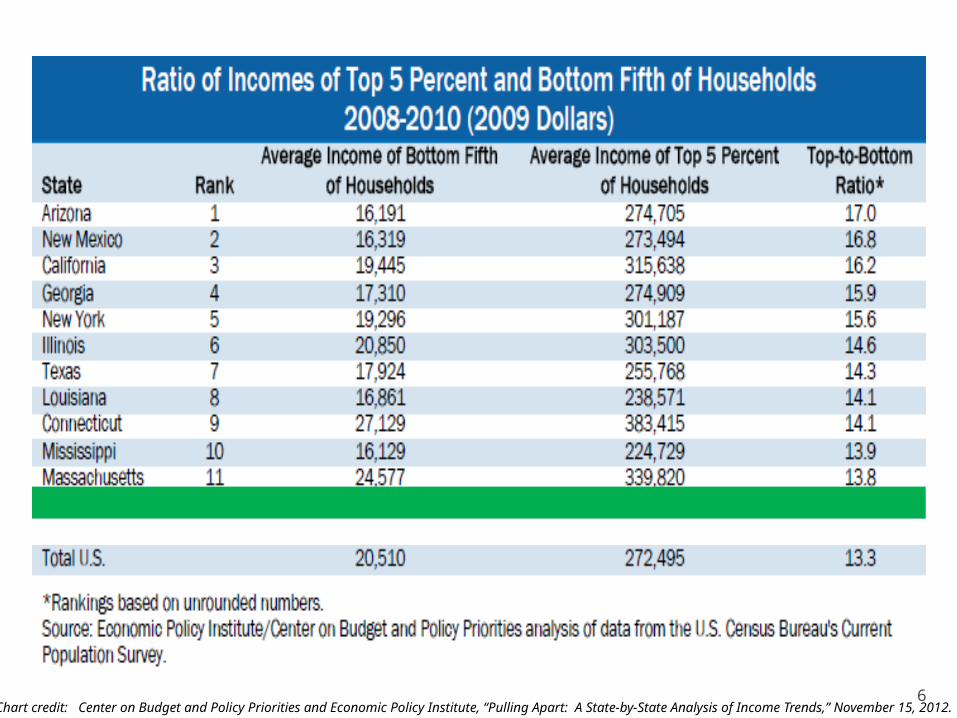
6Chart credit: Center on Budget and Policy Priorities and Economic Policy Institute, “Pulling Apart: A State-by-State Analysis of Income Trends,” November 15, 2012.
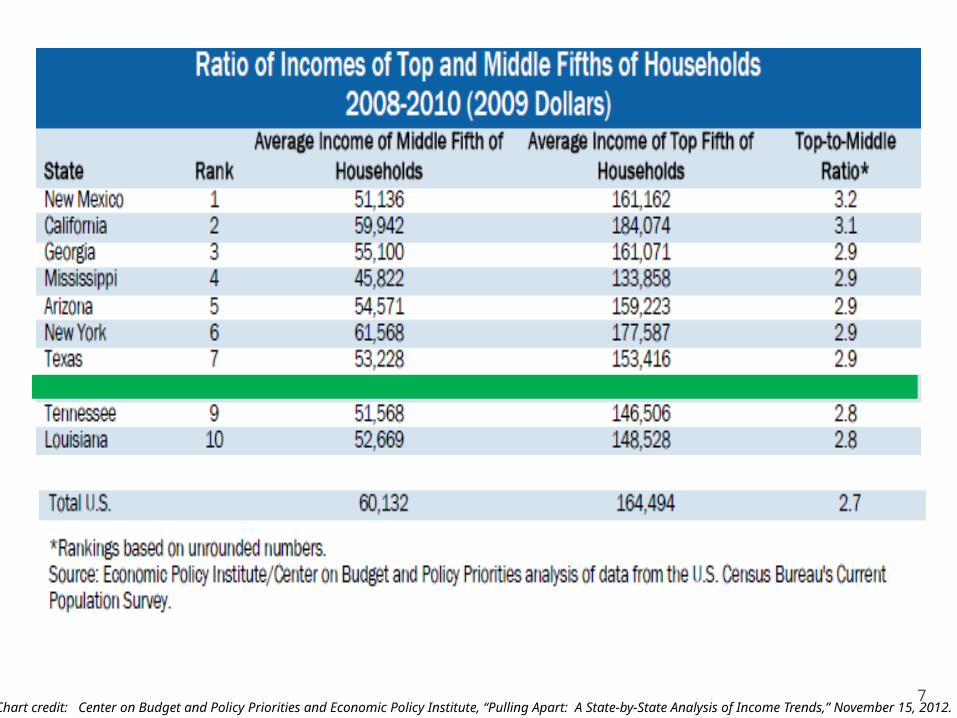
7Chart credit: Center on Budget and Policy Priorities and Economic Policy Institute, “Pulling Apart: A State-by-State Analysis of Income Trends,” November 15, 2012.
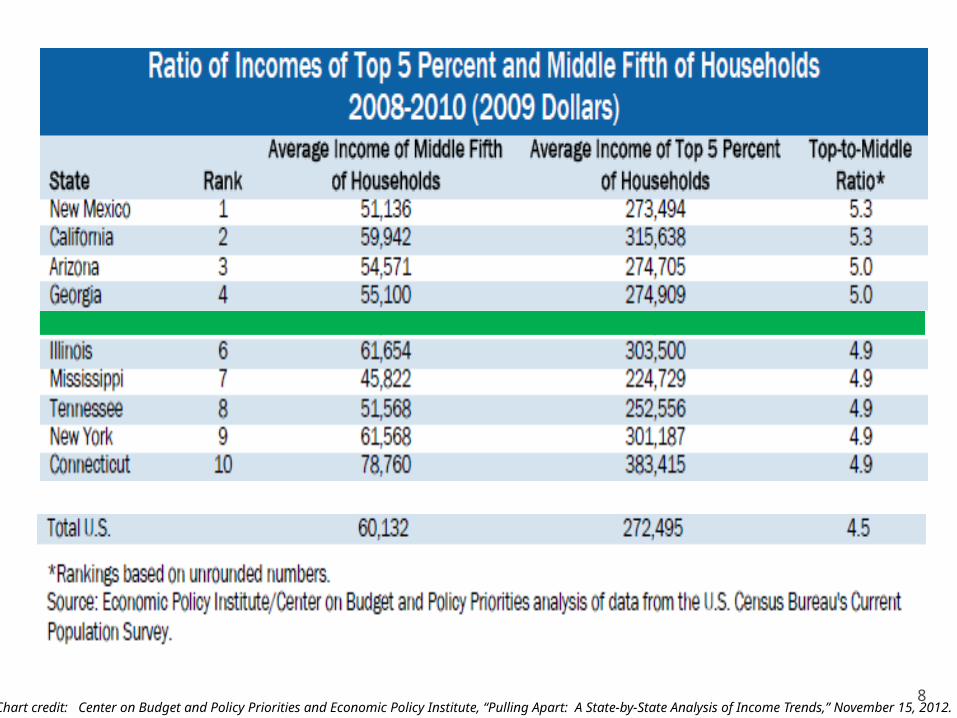
8Chart credit: Center on Budget and Policy Priorities and Economic Policy Institute, “Pulling Apart: A State-by-State Analysis of Income Trends,” November 15, 2012.
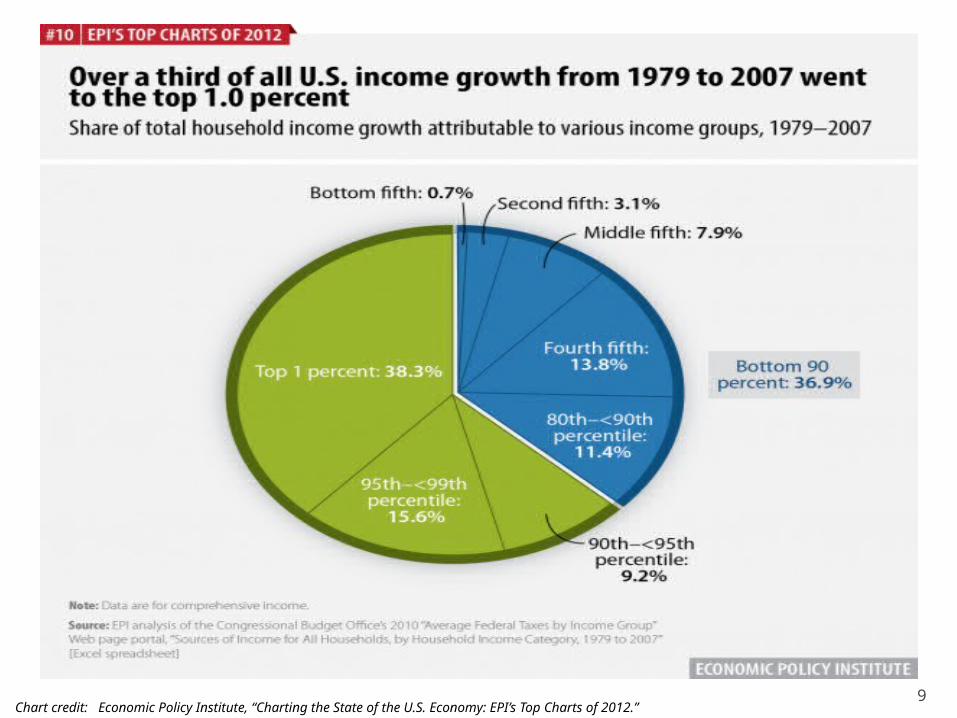
9Chart credit: Economic Policy Institute, “Charting the State of the U.S. Economy: EPI’s Top Charts of 2012.”
10
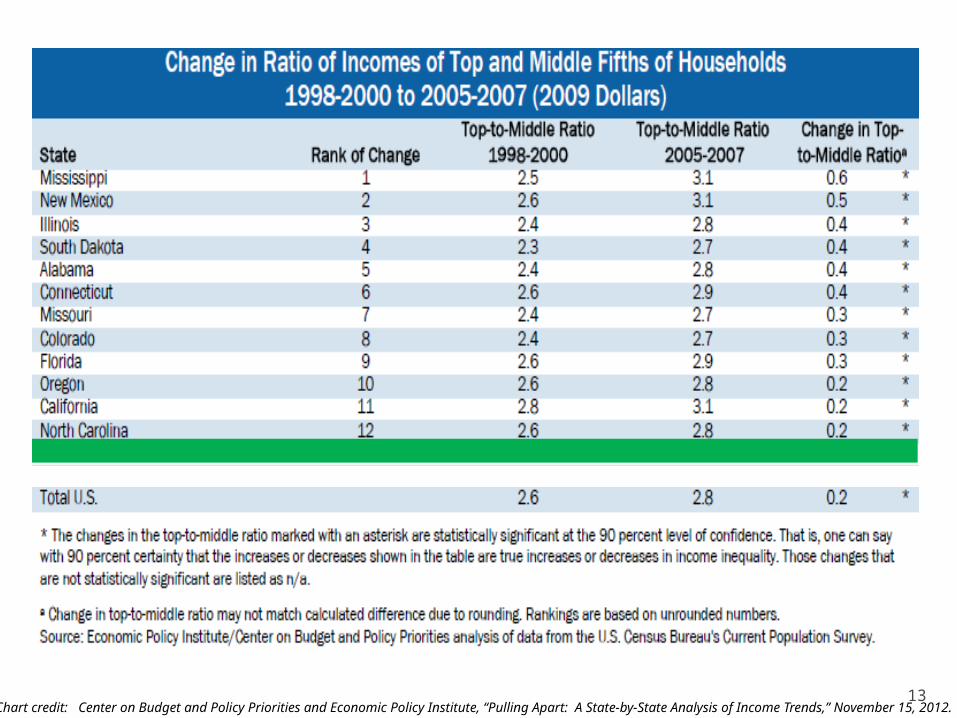
Change in Income Inequality
11
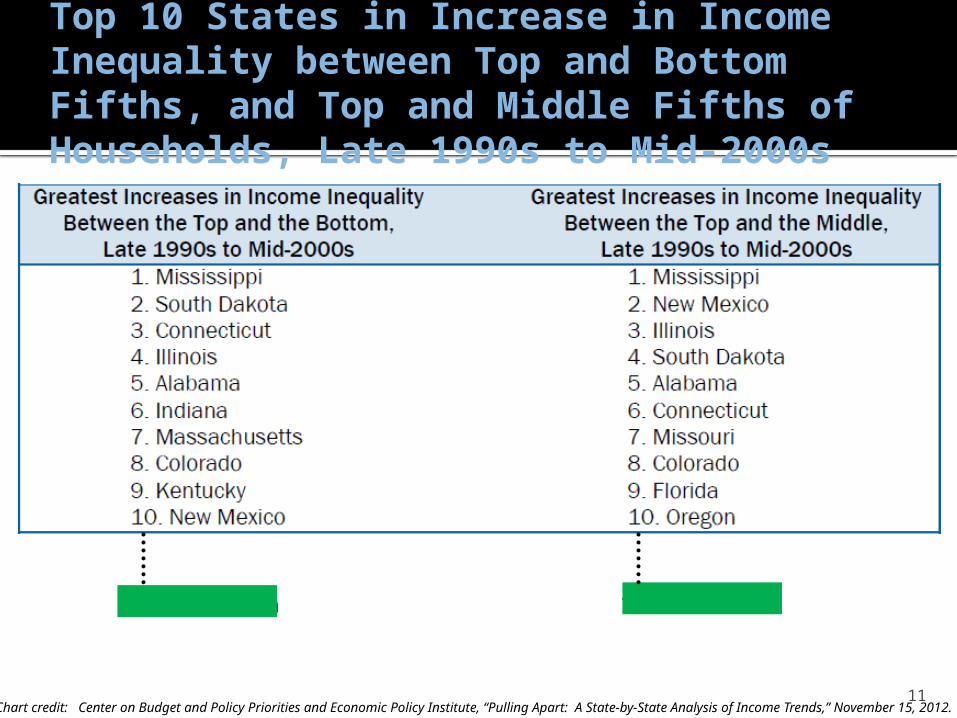
16. Oklahoma 13. Oklahoma
Top 10 States in Increase in Income Inequality between Top and Bottom Fifths, and Top and Middle Fifths of Households, Late 1990s to Mid-2000s
Chart credit: Center on Budget and Policy Priorities and Economic Policy Institute, “Pulling Apart: A State-by-State Analysis of Income Trends,” November 15, 2012.
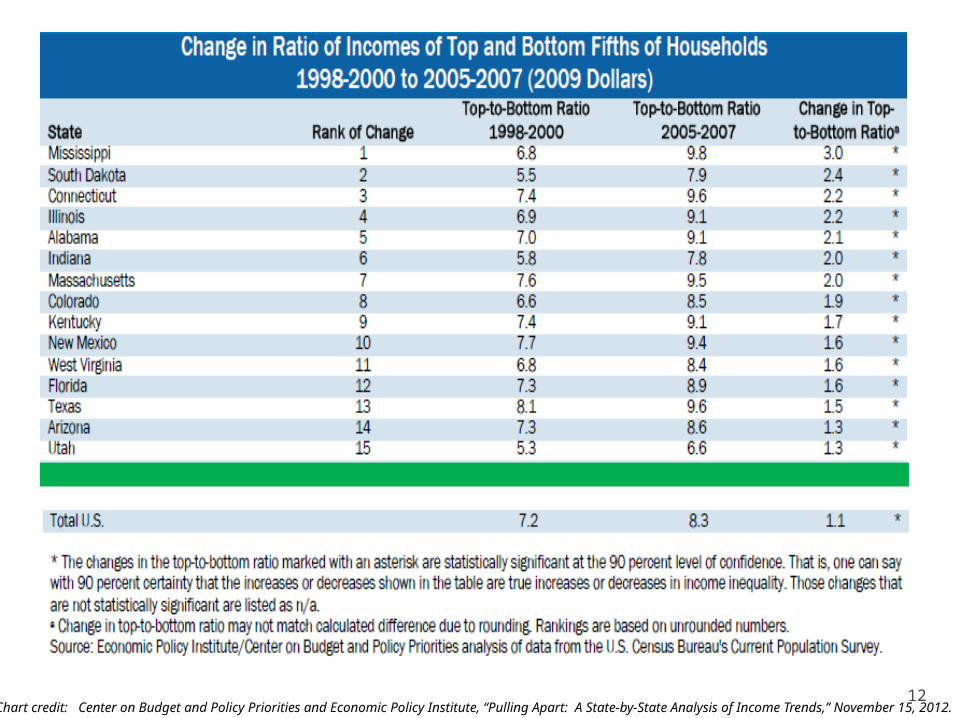
12Chart credit: Center on Budget and Policy Priorities and Economic Policy Institute, “Pulling Apart: A State-by-State Analysis of Income Trends,” November 15, 2012.
13Chart credit: Center on Budget and Policy Priorities and Economic Policy Institute, “Pulling Apart: A State-by-State Analysis of Income Trends,” November 15, 2012.
14
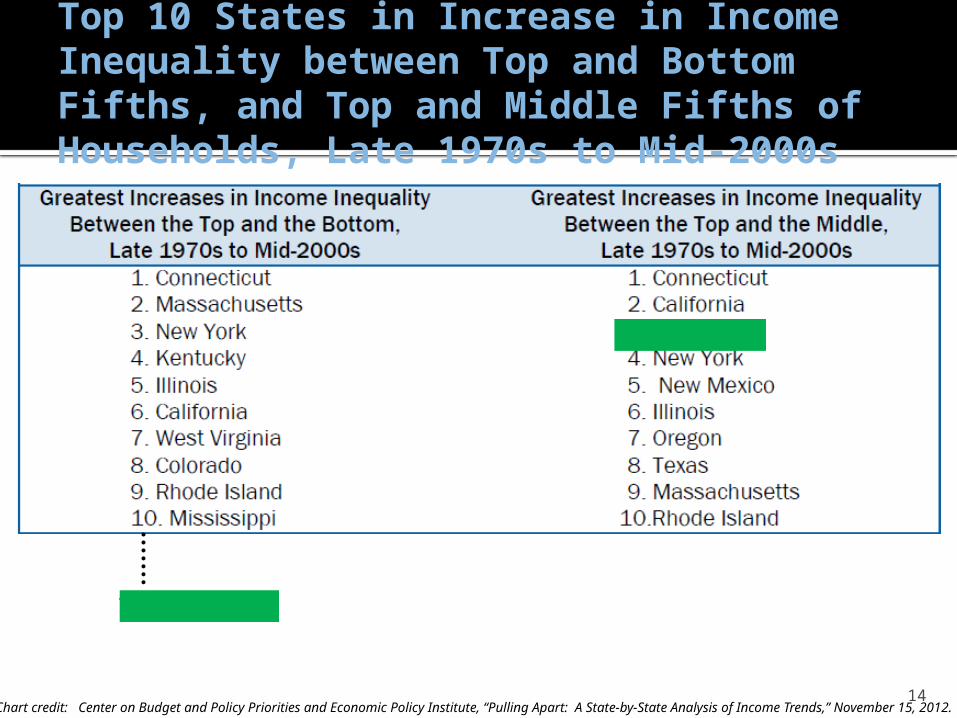
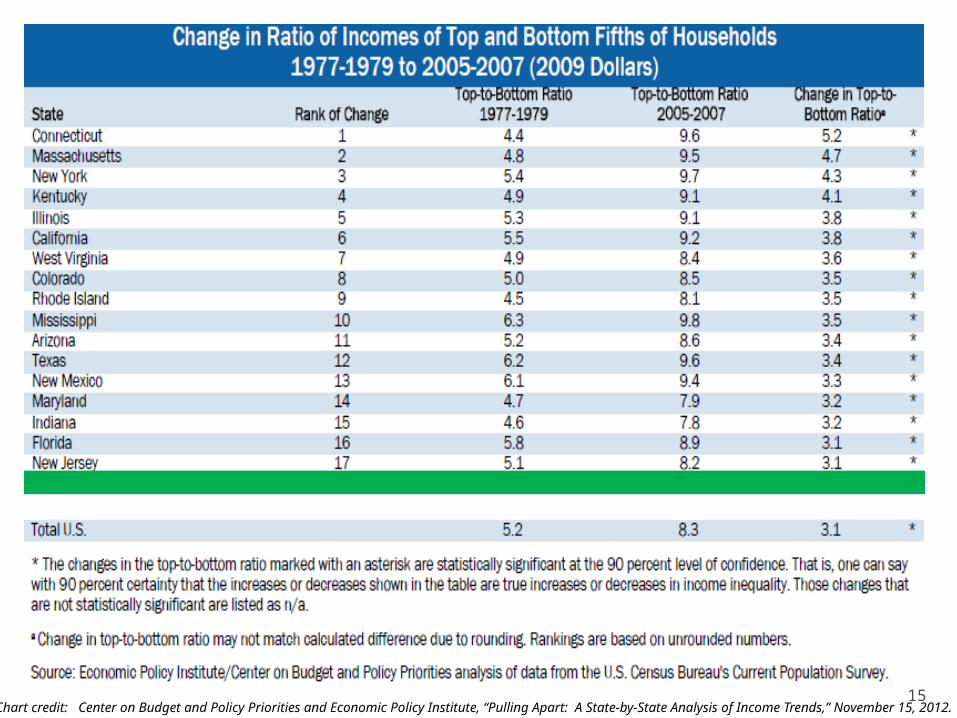
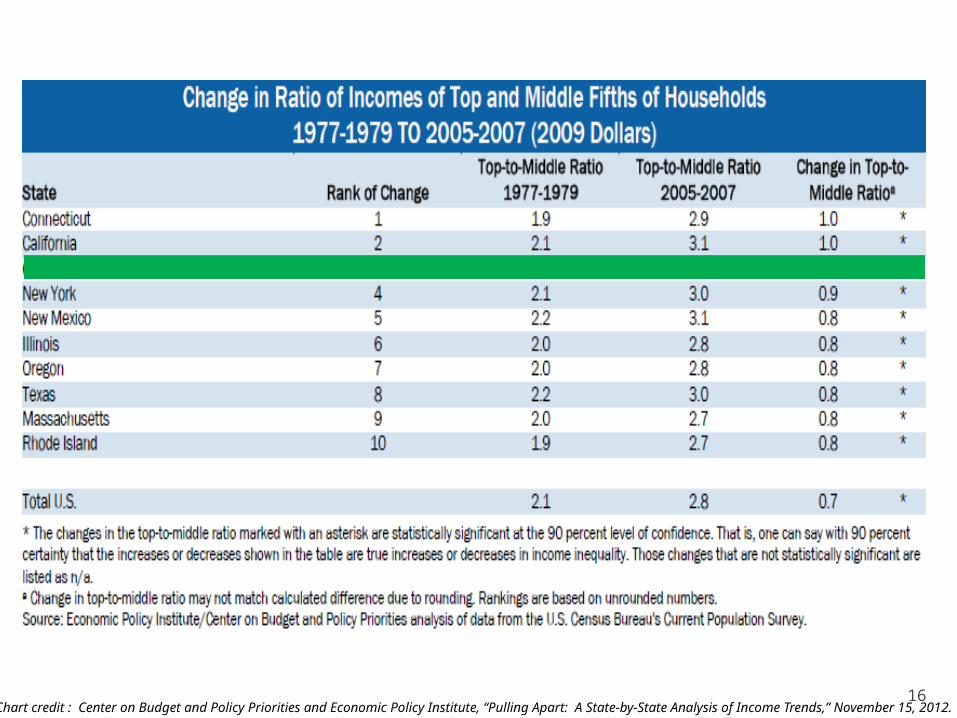
18. Oklahoma
Top 10 States in Increase in Income Inequality between Top and Bottom Fifths, and Top and Middle Fifths of Households, Late 1970s to Mid-2000s
Chart credit: Center on Budget and Policy Priorities and Economic Policy Institute, “Pulling Apart: A State-by-State Analysis of Income Trends,” November 15, 2012.
15Chart credit: Center on Budget and Policy Priorities and Economic Policy Institute, “Pulling Apart: A State-by-State Analysis of Income Trends,” November 15, 2012.
16Chart credit : Center on Budget and Policy Priorities and Economic Policy Institute, “Pulling Apart: A State-by-State Analysis of Income Trends,” November 15, 2012.
17
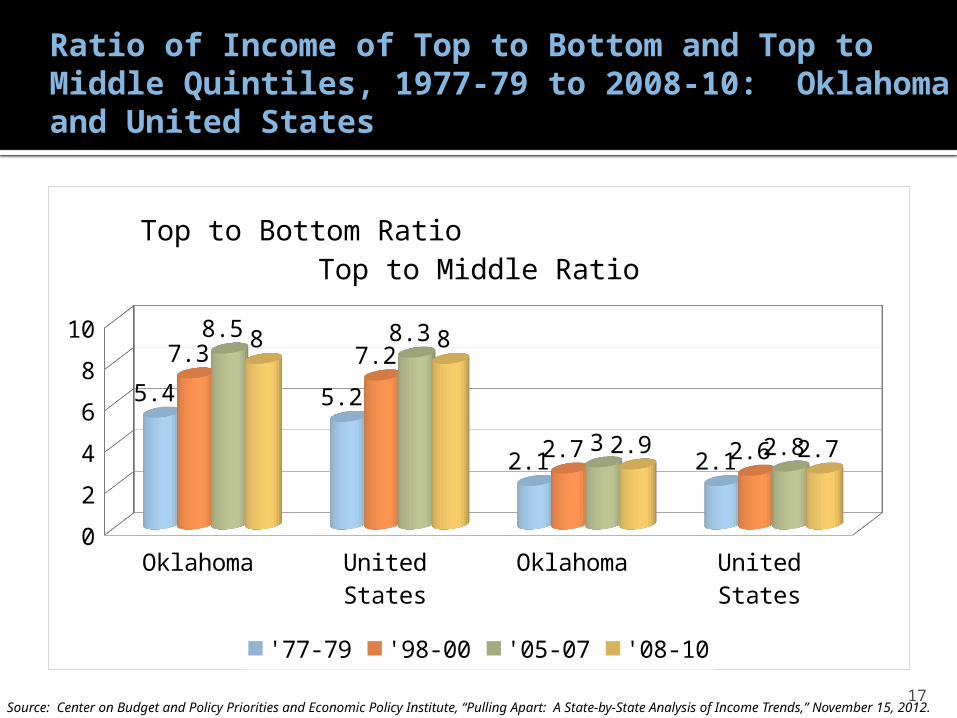
Ratio of Income of Top to Bottom and Top to Middle Quintiles, 1977-79 to 2008-10: Oklahoma and United States
Oklahoma United States Oklahoma United States0123456789
5.4 5.2
2.1 2.1
7.3 7.2
2.7 2.6
8.5 8.3
3 2.8
8 8
2.9 2.7
Top to Bottom Ratio Top to Middle Ratio
'77-79 '98-00 '05-07 '08-10
Source: Center on Budget and Policy Priorities and Economic Policy Institute, “Pulling Apart: A State-by-State Analysis of Income Trends,” November 15, 2012.

18Chart credit : Economic Policy Institute, “Charting the State of the U.S. Economy: EPI’s Top Charts of 2012.”
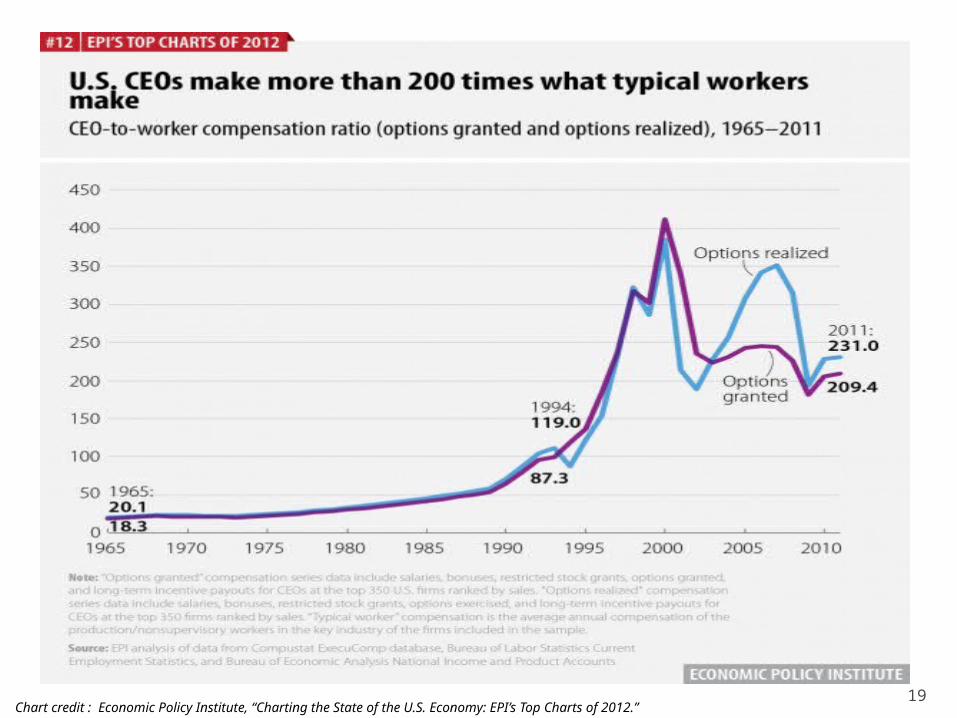
19Chart credit : Economic Policy Institute, “Charting the State of the U.S. Economy: EPI’s Top Charts of 2012.”
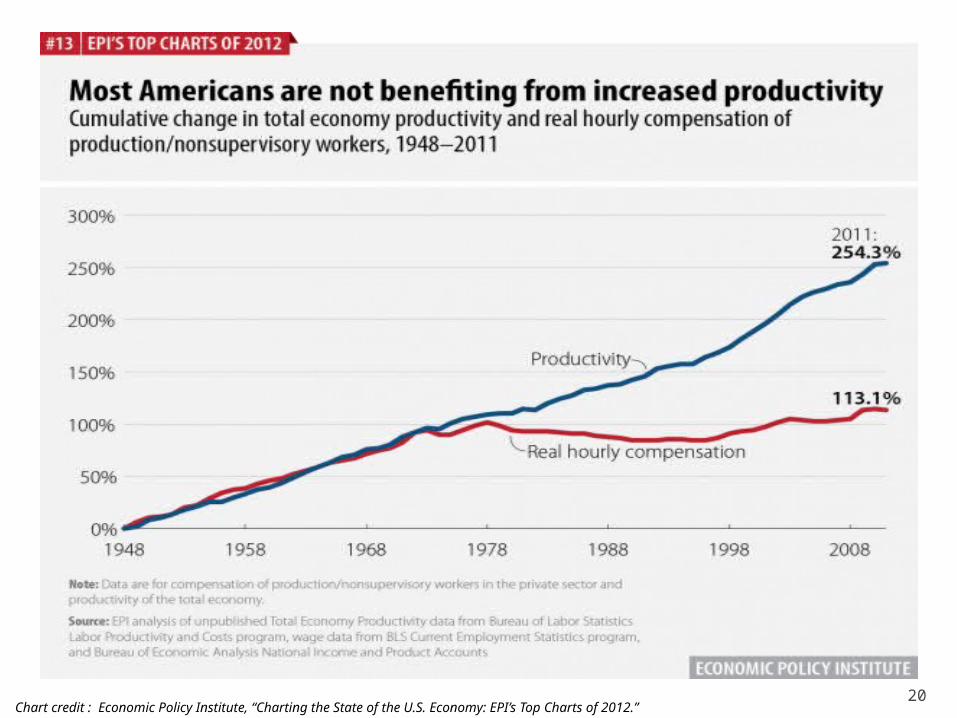
20Chart credit : Economic Policy Institute, “Charting the State of the U.S. Economy: EPI’s Top Charts of 2012.”
21
Changes in Household Income and WagesUnited States and Oklahoma

22Source: Center on Budget and Policy Priorities and Economic Policy Institute, “Pulling Apart: A State-by-State Analysis of Income Trends,” November 15, 2012.
Real Growth of Hourly Wages by Percentile, 2007-2011: United States
10th 20th Median 80th 90th
-4.0%
-3.5%
-3.0%
-2.5%
-2.0%
-1.5%
-1.0%
-0.5%
0.0%
0.5%
1.0%
-3.4%
-3.9%
-2.0%
1.0%0.7%
23
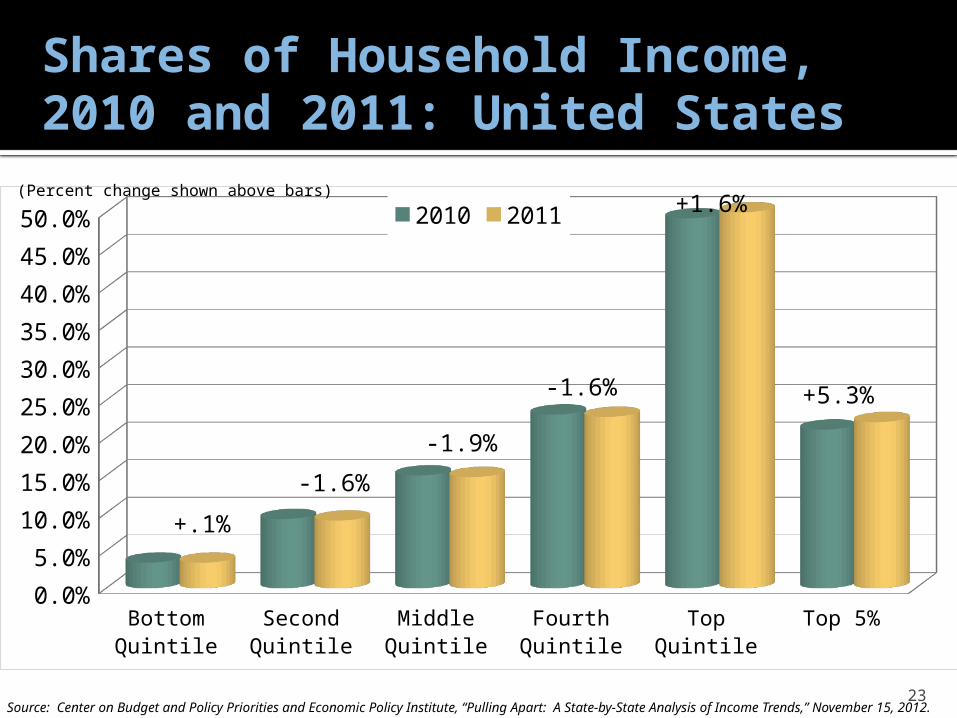
Shares of Household Income, 2010 and 2011: United States
Botto
m Q
uint
ile
Seco
nd Q
uint
ile
Middle
Quint
ile
Four
th Q
uint
ile
Top
Quint
ile
Top
5%0.0%5.0%
10.0%15.0%20.0%25.0%30.0%35.0%40.0%45.0%50.0% 2010 2011
Source: Center on Budget and Policy Priorities and Economic Policy Institute, “Pulling Apart: A State-by-State Analysis of Income Trends,” November 15, 2012.
+.1%
-1.6%
-1.9%
-1.6%
+1.6%
+5.3%
(Percent change shown above bars)
24
'77-79 '98-00 '05-07 '08-10 '77-79 '98-00 '05-07 '08-10 $-
$20,000
$40,000
$60,000
$80,000
$100,000
$120,000
$140,000
$160,000
$180,000
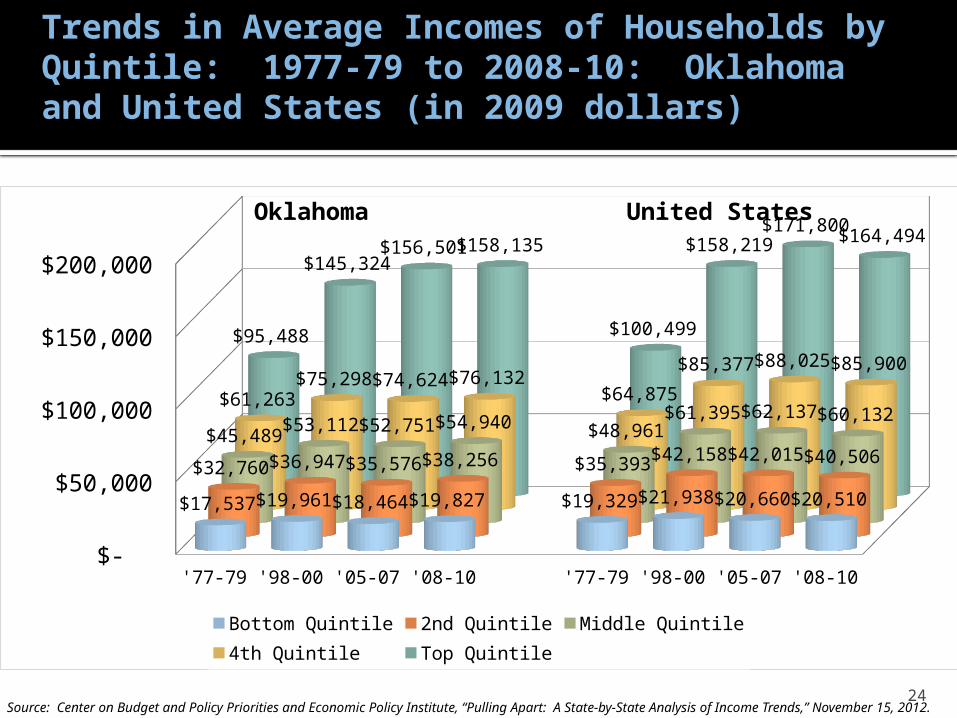
$17,537 $19,961 $18,464 $19,827 $19,329 $21,938 $20,660 $20,510
$32,760 $36,947 $35,576 $38,256 $35,393 $42,158 $42,015 $40,506
$45,489 $53,112 $52,751 $54,940
$48,961 $61,395 $62,137 $60,132
$61,263 $75,298 $74,624 $76,132
$64,875
$85,377 $88,025 $85,900
$95,488
$145,324 $156,501 $158,135
$100,499
$158,219 $171,800
$164,494
Bottom Quintile 2nd Quintile Middle Quintile 4th Quintile Top Quintile
Source: Center on Budget and Policy Priorities and Economic Policy Institute, “Pulling Apart: A State-by-State Analysis of Income Trends,” November 15, 2012.
Trends in Average Incomes of Households by Quintile: 1977-79 to 2008-10: Oklahoma and United States (in 2009 dollars)
Oklahoma United States
25
'77-79 '98-00 '05-07 '08-10 '77-79 '98-00 '05-07 '08-10 $-
$50,000
$100,000
$150,000
$200,000
$250,000
$300,000
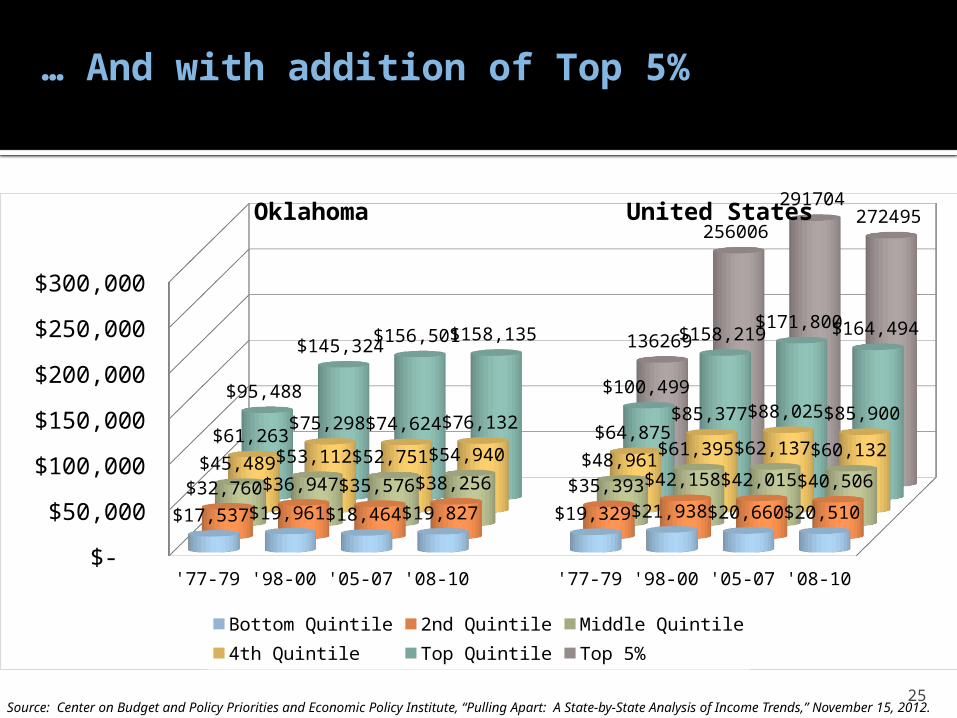
$17,537 $19,961 $18,464 $19,827 $19,329 $21,938 $20,660 $20,510 $32,760 $36,947 $35,576 $38,256 $35,393 $42,158 $42,015 $40,506
$45,489 $53,112 $52,751 $54,940 $48,961 $61,395 $62,137 $60,132
$61,263 $75,298 $74,624 $76,132
$64,875 $85,377 $88,025 $85,900
$95,488
$145,324 $156,501 $158,135
$100,499
$158,219 $171,800 $164,494
136269
256006
291704272495
Bottom Quintile 2nd Quintile Middle Quintile4th Quintile Top Quintile Top 5%
Source: Center on Budget and Policy Priorities and Economic Policy Institute, “Pulling Apart: A State-by-State Analysis of Income Trends,” November 15, 2012.
… And with addition of Top 5%
Oklahoma United States
26
Oklahoma United States $-
$20,000
$40,000
$60,000
$80,000
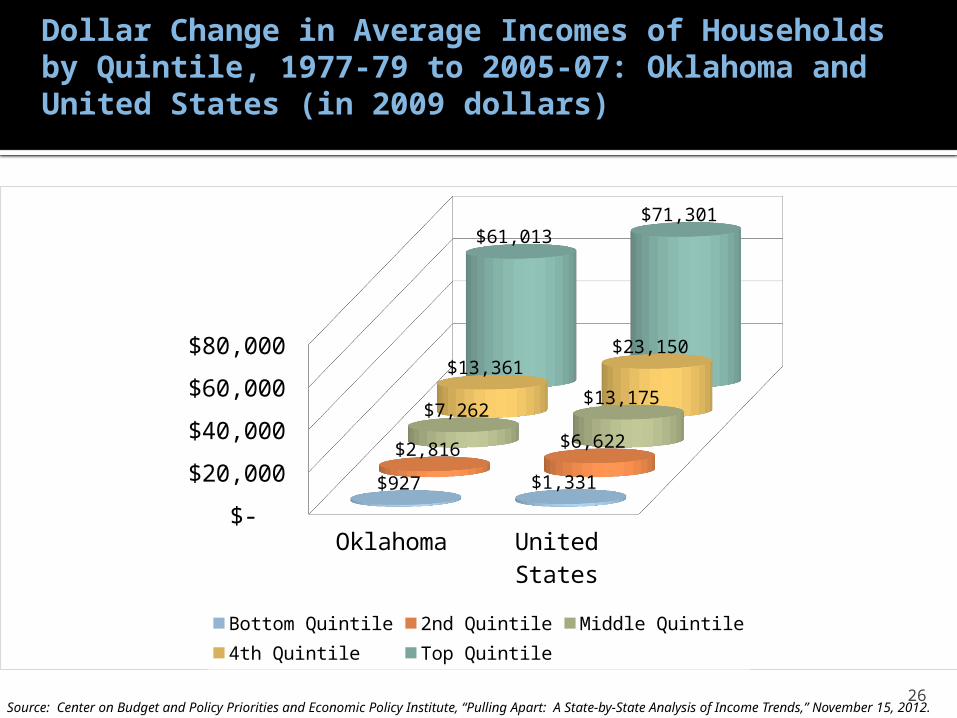
$927 $1,331
$2,816 $6,622
$7,262 $13,175
$13,361 $23,150
$61,013 $71,301
Bottom Quintile 2nd Quintile Middle Quintile 4th Quintile Top Quintile
Source: Center on Budget and Policy Priorities and Economic Policy Institute, “Pulling Apart: A State-by-State Analysis of Income Trends,” November 15, 2012.
Dollar Change in Average Incomes of Households by Quintile, 1977-79 to 2005-07: Oklahoma and United States (in 2009 dollars)

27
Oklahoma United States
$-
$50,000
$100,000
$150,000
$200,000
$927 $1,331
$2,816 $6,622 $7,262 $13,175
$13,361 $23,150
$61,013 $71,301
$155,435
Bottom Quintile 2nd Quintile Middle Quintile4th Quintile Top Quintile Top 5%
Source: Center on Budget and Policy Priorities and Economic Policy Institute, “Pulling Apart: A State-by-State Analysis of Income Trends,” November 15, 2012.
… And with addition of Top 5%
28
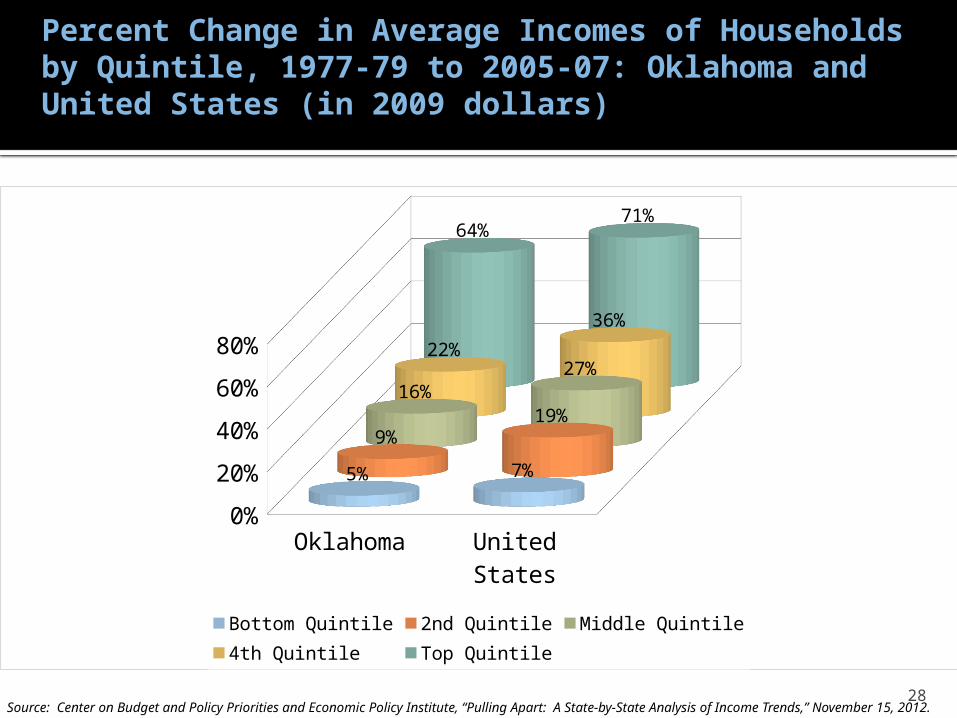
Oklahoma United States0%
20%
40%
60%
80%
5% 7%
9%19%
16%
27%22%
36%
64%71%
Bottom Quintile 2nd Quintile Middle Quintile 4th Quintile Top Quintile
Source: Center on Budget and Policy Priorities and Economic Policy Institute, “Pulling Apart: A State-by-State Analysis of Income Trends,” November 15, 2012.
Percent Change in Average Incomes of Households by Quintile, 1977-79 to 2005-07: Oklahoma and United States (in 2009 dollars)
29
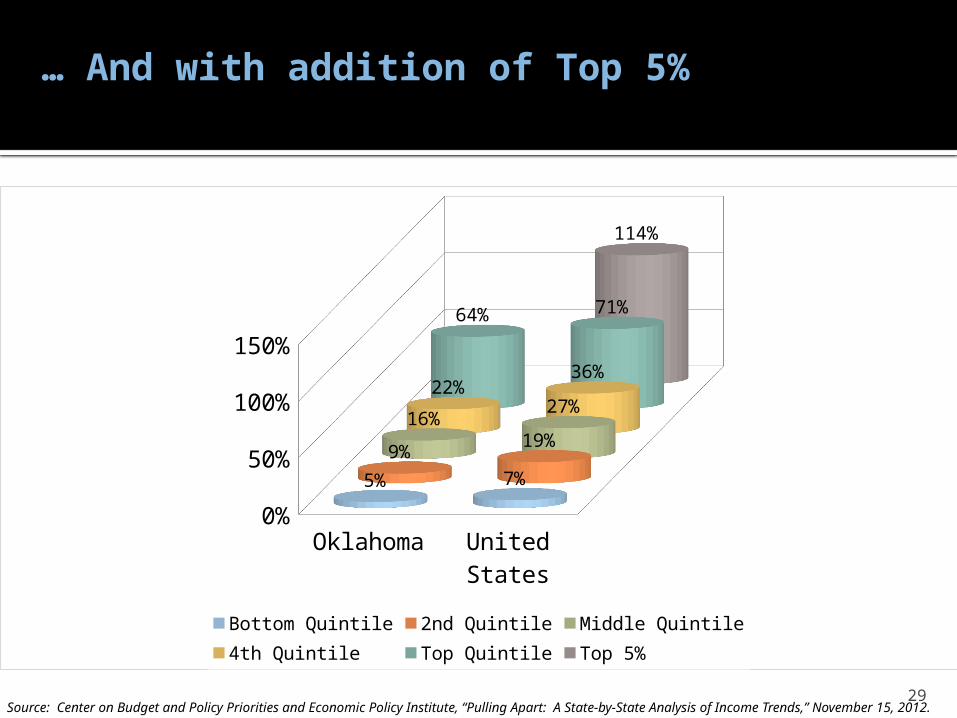
Oklahoma United States
0%20%40%60%80%
100%120%
5% 7%
9%19%
16%27%
22%36%
64% 71%
114%
Bottom Quintile 2nd Quintile Middle Quintile4th Quintile Top Quintile Top 5%
Source: Center on Budget and Policy Priorities and Economic Policy Institute, “Pulling Apart: A State-by-State Analysis of Income Trends,” November 15, 2012.
… And with addition of Top 5%
30
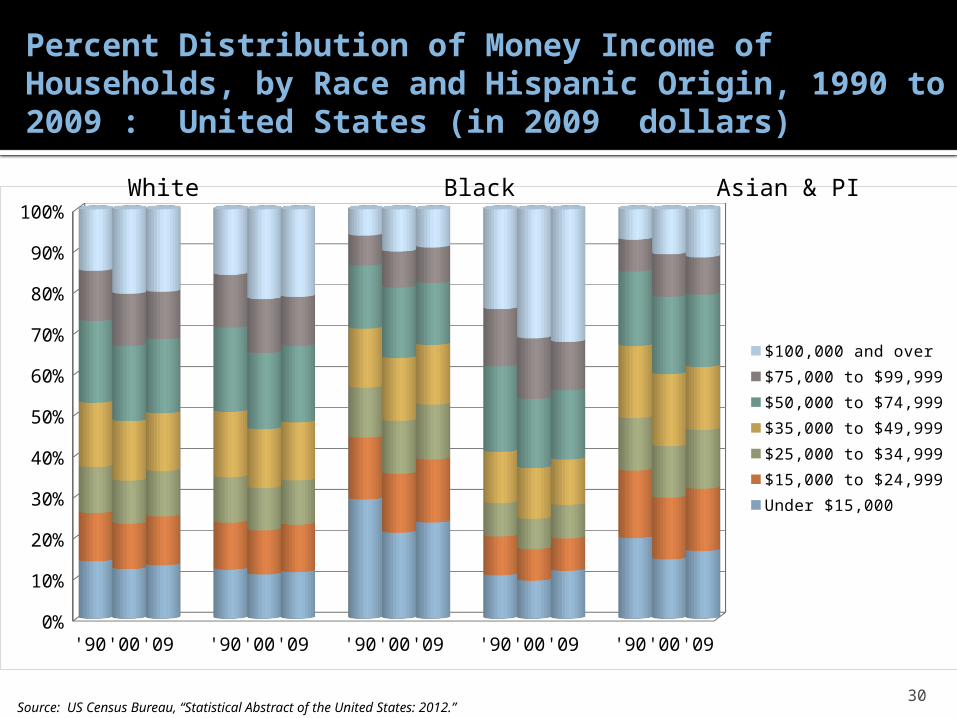
Percent Distribution of Money Income of Households, by Race and Hispanic Origin, 1990 to 2009 : United States (in 2009 dollars)
'90 '00 '09 '90 '00 '09 '90 '00 '09 '90 '00 '09 '90 '00 '090%
10%
20%
30%
40%
50%
60%
70%
80%
90%
100%
$100,000 and over$75,000 to $99,999$50,000 to $74,999$35,000 to $49,999$25,000 to $34,999$15,000 to $24,999Under $15,000
All White Black Asian & PI Hispanic
Source: US Census Bureau, “Statistical Abstract of the United States: 2012.”
31
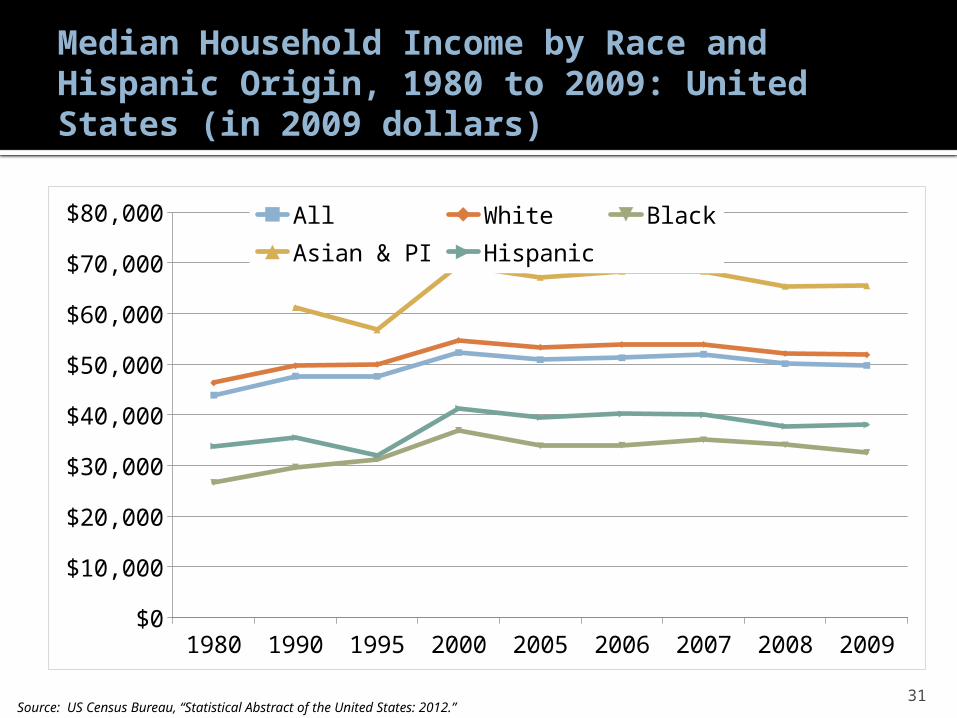
Median Household Income by Race and Hispanic Origin, 1980 to 2009: United States (in 2009 dollars)
1980 1990 1995 2000 2005 2006 2007 2008 2009$0
$10,000
$20,000
$30,000
$40,000
$50,000
$60,000
$70,000
$80,000 All White BlackAsian & PI Hispanic
Source: US Census Bureau, “Statistical Abstract of the United States: 2012.”
32
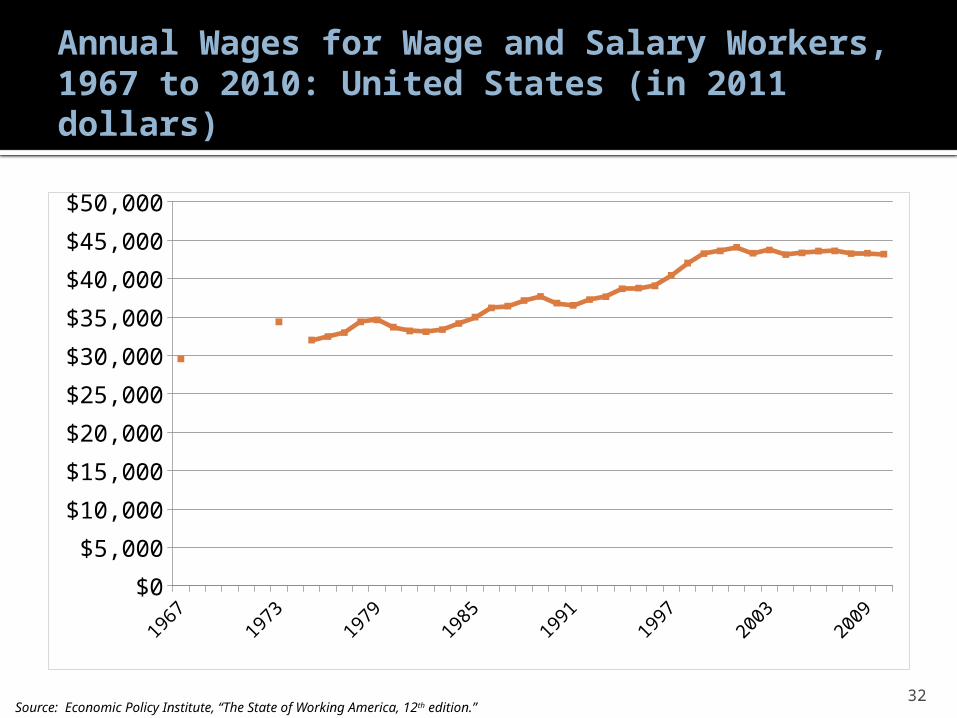
Annual Wages for Wage and Salary Workers, 1967 to 2010: United States (in 2011 dollars)
1967
1973
1975
1977
1979
1981
1983
1985
1987
1989
1991
1993
1995
1997
1999
2001
2003
2005
2007
2009
$0
$5,000
$10,000
$15,000
$20,000
$25,000
$30,000
$35,000
$40,000
$45,000
$50,000
Source: Economic Policy Institute, “The State of Working America, 12th edition.”
33
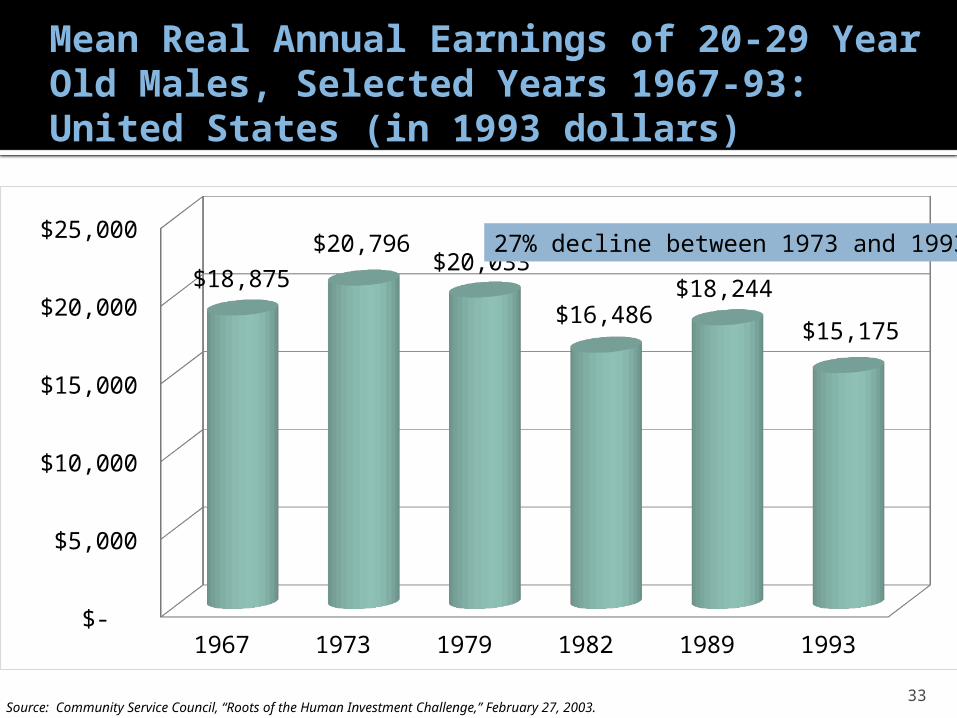
Mean Real Annual Earnings of 20-29 Year Old Males, Selected Years 1967-93: United States (in 1993 dollars)
1967 1973 1979 1982 1989 1993 $-
$5,000
$10,000
$15,000
$20,000
$25,000
$18,875
$20,796 $20,033
$16,486 $18,244
$15,175
Source: Community Service Council, “Roots of the Human Investment Challenge,” February 27, 2003.
27% decline between 1973 and 1993
34
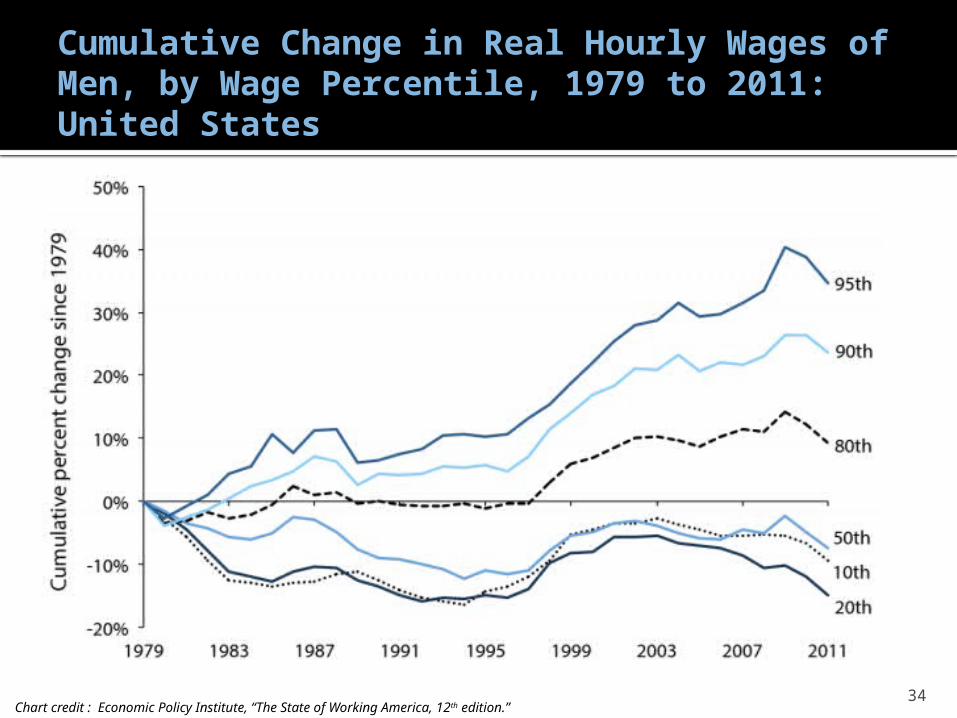
Cumulative Change in Real Hourly Wages of Men, by Wage Percentile, 1979 to 2011: United States
Chart credit : Economic Policy Institute, “The State of Working America, 12th edition.”
35
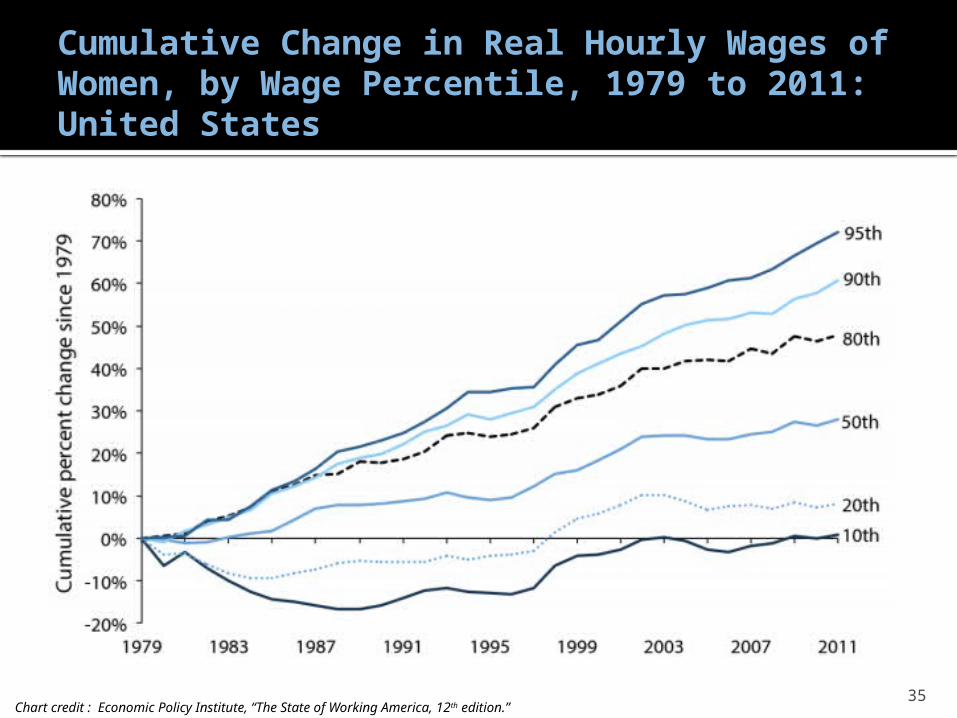
Cumulative Change in Real Hourly Wages of Women, by Wage Percentile, 1979 to 2011: United States
Chart credit : Economic Policy Institute, “The State of Working America, 12th edition.”

36
Share of Total Annual Wages Received by Top Earners, 1947 to 2010: United States
Chart credit : Economic Policy Institute, “The State of Working America, 12th edition.”
37
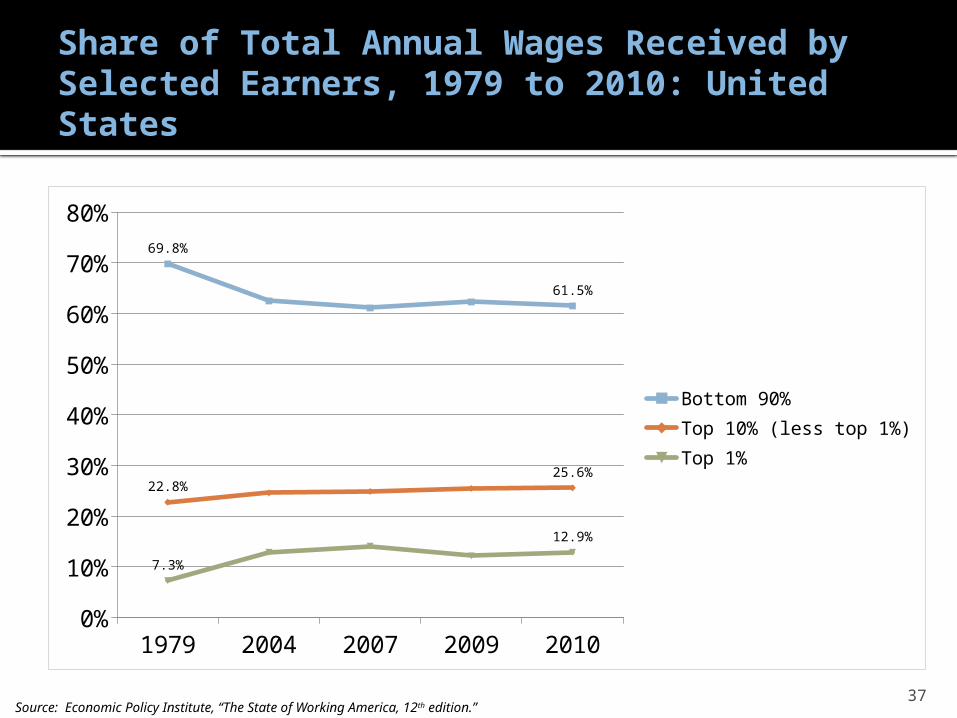
Share of Total Annual Wages Received by Selected Earners, 1979 to 2010: United States
1979 2004 2007 2009 20100%
10%
20%
30%
40%
50%
60%
70%
80%69.8%
61.5%
22.8%25.6%
7.3%
12.9%
Bottom 90%Top 10% (less top 1%)Top 1%
Source: Economic Policy Institute, “The State of Working America, 12th edition.”
38
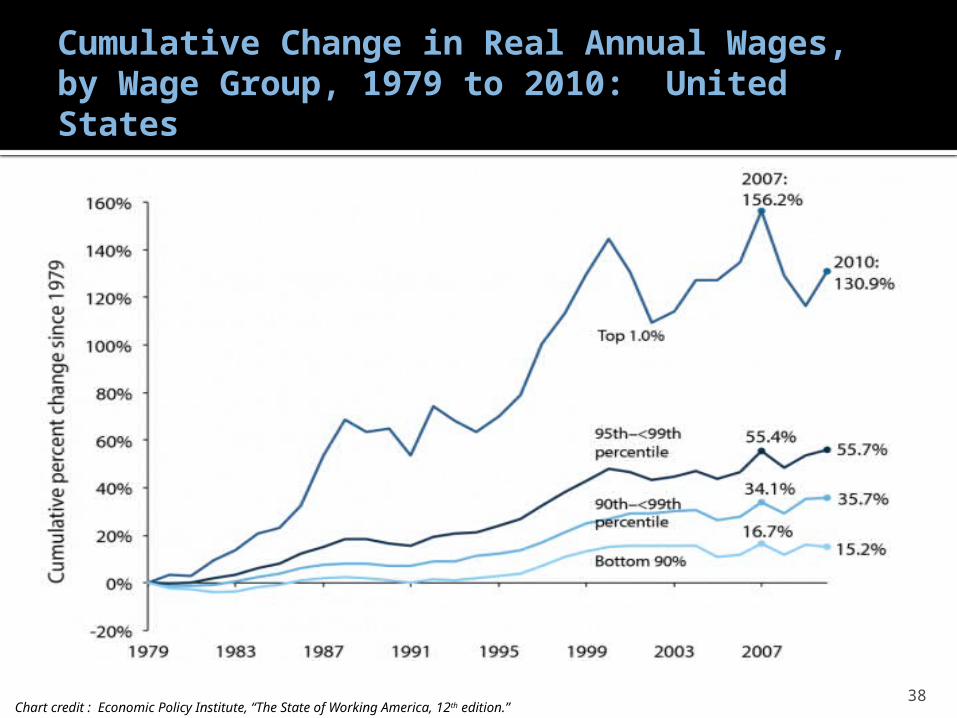
Cumulative Change in Real Annual Wages, by Wage Group, 1979 to 2010: United States
Chart credit : Economic Policy Institute, “The State of Working America, 12th edition.”

39
Impact of Recession
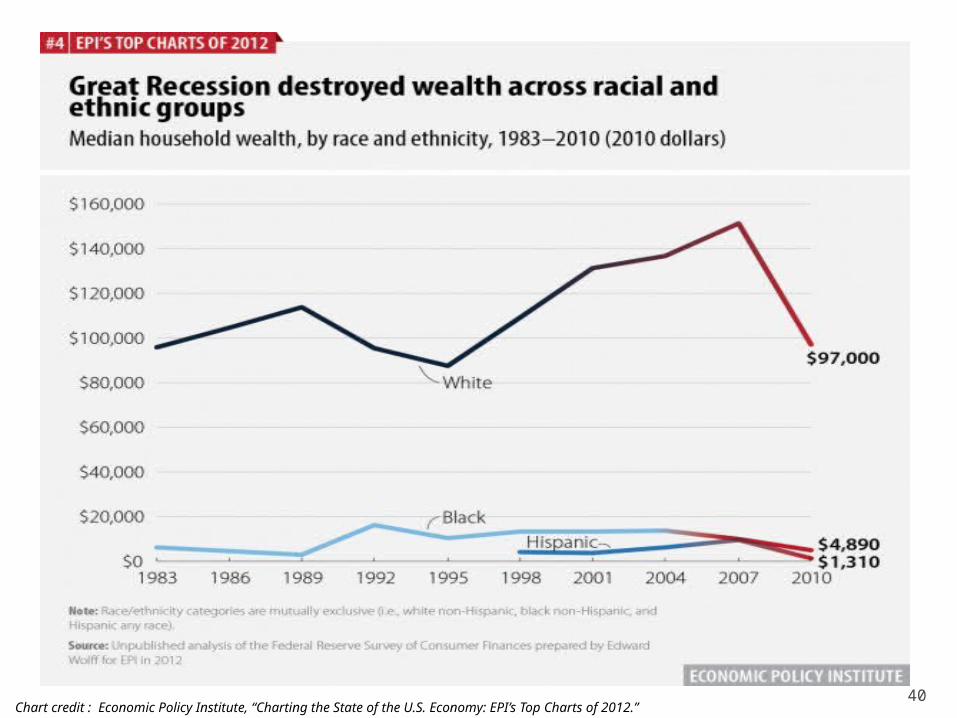
40Chart credit : Economic Policy Institute, “Charting the State of the U.S. Economy: EPI’s Top Charts of 2012.”
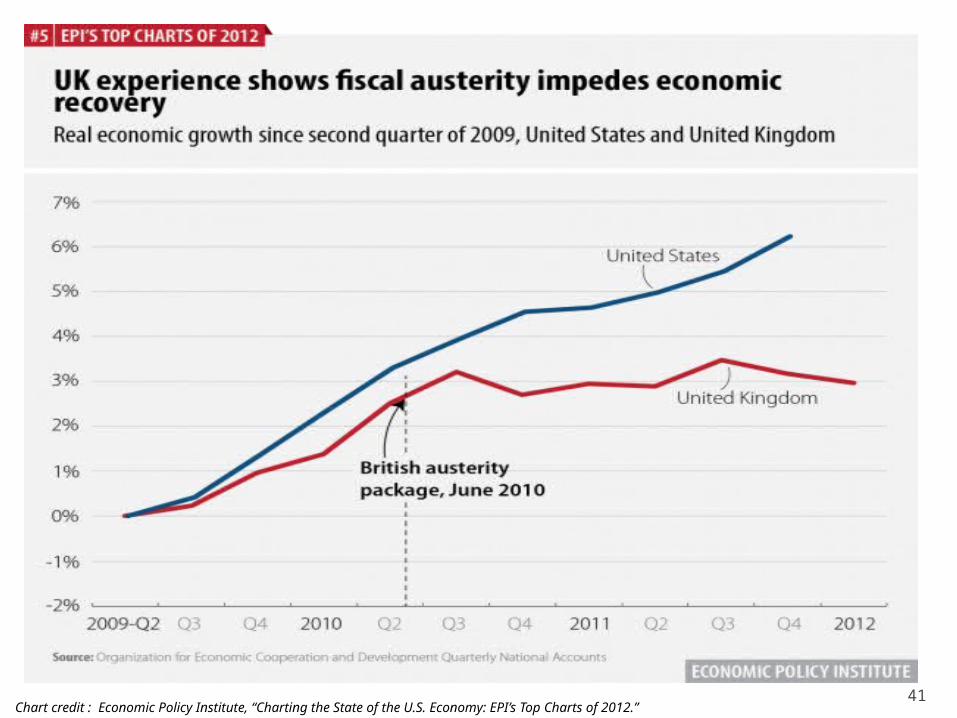
41Chart credit : Economic Policy Institute, “Charting the State of the U.S. Economy: EPI’s Top Charts of 2012.”