Embed Size (px)
Citation preview
PRELIMINARY DRAFT: DO NOT QUOTEWITHOUT PERMISSION OF AUTHORS
Income Inequality and Health: a Longitudinal Analysis
Dean R. Lillard and Richard V. BurkhauserCornell University and DIW
paper prepared for theJoint EPUNet-2003 and BHPS-2003
3-5 July 2003Colchester, United Kingdom
Corresponding author:Dean R. LillardDepartment of Policy Analysis and Management247 MVR HallCornell UniversityIthaca, NY 14853-4401USA
Tel. (607) 255-9290FAX (607) 255-4071E-mail [email protected]
AcknowledgementsThis research has been supported by the National Institutes on Aging grant 1R03AG21009-01. Shanze Huang provided valuable research assistance.

AbstractIn this study we use panel data from Great Britain and the United States to investigate whetherindividual self-reported health varies systematically with the degree of income inequality theyexperience at particular ages. We also investigate whether self-reported health is correlated withthe household income individuals experienced on average over their lifetimes. We find noevidence in either our British or US samples that links self-reported health status to incomeinequality. On the other hand, we find strong evidence that income is strongly associated withhealth status in a surprisingly similar way in the two countries.

1
INTRODUCTION
Since Preston (1975) observed that life-expectancy is higher in countries with greater
income per capita and that the degree of association falls as income per head increases, much
attention has been devoted to understanding the relationship between income and health. In the
economic framework, health is characterized as part of the human capital individuals accumulate.
Income is linked to health in a production function framework but many economists observe the
difficultly in trying to distinguish the extent to which health causes income from the extent to
which income causes health. In another strand of literature, much attention has been devoted to
observations about the correlation between inequality in the distribution of income and average
health in and across countries. Many public health researchers find a negative correlation
between the extent of income inequality in a country and the average health of the country’s
population. Often this finding is cited as evidence of a need for stronger income redistribution
policies. Advocates of this position point to recent papers that have found statistically significant
correlations between inequality and health that suggest that lower income inequality is associated
with improved population health. Researchers have considered measures population health such
as infant mortality (Rodgers, 1979; Flegg, 1982; Waldman, 1992; Wennemo, 1993), average life
expectancy (Wilkinson 1986, 1990, 1992, 1993), average age at death (Le Grand, 1987), total
mortality (Kennedy et al. 1996a, 1996b; Lynch et al. 1998; Smith et al. 2002), cause-specific
mortality (Kennedy et al. 1996a, 1996b), and self-reported health (Kennedy et al. 1998).
Despite the similar pattern of association identified in these studies, the interpretation and
robustness of the identified relationships in all of the studies have been criticized on both
technical and methodological grounds. On technical grounds there have been several studies that
2
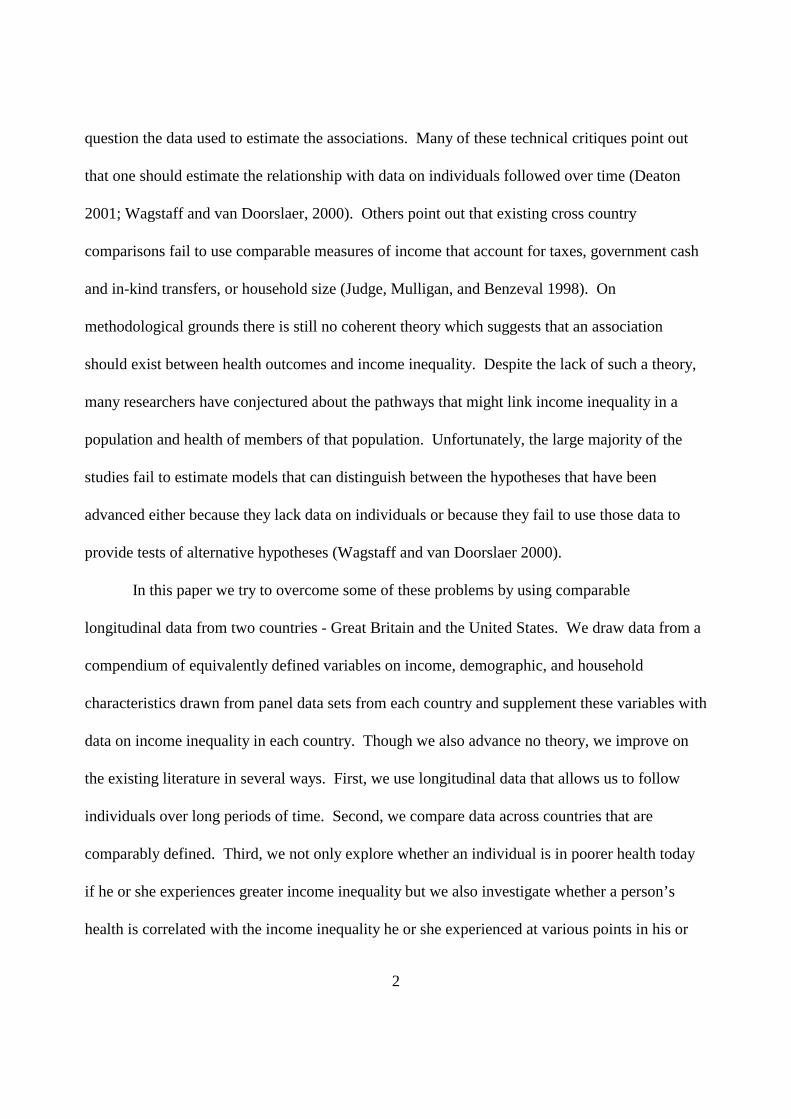
question the data used to estimate the associations. Many of these technical critiques point out
that one should estimate the relationship with data on individuals followed over time (Deaton
2001; Wagstaff and van Doorslaer, 2000). Others point out that existing cross country
comparisons fail to use comparable measures of income that account for taxes, government cash
and in-kind transfers, or household size (Judge, Mulligan, and Benzeval 1998). On
methodological grounds there is still no coherent theory which suggests that an association
should exist between health outcomes and income inequality. Despite the lack of such a theory,
many researchers have conjectured about the pathways that might link income inequality in a
population and health of members of that population. Unfortunately, the large majority of the
studies fail to estimate models that can distinguish between the hypotheses that have been
advanced either because they lack data on individuals or because they fail to use those data to
provide tests of alternative hypotheses (Wagstaff and van Doorslaer 2000).
In this paper we try to overcome some of these problems by using comparable
longitudinal data from two countries - Great Britain and the United States. We draw data from a
compendium of equivalently defined variables on income, demographic, and household
characteristics drawn from panel data sets from each country and supplement these variables with
data on income inequality in each country. Though we also advance no theory, we improve on
the existing literature in several ways. First, we use longitudinal data that allows us to follow
individuals over long periods of time. Second, we compare data across countries that are
comparably defined. Third, we not only explore whether an individual is in poorer health today
if he or she experiences greater income inequality but we also investigate whether a person’s
health is correlated with the income inequality he or she experienced at various points in his or
3
her lifetime. Finally, we construct tests that can, in principle reject one or more of the hypotheses
currently circulating in this literature.
BACKGROUND
Studies that find that greater income inequality is associated with poorer health suffer
from a common set of data deficiencies. The majority use aggregate cross sectional data at levels
ranging from metropolitan areas to whole countries to compare health and income inequality
measured in the same time period. In the studies that compare inequality and health across
countries, industrially developing countries are treated as identical observations as industrially
developed countries (i.e. as having been drawn from the same underlying distribution). The
validity of this assumption is weak when one acknowledges that no account is taken of changes
in or access to medical technology across time. Since the years surveyed in the cross country
studies vary over as much as 21 years it is less plausible to assume a common underlying
distribution or process linking the distribution of income and health. Finally, in every study the
set of factors included to control for other determinants of health outcomes is disturbingly sparse.
Numerous researchers have carefully examined the data used in the above studies and
have raised the above and other criticisms that question the robustness of the finding that greater
income inequality Aproduces@ poorer health and higher infant and adult mortality. Judge (1995)
notes that the statistically significant and much cited associations between income inequality and
life expectancy reported in Wilkinson (1992) ceases to be significant after one corrects for
computational errors and questionable measures of the income distribution. While Le Grand
(1987) finds in his cross country analysis that health inequality is lower when the poorest 20
percent of a country=s population gets more of national income, he is quite careful to note that

4
poor data and small sample sizes provide ample reason to be cautious about interpreting the
association (he also carefully notes that no causality can be assigned). In their review of the cross
country empirical evidence linking income inequality and health Judge, Mulligan, and Benzeval
(1998, page 578) conclude that A... statistically significant associations between income
inequality and population health in the developed world are anything but secure...@ They also
conclude that their findings Arepresent a serious challenge to those who believe that the
relationship is a very powerful one.@
In a subset of the studies, researchers focus their analysis on a single country (Fiscella and
Franks 2000; Kennedy, Kawachi, and Prothrow-Stith 1996a, 1996b; Kawachi and Kennedy
1997; Kaplan et al. 1996; Shi et al. 1999; Soobadeer and LeClere 1999). Mellor and Milyo
(2001, 2002) note that the associations in almost all of these studies are based on income
inequality and health outcomes measured in a single year (1990) and that the associations
generally become statistically insignificant when controls are added for either regional or state
level spending on health care. In studies that include measures of individual and family
characteristics, no association remains between income inequality and adult mortality (Mellor
and Milyo 2001, 2002; Fiscella and Franks 1997, 2000; Daly et al. 1998), infant mortality or low
birthweight (Meara 1999).1 Fiscella and Franks (2000) do find some evidence of a significant
correlation between income inequality (measured at the community level) and self-rated
psychological health. While the above mentioned studies used individual data from US
residents, Deaton and Paxson (2001b) not only found no association between income inequality
1Daly et al. (1998) find some evidence of a link between income inequality and individual
mortality but only for non elderly individuals with middle class incomes (and only in 1990).

5
and mortality using individual data from Britain, they also found no clear evidence linking
income and cohort mortality rates using either British or US data.
Finally one should note that many researchers in this literature conjecture that a person=s
health is mostly a function of the position one occupies in the social order of the society
(Wilkinson 1996). Proponents of this hypothesis frequently point to studies of social order in
laboratory and wild animal populations that suggest that social rank is correlated with health.
This literature documents that animals occupying lower positions in social orders are found to
have worse health and to be less responsive to levels of glucocorticoid hormones (e.g.
dexamethasone) that the body releases as a response to stress (Sapolsky, Alberts, and Altmann
1997; Shively and Clarkson 1994).
Across such studies, however, the direction of the relationship is not so clear nor is there
compelling evidence that such patterns will be observed in humans. For example, laboratory
studies of rats subjected to chronic social stress found that rats lower in the social order have
lower phsyical responses to stress. These lower responding rats had fewer corticotropin-releasing
factor mRNA (CRF) grains per cell in the paraventricular hypothalamic nucleus (Albeck et al.
1997). There is evidence that CRF affects the cardiovascular system, the autonomic nervous
system, behavior, depressive illnesses and anxiety disorders. However these studies find that
only some portion of the rats of lower social order responded less well to stress (CIBA
Foundation 2002). Recent meta analysis of the literature studying stress and social rank in
primate societies identifies no consistent relationship between stress in subordinate members of a
group and physiological or pathopsychological consequences (Abbott et al. 2003). In particular
the authors find evidence that the consequences of stress depend not only on the frequency or

6
severity of the stress but also on the availability and efficacy of coping responses. They further
find that the availability and efficacy of coping responses varies quite a bit across primate
groupings. Thus, no clear mechanism links social position and health outcomes in primates.
HYPOTHESES/FRAMEWORK
Although there is, as yet, no fully specified theory that links behavior of individuals to
population (community) income inequality and health, a number of hypotheses have been
advanced about possible mechanisms. The several hypotheses are nicely summarized in the
literature review by Wagstaff and van Doorslaer (2000). We summarize their review here and
refer the reader to their study.
Absolute income hypothesis (poverty hypothesis)2
Each of these hypotheses ultimately appeals to a concave relationship between
individual income and individual health. This relationship, noted by Rodgers (1979), assumes
that health increases in smaller and smaller increments with each additional dollar of income.
One can generate such a result either by assuming that individuals assign declining marginal
utility to additional units of health or that there are diminishing returns in the production of
health with respect to income (or health inputs purchased with income). In either case, when
individual incomes are aggregated to a community or population level, average income and
income inequality matter for the production of health. The concavity of the health production
function means that a dollar transferred from a rich person to a poorer person raises average
health. Thus, holding average income of community or population constant, lower income
2We subsume Wagstaff and van Doorslaer=s Adeprivation@ hypothesis into the absolute
income hypothesis because it is essentially a conjecture about a particular form of a non linearrelationship between absolute income and health.

7
inequality should be associated with higher average health.
Relative income hypothesis
Individual health is assumed to be determined by a person=s income relative to the
average income in the community or population. Thus, if a person=s absolute income remains
constant while the overall distribution shifts upwards, a person will be in worse health. An
association between relative income and health might arise, for example, if the general rise in
incomes leads to a general rise in prices - including the cost of medical care. Individuals whose
incomes remain constant in absolute terms suffer a reduction in their power to purchase medical
care and thus purchase fewer health inputs.
Deaton (2001) has advanced a variant of the relative income hypothesis in which he
posits that health is determined only by relative income within some reference group. This
hypothesis is less easy to motivate on economic grounds but, under certain conditions, it yields
possible statistical explanations for the presence of zero correlation between income inequality
and health for a whole society together with a strong correlation between health and income
inequality within groups in a society.
Relative position hypothesis
Another hypothesis linking income distributions and health posits that a person=s health
is mostly a function of the position one occupies in the social order of the society (Evans, Barer,
and Marmor, 1994; Wilkinson 1996). This hypothesis requires a different metric than simply
income as social position may not vary one-for-one with income. Similar to the relative income
hypothesis, the choice of reference group is also unclear. It is not clear, for example whether an
individual=s health is a function of his or her position relative to a group as small as the members

8
of a local church or as large as the population of a nation. As noted above, Deaton (2001)
observes that the size of the reference groups matters because there may be zero correlation
between relative position and health in a large population while the correlation between health
and relative position may be statistically different from zero in smaller reference groups.
Income inequality hypothesis
Finally, several articles have posited that health is functionally related to the extent of
income inequality in a society, independent of an individual=s absolute income. While no theory
generates this hypothesis from first principles various researchers have conjectured that equal
societies are healthier because there is a) more social cohesion, b) more solidarity, c) less stress,
d) more social support, e) more social capital, f) more health inputs for the poor and g) satisfy
human=s evolved preference for fairness. (Wilkinson 1992, 1996, 2000).
A related hypothesis linking health indirectly to income inequality rests on the
assumption that societies with less equal distribution of income are more likely to have
incomplete capital markets. The logic of this hypothesis runs thus. Health is positively
correlated with human capital because more educated people produce health more efficiently.
That is, this hypothesis assumes that education determines health because people process
information more efficiently. Income inequality is correlated with health when high income
inequality reflects (is correlated with) poorly functioning capital markets. When capital markets
work imperfectly, individuals do not invest efficiently in their own human capital (or the human
capital of their children). Therefore, in less equal societies poorer people under-invest in human
capital and less human capital leads to lower average health.
Table 1 summarizes the expected association between health, absolute and relative
9
incomes of individuals, and income inequality.
DATA
To investigate the above hypotheses we use comparably defined data from a compendium
of panel studies that include data from the Canadian Survey of Labour and Income Dynamics
(SLID), Germany=s Socio-Economic Panel (GSOEP), Great Britain=s British Household Panel
Study (BHPS), and the United States Panel Study of Income Dynamics (PSID).3 This
compendium, known as the Cross-National Equivalent File (CNEF), is a joint effort of
researchers at Cornell University, Statistics Canada, the Institute for Social and Economic
Research at Essex University, the Institute for Social Research at the University of Michigan, and
the German Institute for Economic Research in Berlin.
From each wave of the BHPS and PSID we draw data on self-reported health, household
income, age (year of birth), sex, and marital status.
-Measures of income inequality
We characterize inequality in the distribution of income in several ways that vary with the
data that are available for each country. To try to increase the samples under study, we combine
estimates of income inequality for each country that are drawn from a variety of sources. This
strategy potentially introduces error into our estimated correlations because each study uses
different methods. We explore the sensitivity of our estimated correlations when we restrict our
income measures to a single source and when we mix estimates of inequality from a variety of
sources. Because we lack a long time series of consistently defined and constructed measures of
3The SLID data contain no health information and so are not used here. We also append
original PSID data from 1970-1979 to the CNEF-PSID data.
10
income inequality, both within and across countries, readers should interpret our results
cautiously.
We draw our data on inequality from various sources. Our aim in constructing the
inequality data was to compile as long a time series on inequality as we could. Whenever data
were available in multiple years, our general rule was to draw data from one source only. In the
case of the United States, some measures of income inequality were only available in intermittent
years. For example, we could find estimates of Gini coefficients for each state in the US before
1976 only for the the 1940, 1950, 1960, and 1970 decennial censuses. When faced with a choice
of multiple measures from many studies, we chose to keep estimates that were from a single
author to avoid the complicated task of having to account for differences in the methods used
across multiple studies.
Our measures of income inequality for the United States include Gini coefficients and the
ratio of aggregate income held by the richest twenty percent of households to the aggregate
income held by the poorest twenty percent of households (80-20 ratio). We currently have data
on Gini coefficients at both the national and state levels and data on the 80-20 ratio measures at
the national level only. We draw state Gini coefficients from Langer (1999) who uses the US
decennial census to construct state Gini coefficients for 1949, 1959, 1969, 1979, and 1989.
Langer (1999) also uses the Current Population Surveys to construct annual measures of state
Gini coefficients from 1976 to 1995. The data on the 80-20 ratio covers the period from 1947-
2001. We downloaded these data from the web site of the US Census Bureau
www.census.gov/hhes/income/histinc/ineqtoc.html.
We draw estimates of inequality in the distribution of income in the United Kingdom

11
from two sources. Our primary inequality measures are drawn from Goodman and Shephard
(2002).4 Goodman and Shephard use the Family Resources Survey and the Family Expenditure
Surveys to compute measures of the income shares and Gini coefficients in each year from 1961
to 2000. Income is measured at the household level and is adjusted for household size using the
McClements (1977) equivalence scale. They construct Gini coefficients and decile income
shares using income before and after accounting for housing costs. Since the US data measure
inequality in income before housing costs are deducted, we use Goodman and Shephard=s before
housing cost measures. Table 2 lists the national income inequality measures.5
METHODS
We relabel our data with reference to chronological age in order to compare the health of
each individual in our sample at similar ages. For example, for a person who turned fifty in
1991, we use his age to relabel his self-reported health status in 1991 as his health at age fifty.
We also relabel the income inequality measures by the individual=s age. We relabel our other
time varying data from calendar time to the age the individual attained in the particular year.
In pooling data on individuals of a particular age we collect together people who were
born in different years. An implicit assumption underlying this treatment of the data is that
everyone follows a common aging process that results in similar outcomes at a given age.
4These data can be downloaded at www.ifs.org.uk/inequality/bn19fits.zip.
5Langer=s (1999) estimates of state Gini coefficients can be downloaded fromwww.u.arizona.edu/~llanger/replication_datasets.htm.

12
Because individuals face different medical technologies by virtue of being born in different years,
we use year of birth to identify the birth cohort to which each person belongs.
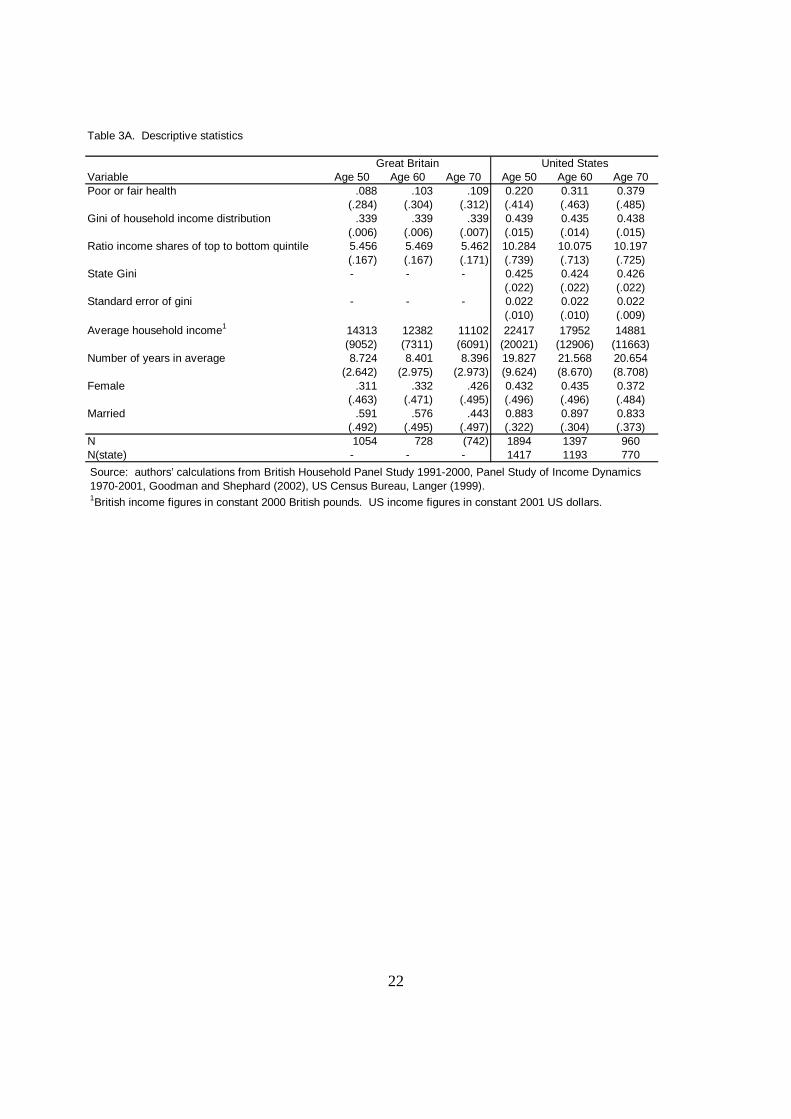
In our analyses, we focus on the self-reported health status of individuals at age 50, 60,
and 70. Our dependent variable, equals a one if a person reported himself to be in Afair@ or
Apoor@ health and equals zero otherwise. Tables 3A, 3B, and 3C report descriptive statistics for
the sample of individuals at each age. Table 3B shows the distribution of year of birth in each
sample. Table 3C shows the distribution of the number of years each individual was in a
household that responded to the survey. We include the number of years an individual
participated in the survey as a crude attempt to account for sample selection bias (attrition bias).
Our approach is to investigate the above hypotheses by starting with a parsimonious
model that correlates individual self-reported health to contemporaneous income inequality. We
then add basic control variables measured at the individual level. We sequentially add, in
separate models, each individual=s year of birth, the average income of the household in which
the individual resided (over all years we observe such income), sex, and whether or not the
individual was married in the year health status was reported. We use this strategy for both
measures of income inequality (Gini coefficient and the 80-20 income share ratio).
We append our measures of inequality to each individual based on the year and (for the
US) state of residence in each year. As noted above, for each country, we also create an indicator
variable to flag observations that have an inequality measure appended from the secondary
inequality data source for that country (i.e. the source with fewer years).
RESULTS
Table 4 presents coefficients estimated for linear probability models that relate self-
13
reports of being in Afair@ or Apoor@ health to the Gini coefficient for the national distribution of
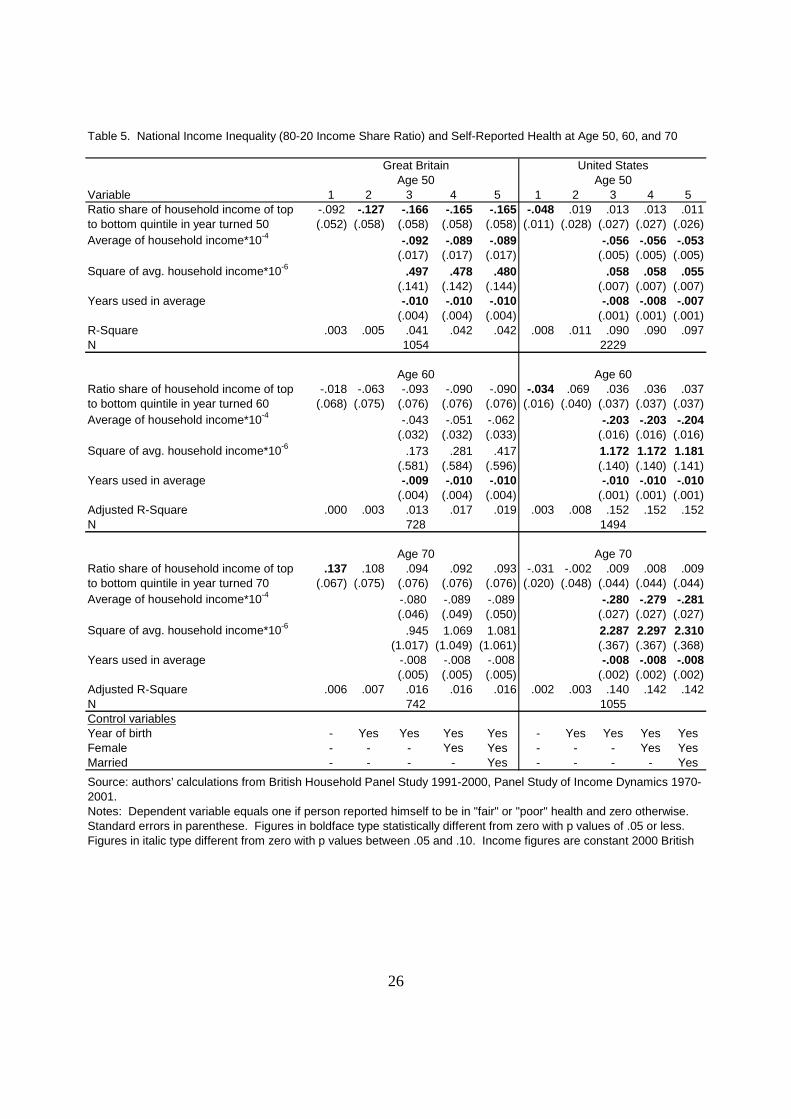
household income. Table 5 reports parallel coefficients that replace the Gini coefficient with the
80-20 income share ratio. We run separate regressions for individuals aged 50, 60, and 70 years
in each country. The results are so similar across the two measures of income inequality that we
will discuss the results only for the regressions that use the Gini coefficient. The reader can
confirm that the observations apply equally to the models that use the 80-20 income share ratio.
In Column 1 of Table 4 we report the association between self-reported health status and
the Gini coefficient with no other regressors. In Column 2 we add a control for each person’s
year of birth. In Column 3 we add measures of household income (including the number of years
we observed such income). In Column 4 we add an indicator to flag women. In Column 5 we
add an indicator to identify observations who are married. All of these models are separately
estimated for people who are age 50, 60, and 70.
In only one case, for people 70 years of age in Great Britain, do we find a positive
correlation between income inequality and the probability of being in poor health. That simple
association is statistically different from zero at the five percent level of significance but the
association is weakened substantially by the addition of the individual=s year of birth. For the
other age groups the simple correlation is close to zero (those age 60 in Great Britain) or is
negative. When additional individual covariates are added, a significant partial correlation
remains in only one age group (50 year old residents of Great Britain). The sign of the
association is negative - and runs counter to the assertion that greater inequality leads to poorer
health.
The coefficient estimates on household income shown in Table 4 (and Table 5) do
14
provide support for the absolute income hypothesis. In the fullest specification (Column 5) that
includes each individual=s year of birth, sex, and marital status, higher income is always
association with a lower probability of reporting oneself to be in Afair@ or Apoor@ health. For
individuals at all three ages in the US and for individuals aged 50 Great Britain there is
additional support for a declining contribution of income to health. As income rise, individuals
are less likely to report being in poor health but each additional dollar lowers the probability by
less. It is interesting to note that this evidence of a non linear relationship in income is not
supported by the coefficient estimates for individuals 60 and 70 in Great Britain.
Finally, we note that our results confirm what empirical researchers have long known - a
person remains in panel studies longer if he or she is healthier. When we regress health status on
the number of years we observed household income for each individual the coefficient estimates
surprisingly similar across countries and ages and are statistically different from zero with p
values of .05 or less in all but three models.
DISCUSSION
Although there are still technical issues we must address, this preliminary evidence
rejects the income inequality hypotheses that have been advanced in this literature.6 We find no
evidence to support the hypothesis individuals facing greater income inequality are more likely
report being in poor health. In all but a few models, the sign on the coefficient on income
inequality measures perversely suggests that the opposite is true! Although similar negative
associations have been reported before (Mellor and Milyo 2002), these results should not be
given much weight until we refine our analyses.
6An obvious issue is our use of linear probability models.
15
We find substantial support for the hypothesis that better health status is associated with
higher absolute income. Our results suggest that, at least for self-reported health, higher income
is consistently associated with better health at all ages and in similar ways in both Great Britain
and the United States. This finding differs from the finding of Deaton and Paxson (2001b) but,
as noted above, those authors investigate the relationship between income and mortality, not
income and self-reported health.
Finally, we interpret the coefficient estimates on the number of years a person was in our
sample as a cautionary flag that highlights the importance of accounting for attrition bias. While
attention to this technical problem is always recommended, it is especially important when the
outcome of interest is the health of older respondents to panel studies.
CONCLUSIONS
In this study we have examined the relationship between income inequality and individual
health in Great Britain, and the United States. We investigated whether health is determined by
absolute levels of income and by income inequality.
Although our results are still quite preliminary two conclusions can be drawn. First, we
find no evidence in either Great Britain or the United States that individuals report being in
poorer health if they experience greater income inequality. Second, we find that individuals are
in better health if they have more income. In future work we will expand our analysis to
investigate the other hypotheses shown in Table 1.

16
REFERENCES
Abbott, D.H., Keverne, E.B., Bercovitch, F.B., Shively, C.A., Mendoza, S.P., Saltzman, W.,Snowdon, C.T., Ziegler, T.E., Banjevic, M., Garland, Jr., T., Sapolsky, R.M. 2003. AAresubordinates always stressed? A comparative analysis of rank differences in cortisollevels among primates.@ Hormones and Behavior 43(1): 67-82.
Albeck, D. S., McKittrick, C.R., Blanchard, D.C., Blanchard, R.J., Nikulina, J., McEwen, B.S.,and Sakai, R.R. 1997. AChronic social stress alters level of corticotropin-releasing factorand arGinine vasopressin mRNA in rat brain.@ Journal of Neuroscience 17(12): 4895-4903.
Becker, Irene, Frick, Joachim, Grabka, Markus M., Hauser, Richard, Krause, Peter, and Wagner,Gert G. 2003. AA Comparison of the Main Household Income Surveys for Germany:EVS and SOEP.@ in Reporting on Income Distribution and Poverty. Richard Hauser andIrene Becker, eds. Springer-Verlag: Berlin.
CIBA Foundation Symposium. 2002. Corticotropin-Releasing Factor - Symposium No. 172Chairman: Wylie Vale, CIBA Foundation.
Daly, Mary C., Duncan, Greg J., Kaplan, George A., and Lynch, John W. 1998. AMacro-to-Micro Links in the Relation between Income Inequality and Mortality.@ MillbankQuarterly Vol. 76, No.3,
Deaton, Angus. 2001. AHealth, Inequality, and Economic Development.@ National Bureau ofEconomic Research working paper 8318.
Deaton, Angus, and Paxson, Christina. 2001a. AMortality, Education, Income, and Inequalityamong American Cohorts.@ in David Wise, editor, Themes in the Economics of Aging. Chicago, University of Chicago Press for NBER (National Bureau of Economic Researchworking paper 7140).
_______. 2001b. AMortality, Income, and Income Inequality Over Time in Britain and theUnited States.@ National Bureau of Economic Research working paper 8534.
Deininger, K. and Squire, L. 1996. AA New Data Set Measuring Income Inequality.@ www.worldbank.org/research/growth/dddeisqu.htm
Ecob, Russell. and Smith, Davey G. 1999. AIncome and Health: What is the Nature of theRelationship?@ Social Science and Medicine 48, 693-705.
Evans, Robert G., Barer, Morris, L. and Marmor, Theodore, R. 1994. Why are Some PeopleHealthy and Others Not? Aldine de Gruyter: New York.

17
Ettner, S.L. 1996. ANew evidence on the relationship between income and health.@ Journal ofHealth Economics 15(1), 67-85.
Fiscella, Kevin, and Franks, Peter. 1997. APoverty or Income Inequality as Predictor ofMortality: Longitudinal Cohort Study.@ British Medical Journal 314, 1724-1727.
_______. 2000. AIndividual income, income inequality, health, and mortality: What are therelationships?.@ Health Services Research Vol. 35, No. 1, 307-318.
Flegg, A. T. 1982. AInequality of income, illiteracy and medical care as determinants of infantmortality.@ Population Studies, 33, 343-351.
Goodman, Alissa., and Shephard, Andrew. 2002. Inequality and Living Standards in GreatBritain: Some Facts. Institute for Fiscal Studies, Briefing Note No. 19, London.
Goodman, Alissa., and Webb, Steven. 1994. For Richer, For Poorer: The Changing Distributionof Income in the United Kingdom, 1961-1991. Institute for Fiscal Studies, CommentaryNo. 42, London.
Guger, Alois. 1989. AThe Distribution of Household Income in Germany.@ WIFO WorkingPaper 35, Austrian Institute of Economic Research, Vienna.
Judge, Ken. 1995. AIncome distribution and life expectancy: a critical appraisal.@ BritishMedical Journal, 311, 1282-1285.
Judge, Ken, Mulligan, Jo-Ann, and Benzeval, Michaela. 1998. AIncome Inequality andPopulation Health.@ Social Science and Medicine Volume 46, Nos. 4-5, 567-579.
Kaplan, George A., Pamuk, Elsie R., Lynch, John W., Cohen, Richard D., and Balfour, JenniferL. 1996. AInequality in income and mortality in the United States.@ British MedicalJournal 312, 999-1003.
Kawachi , Ichiro, and Kennedy, Bruce. 1997. AThe Relationship of Income Inequality toMortality: Does the Choice of Indicator Mattter?@ Social Science and Medicine Volume45, No. 7: 1121-1127.
Kennedy, Bruce P., Kawachi, Ichiro, Glass, Roberta, and Prothrow-Stith, Deborah. 1998. AIncome distribution, socioeconomic status, and self-rated health in the United States:multilevel analysis.@ British Medical Journal, 317, 917-921.
Kennedy, Bruce P., Kawachi, Ichiro, and Prothrow-Stith, Deborah. 1996a. AIncome distributionand mortality: cross sectional ecological study of the Robin Hood index in the UnitedStates.@ British Medical Journal, 312, 1004-1007.
18
_______. 1996b. AImportant Correction.@ British Medical Journal, 312, 1194.
Lakin, Caroline. 2003. AThe effects of taxes and benefits on household income, 2001-2002.@ Economic Trends, No. 582, (May), London: Office of National Statistics, Social Analysisand Reporting Division. www.statistics.gov.uk/downloads/theme_social/Taxes_Benefits_2001/Taxes_Benefits_2001.pdf
Langer, Laura. 1999. AMeasuring Income Distribution across Space and Time in the AmericanStates.@ Social Science Quarterly 80(1) (March): 55-67.
Le Grand, J. 1987. AInequalities in health,: some international comparisons.@ EuropeanEconomic Review, 31, 182-191.
Lynch, John W., Kaplan, George A., Pamuk, Elsie R., Cohen, Richard D., Heck, Katherine E.,Balfour, Jennifer L., and Yen, Irene H. 1998. AIncome Inequality and Mortality inMetropolitan Areas of the United States.@ American Journal of Public Health, 88, 1074-1080.
McClements, L. 1977. AEquivalence Scales for Children.@ Journal of Public Economics Vol.8: 191-210.
Meara, Ellen. 1999. AWhy is Health Related to Socioeconomic Status?@ manuscript (HarvardUniversity).
Mellor, Jennifer M. and Milyo, Jeffrey. 2001. AReexamining the Evidence of an EcologicalAssociation between Income Inequality and Health.@ Journal of Health Politics, Policyand Law, Vol. 26, No. 3, 487-522.
_______. 2002. AIncome Inequality and Health Status in the United States: Evidence from theCurrent Population Survey..@ Journal of Human Resources,.
Preston, Samuel H. 1975. AThe changing relation between mortality and level of economicdevelopment,@ Population Studies, 29, 231-48.
Rodgers, G. B. 1979. AIncome inequality as determinants of mortality: an international cross-section analysis.@ Population Studies, 33, 343-351.
Soobadeer, Mah-Jabeen and LeClere, Felicia. 1999. AAggregation and the Measurement ofIncome Inequality: Effects on Morbidity.@ Social Science and Medicine. 48: 733-744.
Smith, G. Davey, Dorling, D., Mitchell, R., and Shaw, M. 2002. AHealth inequalities Britain: continuing increases up to the end of the 20th centurey.@ Journal of Epidemiological andCommunity Health, 56, 434-435.

19
Wagstaff, Adam, and van Doorslaer, Eddy. 2000. AIncome Inequality and Health: What Doesthe Literature Tell Us?@ Annual Review of Public Health. 21, 543-567.
Waldman, R. J. 1992. AIncome distribution and infant mortality.@ Quarterly Journal ofEconomics November, 1283-1302.
Wennemo, I. 1993. AInfant mortality, public policy and inequality -- a comparison of 18industrialized countries 1950-85.@ Sociology of Health and Illness, 15, 429-446.
Wilkinson, Richard G. 1992. AIncome Distribution and life-expectancy,@ British MedicalJournal, 304, 165-68.
Wilkinson, Richard G. 1994 AThe epidemiological transition: from material society to socialdisadvantage?@ Daedalus, 123, 61-77.
Wilkinson, Richard G. 1996. Unhealthy Societies: the afflication of inequality, London.Routledge.
Wilkinson, Richard G. 2000. Mind the gap: hierarchies, health, and human evolution, London, Weidenfeld and Nicolson.

20
Table 1 Comparisons of relationships implied by the various hypotheses
Hypothesis Variant Individual level
Absolute income hypothesis (AIH) [a][b]
(1) hi=fI(yi); (f’>0, f’’<0)(1a) hi=gI(yi);
Relative income hypothesis (RIH) [a][b]
(4) hi=fI(yi-yp)(6) hi=fI(yi-yc)
Relative position hypothesis (RPH) [a][b][c]
(10) hi=fI(yi, Ri)(12) hi=fI(yi, Ri0Nc)(10) hi=fI(yi, Rc)
Income inequality hypothesis (IIH) [a][b]
(10) hi=fI(yi, Ic)(10) hi=fI(yi, Ip)
Notes: Drawn from Wagstaff and van Doorslaer (2000).

21
Table 2. Measures of income inequality in Germany, Great Britain, and the United States 1947-2001
Year Great Britain1 Great Britain2 Germany3 US Great Britain1 Great Britain2 US1947 8.601948 8.651949 9.491950 39.60 9.491951 8.321952 8.551953 8.701954 9.291955 38.40 8.601956 8.201957 7.921958 8.121959 8.391960 38.00 8.601961 25.65 26.55 3.75 3.96 8.981962 24.22 25.10 3.48 3.66 8.261963 26.57 27.53 3.90 4.09 8.241964 25.84 26.68 38.00 3.65 3.91 8.081965 24.57 25.38 3.48 3.66 7.871966 25.66 26.55 3.68 3.89 7.231967 24.59 25.53 3.45 3.62 7.671968 24.36 25.35 38.70 3.40 3.60 7.231969 25.23 26.27 3.58 3.82 7.251970 25.44 26.53 39.20 3.61 3.84 7.571971 26.16 27.32 3.75 4.03 7.471972 26.46 27.64 3.90 4.23 7.671973 25.35 26.52 3.58 3.83 7.471974 24.55 25.70 3.47 3.71 7.451975 23.78 24.89 36.60 30.21 3.32 3.55 7.611976 23.69 24.78 30.44 3.28 3.51 7.611977 23.39 24.47 30.81 3.22 3.43 7.981978 23.41 24.52 31.13 3.26 3.48 7.981979 24.76 25.72 31.28 3.48 3.68 8.021980 25.28 26.43 36.60 30.99 3.59 3.85 8.161981 25.80 27.34 31.08 3.64 3.99 8.381982 25.68 27.50 31.88 3.58 3.98 9.091983 26.35 28.32 27.73 31.97 3.70 4.16 9.111984 26.53 28.66 28.23 32.29 3.73 4.23 9.131985 27.77 29.84 27.39 32.31 3.92 4.46 9.461986 28.53 30.97 26.77 32.89 4.15 4.86 9.501987 30.10 32.55 26.88 32.63 4.49 5.29 9.521988 31.84 34.18 27.05 32.71 4.98 5.92 9.571989 32.24 34.46 27.72 33.09 5.11 6.08 9.701990 33.63 36.35 27.55 32.92 5.53 6.82 9.631991 33.72 36.64 27.95 32.98 5.54 6.95 9.821992 33.86 37.23 28.51 33.17 5.51 7.23 10.141993 33.77 37.26 29.04 34.00 5.49 7.20 11.001994 32.64 36.77 29.36 34.36 5.12 7.06 11.171995 32.91 36.92 29.20 34.48 5.18 6.95 10.571996 33.20 37.37 29.11 34.40 5.27 7.19 11.141997 33.85 37.84 28.94 34.74 5.46 7.45 11.241998 34.57 38.41 28.90 34.57 5.60 7.46 11.261999 34.29 38.18 32.13 35.36 5.53 7.46 10.982000 34.66 38.43 35.61 5.65 7.60 11.022001 35.80 11.36
Ratio of income share of fifth to first quintileGini coefficients
Sources: UK data from Goodman and Shephard (2002), Germany data from Guger (1989) and Becker et al . (2003), US gini coefficients and income shares from US Census Bureau.1Before housing costs2After housing costs3Germany Gini coefficients for population of West German states only.
22
Table 3A. Descriptive statistics
Variable Age 50 Age 60 Age 70 Age 50 Age 60 Age 70Poor or fair health .088 .103 .109 0.220 0.311 0.379
(.284) (.304) (.312) (.414) (.463) (.485)Gini of household income distribution .339 .339 .339 0.439 0.435 0.438
(.006) (.006) (.007) (.015) (.014) (.015)Ratio income shares of top to bottom quintile 5.456 5.469 5.462 10.284 10.075 10.197
(.167) (.167) (.171) (.739) (.713) (.725)State Gini - - - 0.425 0.424 0.426
(.022) (.022) (.022)Standard error of gini - - - 0.022 0.022 0.022
(.010) (.010) (.009)Average household income1 14313 12382 11102 22417 17952 14881
(9052) (7311) (6091) (20021) (12906) (11663)Number of years in average 8.724 8.401 8.396 19.827 21.568 20.654
(2.642) (2.975) (2.973) (9.624) (8.670) (8.708)Female .311 .332 .426 0.432 0.435 0.372
(.463) (.471) (.495) (.496) (.496) (.484)Married .591 .576 .443 0.883 0.897 0.833
(.492) (.495) (.497) (.322) (.304) (.373)N 1054 728 (742) 1894 1397 960N(state) - - - 1417 1193 770
Great Britain United States
Source: authors’ calculations from British Household Panel Study 1991-2000, Panel Study of Income Dynamics 1970-2001, Goodman and Shephard (2002), US Census Bureau, Langer (1999).1British income figures in constant 2000 British pounds. US income figures in constant 2001 US dollars.

23
Table 3B. Birth years of sample members at age 50, 60, and 70
Year of birth Freq. Percent Freq. Percent Freq. Percent Freq. Percent Freq. Percent Freq. Percent1909 - - - - - 1 0.11911 - - - - - 1 0.11912 - - - - - 2 0.21913 - - - - - 14 1.51914 - - - - 1 0.1 45 4.71915 - - - - 1 0.1 43 4.51916 - - - - - 46 4.81917 - - - - - 55 5.71918 - - - - - 50 5.21919 - - - - 1 0.1 57 5.91920 - - - - - 77 8.01921 - - 56 7.6 - 2 0.1 91 9.51922 - - 44 5.9 - 2 0.1 96 10.01923 - - 47 6.3 - 23 1.7 72 7.51924 - - 68 9.2 - 74 5.3 90 9.41925 - - 53 7.1 - 88 6.3 81 8.41926 - - 64 8.6 - 72 5.2 59 6.21927 - - 74 10.0 - 112 8.0 61 6.41928 - - 79 10.7 - 102 7.3 19 2.01929 - - 129 17.4 - 90 6.4 -1930 - - 128 17.3 - 137 9.8 -1931 - 53 7.3 - - 122 8.7 -1932 - 60 8.2 - 1 0.1 104 7.4 -1933 - 49 6.7 - 22 1.2 108 7.7 -1934 - 58 8.0 - 77 4.1 119 8.5 -1935 - 55 7.6 - 95 5.0 100 7.2 -1936 - 53 7.3 - 90 4.8 76 5.4 -1937 - 73 10.0 - 87 4.6 53 3.8 -1938 - 85 11.7 - 96 5.1 10 0.7 -1939 - 116 15.9 - 95 5.0 - -1940 - 126 17.3 - 151 8.0 - -1941 69 6.6 - - 158 8.3 - -1942 87 8.3 - - 157 8.3 - -1943 72 6.8 - - 141 7.4 - -1944 78 7.4 - - 187 9.9 - -1945 96 9.1 - - 169 8.9 - -1946 91 8.6 - - 151 8.0 - -1947 149 14.1 - - 163 8.6 - -1948 112 10.6 - - 54 2.9 - -1949 139 13.2 - - - - -1950 161 15.3 - - - - -
Great Britain United StatesAge 60 Age 70Age 50 Age 60 Age 70 Age 50
Source: authors’ calculations from British Household Panel Study 1991-2000, Panel Study of Income Dynamics 1970-2001, Goodman and Shephard (2002)

24
Table 3C. Number of years used in construction of average household income at age 50, 60, and 70
Years in avg. Freq. Percent Freq. Percent Freq. Percent Freq. Percent Freq. Percent Freq. Percent1 4 0.4 13 1.8 10 1.4 29 1.5 12 0.9 - -2 90 8.5 82 11.3 82 11.1 49 2.6 26 1.9 20 2.13 5 0.5 3 0.4 1 0.1 71 3.8 45 3.2 27 2.84 64 6.1 45 6.2 62 8.4 109 5.8 53 3.8 56 5.85 6 0.6 2 0.3 64 3.4 44 3.2 23 2.46 5 0.5 3 0.4 1 0.1 61 3.2 29 2.1 30 3.17 7 0.7 5 0.7 6 0.8 21 1.1 3 0.2 2 0.28 20 1.9 10 1.4 4 0.5 17 0.9 7 0.5 7 0.79 59 5.6 43 5.9 35 4.7 16 0.8 6 0.4 11 1.210 794 75.3 522 71.7 541 72.9 21 1.1 7 0.5 7 0.711 - - - 23 1.2 10 0.7 7 0.712 - - - 25 1.3 12 0.9 8 0.813 - - - 17 0.9 9 0.6 5 0.514 - - - 19 1.0 12 0.9 9 0.915 - - - 20 1.1 11 0.8 14 1.516 - - - 22 1.2 16 1.2 14 1.517 - - - 28 1.5 17 1.2 15 1.618 - - - 37 2.0 15 1.1 14 1.519 - - - 24 1.3 27 1.9 26 2.720 - - - 32 1.7 38 2.7 25 2.621 - - - 36 1.9 49 3.5 39 4.122 - - - 64 3.4 46 3.3 35 3.723 - - - 78 4.1 65 4.7 57 5.924 - - - 91 4.8 80 5.7 63 6.625 - - - 128 6.8 110 7.9 76 7.926 - - - 154 8.1 130 9.3 74 7.727 - - - 151 8.0 132 9.5 83 8.728 - - - 168 8.9 121 8.7 69 7.229 - - - 173 9.1 155 11.1 79 8.230 - - - 146 7.7 110 7.9 65 6.8
Great Britain United StatesAge 50 Age 60 Age 70 Age 50 Age 60 Age 70
Source: authors’ calculations from British Household Panel Study 1991-2000, Panel Study of Income Dynamics 1970-2001, Goodman and Shephard (2002)

25
Table 4. National Income Inequality (Gini) and Self-Reported Health at Age 50, 60, and 70
Variable 1 2 3 4 5 1 2 3 4 5Gini coefficient in Year turned 50 -1.752 -3.702 -4.841 -4.826 -4.823 -1.463 -1.768 -1.159 -1.160 -1.105
(1.368) (1.756) (1.753) (1.753) (1.755) (.651) (1.742) (1.643) (1.643) (1.641)Average of household income*10-4 -.092 -.089 -.089 -.101 -.101 -.097
(.017) (.017) (.018) (.008) (.008) (.008)Square of avg. household income*10-6 .497 .478 .479 .260 .260 .251
(.141) (.142) (.145) (.030) (.030) (.030)Years used in average -.010 -.010 -.010 -.008 -.008 -.008
(.004) (.004) (.004) (.001) (.001) (.001)R-Square .002 .005 .040 .041 .041 .003 .003 .117 .117 .121N
Gini coefficient in Year turned 60 .134 -1.940 -2.787 -2.697 -2.694 -1.572 3.394 3.273 3.262 3.277(1.747) (2.294) (2.315) (2.313) (2.313) (.885) (2.261) (2.105) (2.109) (2.110)
Average of household income*10-4 -.043 -.051 -.062 -.204 -.204 -.205(.032) (.032) (.033) (.017) (.017) (.018)
Square of avg. household income*10-6 .176 .284 .419 1.223 1.223 1.228(.581) (.584) (.596) (.174) (.174) (.175)
Years used in average -.009 -.010 -.010 -.010 -.010 -.010(.004) (.004) (.004) (.001) (.001) (.001)
R-Square .000 .003 .013 .017 .019 .002 .006 .148 .148 .149N
Gini coefficient in Year turned 70 3.785 3.394 3.000 2.944 2.950 -1.516 -1.867 -.698 -.556 -.559(1.729) (2.312) (2.329) (2.333) (2.336) (1.085) (2.778) (2.591) (2.588) (2.588)
Average of household income*10-4 -.080 -.089 -.089 -.272 -.271 -.274(.046) (.049) (.050) (.028) (.028) (.028)
Square of avg. household income*10-6 .943 1.067 1.079 2.190 2.196 2.213(1.017) (1.049) (1.061) (.377) (.376) (.377)
Years used in average -.008 -.008 -.008 -.009 -.008 -.009(.005) (.005) (.005) (.002) (.002) (.002)
R-Square .007 .007 .016 .016 .016 .002 .002 .140 .143 .144NControl variablesYear of birth - Yes Yes Yes Yes - Yes Yes Yes YesFemale - - - Yes Yes - - - Yes YesMarried - - - - Yes - - - - Yes
Age 70
Great Britain
1054
728
742 949
United StatesAge 50
Age 60
Age 70
1843
1368
Age 50
Age 60
Source: authors’ calculations from British Household Panel Study 1991-2000, Panel Study of Income Dynamics 1970-2001.Notes: Dependent variable equals one if person reported himself to be in "fair" or "poor" health and zero otherwise. Standard errors in parenthese. Figures in boldface type statistically different from zero with p values of .05 or less. Figures in italic type different from zero with p values between .05 and .10. Income figures are constant 2000 British pounds and constant 2001 US dollars.
26
Table 5. National Income Inequality (80-20 Income Share Ratio) and Self-Reported Health at Age 50, 60, and 70
Variable 1 2 3 4 5 1 2 3 4 5Ratio share of household income of top -.092 -.127 -.166 -.165 -.165 -.048 .019 .013 .013 .011to bottom quintile in year turned 50 (.052) (.058) (.058) (.058) (.058) (.011) (.028) (.027) (.027) (.026)Average of household income*10-4 -.092 -.089 -.089 -.056 -.056 -.053
(.017) (.017) (.017) (.005) (.005) (.005)Square of avg. household income*10-6 .497 .478 .480 .058 .058 .055
(.141) (.142) (.144) (.007) (.007) (.007)Years used in average -.010 -.010 -.010 -.008 -.008 -.007
(.004) (.004) (.004) (.001) (.001) (.001)R-Square .003 .005 .041 .042 .042 .008 .011 .090 .090 .097N
Ratio share of household income of top -.018 -.063 -.093 -.090 -.090 -.034 .069 .036 .036 .037to bottom quintile in year turned 60 (.068) (.075) (.076) (.076) (.076) (.016) (.040) (.037) (.037) (.037)Average of household income*10-4 -.043 -.051 -.062 -.203 -.203 -.204
(.032) (.032) (.033) (.016) (.016) (.016)Square of avg. household income*10-6 .173 .281 .417 1.172 1.172 1.181
(.581) (.584) (.596) (.140) (.140) (.141)Years used in average -.009 -.010 -.010 -.010 -.010 -.010
(.004) (.004) (.004) (.001) (.001) (.001)Adjusted R-Square .000 .003 .013 .017 .019 .003 .008 .152 .152 .152N
Ratio share of household income of top .137 .108 .094 .092 .093 -.031 -.002 .009 .008 .009to bottom quintile in year turned 70 (.067) (.075) (.076) (.076) (.076) (.020) (.048) (.044) (.044) (.044)Average of household income*10-4 -.080 -.089 -.089 -.280 -.279 -.281
(.046) (.049) (.050) (.027) (.027) (.027)Square of avg. household income*10-6 .945 1.069 1.081 2.287 2.297 2.310
(1.017) (1.049) (1.061) (.367) (.367) (.368)Years used in average -.008 -.008 -.008 -.008 -.008 -.008
(.005) (.005) (.005) (.002) (.002) (.002)Adjusted R-Square .006 .007 .016 .016 .016 .002 .003 .140 .142 .142NControl variablesYear of birth - Yes Yes Yes Yes - Yes Yes Yes YesFemale - - - Yes Yes - - - Yes YesMarried - - - - Yes - - - - Yes
Great Britain United StatesAge 50 Age 50
742 1055
1054 2229
728 1494
Age 60 Age 60
Age 70 Age 70
Source: authors’ calculations from British Household Panel Study 1991-2000, Panel Study of Income Dynamics 1970-2001.Notes: Dependent variable equals one if person reported himself to be in "fair" or "poor" health and zero otherwise. Standard errors in parenthese. Figures in boldface type statistically different from zero with p values of .05 or less. Figures in italic type different from zero with p values between .05 and .10. Income figures are constant 2000 British