Embed Size (px)
Citation preview
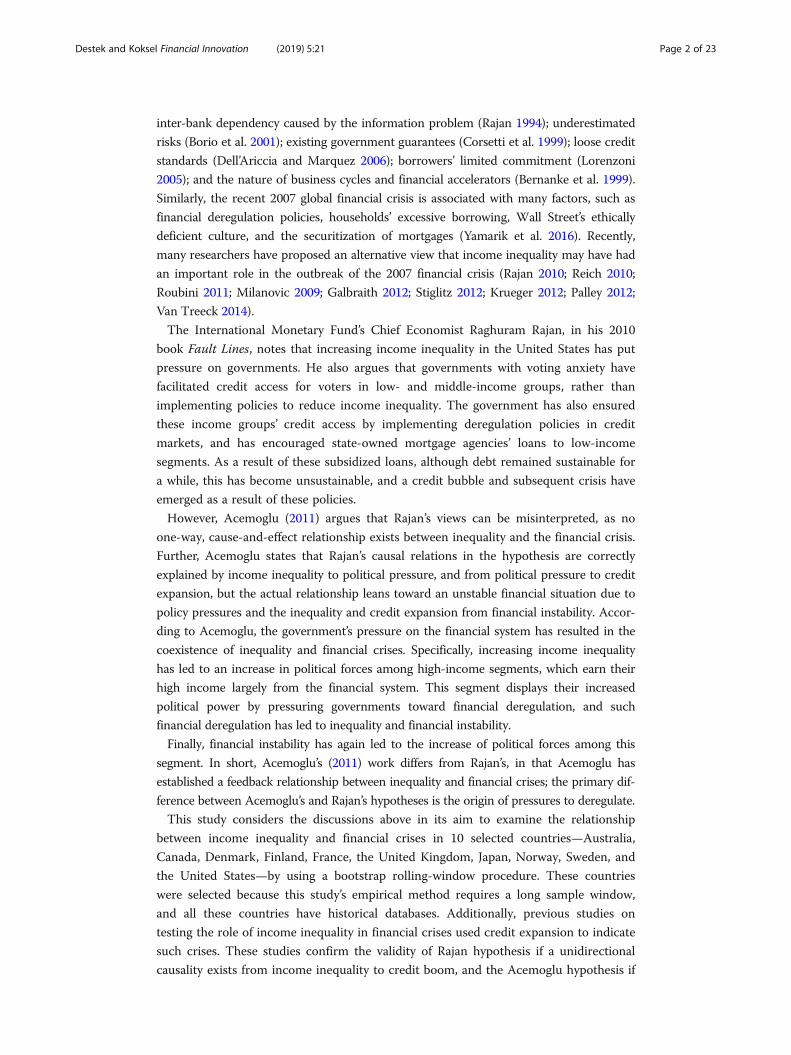
RESEARCH Open Access
Income inequality and financial crises:evidence from the bootstrap rollingwindowMehmet Akif Destek* and Bilge Koksel
* Correspondence: [email protected] manuscript is based ondissertation research of the firstauthor at the Department ofEconomics, Gaziantep University.Department of Economics,Gaziantep University, 27310Gaziantep, Turkey
Abstract
This study aims to investigate the validity of the Rajan hypothesis, which argues thatincreasing income inequality plays a key role in the outbreak of financial crises. Therelationship between income inequality and credit booms are examined in 10developed countries: Australia, Canada, Denmark, Finland, France, the UnitedKingdom, Japan, Norway, Sweden, and the United States. In doing so, a bootstraprolling-window estimation procedure is used to detect any possible causal linkbetween inequality and credit booms in financial crisis sub-periods. The results revealthat the Rajan hypothesis is supported for the 1989 crisis in Australia, the 1991 and2007 crises in the United Kingdom, and the 1929 and 2007 crises in the UnitedStates. Therefore, increasing income inequality has positive predictive power oncredit booms in Anglo-Saxon countries. However, the hypothesis is not confirmed forScandinavian and continental European countries. Our study is novel in its use of thebootstrap rolling-window procedure, which allows us to detect the possiblerelationship between inequality and credit booms in financial crises. The findingssuggest that a progressive taxation policy or investments to accumulate humancapital and increase the labor force are more beneficial than temporary solutions.
Keywords: Income inequality, Credit booms, Financial crisis, Rolling windowestimation
JEL classifications: E25, E51, G01
IntroductionIn pioneer studies of crisis theories, Fisher (1932, 1933) argued that all economic
booms and depressions emerge through excessive borrowing and subsequent deflation.
Following this argument, Minsky’s (1975, 1982, 1986) financial instability hypothesis
argued that financial instability primarily occurs due to excessive borrowing, but these
hypotheses are based on corporate debt and investments rather than household debt
and consumption. In addition, many studies have highlighted the risk associated with
excessive bank lending affects financial systems and entire economies (Kashif et al. 2016).
Therefore, it is necessary to examine the bases of financial instability through debt and
credit expansion (Perugini et al. 2015).
Financial instability has been explained following these perspectives, and by incorpo-
rating many factors: banks’ herd behavior (Kindleberger 1978); credit policies based on
© The Author(s). 2019 Open Access This article is distributed under the terms of the Creative Commons Attribution 4.0 InternationalLicense (http://creativecommons.org/licenses/by/4.0/), which permits unrestricted use, distribution, and reproduction in any medium,provided you give appropriate credit to the original author(s) and the source, provide a link to the Creative Commons license, andindicate if changes were made.
Financial InnovationDestek and Koksel Financial Innovation (2019) 5:21 https://doi.org/10.1186/s40854-019-0136-2
inter-bank dependency caused by the information problem (Rajan 1994); underestimated
risks (Borio et al. 2001); existing government guarantees (Corsetti et al. 1999); loose credit
standards (Dell’Ariccia and Marquez 2006); borrowers’ limited commitment (Lorenzoni
2005); and the nature of business cycles and financial accelerators (Bernanke et al. 1999).
Similarly, the recent 2007 global financial crisis is associated with many factors, such as
financial deregulation policies, households’ excessive borrowing, Wall Street’s ethically
deficient culture, and the securitization of mortgages (Yamarik et al. 2016). Recently,
many researchers have proposed an alternative view that income inequality may have had
an important role in the outbreak of the 2007 financial crisis (Rajan 2010; Reich 2010;
Roubini 2011; Milanovic 2009; Galbraith 2012; Stiglitz 2012; Krueger 2012; Palley 2012;
Van Treeck 2014).
The International Monetary Fund’s Chief Economist Raghuram Rajan, in his 2010
book Fault Lines, notes that increasing income inequality in the United States has put
pressure on governments. He also argues that governments with voting anxiety have
facilitated credit access for voters in low- and middle-income groups, rather than
implementing policies to reduce income inequality. The government has also ensured
these income groups’ credit access by implementing deregulation policies in credit
markets, and has encouraged state-owned mortgage agencies’ loans to low-income
segments. As a result of these subsidized loans, although debt remained sustainable for
a while, this has become unsustainable, and a credit bubble and subsequent crisis have
emerged as a result of these policies.
However, Acemoglu (2011) argues that Rajan’s views can be misinterpreted, as no
one-way, cause-and-effect relationship exists between inequality and the financial crisis.
Further, Acemoglu states that Rajan’s causal relations in the hypothesis are correctly
explained by income inequality to political pressure, and from political pressure to credit
expansion, but the actual relationship leans toward an unstable financial situation due to
policy pressures and the inequality and credit expansion from financial instability. Accor-
ding to Acemoglu, the government’s pressure on the financial system has resulted in the
coexistence of inequality and financial crises. Specifically, increasing income inequality
has led to an increase in political forces among high-income segments, which earn their
high income largely from the financial system. This segment displays their increased
political power by pressuring governments toward financial deregulation, and such
financial deregulation has led to inequality and financial instability.
Finally, financial instability has again led to the increase of political forces among this
segment. In short, Acemoglu’s (2011) work differs from Rajan’s, in that Acemoglu has
established a feedback relationship between inequality and financial crises; the primary dif-
ference between Acemoglu’s and Rajan’s hypotheses is the origin of pressures to deregulate.
This study considers the discussions above in its aim to examine the relationship
between income inequality and financial crises in 10 selected countries—Australia,
Canada, Denmark, Finland, France, the United Kingdom, Japan, Norway, Sweden, and
the United States—by using a bootstrap rolling-window procedure. These countries
were selected because this study’s empirical method requires a long sample window,
and all these countries have historical databases. Additionally, previous studies on
testing the role of income inequality in financial crises used credit expansion to indicate
such crises. These studies confirm the validity of Rajan hypothesis if a unidirectional
causality exists from income inequality to credit boom, and the Acemoglu hypothesis if
Destek and Koksel Financial Innovation (2019) 5:21 Page 2 of 23
a bidirectional causal link exists. However, previous studies ignored one key detail: all
credit booms are not followed by a banking crisis. Therefore, the rolling-window
estimation method—which allows for an examination of the time-varying causal
relationships between variables—provides an opportunity to detect the possible
relationship between inequality and credit booms in financial crisis periods.
In summary, we primarily argue that the presence of unidirectional causality from
inequality to credit booms within the full sample does not adequately justify accepting the
Rajan hypothesis. However, the hypothesis can be confirmed under two conditions. First,
the presence of causality from inequality to credit booms should occur in the crisis
sub-period. Second, the coefficient of inequality in credit booms should be positive in this
sub-period.
This study makes three contributions to the literature: i) This is the first study to
investigate the causal relationship between income inequality and financial crisis using
a rolling-window causality procedure in its selected countries. ii) As using unit root
tests that ignore possible structural breaks may provide misleading results, this study
employs a unit root test with multiple endogenous structural breaks. iii) This study also
provides a methodological contribution by employing a bootstrap rolling-window
estimation method, which has never been previously used in such research; this
methodology lets us separate the findings into sub-sample periods.
Literature reviewThis section reviews empirical studies investigating whether income inequality may be
a major reason for credit booms and financial crises. In addition to these empirical
studies, agent-based studies also address the nexus between inequality and crises.
For instance, Dosi et al. (2013) examined the relationship between income dis-
tribution and monetary policy using a credit-augmented version of the agent-based
Keynesian model, and concluded that more unequal economies experience a higher
probability of crises. Kumhof et al. (2015) explored the nexus between income distri-
bution, household leverage, and crises using an agent-based approach, and argued that
higher leverage and crises are the endogenous result of high-income households’
growing share of income. Similarly, Russo et al. (2016) argued that increasing inequality
accelerates the system’s tendency toward crisis.
Limited studies have also empirically addressed the view that the increasing income in-
equality plays a key role in the emergence of financial crises. This perspective is also known
as the Rajan hypothesis, and empirical studies appear to have examined this based on the
hypothesis that increasing inequality not only creates unsustainable levels of household debt
and leads to a credit bubble, but also impacts credit expansion as well as household debt.
It can be observed that studies investigating the validity of the hypothesis for the
same countries or country groups based on the observed period or used methodology
reveal contradictory findings. For instance, Bordo and Meissner (2012) examined the
relationship between income inequality and credit expansion in 14 developed countries
using a panel fixed-effects model for the period from 1920 to 2012, and concluded
that the Rajan hypothesis is invalid for their observed country group. In contrast,
Kirschenmann et al. (2016) examined the validity of Rajan hypothesis in the same
country group using a panel logit model for the period from 1870 to 2008 to conclude
that the hypothesis is valid.
Destek and Koksel Financial Innovation (2019) 5:21 Page 3 of 23
Similarly, Malinen (2013) employed a seemingly unrelated dynamic regression to
explore the relationship between income inequality and credit expansion in the case of
eight developed countries from 1972 to 2008, and concluded that no relationship exists
between income inequality and credit expansion. However, Gu and Huang (2012)
probed this nexus in the same country group from 1980 to 2008 using a pooled
mean-group estimation approach to conclude that the hypothesis is valid for three of
the eight countries.
Further, it seems that some existing studies focused on countries within the Organisation
for Economic Co-operation and Development (OECD) and found evidence to confirm the
Rajan hypothesis. Ahlquist and Ansell (2012) analyzed the validity of this hypothesis
through a panel error-correction model from 1980 to 2008 in OECD countries,
and concluded that the Rajan hypothesis is valid. Additionally, Perugini et al.
(2015) verified the validity of the Rajan hypothesis in OECD countries using the
panel generalized method of moments (GMM) estimation method from 1970 to
2007. Mahmoud and Niguez (2015) also confirmed its validity in 18 OECD countries
from 1970 to 2007 using a panel GMM procedure.
Some studies investigate the possible role of increasing inequality in global financial
crises by examining this nexus in the US economy; these studies also present contra-
dictory findings. Fasianos et al. (2017) investigated the relationship between income
inequality and credit expansion in the United States from 1913 to 2008 using a non-
linear autoregressive distributed lag test to invalidate the Rajan hypothesis. In contrast,
Yamarik et al. (2016) examined the validity of the hypothesis among the 50 US states
from 1977 to 2010 using with second-generation panel data methodologies to consider
the cross-sectional dependence among states. This study’s findings reveal that the
hypothesis is valid.
As the literature has indicated, all studies on the relationship between inequality and
crises have used credit expansion as an absolute crisis indicator. However, not every
credit expansion has resulted in a crisis. Therefore, this study deviates from previous
works to examine the emergence of crises in periods when income inequality has
caused credit expansion. Additionally, previous studies’ empirical analyses have been
based on the assumption of stable parameters; this study first tests the stability of
parameters and then conducts an analysis based on the parameter instability.
Data and methodologyThis study examines the relationship between income inequality and financial crises in
10 selected countries—Australia, Canada, Denmark, Finland, France, the United
Kingdom, Japan, Norway, Sweden and the United States—including annual data with dif-
ferent sample periods for each country based on data availability. Specifically, we use
1886–2013 data for Japan; 1913–2013 data for the United States; 1920–2013 data for
Australia, Canada, Denmark, Finland, and France; 1948–2013 data for Norway; 1949–2013
data for the United Kingdom; and 1943–2013 data for Sweden.
We follow Bordo and Meissner’s (2012) study and use “credit expansion” to indicate
financial crises. Subsequently, a bank loan variable is deflated by the consumer price
index and used as a proxy for credit expansion (hereafter, “CRE”). Additionally, the
share of total income earned by the top 1% of households is used to indicate income in-
equality (INE). Bank loan and consumer price index data are obtained from Schularick
Destek and Koksel Financial Innovation (2019) 5:21 Page 4 of 23
and Taylor’s (2012) Macrohistory database, and income inequality data are retrieved
from the World Top Incomes Database. Further, we also conducted a robustness check
with real mortgage loans as an indicator of credit expansion to observe the impact of
income inequality on mortgage loans. The mortgage loans series data are also obtained
from the Macrohistory database.
In testing our procedure, we first used the full-sample bootstrap causality method as
developed by Hacker and Hatemi-J (2006); this is a modified version of Toda and
Yamamoto’s (1995) causality method, which allows us to investigate the variables’ causal
relationships and determine whether they are co-integrated. The test’s critical values
are obtained from Efron’s (1979) bootstrap testing procedure. The first step of this
methodology considers the following vector autoregressive (VAR) process:
yt ¼ φ0 þ φ1yt−1 þ…þ φpyt−p þ εt ; t ¼ 1; 2;…;T ð1Þ
where p is the lag order, εt = (ε1t, ε2t)′ is the zero-mean white-noise process with
covariance matrix Σ. Further, yt is split into two vectors—CRE (y1t) and INE (y2t)—to
ultimately obtain
y1ty2t
� �¼ φ10
φ20
� �þ φ11 Lð Þ φ12 Lð Þ
φ21 Lð Þ φ22 Lð Þ� �
y1ty2t
� �þ ε1t
ε2t
� �ð2Þ
where φijðLÞ ¼Pp
k−1φij;kLk , i, j = 1, 2 and L is the lag operator. The null hypothesis of
income inequality (INE) does not Granger-cause credit growth (CRE) can be examined
by imposing zero restrictions φ12, i = 0 for i = 1, 2,… , p and the null of credit growth
(CRE) does not Granger-cause income inequality (INE) can be computed by imposing
zero restrictions φ21, i = 0 for i = 1, 2,… , p.
Various empirical analyses describe different methods to determine structural
changes, such as splitting the sample into pieces or using dummy variables, among
others. This study uses the rolling-window causality method as described by Balcilar et
al. (2010) to consider the changes in the causal relationship between income inequality
and credit growth for sub-sample periods. Balcilar et al. (2010) used Hacker and
Hatemi-J’s (2006) methodology to develop a causality method that investigates the boot-
strap causality in rolling-window sub-samples for t = τ − 1 + l, τ − 1,…, τ, τ = l, l + 1,…, T,
where l is the rolling window. Possible changes in the causal connections between
inequality and credit growth are determined by computing the bootstrap p-values of the
LR-statistic rolling through T-1 sub-samples. Further, the effect of income inequality on
credit growth is calculated as B−1PPk−1φ̂
�21;k with φ̂�
21;k obtained from bootstrap estimation
of vector autoregressive (VAR) model by Eq.2 and B is the bootstrap repetition number.
Similarly, the effect of credit growth on income inequality is computed as B−1PPk−1φ̂
�12;k
where φ̂�12;k is obtained from bootstrap estimation of VAR model by Eq.2 and B refers to
bootstrap repetition number.
Empirical resultsInvestigating the stationary process of variables in an empirical analysis is a crucial
issue, as ignoring any possible structural breaks may lead to unreliable results. We
address this problem by first using a unit root test that allows multiple structural
breaks (hereafter, “CS”) as developed by Carrion-i-Silvestre et al. (2009). Table 1
Destek and Koksel Financial Innovation (2019) 5:21 Page 5 of 23
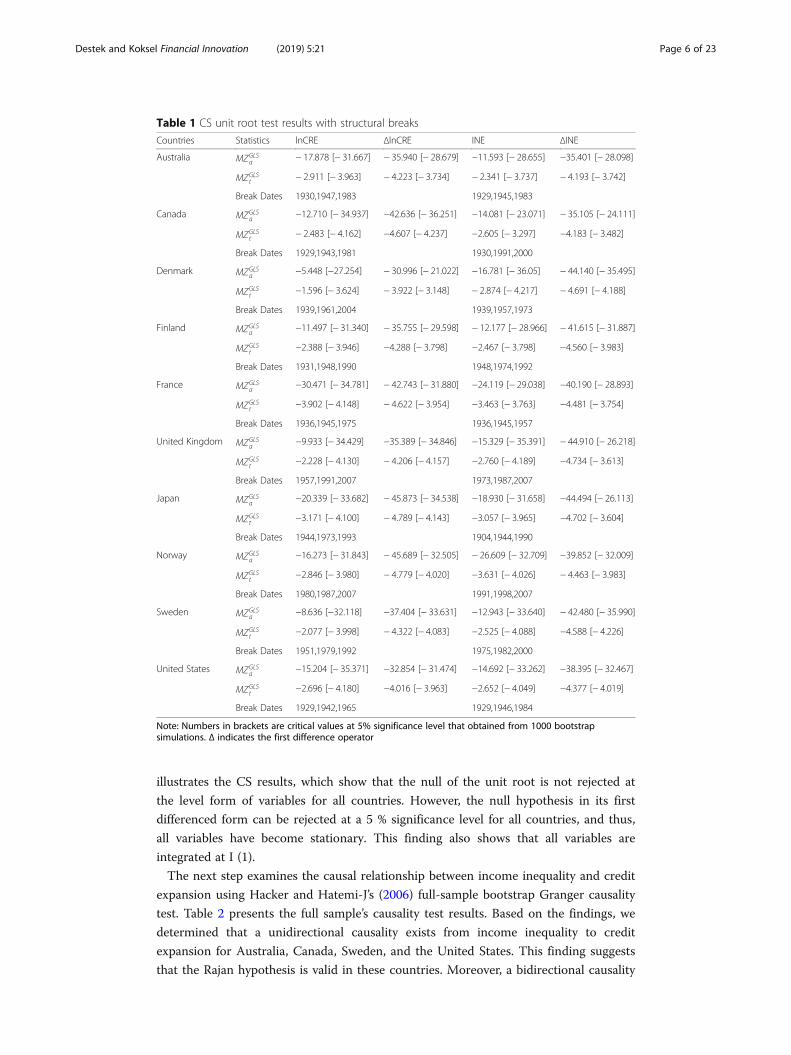
illustrates the CS results, which show that the null of the unit root is not rejected at
the level form of variables for all countries. However, the null hypothesis in its first
differenced form can be rejected at a 5 % significance level for all countries, and thus,
all variables have become stationary. This finding also shows that all variables are
integrated at I (1).
The next step examines the causal relationship between income inequality and credit
expansion using Hacker and Hatemi-J’s (2006) full-sample bootstrap Granger causality
test. Table 2 presents the full sample’s causality test results. Based on the findings, we
determined that a unidirectional causality exists from income inequality to credit
expansion for Australia, Canada, Sweden, and the United States. This finding suggests
that the Rajan hypothesis is valid in these countries. Moreover, a bidirectional causality
Table 1 CS unit root test results with structural breaks
Countries Statistics lnCRE ΔlnCRE INE ΔINE
Australia MZGLSa
− 17.878 [− 31.667] − 35.940 [− 28.679] −11.593 [− 28.655] −35.401 [− 28.098]
MZGLSt
− 2.911 [− 3.963] − 4.223 [− 3.734] − 2.341 [− 3.737] − 4.193 [− 3.742]
Break Dates 1930,1947,1983 1929,1945,1983
Canada MZGLSa
−12.710 [− 34.937] −42.636 [− 36.251] −14.081 [− 23.071] − 35.105 [− 24.111]
MZGLSt
− 2.483 [− 4.162] −4.607 [− 4.237] −2.605 [− 3.297] −4.183 [− 3.482]
Break Dates 1929,1943,1981 1930,1991,2000
Denmark MZGLSa
−5.448 [−27.254] − 30.996 [− 21.022] −16.781 [− 36.05] − 44.140 [− 35.495]
MZGLSt
−1.596 [− 3.624] − 3.922 [− 3.148] − 2.874 [− 4.217] − 4.691 [− 4.188]
Break Dates 1939,1961,2004 1939,1957,1973
Finland MZGLSa
−11.497 [− 31.340] − 35.755 [− 29.598] − 12.177 [− 28.966] − 41.615 [− 31.887]
MZGLSt
−2.388 [− 3.946] −4.288 [− 3.798] −2.467 [− 3.798] −4.560 [− 3.983]
Break Dates 1931,1948,1990 1948,1974,1992
France MZGLSa
−30.471 [− 34.781] − 42.743 [− 31.880] −24.119 [− 29.038] −40.190 [− 28.893]
MZGLSt
−3.902 [− 4.148] − 4.622 [− 3.954] −3.463 [− 3.763] −4.481 [− 3.754]
Break Dates 1936,1945,1975 1936,1945,1957
United Kingdom MZGLSa
−9.933 [− 34.429] −35.389 [− 34.846] −15.329 [− 35.391] − 44.910 [− 26.218]
MZGLSt
−2.228 [− 4.130] − 4.206 [− 4.157] −2.760 [− 4.189] −4.734 [− 3.613]
Break Dates 1957,1991,2007 1973,1987,2007
Japan MZGLSa
−20.339 [− 33.682] − 45.873 [− 34.538] −18.930 [− 31.658] −44.494 [− 26.113]
MZGLSt
−3.171 [− 4.100] − 4.789 [− 4.143] −3.057 [− 3.965] −4.702 [− 3.604]
Break Dates 1944,1973,1993 1904,1944,1990
Norway MZGLSa
−16.273 [− 31.843] − 45.689 [− 32.505] − 26.609 [− 32.709] −39.852 [− 32.009]
MZGLSt
−2.846 [− 3.980] − 4.779 [− 4.020] −3.631 [− 4.026] − 4.463 [− 3.983]
Break Dates 1980,1987,2007 1991,1998,2007
Sweden MZGLSa
−8.636 [−32.118] −37.404 [− 33.631] −12.943 [− 33.640] − 42.480 [− 35.990]
MZGLSt
−2.077 [− 3.998] − 4.322 [− 4.083] −2.525 [− 4.088] −4.588 [− 4.226]
Break Dates 1951,1979,1992 1975,1982,2000
United States MZGLSa
−15.204 [− 35.371] −32.854 [− 31.474] −14.692 [− 33.262] −38.395 [− 32.467]
MZGLSt
−2.696 [− 4.180] −4.016 [− 3.963] −2.652 [− 4.049] −4.377 [− 4.019]
Break Dates 1929,1942,1965 1929,1946,1984
Note: Numbers in brackets are critical values at 5% significance level that obtained from 1000 bootstrapsimulations. Δ indicates the first difference operator
Destek and Koksel Financial Innovation (2019) 5:21 Page 6 of 23
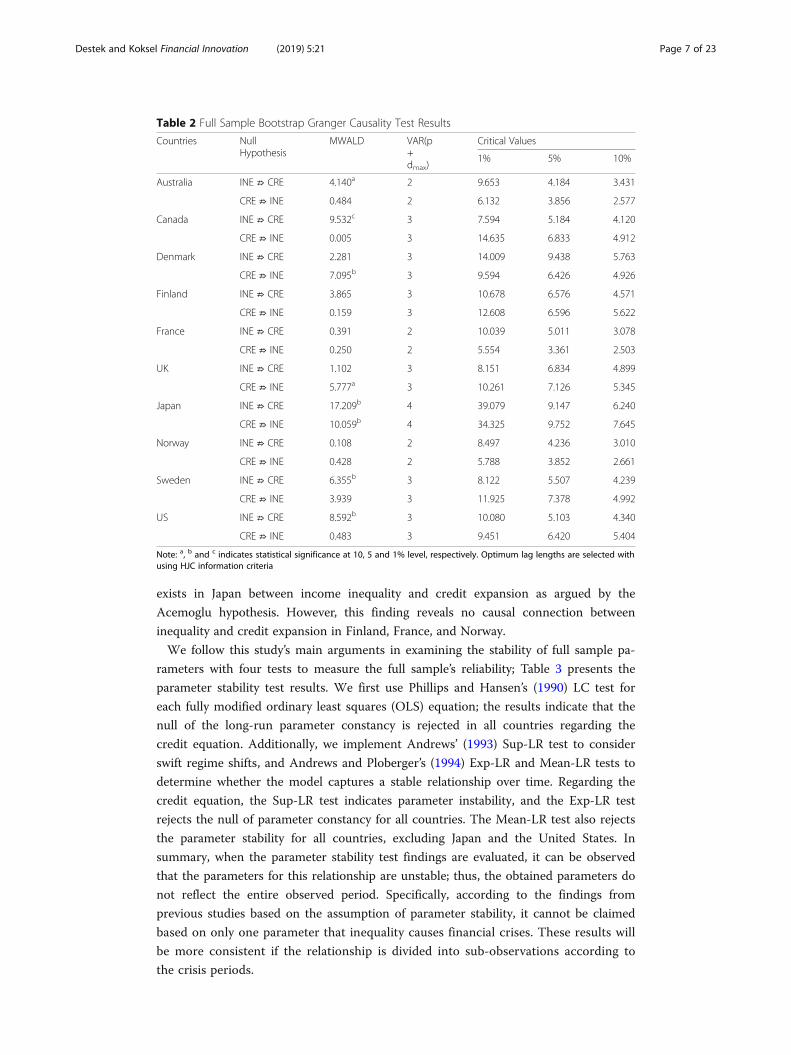
exists in Japan between income inequality and credit expansion as argued by the
Acemoglu hypothesis. However, this finding reveals no causal connection between
inequality and credit expansion in Finland, France, and Norway.
We follow this study’s main arguments in examining the stability of full sample pa-
rameters with four tests to measure the full sample’s reliability; Table 3 presents the
parameter stability test results. We first use Phillips and Hansen’s (1990) LC test for
each fully modified ordinary least squares (OLS) equation; the results indicate that the
null of the long-run parameter constancy is rejected in all countries regarding the
credit equation. Additionally, we implement Andrews’ (1993) Sup-LR test to consider
swift regime shifts, and Andrews and Ploberger’s (1994) Exp-LR and Mean-LR tests to
determine whether the model captures a stable relationship over time. Regarding the
credit equation, the Sup-LR test indicates parameter instability, and the Exp-LR test
rejects the null of parameter constancy for all countries. The Mean-LR test also rejects
the parameter stability for all countries, excluding Japan and the United States. In
summary, when the parameter stability test findings are evaluated, it can be observed
that the parameters for this relationship are unstable; thus, the obtained parameters do
not reflect the entire observed period. Specifically, according to the findings from
previous studies based on the assumption of parameter stability, it cannot be claimed
based on only one parameter that inequality causes financial crises. These results will
be more consistent if the relationship is divided into sub-observations according to
the crisis periods.
Table 2 Full Sample Bootstrap Granger Causality Test Results
Countries NullHypothesis
MWALD VAR(p+dmax)
Critical Values
1% 5% 10%
Australia INE ⇏ CRE 4.140a 2 9.653 4.184 3.431
CRE ⇏ INE 0.484 2 6.132 3.856 2.577
Canada INE ⇏ CRE 9.532c 3 7.594 5.184 4.120
CRE ⇏ INE 0.005 3 14.635 6.833 4.912
Denmark INE ⇏ CRE 2.281 3 14.009 9.438 5.763
CRE ⇏ INE 7.095b 3 9.594 6.426 4.926
Finland INE ⇏ CRE 3.865 3 10.678 6.576 4.571
CRE ⇏ INE 0.159 3 12.608 6.596 5.622
France INE ⇏ CRE 0.391 2 10.039 5.011 3.078
CRE ⇏ INE 0.250 2 5.554 3.361 2.503
UK INE ⇏ CRE 1.102 3 8.151 6.834 4.899
CRE ⇏ INE 5.777a 3 10.261 7.126 5.345
Japan INE ⇏ CRE 17.209b 4 39.079 9.147 6.240
CRE ⇏ INE 10.059b 4 34.325 9.752 7.645
Norway INE ⇏ CRE 0.108 2 8.497 4.236 3.010
CRE ⇏ INE 0.428 2 5.788 3.852 2.661
Sweden INE ⇏ CRE 6.355b 3 8.122 5.507 4.239
CRE ⇏ INE 3.939 3 11.925 7.378 4.992
US INE ⇏ CRE 8.592b 3 10.080 5.103 4.340
CRE ⇏ INE 0.483 3 9.451 6.420 5.404
Note: a, b and c indicates statistical significance at 10, 5 and 1% level, respectively. Optimum lag lengths are selected withusing HJC information criteria
Destek and Koksel Financial Innovation (2019) 5:21 Page 7 of 23
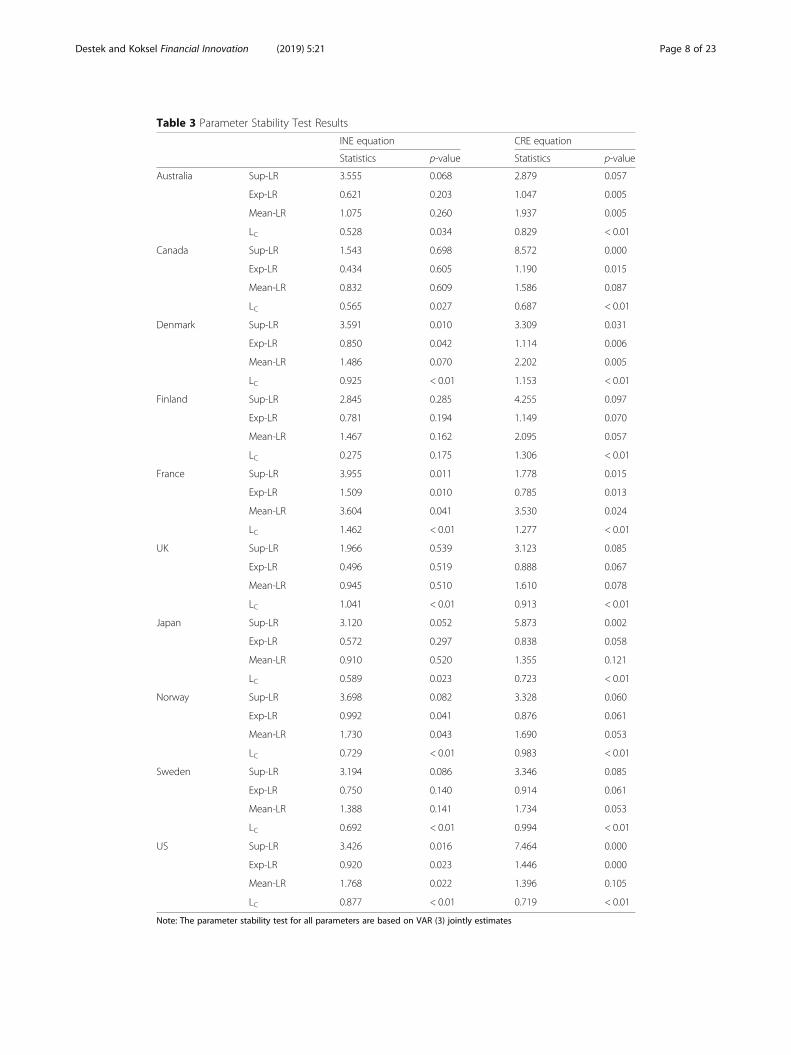
Table 3 Parameter Stability Test Results
INE equation CRE equation
Statistics p-value Statistics p-value
Australia Sup-LR 3.555 0.068 2.879 0.057
Exp-LR 0.621 0.203 1.047 0.005
Mean-LR 1.075 0.260 1.937 0.005
LC 0.528 0.034 0.829 < 0.01
Canada Sup-LR 1.543 0.698 8.572 0.000
Exp-LR 0.434 0.605 1.190 0.015
Mean-LR 0.832 0.609 1.586 0.087
LC 0.565 0.027 0.687 < 0.01
Denmark Sup-LR 3.591 0.010 3.309 0.031
Exp-LR 0.850 0.042 1.114 0.006
Mean-LR 1.486 0.070 2.202 0.005
LC 0.925 < 0.01 1.153 < 0.01
Finland Sup-LR 2.845 0.285 4.255 0.097
Exp-LR 0.781 0.194 1.149 0.070
Mean-LR 1.467 0.162 2.095 0.057
LC 0.275 0.175 1.306 < 0.01
France Sup-LR 3.955 0.011 1.778 0.015
Exp-LR 1.509 0.010 0.785 0.013
Mean-LR 3.604 0.041 3.530 0.024
LC 1.462 < 0.01 1.277 < 0.01
UK Sup-LR 1.966 0.539 3.123 0.085
Exp-LR 0.496 0.519 0.888 0.067
Mean-LR 0.945 0.510 1.610 0.078
LC 1.041 < 0.01 0.913 < 0.01
Japan Sup-LR 3.120 0.052 5.873 0.002
Exp-LR 0.572 0.297 0.838 0.058
Mean-LR 0.910 0.520 1.355 0.121
LC 0.589 0.023 0.723 < 0.01
Norway Sup-LR 3.698 0.082 3.328 0.060
Exp-LR 0.992 0.041 0.876 0.061
Mean-LR 1.730 0.043 1.690 0.053
LC 0.729 < 0.01 0.983 < 0.01
Sweden Sup-LR 3.194 0.086 3.346 0.085
Exp-LR 0.750 0.140 0.914 0.061
Mean-LR 1.388 0.141 1.734 0.053
LC 0.692 < 0.01 0.994 < 0.01
US Sup-LR 3.426 0.016 7.464 0.000
Exp-LR 0.920 0.023 1.446 0.000
Mean-LR 1.768 0.022 1.396 0.105
LC 0.877 < 0.01 0.719 < 0.01
Note: The parameter stability test for all parameters are based on VAR (3) jointly estimates
Destek and Koksel Financial Innovation (2019) 5:21 Page 8 of 23
Based on the parameter instability for the full sample period, we used the rolling-window
estimation method to observe the relationship between inequality and credit expansion
among the sub-sample periods. Additionally, using this method lets us detect the presence
of a causal relationship between inequality and credit expansion during the financial
crisis periods.
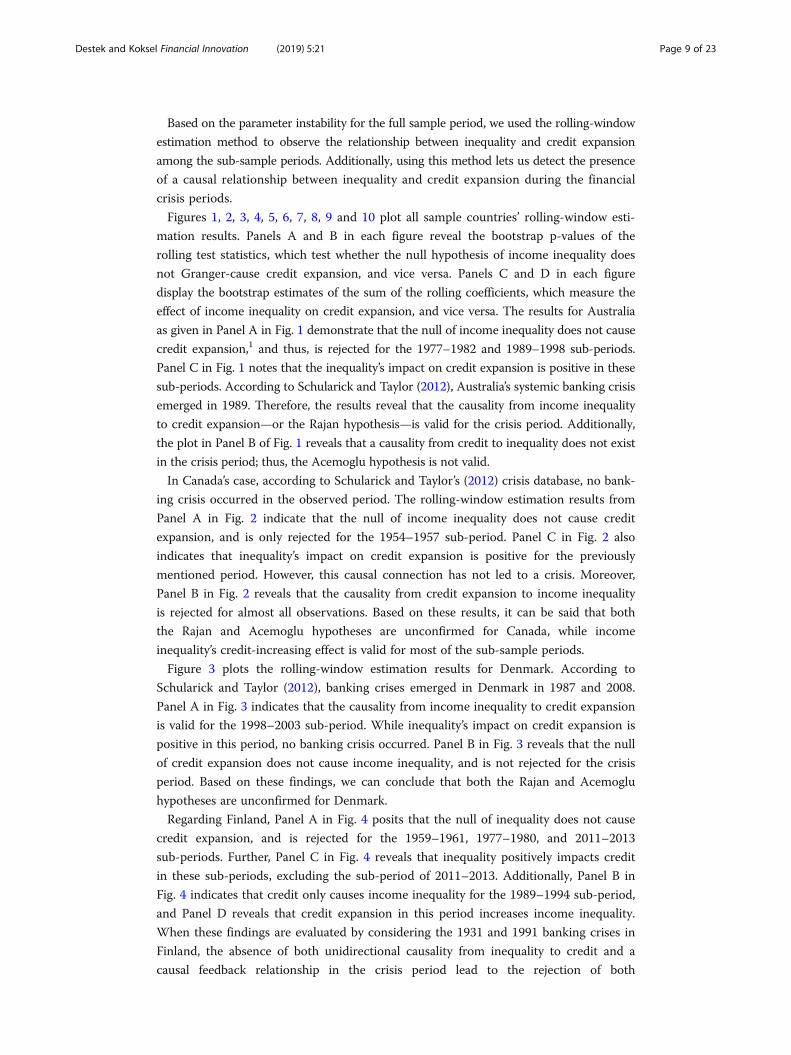
Figures 1, 2, 3, 4, 5, 6, 7, 8, 9 and 10 plot all sample countries’ rolling-window esti-
mation results. Panels A and B in each figure reveal the bootstrap p-values of the
rolling test statistics, which test whether the null hypothesis of income inequality does
not Granger-cause credit expansion, and vice versa. Panels C and D in each figure
display the bootstrap estimates of the sum of the rolling coefficients, which measure the
effect of income inequality on credit expansion, and vice versa. The results for Australia
as given in Panel A in Fig. 1 demonstrate that the null of income inequality does not cause
credit expansion,1 and thus, is rejected for the 1977–1982 and 1989–1998 sub-periods.
Panel C in Fig. 1 notes that the inequality’s impact on credit expansion is positive in these
sub-periods. According to Schularick and Taylor (2012), Australia’s systemic banking crisis
emerged in 1989. Therefore, the results reveal that the causality from income inequality
to credit expansion—or the Rajan hypothesis—is valid for the crisis period. Additionally,
the plot in Panel B of Fig. 1 reveals that a causality from credit to inequality does not exist
in the crisis period; thus, the Acemoglu hypothesis is not valid.
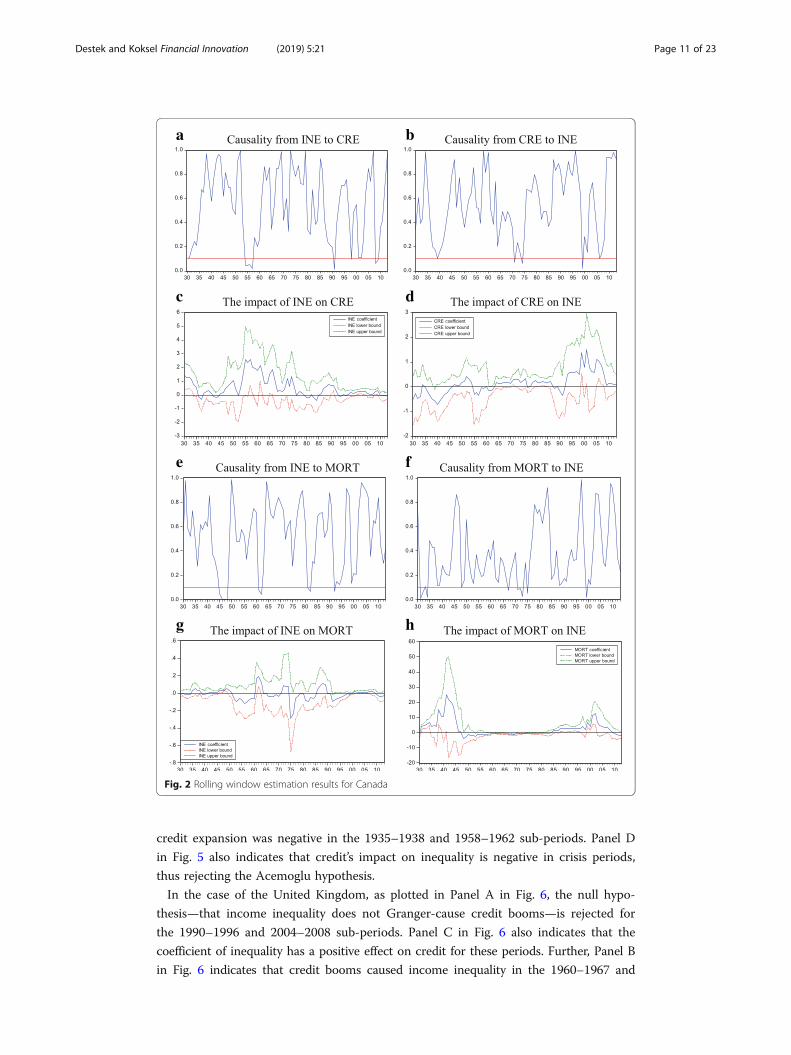
In Canada’s case, according to Schularick and Taylor’s (2012) crisis database, no bank-
ing crisis occurred in the observed period. The rolling-window estimation results from
Panel A in Fig. 2 indicate that the null of income inequality does not cause credit
expansion, and is only rejected for the 1954–1957 sub-period. Panel C in Fig. 2 also
indicates that inequality’s impact on credit expansion is positive for the previously
mentioned period. However, this causal connection has not led to a crisis. Moreover,
Panel B in Fig. 2 reveals that the causality from credit expansion to income inequality
is rejected for almost all observations. Based on these results, it can be said that both
the Rajan and Acemoglu hypotheses are unconfirmed for Canada, while income
inequality’s credit-increasing effect is valid for most of the sub-sample periods.
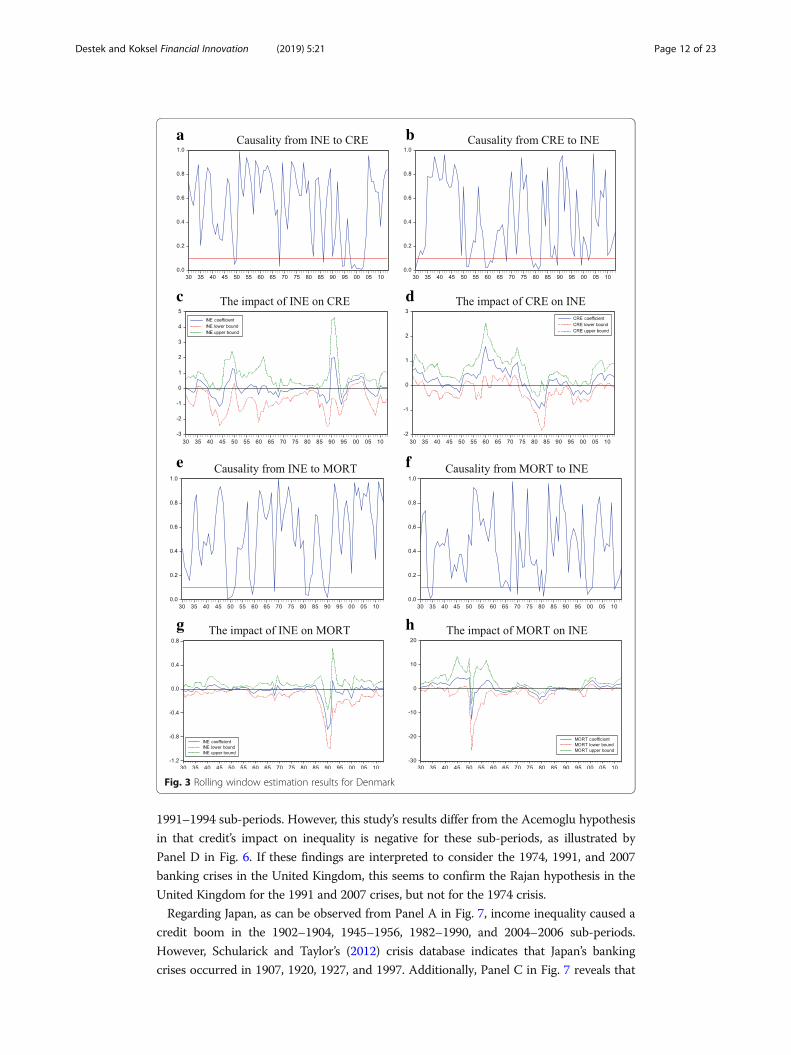
Figure 3 plots the rolling-window estimation results for Denmark. According to
Schularick and Taylor (2012), banking crises emerged in Denmark in 1987 and 2008.
Panel A in Fig. 3 indicates that the causality from income inequality to credit expansion
is valid for the 1998–2003 sub-period. While inequality’s impact on credit expansion is
positive in this period, no banking crisis occurred. Panel B in Fig. 3 reveals that the null
of credit expansion does not cause income inequality, and is not rejected for the crisis
period. Based on these findings, we can conclude that both the Rajan and Acemoglu
hypotheses are unconfirmed for Denmark.
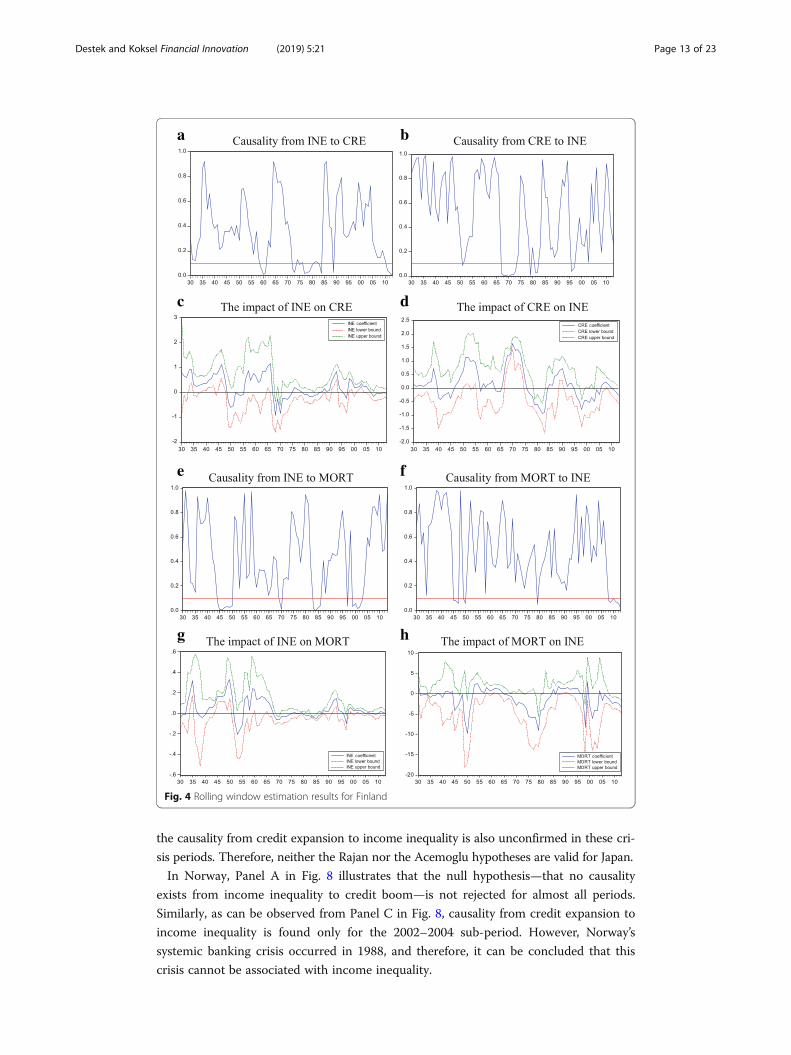
Regarding Finland, Panel A in Fig. 4 posits that the null of inequality does not cause
credit expansion, and is rejected for the 1959–1961, 1977–1980, and 2011–2013
sub-periods. Further, Panel C in Fig. 4 reveals that inequality positively impacts credit
in these sub-periods, excluding the sub-period of 2011–2013. Additionally, Panel B in
Fig. 4 indicates that credit only causes income inequality for the 1989–1994 sub-period,
and Panel D reveals that credit expansion in this period increases income inequality.
When these findings are evaluated by considering the 1931 and 1991 banking crises in
Finland, the absence of both unidirectional causality from inequality to credit and a
causal feedback relationship in the crisis period lead to the rejection of both
Destek and Koksel Financial Innovation (2019) 5:21 Page 9 of 23
hypotheses. The existence of causality from credit to inequality and credit’s positive
effect on inequality in the crisis period may occur due to financial crises’ increasing
of inequality.
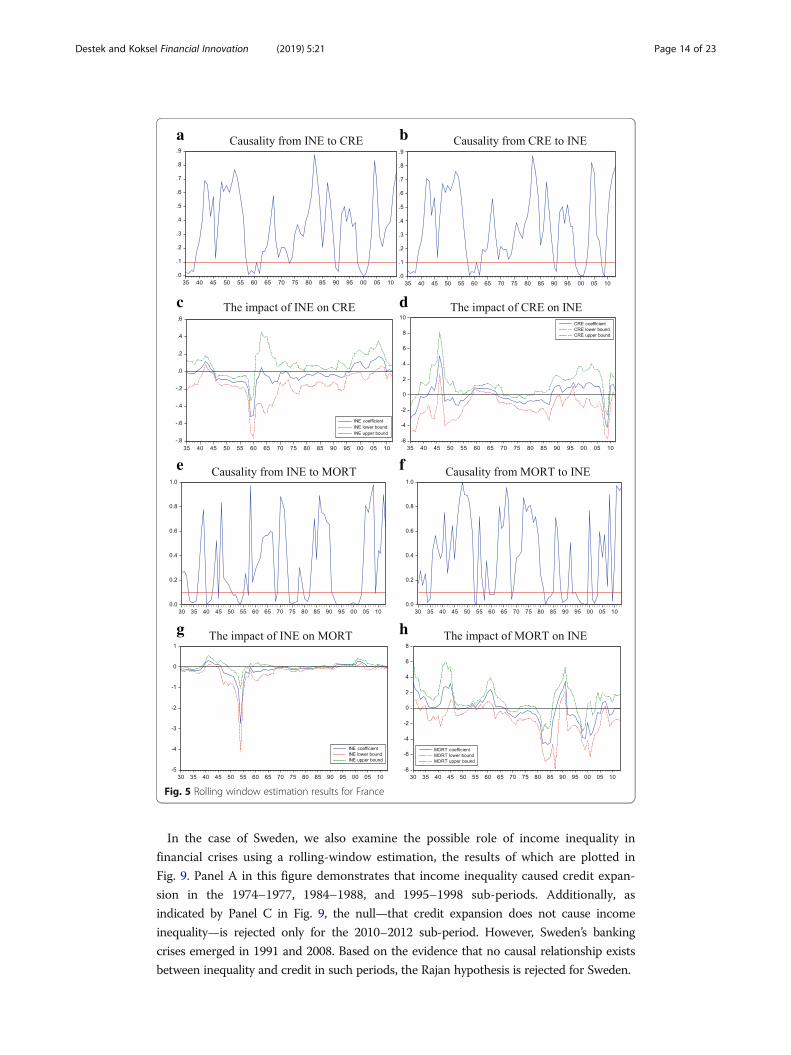
When the results are evaluated for France, Panel A in Fig. 5 indicates that income
inequality caused credit expansions in the 1935–1938, 1958–1962, and 1998–2002
sub-periods. According to Schularick and Taylor (2012), France’s banking crises
emerged in 1930 and 2008; therefore, no causality exists between inequality and credit
in these crisis periods. Additionally, Panel C in Fig. 5 reveals that inequality’s impact on
a b
c d
e f
g h
Fig. 1 Rolling window estimation results for Australia
Destek and Koksel Financial Innovation (2019) 5:21 Page 10 of 23
credit expansion was negative in the 1935–1938 and 1958–1962 sub-periods. Panel D
in Fig. 5 also indicates that credit’s impact on inequality is negative in crisis periods,
thus rejecting the Acemoglu hypothesis.
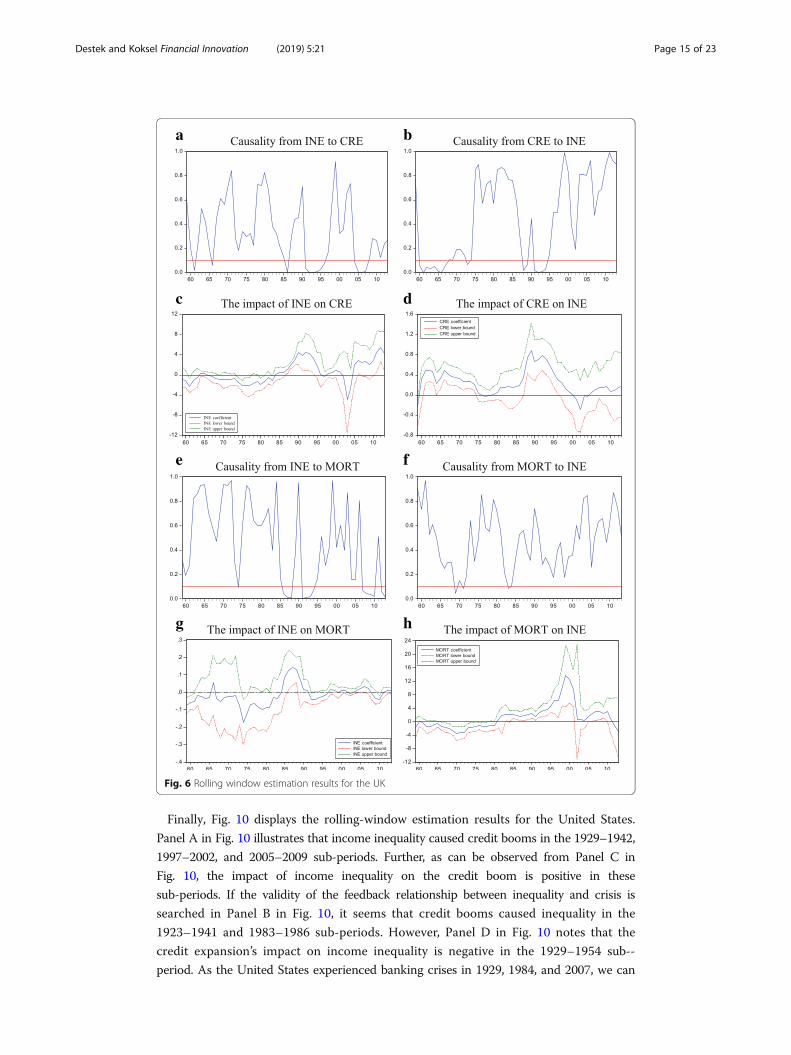
In the case of the United Kingdom, as plotted in Panel A in Fig. 6, the null hypo-
thesis—that income inequality does not Granger-cause credit booms—is rejected for
the 1990–1996 and 2004–2008 sub-periods. Panel C in Fig. 6 also indicates that the
coefficient of inequality has a positive effect on credit for these periods. Further, Panel B
in Fig. 6 indicates that credit booms caused income inequality in the 1960–1967 and
a b
c d
e f
g h
Fig. 2 Rolling window estimation results for Canada
Destek and Koksel Financial Innovation (2019) 5:21 Page 11 of 23
1991–1994 sub-periods. However, this study’s results differ from the Acemoglu hypothesis
in that credit’s impact on inequality is negative for these sub-periods, as illustrated by
Panel D in Fig. 6. If these findings are interpreted to consider the 1974, 1991, and 2007
banking crises in the United Kingdom, this seems to confirm the Rajan hypothesis in the
United Kingdom for the 1991 and 2007 crises, but not for the 1974 crisis.
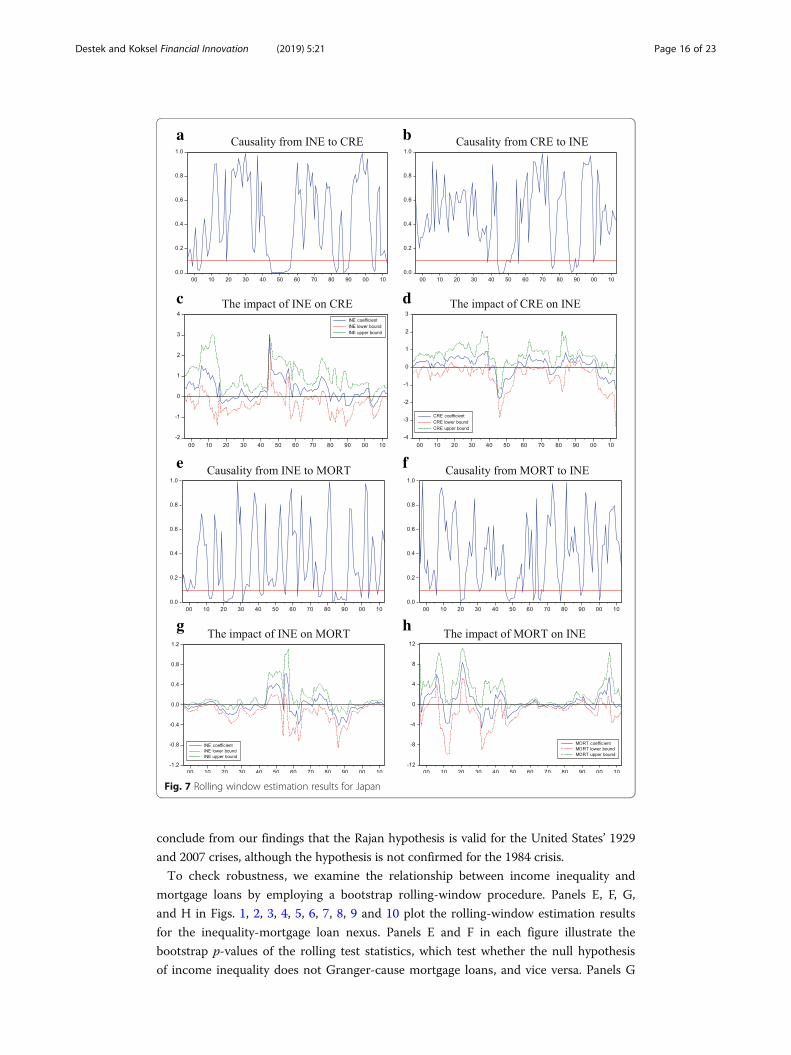
Regarding Japan, as can be observed from Panel A in Fig. 7, income inequality caused a
credit boom in the 1902–1904, 1945–1956, 1982–1990, and 2004–2006 sub-periods.
However, Schularick and Taylor’s (2012) crisis database indicates that Japan’s banking
crises occurred in 1907, 1920, 1927, and 1997. Additionally, Panel C in Fig. 7 reveals that
a b
c d
e f
g h
Fig. 3 Rolling window estimation results for Denmark
Destek and Koksel Financial Innovation (2019) 5:21 Page 12 of 23
the causality from credit expansion to income inequality is also unconfirmed in these cri-
sis periods. Therefore, neither the Rajan nor the Acemoglu hypotheses are valid for Japan.
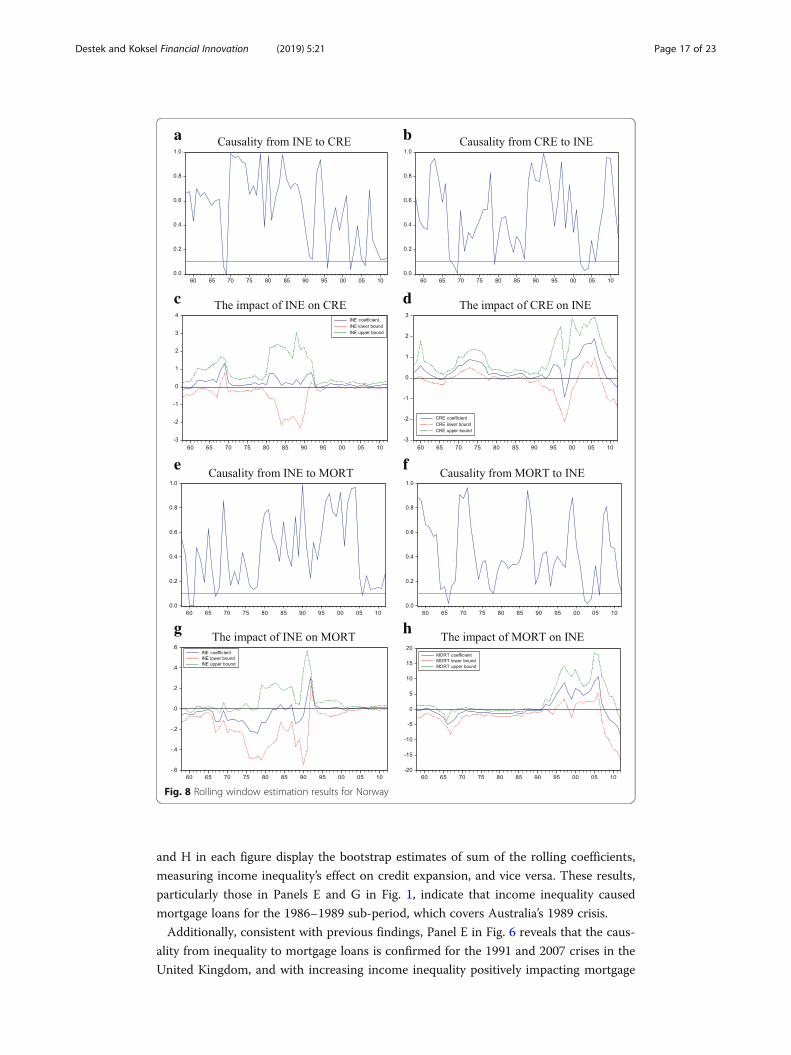
In Norway, Panel A in Fig. 8 illustrates that the null hypothesis—that no causality
exists from income inequality to credit boom—is not rejected for almost all periods.
Similarly, as can be observed from Panel C in Fig. 8, causality from credit expansion to
income inequality is found only for the 2002–2004 sub-period. However, Norway’s
systemic banking crisis occurred in 1988, and therefore, it can be concluded that this
crisis cannot be associated with income inequality.
a b
c d
e f
g h
Fig. 4 Rolling window estimation results for Finland
Destek and Koksel Financial Innovation (2019) 5:21 Page 13 of 23
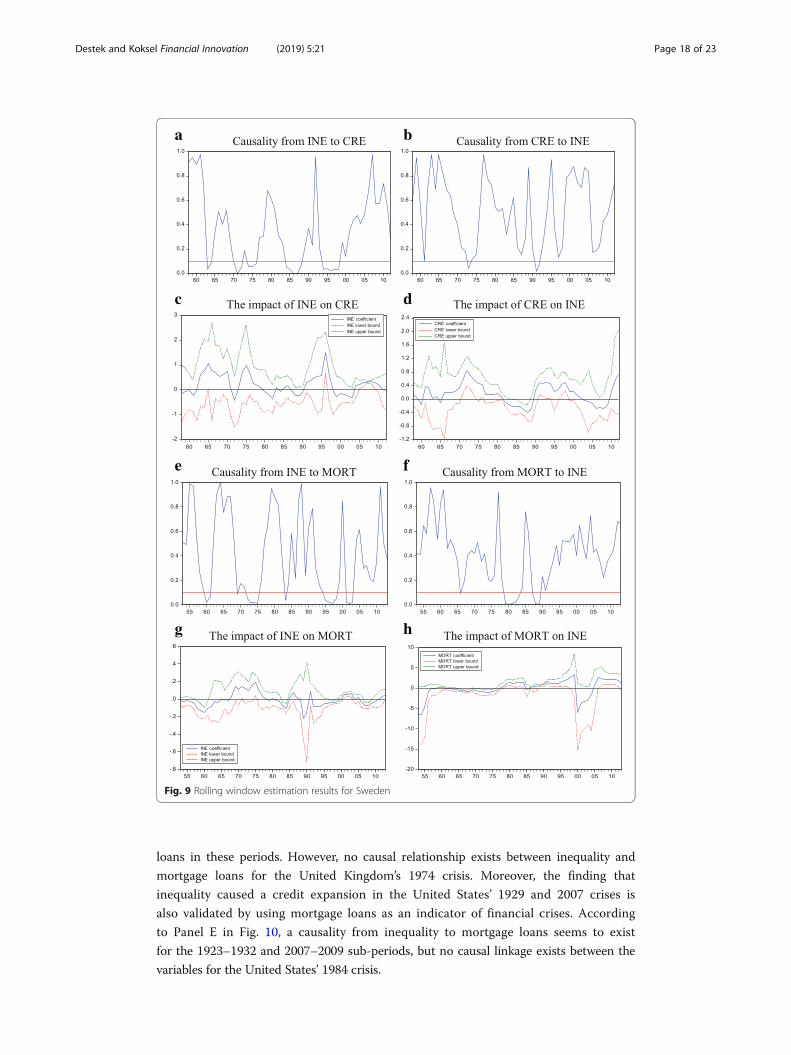
In the case of Sweden, we also examine the possible role of income inequality in
financial crises using a rolling-window estimation, the results of which are plotted in
Fig. 9. Panel A in this figure demonstrates that income inequality caused credit expan-
sion in the 1974–1977, 1984–1988, and 1995–1998 sub-periods. Additionally, as
indicated by Panel C in Fig. 9, the null—that credit expansion does not cause income
inequality—is rejected only for the 2010–2012 sub-period. However, Sweden’s banking
crises emerged in 1991 and 2008. Based on the evidence that no causal relationship exists
between inequality and credit in such periods, the Rajan hypothesis is rejected for Sweden.
a b
c d
e f
g h
Fig. 5 Rolling window estimation results for France
Destek and Koksel Financial Innovation (2019) 5:21 Page 14 of 23
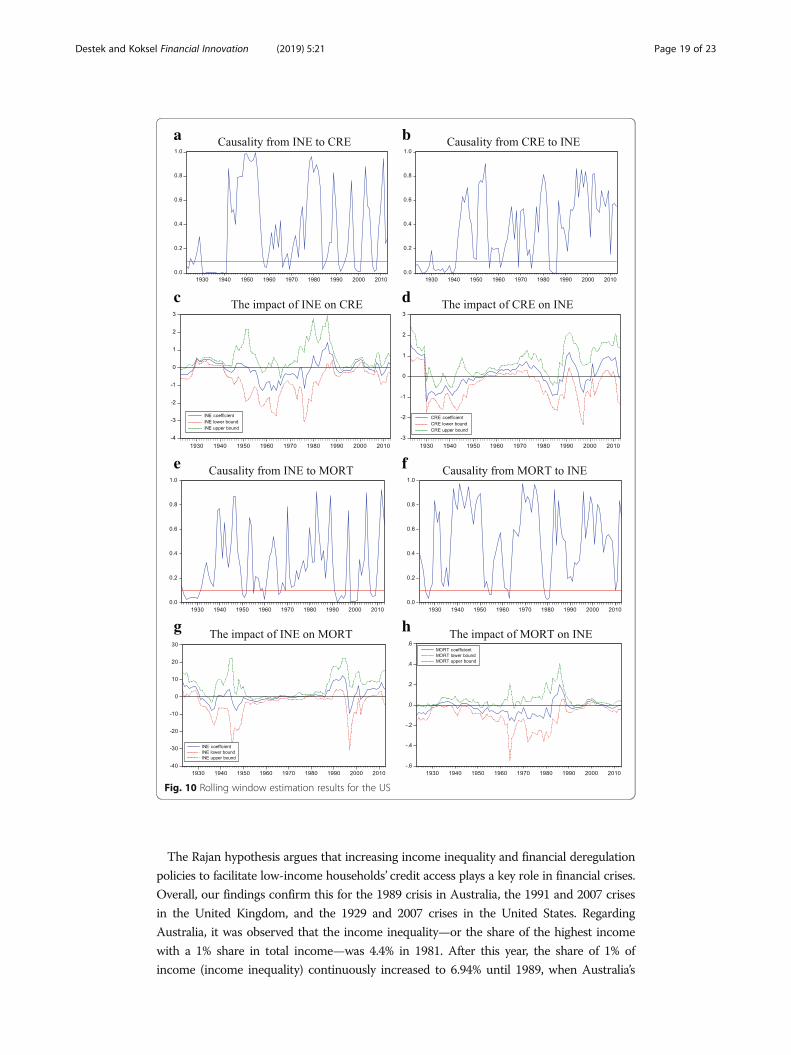
Finally, Fig. 10 displays the rolling-window estimation results for the United States.
Panel A in Fig. 10 illustrates that income inequality caused credit booms in the 1929–1942,
1997–2002, and 2005–2009 sub-periods. Further, as can be observed from Panel C in
Fig. 10, the impact of income inequality on the credit boom is positive in these
sub-periods. If the validity of the feedback relationship between inequality and crisis is
searched in Panel B in Fig. 10, it seems that credit booms caused inequality in the
1923–1941 and 1983–1986 sub-periods. However, Panel D in Fig. 10 notes that the
credit expansion’s impact on income inequality is negative in the 1929–1954 sub--
period. As the United States experienced banking crises in 1929, 1984, and 2007, we can
a b
c d
e f
g h
Fig. 6 Rolling window estimation results for the UK
Destek and Koksel Financial Innovation (2019) 5:21 Page 15 of 23
conclude from our findings that the Rajan hypothesis is valid for the United States’ 1929
and 2007 crises, although the hypothesis is not confirmed for the 1984 crisis.
To check robustness, we examine the relationship between income inequality and
mortgage loans by employing a bootstrap rolling-window procedure. Panels E, F, G,
and H in Figs. 1, 2, 3, 4, 5, 6, 7, 8, 9 and 10 plot the rolling-window estimation results
for the inequality-mortgage loan nexus. Panels E and F in each figure illustrate the
bootstrap p-values of the rolling test statistics, which test whether the null hypothesis
of income inequality does not Granger-cause mortgage loans, and vice versa. Panels G
a b
c d
e f
g h
Fig. 7 Rolling window estimation results for Japan
Destek and Koksel Financial Innovation (2019) 5:21 Page 16 of 23
and H in each figure display the bootstrap estimates of sum of the rolling coefficients,
measuring income inequality’s effect on credit expansion, and vice versa. These results,
particularly those in Panels E and G in Fig. 1, indicate that income inequality caused
mortgage loans for the 1986–1989 sub-period, which covers Australia’s 1989 crisis.
Additionally, consistent with previous findings, Panel E in Fig. 6 reveals that the caus-
ality from inequality to mortgage loans is confirmed for the 1991 and 2007 crises in the
United Kingdom, and with increasing income inequality positively impacting mortgage
a b
c d
e f
g h
Fig. 8 Rolling window estimation results for Norway
Destek and Koksel Financial Innovation (2019) 5:21 Page 17 of 23
loans in these periods. However, no causal relationship exists between inequality and
mortgage loans for the United Kingdom’s 1974 crisis. Moreover, the finding that
inequality caused a credit expansion in the United States’ 1929 and 2007 crises is
also validated by using mortgage loans as an indicator of financial crises. According
to Panel E in Fig. 10, a causality from inequality to mortgage loans seems to exist
for the 1923–1932 and 2007–2009 sub-periods, but no causal linkage exists between the
variables for the United States’ 1984 crisis.
a b
c d
e f
g h
Fig. 9 Rolling window estimation results for Sweden
Destek and Koksel Financial Innovation (2019) 5:21 Page 18 of 23
The Rajan hypothesis argues that increasing income inequality and financial deregulation
policies to facilitate low-income households’ credit access plays a key role in financial crises.
Overall, our findings confirm this for the 1989 crisis in Australia, the 1991 and 2007 crises
in the United Kingdom, and the 1929 and 2007 crises in the United States. Regarding
Australia, it was observed that the income inequality—or the share of the highest income
with a 1% share in total income—was 4.4% in 1981. After this year, the share of 1% of
income (income inequality) continuously increased to 6.94% until 1989, when Australia’s
a b
c d
e f
g h
Fig. 10 Rolling window estimation results for the US
Destek and Koksel Financial Innovation (2019) 5:21 Page 19 of 23
financial crisis occurred. An examination of the Australian economic policies in the
previously mentioned period revealed that a financial deregulation policy was introduced
in Australia in 1983. As a result, housing prices increased by 17% in real terms until 1990,
while the share of corporate debt in the national income increased to 60% (Gizycki and
Lowe 2000). Therefore, Rajan’s claims of increasing inequality as well as a subsequent
financial deregulation policy are consistent with our findings.
Regarding the United Kingdom, income inequality was 11.47% in 1950, then continu-
ously decreased to 6.54% until 1974, when the first crisis occurred. It was then observed
that this increased to 10.32% until the second crisis in 1991. This percentage then increased
to 15.44% in 2007. The fact that inequality significantly increased before the crises in 1991
and 2007 is consistent with our findings for the United Kingdom. Income inequality in the
United States, particularly before the 1929 and 2007 crisis periods, indicates that inequality
increased from 14.46% in 1920 to 19.6% in 1928. Similarly, observing the dimensions of
income inequality before the 2007 crisis reveals an inequality of 7.8% in 1970, which
increased to 18.33% in 2007. In short, the inequality in 2007 approached levels observed
prior to the Great Depression in the United States. Additionally, the fact that financial de-
regulation policies were implemented before both crises explains our findings’ consistency.
These findings confirm the primary argument that income inequality played a key
role in financial crises in Anglo-Saxon countries (Australia, the United Kingdom, and
the United States), and this may have originated from the Anglo-Saxon welfare state
model, which involves minimum regulatory policies and low-level social transfers.
Alternatively, the Rajan hypothesis is unconfirmed for countries that follow Scandinavian
or continental European welfare state models.
Conclusions and policy implicationsThis study aimed to examine the possible role of income inequality in financial crises
by using historical data from 10 developed countries. For this purpose, the relationship
between the Gini coefficient and credit expansion is investigated using the full-sample
bootstrap Granger causality and bootstrap rolling-window estimation procedures.
The full-sample bootstrap Granger causality test results indicate that a unidirectional
causality exists from income inequality to credit expansion for Australia, Canada, Sweden,
and the United States. This finding suggests the Rajan hypothesis’ validity in these
countries. Moreover, a bidirectional causality exists in Japan between income inequality
and credit expansion as argued by the Acemoglu hypothesis, although this finding reveals
that no causal connection exists between inequality and credit expansion in Finland,
France, and Norway. After this procedure, we employed parameter stability tests to deter-
mine the reliability of the full sample’s findings, the results of which reject parameter
stability for all countries. Therefore, we conclude that the previous studies based on
parameter stability and the assumption of a stable relationship over the full sample may
be unreliable. Consequently, we used a rolling-window estimation procedure to observe
the causal linkages among the sub-samples.
The rolling-window estimation results imply that inequality had a positive, predictive role
on credit booms in Australia’s 1989 crisis, the 1991 and 2007 crises in the United Kingdom,
and the 1929 and 2007 crises in the United States. Therefore, the Rajan hypothesis is
confirmed for these crises. These findings are similar to those from Gu and Huang (2012)
and Ahlquist and Ansell (2012) regarding the countries in which the hypothesis is valid.
Destek and Koksel Financial Innovation (2019) 5:21 Page 20 of 23
However, this study contrasts these works by revealing that the hypothesis is valid for
certain financial crises, contrary to the claim that the Rajan hypothesis is valid for all
financial crises experienced in the previously mentioned countries. On one hand, eva-
luating the countries where income inequality played an active role in their financial
crises (Australia, the United Kingdom, and the United States) indicates that they have
connected with the Anglo-Saxon welfare state model, which involves minimum
income-redistribution and regulatory policies in the labor market. On the other hand,
it can be argued that the countries where income inequality did not play a key role in
financial crisis depend on the Scandinavian welfare state model (Denmark, Finland,
Norway, and Sweden), which is based on the fair distribution of income and social
inclusion principles, as well as the continental European welfare state model (France), in
which ownership and individual enterprises exist based on strict governmental control.
Based on these findings, it is possible to argue that policy measures to deter the problems
of increased income inequality and facilitate credit access among low-income segments by
deregulating certain sectors will increase repayment risks and create pressure on the finan-
cial system. Therefore, this study’s findings suggest that a progressive taxation policy or
investments to accumulate human capital and increase the qualified labor force are more
rational than temporary solutions, such as decreasing loan interest rates to facilitate access
of low-income segments to financial instruments. The increase in human capital invest-
ments will also help lower the inequality of education in the society by raising the level of
education of low-income people who are unable to increase their income level and help
them to work with higher wages which reduce the income inequality in the society.
Finally, there are some limitations of this study. First, this study uses time series
methods and the shock dependence between countries is ignored. Therefore, in the
future studies, the role of the income inequality in the crisis of observed countries can
be examined with the second-generation panel data methods which take into account
the cross-sectional dependence among countries. Furthermore, this paper only
considers the developed countries due to lack of data set. In future studies, the effects
of income inequality especially for developing economies should be examined.
AbbreviationsARDL: Autoregressive Distributed Lag; CRE: Credit Expansion; INE: Income Inequality; OLS: Ordinary Least Squares;VAR: Vector Autoregression
AcknowledgementsNot applicable.
FundingWe do not receive any financial assistance from any agency. All the cost associated with preparing article bear byauthors solely.
Availability of data and materialsUpon request in future, we, at this moment, confirming that all the pertinent information will be disclosed for furtheruse.
Authors’ contributionsThe concept and design, data collection and empirical study of this article come from MAD and finally critical reviewimport intellectual content assessment is done by BK and effort by authors in the article, the ration of contributionequally likely. Both authors read and approved the final manuscript.
Competing interestsThe authors declare that they have no competing interests.
Destek and Koksel Financial Innovation (2019) 5:21 Page 21 of 23
Publisher’s NoteSpringer Nature remains neutral with regard to jurisdictional claims in published maps and institutional affiliations.
Received: 3 October 2018 Accepted: 15 April 2019
ReferencesAcemoglu D. (2011). Thoughts on inequality and the financial crisis, http://economics.mit.edu/files/6348Ahlquist, JS, Ansell B (2012). Electoral institutions, credit, and political responses to economic polarization, unpublished
MimeoAndrews DWK (1993) Tests for parameter instability and structural change with unknown change point. Econometrica 61:
821–856Andrews DWK, Ploberger W (1994) Optimal tests when a nuisance parameter is present only under the alternative.
Econometrica 62:1383–1414Balcilar M, Ozdemir ZA, Arslanturk Y (2010) Economic growth and energy consumption causal nexus viewed through a
bootstrap rolling window. Energy Econ 32(6):1398–1410Bernanke BS, Gertler M, Gilchrist S (1999) The financial accelerator in a quantitative business cycle framework. Handbook of
Macroeconomics 1:1341-1393Bordo MD, Meissner CM (2012) Does inequality lead to a financial crisis? J Int Money Financ 31(8):2147–2161Borio C, Furfine C, Lowe P (2001) Procyclicality of Financial Systems and Financial Stability: Issues and Policy Options. BIS
Paper no. 1, Bank for International Settlements, BaselCarrion-i-Silvestre JL, Kim D, Perron P (2009) GLS-based unit root tests with multiple structural breaks under both the null and
the alternative hypotheses. Economet Theor 25(6):1754–1792Corsetti C, Pesenti P, Roubini N (1999) What caused the Asian currency and financial crisis? Jpn World Econ
11(3):305–373Dell’Ariccia G, Marquez R (2006) Lending booms and lending standards. J Financ 51(5):2511–2546Dosi G, Fagiolo G, Napoletano M, Roventini A (2013) Income distribution, credit and fiscal policies in an agent-based
Keynesian model. J Econ Dyn Control 37(8):1598–1625Efron B (1979) Bootstrap methods: another look at the jackknife. Ann Stat 7:1–26Fasianos A, Raza H, Kinsella S (2017) Exploring the link between household debt and income inequality: an asymmetric
approach. Applied Economics Letters 24(6): 404-409Fisher I (1932) Booms and depressions. Adelphi, New YorkFisher I (1933) The debt-deflation theory of great depressions. Econometrica 1(4):337–357Galbraith JK (2012) Inequality and instability: a study of the world economy just before the great crisis. Oxford University
Press, OxfordGizycki M, Lowe P (2000) The Australian financial system in the 1990s. In: Australian Economy in the 1990s. Proceedings of a
conference, Reserve Bank of Australia, Sydney, pp 180–215Gu X, Huang B (2012) An empirical examination of the inequality, leverage and crisis nexus, (Mimeo)Hacker RS, Hatemi-J A (2006) Tests for causality between integrated variables using asymptotic and bootstrap distributions:
theory and application. Appl Econ 38(13):1489–1500Kashif M, Iftikhar SF, Iftikhar K (2016) Loan growth and bank solvency: evidence from the Pakistani banking sector. Financ
Innov 2(1):22Kindleberger CP (1978) Manias, panics, and crashes: a history of financial crisis. Basic Books, New YorkKirschenmann K, Malinen T, Nyberg H (2016) The risk of financial crises: is there a role for income inequality? J Int Money
Financ 68:161–180Krueger A (2012) The Rise and Consequences of Inequality in the United States, presentation at the Center for
American Progress, Washington 12 January 2012, http://www.whitehouse.gov/sites/default/files/krueger_cap_speech_final_remarks.pdf
Kumhof M, Rancière R, Winant P (2015) Inequality, leverage, and crises. Am Econ Rev 105(3):1217–1245Lorenzoni G (2005) ‘Inefficient credit booms’, Department of Economics (online), Massachusetts institute of technologyMahmoud S, Niguez TM (2015) Does income inequality have a role in financial crises?Malinen T (2013) Is there a relationship between income inequality and credit cycles? In: Society for the study of economic
inequality working paper series, pp 2013–2292Milanovic B (2009) Two views on the cause of the global crisis—part I. Yale Global Online http://yaleglobal.yale.edu/content/
two-views-global-crisisMinsky HP (1975) John Maynard Keynes. McGraw-Hill Professional, New YorkMinsky HP (1982) Can ‘It’ Happen Again? Essays on Instability and Finance. M. E. Sharpe, ArmonkMinsky HP (1986) Stabilizing an unstable economy. McGraw-Hill Professional, New YorkPalley T (2012) From financial crisis to stagnation: the destruction of shared prosperity and the role of economics. Cambridge
University Press, CambridgePerugini C, Hölscher J, Collie S (2015) Inequality, credit and financial crises. Cambridge Journal of Economics 40(1): 227-257Phillips PCB, Hansen BE (1990) Statistical inference in instrumental variables regression with I (1) processes. Rev Econ
Stud 57:99–125Rajan R (1994) Why bank credit policies fluctuate: a theory and some evidence. Q J Econ 109:399–441Rajan RG (2010) Fault Lines. Princeton University Press, PrincetonReich R (2010) Aftershock: the next economy and America’s future. Knopf, New YorkRoubini N (2011). The Instability of Inequality, https://www.project-syndicate.org/commentary/the-instability-
ofinequality?barrier=accesspaylogRusso A, Riccetti L, Gallegati M (2016) Increasing inequality, consumer credit and financial fragility in an agent based
macroeconomic model. J Evol Econ 26(1):25–47
Destek and Koksel Financial Innovation (2019) 5:21 Page 22 of 23
Schularick M, Taylor AM (2012) Credit booms gone bust: monetary policy, leverage cycles, and financial crises, 1870–2008.Am Econ Rev 102(2):1029–1061
Stiglitz JE (2012) The Price of inequality: how Today’s divided society endangers our future. W. W. Norton,Princeton
Toda HY, Yamamoto T (1995) Statistical inference in vector autoregressions with possibly integrated processes. J Econ66(1):225–250
Van Treeck T (2014) Did inequality cause the US financial crisis. J Econ Surv 28(3):421–448Yamarik S, El-Shagi M, Yamashiro G (2016) Does inequality lead to credit growth? Testing the Rajan hypothesis using state-
level data. Econ Lett 148:63–67
Destek and Koksel Financial Innovation (2019) 5:21 Page 23 of 23