Embed Size (px)
Citation preview
INCOME INEQUALITY:
ANALYSIS AND RECOMMENDATION USING THE BARDACH METHOD
A Thesis
Presented to the faculty of the Department of Public Policy and Administration
California State University, Sacramento
Submitted in partial satisfaction of
the requirements for the degree of
MASTER OF PUBLIC POLICY AND ADMINISTRATION
by
Michael W. Billingsley
SPRING
2014

ii
© 2014
Michael W. Billingsley
ALL RIGHTS RESERVED
iii
INCOME INEQUALITY:
ANALYSIS AND RECOMMENDATION USING THE BARDACH METHOD
A Thesis
by
Michael W. Billingsley
Approved by:
__________________________________, Committee Chair
Robert W. Wassmer, Ph.D.
__________________________________, Second Reader
Su Jin Jez, Ph.D.
____________________________
Date

iv
Student: Michael W. Billingsley
I certify that this student has met the requirements for format contained in the University format
manual, and that this thesis is suitable for shelving in the Library and credit is to be awarded for
the thesis.
__________________________, Department Chair ___________________
Robert W. Wassmer, Ph.D. Date
Department of Public Policy Administration
v
Abstract
of
INCOME INEQUALITY:
ANALYSIS AND RECOMMENDATION USING THE BARDACH METHOD
by
Michael W. Billingsley
This thesis examines current income distribution in the U.S. An increasing number of
researchers, scholars, and interested citizens find the large and growing difference between
incomes at the very top of the U.S. income scale and the rest of society as a problem for the
economic, social and political well being of the nation. This thesis examines U.S. income
distribution, and analyzes income inequality using the Bardach (2009) method. The Bardach
(2009) method requires; presenting a problem statement (in this thesis that problem is that current
U.S. income dispersion is too great), presenting evidence that supports this claim, developing and
accessing alternatives, confronting the tradeoffs in choosing one alternative over another, and
then making a recommendation. In this thesis, the problem definition is followed by a literature
review of the theories that inform the debate and a review of the literature that describes the most
common alternative mitigation strategies.
This thesis uses an outcomes matrix as suggested by Bardach (2009) to confront the
tradeoffs and assess the alternatives identified in the literature against a set of decision criteria.
The outcomes matrix illustrates that very few of the alternatives sufficiently fulfilled the entire
criteria standard. In most cases, this was due to the unlikely prospect of garnering sufficient
political support. However, one alternative, investing in infrastructure, appeared to satisfy the
vi
criteria better than the others did. Therefore, this alternative is the cornerstone of a
recommendation to invigorate the economy and reduce income inequality. This thesis presents a
final recommendation that consists of re-calibrating estate taxes to produce revenue for a
comprehensive infrastructure program that will not only lower income inequality, but also boost
middle class jobs and make America more competitive.
_______________________, Committee Chair
Robert W. Wassmer, Ph.D.
_______________________
Date
vii
ACKNOWLEDGEMENTS
This thesis is the culmination of a long and awesome journey. It is fitting at this
time to acknowledge those people who shared it with me and helped make it possible.
First I would like to thank my professors who gave so much to me. I thank you for
helping me to see everything in a new and different way. I think most of us who enter the
PPA program think we are pretty darn smart, I know I did. You all taught me I was not as
smart as I thought I was, but also showed me it was possible to know things and
understand in ways I never imagined. Dr. Rob Wassmer, department chair, first thesis
reader, advisor, and host of great holiday parties, I thank you for all the time, attention
and effort you expended on my behalf. You should be proud of the work you do. I know I
feel very fortunate to have met and learned from you. Now I love economics, who would
have guessed! To Dr. Su Jin Jez, my second thesis reader, thank you for all your excellent
edits, suggestions, and instruction. To Dr. Mary Kirlin, that first weekend I thought,
“what the H*ll am I doing here?” You helped me answer that question, and brought a
passion and depth to the many classes you taught in which I had the good fortune to be a
student. I will always endeavor to “tell people what they need to know, not what I know.”
No mention of the Sacramento State PPA program is complete without acknowledging
the glue that holds everything together, knows where everything goes, when it has to get
there, and how many times Rob has to sign it, to the Great Suzi Byrd. Thank you, thank
you, and thank you.

viii
I made some great friends during this journey. I thank you, Heather Kendrick,
Tracey Dickinson, Katie Cardenas, Ryan Ong, Stephen Tupolo, for your friendship,
support, and the memorable times we shared honing our skills for the real world. Now
let’s take over! Outside of the PPA grogram but definitely part of this journey are my
friends from the Center for Strategic Economic Research. I want to thank Deputy
Director Helen Schaubmayer, Director Ryan Sharp, (sorry I had to put Helen first!),
Celeste Silvera and everybody else at SACTO. I learned a lot at CSER and really added
another level of expertise and research ability working with you.
There is no way any of this journey would have happened, or mattered, without
my beautiful, genius, talented, and loving, wife Sarah. We both got our Master’s degrees
at the same time, so it could get a little crazy, but never between us. When I was a kid I
would hear people say, “My wife is my best friend,” and I would think, “What a loser!”
Now my wife is not only my best friend, she is my everything. I love you forever and for
always, my sun and stars, thank you.
ix
TABLE OF CONTENTS
Page
Acknowledgements ................................................................................................................ vii
List of Tables .......................................................................................................................... xv
List of Figures ......................................................................................................................... xvi
Chapter
1. INTRODUCTION ............................................................................................................. 1
Why Income Inequality Matters: Societal, Economic and Political Effects ................. 3
Societal Effects ............................................................................................................. 3
Economic Effects .......................................................................................................... 5
Intergenerational Income Mobility ............................................................................... 7
Political Effects ............................................................................................................ 9
Income Inequality, definition and measurement ......................................................... 11
Gini Coefficient .......................................................................................................... 12
Historical Trends in U.S. Inequality ........................................................................... 15
Early America-post Civil War (1776-1900) .................................................. 15
20th Century Inequality Developments .......................................................... 16
Post World War 2 – The Great Compression to Reagan (1945-1980) .......... 17
The Great Divide 1980- present ..................................................................... 18
Current Conditions ...................................................................................................... 20
Chapter Conclusion ..................................................................................................... 24
2. THEORETICAL LITERATURE REVIEW ..................................................................... 26
Marginal Product Theory ........................................................................................... 27
People Get What They Deserve ..................................................................... 27
x
Redistribution ............................................................................................................. 29
The Traditional Government Response to Income Inequality – Definition .......
Justification, and Philosophy ......................................................................... 29
Equity, Efficiency, and the Leaky Bucket ..................................................... 30
Pareto Optimal Efficiency ............................................................................. 32
Kahldor-Hicks Compensation Principle ........................................................ 34
Redistributive Tax and Transfer Policy ......................................................... 36
Progressive Income Tax and Redistribution .................................................. 36
Changes in Tax Progressivity ........................................................................ 38
Corporate Tax ................................................................................................ 38
Wealth Transfer Taxes, the Estate Tax .......................................................... 40
Government Expenditure Programs ............................................................... 42
Government Transfers: Effect on Income Dispersion .................................. 43
Criticism of Transfer Programs ..................................................................... 44
Chapter Conclusion ..................................................................................................... 45
3. CONSTRUCTING ALTERNATIVES ............................................................................. 46
Let Present Trends Continue – Do Nothing ................................................................ 48
Financial Regulation – Why it Matters ....................................................................... 49
Focusing Event ........................................................................................................... 50
Rent Seeking ............................................................................................................... 51
Federal Reserve Dual Mandate ................................................................................... 52
Regulate Campaign Finance ....................................................................................... 53
Regulate the Banks ........................................................................................................... 54
xi
Reinstate Glass-Steagall, Limit Risk Taking .............................................................. 54
Break Up “Too Big to Fail” Banks ............................................................................. 54
Reform the Mortgage Deduction ..................................................................................... 55
Bankruptcy Reform .......................................................................................................... 56
Educational Debt and Student Loans ............................................................................... 57
Enact Universal Health Care ............................................................................................ 58
Re-Unionize U.S. Labor Force......................................................................................... 59
Invest in Education, Especially for the Economically Disadvantaged ............................. 60
Invest in Infrastructure ..................................................................................................... 62
Chapter Conclusion .......................................................................................................... 63
4. ASSESSMENT CRITERIA .............................................................................................. 64
Sufficiency .................................................................................................................. 66
Sustainability .............................................................................................................. 66
Least Disruptive to Market ......................................................................................... 66
Political Feasibility ..................................................................................................... 67
5. OUTCOMES MATRIX ................................................................................................... 69
Outcomes Matrix Methodology ................................................................................. 69
Criterion Weights ........................................................................................................ 70
Criterion Measurement Scale ...................................................................................... 70
Changes in Economic Structure – Financial Regulation ............................................ 71
Alternative #1: Reinstate Glass-Steagall .................................................................... 72
Probable Outcomes and Trade Offs ............................................................................ 72
Sufficiency ..................................................................................................... 73
xii
Sustainability ................................................................................................. 73
Least Disruptive to Market ............................................................................ 74
Political Feasibility ........................................................................................ 74
Alternative #2: Break Up “Too Big to Fail” Banks .................................................... 75
Probable Outcomes and Trade Offs ............................................................................ 76
Sufficiency ..................................................................................................... 76
Sustainability ................................................................................................. 76
Least Disruptive to Market ............................................................................ 77
Political Feasibility ........................................................................................ 77
Alternative #3: Recalibrate Federal Reserve Policy to Fulfill its Dual ...........................
Mandate ...................................................................................................................... 78
Probable Outcomes and Trade Offs ............................................................................ 79
Sufficiency ..................................................................................................... 80
Sustainability ................................................................................................. 80
Least Disruptive to Market ............................................................................ 80
Political Feasibility ........................................................................................ 81
Alternative #4: Reform the Mortgage Deduction ....................................................... 82
Probable Outcomes and Trade Offs ........................................................................... 82
Sufficiency ..................................................................................................... 83
Sustainability ................................................................................................. 83
Least Disruptive to Market ............................................................................ 83
Political Feasibility ........................................................................................ 84
Alternatives that Change the Outcomes of Inequality ................................................ 85
xiii
Alternative #5: Universal Health Care ........................................................................ 85
Probable Outcomes and Trade Offs ............................................................................ 86
Sufficiency ..................................................................................................... 86
Sustainability ................................................................................................. 87
Least Disruptive to Market ............................................................................ 87
Political Feasibility ........................................................................................ 87
Alternative #6: Re-Unionize Labor Force .................................................................. 88
Probable Outcomes and Trade Offs ............................................................................ 89
Sufficiency ..................................................................................................... 89
Sustainability ................................................................................................. 90
Least Disruptive to Market ............................................................................ 90
Political Feasibility ........................................................................................ 91
Alternative #7: Infrastructure Investment ................................................................... 92
Probable Outcomes and Trade Offs ............................................................................ 92
Sufficiency ..................................................................................................... 93
Sustainability ................................................................................................. 93
Least Disruptive to Market ............................................................................ 93
Political Feasibility ........................................................................................ 94
Chapter Conclusion ..................................................................................................... 95
6. RECOMMENDATIONS ............................................................................................... .97
Recommendations ....................................................................................................... 98
How They Were Developed .......................................................................... 98
Recommendation: Recalibrate Estate Tax Rates to 2000 Levels................................ 99
xiv
Raise $1 Trillion in Revenue in 10 Years ...................................................... 99
Recommendation: Invest $1 Trillion Estate Tax Revenue ....................................... 101
Rebuild U.S. Infrastructure .......................................................................... 101
The U.S. Needs Investment in Infrastructure ............................................... 102
Infrastructure Benefits All Income Groups .................................................. 104
Infrastructure and Income Inequality ............................................................................. 104
More Good Jobs, More Competitive Business; Less Inequality .................. 104
Infrastructure and Jobs ................................................................................. 105
What Can Be Expected ................................................................................ 105
Input-Output Analysis .................................................................................. 105
Comparative Analysis of Average Jobs Created Estimates Range .............. 107
Sufficiency ................................................................................................... 109
Sustainability ............................................................................................... 109
Least Disruption to Market .......................................................................... 110
Political Feasibility ...................................................................................... 111
Chapter Conclusion ........................................................................................................ 114
Thesis Conclusion ......................................................................................................... 114
References ..................................................................................................................... 119
xv
LIST OF TABLES
Tables Page
1. Outcomes Matrix – Alternative #1 – Reinstate Glass-Steagall .................................... 75
2. Outcomes Matrix – Alternative #2 – Break Up “Too Big to Fail” Banks .................. 78
3. Outcomes Matrix – Alternative #3 – Recalibrate Federal Reserve Policy ................. 82
4. Outcomes Matrix – Alternative #4 – Reform the Mortgage Deduction ..................... 84
5. Outcomes Matrix – Alternative #5 – Universal Health Care ....................................... 88
6. Outcomes Matrix – Alternative #6 – Re-Unionize U.S. Labor Force ......................... 92
7. Outcomes Matrix – Alternative #7 – Infrastructure Investment .................................. 94
8. Final Outcomes Matrix ................................................................................................ 96
9. Job Creation Comparison .......................................................................................... 108
xvi
LIST OF FIGURES
Figures Page
1. The Great Gatsby Curve ............................................................................................... 9
2. Gini Coefficient Model with Lorenz Curve ................................................................. 14
3. Top Deciles Income Trends from 1913-2008 .............................................................. 18
4. Income Gains 1979-2007 ............................................................................................. 19
5. Wage/ Productivity Disconnect .................................................................................. 20
6. Change in Median Household Incomes 2000-2010 ..................................................... 21
7. Union Membership and Middle Class Income Share ................................................. 60
1
Chapter 1
INTRODUCTION
The manner in which economic rewards are distributed in a society has been
an important, and divisive, topic. Around 100 CE the ancient Greek philosopher Plutarch
is attributed with the comment, “An imbalance between rich and poor is the oldest and
most fatal ailment of all republics” (Hacker & Pierson, 2010, p.75). Today positions on
income inequality range from ideas that the focus on a more equitable distribution of
rewards is about “envy and class warfare” (Luhby, 2012) to Warren Buffet’s assertion
that the wealthy are being “coddled” and that the tax code is reverse class warfare being
waged on the middle and lower class (Bradford, 2011).
This thesis examines income inequality, presents the historical and current levels
of United States income dispersion, explains the research on the societal, health,
economic and political consequences of inequality, and then proposes recommendations
for government action intended to mitigate this condition as well as the criteria that is
used to evaluate the mitigation strategies. This thesis uses a set of basic assumptions
about income inequality. Those assumptions are that markets are dependent upon
governmental regulation and therefore government has an important and appropriate role
in lessening income inequality and that huge differences in the distribution of economic
rewards in a society are important indicators of the fairness of that society.
This thesis utilizes the strategy and philosophy of policy analysis elucidated by
Bardach (2009). This intuitive approach consists of defining a precise problem,
2
collecting relevant evidence, stating a set of alternative approaches, deciding on the
appropriate decision criteria to assess the alternatives, imagining the probable outcomes
of implementation of the alternatives, realistically facing the trade-offs inherent in the
respective alternatives, and then deciding on the most appropriate approach informed by
the analysis.
The thesis follows this analysis strategy and concentrates on the trade-offs
between mitigation strategies and probable real world outcomes. A concentration on
trade-offs is appropriate because strategies intended to mitigate income inequality will
likely consist of some recalibration of market or taxation levels or processes.
Governmental intervention into the market is necessary but also comes with risks. Poor
outcomes resulting from governmental intervention are sometimes characterized as
“government failure” (Mintrom, 2012). Government failure can be understood as a
situation where attempts to mitigate a problem create more problems than they solve, or
where “the cure is worse than the disease.” In this case, the disease is income inequality,
or more precisely the current level of inequality in U.S. incomes. This thesis does not
propose attempts to produce complete equality. Some inequality is natural in the human
world. This is generally a result of variation in individual’s effort, needs and abilities
(Colander, 2008). However, current income inequality in the U.S. is at levels that are not
completely indicative of these aspects of individual traits. This thesis will concentrate on
solutions to the problem that current levels of income inequality in the U.S. are too great.
The remaining sections of Chapter 1 present the basic context of income
inequality in America. First, I discuss why income inequality matters and is an
3
appropriate topic for a thesis. Then the most utilized income inequality metric, the Gini
Coefficient, is explained, followed by a historical overview of inequality trends and a
description of the current condition. This chapter concludes with a brief outline of the
remaining chapters of this thesis.
Why Income Inequality Matters: Societal, Economic and Political Effects
Is it a concern that some have so much and others so little? Is it simple envy or
class warfare that causes so many to look negatively at such a vastly unequal distribution
of income? There is some debate about whether income inequality should be viewed as a
concern or a necessary outcome of a competitive and dynamic market economy. A
growing number of studies are beginning to develop causal links between income
inequality and poor societal, health, economic, political, and personal outcomes,
highlighting the importance of understanding current levels of inequality as a problem.
Societal Effects
There are those who propose that changes between groups in a society do not
matter if the total society is getting more affluent (Wilkinson, 2009). This is an argument
about the effect of relative versus absolute economic position. As many social scientists,
neurologists and economists have explained, it is the relative position of an individual
that makes the most difference in how people understand the world around them (Hill &
Myatt, 2010; Frank 2007; Kahneman, 2012). This is not simply a matter of feeling; there
are real economic and social ramifications of a decreasing relative position. In
contradiction to the standard model of rational choice economic theory, the field of
behavioral economics posits that there is no absolute assessment of conditions. People
4
can only view and understand conditions contextually. Kahneman (2012) calls this “the
endowment effect” (p.292) and explains that it is a cognitive impossibility for humans to
think solely in terms of absolute position or utility. All outcomes and conditions are
viewed and understood in comparison to some reference point. The reference point that
matters in income inequality is the individual’s relative position. People primarily view
their position in relation to what others have, that is why concern about relative position
is not simple envy, but innate human nature.
The resulting social costs of vast inequality harm the whole society, not just the
poor. Wilkinson & Pickett (2010) were among the first to discern causal relationships
between income inequality and adult and infant mortality, increased mental illness, and
poor health outcomes. Perhaps the most important finding from this research is the fact
that all members of a society suffer when a society is highly unequal. This research
revealed that income inequality is closely correlated (r=0.87) with poor outcomes on a
range of health and social problems, such as worse mental health, more crime and
violence, more obesity, and others. Additionally it appears that this phenomenon is
consistent across different societal measurement. In other words, countries suffer more
social and health problems the more relatively unequal they are, and this trend holds for
states, and counties as well, both in the United States and other nations (Wilkinson &
Pickett, 2010).
Other research has demonstrated a positive correlation between income inequality
and violent crime including homicide (Kennedy, Kawachi, Prothrow-Stith, Lochner &
Gupta, 1998; Aitken & Elgar, 2010). These studies indicate that great income inequality
5
results in diminished societal trust, and decreases the common bonds that enforce
collective societal norms. The majority of these studies examine the idea of income
inequality as leading to erosion in social capital, or cohesion. The hypothesis is that as
income inequality becomes more pronounced, the bonds between people in a society
begin to unravel. This results in decreased levels of trust and community strength. The
ideal of everyone pulling together erodes to a social Darwinist struggle of the fittest. If
more and more members of a society feel the social and economic arrangement works
against them they have less reason to abide by the generally accepted norms of that
society and that society will begin to weaken.
Economic Effects
The economic consequences of income inequality are also great. Income
inequality reduces the disposable income for the great majority of consumers who must
continue to consume if the economy is to grow. Income that goes to a small number of
wealthy families instead of being distributed to a much larger group of lower income
families does not result in the same level of consumer spending. Wealthy people have
most of what they need already; for the most part they will not buy many more new
houses or more groceries with increased income. For example, a family with a $9 million
after tax income may purchase 3 or 5 cars, but if that $9 million went to 1000 middle
class families ($9,000 each) you could expect 100’s of cars to be purchased with that
same money (Blodget, 2012). A decrease in middle class spending power is important
for those at the top of the income scale as well because they depend on the profits and
investment dividend from consumption to maintain their relative position and affluence
6
(Roubini, 2011). At the other end of the income scale the reduction of household
disposable income has resulted in many American families straining under massive
amounts of debt in the struggle to “keep up with the Joneses.” Over borrowing has been
the only way for middle class families with declining incomes to maintain the pretense of
relative affluence and this growing debt has added to economic instability. Franks (2007)
relates the inefficiencies created by this competitive consumption as a market failure and
characterizes it as a “consumption externality.” This competitive consumption also
contributes to a low national savings rate and the condition that the vast majority of
Americans are not financially prepared for retirement (Noah, 2012). Additionally
Bloomquist (2003) argues that income inequality can be tied to increases in income tax
evasion as more income is realized through investments that are more difficult to trace.
A recent study illustrates the negative effect income inequality is having on the health of
the Social Security program (Whitman & Shoffner, 2011). This study finds that the
current taxable maximum of $106,800 (2011) is exempting a growing amount of income
from Social Security taxation, and that this is contributing to the fiscal imbalance in the
trust fund. It may also be that capitalist economies cannot function properly at certain
levels of income concentration. Alesino & Perotti (1994) found an inverse relationship
between income inequality and levels of investment in data from 71 countries. The fact
that income inequality decreases the societal and political stability needed to attract
investment was an early and important finding that began to uncover some of the indirect
effects of income inequality on economic conditions. Recent research focusing on
metropolitan regions indicates that inequality is a barrier to economic growth, and that
7
regions with more income equality have grown faster, and more consistently over the past
30 years (Benner & Pastor, 2012).
Current inequality may be a contributing factor to increasing economic
tribulation. There is a concern that advanced levels of inequality distort the market to an
extent that makes smooth functioning unattainable (Stiglitz, 2012). This concern is
supported by the fact that the only previous instance of income inequality at current
levels was followed soon after by the Great Depression. As Figure 3 illustrates the top
1% of earners in 1928 captured 24% of the total income of the U.S., a level not seen
again until 2007 when the 24% threshold was reached again, and almost immediately
followed by the Great Recession. For comparison, the top 1% captured 9% of total U.S.
income in 1970 (Noah, 2012).
Intergenerational Income Mobility
Possibly the most troubling of the economic and social consequences of vast
income inequality is the related occurrence of decreasing intergenerational income
mobility. Intergenerational income mobility is a metric that reveals how many people
move up, or down, from the income quintile of their parents. This idea goes to the heart
of American economic mythology. Studies are beginning to link entrenched levels of
inequity to a new caste system and the end of the American dream (Wolfers, 2012). The
myth of the “American Dream” is being disproved and with it the belief that people can
rise out of the economic position they were born in through hard work and enterprise.
Research implies that as inequality in income grows so does inequality in opportunity.
Analysis of longitudinal panel data on the difference in generational change in income
8
shows that the U.S. is last in developed nations in intergenerational mobility (Mazunder,
n.d.). For example, in a January 12, 2012 speech at the Center for American Progress,
Alan Krueger, the Chairman of the Council of Economic Advisors presented the “Great
Gatsby curve,” which illustrates the relationship between inequality and generational
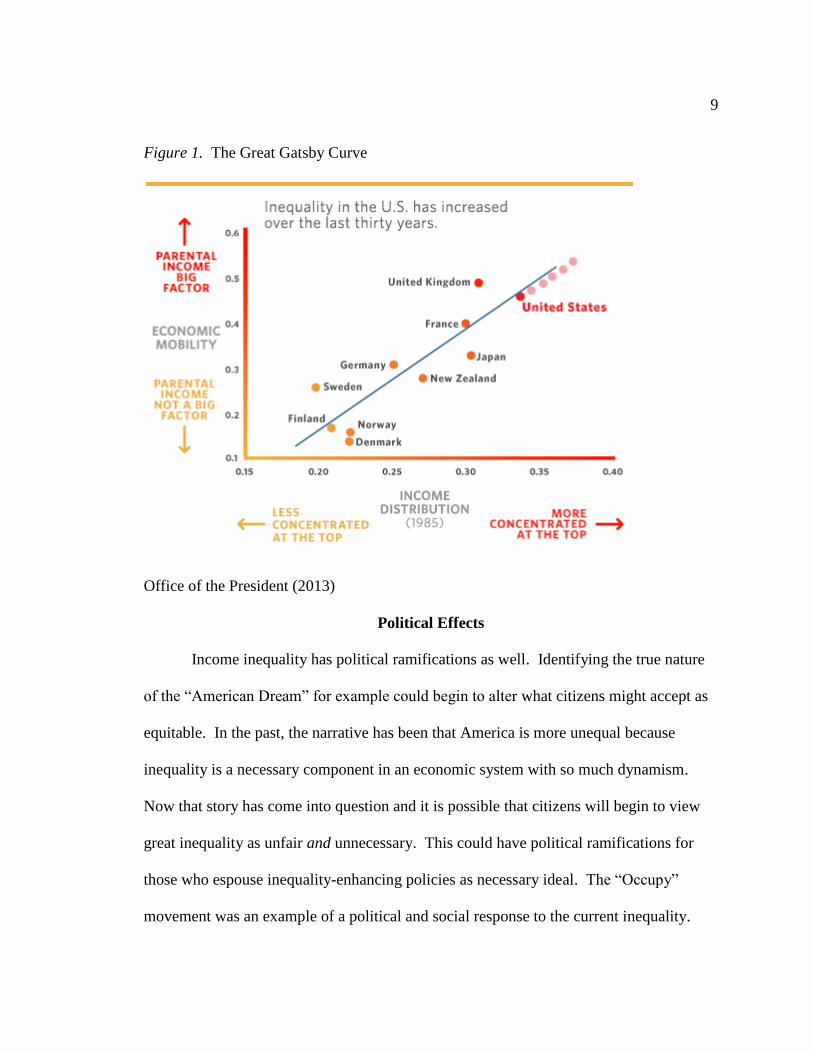
earnings mobility (Krueger, 2012). The Great Gatsby curve (Figure 1) shows that as
income inequality increases the level of movement from different income strata contracts.
More simply, income inequality is beginning to be recognized as a factor that keeps poor
people poor and wealthy people wealthy through generations. Figure 1 shows the
relationship between intergenerational earnings elasticity (the vertical axis), or how much
a parents income predicts a child’s future income, the higher the number the greater
chance the child will either stay poor, if parents are poor, or wealthy if parents are
wealthy, in relation to the country Gini coefficient ranking. As Figure 1 illustrates, the
U.S. is more unequal and more economically rigid than comparable Western capitalist
democracies.
A recent report from the U.S. Federal Reserve illustrates this trend as 47% of
children born to U.S. families in the top quintile of income earners remain in the top and
only 7% move to the bottom, while 66% of those born to families in the bottom quintile
remain in the bottom two quintiles of earners (Bengali & Daly, 2013).
9
Figure 1. The Great Gatsby Curve
Office of the President (2013)
Political Effects
Income inequality has political ramifications as well. Identifying the true nature
of the “American Dream” for example could begin to alter what citizens might accept as
equitable. In the past, the narrative has been that America is more unequal because
inequality is a necessary component in an economic system with so much dynamism.
Now that story has come into question and it is possible that citizens will begin to view
great inequality as unfair and unnecessary. This could have political ramifications for
those who espouse inequality-enhancing policies as necessary ideal. The “Occupy”
movement was an example of a political and social response to the current inequality.
10
Regardless of the lack of electoral or legislative accomplishments of the “Occupy”
movement, it helped bring the topic of inequality to the forefront of American political
discourse and shaped the national conversation. A common rejoinder from people who
do not think income inequality is a problem is, “America doesn’t guarantee outcomes,
only opportunities.” Some who share this sentiment perceive income inequality as the
natural and positive outcome of a meritocracy where those who have more talent,
ambition, and drive than others are rightfully better compensated. A baseline assumption
for this position is that everyone begins at a relatively equal starting place and economic
rewards accrue to those who deserve them most. “Deserving” is ostensibly determined
by those adding the most to the national marginal product. The vast economic gains to
those in primarily “rent seeking” enterprises are challenging this notion (Stiglitz, 2012).
Rent seeking behavior occurs when someone gains wealth by taking it from others
instead of creating something of value that creates profit. This behavior is contrary to the
traditional economic theory that the wealthy deserve their rewards because they create
more wealth. The myth that every rich person is a “job creator” is a version of this story.
However, research is illustrating that much of the immense gains in income for the top of
the U.S. income scale has come from inefficient rent seeking behavior (Stiglitz, 2012).
Additionally, a necessary assumption for this position is that America is a place that
affords equal opportunity for economic advancement to all. This is the “American
Dream,” the belief that anyone who works hard and plays by the rules can make a better
life for themselves and their family. This is one of the most enduring baseline societal
myths of our culture, and for many years it was more true than not. Vast income
11
inequality is now destroying this myth and calling into question the historic American
social contract that accepts inequality as a condition of opportunity.
The concentration of income and the political power that comes with it is also an
issue. The Supreme Court ruling in the Citizens United case enacted into law the ideal
that “money equals speech” (Citizens United v. Federal Election Commission, 2009).
The implication of Citizens United is that the wealthy deserve more speech and influence.
Great concentrations of income and wealth were the origin of the feudal aristocracies
against whom the founders of this nation originally rebelled.
This section began with a discussion of why inequality matters utilizing evidence
of the societal, economic, and political costs of income inequality. The next section of
this chapter will define income inequality and explain the most commonly utilized
conceptualizations used to measure income dispersion in an economy. A historical
overview of the trends in income inequality in the U.S. will follow. The chapter will
conclude with a description of the current condition of income inequality.
Income Inequality, definition and measurement
Income inequality is an income gap between segments of a society. It is a
measure of income division, or dispersal. It is not poverty per se; a society could have all
poor people and still have great income equality so it is not a measure of only poverty,
but a measure of relative income position through a population. Poverty is important and
usually societies with great income inequality suffer from high levels of poverty. Income
inequality is important because it centers on questions of fairness, equity, and the
maintenance of the “social contract” (Frank, 2007; Stiglitz, 2012). The social contract is
12
the basic agreement that people accept in a society. This social agreement defines the
general normative ideals of what is “right” and “fair.” As in all contracts, there is also a
degree of reciprocity in the social contract. The general idea is that people give up
something, a degree of absolute freedom for example, in order to create societies that
provide communitarian advantages such as security or fairness. The social contract
matters in examining income inequality because an equitable distribution of economic
rewards for effort and achievement are part of the historical democratic social agreement.
The distribution of society’s economic resources matter because an equitable distribution
of economic rewards and opportunities are important maintaining a just society.
The next section will briefly introduce and more fully explain the Gini coefficient,
the most common measurement tool used to express income inequality as well as the
metric most often utilized in this thesis.
Gini Coefficient
The most important and widely utilized measure that quantifies and illustrates
income inequality is the Gini coefficient. Corrado Gini, an Italian statistician, first
developed this conceptualization of distributional dispersion in 1912 in his paper
“Variability and Mutability” (Xu, 2004). Since the 1920’s the Gini coefficient, or ratio,
has been widely used in many different disciplines including sociology, engineering and
agriculture. The Gini coefficient represents distribution as a value between 0, (0.0%)
which is perfect equality of dispersal, in income terms it would be where all have an
equal share, and 1, (100.0%) or perfect inequality, where 1 person, or family, had 100%
of the income. The most common mathematical calculation of dispersion using the Gini
13
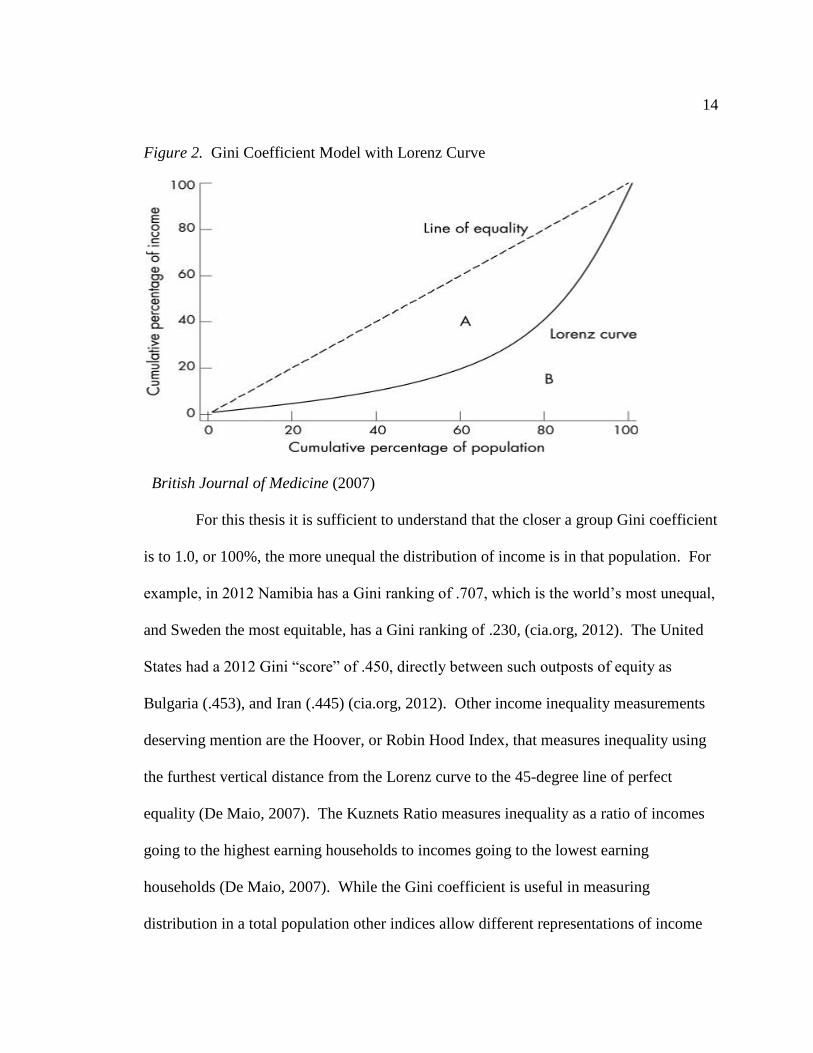
conceptualization is A/ (A+B) (Figure 2), although many, and much more complicated
calculations are possible using the Gini model. The Gini “score” is a ratio calculated
through the application of the Lorenz curve. The Lorenz curve, developed by Max
Lorenz, is the arithmetic representation of percentages of distribution in the Gini
coefficient model. In the Gini coefficient income distribution model, illustrated in Figure
2, the x-axis represents the population, characterized in percentages or deciles, from 0.0
to 100.0%, the y-axis the percentage of income, and expressed a value from 0.0 to
100.0%. The Lorenz curve demonstrates what percentage of y value, or income, is
attributable to the x value, or population. This value is found at the x/y intercept at the
Lorenz curve. In Figure 2 the Lorenz curve can be used to ascertain population income
distribution by following a point on the x axis, which corresponds to a population
percentage, up to the intercept of the Lorenz curve, then following that point back to the y
axis to locate the corresponding percentage of income. For example, in Figure 2 (British
Medical Journal, 2007) 20% of the population receives about 7% of the income, 40% of
the population account for about 10% of the income, etc. Figure 2 illustrates an income
distribution Gini ratio of approximately 0.50.
14
Figure 2. Gini Coefficient Model with Lorenz Curve
British Journal of Medicine (2007)
For this thesis it is sufficient to understand that the closer a group Gini coefficient
is to 1.0, or 100%, the more unequal the distribution of income is in that population. For
example, in 2012 Namibia has a Gini ranking of .707, which is the world’s most unequal,
and Sweden the most equitable, has a Gini ranking of .230, (cia.org, 2012). The United
States had a 2012 Gini “score” of .450, directly between such outposts of equity as
Bulgaria (.453), and Iran (.445) (cia.org, 2012). Other income inequality measurements
deserving mention are the Hoover, or Robin Hood Index, that measures inequality using
the furthest vertical distance from the Lorenz curve to the 45-degree line of perfect
equality (De Maio, 2007). The Kuznets Ratio measures inequality as a ratio of incomes
going to the highest earning households to incomes going to the lowest earning
households (De Maio, 2007). While the Gini coefficient is useful in measuring
distribution in a total population other indices allow different representations of income
15
dispersion and can allow more precise measurement of dispersion between population
deciles. Each of these conceptualizations is important to the study, presentation, and
understanding of income inequality.
Historical Trends in U.S. Inequality
America has always been relatively unequal and it has been argued that the
current condition of income inequality in the U.S. is similar to other periods of great
inequality and is not cause for alarm. Others dispute this assertion and posit that current
inequality is dangerously different from any other time in U.S. history except for the
period directly preceding the Great Depression. This section will examine the general
historical trends in U.S. income inequality.
Early America- post Civil War (1776-1900)
Statistical data on largely rural early America is slight, nevertheless research on
the subject of historical income inequality contend that inequality in the first 100 years of
U.S. history centered on the growing premium enjoyed by the laborers of the emerging
skilled trades. This inequality trend is also exaggerated by the change of wealth and
income consisting primarily of land and barter crops, to a more currency based system
(Noah, 2012). The information that has been analyzed points to increasing income
concentrated in the pre industrial cities of the Northeast (Lindert & Williamson, 1976).
This trend escalated throughout the antebellum period up to the outbreak of the American
Civil War (1860-1864). These early patterns of inequality generally match the Kuznets
curve (1955) hypothesis. This hypothesis posits income inequality in an economically
advancing society will move in an inverted U pattern, where the movement from an
16
agrarian to industrial society will initially cause an increase, and then gradually a
decrease in inequality, as a society’s labor enjoys the productivity gains of increased
mechanization (Neilson & Alderson, 1997).
20th
Century Inequality Developments
Data that are detailed enough to fully explicate changes in incomes and GDP are
difficult to attain until the advent of the federal income tax in 1913. Generally, it is
thought that income and wealth inequality intensified through the years from 1880 until
the outbreak of World War 1 (1914-1918) which caused a temporary leveling (Lindert &
Williamson, 1976). Worldwide productivity gains and labor specification initiated by the
industrial revolution was responsible for an increase in absolute levels of affluence and
income as well as increased concentrations of wealth. The first well-documented modern
instance of great income disparity began during the post WWI boom years and surged
until the crash of 1929, which lead to the Great Depression. During the 1930’s and early
1940’s all income deciles suffered retraction due to decreased earning power and related
diminished demand resulting from the Great Depression, however relative inequality
remained consistently stable and elevated. Again, as in the Civil War and World War 1,
the break out of World War 2 ushered in a brief period of growing equality. Research
points to the virtual elimination of unemployment during wartime as the cause of this
phenomenon, not a long-term economic movement towards equality.
17
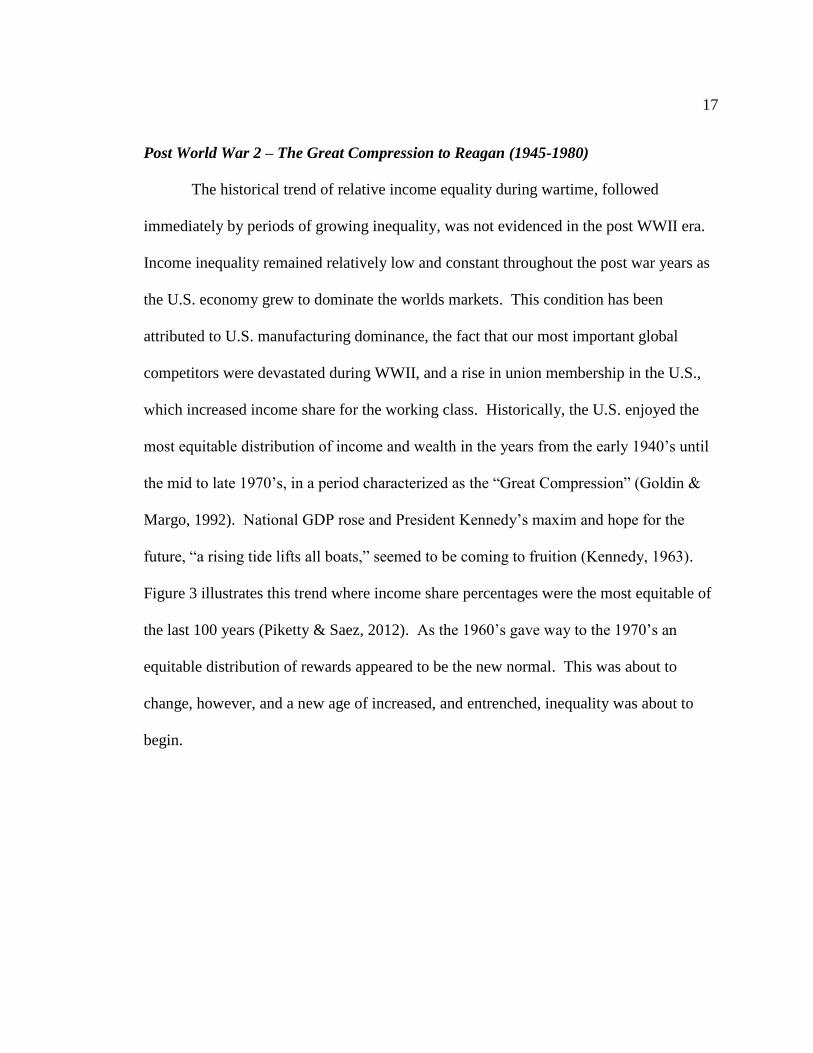
Post World War 2 – The Great Compression to Reagan (1945-1980)
The historical trend of relative income equality during wartime, followed
immediately by periods of growing inequality, was not evidenced in the post WWII era.
Income inequality remained relatively low and constant throughout the post war years as
the U.S. economy grew to dominate the worlds markets. This condition has been
attributed to U.S. manufacturing dominance, the fact that our most important global
competitors were devastated during WWII, and a rise in union membership in the U.S.,
which increased income share for the working class. Historically, the U.S. enjoyed the
most equitable distribution of income and wealth in the years from the early 1940’s until
the mid to late 1970’s, in a period characterized as the “Great Compression” (Goldin &
Margo, 1992). National GDP rose and President Kennedy’s maxim and hope for the
future, “a rising tide lifts all boats,” seemed to be coming to fruition (Kennedy, 1963).
Figure 3 illustrates this trend where income share percentages were the most equitable of
the last 100 years (Piketty & Saez, 2012). As the 1960’s gave way to the 1970’s an
equitable distribution of rewards appeared to be the new normal. This was about to
change, however, and a new age of increased, and entrenched, inequality was about to
begin.
18
Figure 3. Top Deciles Income Trends from 1913-2008
Piketty & Saez (2012)
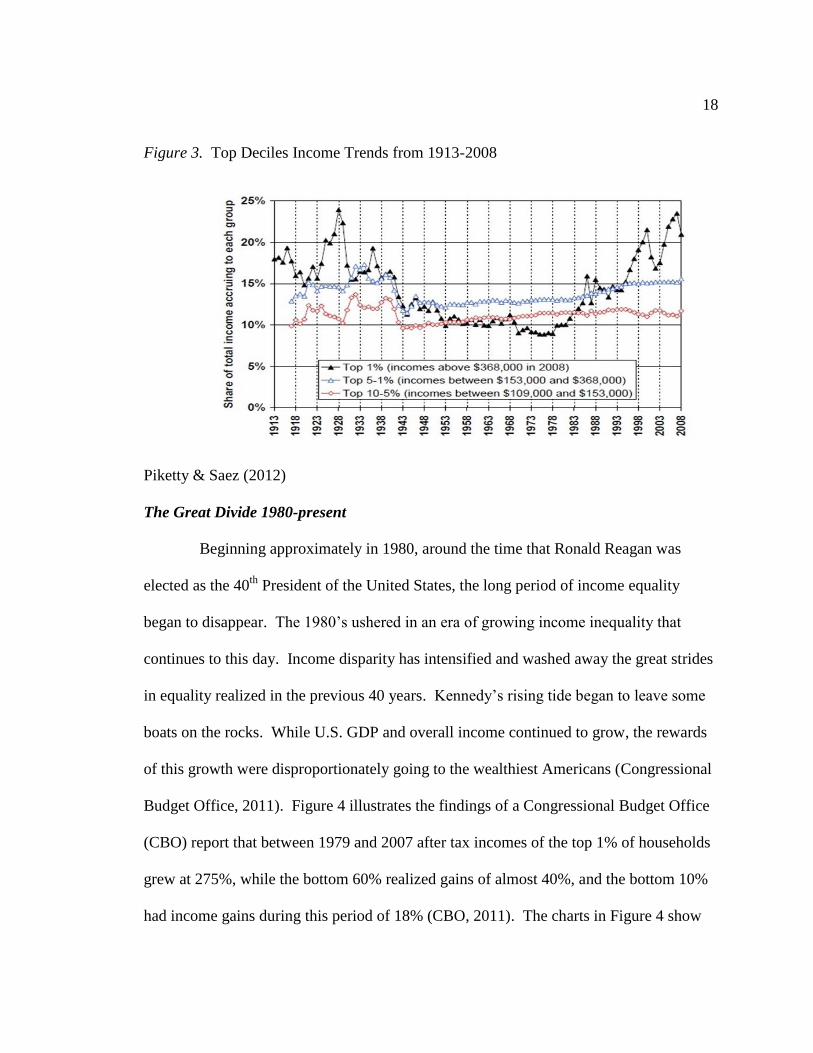
The Great Divide 1980-present
Beginning approximately in 1980, around the time that Ronald Reagan was
elected as the 40th
President of the United States, the long period of income equality
began to disappear. The 1980’s ushered in an era of growing income inequality that
continues to this day. Income disparity has intensified and washed away the great strides
in equality realized in the previous 40 years. Kennedy’s rising tide began to leave some
boats on the rocks. While U.S. GDP and overall income continued to grow, the rewards
of this growth were disproportionately going to the wealthiest Americans (Congressional
Budget Office, 2011). Figure 4 illustrates the findings of a Congressional Budget Office
(CBO) report that between 1979 and 2007 after tax incomes of the top 1% of households
grew at 275%, while the bottom 60% realized gains of almost 40%, and the bottom 10%
had income gains during this period of 18% (CBO, 2011). The charts in Figure 4 show
19
that after taxes and inflation the “gains” at the bottom of the income distribution resulted
in real world decreases in purchasing power.
Figure 4. Income Gains 1979-2007
Gilson & Perot (2007)
20
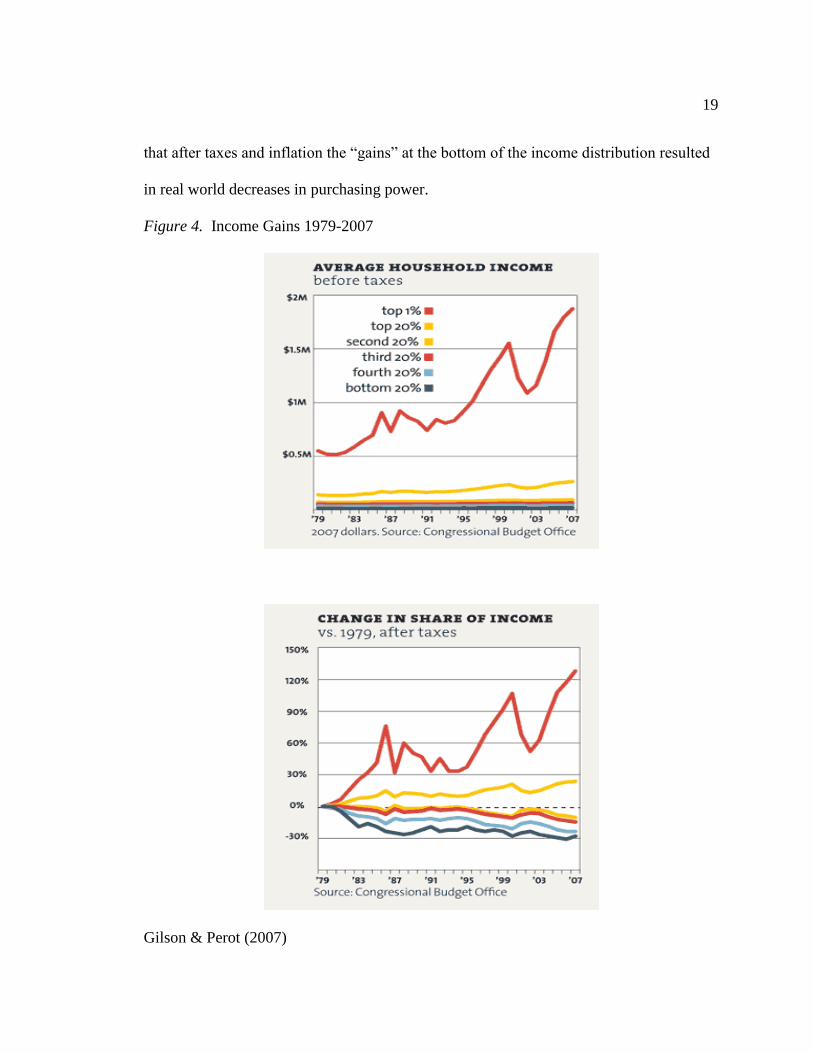
Current Conditions
The data describing current levels of income inequality in the United States
illustrate that inequality is at historic highs and is growing. The rich are getting richer,
and possibly more concerning, staying richer, and the poor are getting poorer, and staying
poorer. The U.S. economy continues to grow, U.S. workers are increasing their
productivity, and real GDP has increased in 15 of the previous 16 quarters (Bureau of
Economic Analysis, 2013), but these gains have not been distributed equally. Even with
the dramatic slowdown resulting from the 2007-2009 recession productivity per hour has
increased from 2000-2010 (Bureau of Labor Statistics, 2013).
Figure 5. Wage/ Productivity Disconnect
Gilson & Perot (2007)
Since the Recession ended (statistically) in 2009, productivity has accelerated
again and the U.S. workforce is continuing its long tradition as the most productive in the
world. However, wages have not kept pace with this productivity. The gains from a
21
more efficient workforce are not going to that workforce and the rewards are
overwhelmingly being captured by the top 1% of the income scale. Figure 5 illustrates
this disconnect and shows that the historic wage/ productivity bargain began to unravel in
the late 1970’s. This coincides with the beginning of the “Great Divergence” (Noah,
2012) and the period of growing inequality that continues to this day.
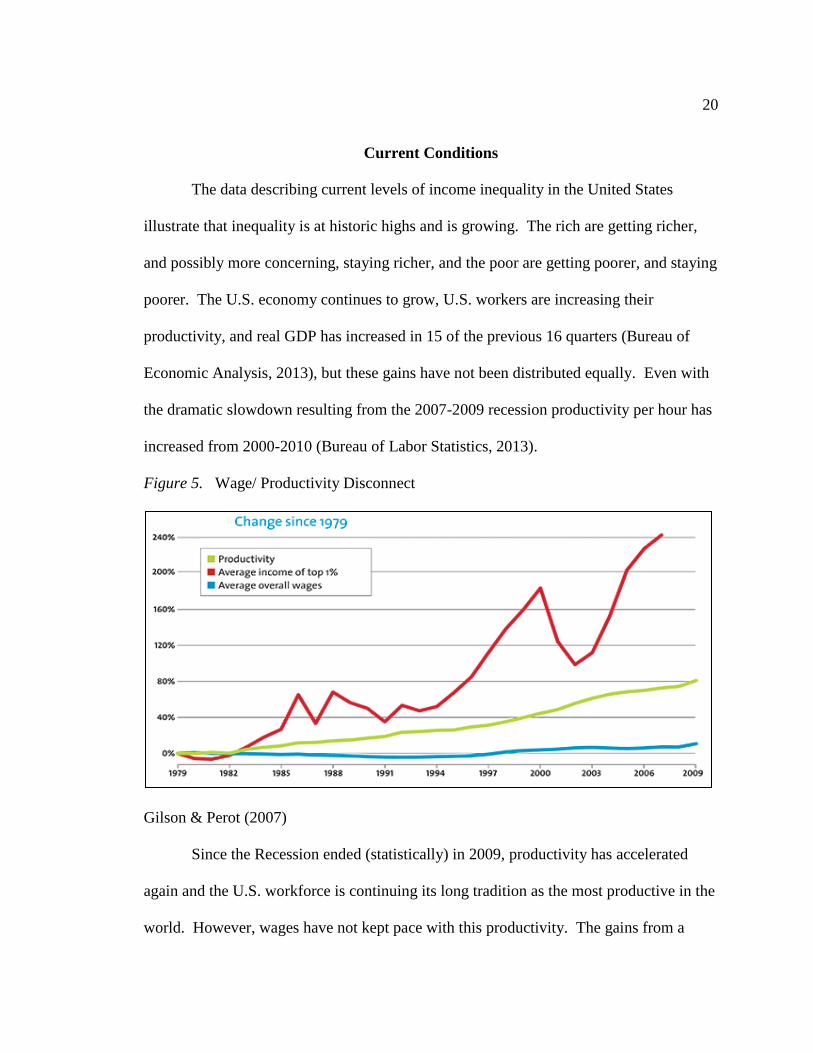
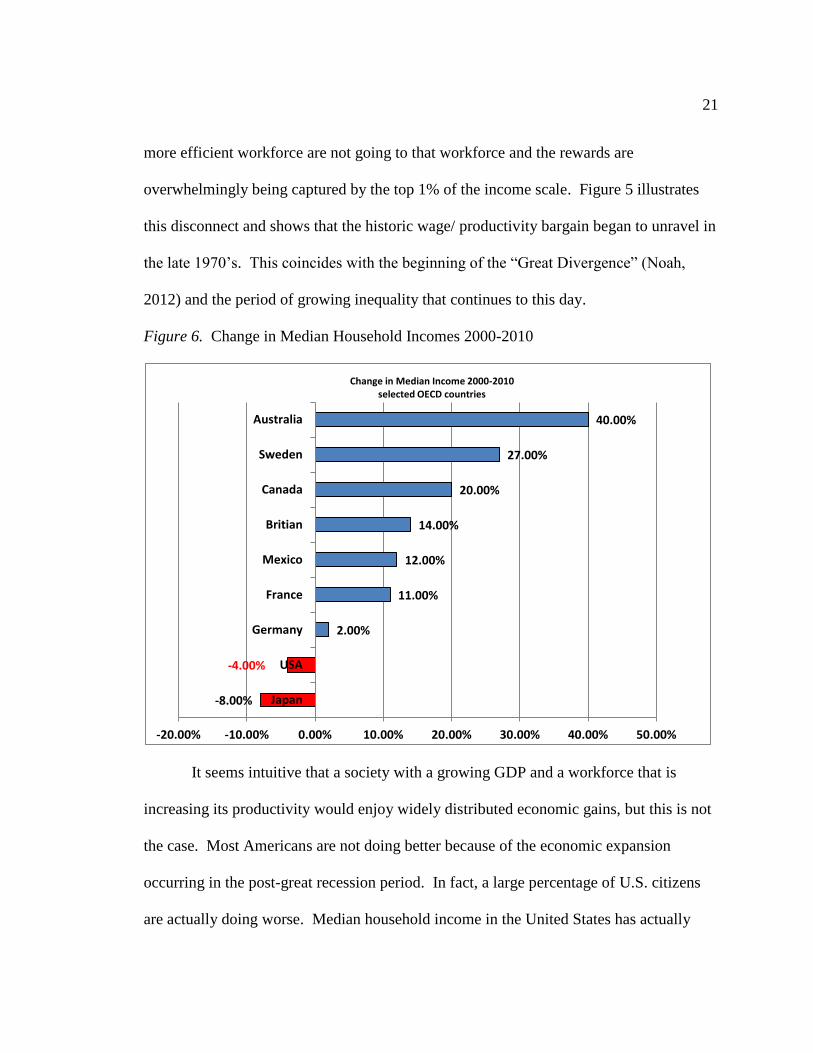
Figure 6. Change in Median Household Incomes 2000-2010
It seems intuitive that a society with a growing GDP and a workforce that is
increasing its productivity would enjoy widely distributed economic gains, but this is not
the case. Most Americans are not doing better because of the economic expansion
occurring in the post-great recession period. In fact, a large percentage of U.S. citizens
are actually doing worse. Median household income in the United States has actually
-8.00%
-4.00%
2.00%
11.00%
12.00%
14.00%
20.00%
27.00%
40.00%
-20.00% -10.00% 0.00% 10.00% 20.00% 30.00% 40.00% 50.00%
Japan
USA
Germany
France
Mexico
Britian
Canada
Sweden
Australia
Change in Median Income 2000-2010 selected OECD countries
22
dropped by 1.3% in the short term, from 2010-2011 (U.S. Census, 2013). Long-term
trends are no better. A recent report by the Organization of Economic Cooperation and
Development (OECD, 2012) illustrated in Figure 6 describes that median incomes have
fallen in the U.S. since 2000. U.S. unemployment and poverty rates, two important
metrics of economic health, are also at historically elevated levels. Apparently something
in the U.S. economy is not working properly. Capitalist orthodoxy proposes that at least
some benefits of a rising economic condition will “trickle down” to those in the lower
income strata, but this has not happened. Where have all the rewards of this economic
expansion gone? Statistical analysis indicates that the overwhelming majority has gone to
the very top of America’s income scale.
The statistics that illustrate the amount of total national income that the top 1%
has captured are incredible. These statistics are delineated by three common periods that
illustrate the growing inequality in U.S. income dispersion since the end of the “Great
Compression,” the period from about 1940 until the Reagan Presidency in 1980. The
first period is from 1980 until 2007, followed by the period of the Great Recession, 2007-
2009, and then the recovery period of after the Great Recession, 2010-2013. The period
1980-2007 is covered in more detail in the history section of this thesis but this is the
time-period where incomes began to diverge dramatically and those in the top 1% began
to rapidly distance themselves from the rest of society. Then the Great Recession hit and,
similar to the Great Depression, all income groups suffered dramatically. Real family
income declined by 17.4% from 2007-2009, and the top income deciles suffered a 36.3%
retraction (Saez, 2013). Research explains the drop in top 1% incomes during this period
23
as primarily resulting from greatly reduced stock and capital gains income (Saez, 2012,
Stiglitz, 2012). The strong resurgence of stock prices and corporate profits while real
wages were falling for the majority of the workforce greatly exacerbated the divergence
of incomes between the top 1% and the rest of society during the post Great Recession
recovery period. These two simultaneous trends, the uneven gains captured by the top
1% and the loss of real spending power for the 99% is what created the condition where
top 1% income share showed increases of over 100.
Additional analysis reveals more about how much income disparity has
accelerated in the post-Great Recession recovery period. The gains to the top 1% are
becoming more pronounced as less and less of the rewards for the nation’s work is
distributed among those who actually perform the work. For example, from 2009-2011
the top .01% has enjoyed income gains 220 times larger than the average gains of the
bottom 90%. The top 1% accrued more than 65% of the increase in national income in
the 2009-2011 periods. Analysis of the latest available data indicates that from 2009-
2010 the top 1% gained 93% of all new income (Alvaredo, Atkinson, Piketty & Saez,
2013). This current acceleration is troubling but it is only an alteration of the inequality
that has been growing for 30 years. For example, the top 1% captured 80% of the total
increase in American income from 1980-2005 (Noah, 2012). An anecdotal example of
the vastness of the distance between the very top of America’s income strata is the fact
that, depending on daily stock fluctuations, the six heirs to the Wal-Mart fortune control
as much wealth as the bottom 35-40% of American society (Blodget, 2013).
24
The general and undeniable trend is that America is a society that is very unequal,
and getting less equal each day. While workers have held up their end of the economic /
social contract by increasing productivity and creating historically high stock values and
corporate profits very little has “trickled down” to them. The middle class is
disappearing and the U.S. is in danger of experiencing levels of income inequality
historically reserved for failed states and “Banana Republic’s.” The condition of income
inequality in America is that the top 1% began the 21st Century with a major advantage
and a very unequal share of income distribution and this situation is rapidly worsening.
This section described the history and current state of income inequality in the
U.S. and began to demonstrate the fact that incomes for a very small minority of U.S.
citizens are historically unequal. Additionally this inequality is happening at a time when
the U.S. workforce is more productive, and corporate profits are growing. The historic
socio-economic bargain that promised basic fairness across American society is
unraveling.
Chapter Conclusion
This is the current situation faced by this nation, and addressed in this thesis. The
remaining chapters of the thesis will generally follow the Bardach (2009) method of
analysis. Chapter 2 will be a review of the literature focusing on theories that inform the
thinking about income inequality. It will highlight the current state of thinking about
what to do about income inequality and the intellectual underpinnings of this thinking.
Chapter 3 will review the literature on the most commonly agreed-to strategies for
lessening the effects and conditions of income inequality. Chapter 4 will list and explain
25
decision criteria and the reasoning behind the criteria used to assess my
recommendations. It will address the important concerns and trade offs in attempting to
mitigate income inequality. Chapter 5 will consist of an outcomes matrix, where the
strategies from Chapter 3 will be assessed using the criteria from Chapter 4. Chapter 6
will contain my recommended plan for lessening the magnitude and effects of income
inequality informed by the literature review and the results of the outcomes matrix.
Chapter 7 will contain a conclusion and suggestions for further research.
26
Chapter 2
THEORETICAL LITERATURE REVIEW
The focus of this thesis is whether income inequality can be reduced. There is an
important distinction between attempts to create a more equitable society over some
unachievable utopia. Human life will always have different levels of attainment. It is the
extent of current inequality, and the resulting health and social problems, which are the
concern for society. The strategies identified in this literature review promote a world
that is fairer, not completely fair. Even behind Johns Rawls’ hypothetical “veil of
ignorance,” some inequality is inevitable (Sandel, 2009).
This literature review is presented in two chapters. First, in Chapter 2, I present a
theoretical review of the most important concepts and ideas that inform positions on
income inequality. Then, in Chapter 3, I present a return to the Bardach (2009) process
and present a more specific review of alternative strategies, policies and regulations to
lessen the condition and effects of income inequality. Chapter 2 informs the reader of the
theoretical scope of ideas to equalize either the distribution of income or the effects of
current income dispersion in the U.S. Chapter 3 will create a framework for making the
subsequent recommendations by presenting and explaining the literature on commonly
proposed strategies for promoting greater equality in incomes.
An examination of current income inequality must address redistributive policies
because these policies are the method most commonly used by societies around the world
to level the economic playing field and increase equity of income. This chapter will
concentrate on redistribution and examine the theories that inform the inequality debate.
27
The first part of the chapter will examine the marginal product theory, followed by a
theoretical literature review examining the debate about efficiency and equality in
redistribution. This review will address the seminal theories of Okun, Pareto, and
Kahldor-Hicks. The efficiency / equity dispute is the philosophic economic foundation
for ideas about what to do, or not to do, about income inequality so it is important to
grasp the general trend of the foundational theories to better understand this debate. Then
the chapter will review the literature about redistributive tax and transfer polices by
examining the income, corporate and wealth transfer taxes, the three major taxes that
generate revenue for redistribution, and then by inspecting the major transfer programs
that allocate this revenue. The chapter will conclude with a review of government
programs that are not strictly redistributive but that use government spending to support
an overall equalizing effect on income dispersion. This chapter furthers the thesis by
building a theoretical foundation of understanding necessary to understand the reasoning
for the subsequent recommendations
Marginal Product Theory
People Get What They Deserve
The idea that income inequality is fair and necessary for the proper functioning of
a market is an economic philosophy based largely on the marginal product theory
(Galbraith, 1998). This theory is the economic foundation for many of the arguments
against policies to lessen income inequality. The marginal product theory posits that
production determines compensation; therefore, economic rewards are a result of
contribution (Colander, 2008; Galbraith, 1998; Hill & Myatt, 2010). However, the
28
marginal product theory is a hypothetical construct; it is impossible to operationalize in
the real world and so it is not an effective reason for accepting inequality.
An important problem with the theory of marginal productivity stems from the
difficulty in actually determining how much an individual has actually produced. The
idea that personal compensation correspond with individual production, in isolation from
others contribution, requires an accurate measurement of individual contribution
(Galbraith, 1998). This is impossible in real world conditions. While it is possible to
determine how many widgets one worker produced at the end of a widget producing
process, it is impossible to determine what that one individual contributed separate from
any others involved in the long and interdependent process of production in a modern
global economy (Hill & Myatt, 2010). For example, it is impossible to separate the
contributions made by the public to protect the property rights of the widget maker, or the
contribution of past generations who paid for and built the transportation network utilized
to bring the raw material and transport the finished product to market. This is why
marginal productivity is not operational or useful in the understanding of income
inequality. It is impossible to determine what someone deserves to be compensated if it
impossible to know with certainty what they contributed separate from any others (Hill &
Myatt, 2010).
Despite much vociferous protestation from conservatives, this is what President
Obama was referring to in his now famous (or infamous) remark, “you didn’t build that”
(Obama, 2012). President Obama was not denigrating the hard work, ingenuity and
sacrifice of successful entrepreneurs, he was pointing out that no one exists, works, or
29
creates wealth, in isolation; the society we build and maintain has a role and is
responsible for providing a tremendous amount of assistance. This is why the idea that
people get what they deserve is not applicable. If it is impossible to know what you
created, how is it possible to know what you deserve?
Redistribution
The Traditional Government Reponse to Income Inequality - Definition, Justification,
and Philosophy
Redistribution is the act of distributing something again in a manner that alters the
original arrangement. The practice of redistribution is most often an attempt to transfer
economic resources from one group that has the resources, to another group that does not.
Historically, economic redistribution is tied to notions of social justice and fairness
(Barry, 2011).
Government has a generally accepted role in ameliorating some of the unequal
distribution of rewards in a capitalist society (Colander, 2008; Hill & Myatt, 2010).
Controversy arises in determining what should be the size and scope of government
intervention. There are many tools government can utilize in this effort supported by
those that believe in government responsibility to help create and maintain an equitable
economic condtion. All Western democracies use redistributive policy to achieve an
equalizing effect. Redistributive policy is the subject of the this section.
The idea and practice of wealth and income redistribution has been around at least
as long as biblical times. The Bible talks about the Jubilee Year when land was to be
redistributed back to the original owners and community (King, 2012; O'Brien, 2012).
30
Most modern societies have continued the practice of redistribution. The U.S. utilizes
redistributive income tax and transfer policy to assist the poor and this helps moderate
income inequality (Colander, 2008; DeBacker, Heim, Panousi, Ramanath, & Vidagos,
2013; Franks, 2007; Noah, 2012; Stiglitz, 2012). Research illustrates that these
redistributive polices do have a positive effect on lessening the pattern and effects of
income inequality (Benner & Pastor, 2012; Noah, 2012 ; Stiglitz, 2012;Wilkinson &
Pickett, 2010).
Equity, Efficiency and the Leaky Bucket
Critics of redistributive tax policy propose the idea that this taxation is inefficient
and that government attempts at fixing market outcomes create more problems than they
repair due to the alteration of incentives and market inefficiencies created by taxation
(Miron, 2011; Okun, 1975). The efficiency-equity trade offs citied in opposition to
redistributive tax systems propose that attempts to increase equity may result in
diminished productivity and a shrinking the total economic pie (Colander, 2008). Okun
(1975) authored a seminal work on the efficiency loss incurred by redistributive tax
policy that resulted from changes in incentives, the loss of consumer and producer
surplus and administrative costs. Okun (1975) equated redistributive policy as a “leaky
bucket” that spilled, or wasted, a portion of the resources dedicated to government
transfer programs. This metaphor has been used to illustrate the idea that the trade off for
more equity is less market efficiency. However the efficiency-equity trade off is
theoretical, the empirical evidence to support it has been challenged forcefully and
repeatedly (Hill & Myatt, 2010; Lindert, 2004).
31
Some believers in the efficiency-equity tradeoff support redistributive policy. For
example, Okun (1975) proposed a “thought experiment” that would help people decide
for themselves the level of efficiency loss a person would accept in a hypothetical
government transfer program. Okun (1975) found that under certain circumstances he
supported a redistributive policy that resulted in the hypothetical efficiency loss of up to
60% of the money intended for transfer from the wealthy to the less well off. Okun
(1975) seemed to believe that even a leaky bucket is better than no bucket at all.
It is possible that there is no substantial loss of efficiency in policies that promote
equity (Hill & Myatt, 2010; Lindert, 2004). Research illustrates that more equal societies
achieve higher growth, better health, and less violence (Benner & Pastor, 2012; Franks,
2007; Hacker & Lowentheil, 2012; Wilkinson & Pickett, 2010). These are some of the
societal goals increased efficiency is meant to enhance. Perhaps it is an increase in equity
which leads to an increase in efficiency (White, 2005).
Additionally the criteria of efficiency is not an end social goal (Bromley, 1990;
Hill & Myatt, 2010; White, 2005). Efficiency is valued because the efficient allocation
of scarce resources leads to optimal outcomes for society. One of those optimal societal
outcomes is greater equity, so a preoccupation with a decrease in efficiency should not
preclude a societal effort of achieving a more tangible goal, such as increased equity
(Fehr, 2006). Additionally there are taxes that increase efficiency. Taxation that reduce
externalities enhance efficiency because they properly assign responsibilites (Helbling,
2012). Taxes levied on externalities, like pollution, raise revenue while discouraging
32
socially harmful behavior and make the people who benefit from an activity responsible
for the costs of that activity.
Regardless of the disagreements about the actual lack of empirical evidence to
support the extent of the efficiency – equity tradeoff, this idea still persists. The
proponents of the efficiency-equity trade off still have significant political power and
these concerns will have to be addressed to garner more mainstream popular support to
maintain or expand redistributive policy.
Because the efficiency-equity tradeoff is an important concern pertaining to the
expansion of resistributive programs it is appropriate to review these ideas. Two of the
most important and influential theories that focus on efficiency and inform the efficiency-
equity debate and decisions on which economic policy to pursue are the Pareto Optimal
and Kahlor-Hicks theories. The next section examines these ideas and their place in the
income inequality debate.
Pareto Optimal Efficiency
The concept of efficiency is concerned with the optimal allocation of scarce
resources (Colander, 2008). One of the important original theories that developed a
principle for determining the efficiency of one policy over another is known as Pareto
Optimal (Fuguitt & Wilcox, 1999). Named for Italian economist Vilfredo Pareto, the
Pareto Optimal efficiency theory proposes that any policy that makes one person better
off and does not make any other person worse off is efficient, or Pareto Optimal, and
should be implemented (Colander, 2008; Fuguitt & Wilcox, 1999; Hill & Myatt, 2012;
Sen, 1993). A Pareto Optimal condition would therefore be one with complete efficiency
33
where all resources are utilized at their maximum level because no reallocation of
resources could produce more optimal outcomes (Colander, 2008).
Pareto efficient polices are difficult to challenge because they propose to improve
someone’s condition while doing no harm to any other. Pareto Optimal theory is
important to the debate about income inequality because it used to support the view that it
is good if rich people keep getting richer as long as poor people do not get poorer because
of it (Hill & Myatt, 2010).
However, Pareto Optimal theory fails in properly assessing whether polices are
useful for promoting optimal social or economic outcomes. First, the Pareto Optimal
theory does not take distribution of rewards into account (Bromley, 1990). A policy is
considered Pareto Optimal regardless of the distribution of utility, or income, from which
it results (Hill & Myatt, 2010). Therefore, a policy that continues, or accelerates, the
uneven distribution of income going to the top of the income scale can be promoted using
the Pareto principle because the Pareto idea only takes aggregate gain/loss into account
(Colander, 2008). The first chapter of this thesis illustrated that a greatly uneven
distribution of incomes does do harm; both those who lose relative economic position,
and society as a whole. The Pareto principle lacks sensitivity to distributional equity,
which is the idea that the distribution of economic rewards is fair and offers all members
of a society an equal chance to capture those rewards (Bird, 2009). This omission is a
major shortcoming in the application of the Pareto Optimal theory (Hochman & Rodgers,
1969).
34
Another shortcoming in the use of the Pareto principle is that policies based on
the theory are impossible to develop. Pareto Optimal policy is similar to the
conceptualization of truly free markets in mainstream economics; it would be great if it
really was possible, but it is not (Colander, 2008). All policies change the status quo and
that inevitably harms someone (Colander, 2008; Hill & Myatt, 2010; Hochman &
Rodgers, 1969). A rich person getting richer while everyone else stays in the same
economic position is not a condition where no one is hurt. Harm results from people
experiencing a decrease in relative economic position, so rich people getting richer does
damage the rest of society if no one else experiences a corresponding increase in income
(Franks, 2007).
These problems in the Pareto theory, the lack of sensitivity to distributional
equity, and the fact that Pareto Optimal policies are impossible to develop lead to
attempts toward improvement. Two economists in the 1930’s have combined efforts and
produced the Kahldor-Hicks compensation principle, which they believed solved some of
the limitations of the Pareto concept.
Kahldor-Hicks Compensation Principle
As noted above, a true Pareto Optimal policy is unattainable. However, theorists
still endeavored to solve the limitations of the policy. The Kahldor-Hicks compensation
principle is one of the most important revisions of the Pareto Optimal conceptualization;
it is known as the potential Pareto improvement (Bromley, 1990) and became one of the
philosophical foundations of the cost- benefit analysis (Fuguitt & Wilcox, 1999). This
theory proposes that a policy is efficient and should be promoted if the parties that gain
35
from it could hypothetically compensate any parties made worse off by the policy
(Bromley, 1990; Fuguitt & Wilcox, 1999). This removes the Pareto Optimal requirement
that no harm be done. While removing the no-harm condition from the Pareto Optimal
theory and adding that winners only need to hypothetically compensate losers in a policy
outcome makes the Kahldor-Hicks principle actually possible. However, methodological
issues make its use controversial and it still disregards dimensions that are vital to good
economic policy (Ellerman, 2008, 2009). Ellerman (2008, 2009) famously illustrates the
“numeraire” problem of the Kahldor-Hicks principle that makes measurement and
comparison of costs and benefits incoherent.
Both the Pareto Optimal and Kahldor-Hicks theories intend to provide a value-
free method for determining policy choice by removing equity concerns from attempts to
increase efficiency (Bromley, 1990; Ellerman, 2008, 2009). However, the attempt to
separate efficiency and equity in decisions of policy is a normative one. Denying, or
ignoring, the distributional effects generated by policies is a value-based decision so
these theories are not value free (Bromley, 1990). Increasing income inequality does not
produce socially optimal outcomes for the reasons already identified in this thesis
(Benner & Pastor, 2012; Franks, 2007; Hacker & Lowentheil, 2012; Lindert, 2004;
Stiglitz, 2012; Wilkinson & Pickett, 2010). The influence Pareto and Kahldor-Hicks
principles hold over decision makers and the public is a challenge to promoters of a more
equitable distribution of economic rewards.
36
Redistributive Tax and Transfer Policy
This section will examine the results that the income tax, corporate tax, and
wealth transfer taxes have on income inequality. This is important to the income
inequality debate because these taxes generate the majority of revenues used for
redistributive policy and attempts to lessen the existing income distribution.
One of the tools government uses to lessen income inequality and its effects is tax
and transfer policy (Colander, 2008; Hill& Myatt, 2010; Noah, 2012; Stiglitz, 2012). Tax
policy can level the difference in after-tax incomes and provide revenue for transfer
policies that reallocate the resources from taxation from those at the top to those at the
lower end of the income scale (Fieldhouse, 2013; Hacker & Lowentheil, 2012; OECD,
2012). The transfer of income from the top of the income distribution to those in lower
income strata is effective in altering the overall level of inequality (Caron & Repetti,
2013; DeBacker, Heim, Panousi, Ramanath, & Vidagos, 2013; Fieldhouse, 2013). For
example, research indicates that in 2007 tax and transfer policies resulted in a 7.2%
reduction in the U.S. Gini coefficient score (Linden, 2012).
Progressive Income Tax and Redistribution
The U.S. utilizes a progressive income tax. A progressive tax is one that collects
tax amounts based on individual or family income. Tax progressivity means that the
more someone makes the higher percentage they pay in tax (Colander, 2008).
Progressive income taxes have an effect on income inequality by equalizing differences
in after tax incomes (Wu, Perloff, & Golan, 2006). Opponents of redistributive taxation
define it as morally unfair and confiscatory (Nozick, 1974; Pethokoukis, 2011). The
37
opponents of redistributive taxation often point to the theoretical efficiency loss of
taxation in general and redistributive taxation in particular, as reasons why such policy
should not be implemented (Lemieux, 1995).
Other researchers of the effects of redistributive tax policy support the policy of
altering the distribution of economic rewards to promote more equality. Redistributive
tax policy is based on some baseline condition of ownership; the term itself refers to a
recalibration of some previous state of affairs. Progressive taxation and redistributive
policy is simply a change from one state of affairs to another, whether it is fair or not
depends on the equity of the original state of things (Barry, 2011). Redistributive policy
is also seen as delivering indirect benefits to those whose resources are being
reorganized. Because redistribution helps create a better, safer, and healthier society for
those at the top of the income scale the resources that are being redistributed do benefit
them, and therefore should not be viewed as confiscatory (Barry, 2011; Murphy & Nagel,
2001).
Income tax rates have been analyzed regarding the possibility of the result of
market efficiency loss. Researchers have analyzed optimal tax rates to determine which
rates generate the most revenue and result in the least market disruption. The debate
about the tradeoff between efficiency and equity in income tax rates is not settled, it is
still “an open question” (Strom, 2008, p.4). Some research indicates that current tax rates
for the top of the income scale are far too low to promote maximum social utility
(Fieldhouse, 2013). Studies specify top income tax rates should be well over 50%,
possibly as high as 82% (Fieldhouse, 2013; Piketty & Saez, 2012; Stiglitz, 2012). This
38
would generate much more revenue for any number of programs that could help lessen
the effects of income inequality and level the economic playing field for all citizens.
There seems to be scant political support for a return to a top rate of 80% (Franko,
Tolbert, & Witko, 2013), but some increase is supported by many researchers as
minimally disruptive way to raise needed revenue for programs that could lessen the
effects of income inequality (Caron & Repetti, 2013; Franks, 2007; Gale & Slemrod,
2001; Noah, 2012; Stiglitz, 2012).
Changes in Tax Progressivity
The U.S. income tax has moved dramatically towards less progressivity since the
1960’s (Greenstone & Looney, 2013; Piketty & Saez, 2006). Top marginal rates have
dropped from 91% in the 1960’s to a current 35% (Piketty & Saez, 2006). Effective
marginal tax rates for the top 0.1% of the U.S. income scale have fallen even more
sharply and mirror the overall change in income distribution (Fieldhouse, 2013). The
result of these changes has been that income tax levels are at historical lows and
government tax policy now plays a diminishing role in promoting income equality
(Congressional Budget Office, 2011).
Corporate Tax
Taxes paid on corporate profits help ensure that companies, and the people who
own them, contribute to the systems they benefit from, including infrastructure,
educational and legal systems, and the U.S. military. Corporate taxes also raise revenue
that used for programs that help lessen the effects of income inequality. Corporate
taxation raises significant revenue for the U.S. but, similar to income tax rates, corporate
39
tax rates have fallen steadily from a top rate of 53% in 1970 to 35% today (Bowie, Smith,
Phillips, & Wamhoff, 2012; Hungerford, 2013; Stiglitz, 2012). Studies show that the
corporate tax generates about 10% of U.S. Federal revenue in 2012, down from 30% in
the 1970’s (Hungerford, 2013).
This is mainly due to changes in the tax code that benefit corporations (Stiglitz,
2012). Some of America’s largest and most successful companies pay no effective
corporate tax due to complexities in the tax code (National Priorities Project, 2013).
General Electric actually has a “negative” tax rate, which means they receive money back
from the U.S. taxpayer (Rivlin, 2012). Of the corporations that do pay tax; virtually none
actually pay the top rate of 35% (Hoover, 2013). For example, one study identifies 280
profitable companies with profits of $1.35 trillion from 2008-2010 that paid an 18%
effective tax rate, about half the top corporate rate of 35% (Bowie, et al., 2012). This
resulted in about $230 billion in lost tax revenue (Hoover, 2013).
Additionally, corporate profits are increasingly being used for lobbying efforts
that expand the already unequal corporate influence in government and this makes
income inequality worse (Stiglitz, 2012). These aforementioned 280 companies also
spent about $2 billion on lobbying from 2008-2010 (Bowie, et al., 2012). The condition
of historically low corporate tax has exacerbated income inequality because owners of
corporate stock are overwhelmingly in the top income classes therefore the lower tax
rates unequally benefit those at the top of the income distribution (Noah, 2012; Stiglitz,
2012).
40
Opponents of corporate taxation cite distortion of incentives as well as the
mobile nature of capital in a global economic system where investment will flow to the
places with the lower tax rates as reasons they oppose taxes on corporate profits
(Cummins, Hassett, & Hubbard, 1996; Norton, 2008; Sherk, 2010). They believe
corporate taxes discourage overall investment and create unemployment. Some
researchers refute this position, and state there is a lack of actual empirical evidence for
these claims (Bowie, et al., 2012; Hungerford, 2013). The evidence indicates that more
revenue was previously collected through corporate taxation and corporations still
prospered. Taxes on corporate profits helps equalize incomes, both by taxing investment
profits that is usually remitted to those in the top income brackets, and providing
government revenue that used for programs to lessen the effects of income inequality.
Wealth Transfer Taxes, the Estate Tax
Studies show that the estate tax is an effective method to decrease income
inequality (Caron & Repetti, 2013; OECD, 2012; Piketty & Saez, 2013). An estate tax is
a tax on property transferred at death (Internal Revenue Service, 2013). Inherited wealth
plays a big role in incomes at the top of the income scale. Analysis of the 2012 Forbes
400 list of the wealthiest Americans indicates that 102 of those 400 inherited their wealth
(Caron & Repetti, 2013). Similar to income and corporate taxes, transfer tax rates have
been steadily reduced (Piketty & Saez, 2013). Subsequently, the current transfer tax
structure has less effect on equalizing income levels than it did previously (Caron &
Repetti, 2013).
41
Major changes in transfer taxation occurred over the last decade. The amount that
triggered a tax, called the exemption amount, has increased from $1.5 million in 2004 to
$5.25 million in 2013 (Internal Revenue Service, 2013). In other words, estates under
$5.25 million do not pay any estate tax. These numbers have risen dramatically since
1977, when the estate tax exemption was about $121,000, or $465,000 in inflation
adjusted 2013 dollars (Thurlow, Thurlow & Giachino, 2013; Bureau of Labor Statistics,
2013). As the estate tax exemption has risen, rates have fallen. The top rate in 1977 was
70%, in 2012 it was 40% (Thurlow, Thurlow & Giachino, 2013). These trends have
resulted in much less revenue from this tax. Reich (2013) estimates that changes in the
estate tax will cost the U.S. $350 billion in 2013 alone, and trillions over the next decade.
Other analysis puts the revenue loss from current changes in the estate tax at $1.3 trillion
over the next 10 years (Huang, 2009).
Because the estate tax is targeted at the very wealthy, it is highly progressive and
affects those with the most ability to pay (Caron & Repetti, 2013; Slemrod & Gale,
2001). Estate taxes are more efficient than taxes that target labor or production because
inherited wealth appears to have less robust positive market effects than “earned” income
(Caron & Repetti, 2013). Efficiency concerns diminish due to the inevitable nature of
death, and the resulting transfers of wealth that occur due to death (Slemrod & Gale,
2001). The thinking that informs this conclusion is that no one wants to die, so bequeaths
that take place due to death is largely accidental and provides little or no utility to the
benefactor. Therefore taxation of these bequeaths do not diminish the utility of the
benefactor (Caron & Repetti, 2013; Gale & Slemrod, 2001).
42
Traditional economic concerns that increased estate taxes will lead to diminished
savings rate and harm small businesses and family farms are not borne out by the
research (Gale & Slemrod, 2001; Huang & Frentz, 2013). Recent studies indicate that
only 20 small businesses and farms will be subject to the current transfer tax (Huang &
Frentz, 2013). A very small portion of estates pays any transfer taxes, so altering rates to
produce more revenue and equality would not significantly raise the overall impact to
99.9% of taxpayers (Huang & Frentz, 2013). Research indicates higher estate tax rates
also result in increases in charitable giving (Caron & Repetti, 2013).
The previous section illustrates that tax rates have dropped significantly across all
the three major tax revenue sources; income, corporate and estate taxes. These tax rate
decreases have occurred at the same time that income inequality has become more
pronounced and wealth and income have grown exponentially at the very top of the U.S.
income distribution. This decrease in tax revenue results in less money for expenditures
that can be used to equalize the distribution of income and its outcomes.
Government Expenditure Programs
The government uses a portion of the revenues from taxation for expenditures that
contribute to ameliorating income inequality and the resulting effects (Barry, 201; Noah,
2012; Franks, 2007; Stiglitz, 2012; Wilkinson & Pickett, 2010). This next section will
explain the role of these programs and the research on their effects by focusing on
transfers, or the act of providing resources to the less fortunate. This section will
conclude with a brief review of the effects on income inequality that education and
infrastructure spending affect. These programs are not transfer programs but they are
43
included here because they are similar to transfers because they require government
expenditure and provide equalizing effects on income distribution.
Government Transfers: Effect on Income Dispersion
The government utilizes transfers to help restore income lost due to an unforeseen
circumstance, and to provide a minimal level of financial support for those who have
need of it (Betson & Haveman, 1984). Colander (2008) defines transfers as, “payments
to individuals that do not involve production” (p.534). Current Federal transfer programs
include the Supplemental Nutrition Assistance Program (commonly known as food
stamps or SNAP), Temporary Aid to Needy Families (TANF), Social Security, Medicare
and Medicaid, among others. Federal spending on transfer programs for low income
Americans, not including health care, has averaged about 2.1% of GDP since 1980
(Greenstein & Kogan, 2013).
Transfer programs have been found to be only partially effective in reducing
income inequality overall, and their effectiveness appears to be decreasing (Wu, Perloff,
& Golan, 2006). In 1979, federal tax and transfers lowered the Gini coefficient between
market income and after tax income by approximately 23%, from 0.479 to 0.367. In
2007 these programs affected a 17% Gini decrease from 0.590 to 0.489 (Congressional
Budget Office, 2011). Consistent with other measures of income inequality across
Western democracies, U.S. transfer amounts are lower and less effective. Comparatively,
U.S. transfer programs achieve less average reductions in inequality measured by the
Gini coefficient than other OECD countries (Organization of Economic Cooperation and
Development, 2011).
44
This is partially because the distribution of transfers began to shift in 1979 from
those at the bottom of the income distribution to those in the middle, or top
(Congressional Budget Office, 2011). Programs like Social Security and
Medicare/Medicaid, which constitute the majority of transfer payments, overwhelmingly
go to the elderly and are not income adjusted so many in the middle and upper income
scale receive benefits from these transfer programs (House Budget Committee, 2011).
This is partially a result of the amount and intensity of lobbying and other forms of
influence utilized by these groups (Lee, 2002).
Criticism of Transfer Programs
Critics of redistributive transfer programs often cite the overall lack of positive
family effects and “non trivial” disincentives to work that is associated with government
transfer programs (Dixit & Londregan, 1995; Wu, Perloff & Golan, 2006). Wu, et al.
(2006) state that Aid for Dependent Children (AFDC) reduces the incentive for some
recipients to work because the benefits equal what a low wage job would pay, and that
some people may reduce work to meet the income threshold required for inclusion into
the program. Research indicates that transfer programs may result in a reduction in
average work hours for populations receiving transfer benefits (Danzinger, Haveman, &
Plotnick, 1981). However programs such as the Earned Income Tax Credit appear to do
a better job of utilizing transfer benefits to achieve improved outcomes for recipients
because it rewards and encourages work and enjoys a high participation rate, unlike many
other transfer programs (Holt, 2011). Drawbacks of the EITC are that it rewards work
but because it does not help the large number of people who do not have any earned
45
income, it is often a short term fix, it creates a lack of political concern about low wages,
and it is plaqued by adminstrative errors (Greenstein & Wancheck, 2011; McMillian,
2007).
Chapter Conclusion
Overall research indicates that government transfer programs have had some
success in lessening the effects of income inequality. An important question for the
critics of redistributive policies is if they produce sufficient bang for the buck or if they
are too inefficient. As previously mentioned, the decision about whether the government
should engage in redistributive tax and transfer policy is normative and is based on
individual ideas about fairness. While it may be possible to design policies that are more
efficient and get more of the resources to those in need, curently these policies are
helping people navigate difficult lives and having a positive effect on reducing income
inequality (Benner & Pastor, 2012; Noah, 2012; Stiglitz, 2012;Wilkinson & Pickett,
2010).
Income inequality is a controversial topic. The previous section was intended to
illustrate the range of theory behind the approaches to income inequality in the literature.
The previous section addressed the thinking surrounding the question of whether or not
government should do anything about income inequality. The next section returns to the
Bardach (2009) approach to analysis and addresses the literature on the alternatives
proposed to alter current levels of income dispersion.
46
Chapter 3
CONSTRUCTING ALTERNATIVES
This chapter continues with Bardach’s (2009) eight-step approach to analysis.
The first chapter satisfied the first two steps of this process, defining the problem of
income inequality in the United States is too great, and presenting the evidence. The
initial chapter of this thesis presented evidence that income inequality is real and getting
worse and provided supporting research that shows this condition is detrimental to
society, even to those at the top of the income scale. U.S. incomes are diverging
drastically and this condition corresponds to poor outcomes in health and well-being
across all income segments of more unequal societies. The next step in the Bardach
(2009) process is constructing the alternatives. This chapter will examine the primary
alternative approaches identified in the literature to lessen the current levels of income
inequality.
There are two general approaches to the alternatives proposed to lessen income
inequality. One approach alters the economic structure in an attempt to decrease the
dispersion of incomes; the other approach alters the outcomes of income inequality. This
chapter will examine these approaches and an option proposed by Bardach (2009) to let
present trends continue and take no action.
Financial regulation commands a major role in the literature concerning attempts
to decrease the dispersion of incomes. This is because actions by Wall Street, the
banking industry, and the U.S. Federal Reserve are identified as being responsible for a
great deal of the current income inequality. This chapter examines the proposed remedies
47
identified in the literature that change the structural conditions in the financial sector that
create and exacerbate inequality. These financial sector remedies are, reinstate the Glass-
Steagall Act, break up the “too big to fail” banks, reform the mortgage deduction, change
bankruptcy laws, reinstate a more robust estate tax, and re-focus the Federal Reserve
Bank on its dual mandate.
Alternatives proposed in the literature and examined in this chapter that lessen the
effects of income inequality are campaign finance reform, universal health care, re-
unionize the U.S. labor force, and increased investment in education and infrastructure.
These outcome oriented alternatives do not focus on the current actual income dispersion
but if implemented will lessen some of the consequences of income inequality by
creating a more equitable society regardless of income distribution. These alternatives
that create more social equity irrespective of income distribution are important because
the social costs of income inequality are the main problem with income inequality. If a
less-equal society were healthier, more inclusive, educated, and provided more
opportunity there would be no issue with a small number of citizens reaping the vast
majority of economic rewards. As Chapter 1 of this thesis illustrated this is not the case.
The alternatives examined in this chapter are identified through an extensive
review of current research on income inequality. This review of alternatives will begin
with the alternative of letting present trends continue, or do nothing. Bardach (2009)
proposes this alternative as being relevant in almost any analysis where a
recommendation is developed. The option of leaving conditions in the present state is a
serious one. There are occasions when implementing change results in less than optimal
48
outcomes. There is a natural proclivity to action, doing nothing is often the most difficult
course. The option to let present trends continue will be examined next.
Let Present Trends Continue - Do Nothing
Bardach (2009) advises in his discussion of alternative construction to always
include the opportunity to “let present trends continue,” or do nothing other than let
natural change take its course (p. 17). This is relevant here because this is the strategy
preferred and proposed by many who believe the free market is the most effective and
equitable manner to ensure a proper distribution of economic rewards (Feldstein, 1999;
Pethokoukis, 2011; Pennington, 2013). They believe that nothing should be, or can be,
done about the widely divergent U.S. income dispersion. This is primarily due to
strongly held beliefs about the effects of more equality on incentives to achieve, as well
as concerns about the negative results of government intervention in the market.
The idea that equality is detrimental to motivation or that deprivation is a factor
that creates the necessary desire and effort for economic progress is an assumption of
those who think inequality should be resolved by the free market (The Economist, 2013).
Government attempts to alter market outcomes to insure more equality are believed to
produce negative economic consequences and are bound to fail, and make inequality
worse (Lee, 2013). Government can get things wrong and unintended outcomes result
from poorly planned or implemented policy. Strategies intended to alter market
outcomes such as income distribution, must be well thought out with sensitivity to
possible unintended consequences. When government institutes policy, there is always a
trade off that must be anticipated (Colander, 2008).
49
Another argument in favor of “letting present trends continue” is the idea that
government intervention in the market usually makes things worse (Sowell, 2008; Woods
Jr, 2009). If this were true, it would make sense for government to stay out of the income
inequality problem and let the market determine the appropriate income dispersion.
However, government has a generally accepted role as the arbiter and guarantor of
markets (Colander, 2008; Hill & Myatt, 2012). The idea that a more lassiez-faire
economic approach is the best way to organize the market is challenged by those who
believe government has failed in its role as referee of the market. Deregulation,
especially of the financial industry, has led to a great deal of the current income
inequality (Alvaredo, Atkinson, Piketty, & Saez, 2013; Hacker & Lowentheil, 2012;
Stiglitz, 2012).
Financial Regulation - Why it Matters
The current state of income inequality in the U.S. has come to the forefront of our
social and political discourse around the same time as the great financial crisis and the
2007 economic downturn (Fontevecchia, 2011). It was during this period that actions
and practices at Wall Street banks and brokerages came under greater scrutiny from the
public. The manner in which Wall Street was conducting its business started to look
unfair and dangerous (Lewis, 2011). The outsized bonuses awarded to Wall Street
CEO’s whose banks were bailed out by taxpayers ignited a strong opposition to those
businesses, and their practices (Schwartz, 2011). Wall Street came to symbolize the
structural inequities in the U.S. economic system exemplified by the 1% versus 99%
construct, and the 99% began to perceive that Wall Street practices and pay were
50
emblematic of an inequitable system that did not reward success and competition but
access to power and influence (Noah, 2012; Stiglitz, 2012).
Researchers disagree about which exact tactics are more vital to alter the income
distribution. This is due primarily to what forces they see as being most responsible for
the creation, and exacerbation of current income dispersion. Stiglitz (2012) places a large
portion of the blame for the current elevated levels of U.S. income inequality on the
political influence, business practices and remuneration policies of the financial sector.
While there are differences in the interpretation of causal factors, the majority of
researchers of income inequality assign culpability to the financial sector (Frank, 2007;
Hacker & Lowentheil, 2012; Noah, 2012; Stiglitz, 2012; Wilkinson & Pickett, 2010).
Outsized executive pay, rent seeking behavior and the development of opaque financial
instruments like collateral debt obligations (CDO’s) and derivative trading have led to a
Wall Street/Main Street economic and social disconnect (Catlett, 2013; Rasmussen,
2013).
Focusing Event
The public is beginning to pay attention to this situation. Kingdon (2011) advises
that a “focusing event” is necessary for a topic to get on the “policy agenda” and into the
mainstream of public interest (p. 95). The $2.6 billion awarded to Goldman Sachs
employees, and $67.9 million in “performance” bonuses to CEO Lloyd Blankfein alone,
in the same year the company received a $10 billion bailout from U.S. taxpayers brought
income inequality and the reality of the two Americas into sharp focus (Moore & Harper,
51
2010). This is a major reason why financial reforms are such a large part of following
recommendations for lessening income inequality.
Rent Seeking
Traditional economic theory posits that people benefit according to what they
contribute. This entails people creating wealth to be rewarded with wealth (Colander,
2008; Hill & Myatt, 2010). Rent seeking is the practice of making money by capturing
someone else’s wealth, not by creating wealth (Colander, 2008; Hill & Myatt, 2010;
Stiglitz, 2012).
Rent seeking is an important concept in the understanding of the economic and
political forces that result in income inequality so a brief explanation is appropriate. The
majority of researchers investigating income inequality have concluded that some
corporations, such as the banks and the big energy companies, are not contributing
commensurate to what they are receiving in return from U.S. society (Franks, 2007;
Noah, 2012; Stiglitz, 2012). Additionally there is a sense that these entities are not
creating wealth and helping “grow” the economic pie, but using their talents and political
influence to transfer the hard-earned rewards of others to themselves. This is classic rent
seeking behavior and a distortion of the market that results in economic inefficiencies and
exacerbates income inequality (Colander, 2008; Hill & Myatt, 2012; Stiglitz, 2012).
One type of rent seeking behavior is profiting from government largesse. One
example of rent seeking is when the U.S. Federal Reserve currently lends money to
commercial banks at 0.08% per annum, aptly named the “discount” rate. Banks can take
this virtually free money and immediately purchase a 1-year Treasury note that pays the
52
bank 0.10 % (U.S. Federal Reserve, 2013). That is a 20% profit for doing nothing. It is
not hard to get rich when you can do this repeatedly with billions of dollars lent to you
free. This is a subsidy to the financial sector paid for by the taxpayers. These
transactions provide no social benefit. The discount rate is intended to promote lending
to customers to start businesses and invest, but the banks have figured out a way to
subvert this intention. This scheme, and others like federal oil and gas leases at discount
rates to multi-billion dollar corporations, creates a regressive distribution of income from
the majority to the very top of the income scale. This adds to income inequality and is an
example of rent seeking behavior (Hill & Myatt, 2010; Stiglitz, 2012). This behavior is
contrary to market ideals of fair competition and result in market inefficiencies and a
skewed distribution of economic rewards (Colander, 2008; Hill & Myatt, 2012).
Federal Reserve Dual Mandate
Re-calibrating Federal Reserve policy to fulfill its dual mandate would boost
employment, especially during a period of low inflation, and is seen as a way to lessen
income inequality and help raise millions of Americans out of unemployment and
poverty (Frank, 2007; Hacker & Lowentheil, 2012; Matthews, 2012; Noah, 2012;
Stiglitz, 2012).
The Federal Reserve Bank was created with a dual mandate. One of the Federal
Reserve goals is to contain inflation and promote price stability; the other is to promote
full employment (Board of Governors of the Federal Reserve System, 2013). Critics of
Federal Reserve policies see an abrogation of this second mandate as Bank has
concentrated solely on keeping inflation low.
53
Regulate Campaign Finance
Campaign finance reform (and a repeal of the Citizens United and Buckley v.
Valeo rulings) is an important step in correcting the imbalances in our political system.
These imbalances help create and exacerbate the political and economic separation of the
1% and the rest of society and worsen income inequality (Benner & Pastor; 2012; Hacker
& Lowentheil, 2012; Matthews, 2012; Noah, 2012; Stiglitz; 2012). The discount rate
example (see Rent Seeking, above) is only one of the ways that financial interests have
taken advantage of the political system. More accurately, they have shaped the system to
their advantage through the political power gained by lobbying, a revolving door between
government regulators and Wall Street and the importance of corporate campaign
contributions (Johnson & Kwak, 2010; Zingales, 2012). Elected officials are supposed to
reflect for the will of “we the people,” but increasingly political elites are representing the
will of the top 1% (Cilens, 2012). The amount of money needed to win political office is
staggering, the 2012 presidential campaign cost $6 billion, up over $1 billion from 2008
(Kane, 2012). This gives unequal power and access to those who can afford to
participate in this arena, and leaves the majority out. In a country where Supreme Court
Justice Scalia upheld the notion that,” money equals speech,” coupled with shrinking
household income, the danger of the influence of money on our basic democratic rights is
a legitimate concern.
54
Regulate the Banks
Reinstate Glass–Steagall, Limit Risk Taking
There is a growing consensus requiring an alteration of the banking sector is
necessary for any meaningful reduction of income inequality to take place (Wilkinson &
Pickett, 2010; Noah, 2012; Stiglitz, 2012; Franks, 2007). The ideas for banking reform
will reduce income inequality, and make the banking system more fair, transparent and
competitive. Tighter regulation of Wall Street practices are listed as a primary approach
to financial reform that would lessen income inequality (Noah, 2012; Stiglitz, 2012,
Wilkinson & Pickett, 2010; Reich, 2011). These regulations include reestablishing
firewalls between depository and investment banks by reinstating some version of the
Glass-Steagall Act, raising capital requirments to limit leverage and risk, requiring hedge
funds to register with the Securities and Exchange Commisisson, bolster the power of the
Financial Protection Bureau, and closing down off shore banking tax havens (Franks,
2007; Noah, 2012; Reich, 2011, 2012; Stiglitz, 2012; Wilkinson & Pickett, 2010).
Break Up “Too Big to Fail” Banks
Finally there is broad consensus that big banks need to be broken up (Franks,
2007; Matthews, 2012; Noah, 2012; Reich 2012, 2013; Stiglitz, 2012; Wilkinson &
Pickett, 2010). There is an impressive roster of those who agree to breaking up the big
banks including, former FDIC chairs Bair, Bullard and Dudley, the heads of the St.
Louis and New York Federal Reseve Banks, Haldene executive director of the Bank of
England, previous head of the Federal Reserve Bank Volker, even Purcell and Weil,
former CEO’s of Morgan Stanley and Citi (Cahoon, 2013). Famously, Alan Greenspan,
55
a man who many blame for the policies that lead to the current condition of the banks
said, “If they’re too big to fail, they’re too big” (McKee & Lanaman, 2009).
These alternatives are accepted by researchers as important in making the U.S.
financial system more equitable. A more equitable financial system removes some of the
power and influence of insiders, the big banks, and their influence on policy (Hacker &
Lowentheil, 2012; Stiglitz, 2012). This would reduce income inequality because part of
the tremendous rise of income in the top 1% has come from the way the financial system
works to the advantage of the wealthy (Noah, 2012; Stiglitz, 2012). Additionally,
reducing the risks that unsafe banking practices will create another economic crisis is
important, because economic crisies have had worse long term equity effects for the poor
and middle class (Parrott, 2008). Historically the wealthy have rebounded faster, and
more completely after financial calamities than the rest of economic society. Regulating
anti-competitive practices in the financial sector will level the playing field and create
more real equality of opportunity as well (Johnston, 2011).
Reform the Mortgage Deduction
Researchers see the home mortgage deducation as a policy that makes inequality
worse because it is a subsidy to wealthy home owners (Stansel & Randazzo, 2011).
Currently interest on mortgage debt of up to $1 million can be deducted from a
households income tax. These subsidies transfer about $120 billion to home owners each
year (Carroll, O'Hare, & Swagel, 2011). The majority of this subsidy goes to households
already in the top quintile of earners. Because the mortgage deduction is so entrenched in
the pricng of U.S. homes ideas about what to do vary from ending the deduction
56
immediately (Benner & Pastor, 2013), to a slower winding down (Editors, 2013; Habib,
2013). The exact process would have to be negotiated but there appears to be a
consensus forming around the idea of a change in this deduction (Gleckman, 2013;
Habib, 2013). This would have a equalizing effect on income disparity by removing a
taxpayer subsidy to wealthy home owners.
Bankruptcy Reform
Reform of the bankruptcy system is proposed as an reasonable alternative that
will lessen the effects of debt on inequality and allow people to take the chances
necessary to move their lives and the economy forward, creating more businesses and
jobs (Hacker & Lowentheil, 2012; Stiglitz, 2012; Wilkinson & Pickett, 2010).
One of the consequences of growing income inequality is the explosion of U.S.
household debt (Kumhof & Ranciere, 2010). Research by Frank (2007) indicated that as
income inequality grows households in the middle class must increase debt to maintain a
relative social position. Historically bankruptcy has been a method for households to get
a fresh start if they have acquired too much debt through circumstances outside of their
control. Bankruptcy laws have been an accepted part of financial systems for thousands
of years (Tabb, 1995). Recent changes in bankruptcy laws have made acquiring this
fresh start much more difficult, and in some cases impossible (Michon, 2013). Fewer
people are allowed to utilize Chapter 7 liquidation of debt and now must use Chapter 13
repayment. These changes also recalibrate the method for determining property values
and reduce the amount of allowed income for living expenses protected from bankruptcy
(Michon, 2013). This condition adds to the negative effect of income inequality by
57
making it more difficult for those at the lower end of the income scale to be relieved of
crushing debt. There are actual cases of people who cannot afford to declare bankruptcy.
Educational Debt and Student Loans
A great deal of debt is tied to aspirational spending. Reforming student loan
policies that could make it possible to discharge student loan debt in bankruptcy would
lessen income inequality because student debt is overwhelmingly concentrated at the
lower end of the income distribution (Hiltonsmith, 2013). Currently student debt stands
at around $1 trillion, and recent research projects this debt could end up costing $4
trillion in lost wealth for those indebted households (Hiltonsmith, 2013). This debt
burden is insidious because higher education is seen as a way to lessen income inequality
and ensure better long term earning power (Franks, 2007; Hacker & Lowentheil, 2012;
Noah, 2012, Stiglitz, 2012; Wilkinson & Pickett, 2010). However this research indicates
that a significant portion of this increased earning power will go to finance the debt
needed to achieve this level of education. This is a defacto redistribution to the
financiers of this debt, traditionally the top of the income scale (O'Neil, 2012). Student
loan debt is concentrated among the lower income quintiles. Seventy five percent of
Bachelor’s degree earners in families with average incomes of less than $60,000
graduated with student loan debt, while only 48% of those with family incomes of over
$100,000 did (Hiltonsmith, 2013). While the Hiltonsmith (2013) study is instructive it
does not examine debt in the upper income scale. The study uses family incomes of
$100,000 as the top cut off point, so it is difficult to see the exact debt breakdown in the
current income distribution. Household income of $100,000 is not even in the top 20% in
58
the U.S., or the top 25% in Sacramento County, but it is fair to asume this debt level
drops rapidly as household income rises (Bureau of Economic Analysis, 2013). The
majority of student loan debt can not be discharged through bankruptcy so even in cases
of hardship this debt remains a drag on future income. Changes to this part of bankruptcy
law could help individuals and require lending institutions to take more responsibility in
vetting potential borrowers. Currently the fact that people cannot discharge this debt
relieves lenders from performing proper due diligence before lending and creates
perverse incentives for banks (Allen, 2010).
Enact Universal Health Care
Bankruptcy laws can discharge some medical bills but medical bankruptcy is a
growing problem (Chua & Casot, 2008). Differences in access to high quality healthcare
is one of the most nocent problems of income inequality (Wilkinson & Pickett, 2010).
Modern healthcare is prohibitively expensive, especially for those at the bottom of the
income scale. Lack of access to heathcare exacerbates inequality by consigning less
fortunate families to less healthy and prosperous lives (Mukherjee, 2013; Wilkinson &
Pickett, 2010). This condition is ameliorated by the next widely cited strategy to lessen
the effects of income inequality, enact universal health care. Universal health care is seen
as germane to lessening income inequality because it removes an important effect of
income differences, the disparity in access to high quality health care (Oxfam
International, 2013; Deaton, 2003; Shi, Starfield, Kennedy, & Kawachi, 1999).
Medical bankruptcy is rising as a percentage of all bankruptcies, as people lose jobs and
employers end the practice of providing health care (Mitchell, 2013; Parker-Pope, 2009).
59
Universal health care is viewed as a way to end this problem and afford all people access
to high quality care (Hacker & Lowentheil, 2012; Noah, 2012; OECD, 2012; Wilkinson
& Pickett, 2010).
Insecurity about health care has adverse effects on economic decision making and
job growth and providing more health security allows people to take more risks, innovate,
and create opportunity and allow them to live with less fear of unforseen circumstances
(McCardle, 2010; Mohit, 2009).
Re-Unionize U.S. Labor Force
Studies correlate the unionization of workforce with income equality (Franks,
2007; Gordon, 2013; Matthews, 2012; Noah, 2012; Stiglitz, 2012; Wilkinson & Pickett,
2010). These studies indicate income equality moves directly opposite of a society’s
level of unionized labor. As unionization decreases income inequality increases and vice
versa. Unions are viewed as a force that drives wages up across the labor market, even in
non-union sectors (Mishel & Walters, 2003). There has been a concerted, and largely
successful, effort by conservatives and corporate interests to break union power
beginning with the Reagan administrations treatment of air traffic controllers (McCartin,
2011). This effort, coupled with privatization, globalization, the decline of U.S.
manufacturing, and “right to work” legislation has resulted a decrease in the percentage
of union workers in the U.S. labor force (Fischer, 2010). The U.S. has seen a drop in
labor force unionization the from 20.1% in 1983 to 11.3% in 2013 (Bureau of Labor
Statistics, 2013). This decrease has had a negative effect on U.S. income equality
(Hacker & Lowentheil, 2012; Noah, 2012 ; Stiglitz ,2012). Figure 7 shows the
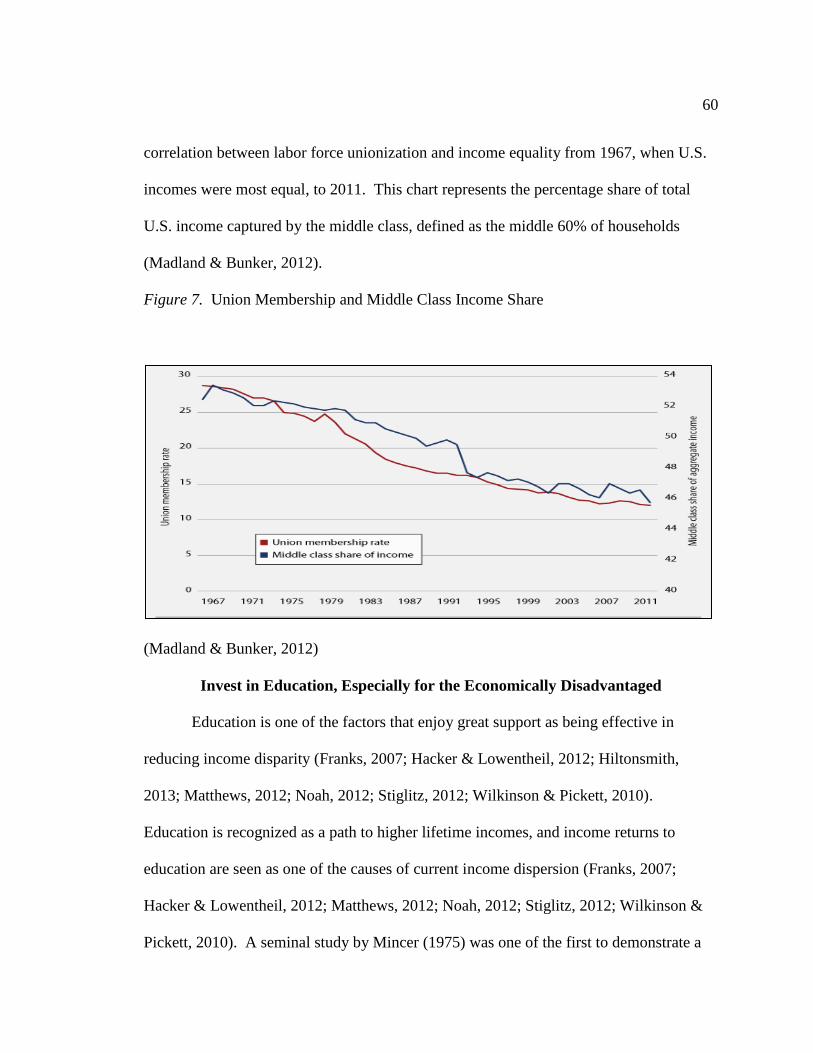
60
correlation between labor force unionization and income equality from 1967, when U.S.
incomes were most equal, to 2011. This chart represents the percentage share of total
U.S. income captured by the middle class, defined as the middle 60% of households
(Madland & Bunker, 2012).
Figure 7. Union Membership and Middle Class Income Share
(Madland & Bunker, 2012)
Invest in Education, Especially for the Economically Disadvantaged
Education is one of the factors that enjoy great support as being effective in
reducing income disparity (Franks, 2007; Hacker & Lowentheil, 2012; Hiltonsmith,
2013; Matthews, 2012; Noah, 2012; Stiglitz, 2012; Wilkinson & Pickett, 2010).
Education is recognized as a path to higher lifetime incomes, and income returns to
education are seen as one of the causes of current income dispersion (Franks, 2007;
Hacker & Lowentheil, 2012; Matthews, 2012; Noah, 2012; Stiglitz, 2012; Wilkinson &
Pickett, 2010). A seminal study by Mincer (1975) was one of the first to demonstrate a
61
robust quantitative link between education and income. A meta-analysis of 64 empirical
studies indicates there is general support for the hypothesis that increased education
reduces income inequality in the academic literature (Abdullah, Doucouliagos, &
Manning, 2011). The study found that 22.6% of the 64 econometric studies examined
found education had a statistically significant equalizing effect on incomes. Conversely,
25.7% of the studies actually indicated education increased income inequality in an
statistically significant manner. The authors propose this is due to the fact that education
spending in many countires is often allocated toward the middle and upper classes of
socieities (Abdullah, Doucouliagos, & Manning, 2011). According to this recent meta
analysis, education affects incomes at the very top and bottom of the income distribution,
but has little effect on middle class incomes. This may be due to the fact that societies
with a large middle class have a higher baseline education level overall and small
changes in the income distribution are difficult to attribute to any one factor, including
education.
The study reports that variation in the effectiveness in education on altering
income distribution may be due to differences in the overall level of economic
dvelopement of a country, and that more developed countries have better results
attributed to education. Politcal systems are also important and education has more
pronounced effect on equalizing incomes in countries with more democratic political
systems. The study indicates support for education as a signalling mechanism, or that in
a world where people can not know a lot about each other, educational attainment signals
that a person has desirable skills and is a indicator of human capital (Wheelan, 2010).
62
These findings are consistent with other research that indicates education, especially for
young children from low income families, can raise lifetime income prospects and create
aggreagate improvements in income equality (Mitchell, 2013). Public investment in the
nations human capital is needed to reamin competitive and foster the skills needed for
people to do the high paying jobs of the next 50 years (Cooper, Hersh, & O'Leary, 2012).
The key is to focus education resources towards those at the lower end of the income
scale, spending more money on already affluent schools does not appear to have a positve
effect on encouraging income equality (De Gregorio, 2002).
Invest in Infrastructure
America’s infrastructure is deteriorating rapidly and this condition makes the
country less competitve (Alden, 2012), and less equal (Benner & Pastor, 2012). Studies
show that improved infrastructure is one of the ways a society can lessen the effects of
vast differences in income dispersion by providing efficient, safe and reliable
transportation systems for all its citizens, reducing time and transportation costs
(Calderon & Serven, 2014). Infrastruture invesments also create jobs at a higher rate than
other pubic sector spending, and infrastructure spending creates significant direct,
indirect, and induced job creation (Heintz, Pollin, & Garret-Peltier, 2009). Unlike public
discontent with other government action, there is widespread support for infrastructure
investment. Polls indicate the U.S. public overwhelmingly support increased spending on
infrastructure and and large majority have indicated they would pay more in taxes to
achieve this (CNN/ORC, 2011; Building America's Future, 2009). Infrastructure
investment could be used as an approach where public investment could generate job
63
growth, promote income equality and build the needed physical plant for a more
competitive future.
Chapter Conclusion
This chapter continues the Bardach (2009) process of analysis and presents the
most common alternative approaches proposed in the literature to lessen the condition
and effects of income inequality. The first chapter was intended to report to the reader of
the existence of the problem and the reasons why income inequality is a concern for
society. The last two chapters were intended to inform the reader what the literature
suggests should be done, and responded to the arguments that nothing should be done. I
do not recommend an expansion of redistributive policy in this thesis. Not because they
do not work, or because they increase market inefficiencies, but because there are other
better approaches that result in more income equality and I believe have a better chance
of actually being implemented.
The next chapter will move towards developing specific recommendations by
presenting and explaining the criteria I will use to assess the alternatives. These criteria
are the most important in assessing and deciding upon the best approaches to lessen the
condition and effects of income inequality.
64
Chapter 4
ASSESSMENT CRITERIA
Criteria judge the potential outcomes of competing alternatives. The choice of
alternatives is really a choice about what alternative results in the “best” outcome
(Bardach, 2009). The previous chapter illustrated the wide range of alternatives available
to alter the condition and effects of income inequality. They all have merit, and choosing
between them, or developing other alternatives, depends on the understanding of the
problem and individual assumptions about the causes of income inequality. This chapter
will list and explain the criteria used to evaluate the outcomes of the alternatives and
decide on the recommendations that follow.
Mintrom (2012) posits that the decisions we make about “what to do” convey
what we see as important, they are necessarily normative because they flow from the
results we hope to achieve. To establish criterion that leads to the hoped for result
Bardach (2009) suggests beginning with one overarching goal or objective. This
objective intuitively flows from the basic problem statement. The problem this thesis
confronts is that income inequality in the U.S. is too great; therefore, the criteria assess
the alternatives by their respective projected outcomes on how effective they will be at
lessening income disparity. The research, and my understanding of income inequality,
has led me to the four criteria that I believe are most essential to assessing the outcome of
any proposed recommendations. These are sufficiency, sustainability, least disruptive to
market processes, and political acceptability.
65
Choosing and explaining the decision criteria is important to narrow the focus to a
realistic number of alternatives, and to explain the reasoning behind the choice of one
alternative over another. The decision about what to do, or not to do, about the current
income dispersion will require tradeoffs. Income inequality is a controversial topic; there
are disagreements about what outcomes and tradeoffs are most important. As explained
in the previous chapter some people believe market efficiency is the top priority, others
believe that social and economic equity take precedence. Explicitly indicating the
guiding criteria used to decide upon the recommendations will allow critics and
supporters of these recommendations to understand the reasoning behind the choices.
Sufficiency means determining if implementation of the alternatives results in a
substantial reduction of income inequality. Sustainability determines whether the
decrease in inequality resulting from implementation of the alternative will be long term,
and if results will persist without constant additional attention and resources. These first
two criteria are balanced against the next two; least disruptive to the market, and political
feasibility. In other words, an alternative judged as sufficient and sustainable will then be
assessed according to the probable effect it will have on the efficient working of the
market, and then its respective political feasibility. An alternative that is both sufficient
and sustainable but is determined to be too disruptive to the functioning of the market
will not be recommended. An alternative that satisfies the initial three criterions will then
be assessed by the likelihood of its political acceptance. The implementation of the
proposed recommendations will require political action. Therefore, the political
probability of their actual implementation is crucial to the assessment process.
66
Sufficiency
The focus of this thesis is to analyze strategies to lessen either the condition or
effects of U. S. income inequality; therefore, the first and most important criterion is
sufficiency. Simply put, alternatives are judged by how sufficient the probable outcomes
will be in achieving less inequality. This assessment is done by examining the literature
and extrapolating the probable results of the proposed policy action. Alternatives that
have demonstrated a high probability of success in achieving the overall goal of lessening
income inequality will be determined to be superior to alternatives that do not.
Sustainability
The determination of sustainability in this thesis assesses whether an alternative
will result in an outcome that will be able make a long term, reduction in income
inequality without constant adjustments or additional resources. The outcome must have
long-term effectiveness because only decreasing inequality in the short term is
inadequate. Changing the trajectory of income inequality will require a degree of effort
that is not worth it for a short-term alteration. Similar to sufficiency, the criteria of
sustainability will ensure that the recommendations are sensitive to the fact that once
implemented they will have to produce positive results.
Least Disruption to Market
Changing the current trajectory of income dispersion will require a market
alteration. One of the dangers of governmental recalibration of any market process is that
attempts to solve a problem will result in other, more disruptive problems. The
recommendations intend to make the market work better, and distribute rewards more
67
fairly, and evenly. However, damaging effects may arise while attempting an alteration
in market rewards.
Government does play a necessary role in promoting and supporting the market
(Mintrom, 2012). However, negative unintended consequences are always possible in
government market alteration (Colander, 2008). While market efficiency is not the end
goal of government action, implementation of policies that have a negative effect on the
allocation of scarce resources must be avoided. The goal of the recommendations in this
thesis is to make markets work better, by promoting a more equitable distribution of
rewards. If these recommendations cause negative unintended consequences it could be
that all the work needed to promote and execute them will simply result in trading one
bad outcome for another. To avoid any negative outcomes the recommendations are
assessed using the lessons from previous research and comparisons of past efforts.
Political Feasibility
This thesis is written during a time of political upheaval. Conflict between
political parties has shut down the federal government in 2013, and another shutdown
looms. That makes this last criterion, political acceptability, the most troublesome of all.
It is difficult to imagine what policy could be politically acceptable to a group of
legislators that are willing to suspend the federal government. Regardless, this thesis will
attempt to assess the political chances for the recommended alternatives because they will
require government action to implement.
It is not responsible to allow income inequality to continue on its current
trajectory because a minority group opposes almost any government action. The
68
previously presented evidence illustrates the danger that the current levels of income
inequality pose to everyone, regardless of their economic position or political affiliation.
It is possible that this evidence will sway some opponents. Assessing the alternatives by
using these criteria will help produce recommendations that are common sense enough to
garner some support from foes of government “interference.”
All of the judgments made about the outcomes of the alternatives are subjective.
It is impossible to know the future. It is possible to make informed assessments about the
probable outcomes of action by looking closely at research and experience and using that
knowledge to extrapolate the probable outcomes of the respective recommendations.
This is the art of analysis. There is no calculator to find the best approach to major issues
such as income inequality. The process is complicated, and decisions about what to do
are shaped by the viewpoints and biases of each person who examines it. These criteria
are guideposts; they are intended to generate a positive strategy for creating an equal
distribution of the rewards of the most dynamic economy in the world.
69
Chapter 5
OUTCOMES MATRIX
This chapter will use the outcomes matrix process suggested by Bardach (2009) to
assess the alternatives described in Chapter 3 with the decision criterion described in
Chapter 4. First, the alternative will be listed, with a brief restatement, followed by a
description of the probable outcomes and tradeoffs, concluding with an assessment of the
how well the outcomes satisfies the criterion.
The choice of alternatives outlined in Chapter 3 was informed by the research on
income inequality. It is tempting to propose and/or implement all the proposed
alternatives. This is not a realistic method. Determining which of the many good
alternatives is best is one of the most difficult tasks in policy analysis. The process of
deciding between good alternatives is hard because it requires making informed
projections about an uncertain future. The outcomes matrix can be used to help make
these complex judgments.
Outcomes Matrix Methodology
An outcomes matrix is a process that presents the probable outcomes of each
alternative and assesses them according to the decision criterion. Insights and the results
from the books, articles, research papers, and studies consulted for this thesis inform the
assessment. The outcomes matrix is a grid where the alternatives projected outcomes are
in rows and decision criterion are in columns. How well the alternatives outcome
satisfies the criteria is presented at the row/column intersection.
70
Criterion Weights
Properly assessing alternatives according to explicit decision criteria requires
weighting the criteria because some criteria may be more important in achieving the
desired outcome. This thesis assigns equal weights to each criterion because each
criterion is equally important in lessening the conditions and effects of income inequality.
Alternatives that fail to meet any of the four criteria would likely not be effective, or have
an acceptable probability of implementation. An alternative that has a good chance of
being politically acceptable but projects as insufficient or unsustainable will not be
useful. Extensive research of the literature concerning income inequality informed the
decision to give equal weight to each criterion. The literature contains no specific
guidance about which of these criteria are more important. Others may view the criterion
weights differently. That is an example of the art of analysis; people can come to
different conclusions about the same specifics.
Criterion Measurement Scale
This thesis uses a qualitative interval measurement for the assessment of the
alternatives projected outcome. The assessed projected outcome of each alternative is,
Satisfies Criteria - This measure indicates the projected outcome of the alternative
will meet the criteria to a substantial extent.
Moderately Satisfies Criteria - This measure indicates the projected outcome of
the alternative will meet the criteria, but to a modest extent.
Minimally Satisfies Criteria - This measure indicates the projected outcome of the
alternative will meet the criteria, but to a negligible extent.
71
Does Not Satisfy - This measure indicates the projected outcome of the alternative
completely fails to satisfy the criterion.
Changes in Economic Structure - Financial Regulation
Chapter 3 explained the two general approaches for alternatives to lessen the
condition and effects of income inequality. The initial part of the outcomes matrix will
assess the probable outcomes resulting from the alternatives that change the economic
structure. These alternatives are; financial regulation, reinstate some form of the Glass-
Steagall restrictions on depository institutions investment activity, break up “too big to
fail” banks, demand the Federal Reserve perform both conditions of its dual mandate, and
reform the mortgage deduction.
To paraphrase Chapter 3, financial reform is important to income inequality
because financial rules and regulations have helped shape the current system in a way
that overwhelmingly benefits the top income scale at the expense of the rest of the nation.
The proposed alternatives alter financial rules and regulations in a manner that creates a
more even playing field and restores some fairness to a financial system that unevenly
benefit the nation’s top bankers, investors and speculators. Previous changes in financial
rules and regulations overwhelmingly benefit the 1%, often at the detriment of the 99%
(Franks, 2007; Noah, 2012; Stiglitz, 2012). Reinstating Glass-Steagall and breaking up
“too big to fail” banks reintroduce safeguards and best practices that enhance the stability
and equity of the financial system. This affects income inequality because lower income
groups suffer most long term in financial crises like the meltdown of 2008. These
regulations also limit the opportunity for the Wall Street investor class to reap immense
72
gains by betting with other people’s money, and other at little or no risk to themselves.
This results in Wall Street risk taking as a game of “heads I win, tails you lose” (Dowd,
2009; Noah, 2012).
Alternative #1: Reinstate Glass-Steagall
The Glass-Steagall Act of 1933, or the Banking Act of 1933, mitigated practices
in the banking system that contributed to the 1929 bank collapse and lead to the Great
Depression. One of the most consequential elements of the Act was a prohibition on
banks that accepted deposits being involved in investment banking. This created a
firewall between financial institutions that invested, or gambled with people’s money and
those that held peoples savings. Congress repealed these protections in 1999.
Researchers concerned with income inequality have proposed these restrictions be
reinstated (Franks, 2007; Noah, 2012; Reich, 2011, 2012; Stiglitz, 2012; Wilkinson &
Pickett, 2010).
Probable Outcomes and Trade Offs
Reinstating Glass-Steagall will make the banking system safer and less volitile.
Currently banks have less reason to responsibly assess the risks of their investment
behavior when using depositor funds. This is because deposits are guaranteed by the
Federal Depost Insurance Corporation so depositor money lost by the banks through
investments is guaranteed to be paid back by the taxpayers. Therefore banks can gamble
depositor money without proper concern. This creates what economists call a moral
hazard, a situation where one party is responsible for the interests of another, but has an
incentive to put his or her own interests first (Dowd, 2009; Mintrom, 2012). Reinstating
73
the firewalls between banks that take depositor money, and recieve taxpayer guarantees
for that money, and investment banking removes the moral hazard and safeguards the
banking system from behavior that threatens it.
The most considerable probable effect of a reinstatement of Glass-Steagall
regualtions on income inequality is the way it will alter Wall Street incomes. Wall Street
investors have reaped enormous gains in the last 20 years. Making investors put their
own money at risk is equitable and reasonable but will likely result in less overall risk
taking. Forseeable trade offs of a reinstaement of Glass–Steagall regulations are that the
decrease in risk taking will result in some decrease in overall stock market performance
and less money for all investors, banks and hedge funds, but also pension funds and
indivdual IRA’s.
Sufficiency
It is reasonable to expect that reinstating some form of Glass–Steagall would
decrease the current level of income dispersion in the long term. Changing the rules to
remove taxpayer protection for depository banks from engaging in the same behavior as
investment banks would likely reduce the appetite, and rewards for those risks. However
this regulation would take time to implement, and banks have armies of highly trained
and intelligent experts who would try to circumvent regulation. Therefore this alternative
projects as - Minimally Satisfies Criteria.
Sustainability
It is difficult to judge the long term sustainability of financial regulations. Much
depends on the political will of regualtors to perform their duties in a conscientious
74
manner. However using history as a guide the original Glass-Steagall Act lasted for over
60 years (1933-1999) and was in effect during a period of growing income equality and
great gains in stock prices, GDP and corporate profits, so the projected outcome of this
alternatives sustainability is – Moderately Satisfies Criteria.
Least Disruptive to Market
On its face this alternative should grade poorly on this criterion because the
reason for this alternative is to disrupt the current market process. However it is my
position that repeal of the Glass-Steagal protections for depositors skewed the market
from being fair to being a rigged game where bankers could gamble with depositors
money without compunction. Rebuilding the firewalls between investment and deposit
banking institutions returns the market to a more truly capitalistic enterprise. For that
reason this alternative grades as – Minimally Satisfies Criteria.
Political Feasibility
This alternative grades poorly on this criterion because it is difficult for politicians
to regulate the financial sector. Glass-Steagall is not a new idea, it was in effect for over
60 years with good result. However, 155 Democrats and 207 Republicans voted to repeal
in 1999. Only 51 Democrats, 5 Republicans and 1 independent voted against repeal
(Sanati, 2009). Since then some regulation has been instituted but the votes have been
close and illustrate a lack of support for increased financial regulation. The Dodd-Frank
bill that created the Consumer Protection Agency was enacted in 2010. This bill was less
constrictive on Wall Street practices than Glass-Steagall but was bitterly contested and
passed on a mainly party line vote 237 /192 in the House of Representatives, and 60/39 in
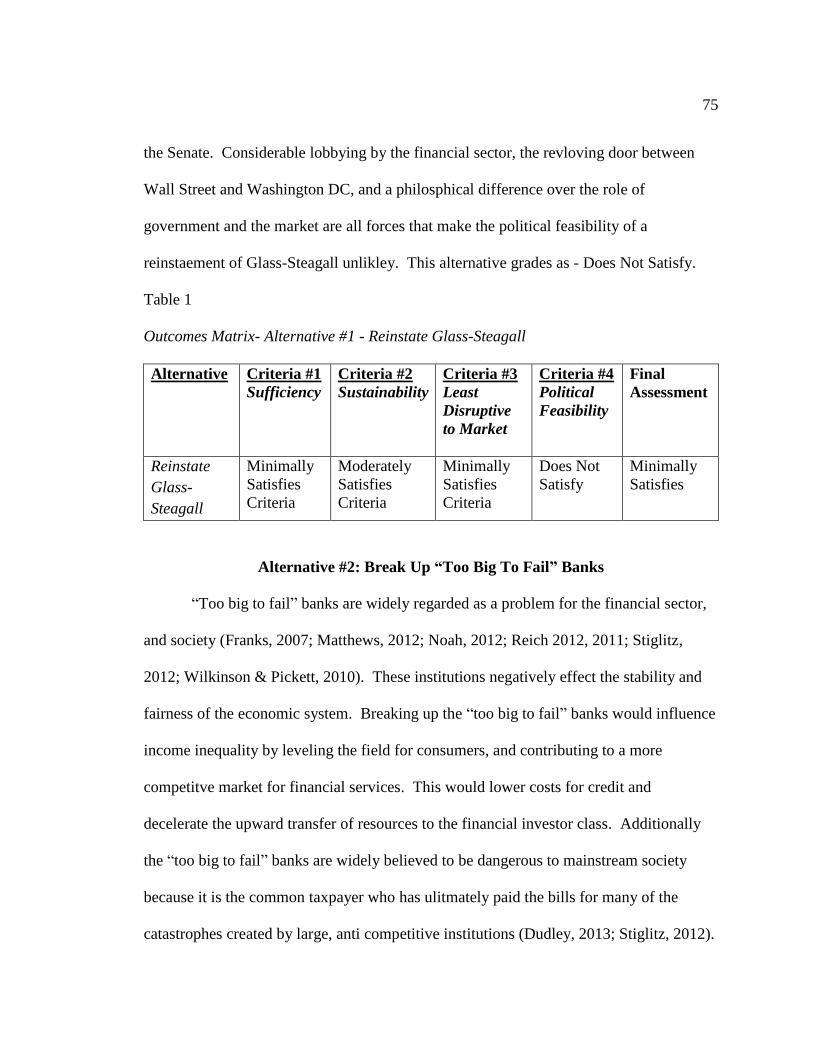
75
the Senate. Considerable lobbying by the financial sector, the revloving door between
Wall Street and Washington DC, and a philosphical difference over the role of
government and the market are all forces that make the political feasibility of a
reinstaement of Glass-Steagall unlikley. This alternative grades as - Does Not Satisfy.
Table 1
Outcomes Matrix- Alternative #1 - Reinstate Glass-Steagall
Alternative
Criteria #1
Sufficiency
Criteria #2
Sustainability
Criteria #3
Least
Disruptive
to Market
Criteria #4
Political
Feasibility
Final
Assessment
Reinstate
Glass-
Steagall
Minimally
Satisfies
Criteria
Moderately
Satisfies
Criteria
Minimally
Satisfies
Criteria
Does Not
Satisfy
Minimally
Satisfies
Alternative #2: Break Up “Too Big To Fail” Banks
“Too big to fail” banks are widely regarded as a problem for the financial sector,
and society (Franks, 2007; Matthews, 2012; Noah, 2012; Reich 2012, 2011; Stiglitz,
2012; Wilkinson & Pickett, 2010). These institutions negatively effect the stability and
fairness of the economic system. Breaking up the “too big to fail” banks would influence
income inequality by leveling the field for consumers, and contributing to a more
competitve market for financial services. This would lower costs for credit and
decelerate the upward transfer of resources to the financial investor class. Additionally
the “too big to fail” banks are widely believed to be dangerous to mainstream society
because it is the common taxpayer who has ulitmately paid the bills for many of the
catastrophes created by large, anti competitive institutions (Dudley, 2013; Stiglitz, 2012).
76
Probable Outcomes and Trade Offs
Trade offs invloved in the break up of “too big to fail” financial institutions are a
decrease in scale that allows these institutions to offer certain finanacial services and
products to global clients that smaller banks can not (Dudley, 2013). Big banks
ostensibly create economies of scale and increased efficiency that would be lost to
customers if they were dismantled (Harrison Jr, 2012). There is the chance that ending
“too big to fail” banks will only break current big problems up into smaller pieces and not
solve the issues of systemic fragility in the modern global financial system (Dudley,
2013). There would also be a direct financial cost to breaking up big banks, and ongoing
costs to regulate.
Sufficiency
Breaking “too big to fail” banks could reduce income inequality over the long
term by making credit more affordable and reducing some systemic danger to the
financial sector. Reducing systemic danger is important to income inequality because
research has shown that inequality worsens in the aftermath of financial crises (Franks,
2007; Stiglitz, 2012). However, it is difficult to project how long a breakup of the big
banks would take and how long it until the benefits are realized. For these reasons this
alternative grades as - Minimally Satisfies Criteria.
Sustainability
The sustainability of this alternative is dependent upon the political will of the
people who are responsible for instituting and monitoring the rules of the financial
industry. Bank regulation has been enacted previously so there is a precedent. However
77
current conditions make it less likely that a breakup of the “too big to fail” banks will
occur. It is instructive that the banks were not broken up after the financial crash of
2007-08. Since that was not sufficient to compel the break up of the banks it is difficult
to imagine a situation that is more persuasive. If the banks are not broken up there is no
chance for the sustainability of this alternative. For these reasons this alternative grades
as - Does Not Satisfy.
Least Disruptive to Market
Much of the research on income inequality presented in this thesis illustrates that
the current processes of the market are creating, or at least contributing to, growing
inequality. Therefore, similar to alternative #1, this alternative intends to disrupt the
market as it is currently constituted. However this disruption should result in a more
stable and competitive financial system. This alternative requires a disruption of the
market now to reduce the possibility of future, and more disasterous, disruption. For this
reason this alternative grades as - Minimally Satisfies Criteria.
Political Feasibility
The fact that the banks were not broken up in the aftermath of the malfeasance of
2007-08 illustrates the political will necessary to break up the banks is lacking.
Observers believe that the regulations that were enacted, namely the Dodd-Frank Act,
will not be sufficient to dramatically reduce the systemic risk to the financial system
posed by the “too big” banks (Edwards, 2013; Rivlin, 2013). The vociferous oppositon
to much less dramatic attempts at regulation, like the Consumer Protection Agency,
appear to illustrate the too big banks will not be broken up. Actually the trend is in the
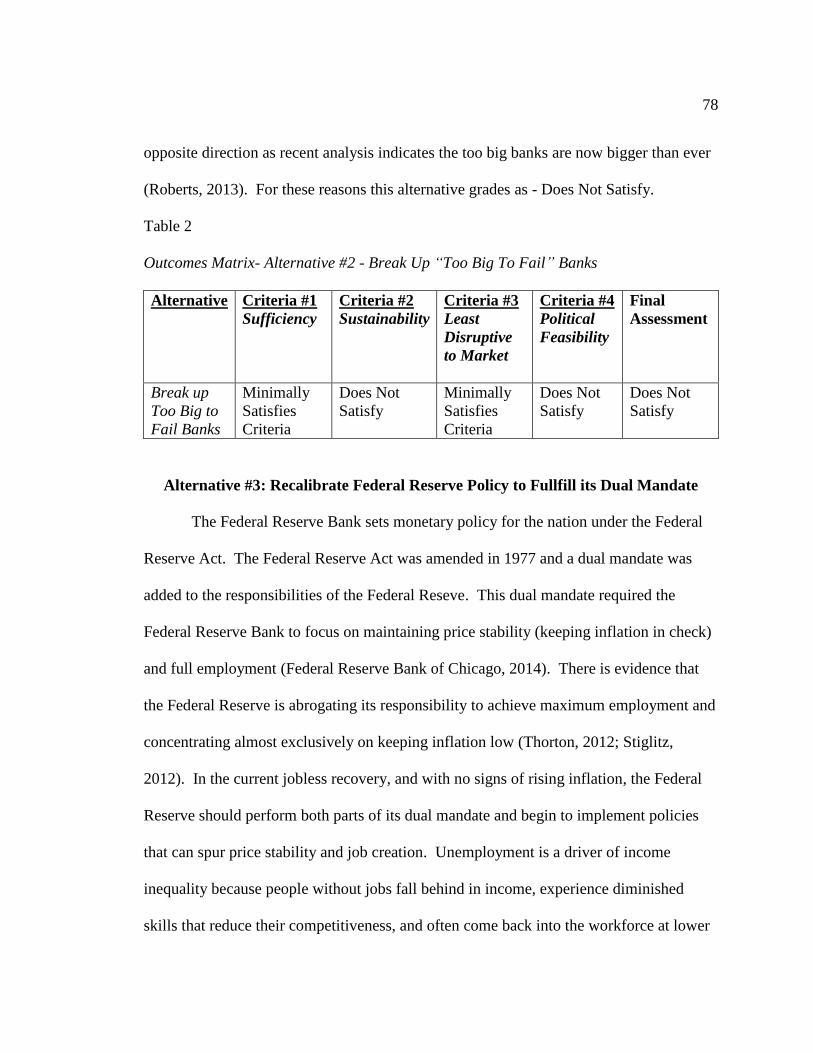
78
opposite direction as recent analysis indicates the too big banks are now bigger than ever
(Roberts, 2013). For these reasons this alternative grades as - Does Not Satisfy.
Table 2
Outcomes Matrix- Alternative #2 - Break Up “Too Big To Fail” Banks
Alternative
Criteria #1
Sufficiency
Criteria #2
Sustainability
Criteria #3
Least
Disruptive
to Market
Criteria #4
Political
Feasibility
Final
Assessment
Break up
Too Big to
Fail Banks
Minimally
Satisfies
Criteria
Does Not
Satisfy
Minimally
Satisfies
Criteria
Does Not
Satisfy
Does Not
Satisfy
Alternative #3: Recalibrate Federal Reserve Policy to Fullfill its Dual Mandate
The Federal Reserve Bank sets monetary policy for the nation under the Federal
Reserve Act. The Federal Reserve Act was amended in 1977 and a dual mandate was
added to the responsibilities of the Federal Reseve. This dual mandate required the
Federal Reserve Bank to focus on maintaining price stability (keeping inflation in check)
and full employment (Federal Reserve Bank of Chicago, 2014). There is evidence that
the Federal Reserve is abrogating its responsibility to achieve maximum employment and
concentrating almost exclusively on keeping inflation low (Thorton, 2012; Stiglitz,
2012). In the current jobless recovery, and with no signs of rising inflation, the Federal
Reserve should perform both parts of its dual mandate and begin to implement policies
that can spur price stability and job creation. Unemployment is a driver of income
inequality because people without jobs fall behind in income, experience diminished
skills that reduce their competitiveness, and often come back into the workforce at lower
79
wage levels. Using the power of the Federal Reserve Bank solely to keep inflation low
primarily benefits the financial sector and invstor class by providing predictability for
financial markets (LeBonte, 2013). Rising inflation helps debtors by lowering the real
value of future debts.
Probable Outcomes and Trade Offs
In very basic terms monetary policy can keep the money supply tight , keep
inflation low and stable and protect investors, or it can increase the money supply
resulting in greater liquidity in the market. That increased liquidity “heats things up” in
the economy and spurs job creation but can also result in rising inflation. That is the
theoretical trade off; policies that spur job creation can result in inflation and policies
that tighten money supply keep inflation and job creation low.
Currently inflation has been at relatively low levels, between 1.3 and 3.3% since
1991 (White, 2008). Some economists are actually more concerned about the possibility
of deflation (Makin, 2013). Meanwhile unemployment has been historically elevated,
especially since the Great Recession of 2007-2008 (Bureau of Labor Statistics, 2014).
No responsible person is calling for a policy that would create hyper inflation but Federal
Reserve monetary policy could be altered to try to produce job growth even if inflation
rose minimally. As mentioned earlier full employment is one of the foundational
missions of the Federal Reserve. While too much inflation is bad for an economy, how
much is too much is continually up for debate, elevated levels of unemployment also
inflict huge economic losses in productivity and efficiency. In 2012 Fed chairman
Bernanke agreed, and warned of the severe social consequences of long term growing
80
unemployment (Cooke, 2010). If the Federal Reserve will not do it, or as some argue,
can not do it, the dual mandate should be reviewed, until then they are mandated to try.
Sufficiency
The results of monetary policy are difficult to project. However, there are many
who believe Federal Reserve policy could, and should, fullfill the dual mandate
(Thorbecke, 2000; Rivlin, 2012; Spicer, 2013; Stiglitz, 2012). If Federal Reserve policy
could stimulate employment it should, however even proponents of the dual mandate ae
cautious about how much employemnt monetary policy can generate. Therefore this
alternative grades as - Minimally Satisfies Criteria.
Sustainability
Successful monetary policy is a constantly shifting battle against myriad
economic forces. While Federal Reserve policy has kept inflation low it has failed to
achieve full or even maximum employment since the dual mandate was created. Even if
the Federal Reserve concentrated more on promoting employment it is very difficult to
imagine that any consequential positive result could be sustainable over the long term.
This is primarily due to the complexity of the task and lack of control that monetary
policy has over employment. For these reasons this alternative grades as - Does Not
Satisfy.
Least Disruptive to Market
Changing monetary policy necessitates the tradeoffs of more inflation for more
employment or less employment for less inflation. Markets require stability and
certainty; rising inflation does not promote either. The chairperson of the Federal
81
Reserve has great power over the markets. World markets move on the most ambiguous
commentary of the Fed chair. Although unemployment at current levels is as probably as
damaging to an economy as a short-term rise in inflation world markets would react, and
probably negatively, to a change in Federal Reserve focus. For these reasons this
alternative grades as - Minimally Satisfies Criteria.
Political Feasibility
Because of the independence built in to the posts on the Board of the Federal
Reserve political feasibility is not an overriding concern for this alternative. The chair of
the Federal Reserve serves a relatively long term and enjoys considerable control over
Federal Reserve decisions and policy. The President appoints the seven members of the
Board of Governors for 14-year terms. From this group the President appoints Governor
as the chair for a term of 4 years (Federal Reserve Board, 2003). Many Fed chairs have
served numerous 4-year terms. Alan Greenspan served from 1987 until 2006. Federal
Reserve chairs have great independence and so if Fed chair Yellen wished to pursue the
dual mandate more aggressively she could. Therefore this alternative grades as - Satisfies
Criteria.
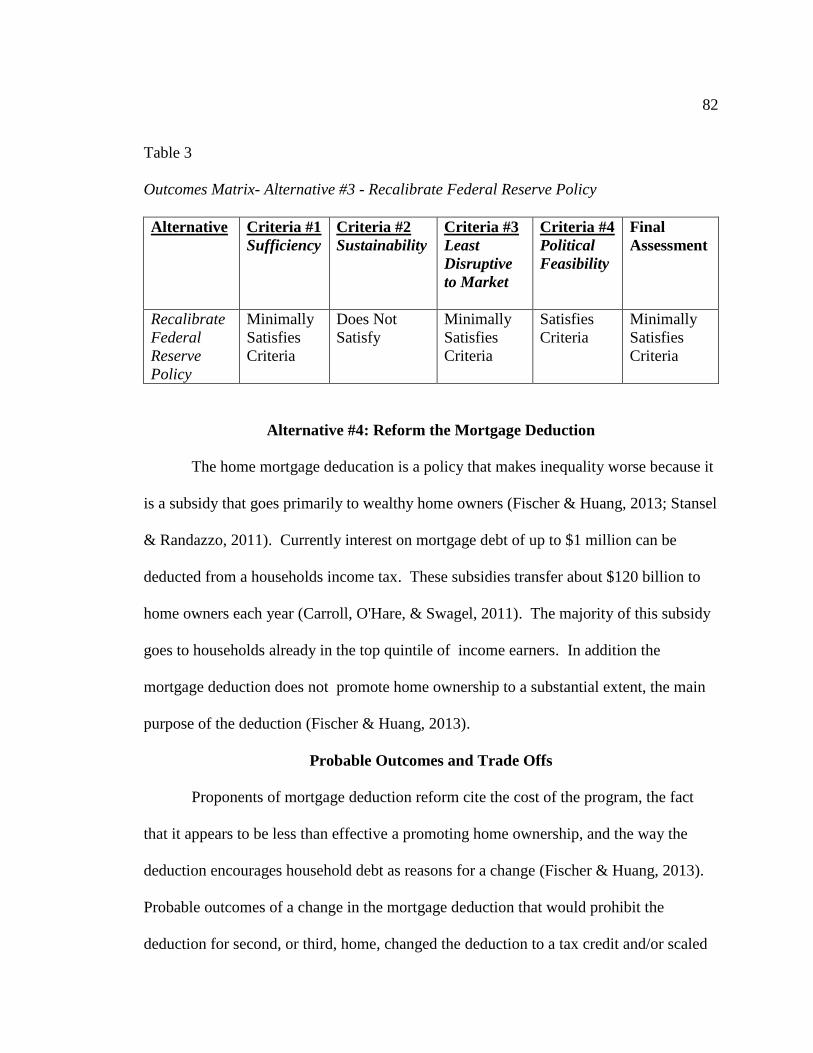
82
Table 3
Outcomes Matrix- Alternative #3 - Recalibrate Federal Reserve Policy
Alternative Criteria #1
Sufficiency
Criteria #2
Sustainability
Criteria #3
Least
Disruptive
to Market
Criteria #4
Political
Feasibility
Final
Assessment
Recalibrate
Federal
Reserve
Policy
Minimally
Satisfies
Criteria
Does Not
Satisfy
Minimally
Satisfies
Criteria
Satisfies
Criteria
Minimally
Satisfies
Criteria
Alternative #4: Reform the Mortgage Deduction
The home mortgage deducation is a policy that makes inequality worse because it
is a subsidy that goes primarily to wealthy home owners (Fischer & Huang, 2013; Stansel
& Randazzo, 2011). Currently interest on mortgage debt of up to $1 million can be
deducted from a households income tax. These subsidies transfer about $120 billion to
home owners each year (Carroll, O'Hare, & Swagel, 2011). The majority of this subsidy
goes to households already in the top quintile of income earners. In addition the
mortgage deduction does not promote home ownership to a substantial extent, the main
purpose of the deduction (Fischer & Huang, 2013).
Probable Outcomes and Trade Offs
Proponents of mortgage deduction reform cite the cost of the program, the fact
that it appears to be less than effective a promoting home ownership, and the way the
deduction encourages household debt as reasons for a change (Fischer & Huang, 2013).
Probable outcomes of a change in the mortgage deduction that would prohibit the
deduction for second, or third, home, changed the deduction to a tax credit and/or scaled
83
back the eligible debt limit to $500,000 would be more revenue for the government and a
projected minimal effect on home purchasing demand.
Opponents of a change cite the still recovering housing market that does not need
any barriers to recovery, no matter how slight. Additionally any change in the deduction
would primarily affect lower income homebuyers, and owners, as well as construction
workers that could be negatively influenced by a decrease in residential construction.
Sufficiency
A change in the mortgage deduction would eliminate a costly taxpayer subsudy
for wealthy home owners. This would have some effect on narrowing income dispersion.
However the positive effects could be offset by changes in residential construction and
the market for home sales. Therefore, this alternative rates as - Minimally Satisfies
Criteria.
Sustainability
The current mortgage deduction has been in effect since the advent of the income
tax in 1913. It derived from a basic deduction on any interest paid for any reason
(Ritholtz, 2010). This illustrates the sustainability of the deduction. Similarly, any
change in the deduction should enjoy the same staying power. There are no strong
opponents of the deduction, and many people like it. Therefore, this alternative rates as -
Satisfies Criteria.
Least Disruptive to Market
Proponents of a change in the mortgage deduction propose that the people who
benefit the most from it do not need it and would not change their economic behavior
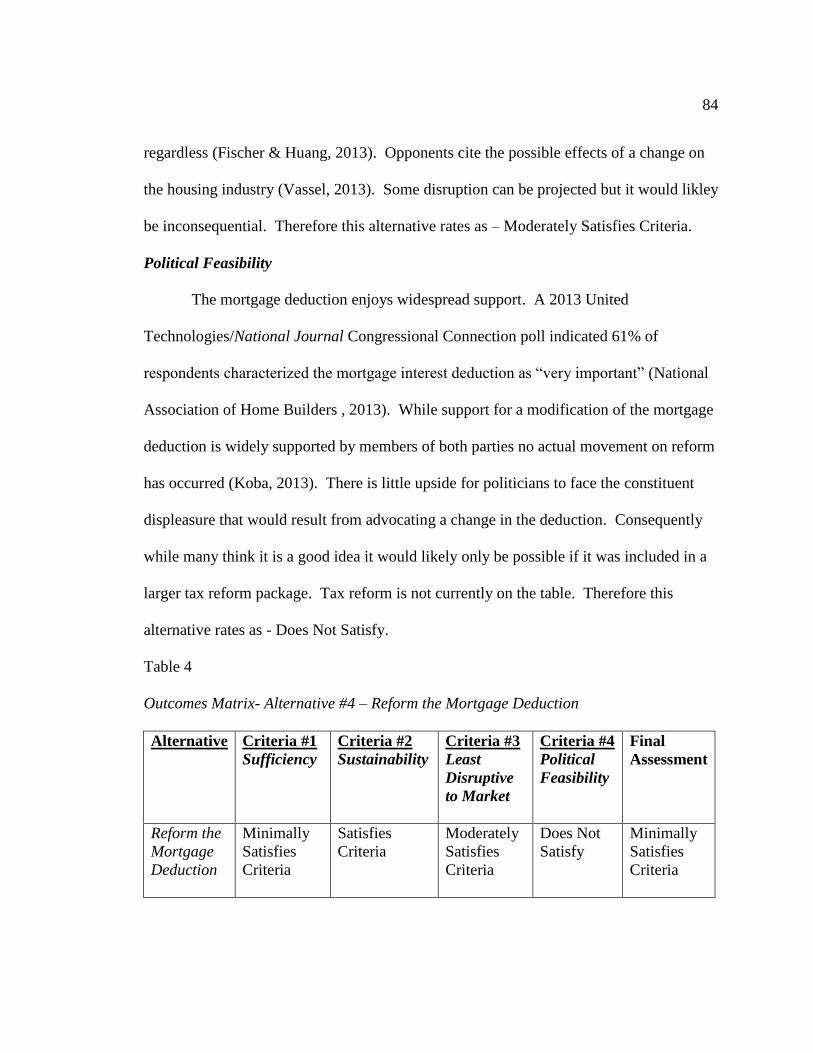
84
regardless (Fischer & Huang, 2013). Opponents cite the possible effects of a change on
the housing industry (Vassel, 2013). Some disruption can be projected but it would likley
be inconsequential. Therefore this alternative rates as – Moderately Satisfies Criteria.
Political Feasibility
The mortgage deduction enjoys widespread support. A 2013 United
Technologies/National Journal Congressional Connection poll indicated 61% of
respondents characterized the mortgage interest deduction as “very important” (National
Association of Home Builders , 2013). While support for a modification of the mortgage
deduction is widely supported by members of both parties no actual movement on reform
has occurred (Koba, 2013). There is little upside for politicians to face the constituent
displeasure that would result from advocating a change in the deduction. Consequently
while many think it is a good idea it would likely only be possible if it was included in a
larger tax reform package. Tax reform is not currently on the table. Therefore this
alternative rates as - Does Not Satisfy.
Table 4
Outcomes Matrix- Alternative #4 – Reform the Mortgage Deduction
Alternative Criteria #1
Sufficiency
Criteria #2
Sustainability
Criteria #3
Least
Disruptive
to Market
Criteria #4
Political
Feasibility
Final
Assessment
Reform the
Mortgage
Deduction
Minimally
Satisfies
Criteria
Satisfies
Criteria
Moderately
Satisfies
Criteria
Does Not
Satisfy
Minimally
Satisfies
Criteria
85
Alternatives that Change the Outcomes of Income Inequality
The first part of this chapter analyzed the alternatives that change the economic
structure to lessen the conditon of income inequality. The next part of this chapter will
assess how well the the alternatives that change the outcomes of income inequality satisfy
the decsion criteria. The alternatives that change the outcomes of income inequality are
important because it is very difficult to influence the economic structure of an economy
as large and complex as the United States in a manner that appreciably reduces income
inequality. Attempting to alter economic systems is an unceratin undertaking and often
leads to unintended negative consequences. These alternatives focus on outcomes
separate from the economic system that will mitigate some of the most egregious
consequences of income inequality. At the end of the day that is what matters most.
Concerns about income inequality are not about how rich someone is, or is not. The
problem with income inequality is that the great dispersion in incomes is beginning to
create a vast difference in the quality of, and the chances for, a great life.
This section will be organized in the same manner as the previous section. The
alternative will be breifly explained, then a analysis of outcomes and tradeoffs will be
followed by the projected outcomes being assessed according to how well they satisfy the
decision criteria. The alternatives examined in this section are universal health care, re-
unionize the U.S. labor force, and increased investments in infastructure.
Alternative #5: Universal Health Care
One of the most important cited effects of income inequality is the difference
between the health outcomes of people in countries with greater comparitive income
86
inequality (Wilkinson & Pickett, 2010). There is a considerable difference between the
life expectancy, infant mortality, and mental health of people at different ends of the U.S.
income scale (Wolfe, 2012). Research on income inequality that centered on health
outcomes appeared to indicate more unequal countries had worse overall health outcomes
(Wilkinson & Pickett, 2010). Lack of health insurance, and access to routine
preventative health care has deleterious effects on people and society. Uninsured people
are sicker, and cost more to treat when they finally do become sick enough to avail
themselves of medical care (Kaiser Family Foundation, 2013). Universal health care is
proposed as a way to mitigate some of these conditions (Hacker & Lowentheil, 2012;
Stiglitz, 2012; Wilkinson & Pickett, 2010).
Probable Outcomes and Trade Offs
Outcomes of current (Canadian) universal health coverage include decreased
costs and increased overall access to healthcare (McBane, 2009; Nanos, 2009). These
positive effects are muted by a comparitively longer wait for doctor visits, elective
surgeries and less access to high tech medical devices, such as MRI’s. Providing
universal health care is expensive and traditionally the costs are assigned to those with
the most ability to pay. Universal health care is directly redistributive. Supporting
research found that a $1 expenditure on universal health care transmitted about $0.50 to
the bottom 40% of earners (Glied, 2008).
Sufficiency
The projected effects on income inequality could be dramatic. Differences in
access to healthcare is a substantial effect of difference in income. Leveling this
87
difference begins to equalize those dissimilarities. Better health across income deciles
could level the field between those at the upper and lower levels of the income
distribution. Therefore this alternative rates as – Moderately Satisfies Criteria.
Sustainability
The sustainability of universal health care can be assessed by examining support
in countries where universal health care has been implemented. Polling indicates
overwhemling popular support for public healthcare in Canada with over 85% of
respondents providing postitive impressions of their system (McBane, 2009; Nanos,
2009). When universal health care has been instituted public support makes repeal
almost impossible. Therefore this alternative rates as – Satisfies Criteria.
Least Disruptive to Market
Universal health care is promoted as delivering better access to healthcare to all
members of a society. A healthier society brings a competitive edge compared to less
healthy socities. However the disruption to the current U.S. for profit health care system
would be immense. This is illustrated by the difficulty in the implementation of the
Affordable Care Act. Whole industries are based on charging profit maximizing rates for
the care sick people require to live healthy lives. Universal health care would greatly
disrupt that system. Therefore this alternative rates as - Does Not Satisfy.
Political Feasibility
The political feasibility of universal health care in the U.S. can be imagined by
examining the political upheaval surrounding the implementation of the Affordable Care
Act (ACA). Notwithstanding the fact that a very similar plan was promoted by
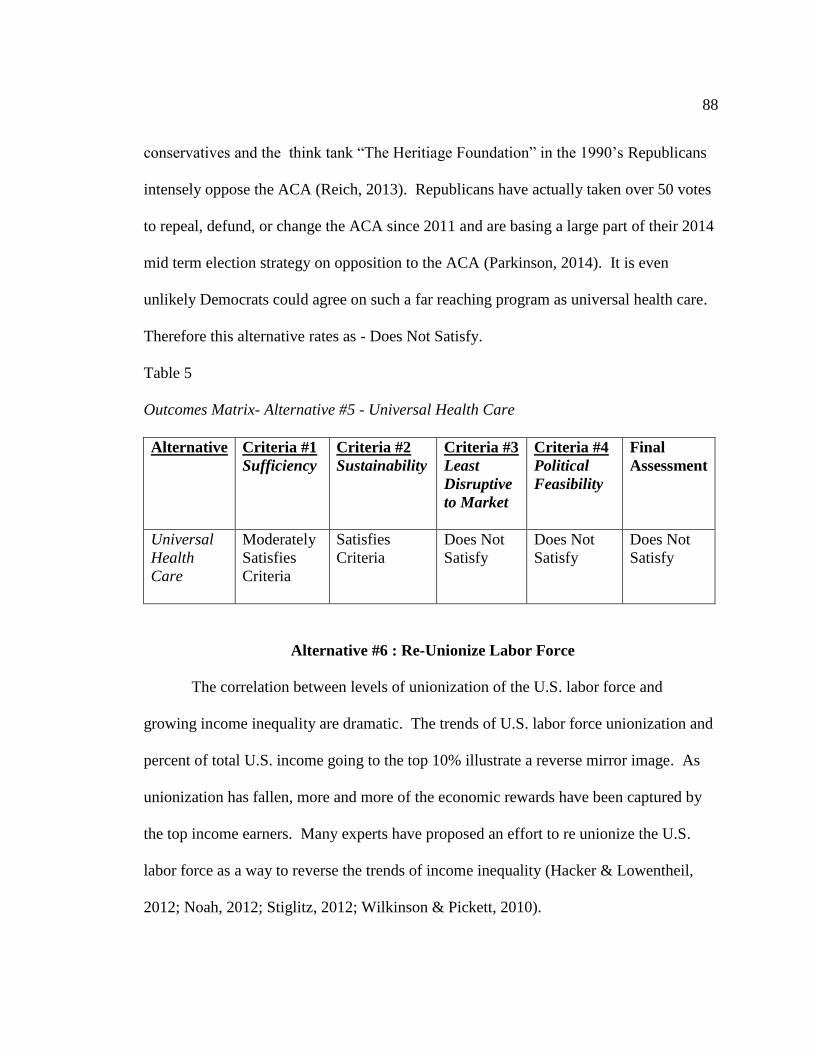
88
conservatives and the think tank “The Heritiage Foundation” in the 1990’s Republicans
intensely oppose the ACA (Reich, 2013). Republicans have actually taken over 50 votes
to repeal, defund, or change the ACA since 2011 and are basing a large part of their 2014
mid term election strategy on opposition to the ACA (Parkinson, 2014). It is even
unlikely Democrats could agree on such a far reaching program as universal health care.
Therefore this alternative rates as - Does Not Satisfy.
Table 5
Outcomes Matrix- Alternative #5 - Universal Health Care
Alternative Criteria #1
Sufficiency
Criteria #2
Sustainability
Criteria #3
Least
Disruptive
to Market
Criteria #4
Political
Feasibility
Final
Assessment
Universal
Health
Care
Moderately
Satisfies
Criteria
Satisfies
Criteria
Does Not
Satisfy
Does Not
Satisfy
Does Not
Satisfy
Alternative #6 : Re-Unionize Labor Force
The correlation between levels of unionization of the U.S. labor force and
growing income inequality are dramatic. The trends of U.S. labor force unionization and
percent of total U.S. income going to the top 10% illustrate a reverse mirror image. As
unionization has fallen, more and more of the economic rewards have been captured by
the top income earners. Many experts have proposed an effort to re unionize the U.S.
labor force as a way to reverse the trends of income inequality (Hacker & Lowentheil,
2012; Noah, 2012; Stiglitz, 2012; Wilkinson & Pickett, 2010).
89
Probable Outcomes and Trade Offs
Unions enjoy a wage premium and tend to raise wages throughout an economy
(Gordon, 2012; Hacker & Lowentheil, 2012). An increase in the number of union
workers would likely raise wages for some workers. However many of the industries that
were heavily unionized, automobile manufacturing for example, face global competition.
In those industries union wages result in decreased levels of employment as
manufacturers move to regions with more competitive wages. At a very basic level an
increase in unionization often leads to less overall jobs. Global competition is not the
only factor in the decrease in unionization. Unions also face restrictive legislation such
as the Taft-Hartley Act of 1947 (Noah, 2012). Ths law made it much more difficult for
unions to organize and is seen as a major limiting factor in the ability of unions to
survive.
Sufficiency
History illustrates that the U.S. enjoyed its greatest level of income equality
during the apex of union participation. This is an indication that increased levels of
unionization are sufficient to alter income distribution. A 2009 study contends that a
10% increase in unionization would result in an increase of about $1,500 per year to an
average middle class family (Madland, Walker, & Bunker, 2009). Because the level of
unionization is currently low, estimates place current labor force unionization at
approximately 10%, it would take a 1% increase in the unionization of the total U.S.
labor force to effect the 10% increase that leads to the $1,500 increase. A 1% increase in
unionization would require over 1.5 million workers join unions (Bureau of Labor
90
Statistics, 2014). Therefore it would take a major change in the historical trajectory of
unionization to make a substantial difference in income inequality. However if this
trajectory was changed an increase in unionization would have a equalizing effect.
Therefore this alternative rates as – Moderately Satisfies Criteria.
Sustainability
Unions have been under almost constant pressure since workers coalesced to
advocate for more rights and better wages. The political and economic power of
corporate interests have always attempted to eliminate, or at least limit, the power and
influence of organized labor. It appears that a growing number of Americans have begun
to believe that unions are unecessary and/or harmful. Recent polling indicates that 51%
of Americans have favorable attitudes toward labor unions (almost an all time low), and
42% (an all time high) had a unfavorable attitude (DeSilver, 2014). These trends, added
to the growing power of corporations and anti union lobbying groups make the
sustainability of a projected increase in unionization difficult to imagine. Therefore this
alternative rates as - Minimally Satisfies Criteria.
Least Disruptive to Market
Economic critiques of organized labor view unions as monopolistic institutions
that manipulate the supply of labor causing an artificial shortage. This causes the cost of
labor to rise above the equilibrium rate. When finite resources for labor are expended in
an anti competitve manner it leaves less for remaining labor needs, resulting in less
workers being hired than would be in an truly competitive market (Reynolds, 2008).
Economic critiques that support unionization propose that economies with developed
91
labor relations perform better in the long term, have less labor force disruption, and more
social cohesion, resulting in greater productivity (The World Bank , 2003). On balance
markets can be profitable in a unionized labor atmosphere, just not as profitable as they
would be in an economic condition of no labor organization. The ability of capital to
move rapidly across the globe to take advantage of marginally more competitive labor
markets makes this alternative troublesome. Therefore this alternative rates as -
Minimally Satisfies Criteria.
Political Feasibility
The current climate of anti union legislation in state legislatures such as
Wisconsin, Ohio, and Indiana illustrate the political headwinds this alternative faces.
Conservatives believe they have followed the example set by President Reagan in his
dealings with striking air traffic controllers. However, Reagan only denied the air traffic
controllers the right to strike, not to exist (McCartin, 2011 ). A wide range of state
legislation such as “right to work” is attempting to drastically reduce the power of both
private and public sector unions. Democratic support for unions has generally not been
able to counter conservative anti-union legislation. A re-unionization could happen in the
U.S. but it would have to happen with the political parties balancing each other.
Therefore this alternative rates as - Minimally Satisfies Criteria.
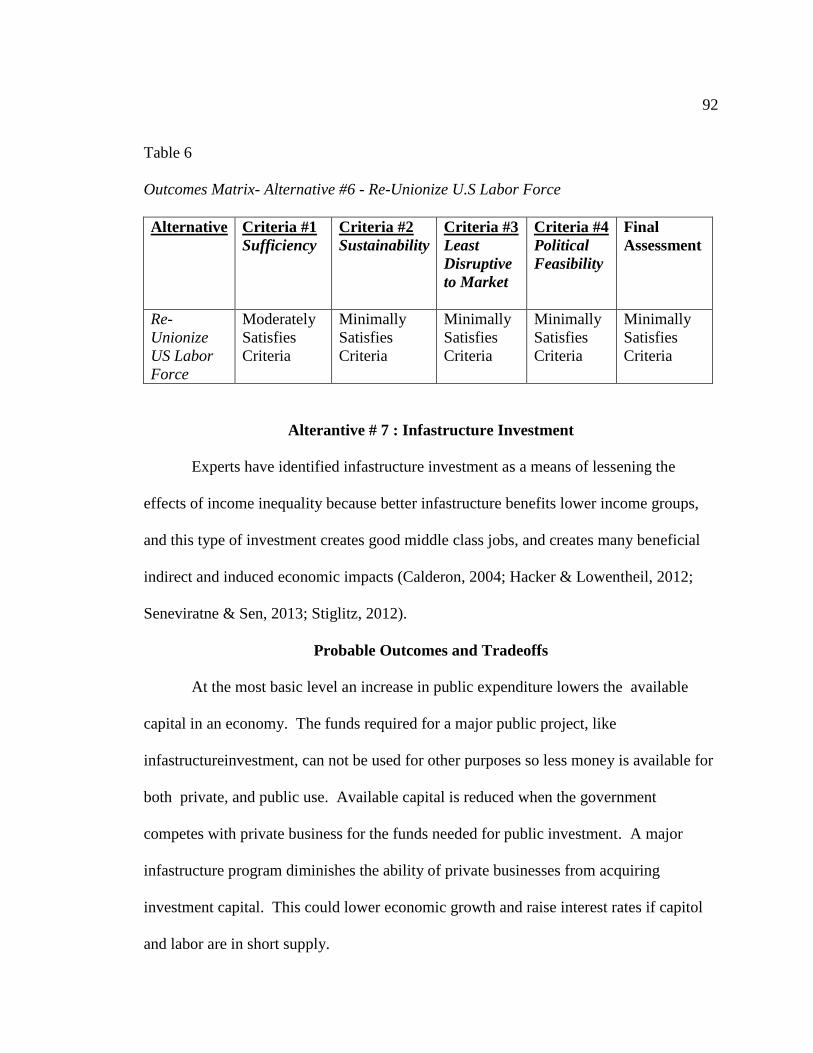
92
Table 6
Outcomes Matrix- Alternative #6 - Re-Unionize U.S Labor Force
Alternative Criteria #1
Sufficiency
Criteria #2
Sustainability
Criteria #3
Least
Disruptive
to Market
Criteria #4
Political
Feasibility
Final
Assessment
Re-
Unionize
US Labor
Force
Moderately
Satisfies
Criteria
Minimally
Satisfies
Criteria
Minimally
Satisfies
Criteria
Minimally
Satisfies
Criteria
Minimally
Satisfies
Criteria
Alterantive # 7 : Infastructure Investment
Experts have identified infastructure investment as a means of lessening the
effects of income inequality because better infastructure benefits lower income groups,
and this type of investment creates good middle class jobs, and creates many beneficial
indirect and induced economic impacts (Calderon, 2004; Hacker & Lowentheil, 2012;
Seneviratne & Sen, 2013; Stiglitz, 2012).
Probable Outcomes and Tradeoffs
At the most basic level an increase in public expenditure lowers the available
capital in an economy. The funds required for a major public project, like
infastructureinvestment, can not be used for other purposes so less money is available for
both private, and public use. Available capital is reduced when the government
competes with private business for the funds needed for public investment. A major
infastructure program diminishes the ability of private businesses from acquiring
investment capital. This could lower economic growth and raise interest rates if capitol
and labor are in short supply.
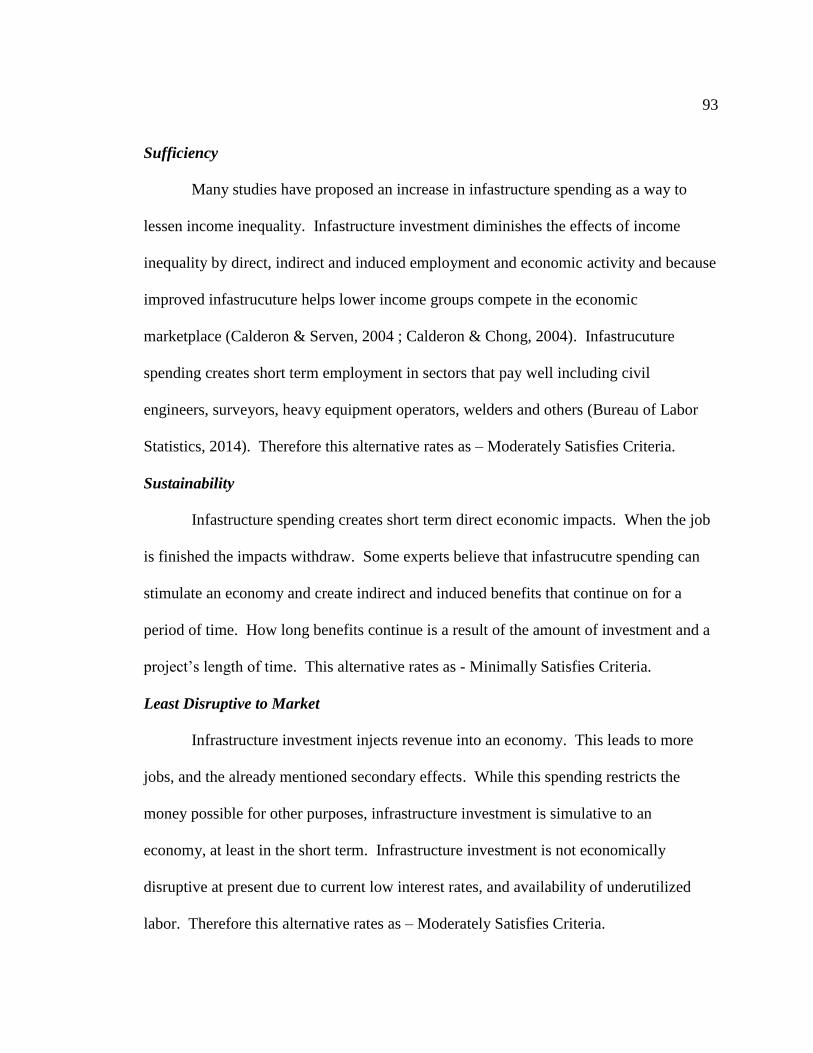
93
Sufficiency
Many studies have proposed an increase in infastructure spending as a way to
lessen income inequality. Infastructure investment diminishes the effects of income
inequality by direct, indirect and induced employment and economic activity and because
improved infastrucuture helps lower income groups compete in the economic
marketplace (Calderon & Serven, 2004 ; Calderon & Chong, 2004). Infastrucuture
spending creates short term employment in sectors that pay well including civil
engineers, surveyors, heavy equipment operators, welders and others (Bureau of Labor
Statistics, 2014). Therefore this alternative rates as – Moderately Satisfies Criteria.
Sustainability
Infastructure spending creates short term direct economic impacts. When the job
is finished the impacts withdraw. Some experts believe that infastrucutre spending can
stimulate an economy and create indirect and induced benefits that continue on for a
period of time. How long benefits continue is a result of the amount of investment and a
project’s length of time. This alternative rates as - Minimally Satisfies Criteria.
Least Disruptive to Market
Infrastructure investment injects revenue into an economy. This leads to more
jobs, and the already mentioned secondary effects. While this spending restricts the
money possible for other purposes, infrastructure investment is simulative to an
economy, at least in the short term. Infrastructure investment is not economically
disruptive at present due to current low interest rates, and availability of underutilized
labor. Therefore this alternative rates as – Moderately Satisfies Criteria.
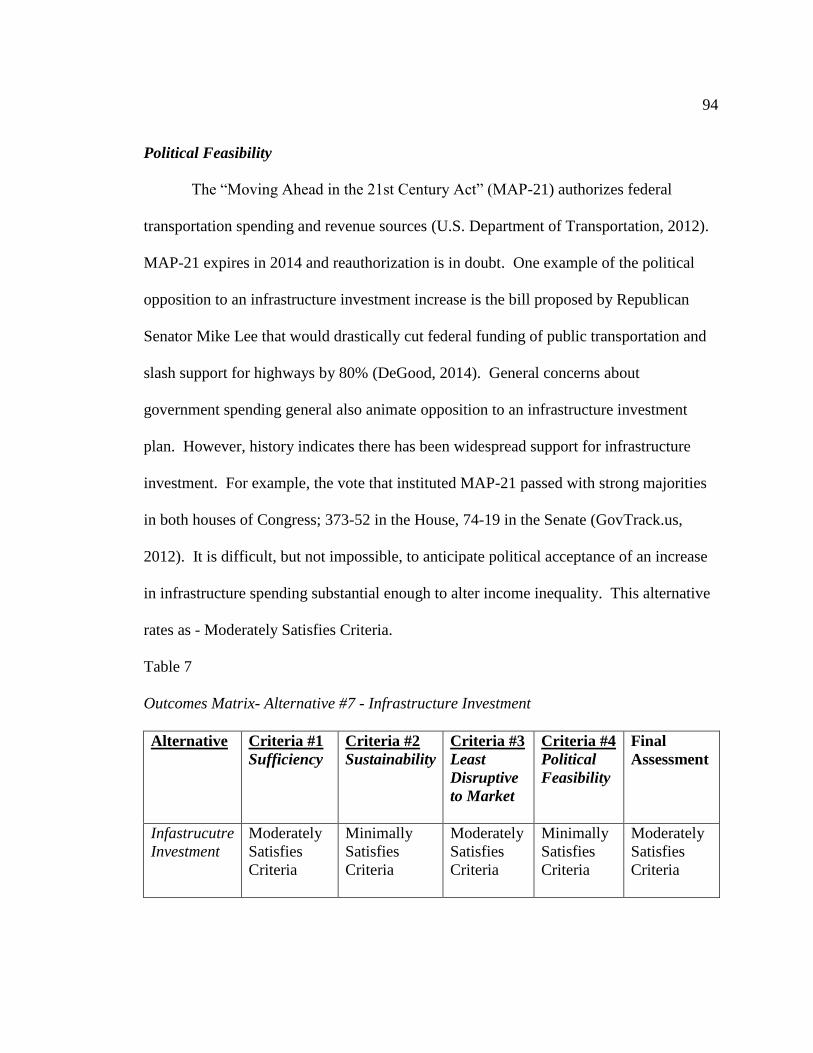
94
Political Feasibility
The “Moving Ahead in the 21st Century Act” (MAP-21) authorizes federal
transportation spending and revenue sources (U.S. Department of Transportation, 2012).
MAP-21 expires in 2014 and reauthorization is in doubt. One example of the political
opposition to an infrastructure investment increase is the bill proposed by Republican
Senator Mike Lee that would drastically cut federal funding of public transportation and
slash support for highways by 80% (DeGood, 2014). General concerns about
government spending general also animate opposition to an infrastructure investment
plan. However, history indicates there has been widespread support for infrastructure
investment. For example, the vote that instituted MAP-21 passed with strong majorities
in both houses of Congress; 373-52 in the House, 74-19 in the Senate (GovTrack.us,
2012). It is difficult, but not impossible, to anticipate political acceptance of an increase
in infrastructure spending substantial enough to alter income inequality. This alternative
rates as - Moderately Satisfies Criteria.
Table 7
Outcomes Matrix- Alternative #7 - Infrastructure Investment
Alternative Criteria #1
Sufficiency
Criteria #2
Sustainability
Criteria #3
Least
Disruptive
to Market
Criteria #4
Political
Feasibility
Final
Assessment
Infastrucutre
Investment
Moderately
Satisfies
Criteria
Minimally
Satisfies
Criteria
Moderately
Satisfies
Criteria
Minimally
Satisfies
Criteria
Moderately
Satisfies
Criteria
95
Chapter Conclusion
This chapter assessed the alternatives from Chapter 3 with the criteria from
Chapter 4 using an outcomes matrix suggested by Bardach (2009). The results are
complied in Table 8 (below). For the most part the alternatives fail to satisfy the criteria
by themselves. This is not a complete surprise. The literature on income inequality does
not envision a one approach solution. Income inequality is complex, and as earlier
chapters illustrated, there is disagreement about causes, and solutions This chapter
illustrated some of these complexitites. Most of the concerned experts on income
inequality accept tht a multi pronged approach is the only way to reverse the economic
trends of the last 35 years.
No alternative fully satisfied all of the criteria, some failed to satisfy many of the
criteria. This was due primarily to the lack of alternatives judged to be politically
acceptable. However, elections have consequences and this condition could change if
voters make income inequality a priority. Nevertheless, one of the alternatives, investing
in infastrucuture, did satisfy all the criteria successfully. Because this alternative most
successfully satsfied the stringent criteria it will be used as the cornerstone for the thesis
recommendation presented in the next chapter.
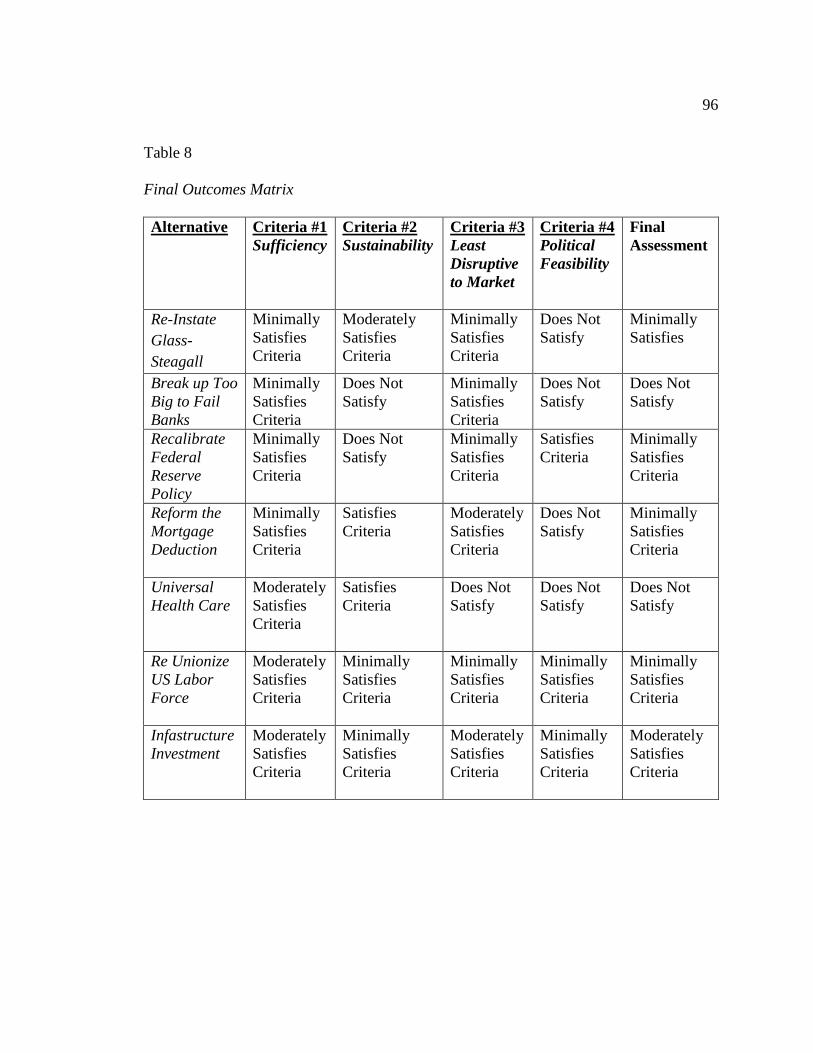
96
Table 8
Final Outcomes Matrix
Alternative
Criteria #1
Sufficiency
Criteria #2
Sustainability
Criteria #3
Least
Disruptive
to Market
Criteria #4
Political
Feasibility
Final
Assessment
Re-Instate
Glass-
Steagall
Minimally
Satisfies
Criteria
Moderately
Satisfies
Criteria
Minimally
Satisfies
Criteria
Does Not
Satisfy
Minimally
Satisfies
Break up Too
Big to Fail
Banks
Minimally
Satisfies
Criteria
Does Not
Satisfy
Minimally
Satisfies
Criteria
Does Not
Satisfy
Does Not
Satisfy
Recalibrate
Federal
Reserve
Policy
Minimally
Satisfies
Criteria
Does Not
Satisfy
Minimally
Satisfies
Criteria
Satisfies
Criteria
Minimally
Satisfies
Criteria
Reform the
Mortgage
Deduction
Minimally
Satisfies
Criteria
Satisfies
Criteria
Moderately
Satisfies
Criteria
Does Not
Satisfy
Minimally
Satisfies
Criteria
Universal
Health Care
Moderately
Satisfies
Criteria
Satisfies
Criteria
Does Not
Satisfy
Does Not
Satisfy
Does Not
Satisfy
Re Unionize
US Labor
Force
Moderately
Satisfies
Criteria
Minimally
Satisfies
Criteria
Minimally
Satisfies
Criteria
Minimally
Satisfies
Criteria
Minimally
Satisfies
Criteria
Infastructure
Investment
Moderately
Satisfies
Criteria
Minimally
Satisfies
Criteria
Moderately
Satisfies
Criteria
Minimally
Satisfies
Criteria
Moderately
Satisfies
Criteria
97
Chapter 6
RECOMMENDATIONS
The first chapter of this thesis defined the problem, in this case, current U.S.
income inequality is too great, and presented evidence of the existence and magnitude of
the problem. Chapter 2 presented a literature review of the foundational concepts that
inform ideas about what, if anything can or should be done to lessen the condition and
effects of income inequality. Chapter 3 presented a literature review of the most widely
accepted alternatives to improve the condition and lessen the effects of income
inequality. Chapter 4 listed and explained the criteria used to decide which of the
alternative recommendations is implemented. Chapter 5 used the outcomes matrix
process suggested by Bardach (2009) to assess the alternatives described in Chapter 3
with the decision criterion described in Chapter 4. The Chapter 6 of this thesis continues
the general process of Criteria Alternative Matrix (CAM) analysis suggested by Munger
(2000) and Bardach (2009).
Chapter 7 offers a specific recommendation to lessen the condition and effects of
income inequality and explain how the recommended alternatives satisfy the decision
criteria. This is accomplished by projecting the probable outcomes of implementation of
the recommendations. Bardach (2009) suggests this outcome projection phase of analysis
requires facing the practical realities of a policy. This phase is more art than science, and
requires the analyst to acknowledge and be watchful for undue optimism in proposing a
policy option. Projecting outcomes of policy recommendations is an attempt at
discerning the future, and is subsequently uncertain, problematic and susceptible to
98
strong disagreement. There is no way to prove with complete certainty that the policy
recommendations will achieve what you hope they will. That is why any policy should
be thought out as completely as possible and offered with humility. Following Bardach’s
(2009) process helps protect analysis from some errors but there are no guarantees. I
present the recommendations of this thesis in this spirit.
The remaining sections of this final chapter are organized in the following way;
first, a description of the recalibration of the estate tax, which is the revenue-generating
portion of the recommended plan, will be offered. That will be followed by a description
of the infrastructure investment component, which is the spending portion of the
proposal. The chapter will conclude with an assessment of the recommendations
suitability in regards to the decision criteria.
Recommendations
How They Were Developed
The proposed recommendations were developed and decided upon after a
comprehensive review of the research on the probable causes and effects of the current
income distribution, followed by a review of the most widely proposed corrective
proposals and strategies. Assessment of this information was completed in the outcomes
matrix form Chapter 5. Policy proposals were examined and judged for suitability in
relation to the criteria explained in the previous chapter (sufficiency, sustainability, least
disruptive to market processes, and political feasibility). This is the best way to devise a
plan that will narrow the growing difference in U.S. incomes. This chapter will present
99
the recommendation, explain it, and then provide my judgment about the respective
suitability.
Recommendation: Recalibrate Estate Tax Rates to 2000 Levels
Raise $1Trillion in Revenue in 10 Years
Those who inherit or receive income through inheritance pay estate taxes. In the
United States, these estate tax rates have been falling rapidly in the last 25 years (Caron
& Repetti, 2013; Huang & Frentz, 2013). This has had an effect on the enormous growth
of incomes at the very top of the income distribution (Stiglitz, 2012). Based upon the
research offered earlier in this thesis, I recommend a return to the estate tax rates in effect
in the year 2000. This requires the exemption, or the amount where no tax is due, be
returned to $1.75 million, from $5.25 million today, and tax rates would revert to a scale
with a top rate of 55%. Research indicates this could generate an additional $1 trillion in
the next 10 years (Huang & Frentz, 2013; Reich, 2011). Analysis of a similar estate tax
proposal from 2006 that called for a $2 million exemption and a top rate of 46% revealed
that about one in two hundred estates would be subject to any tax at all under that
program (Aron-Dine & Friedman, 2006). The recommended plan with a $1.75 million
exemption ($3.5 million per couple) and 55% top rate would capture slightly more estates
and revenue than those 2006 report levels but will still result in a small number of
inheritances owing any tax at all. The Tax Policy Center estimated that an estate tax with
a $1 million exemption would result in 115,000 estates filing and 52,000 owing some tax
in 2013 (Rohaly & Lim, 2011). Approximately 2.5 million Americans expire each year,
100
therefore, about 2% of those deaths bequeath inheritances large enough to be subject to
the estate tax (Petz, 2013).
This change is fair. Transfer taxation is equitable because the recipients have no
merit-based claim on the revenue. Inheritance is a windfall; no one can claim a right to it
because they had no active role in its acquisition. The act of receiving an inheritance or
major gift is good fortune. No one can choose his or her parents, or grandparents,
therefore inheritance is a matter of pure coincidence. This program does not take
anyone’s inheritance. The exemption guarantees that $1.75 million dollars can be
transferred with no tax paid. For those that are fortunate enough to receive an
inheritance of over $1.75 million, the rates are progressive, which means that the tax rate
is dependent upon the inheritance amount. The more someone receives, over the $1.75
million exemption, the higher percentage is assessed, up to the maximum rate of 55%. In
other words, a person receiving a $50 million dollar inheritance would pay no tax on the
first $1.75 million and then be subject to a gradually increasing rate up to the 55%
threshold. Even at the top rate that inheritance would be at least $23.5 million ($1.75
exemption, and 45% of the remaining $48.25 million). A $50 million estate may appear
fantastic however analysis of estate tax tables reveal that there are about 900 estates
worth an about $65 million on average in each year from 2002-2013 (Internal Revenue
Service, 2013).
This tax is in the middle range of historical estate tax rates. Transfer tax rates
have been much higher at other times. Since the advent of a permanent estate tax
exemptions have fluctuated from $50,000 (unadjusted) to the current high of $5.25
101
million and top rates have varied from above 80% to a current 35% (Caron & Repetti,
2013; Slemrod & Gale, 2001; Tabarrok, 2000).
This thesis recommends the recalibration of estate tax rates to raise the revenue
needed for the plan because it is fair, because current rates are at historically low levels,
because the estate tax generates the most revenue with the least disruption of the three
main governmental revenue sources and the tax has a relatively stable revenue stream.
As described earlier, this revenue will be dedicated to a long-term U.S. infrastructure
investment program. The next section describes this infrastructure investment and
projects the anticipated direct, indirect, induced and employment results.
Recommendation: Invest $1 Trillion Estate Tax Revenue
Rebuild U.S. Infrastructure
The next step in the recommended plan is to invest the $1 trillion generated by the
estate tax increase to rebuild U.S. infrastructure. This part of the plan both reduces
income inequality and provides direct benefits to the people who will pay for it.
Traditional redistributive tax schemes are criticized for providing little direct benefit to
those who pay the tax. Revenue generated for redistributive programs is commonly
passed on as cash or in kind benefits to those less fortunate. While these benefit
programs do achieve indirect and communitarian benefits to the more affluent taxpayers
they are seen by some as confiscatory because the revenue they provide is used primarily
for others. The plan proposed in this thesis assuages that concern because the revenue
generated will go to infrastructure investment, not to direct benefits to those in need.
The amount of revenue dedicated to this project will also allow for a robust
102
training and apprenticeship program. Part of the final plan must include dedicated
funding to create opportunities for unemployed and lower income individuals to receive
training and experience in the relevant occupations. The respective state welfare to work
and unemployment departments can recruit and identify qualified applicants. A
minimum level of minority participation must be included in this project in order for the
maximum community benefits to be realized. Where possible American- made and
produced materials should be used to complete this project. This will enhance the
indirect and induced economic effects of this project.
The U.S. Needs Investment in Infrastructure
U.S. infrastructure (roads, bridges, airports, ports, rail systems and energy grid) is
deteriorating to a critical condition. In a widely circulated 2013 report, the American
Society of Civil Engineers (ASCE) examined the current state of U.S. infrastructure and
concluded that the shortfall between needed and expected funding for infrastructure
would be approximately $1.1 trillion over the next 10 years. This is almost exactly the
amount projected raised by the recommended estate tax recalibration.
Some who say more spending is needed, and those who call for less spending
have challenged the $1.1 trillion shortfall amount proposed by the ASCE. A 2011 report
from the New America Foundation calls for a $1.2 trillion infrastructure investment over
five years (Albert, Hockett, & Roubini, 2011). Conversely, critics of increased
infrastructure spending appear to be both focused on a dislike of government spending in
general, added to annoyance over some famously over-budget infrastructure projects like
the “bridge to nowhere.” (Lowry, 2008; Smith, 2011). Although critics of an increase in
103
infrastructure spending correctly cite troubling examples of wasteful spending and cost
overruns on some projects, like Boston’s “Big Dig,” a massive 15-year infrastructure
project that is estimated to have run more than $1 billion over budget, few appear to think
that U.S. infrastructure is in good condition ( Boston Globe, 2014).
Stringent oversight must accompany this project to assure the resources allocated
for this are spent in the most efficient manner possible. Best practices in project
management must be employed for each individual project, and must be consistently
monitored at each geographical level, local, state, regional and national. A panel of
experts from the government and private sector should be convened to vet each project
for need, efficacy and cost-benefit. Complete transparency must accompany this project
and the public must be able to access budgets, timelines and actual progress reports of
every project that is undertaken. Every construction project, regardless of size, and
complexity is subject to some setbacks and occasional unforeseen contingencies but this
project must endeavor to meet the highest possible standards for openness, integrity and
responsibility.
Most every concerned party recognizes something must be done to rebuild U.S.
infrastructure and in this case, I think it is prudent to accept the assessment of the ASCE
even with their natural bias toward increased infrastructure investment. Therefore, this
thesis accepts the ASCE infrastructure cost estimates of need for investment of
approximately $1.12 trillion over 10 years.
104
Infrastructure Benefits All Income Groups
This plan is fair because infrastructure investment also benefits the wealthy.
Infrastructure is more valuable to the wealthy because they utilize and depend more on
transportation networks than those who are not wealthy. Upper income Americans fly
more than those in the lower- and middle-class so improved airports will benefit them
directly and to a greater degree. In addition, improved infrastructure will lower business
transportation costs. Because businesses owners, and the stockowners of those
businesses, are overwhelmingly in higher income brackets, this plan will pay them
additional dividends. At a personal level it costs a lot more to repair a Mercedes
damaged by a pothole than it does a Ford, so improved roads and bridges will directly
benefit the wealthy that will be asked to contribute the resources for this program.
Infrastructure and Income Inequality
More Good Jobs, Businesses that are More Competitive; Less Inequality
Infrastructure investment will have a positive effect on equalizing U.S. income
distribution by creating good paying jobs that can’t be outsourced, many of them
unionized, and by lowering costs of distribution, making U.S. businesses more
competitive and profitable. A competitive advantage boosted by modern infrastructure
that creates profitable and competitive businesses can be expected to employ more
workers. This infrastructure project creates demand in the labor market and should result
in more jobs and higher wages. One of the conditions that exacerbated income inequality
is the disappearance of middle-income jobs, especially in construction and manufacturing
(Department of the Treasury & Council of Economic Advisors, 2012; Kotkin, 2013).
105
Infrastructure investment predominantly employs workers from these hardest hit industry
sectors. A large number of these jobs were union jobs or paid wages similar to union
wages. Chapters 1 and 3 detailed research that showed job losses in unionized
employment overwhelmingly hurt middle class earners and worsened income inequality
(Gordon, 2012; Hacker & Lowentheil; Noah, Stiglitz, 2012). Infrastructure investment in
general can have a positive effect on reversing that trend (Department of the Treasury, et
al., 2012).
Infrastructure and jobs
What can be expected
This thesis contends that an infrastructure investment program will create enough
jobs and economic activity to lessen income inequality. I examined and considered other
impact estimate claims to develop a probable range of employment and economic ripple
effects of the recommended infrastructure spending. I examined the 2009 report on
ARRA job creation from the President’s Council on Economic Advisors, a working paper
from Wilson (2011) that analyzes job growth resulting from the 2009 American Recovery
and Reinvestment Act (ARRA), a report on job creation from transportation
infrastructure investment by the Federal Highway Administration and Political Economy
Research Institute ( PERI) at University of Massachusetts, Amhearst, and my own
IMPLAN analysis of employment and economic impacts.
Input-Output Analysis
These estimates were developed using input-output analysis. Input-output
analysis tracks the ripple effect of an economic activity throughout an economy. This is
106
done by producing a multiplier index that describes and measures the outcome of an
economic activity. Economic outcomes are expressed as direct, indirect, and induced
impacts. Direct impacts measure economic results directly related to a primary activity.
In the case of infrastructure, direct impacts would include labor, the people hired to do
the work, materials and supplies purchased to build or repair the roads and bridges, steel,
concrete, equipment, etc. as well as capital costs. Indirect impacts are secondary. They
would include the labor and raw materials purchased by the suppliers of the materials,
equipment builders and salespeople, etc. that would be needed specifically for the
infrastructure projects. Induced effects are a step further away from the primary activity.
Induced economic activity would include the individual household level spending of the
workers made possible by the wages from the infrastructure improvement project.
I modeled the direct, indirect, and induced multiplier effects of a $100 billion
annual infrastructure investment on employment, economic output and taxation using
IMPLAN modeling software. IMPLAN is a software program that performs economic
modeling of varying complexity. In this case, I used the program for a very basic
employment and economic effects modeling query. The methodology was simple; I
input $100 million in public infrastructure spending and received the IMPLAN impact
results, to calculate impacts of $100 billion spending each value would be multiplied by
1,000 (IMPLAN does not calculate impacts for spending $100 billion). The IMPLAN
calculation projected direct employment output at 898 jobs, indirect employments output
at 380 jobs and induced employment at 687, resulting in a total of 1,965 jobs created for
107
each $100 million. This would result in 1,965,000 jobs created for a $100 billion
infrastructure investment. This is a substantial employment effect.
Input-output economic modeling is controversial and relies on imperfect
economic assumptions and in this case attempts to derive a cumulative national average
of regional and local results. However IMPLAN modeling results have been accepted by
U.S. courts and a wide range of economic forecasters (University of Wisconsin Center
for Cooperatives, 2009). Assessing impacts of such a large amount of spending on a
national scale is imprecise but it can be instructive to develop a range of projected
outcomes. IMPLAN input-output economic modeling is only one of the sources
consulted for assessing the impact of a $100 billion annual infrastructure investment plan.
Comparative Analysis of Average Jobs Created Estimates Range
A report from the President’s Council of Economic Advisors (2009) estimates
employment impact of $100 billion of direct ARRA government infrastructure spending
to be 1,085,355 job years, meaning that 1,085,355 full year jobs are created by that level
of investment. Analysis from the Political Economy Research Institute ( PERI) at
University of Massachusetts, Amhearst, posits $1 billion of infastrucuture spending
results in 18,000 jobs (Heintz, Pollin, & Garret-Peltier, 2009).This results in 1,800,000
jobs for a $100 billion infastrucuture investment. The Federal Highway Administration
reported a projection of 27,800 jobs created for each $1 billion in federal transportation
infastructure spending (U.S. Department of Transportation- Federal Highway
Administration, 2012), this projects to 2,780,000 jobs, a total that is far outside the range
suppoted in other studies. The Bureau of Labor Statistice (BLS) provides the tables used
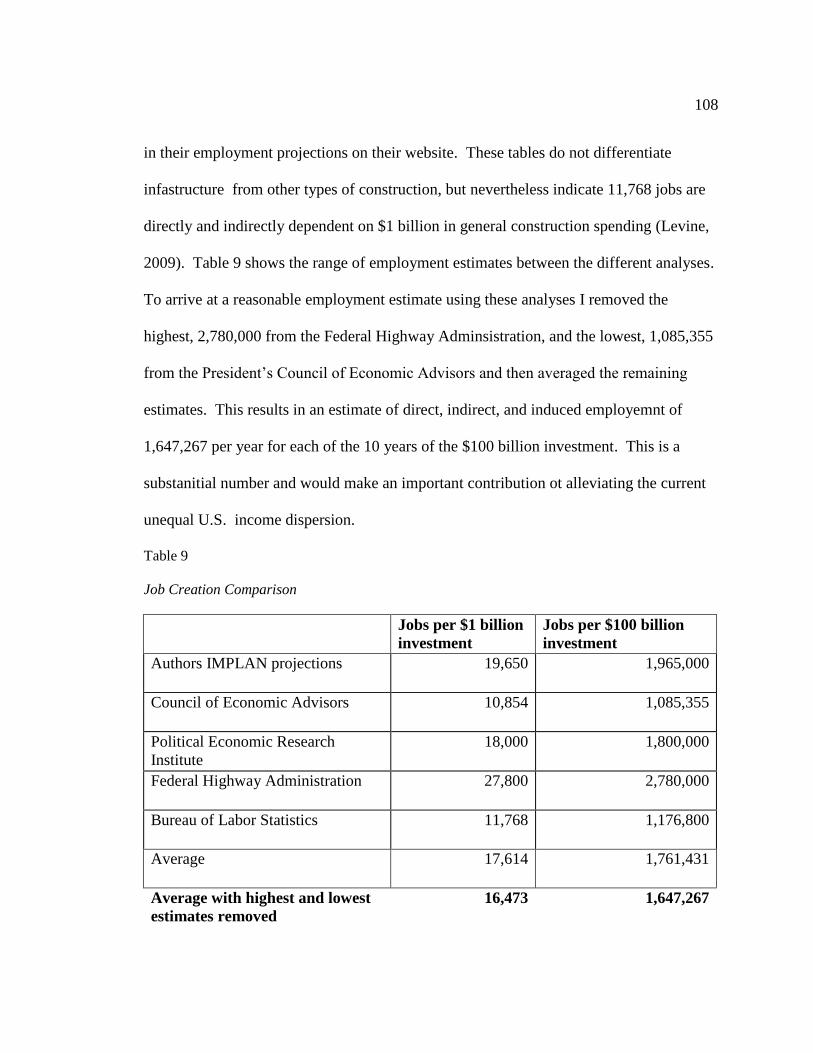
108
in their employment projections on their website. These tables do not differentiate
infastructure from other types of construction, but nevertheless indicate 11,768 jobs are
directly and indirectly dependent on $1 billion in general construction spending (Levine,
2009). Table 9 shows the range of employment estimates between the different analyses.
To arrive at a reasonable employment estimate using these analyses I removed the
highest, 2,780,000 from the Federal Highway Adminsistration, and the lowest, 1,085,355
from the President’s Council of Economic Advisors and then averaged the remaining
estimates. This results in an estimate of direct, indirect, and induced employemnt of
1,647,267 per year for each of the 10 years of the $100 billion investment. This is a
substanitial number and would make an important contribution ot alleviating the current
unequal U.S. income dispersion.
Table 9
Job Creation Comparison
Jobs per $1 billion
investment
Jobs per $100 billion
investment
Authors IMPLAN projections 19,650 1,965,000
Council of Economic Advisors 10,854 1,085,355
Political Economic Research
Institute
18,000 1,800,000
Federal Highway Administration 27,800 2,780,000
Bureau of Labor Statistics 11,768 1,176,800
Average 17,614 1,761,431
Average with highest and lowest
estimates removed
16,473 1,647,267
109
This section of the chapter explained the recommended estate tax and
infrastructure investment plan. The next section assesses the recommended plan in
regards to the decision criteria explained in Chapter 4. This assessment will be done by
judging the projected outcomes with the criteria, sufficiency, sustainability, least
disruptive to market processes, and political feasibility.
Sufficiency
This plan is not a panacea, but it is sufficient to lessen the conditions and effects
of income inequality. The recommendations proposed in this thesis will not end income
inequality. Nevertheless, this plan is satisfies the sufficiency criteria because it
constitutes a positive and substantial first step in recalibrating the current income
distribution by creating mid wage jobs that will help rebuild America’s middle class and
the training and apprenticeship component will lift many families out of the lower
economic strata .
This plan is not the only necessary approach; current programs should be
continued and if possible expanded. Nevertheless, this plan generates and invests
approximately $100 billion a year for a ten-year period, an amount extensive enough to
meet the sufficiency criteria.
Sustainability
This plan is sustainable because once the rates are set they will remain in effect
indefinitely. No additional resources would be needed to continue the tax portion of the
plan. Some tax plans are not sustainable because behavior can be altered to reduce the
amount exposed to the tax. For instance revenue from capital gains taxation is difficult to
110
project because people may change their market behavior in response. People may wait
to sell stocks or real estate to avoid paying capital gains taxes. This makes the revenue
from these taxes unstable over the long term. Transfer taxation does not face this
problem. People cannot postpone their death to avoid these taxes. This makes revenue
from these taxes sustainable because death rates are relatively consistent and constant.
There is legitimate concern over what effect an increase in the estate tax may have
on individual work and investment behavior. People may work or save less to avoid
taxation, or find other ways to transfer income before their death, and this will reduce the
revenue generated by the estate tax. Research by the Congressional Budget Office (2005)
indicates actual behavior does not support, or refute, those concerns and that although
some may work and save less to avoid taxation at death some may work and save more to
offset the taxes. Why people work and save is too complicated and individually
determined to accurately predict at this level. The estate tax is not new and past behavior
indicates that while some may change their economic behavior many will not, the
revenue and number of estates subject to the estate tax has remained relatively stable
(Internal Revenue Service, 2013).
Least Disruptive to Market
There are arguments that propose that any taxation is disruptive to market
processes. In the most simplistic economic rationale this is accurate. Money that is taxed
is not used as it would be if it was not taxed and this creates a theoretical inefficiency.
However, research has indicated that estate or transfer taxes are much less disruptive to
the overall economy than most other types of taxation (Caron & Repetti, 2013; Slemrod
111
& Gale, 2001). Caron & Repetti (2013) found that inherited income has a greater effect
in worsening inequality than self-generated wealth. Gale & Slemrod (2001) found that
commonly raised concerns about the estate taxes negative effect on reducing savings,
charitable donations and small businesses “ lack definitive supporting evidence and in
some cases appear to be grossly overstated” (p.61). Therefore, of the other commonly
proposed revenue sources, income and corporate taxation, transfer taxes are the least
disruptive to market processes.
Political Feasibility
As mentioned in Chapter 4 satisfying this criterion is extremely challenging.
Imagining politically acceptable options is difficult in a world where one political party is
willing to shut down the federal government in protest over policy. In this case the
criteria will be defined as answering the question what policy is likely more acceptable.
Political opposition to this plan can be expected due to philosophical differences
about the size and role of government. Conservatives routinely oppose any program they
view as increasing the size and scope of a government they view as too large and
expensive. These political disagreements are often founded in a core set of beliefs about
the efficacy of the market to redress imbalances and create a more equitable society.
Concerns about the size of current U.S. deficits also drive opposition to a spending plan
of this magnitude. Long standing opposition to any tax increase and cries of “death tax”
will be renewed if this plan was attempted. It would be difficult for many conservative
members of Congress to support this plan even if they agree with it due to “Tea Party”
challenges from inside their party.
112
These are seriously held concerns that are outside the scope of this thesis to
counter fully. Briefly, the quarrel about the size and scope of government will not be
settled here, or possibly anywhere. This thesis takes the position that government has a
necessary and vital role in ameliorating this situation and if the market could remedy the
conditions of income inequality and failing infrastructure it would already be done. The
concern about deficits is serious, however allowing the physical plant the U.S. needs to
maintain competiveness in global market to deteriorate to save money now is
shortsighted and unwise because repair will ultimately cost much more in the future. The
U.S. should take advantage of historically low interest rates and invest now.
Apart from philosophical political differences, there are disagreements about the
actual need for an infrastructure spending plan. Critics of an increase in Federal
infrastructure spending doubt that the need is as great as the ASCE claims. If this
concern is accurate and less repair is needed then less repair should be done. It would be
a positive development if rebuilding American infrastructure costs less than projected by
the ASCE. This thesis does not recommend wasting money on projects that are
unnecessary or frivolous. This recommendation will require vetting by a panel of
professional engineers from the private and public sector to assure that resources are
allocated to needed projects.
Regardless, this proposal satisfies the criterion because it possible to realistically
imagine an increase in transfer taxes could generate some support when coupled with the
infrastructure spending plan. Opposition could come from the fact that currently over
50% of representatives in Congress are millionaires, the median income for members of
113
Congress in $1,008,767, and these people may not want to subject themselves to an
increase in estate taxation (Lipton, 2014).
The recommendations have been devised to offer both primary and secondary
benefits. The revenue piece of the plan, a recalibration of estate tax rates, helps alleviate
income inequality in two ways. First, a recalibration of the estate tax regime that
reintroduces taxation levels in effect in 2000 will achieve a diminution, albeit small, of
incomes for those at the very top of the income scale. This change in estate tax rates will
have a small effect on equalizing overall income distribution (Caron & Repetti, 2013).
The major effect of this revenue on promoting a more equitable income distribution will
be realized when it is used to invest in a badly needed major U.S. infrastructure program.
This infrastructure investment will create good high paying jobs, create significant direct,
indirect and induced economic growth, and help U.S. businesses to be more competitive
in the world marketplace. All of these outcomes will make the U.S. a more equitable and
prosperous place.
This infrastructure investment plan will be effective in reducing the growing
unequal income distribution because it attacks one of the main problems of growing
inequality, the disappearance of the middle class. The large infrastructure investment
program proposed in this thesis will create hundreds of thousands of good paying jobs
that support middle class lifestyles. Because the middle class sector of the economy is
responsible for the vast majority of consumer spending the economic ripple effect of this
employment is exponential.
114
The recommendations are explained individually, however, they must be
combined and they are only likely to produce the projected outcomes if they are
implemented together. This is a unified plan, one portion raises revenue and the other
invests it in a way that will have a multiplier effect on economic growth, creating high
wage employment and expanding the middle class, which will bring incomes across the
economy closer.
Chapter Conclusion
This chapter presents and explains the recommended plan devised to begin to
lessen income inequality in the U.S. This plan is a novel integrated approach, which
generates revenue by recalibrating the estate tax rates to 2000 levels and using the
projected $1 trillion in revenue on a much-needed infrastructure-rebuilding program.
This plan attacks income inequality in a number of ways. First, the estate tax
recalibration will alter incomes at the very top of the income distribution, and then invest
the revenue creating over a million good mid range jobs in industry sectors that have seen
major recent job losses. The jobs themselves will alter the income distribution by helping
rebuild the middle class, and providing a substantial economic multiplier effect that will
reverberate throughout the economy.
Thesis Conclusion
This thesis has covered a lot of ground because income inequality is a
complicated and controversial topic. The Bardach (2009) methodology is ideal for
developing understanding of, analyzing, and communicating, topics like this. I wanted
this thesis to be an examination of income inequality but also a subject primer. It was my
115
hope that the reader would come away with a more global understanding of the issue, not
just an explanation of a technical piece of the puzzle. The first chapter presented the
problem statement, in this thesis, “current U.S. income inequality is too great.” The
remaining portion of that first chapter presented the evidence I believe makes this case.
While income inequality itself is contentious, the economic research is beginning to be
widely accepted, and this research indicates that incomes of a small group of Americans
are separating rapidly and considerably from the rest of U.S. society. The debate comes
from what, if anything can, or should be, done about it.
This question drove the second and third chapters of this thesis where I reviewed
the literature surrounding the normative aspects of income inequality. The second
chapter, a review of the main economic theories that shape approaches to income
inequality was a diversion from the traditional literature review. I took this approach
because the debate about what to do, if anything, about income distribution is rooted in
basic belief about how economies work, and what role government has in mitigating
distributional issues. To understand the topic of income inequality it is vital to grasp the
foundational theories held by people who agree income inequality is a problem but also
those who think it is not a problem. To be fair I also wanted to address the thinking of
those who think income inequality is a problem but believe an unregulated “free” market
is the best way to mitigate the problem. However, economic theory indicates that
markets are not free, they are created and regulated by people, and in the case of income
inequality, it seems markets are currently constructed to overwhelmingly favor those at
the top of the income scale. I agree that markets must be part of the solution to income
116
inequality but the idea that free markets can create more fairness is based on folklore, not
economics. The regulation of markets has led to the current condition of vast inequality;
therefore, markets can be altered to engender more distributional equity.
Chapter 3 was a review of the literature on alternative approaches to lessening the
condition and effects of income inequality. This follows Bardach’s (2009) next step to
develop alternatives. This chapter explained and examined the many alternatives
presented in the literature. Chapter 4 listed, explained, and presented the rationale for the
decision criteria. Chapter 5 presented an outcome matrix suggested by Bardach (2009) as
an assessment tool that evaluated the alternatives using the decision criteria. Chapter 6
used the assessment of alternatives from Chapter 5 and presented a recommendation plan
that could begin to change the trajectory of U.S. income inequality towards a more
equitable and equal distribution of economic rewards.
Future Research
As stated previously income inequality is a contentious subject. Part of the
disagreement about the topic is philosophical; some people believe inequality is good
because it provides motivation to strive, and achieve, some think that even if incomes are
diverging too much there is not anything government can do to mitigate the problem.
These positions are deeply held and may not be subject to significant alteration.
However, some of the debate about income inequality comes from the lack of data.
Much of the empirical research done on income inequality was not developed for the
purpose of investigating income dispersion. A large amount the data is anecdotal; some
is too broad to establish causation. This needs to change. It was the establishment and
117
analysis of the top income database from Piketty and Saez that really began the income
inequality debate when they showed the great divergence in incomes using IRS tax data .
More precise data must be collected and analyzed to determine exactly how incomes are
diverging. Longitudinal data sets must be developed to illustrate whether or not
intergenerational income mobility is constricting or whether the “American Dream” is
still a possibility for the majority.
The social costs of income inequality require more research. Income inequality
appears to be creating a vicious cycle where social trust is eroding and creating a less
communitarian, and trusting society. When people lose trust in each other society can
devolve to a Darwinist survival of the fittest struggle. Democracy and democratic society
is dependent upon people working together. If people begin to view society as a rigged
game that only benefits the already powerful and wealthy social capital is diminished and
social norms begin to break down. The diminishing belief in society results decreased
participation. Decreasing participation results in less voting. Less voting from ordinary
citizen’s results in overwhelming political and economic influence going to the wealthy.
This creates anger, frustration and apathy in the general public and that reinforces the
vicious cycle.
It will be difficult to address income inequality until there is a common
acceptance that a greatly skewed income distribution it is bad for everyone, rich and poor.
Research and data need to be developed to convey the actual condition and consequences
of income inequality. Often research can indicate solutions, and solutions do exist. I
tried to present many of them in this thesis. If both wealthy and not wealthy understand
118
that a vastly unequal society is a detriment to all then change can begin. The historical
arc of Western civilization is a movement towards greater equality. Our society has
determined inequality is unjust and unproductive in regards to race, gender, ethnicity,
sexual orientations, and many other human attributes. This has made our society better,
more efficient, and productive. Western society is as free, as equal and as productive as
any time in history. This is because equality is the best way to order a society. When
people are free and respected they feel valued and are more able to freely contribute to
the social order. In my opinion income inequality will one day be viewed similar to racial
and ethnic equality. Society cannot function properly in conditions of great inequality of
any type. The more equal a society, the more productive, successful and lasting, for rich,
middle class, and poor alike.
119
References
Abdullah, A.& Doucouliagos, H., & Manning, E. (2011, September nd). Education and
Income Inequality: A Meta-Regression Analysis . Retrieved from Hendrix:
http://www.hendrix.edu/uploadedFiles/Departments_and_Programs/Business_and
_Economics/AMAES/Education%20and%20Inequality%20Meta%20Analysis%2
0JABBAR.pdf
Aitken, N., & Elgar, F. (2010) Income inequality, trust and homicide in 33 countries,
European Journal of Public Health, April 2010 22(2).
Albert, D., Hockett, R., & Roubini, N. (2011). The way forward. Washington: The New
America Foundation.
Alden, E. (2012, June 14). The First Renewing America Progress Report and Scorecard:
The Road to Nowhere. Retrieved from Council on Foreign Relations:
http://blogs.cfr.org/renewing-america/2012/06/14/the-first-renewing-america-
progress-report-and-scorecard-the-road-to-nowhere/
Alesina, A. & Perotti, R. (1994) Income distribution, political instability and investment.
1994-95 Discussion Paper Series No. 751 .
Allen, C. (2010, March 1). Those Disastrous Student Loans. Retrieved from Minding the
campus, reforming our universities:
http://www.mindingthecampus.com/originals/2010/03/those_disastrous_student_l
oans.html
120
Alvaredo, F., Atkinson, T., Piketty, T. & Saez, E. (2013). The world’s top income
database. Country detail ,USA, Paris School of Economics. Retrieved 8/1/2013
http://topincomes.gmond.parisschoolofeconomics.eu/#Country:United%20States
Aron-Dine, A., & Friedman, J. (2006, June 14). New estate antecdotes dredge up old
claim that estae tax claims more than half of an estate. Retrieved from Center for
Budget Priorities: http://www.cbpp.org/files/6-14-06tax.pdf
ASCE, & Engineers, A. S. (2013). Failure to Act: The Impact of Current Infastructure
inverstment on America's economic future. Reston: American Society of Civil
Engineers.
Bardach, E. (2009). A practical guide to policy analysis. Washington, D.C.: CQ Press.
Barry, C. (2011, Spring nd). Redistribution. Retrieved from Stanford encyclopedia of
philosophy: http://plato.stanford.edu/cgi-
bin/encyclopedia/archinfo.cgi?entry=redistribution
Bengali, L. & Daly, M. (2013) US economic mobility the dream and the data. Federal
Reserve Bank of San Francisco Economic Letter. Federal Reserve Bank of San
Francisco March 3, 2013. Retrieved from http://www.frbsf.org/economic-
research/publications/economic-letter/2013/march/us-economic-mobility-dream-
data/
Benner, C., & Pastor, M. (2012). Just Growth; inclusion and prosperity in America's
metrpolitan regions. Abingdon: Routledge.
121
Betson, D., & Haveman, R. (1984). The Role of Income Transfers in Reducing Inequality
between and within regions. In M. ,. Moon, Economic Transfers in the United
States (pp. 283-326). Chicago: University of Chicago Press.
Blodgett, H. (2013) 6 members of the Wal-Mart family have as much wealth as the
bottom third of the US. Business Insider, Jan. 24, 2013
http://www.businessinsider.com/the-walton-family-has-as-much-money-as-the
bottom-third-of-the-us-2013-1
Bloomquist, K. (2003) Tax Evasion, Income inequality, and opportunity costs of
compliance. Presentation at the 96th
Annual Conference of the National Tax
Association, Nov. 2003, Chicago, Il. http://www.irs.gov.edgesuite-
staging.net/pub/irs-soi/bloomq.pdf
Board of Governors of the Federal Reserve System. (2013, Septemeber 26). What are the
Federal Reserve's objectives in conducting monetary policy? Retrieved from
Federal Reserve Board: http://www.federalreserve.gov/faqs/money_12848.htm
Boston Globe. (2014, nd nd). Road to tragedy- a history of problems with the Big Dig.
Retrieved from Boston.com:
http://www.boston.com/news/specials/big_dig_problems/
Bowie, B., Smith, D., Phillips, R., & Wamhoff, S. (2012). Representation without
taxation, fortune 500 companies that spend big on lobbying. Washington:
Citizen's for tax justice; U.S. PIRG.
Bradford, H., http://www.huffingtonpost.com/2011/11/15/warren-buffett-tax-code-
l_n_1095833.html. Retrieved 6/5/2012
122
Brill, M., & Rowe, T. (2013) Spotlight on Statistics, Industry Labor and Productivity
Trends, 2000- 2010. Bureau of Labor Statistics Retrieved 8/15/2013 from
http://www.bls.gov/spotlight/2013/productivity/
Bromley, D. (1990). The ideology of efficiency: searching for a theory of policy analysis.
Journal of environmental economics and management, 86-107.
Building America's Future. (2009, January 8). Poll: Majority of Americans Ready to Pay
for Better Infrastructure but Demand Accountability. Retrieved from Building
America's Future: http://www.bafuture.org/news/press-release/poll-majority-
americans-ready-pay-better-infrastructure-demand-accountability
Bureau of Labor Statistics. (2013, January 29). CPI Inflation Calculator. Retrieved from
Bureau of Labor Statistics: http://www.bls.gov/data/inflation_calculator.htm
Bureau of Labor Statistics. (2013, January 23). Economic News Release; Union Members
Summary. Retrieved from Bureau of Labor Statistics; U.S. Department of Labor:
http://www.bls.gov/news.release/union2.nr0.htm
Cahoon, S. (2013, May 17). A list ofexperts who want to end, "too big to fail" . Retrieved
from Too big has failed; let's reform Wall Street for good:
http://www.toobighasfailed.org/too-big-to-fail/
Calderon, C., & Serven, L. (2014). The Effects of Infrastructure Development on growth
and income distribution. Annals of economcis and finance, 521-534.
Caron, P. L., & Repetti, J. R. (2013). Occupy the tax code: Using the estae tax to reduce
inequality and spur economic growth. Pepperdine Law Review, 1255-1289.
123
Carroll, R., O'Hare, J., & Swagel, P. L. (2011, June nd). Costs and benefits of housing tax
subsidies. Retrieved from Pew Charitable Trusts- Subsidyscope:
http://www.pewtrusts.org/uploadedFiles/wwwpewtrustsorg/Reports/Economic_M
obility/Pew_Housing_Report.pdf
Carter, B., & Craw, B. (2012, October 5). Paul Ryan; 60 percent of Americans are takers
not makers. Retrieved from HuffPost Politics:
http://www.huffingtonpost.com/2012/10/05/paul-ryan-60-percent-of-
a_n_1943073.html
Catlett, D. (2013, July 29). America's main street economy versus Wall Strett. Retrieved
from Independent Record: http://helenair.com/news/opinion/america-s-main-
street-economy-versus-the-wall-street/article_10b3d4e2-f659-11e2-bf3f-
001a4bcf887a.html?comment_form=true
Chua, K., & Casot, F. (2008). The case for universal health care. Reston: American
Medical Student Association.
Cilens, M. (2012). Inequality and democratic responsiveness. Princeton: Russell Sage &
Princeton University Press.
Citizens United v. Federal Election Commission (Docket No. 08-205) Oral argument
March 24, 2009.Legal Information Institute, Cornell University Law School
Retrieved 7/22/2013 from http://www.law.cornell.edu/supct/cert/08-205
CNN/ORC. (2011, October 17). CNN/ORC Poll. Retrieved from CNN / ORC:
http://i2.cdn.turner.com/cnn/2011/images/10/17/oct17.poll.economy.pdf
Colander, D. (2008) Economics, 7th
Ed. McGraw/Hill, Irwin, New York, N.Y.
124
Congressional Budget Office, C. (2005). Effects of the federal estae tax on small farms
and businesses. Washington: Congress of the United Staes, Congressional Budget
Office.
Congressional Budget Office. (2011, October nd). Trends in the distribution of household
income from 1979-2007. Retrieved from Congressional Budget Office:
http://www.cbo.gov/sites/default/files/cbofiles/attachments/10-25-
HouseholdIncome.pdf
Cooper, D., Hersh, A., & O'Leary, A. (2012, August nd). The Competition that really
matters, comparing US, Chinese and Indian investments in next generation
workers. Retrieved from Center for American Progress:
http://www.americanprogress.org/wp-
content/uploads/2012/08/USChinaIndiaEduCompetitiveness.pdf
Country detail ,USA, Paris School of Economics. Retrieved 8/1/2013 from
http://topincomes.gmond.parisschoolofeconomics.eu/#Country:
United%20States
Cummins, J., Hassett, K., & Hubbard, R. (1996). Tax reforms and investment; a cross
country comparision. Journal of Public Economics, 237-273.
Danzinger, S., Haveman, R., & Plotnick, R. (1981). How income transfer programs affect
work, savings and the income distribution; a critical review. Journal of economic
literature, 975-1028.
125
De Maio, F. G., (2007), Income Inequality Measures, J Epidemiol Community Health.
October; 61(10): 849–852.Retrieved 7- 21, 2013 from
http://www.ncbi.nlm.nih.gov/pmc/articles/PMC2652960/
De Gregorio, J. (2002). Education and income inequality; new evidence from cross
country data. Review of income and wealth, 395-416.
Deaton, A. (2003). Health, income and inequality. Washington: National Bureau of
Economici Research.
DeBacker, J., Heim, B., Panousi, V., Ramanath, S., & Vidagos, I. (2013). Rising
inequality, transitory or permanent? Evidence frorm a new panel of U.S. taz
returns. Boston: Brookings Institute.
Department of the Treasury, Council of Economic Advisors. (2012). A new economic
analysis of infastructure investment. Washington: Department of the Treasury.
Dixit, A., & Londregan, J. (1995). Redistributive politics and economic efficency.
American Political Science Review, 856-866.
Editors, T. (2013, May 9). End the home mortgage deduction. Retrieved from
Bloomberg: http://www.bloomberg.com/news/2013-05-09/housing-recovery-
opens-window-to-fix-homeowner-tax-breaks.html
Ellerman, D. (2008, September 9). Numeraire illusion : the final demise of the Kahldor-
Hicks principle. Retrieved from Social Science Research Network:
http://papers.ssrn.com/sol3/papers.cfm?abstract_id=1340637
126
Ellerman, D. (2009, June 8). A Fatal Logical-Methodological Error in the Kaldor-Hicks
principle, consumer surplus, and all that. Retrieved from Uni-Kassel:
http://www.uni-kassel.de/fb07/fileadmin/datas/fb07/5-
Institute/IVWL/Forschungskolloquium/SS09/Methodological-
error_Ellerman_Kurzfassung.pdf
Fehr, E. (2006). The economics of fariness, reciprocity, and altruisim-experimentla
evidence and new theories. In S. C. Kolm, & J. M. Ythier, Handbook of the
Economics of Giving, Altruism and Reciprocity, Volume 1 (pp. 615-690). Zurich:
Elsevier.
Feldstein, M. (1999). Reducing poverty, not inequality. Washington: National Bureau of
economic research.
Fieldhouse, A. (2013). A review of the economic research on the effects of raisiing
ordinary income tax rates. Washington: Economic Policy Institute.
Fieldhouse, A. (2013, June 14). Economic Policy Institute. Retrieved from Economic
Policy Institute Blog: http://www.epi.org/blog/tax-policy-curb-income-inequality-
growth/
Fischer, C. (2010, September 11). Why has Union membership declined? . Retrieved
from economistsview.com:
http://economistsview.typepad.com/economistsview/2010/09/why-has-union-
membership-declined.html
127
Fontevecchia, A. (2011, Novemeber 17). Occupy Wall Street : income inequality and the
burden of action. Retrieved from Forbes.com:
http://www.forbes.com/sites/afontevecchia/2011/11/17/occupy-wall-street-
income-inequality-and-the-burden-of-action/
Frank, R. (2007) Falling behind, how rising inequality harms the middle class. University
of California Press, Berkeley, CA
Franko, W., Tolbert, C. J., & Witko, C. (2013). Inequlaity, public interest and support for
"Robin Hood" tax policies. Political research quarterly, 923-937.
Franks, R. (2007). Falling behind; how rising inequality harms the mddle class.
Berkelely: University of California Press.
Fuguitt, D., & Wilcox, S. (1999). Cost benefit analysis for public decison makers.
Westport: Quorum Books.
Fund, I. M. (2012, March 28). Externalities: Prices Do Not Capture All Costs. Retrieved
from IMF, Finance & Development:
http://www.imf.org/external/pubs/ft/fandd/basics/external.htm
Galbraith, J. (1998, Novemeber 28). The distribution of income . Retrieved from
University of Texas at Austin: http://utip.gov.utexas.edu/papers/utip_02.pdf
Gale, W. G., & Slemrod, J. B. (2001). Rethinking the estate and gift tax; an overview.
Boston: The Brooking Institute.
Gilson, D. Perot, C. (2011) It’s the inequality stupid. Mother Jones. March/April 2011.
Retrieved from http://www.motherjones.com/politics/2011/02/income-inequality-
in-america-chart-graph
128
Gleckman, H. (2013, 3 28). This may be the ideal time to reform the mortgage intrest
deduction. Retrieved from Forbes.com:
http://www.forbes.com/sites/beltway/2013/03/28/this-may-be-the-ideal-time-to-
reform-the-mortgage-interest-deduction/
Goldin, C., & Margo, R. (1992), The great compression: the wage structure in the United
States at mid- century, The Quarterly Journal of Economics, MIT Press 107(1)
p 1-34.
Gordon, C. (2012, June 5). Union decline and rising inequality in two charts. Retrieved
from Economic Policy Institute- Working Economics:
http://www.epi.org/blog/union-decline-rising-inequality-charts/
Greenstein, R., & Kogan, R. (2013, October 28). Low-Income Programs Are Not Driving
the Nation’s Long-Term Fiscal Problem . Retrieved from Center on Budget and
Policy Prioritites: http://www.cbpp.org/cms/index.cfm?fa=view&id=3772
Greenstein, R., & Wancheck, J. (2011, April 19). EArned income tax credit overpayment
and error issues. Retrieved from Center of budget and policy priorities:
http://www.cbpp.org/cms/?fa=view&id=3445
Greenstone, M., & Looney, A. (2013, April 13). Just how progressive is the US tax code?
Retrieved from Brookings Institution: http://www.brookings.edu/blogs/up-
front/posts/2012/04/13-tax-greenstone-looney
Gross Domestic Product (GDP) Graph (2013). Bureau of Economic Analysis,
Washington, D.C. Retrieved 8/15/2013 from
http://www.bea.gov/newsreleases/national/gdp/gdp_glance.htm
129
Habib, D. (2013 , March 26). Don't kill the mortgage deduction- CAp it. Retrieved from
CNBC.com: http://www.cnbc.com/id/100583714
Hacker, J. S., & Lowentheil, N. (2012). Prosperity Economics; Building an economy for
all. n.d.: Creative Commons.
Heintz, J., Pollin, R., & Garret-Peltier, H. (2009). How infrastructure investments support
the US economy, employment, productivity and growth. Washington: Alliance for
American Manufacturing.
Helbling, T. (2012, March 28). Externalities: Prices Do Not Capture All Costs. Retrieved
from International Monetary Fund; Finance & Development:
http://www.imf.org/external/pubs/ft/fandd/basics/external.htm
Hill, R. Myatt, T. (2010) The economics anti-textbook, a critical thinkers guide to
microeconomics. Zed Books, New York, NY.
Hiltonsmith, R. (2013, August nd). At what cost? How student debt reduces lifetime
wealth. Retrieved from demos.org: http://www.demos.org/what-cost-how-student-
debt-reduces-lifetime-wealth
Hochman, H., & Rodgers, J. (1969). Pareto Optimal Redistribution. American Economic
Review, 542-557.
Holt, S. (2011). Ten years of the EITC, making work pay ,now and then .Washington:
The Brooking Institute.
130
Hoover, K. (2013, August 17). Many small businesses pay higher effective tax rates than
major corporations. Retrieved from The Business Journals:
http://www.bizjournals.com/bizjournals/washingtonbureau/2013/08/07/many-
small-businesses-pay-higher.html
Hoover/ Robin Hood Index
http://en.wikipedia.org/wiki/Hoover_index. Retrieved 3/20/2012.
House Budget Committee. (2011, November 17). A deeper look at income inequality.
Retrieved from House Budget Committee:
http://budget.house.gov/uploadedfiles/cboinequality.pdf
Huang, C.-C. (2009, January 28). cbbp.org. Retrieved from Center on Budget and Policy
Priorities: http://www.cbpp.org/cms/index.cfm?fa=view&id=455
Huang, C.-C., & Frentz, N. (2013, August 29). Myths and realities about the estate tax.
Retrieved from Center on Budget and Policy Priorities:
http://www.cbpp.org/files/estatetaxmyths.pdf
Hungerford, T. (2013). Corporate tax rates and economic growth since 1947.
Washington: Economic Policy Institute.
Internal Revenue Service. (2013, August nd). Table 1. Estate tax returns filed in 2012
(1). by tax status and size of gross estate. Retrieved from IRS.gov:
http://www.irs.gov/uac/SOI-Tax-Stats-Estate-Tax-Statistics-Filing-Year-Table-1
Internal Revenue Service. (2013, Septemeber 3). Estate Tax. Retrieved from IRS.com:
http://www.irs.gov/Businesses/Small-Businesses-&-Self-Employed/Estate-Tax
131
Johnson, S., & Kwak, J. (2010). 13 Bankers, the wallstreet takeover and the next
financial meltdown. New York: Random House.
Johnston, D. (2011, December 11). The taxpayer's burden. Retrieved from Reuters:
http://blogs.reuters.com/david-cay-johnston/2011/12/04/the-taxpayers-burden/
Kane, L. (2012, October 26). How much does it cost to run a presidential election? .
Retrieved from Learnvest: http://www.learnvest.com/2012/10/how-much-does-it-
cost-to-run-a-presidential-election-123/
Kahneman, D. 2011) Thinking fast and slow. Farrar, Straus and Giroux, New York, NY.
Kennedy, B., Kawachi, I., Prothrow-Stith, D., Lochner, D., Gupta, V. (1998) Social
Capital, income inequality, and firearm violent crime, Social Science and
Medicine, 7-17.
King, T. (2012, January 11). Gary Bauer is wrong about the Bible. Retrieved from God's
Politics: http://sojo.net/blogs/2012/01/11/gary-bauer-wrong-about-bible#
Kingdon, J. W. (2011). Agendas, Alternatives, and Public Policies. Boston : Longman.
Kotkin, J. (2013, October 24). The cities creating the most middle class jobs. Retrieved
from Forbes.com: http://www.forbes.com/sites/joelkotkin/2013/10/24/the-cities-
creating-the-most-middle-class-jobs/
Kumhof, M., & Ranciere, R. (2010, Decemeber nd). Leveraging inequality. Retrieved
from imf.org: http://www.imf.org/external/pubs/ft/fandd/2010/12/pdf/kumhof.pdf
Kuznets, S., (1955) Economic Growth and Income Inequality. American Economic
Review, 1-28.
132
Lee, D. (2002, nd nd). Redistribution of Income. Retrieved from Library of economics
and liberty: http://www.econlib.org/library/Enc1/RedistributionofIncome.html
Lee, D. (2013, February 5). Reducing income inequality a the expense of the poor.
Retrieved from The Freeman: http://www.fee.org/the_freeman/detail/reducing-
income-inequality-at-the-expense-of-the-poor#axzz2kbM8M2XW
Lemieux, P. (1995). Auditing the income tax. Liberty, 41-47.
Levine, L. (2009, March 17). Job loss and infastructure job creation during the
recession. Retrieved from Congressional Research Service:
http://fpc.state.gov/documents/organization/122480.pdf
Lewis, M. (2011). The big short. New York: W.W. Norton & Co.
Linden, M. (2012, April 19). The fderal tax code and income inequality. Retrieved from
Center for American Progress: http://www.americanprogress.org/issues/tax-
reform/report/2012/04/19/11404/the-federal-tax-code-and-income-inequality/
Lindert, P. (2004, July-August). Social Spending and economic growth. Challenge, 6-16.
Lindert, P.H., Williamson, J., (1976) Three centuries of American inequality,
http://eric.ed.gov/PDFS/ED123312.pdf. Retrieved 6/12/2013.
Lipton, E. (2014, January 9). Half of memebers of Congress are millionaires, report says.
Retrieved from New York Times :
http://www.nytimes.com/2014/01/10/us/politics/more-than-half-the-members-of-
congress-are-millionaires-analysis-finds.html?_r=0

133
Lowry, R. (2008, November 18). Infrastrucuture spending to nowhere. Retrieved from
National Reveiw.com:
http://m.nationalreview.com/articles/226326/infrastructure-spending-
nowhere/rich-lowry
Luhby, T. http://money.cnn.com/2012/01/12/news/economy/romney_envy/index.htm.
Retrieved 6/12/2013
Madland, D., & Bunker, N. (2012, September 12). Unions are necessary to rebuilding
our middle class. Retrieved from Center for American Progress:
http://www.americanprogressaction.org/issues/labor/news/2012/09/12/37761/unio
ns-are-necessary-to-rebuilding-our-middle-class/
Matthews, D. (2012, December 12). Ten ways to reduce income inequality without rasing
tax rates. Retrieved from Washingtont Post Wonkblog:
http://www.washingtonpost.com/blogs/wonkblog/wp/2012/12/06/ten-ways-to-
reduce-inequality-without-raising-tax-rates/
Mazumber, B. (n.d.) Upward intergenerational income mobility in the United States.
Economic Mobility Project. Pew Charitable Trusts.
McCardle, M. (2010, Dec 16). Will national health care improve our economic health.
Retrieved from The Atlantic:
http://www.theatlantic.com/business/archive/2010/12/will-national-health-care-
improve-our-economic-health/68165/
134
McKee, M., & Lanaman, S. (2009, October 15). Greenspan saysU.S. should consider
breaking up big banks. Retrieved from Bloomberg:
http://www.bloomberg.com/apps/news?pid=newsarchive&sid=aJ8HPmNUfchg
McMillian, T. (2007, April 17). The problem with the EITC. Retrieved from Huffington
Post: http://www.huffingtonpost.com/tracie-mcmillan/the-problem-with-the-
eitc_b_46082.html
Michon, K. (2013, nd nd). The new bankruptcy law, changes to Chapter 7 and 13.
Retrieved from Nolo: http://www.nolo.com/legal-encyclopedia/new-bankruptcy-
law-chapter-7-13-30040.html
Mincer, J. (1975). Education, experience, and the distribution of earnings and experience,
an oveview. Education, income and human behavior, 71-94.
Mintrom, M. (2012) Contemporary Policy Analysis, Oxford University Press, New York,
N.Y.
Miron, J. A. (2011). Rethinking Redistribution. National Affairs, 50-62. Retrieved from
National Affairs.
Mishel, L., & Walters, M. (2003, August 26). How Unions help all workers. Retrieved
from Economic Policy Institute:
http://www.epi.org/publication/briefingpapers_bp143/
Mitchell, A. (2013, August nd). The case for expanding Head Start as a wise investment
in America's future. Retrieved from Scholar's strategy network:
http://www.scholarsstrategynetwork.org/sites/default/files/ssn_basic_facts_mitche
ll_on_head_start.pdf
135
Mitchell, J. (2013, October 5). Medical bankruptcy claims rising as residents struggle to
pay bills. Retrieved from Clarion Ledger:
http://www.clarionledger.com/article/20131006/OPINION03/310060023/
Mohit, B. D. (2009, May 11). Universal Health care can save our economy and keep 1.7
million jobs in the U.S. Retrieved from HuffPost Business:
http://www.huffingtonpost.com/dr-behzad-mohit/universal-health-care-
can_b_201154.html
Moore, M. J., & Harper, C. (2010, December 15). Goldman Officers reap $111 million
Payout from 2007-2009. Retrieved from Bloomberg :
http://www.bloomberg.com/news/2010-12-15/goldman-s-bankfein-deputies-to-
collect-111-3-million-in-stock-bonuses.html
National Priorities Project. (2013, nd nd). Federal budget 101, where does the money
come from? Retrieved from National Priorities Project:
http://nationalpriorities.org/en/budget-basics/federal-budget-
101/revenues/?gclid=COme8svE47oCFYY1QgodcngAow
Noah, T. (2012). The great divergence. New York: Bloomsbury Press.
Norton, R. (2008, nd nd). Corporate taxation. Retrieved from Library of economics and
liberty: http://www.econlib.org/library/Enc/CorporateTaxation.html
Nozick, R. (1974). Anarchy, state and utopia. New York: Basic Books.
Obama, B. (2012, July 13). Campaign Speech, Roanoke VA. Roanoke, VA, USA.
136
O'Brien, W. (2012, Marrch 8). Memo to presidential candidates; Redistribution of wealth
is a divine commandment. Retrieved from Huffpost Religion:
http://www.huffingtonpost.com/william-obrien/redistribution-of-wealth-is-a-
divine-commandment_b_1322365.html
OECD, O. f. (2012). Reducing Income Inequality while boosting Economic Growth, Can
it Be Done ? Economic Policy Reforms: Going for Growth, Part II, Chapter 5, .
Paris: Organization for Economic Growth.
Office of Congressperson Marcel Fudge (OH-11). (2011, October 25). Rep. Fudge
introduces bill to fix crumbling bridges, put Ohioans back to work [press
release]. Retrieved from fudge.house.gov:
http://fudge.house.gov/index.cfm?sectionid=231§iontree=8,231&itemid=725
Office, C. B. (2005). Effects of the Federal estae tax on farms and small businesses.
Washington: Congress of theUnited States, Congressional Budget Office.
Office, C. B. (2011). Trends in the distribution of household income 1979-2007.
Washington: Congressional Budget Office .
Office, C. B. (2011). Trends in the distribution of household income 1979-2007.
Washington: Congressional Budget Office.
Okun, A. (1975). Equality and efficiency : The big tradeoff. Washington D.C.: The
Brookings Institute.
O'Neil, C. (2012, October 2). Student loans are a regressive tax. Retrieved from
Mathbabe- exploring and venting about quantitative issues:
http://mathbabe.org/2012/10/02/student-loans-are-a-regressive-tax/
137
Organization of Economic Cooperation and Development. (2011, na na). An overview of
growing inequality in OECD countries : main findings. Retrieved from OECD:
http://www.oecd.org/els/soc/49499779.pdf
Parisi, F., & Rowley, C. (2005). The origins of law and economics. Cheltenham: Edward
Elgar Publishing Limited.
Parker-Pope, C. (2009, June 4). Medical Bills Cause Most Bankruptcies. Retrieved from
New York Times: http://well.blogs.nytimes.com/2009/06/04/medical-bills-cause-
most-bankruptcies/?_r=0
Parrott, S. (2008, November 24). Recession could cause large increases in poverty and
push millions into deep poverty. Retrieved from Center on Budget and Policy
Priorities: http://www.cbpp.org/cms/index.cfm?fa=view&id=1290
Pennington, M. (2013, Marrch 3). To fix income inequality the have nots must become the
do somethings. Retrieved from Forbes.com:
http://www.forbes.com/sites/maurapennington/2013/03/08/to-fix-income-
inequality-the-have-nots-must-become-the-do-somethings/
Pethokoukis, J. (2011, October 18). 5 resons why income inequality is a myth-and occupy
wall street is wrong. Retrieved from Amercian Enterprise Institute:
http://www.aei-ideas.org/2011/10/5-reasons-why-income-inequality-is-a-myth-
and-occupy-wall-street-is-wrong/
Petz, B. (2013, April 1). US life expectancy and mortality rates; latest figures. Retrieved
from Ecology Global Network: http://www.ecology.com/2013/04/01/us-life-
expectancy-mortality-rates/
138
Piketty, T., & Saez, E. (2006). How progressive is the U.S. tax system? a historical and
international perspective. Cambridge: National Bureau of Economic Research.
Piketty, T., & Saez, E. (2012). Top incomes and the great recession;recent evolutions
and policy implications. Washington: International Monetary Fund.
Piketty, T., & Saez, E. (2013). A Theory of Optimal Inheritance Taxation. Econometrica,
1851-1886.
Pirttila, P., & Uusitlo, R. (2008). A leaky bucket in the real world; estimating inequality
aversion using survey data. Economica, 1-17.
President's Council of Economic Advisors. (2010). Estimates of job creation from the
2009 American recovery and reinvestment act. Washington: Executive Office of
the President ,Council of Economic Advisors.
Rasmussen, S. (2013, September 21). Politicians Serving Wall Street, Not Main Street.
Retrieved from Real Clear Politics:
http://www.realclearpolitics.com/articles/2013/09/21/politicians_serving_wall_str
eet_not_main_street_120026.html
Reich, R. (2011, October 26). Why Obamam should call for the breakup of big banks.
Retrieved from Christian Scince Monitor:
http://www.csmonitor.com/Business/Robert-Reich/2011/1026/Why-Obama-
should-call-for-a-breakup-of-big-banks
Reich, R. (2011, April 4). Why we must raise taxes on the rich. Retrieved from Robert
Reich: http://robertreich.org/post/4344201496
139
Rivlin, G. (2012, February 22). The "dirty thirty" are the top US comapnies that mnaged
to pay no tax. Retrieved from The Daily Beast:
http://www.thedailybeast.com/articles/2012/02/22/the-dirty-30-are-the-top-u-s-
companies-that-managed-to-pay-no-taxes.html
Rohaly, J., & Lim, K. (2011, June 13). Wealth Transfer Taxes: How many people pay the
estate tax? Retrieved from Tax Policy Center:
http://www.taxpolicycenter.org/upload/Elements/II-
9KEYELEMENTS_WealthTransferTaxes.final.pdf
Roubini, N. (n.d.) Project Syndicate. Retrieved from http://www.project-
syndicate.org/commentary/roubini46/English
Saez, E. (2013) striking it richer: the evolution of top incomes in the United States
(Updated with 2011 estimates). Pathways Magazine, Stanford Center for the
study of poverty and inequality, Winter 2008, p 6-7. Retrieved 8/15/2013
from, saez-UStopincomes.pdf.
Sandel, M. (2009). Justice; what 's the right thing to do. New York: Farrar, Straus and
Giroux.
Schwartz, M. (2011, November 28). Pre-Occupied. Retrieved from The New Yorker:
http://www.newyorker.com/reporting/2011/11/28/111128fa_fact_schwartz?curren
tPage=all#
Sen, A. (1993). Markets and freedoms; achievements and limitations of the market
mechanism in promoting individual freedom. Oxford Economic Papers, New
Series, 519-541.
140
Sherk, J. (2010, June 4). Unemployment remains high because job creation has yet to
recover. Retrieved from Heritage Foundation:
http://www.heritage.org/research/reports/2010/06/unemployment-remains-high-
because-job-creation-has-yet-to-recover
Shi, L., Starfield, B., Kennedy, B., & Kawachi, I. (1999). Income inequality, primary
care, and health indiccators. Journal of Famiy Practice, 275-284.
Slemrod, J., & Gale, W. P. (2001). Rethinking the estate and gift tax. Boston: Brookings
Institute.
Smith, S. (2011, December 11). Only idiots think infastructure spending is a wasteful;
and Americans are idiots. Retrieved from WashingtonPost.com:
http://www.forbes.com/sites/stephensmith/2011/12/07/washington-post-only-
idiots-think-infrastructure-spending-is-wasteful-and-americans-are-idiots/
Stansel, D., & Randazzo, A. (2011, nd nd). Unmasking the mortgage interest deduction:
Who benefits and by how much? Retrieved from Reason. org:
http://reason.org/files/mortgage_interest_deduction.pdf
Stiglitz, J. (2012). The price of inequality. New York: W.W. Norton.
Strom, E. (2008, nd nd). Example 16.2 incoe taxation and the trade off between efficiency
and equity. Retrieved from Public sector economics:
http://www.palgrave.com/economics/tresch/example/pdfs/Example16.2.pdf
Tabb, C. J. (1995). The history of bankruptcy law in the United States. American
Bankruptcy Institute Law Review, 5-51.
The Economist. (2013, September 21). Inequality, Growing Apart. The Economist.
141
Thurlow, Thurlow & Giachino. (2013, September 9). Estate Tax Rates. Retrieved from
Thurlow, Thurlow & Giachino: http://thurlowpa.com/EstateTaxRates.htm
U.S. Census (2013). Median Household Income and Gini Index in the past 12 months by
State and Puerto Rico, 2010-2011. Retrieved 8/15/2013. From
http://www.census.gov/prod/2012pubs/acsbr11-02.pdf
U.S. Federal Reserve, . (2013, October 4). Daily Update 10/4/2013. Retrieved from
Federalreserve.gov: http://www.federalreserve.gov/releases/h15/update/
U.S. Department of Transportation- Federal Highway Administration. (2012, April 5).
Employment impacts of federal highway infastructure spending. Retrieved from
Federal Highway Administration-Department of Transportation.:
http://www.fhwa.dot.gov/policy/otps/pubs/impacts/
University of Wisconsin Center for Cooperatives. (2009). Research on the economic
impact of cooperatives. Madison: University of Wisconsin.
Welker, J. (2013, January 13). Income inequality as market failure. Retrieved from
Economics in plain english:
http://welkerswikinomics.com/blog/2013/01/08/income-inequality-and-standards-
of-living-does-a-rising-tide-lift-all-boats/
Wheelan, C. (2010). Naked economics; undressing the dismal science. New York: W.W.
Norton.
White, B. A. (2005). Economic Efficiency and the Parameters of Fairness: A Marriage of
Marketplace Morals and the Ethic of Care. Cornell Jourrnal of Law and Public
Policy.
142
Whitman, K, Shoffner, D. (2011) The evolution of Social Security’s taxable minimum.
Policy Brief # 2011-12. U.S. Social Security Administration, Office of
Retirement and Disability Policy. Retrieved 8/25/2013 from
http://www.ssa.gov/policy/docs/policybriefs/pb2011-02.html
Wilkinson, R., & Pickett, K. (2010). The spirit level; Why greater equality makes
socieites stronger. New York: Bloomsbury Press.
Wilkinson, W. (2009) Thinking clearly about income inequality. Policy Analysis No.
640, July 14, 2009. Cato Institute, 1000 Massachusetts Ave, Washington, D.C.
Retrieved 7/21/2013 from http://www.cato.org/publications/policy-
analysis/thinking-clearly-about-economic-inequality
Wilson, D. (2011). Fiscal spending jobs multiplies: evidence from the 2009 American
recovery and reinvestment act. San Francisco: Fedral Reserve Bank of San
Francisco.
Wolfers, J. (2012) Is higher income inequality associated with lower intergenerational
mobility. Freakonomics.com. 1/19/2012
Wu, X., Perloff, J., & Golan, A. (2006). Effects of taxes and other government policies on
income distribution and welfare. Berkeley: University of California .
Xu, K., (2004), How has literature on Gini’s index evolved in the last 80 years,
http://economics.dal.ca/RePEc/dal/wparch/howgini.pdf. Retrieved 5/10/2013
Zingales, L. (2012, May 29). How Political Clout Made Banks Too Big to Fail. Retrieved
from Bloomberg: http://www.bloomberg.com/news/2012-05-29/how-political-
clout-made-banks-too-big-to-fail.html
143
http://www.investopedia.com/terms/i/income-inequality.asp#axzz1rD0qqBiz. Retrieved
4/5/2012
http://inequality.org/quotes. Retrieved 3/20/2013.