Embed Size (px)
Citation preview

OECD Economic Studies No. 34, 2002/I
7
© OECD 2002
INCOME DISTRIBUTION AND POVERTY IN THE OECD AREA: TRENDS AND DRIVING FORCES
Michael Förster and Mark Pearson
TABLE OF CONTENTS
Introduction ................................................................................................................................. 8
Main trends in the distribution of disposable incomes and poverty .................................. 9Overall trends in income distribution .................................................................................. 9Overall trends in poverty ....................................................................................................... 12“Winners” and “losers” of relative income changes............................................................ 15
Driving factors of changing income distributions ................................................................... 20Driving factors: I. Market incomes......................................................................................... 20Driving factors: II. Transfers and taxes .................................................................................. 25(Re)distributive patterns of family and unemployment benefits..................................... 25Overall effects of tax/transfers among the working-age population ................................. 30Poverty alleviation through taxes and transfers.................................................................. 32Driving factors: III. Underlying demographic changes........................................................ 34
Conclusions: 12 stylised facts on trends in income inequality and poverty ....................... 35Overall distributional trends and movements at the bottom........................................... 35Changes in relative positions of specific social groups...................................................... 35Driving factors.......................................................................................................................... 36Distributional effects of public transfers and taxes ............................................................ 36
Annex. Trends in Four Income Inequality Indicators for the Entire Population.................. 38
Bibliography ................................................................................................................................ 39
The authors, both from the Directorate for Education, Employment, Labour and Social Affairs, wish tothank Sveinbjörn Blöndal, Thai-Thanh Dang, Howard Oxley, Peter Scherer, Paul Swaim and, in particular,Michele Pellizzari for their comments and help in this project. The opinions expressed in the paper arethose of the authors and do not engage the OECD or its Member countries. Errors are the soleresponsibility of the authors.
publi.sgml.compo.fm Page 7 Friday, August 2, 2002 8:31 AM
8
© OECD 2002
INTRODUCTION
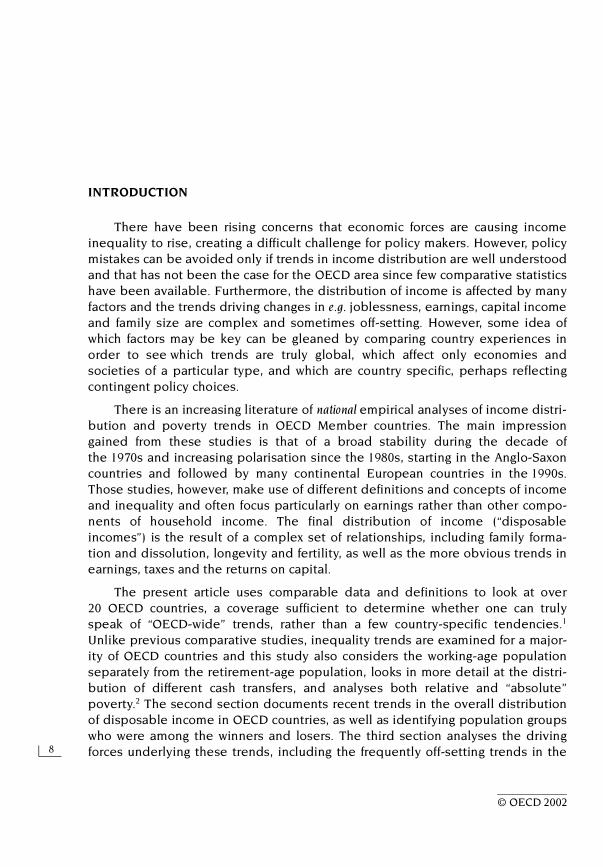
There have been rising concerns that economic forces are causing incomeinequality to rise, creating a difficult challenge for policy makers. However, policymistakes can be avoided only if trends in income distribution are well understoodand that has not been the case for the OECD area since few comparative statisticshave been available. Furthermore, the distribution of income is affected by manyfactors and the trends driving changes in e.g. joblessness, earnings, capital incomeand family size are complex and sometimes off-setting. However, some idea ofwhich factors may be key can be gleaned by comparing country experiences inorder to see which trends are truly global, which affect only economies andsocieties of a particular type, and which are country specific, perhaps reflectingcontingent policy choices.
There is an increasing literature of national empirical analyses of income distri-bution and poverty trends in OECD Member countries. The main impressiongained from these studies is that of a broad stability during the decade ofthe 1970s and increasing polarisation since the 1980s, starting in the Anglo-Saxoncountries and followed by many continental European countries in the 1990s.Those studies, however, make use of different definitions and concepts of incomeand inequality and often focus particularly on earnings rather than other compo-nents of household income. The final distribution of income (“disposableincomes”) is the result of a complex set of relationships, including family forma-tion and dissolution, longevity and fertility, as well as the more obvious trends inearnings, taxes and the returns on capital.
The present article uses comparable data and definitions to look at over20 OECD countries, a coverage sufficient to determine whether one can trulyspeak of “OECD-wide” trends, rather than a few country-specific tendencies.1
Unlike previous comparative studies, inequality trends are examined for a major-ity of OECD countries and this study also considers the working-age populationseparately from the retirement-age population, looks in more detail at the distri-bution of different cash transfers, and analyses both relative and “absolute”poverty.2 The second section documents recent trends in the overall distributionof disposable income in OECD countries, as well as identifying population groupswho were among the winners and losers. The third section analyses the drivingforces underlying these trends, including the frequently off-setting trends in the
publi.sgml.compo.fm Page 8 Friday, August 2, 2002 8:31 AM
Income Distribution and Poverty in the OECD Area: Trends and Driving Forces
9
© OECD 2002
distribution of market-based incomes and the redistributive impact of taxes andtransfers. The conclusion assembles 12 stylised facts that emerge from this analy-sis and provide important context for making policy choices in this difficult area.
MAIN TRENDS IN THE DISTRIBUTION OF DISPOSABLE INCOMES AND POVERTY
Overall trends in income distribution
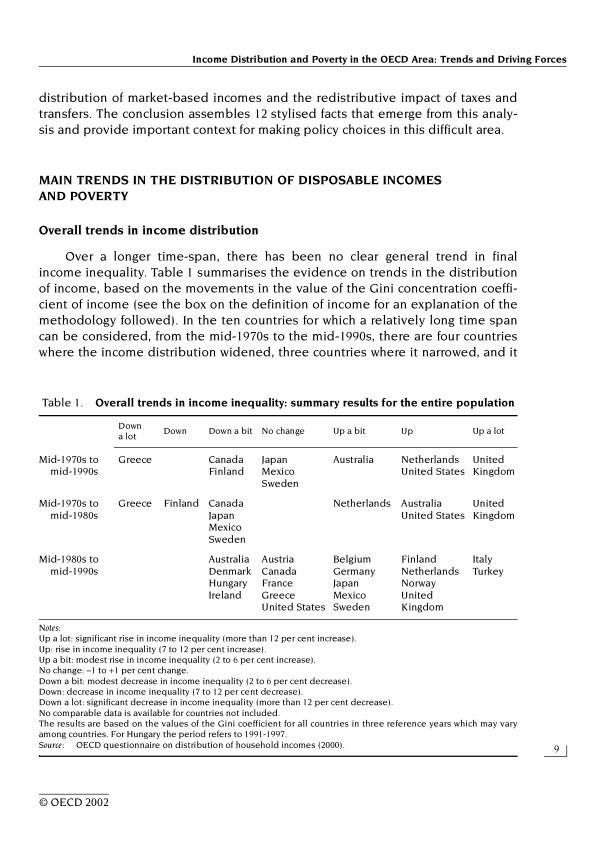
Over a longer time-span, there has been no clear general trend in finalincome inequality. Table 1 summarises the evidence on trends in the distributionof income, based on the movements in the value of the Gini concentration coeffi-cient of income (see the box on the definition of income for an explanation of themethodology followed). In the ten countries for which a relatively long time spancan be considered, from the mid-1970s to the mid-1990s, there are four countrieswhere the income distribution widened, three countries where it narrowed, and it
Table 1. Overall trends in income inequality: summary results for the entire population
Notes:Up a lot: significant rise in income inequality (more than 12 per cent increase).Up: rise in income inequality (7 to 12 per cent increase).Up a bit: modest rise in income inequality (2 to 6 per cent increase).No change: –1 to +1 per cent change.Down a bit: modest decrease in income inequality (2 to 6 per cent decrease).Down: decrease in income inequality (7 to 12 per cent decrease).Down a lot: significant decrease in income inequality (more than 12 per cent decrease).No comparable data is available for countries not included.The results are based on the values of the Gini coefficient for all countries in three reference years which may varyamong countries. For Hungary the period refers to 1991-1997.Source: OECD questionnaire on distribution of household incomes (2000).
Down a lot
Down Down a bit No change Up a bit Up Up a lot
Mid-1970s to mid-1990s
Greece CanadaFinland
JapanMexicoSweden
Australia NetherlandsUnited States
United Kingdom
Mid-1970s to mid-1980s
Greece Finland CanadaJapanMexicoSweden
Netherlands AustraliaUnited States
United Kingdom
Mid-1980s to mid-1990s
AustraliaDenmarkHungaryIreland
AustriaCanadaFranceGreeceUnited States
BelgiumGermanyJapanMexicoSweden
FinlandNetherlandsNorwayUnited Kingdom
ItalyTurkey
publi.sgml.compo.fm Page 9 Friday, August 2, 2002 8:31 AM

OECD Economic Studies No. 34, 2002/I
10
© OECD 2002
remained stable in the remaining three. In five of the ten countries, movements inthe first decade (declines in Finland, Japan, Mexico and Sweden; increase inAustralia) tended to be offset by opposite movements in the second. However,there are signs of a more general trend across OECD countries in more recent
Box. The definition of income
The income concept used in this paper is that of equivalent disposable householdincome per individual. The income unit is the household, defined as a group of per-sons sharing a set of common resources. Incomes are recorded on an annual basisand all possible types of cash income have been grouped into four categories:
i) Gross earnings: the salary income of the household from dependentemployment (excluding employers’ contributions to social security, butincluding sick pay paid by social security).
ii) Gross capital and self-employment incomes: financial gains, real estaterents, occupational pensions and all kinds of private transfers as well asself-employment incomes (but not including imputed income from owneroccupation).
iii) Social security transfers: all kinds of cash transfers from public sources.
iv) Taxes: direct income taxes and employee social security contributionspaid by households.
Household disposable income is defined as total market income (i + ii) plus transfers fromgeneral government (iii), less income taxes and social security contributions (iv).
The analysis has been conducted for individuals rather than households andtheir personal income has been defined as equivalent disposable income andcalculated as follows: First, the sum of the disposable incomes of all householdmembers equals household disposable income. Household disposable incomethen is adjusted for differences in household size to obtain equivalent household dis-posable income. This adjustment recognises some “economies of scale” of consump-tion within the household. In particular, household disposable income is dividedby the square-root of the number of persons in the household: for example, theequivalent income of a four-person household is household income divided bytwo. (This is usually referred to as “equivalence-scale elasticity” of 0.5. A higherelasticity value assumes less economies of scale in consumption, until theelasticity value of 1.0 which assumes no economies of scale.) Third, equivalenthousehold income is attributed equally to all individuals in the household, eventhough the incomes they receive as individuals may be different. Children andspouses are assumed to benefit equally from household income. Finally, individ-uals are ranked by the (ascending) levels of their equivalent disposable income(Atkinson, et al., 1995).
publi.sgml.compo.fm Page 10 Friday, August 2, 2002 8:31 AM

Income Distribution and Poverty in the OECD Area: Trends and Driving Forces
11
© OECD 2002
times. According to the Gini coefficient, from the mid-1980s to the mid-1990s3
inequalities decreased only slightly in four of the 20 countries for which trend dataare available, remained stable in another five, but increased in the other11 countries, in half of them by considerable amounts.
Different measures of inequality can give different results, and a careful read-ing of the table in the Annex shows that during the mid-1980s to the mid-1990s,inequality among the entire population increased unambiguously – i.e. fourdifferent indicators of inequality pointed to a rise – in just eight of the 20 countriesfor which multiple trend data are available. In all other countries, inequalityindicators moved in different directions. This implies that in no country an unam-biguous trend towards greater income equality was recorded (see annex). Ofcourse, real incomes have grown in most countries. In 15 of the 21 countriesconsidered, the mean income of each decile in the most recent year lies abovethat for earlier years. In other words, the bottom 10 per cent in the mid-1990s arebetter off on average than the bottom 10 per cent in the mid-1980s; the second10 per cent in the mid-1990s have higher average incomes than their counterpartsin the mid-1980s, and so on up the income distribution. There are relatively fewexceptions – Australia, Canada, Italy, Norway and Turkey and, in particular,Hungary.4 This does not mean that all parts of the income distribution gained inoverall prosperity to the same extent. In particular, the general pattern has beenthat the three lower deciles did not share in overall growth to the same extent ashigher decile groups. In Germany, Greece, Mexico, the Netherlands, theUnited Kingdom and the United States, the average incomes of the bottomdeciles were just about the same in the mid-1990s as they had been in themid-1980s. A more significant increase of real mean incomes for the lower threeincome deciles (15 per cent or more) took place in Austria, Belgium, Denmark,France, Ireland and Japan.
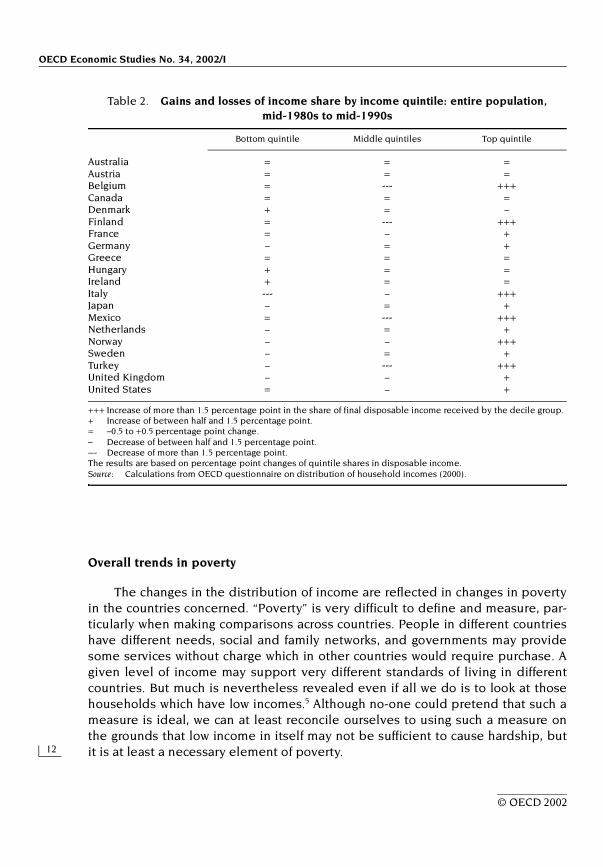
Changes in aggregate inequality can hide other trends. If, for instance, groupsin the middle deciles lose ground whilst both bottom and top incomes increasetheir shares, one can speak of a “hollowing out” of the distribution. Table 2 showsthat this was generally not the case during the past decade, with a “hollowing out”occurring only in Belgium and, very marginally, in France and the United States. Awidening of the income distribution could happen if the poor become relativelypoorer; the rich have relatively more; or a combination of the two. Table 2suggests that the second of these possibilities has predominated: there has beena trend for those at the top of the income distribution to receive a greater propor-tion of household income. In 13 of the 20 countries the top income quintile nowhas a greater proportion of household income than in the mid-1980s, substantiallyso in Belgium, Finland, Italy, Mexico, Norway and Turkey. Persons at the bottom ofthe income ladder lost ground relative to the average in eight countries, theselosses being largest in Italy.
publi.sgml.compo.fm Page 11 Friday, August 2, 2002 8:31 AM
OECD Economic Studies No. 34, 2002/I
12
© OECD 2002
Overall trends in poverty
The changes in the distribution of income are reflected in changes in povertyin the countries concerned. “Poverty” is very difficult to define and measure, par-ticularly when making comparisons across countries. People in different countrieshave different needs, social and family networks, and governments may providesome services without charge which in other countries would require purchase. Agiven level of income may support very different standards of living in differentcountries. But much is nevertheless revealed even if all we do is to look at thosehouseholds which have low incomes.5 Although no-one could pretend that such ameasure is ideal, we can at least reconcile ourselves to using such a measure onthe grounds that low income in itself may not be sufficient to cause hardship, butit is at least a necessary element of poverty.
Table 2. Gains and losses of income share by income quintile: entire population, mid-1980s to mid-1990s
+++ Increase of more than 1.5 percentage point in the share of final disposable income received by the decile group.+ Increase of between half and 1.5 percentage point.= –0.5 to +0.5 percentage point change.– Decrease of between half and 1.5 percentage point.--- Decrease of more than 1.5 percentage point.The results are based on percentage point changes of quintile shares in disposable income.Source: Calculations from OECD questionnaire on distribution of household incomes (2000).
Bottom quintile Middle quintiles Top quintile
Australia = = =Austria = = =Belgium = --- +++Canada = = =Denmark + = –Finland = --- +++France = – +Germany – = +Greece = = =Hungary + = =Ireland + = =Italy --- – +++Japan – = +Mexico = --- +++Netherlands – = +Norway – – +++Sweden – = +Turkey – --- +++United Kingdom – – +United States = – +
publi.sgml.compo.fm Page 12 Friday, August 2, 2002 8:31 AM
Income Distribution and Poverty in the OECD Area: Trends and Driving Forces
13
© OECD 2002
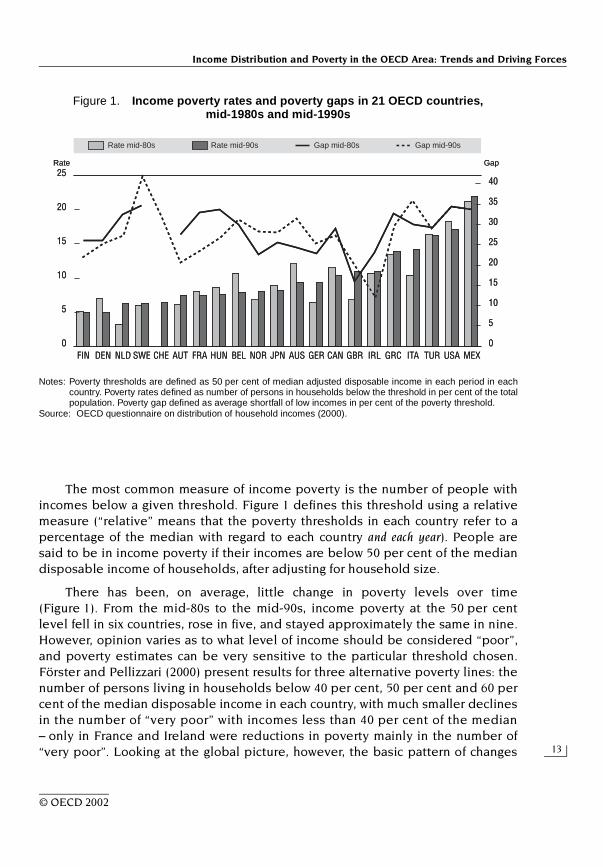
The most common measure of income poverty is the number of people withincomes below a given threshold. Figure 1 defines this threshold using a relativemeasure (“relative” means that the poverty thresholds in each country refer to apercentage of the median with regard to each country and each year). People aresaid to be in income poverty if their incomes are below 50 per cent of the mediandisposable income of households, after adjusting for household size.
There has been, on average, little change in poverty levels over time(Figure 1). From the mid-80s to the mid-90s, income poverty at the 50 per centlevel fell in six countries, rose in five, and stayed approximately the same in nine.However, opinion varies as to what level of income should be considered “poor”,and poverty estimates can be very sensitive to the particular threshold chosen.Förster and Pellizzari (2000) present results for three alternative poverty lines: thenumber of persons living in households below 40 per cent, 50 per cent and 60 percent of the median disposable income in each country, with much smaller declinesin the number of “very poor” with incomes less than 40 per cent of the median– only in France and Ireland were reductions in poverty mainly in the number of“very poor”. Looking at the global picture, however, the basic pattern of changes
Figure 1. Income poverty rates and poverty gaps in 21 OECD countries, mid-1980s and mid-1990s
Notes: Poverty thresholds are defined as 50 per cent of median adjusted disposable income in each period in eachcountry. Poverty rates defined as number of persons in households below the threshold in per cent of the totalpopulation. Poverty gap defined as average shortfall of low incomes in per cent of the poverty threshold.
Source: OECD questionnaire on distribution of household incomes (2000).
25
20
15
10
5
0FIN DEN NLD SWE CHE AUT FRA HUN BEL NOR JPN AUS GER CAN GBR IRL GRC ITA TUR USA MEX
Gap mid-80s Gap mid-90sRate mid-90sRate mid-80s
40
35
30
25
20
15
10
5
0
Rate Gap25
20
15
10
5
0FIN DEN NLD SWE CHE AUT FRA HUN BEL NOR JPN AUS GER CAN GBR IRL GRC ITA TUR USA MEX
Gap mid-80s Gap mid-90sRate mid-90sRate mid-80s
40
35
30
25
20
15
10
5
0
Rate Gap
publi.sgml.compo.fm Page 13 Friday, August 2, 2002 8:31 AM
OECD Economic Studies No. 34, 2002/I
14
© OECD 2002
shown in the table is not misleading: falls in poverty at the 50 per cent level areusually accompanied by falls in poverty at both the 40 per cent and 60 per centlevel [exceptions being Ireland and the United States, where reductions in thenumber of “very poor” have taken place at the same time as the number of thosebelow the 60 per cent threshold stayed constant (the United States) or evenincreased (Ireland)].
The number of people with a low income is only one way of measuring poverty. Itsays nothing as to the average income level of the poor which could be very close orfar beyond a given threshold. Another relevant measure is therefore the intensity ofpoverty – the income gap ratio – which measures how far below the poverty line isthe average poor person, in per cent of the poverty line. This is shown in the lines inFigure 1. On average across 21 OECD countries, the incomes of the poor are some28 per cent below the poverty threshold of 50 per cent of the median in themid-1990s, with lower ratios in Austria, Finland, the United Kingdom and, in parti-cular, Ireland and higher ratios in Italy, Mexico, Sweden and the United States. Ingeneral, income gap ratios have followed the movements of the poverty head-countrates. This means that in countries in which the proportion of the poor in the popu-lation decreased, the average income as a proportion of the poverty line of theremaining poor decreased, and vice versa. A few exceptions are noteworthy: inAustralia and, to a lesser extent, Belgium and the United States, the income gapwidened although poverty rates fell (in other words, fewer people are “poor”, butthose who remain have particularly low incomes) and in Austria and theNetherlands, the inverse was the case. Apart from Australia, poverty intensityincreased significantly in Italy, Norway and Sweden. On the other hand, a largereduction of the income gap ratio occurred in Ireland.
These poverty estimates refer to percentages of the median income in eachof the years considered. Of course, in many countries there have been largeincreases in average incomes (and in a few others, average household incomeshave fallen). Because in most countries incomes have been increasing, povertyrates compared with a fixed level of income have generally fallen. Poverty belowconstant thresholds – i.e. fixed in real terms at the beginning of the period –increased from the mid-1980s to the mid-1990s in only a few countries (Hungary,Italy and Turkey – in Hungary and Turkey, because real mean incomes fell over theperiod). The most striking case is Hungary: against the background of a deeprecession at the beginning of the transition restructuring (1990 to 1993/94), realmedian income and, hence, the relative poverty threshold fell by one-third. As aconsequence, relative poverty rates remained broadly stable while poverty ratesunder a constant threshold tripled. In all other countries, real incomes increasedover the period and poverty below constant thresholds stayed the same or fell,particularly so in Finland and Greece (between the mid-1970s and the mid-1980s)and Ireland (from the mid-1980s onwards).
publi.sgml.compo.fm Page 14 Friday, August 2, 2002 8:31 AM
Income Distribution and Poverty in the OECD Area: Trends and Driving Forces
15
© OECD 2002
The trouble with comparing “how many people are poor and to what extent”in different years is that we are not comparing the same people. These resultshave to be put in the context of income dynamics. Talk of there being fewerpeople in poverty in the mid-1990s compared with the mid-1980s implies that afew of those who were poor have clawed their way above the threshold. In fact, ofcourse, it is perfectly possible that none of those who were poor in the mid-1980sremained so ten years later, because as people’s circumstances change, so theymove up and down the income distribution. To some extent, comparisons of“head-counts” of low incomes at a point in time depersonalises the concept ofpoverty. Poverty is, however, a very personal state, and the amount of time thatpeople spend below an income threshold is very important in determining livingstandards.
Low income head-counts both massively underestimate and at the same timeoverestimate the problem of poverty. Oxley et al. (2000) and OECD (2001) take thesame concept of low incomes – 50 per cent of median household income afteradjusting for family size – and follow the same people over a period of six years, ormore for a restricted sample of countries. These studies show that:
• On average, at any moment in time, between 6 and 20 per cent of the popu-lation in the countries considered have low incomes.
• A larger part of the population than suggested by “static” poverty rates istouched by income poverty over a six-year period, namely between 12 and40 per cent.
• Only around 1-2 per cent of the population is continuously poor throughoutthe six years in Canada, Germany, the Netherlands and Sweden. The pro-portion in the United Kingdom and the United States is significantly higher.
• This means that between 2/3 (in the United States and the United Kingdom)and 6/7 (in the Netherlands) of all those who have low incomes at any point intime, will not be poor at some other time in the six years.
• Even in Sweden, nearly 12 per cent of the population will have low incomesat some point during the six years. In the United Kingdom, this ratioreaches nearly 40 per cent of the sample.
• Persistent poverty is closely associated with the lack of earned income.
“Winners” and “losers” of relative income changes
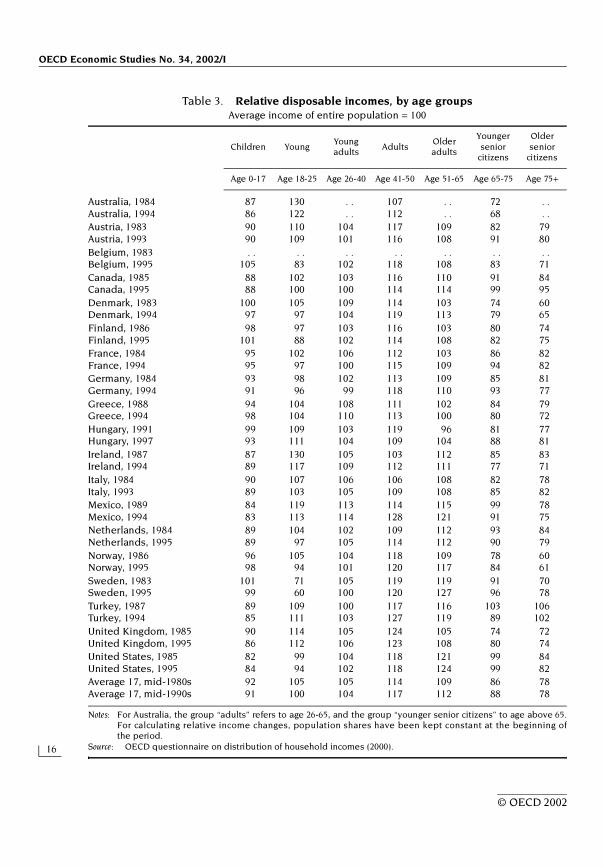
The classical life-cycle pattern would predict that income increases whenindividuals enter working life; continues to rise as individuals gain experience inthe labour market and accumulate capital assets and declines when moving intoretirement. Broadly speaking, this is indeed the pattern found in most countries.Table 3 shows that children are, on average, a little under 10 per cent poorer than
publi.sgml.compo.fm Page 15 Friday, August 2, 2002 8:31 AM
OECD Economic Studies No. 34, 2002/I
16
© OECD 2002
Table 3. Relative disposable incomes, by age groupsAverage income of entire population = 100
Notes: For Australia, the group “adults” refers to age 26-65, and the group “younger senior citizens” to age above 65.For calculating relative income changes, population shares have been kept constant at the beginning ofthe period.
Source: OECD questionnaire on distribution of household incomes (2000).
Children YoungYoung adults
AdultsOlder adults
Younger senior
citizens
Older senior
citizens
Age 0-17 Age 18-25 Age 26-40 Age 41-50 Age 51-65 Age 65-75 Age 75+
Australia, 1984 87 130 . . 107 . . 72 . .Australia, 1994 86 122 . . 112 . . 68 . .Austria, 1983 90 110 104 117 109 82 79Austria, 1993 90 109 101 116 108 91 80Belgium, 1983 . . . . . . . . . . . . . .Belgium, 1995 105 83 102 118 108 83 71Canada, 1985 88 102 103 116 110 91 84Canada, 1995 88 100 100 114 114 99 95Denmark, 1983 100 105 109 114 103 74 60Denmark, 1994 97 97 104 119 113 79 65Finland, 1986 98 97 103 116 103 80 74Finland, 1995 101 88 102 114 108 82 75France, 1984 95 102 106 112 103 86 82France, 1994 95 97 100 115 109 94 82Germany, 1984 93 98 102 113 109 85 81Germany, 1994 91 96 99 118 110 93 77Greece, 1988 94 104 108 111 102 84 79Greece, 1994 98 104 110 113 100 80 72Hungary, 1991 99 109 103 119 96 81 77Hungary, 1997 93 111 104 109 104 88 81Ireland, 1987 87 130 105 103 112 85 83Ireland, 1994 89 117 109 112 111 77 71Italy, 1984 90 107 106 106 108 82 78Italy, 1993 89 103 105 109 108 85 82Mexico, 1989 84 119 113 114 115 99 78Mexico, 1994 83 113 114 128 121 91 75Netherlands, 1984 89 104 102 109 112 93 84Netherlands, 1995 89 97 105 114 112 90 79Norway, 1986 96 105 104 118 109 78 60Norway, 1995 98 94 101 120 117 84 61Sweden, 1983 101 71 105 119 119 91 70Sweden, 1995 99 60 100 120 127 96 78Turkey, 1987 89 109 100 117 116 103 106Turkey, 1994 85 111 103 127 119 89 102United Kingdom, 1985 90 114 105 124 105 74 72United Kingdom, 1995 86 112 106 123 108 80 74United States, 1985 82 99 104 118 121 99 84United States, 1995 84 94 102 118 124 99 82Average 17, mid-1980s 92 105 105 114 109 86 78Average 17, mid-1990s 91 100 104 117 112 88 78
publi.sgml.compo.fm Page 16 Friday, August 2, 2002 8:31 AM

Income Distribution and Poverty in the OECD Area: Trends and Driving Forces
17
© OECD 2002
the population average. The richest age group are individuals aged 41 to 50 (andindeed this is true within every country, other than the United States andSweden). Beyond 65, average incomes are 10 per cent below the populationaverage, falling to 20 per cent below average for those aged over 75.
However, the changes in this distribution have been significant. In nearly allcountries people aged 41-50 have seen an increase in incomes relative to theaverage of all age groups between the mid-1980s and mid-1990s. Even more strik-ingly, in most countries, elderly age groups also benefited from changes in theincome distribution, in particular those just before or just after retirement: relativeincomes of those aged 51 to 65 increased by 3 percentage points on average, andrelative incomes of those aged 66 to 74 increased 2 percentage points (falls inincomes beyond the age of 65 being found in Australia, Greece, Ireland, Mexico,the Netherlands and Turkey). However, relative incomes of those aged 75 andover increased by less, if at all.
In stark contrast, younger age groups lost ground during the past ten years:relative incomes of children decreased by approximately 1 percentage point, onaverage, and those of persons aged 18 to 25 by 5 percentage points. This latterdevelopment is linked to delayed labour market entry of younger people due tolonger education periods and/or unemployment.
There are large differences in standards of living across different familytypes. Persons living in households with only one adult generally have lower rel-ative incomes than those living in households with two or more adults (Table 4).The gap between the incomes of the two types of households has not becomesmaller over time. Lone parents have – by far – the lowest relative incomes, usu-ally between half to two-thirds the level of the average income of the entireworking-age population. Only in three Nordic countries, Austria and Greece didthey have relative incomes above two-thirds of the average. Their income posi-tion relative to the rest of the population has declined in recent years in half thecountries. Relative incomes of persons living in two-adult households with chil-dren did not move very much (except in Austria and Greece where theyincreased and in Mexico where they decreased). Those living in two or moreadult households without children improved their income position in six coun-tries, particularly in Mexico but lost ground in another four countries, particularlyin Austria.
These patterns in the distribution of income are replicated to some extentwhen looking at poverty rates. Taking the average of all countries, people agedunder 25 and over 65 have higher than average poverty rates. The only two coun-tries in which poverty rates of all ages increased were the Netherlands and theUnited Kingdom, and relative poverty declined across all age groups in Australia.Elsewhere, the age profile of poverty has shifted. Overall, whereas the probability
publi.sgml.compo.fm Page 17 Friday, August 2, 2002 8:31 AM

OECD Economic Studies No. 34, 2002/I
18
© OECD 2002
Table 4. Relative disposable incomes, by family typesAverage income of working-age population = 100
Notes: Two adults refer to two and more adults. For calculating relative income changes, population shares have beenkept constant at the beginning of the period.
Source: OECD questionnaire on distribution of household incomes (2000).
Single adult, with children
Single adult, no children
Two adults, with children
Two adults, no children
Australia, 1984 53 99 92 131Australia, 1994 57 92 93 129
Austria, 1983 63 93 95 121Austria, 1993 87 85 98 110
Belgium, 1995 69 126 85 125
Canada, 1985 50 90 94 121Canada, 1995 57 85 94 120
Denmark, 1983 61 77 101 113Denmark, 1994 59 75 100 115
Finland, 1986 75 75 100 113Finland, 1995 76 75 100 112
France, 1984 73 95 96 113France, 1994 66 94 97 113
Germany, 1984 55 87 95 113Germany, 1994 57 90 95 112
Greece, 1988 68 104 95 112Greece, 1994 82 98 97 107
Italy, 1984 57 97 91 118Italy, 1993 52 93 91 118
Mexico, 1989 75 133 87 151Mexico, 1994 62 124 85 161
Netherlands, 1984 60 90 92 121Netherlands, 1995 55 80 93 123
Norway, 1986 65 81 99 115Norway, 1995 67 73 99 117
Sweden, 1983 76 77 101 126Sweden, 1995 72 74 101 131
Turkey, 1994 65 107 91 169
United Kingdom, 1985 59 87 94 124United Kingdom, 1995 51 92 93 127
United States, 1985 46 100 92 130United States, 1995 49 99 93 127
Average 15, mid-1980s 62 92 95 122Average 15, mid-1990s 63 89 95 121
publi.sgml.compo.fm Page 18 Friday, August 2, 2002 8:31 AM
Income Distribution and Poverty in the OECD Area: Trends and Driving Forces
19
© OECD 2002
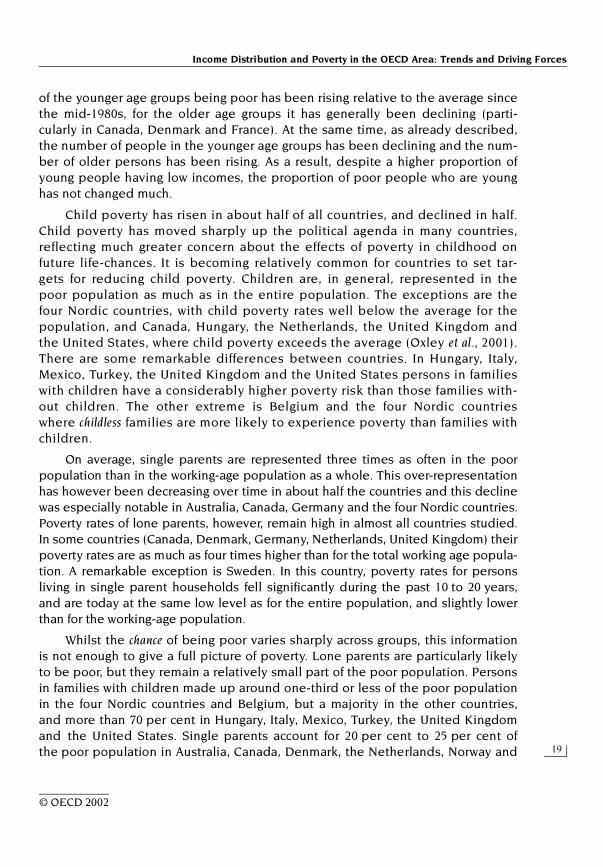
of the younger age groups being poor has been rising relative to the average sincethe mid-1980s, for the older age groups it has generally been declining (parti-cularly in Canada, Denmark and France). At the same time, as already described,the number of people in the younger age groups has been declining and the num-ber of older persons has been rising. As a result, despite a higher proportion ofyoung people having low incomes, the proportion of poor people who are younghas not changed much.
Child poverty has risen in about half of all countries, and declined in half.Child poverty has moved sharply up the political agenda in many countries,reflecting much greater concern about the effects of poverty in childhood onfuture life-chances. It is becoming relatively common for countries to set tar-gets for reducing child poverty. Children are, in general, represented in thepoor population as much as in the entire population. The exceptions are thefour Nordic countries, with child poverty rates well below the average for thepopulation, and Canada, Hungary, the Netherlands, the United Kingdom andthe United States, where child poverty exceeds the average (Oxley et al., 2001).There are some remarkable differences between countries. In Hungary, Italy,Mexico, Turkey, the United Kingdom and the United States persons in familieswith children have a considerably higher poverty risk than those families with-out children. The other extreme is Belgium and the four Nordic countrieswhere childless families are more likely to experience poverty than families withchildren.
On average, single parents are represented three times as often in the poorpopulation than in the working-age population as a whole. This over-representationhas however been decreasing over time in about half the countries and this declinewas especially notable in Australia, Canada, Germany and the four Nordic countries.Poverty rates of lone parents, however, remain high in almost all countries studied.In some countries (Canada, Denmark, Germany, Netherlands, United Kingdom) theirpoverty rates are as much as four times higher than for the total working age popula-tion. A remarkable exception is Sweden. In this country, poverty rates for personsliving in single parent households fell significantly during the past 10 to 20 years,and are today at the same low level as for the entire population, and slightly lowerthan for the working-age population.
Whilst the chance of being poor varies sharply across groups, this informationis not enough to give a full picture of poverty. Lone parents are particularly likelyto be poor, but they remain a relatively small part of the poor population. Personsin families with children made up around one-third or less of the poor populationin the four Nordic countries and Belgium, but a majority in the other countries,and more than 70 per cent in Hungary, Italy, Mexico, Turkey, the United Kingdomand the United States. Single parents account for 20 per cent to 25 per cent ofthe poor population in Australia, Canada, Denmark, the Netherlands, Norway and
publi.sgml.compo.fm Page 19 Friday, August 2, 2002 8:31 AM

OECD Economic Studies No. 34, 2002/I
20
© OECD 2002
the United States, and over one-third of those with low incomes in theUnited Kingdom. On the other hand their share is below 5 per cent in Greece, Italyand Mexico and negligible in Turkey.
DRIVING FACTORS OF CHANGING INCOME DISTRIBUTIONS
The distribution of income and the level of poverty can best be understoodas being determined by two factors: differences in market income and the redis-tributive impact of fiscal and social policy. In policy discussions, most attention isgiven to the effects of taxes and transfers, i.e. how much governments take fromone group and give to another. This is indeed of great importance, and there arelarge differences in the extent of this redistribution of income across countries.However, before looking at how government redistributes income, it is importantto understand why it is that some groups have little income other than incometransfers, and why others have sufficient incomes for governments to tax them forredistribution.
The analysis in the following two sections is confined to the working-age pop-ulation, in order to abstract from changes that took place in shares of public andprivate pensions.6 These sections explore the extent to which shifts in compo-nents of disposable income (market income, transfers and taxes) and trends inemployment concentration within and across households contributed to changesin income inequality. What is particularly interesting is that whereas governmentshave taken different approaches to redistribution over the past ten or 20 years (insome countries redistribution has increased, in others it has not), there is acommon, underlying trend in the distribution of income before taxes and transferstowards increasing inequality.
Driving factors: I. Market incomes
Market income distribution
In many national studies, the distribution of market income has beendescribed as widening, and gross earnings have been identified as the maincontributor to increased overall income inequality. Table 5 confirms this picture. Itshows the allocation market income and its two components – gross earnings andcapital/self-employment income – across three income groups: the bottom threedeciles (“lower incomes”), the four middle deciles (“middle incomes”), and thetop three deciles (“higher incomes”). The shares of earnings and other marketincomes going to the lower incomes are small: the poorest 30 per cent of thepopulation receive between 6 and 12 per cent of total market income in mostcountries. While it should not be surprising that very few people in the bottom
publi.sgml.compo.fm Page 20 Friday, August 2, 2002 8:31 AM

Income Distribution and Poverty in the OECD Area: Trends and Driving Forces
21
© OECD 2002
deciles have much income from capital, it is striking that nearly one-third of theworking-age population has so little income from labour. This suggests thatbarriers to working play a critical role in explaining low incomes, a linkage that isexamined in greater detail below. In contrast, the richest 30 per cent of the popu-lation have something between 50 per cent and 60 per cent of all market income,the exceptions being Mexico and Turkey, where the richer part of the populationcommands an even greater share of market income.
Furthermore, the trend has been for the top 30 per cent of the population toreceive an ever larger proportion of capital and labour income, the only exceptionbeing Ireland. At the same time, those with incomes at the bottom of the distribu-tion have seen a relative decline in market income in all countries; and those in
Table 5. Distribution of market income: proportion of different sources of income received by different income groups of the working-age population
Notes: Data for Greece, Hungary, Mexico and Turkey refer to market incomes net of taxes and are therefore notentirely comparable with the results from the other countries. They are excluded from the average.For calculating the average of percentage point changes, Belgium has also been excluded due to lack ofmid-1980s data. Income groups were built on the basis of final disposable adjusted income.
Source: OECD questionnaire on distribution of household incomes (2000).
Share of earnings,mid-1990s
Share of capitaland self-employment income,
mid-1990s
Share of total market income, mid-1990s
Poorest 30%
Middle 40%
Richest 30%
Poorest 30%
Middle 40%
Richest 30%
Poorest 30%
Middle 40%
Richest 30%
Australia 6.3 36.7 57.0 13.8 32.3 53.9 7.4 36.0 56.6Belgium 7.4 38.8 53.8 7.2 16.0 76.7 7.4 33.8 58.8Canada 9.2 36.7 54.1 11.2 29.3 59.5 9.6 35.5 54.9Denmark 11.1 39.0 49.9 13.5 27.3 59.2 11.4 37.8 50.8Finland 7.5 36.8 55.7 18.4 31.9 49.7 10.2 35.6 54.2France 10.7 35.7 53.6 12.1 20.8 67.1 10.9 33.5 55.6Germany 12.2 37.4 50.4 9.2 28.3 62.5 11.9 36.3 51.8Greece 9.6 36.7 53.6 14.2 31.4 54.4 11.7 34.3 54.0Hungary 8.5 34.0 57.5 8.8 22.6 68.6 8.6 32.0 59.4Ireland 4.8 34.9 60.3 8.9 27.1 63.9 5.7 33.2 61.1Italy 10.4 37.2 52.4 5.9 20.3 73.8 9.0 31.9 59.1Mexico 5.3 24.8 69.9 9.1 22.7 68.2 6.4 24.1 69.4Netherlands 9.9 38.3 51.8 10.8 30.7 58.6 10.0 37.1 52.8Norway 11.6 41.0 47.4 8.7 21.2 70.1 11.0 37.3 51.7Sweden 8.8 37.3 53.9 16.1 30.0 53.9 9.3 36.9 53.9Turkey 12.3 35.5 52.2 6.0 18.2 75.8 8.0 23.9 68.1United Kingdom 6.9 36.3 56.7 11.3 28.6 60.0 7.8 34.9 57.4United States 8.9 35.1 56.0 9.2 26.2 64.6 8.9 33.9 57.1Average (13) 9.0 37.2 53.8 11.2 26.4 62.4 9.3 35.3 55.4Change mid-1980s
to mid-1990s –1.7 –0.5 2.2 –2.8 –0.7 3.5 –1.7 –0.6 2.3
publi.sgml.compo.fm Page 21 Friday, August 2, 2002 8:31 AM
OECD Economic Studies No. 34, 2002/I
22
© OECD 2002
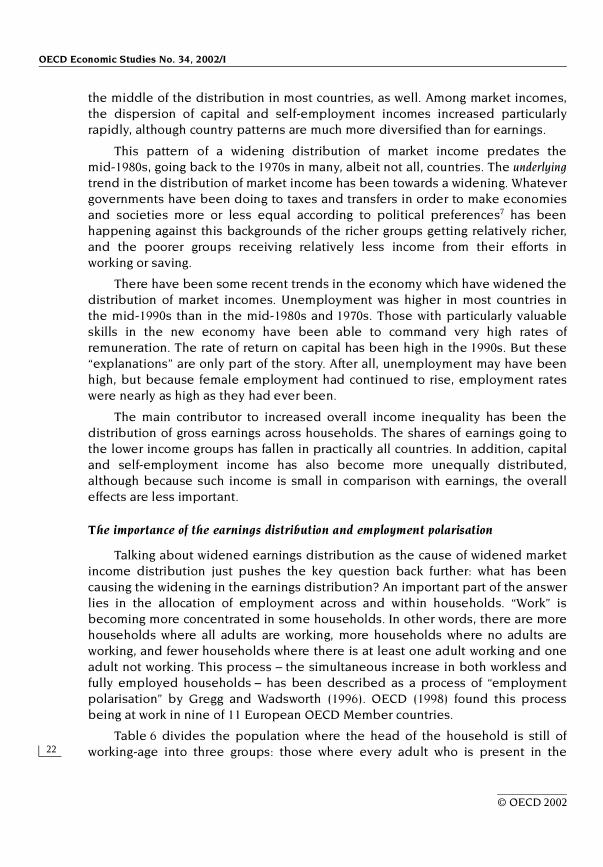
the middle of the distribution in most countries, as well. Among market incomes,the dispersion of capital and self-employment incomes increased particularlyrapidly, although country patterns are much more diversified than for earnings.
This pattern of a widening distribution of market income predates themid-1980s, going back to the 1970s in many, albeit not all, countries. The underlyingtrend in the distribution of market income has been towards a widening. Whatevergovernments have been doing to taxes and transfers in order to make economiesand societies more or less equal according to political preferences7 has beenhappening against this backgrounds of the richer groups getting relatively richer,and the poorer groups receiving relatively less income from their efforts inworking or saving.
There have been some recent trends in the economy which have widened thedistribution of market incomes. Unemployment was higher in most countries inthe mid-1990s than in the mid-1980s and 1970s. Those with particularly valuableskills in the new economy have been able to command very high rates ofremuneration. The rate of return on capital has been high in the 1990s. But these“explanations” are only part of the story. After all, unemployment may have beenhigh, but because female employment had continued to rise, employment rateswere nearly as high as they had ever been.
The main contributor to increased overall income inequality has been thedistribution of gross earnings across households. The shares of earnings going tothe lower income groups has fallen in practically all countries. In addition, capitaland self-employment income has also become more unequally distributed,although because such income is small in comparison with earnings, the overalleffects are less important.
The importance of the earnings distribution and employment polarisation
Talking about widened earnings distribution as the cause of widened marketincome distribution just pushes the key question back further: what has beencausing the widening in the earnings distribution? An important part of the answerlies in the allocation of employment across and within households. “Work” isbecoming more concentrated in some households. In other words, there are morehouseholds where all adults are working, more households where no adults areworking, and fewer households where there is at least one adult working and oneadult not working. This process – the simultaneous increase in both workless andfully employed households – has been described as a process of “employmentpolarisation” by Gregg and Wadsworth (1996). OECD (1998) found this processbeing at work in nine of 11 European OECD Member countries.
Table 6 divides the population where the head of the household is still ofworking-age into three groups: those where every adult who is present in the
publi.sgml.compo.fm Page 22 Friday, August 2, 2002 8:31 AM

Income Distribution and Poverty in the OECD Area: Trends and Driving Forces
23
© OECD 2002
household is working; those where no adult in the household is working, and“mixed” households where one adult is working and the other adult(s) is (are) not.The share of those living in households where there is full employment increasedin all but three of the 15 countries. The share of people in workless householdsalso increased in most countries, and the share of persons in “mixed” households(those with two or more adult households with only one earner) declined in all15 countries during the ten-year period. Overall, the evidence suggests thatemployment polarisation took place in ten countries. Exceptions are the Nordiccountries, where the share of persons in fully-employed households slightlydecreased and Greece and the United States, where the proportion of those inworkless households decreased.
Of course, the quantity of work across households is only part of the story. Thewage rates that people get when they work must be added to the equation in order toexplain changes in earnings distribution. Here the story varies across countries. Asdescribed in OECD (1996), there has been little common trend across countries inwage rates of those in full time work. Large increases in earnings dispersion certainly
Table 6. Changes in households’ employment concentrationPercentage point change in the distribution of working-age households
Notes: “Fully employed households” are households in which all adult persons have an employment; “worklesshouseholds” households in which no person has an employment; and “mixed households” two or more adulthouseholds with only one earner. Data refer to households with a head of working-age. Changes are percentagepoint changes.
Source: OECD questionnaire on distribution of household incomes (2000).
Population shares
Fully employed Workless “Mixed”
Australia, 1984-1994 5.2 1.7 –7.0Austria, 1983-1993 13.7 0.6 –14.4Canada, 1985-1995 1.9 1.9 –3.8Denmark, 1983-1994 –0.4 2.5 –2.0Finland, 1986-1995 –0.8 4.1 –3.3France, 1984-1994 4.1 1.1 –5.2Germany, 1984-1994 0.1 1.4 –1.5Greece, 1988-1994 8.4 –1.3 –7.1Italy, 1984-1993 0.2 4.7 –4.9Mexico, 1989-1994 5.7 0.8 –6.5Netherlands, 1984-1995 14.4 1.6 –16.1Norway, 1986-1995 2.0 4.8 –6.8Sweden, 1983-1995 –1.2 3.4 –2.2United Kingdom, 1985-1995 4.8 0.6 –5.4United States, 1985-1995 3.1 –0.6 –2.5
Average change 4.1 1.8 –5.9
Average levels mid-1990s 64.7 9.8 25.5
publi.sgml.compo.fm Page 23 Friday, August 2, 2002 8:31 AM
OECD Economic Studies No. 34, 2002/I
24
© OECD 2002
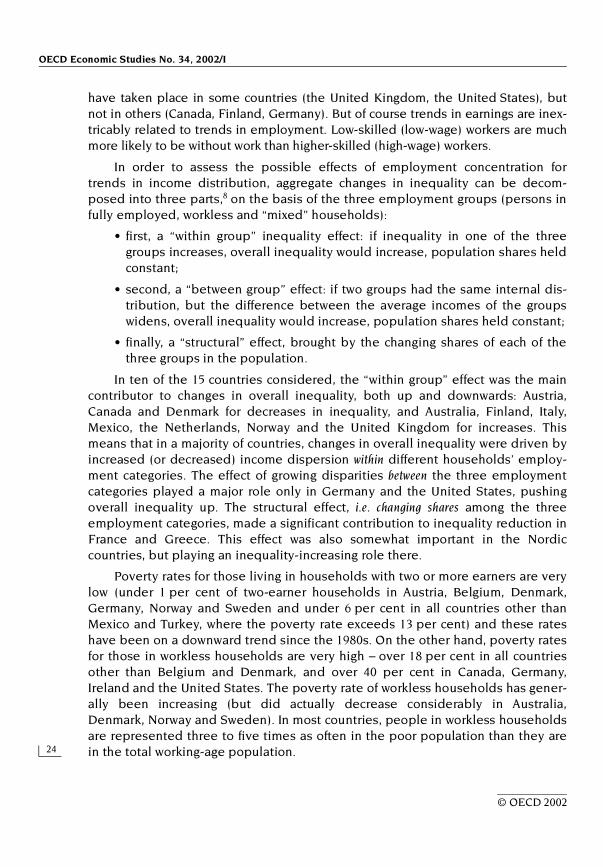
have taken place in some countries (the United Kingdom, the United States), butnot in others (Canada, Finland, Germany). But of course trends in earnings are inex-tricably related to trends in employment. Low-skilled (low-wage) workers are muchmore likely to be without work than higher-skilled (high-wage) workers.
In order to assess the possible effects of employment concentration fortrends in income distribution, aggregate changes in inequality can be decom-posed into three parts,8 on the basis of the three employment groups (persons infully employed, workless and “mixed” households):
• first, a “within group” inequality effect: if inequality in one of the threegroups increases, overall inequality would increase, population shares heldconstant;
• second, a “between group” effect: if two groups had the same internal dis-tribution, but the difference between the average incomes of the groupswidens, overall inequality would increase, population shares held constant;
• finally, a “structural” effect, brought by the changing shares of each of thethree groups in the population.
In ten of the 15 countries considered, the “within group” effect was the maincontributor to changes in overall inequality, both up and downwards: Austria,Canada and Denmark for decreases in inequality, and Australia, Finland, Italy,Mexico, the Netherlands, Norway and the United Kingdom for increases. Thismeans that in a majority of countries, changes in overall inequality were driven byincreased (or decreased) income dispersion within different households’ employ-ment categories. The effect of growing disparities between the three employmentcategories played a major role only in Germany and the United States, pushingoverall inequality up. The structural effect, i.e. changing shares among the threeemployment categories, made a significant contribution to inequality reduction inFrance and Greece. This effect was also somewhat important in the Nordiccountries, but playing an inequality-increasing role there.
Poverty rates for those living in households with two or more earners are verylow (under 1 per cent of two-earner households in Austria, Belgium, Denmark,Germany, Norway and Sweden and under 6 per cent in all countries other thanMexico and Turkey, where the poverty rate exceeds 13 per cent) and these rateshave been on a downward trend since the 1980s. On the other hand, poverty ratesfor those in workless households are very high – over 18 per cent in all countriesother than Belgium and Denmark, and over 40 per cent in Canada, Germany,Ireland and the United States. The poverty rate of workless households has gener-ally been increasing (but did actually decrease considerably in Australia,Denmark, Norway and Sweden). In most countries, people in workless householdsare represented three to five times as often in the poor population than they arein the total working-age population.
publi.sgml.compo.fm Page 24 Friday, August 2, 2002 8:31 AM

Income Distribution and Poverty in the OECD Area: Trends and Driving Forces
25
© OECD 2002
The importance of work in explaining income distribution and poverty changescan be seen as the primary cause of many changes in the relative income of parti-cular groups. Why has the position of youths declined? At least in part becauseemployment rates have declined. What explains the very low income of loneparents? The very low employment rates are often the key factor. Hence the strikingresult referred to above that lone parents in Sweden are not at greater risk ofpoverty than others in the population is explained mainly by the fact that a largemajority of Swedish single parents are working: almost nine out of ten, whereas inmost other countries the share of single parents who are working is between 50 and70 per cent. Poverty rates for single parents who do not work are very high in allcountries and, with the exception of Mexico, are at least twice as high as those forworking single parents. In Canada, Germany, Italy, the United Kingdom and theUnited States, more than 60 per cent of non-working single parents are poor.
Driving factors: II. Transfers and taxes
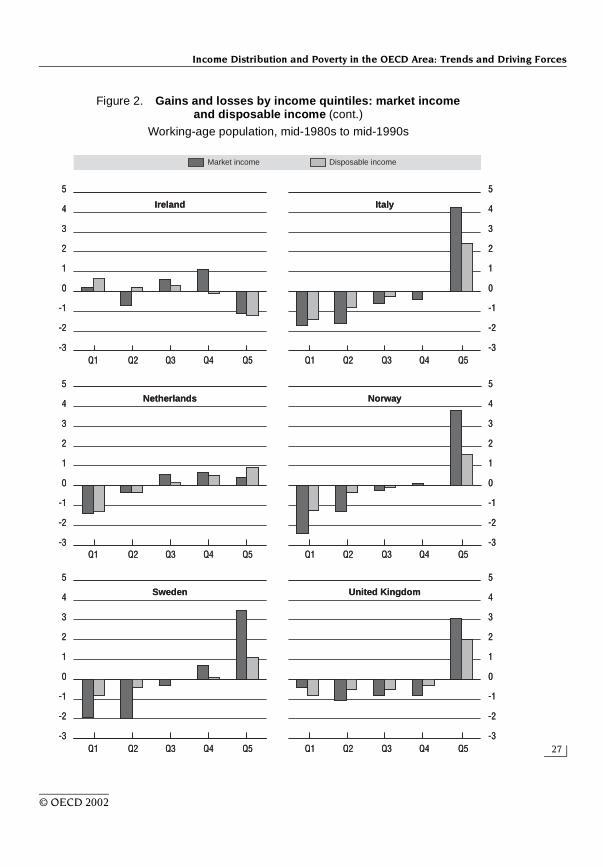
Across the income distribution, most household income is market income– income which comes from work, or from the returns to investment. However,governments tax that income and distribute cash transfers, so altering disposableincome. This is illustrated in Figure 2, which compares changes in the distributionof market incomes over the past ten years with changes in the distribution ofdisposable incomes. When juxtaposing these trends, it can be seen that in almostall countries the gains of the highest income quintile are substantially higher formarket income than for disposable income. By contrast, market income shares forthe lowest quintile (and most often for both lowest quintiles) declined substan-tially (exceptions being Ireland and, to a lesser extent, the United States). In agreat majority of countries, the workings of tax/transfer systems resulted in dispos-able household incomes falling by less than the fall in market incomes for thelower quintiles, and in four countries the falling trend of market incomes actuallywas reversed (Australia, Canada, Denmark and France). However, in Italy and theNetherlands, both market and disposable income fell by the same amount for thelowest quintile and in Germany the income losses of the lowest quintile werehigher after than before taxes and transfers.
(Re)distributive patterns of family and unemployment benefits
Benefit systems redistribute income. But they do not primarily redistributefrom rich to poor. Rather, they redistribute from young to old, from those who workto those who do not, and from childless families to families with children. In mostcountries (Australia and New Zealand being exceptions), most benefits are basednot on the income of the individual or family, but on the circumstances of the fam-ily and the individuals that make up the family more generally.
publi.sgml.compo.fm Page 25 Friday, August 2, 2002 8:31 AM

OECD Economic Studies No. 34, 2002/I
26
© OECD 2002
Figure 2. Gains and losses by income quintiles: market income and disposable income
Working-age population, mid-1980s to mid-1990s
5
1
0
-1
-3
-2
4
3
2
5
1
0
-1
-3
-2
4
3
2
5
1
0
-1
-3
-2
4
3
2
5
1
0
-1
-3
-2
4
3
2
5
1
0
-1
-3
-2
4
3
2
5
1
0
-1
-3
-2
4
3
2
Market income
Australia
Denmark
France
Canada
Finland
Germany
Q1
Disposable income
Q2 Q3 Q4 Q5 Q1 Q2 Q3 Q4 Q5
Q1 Q2 Q3 Q4 Q5 Q1 Q2 Q3 Q4 Q5
Q1 Q2 Q3 Q4 Q5 Q1 Q2 Q3 Q4 Q5
5
1
0
-1
-3
-2
4
3
2
5
1
0
-1
-3
-2
4
3
2
5
1
0
-1
-3
-2
4
3
2
5
1
0
-1
-3
-2
4
3
2
5
1
0
-1
-3
-2
4
3
2
5
1
0
-1
-3
-2
4
3
2
Market income
Australia
Denmark
France
Canada
Finland
Germany
Q1
Disposable income
Q2 Q3 Q4 Q5 Q1 Q2 Q3 Q4 Q5
Q1 Q2 Q3 Q4 Q5 Q1 Q2 Q3 Q4 Q5
Q1 Q2 Q3 Q4 Q5 Q1 Q2 Q3 Q4 Q5
publi.sgml.compo.fm Page 26 Friday, August 2, 2002 8:31 AM
Income Distribution and Poverty in the OECD Area: Trends and Driving Forces
27
© OECD 2002
Figure 2. Gains and losses by income quintiles: market income and disposable income (cont.)
Working-age population, mid-1980s to mid-1990s
5
1
0
-1
-3
-2
3
2
4
5
1
0
-1
-3
-2
3
2
4
5
1
0
-1
-3
-2
3
2
4
5
1
0
-1
-3
-2
3
2
4
5
1
0
-1
-3
-2
3
2
4
5
1
0
-1
-3
-2
3
2
4
Market income
Ireland
Netherlands
Sweden
Italy
Norway
United Kingdom
Q1
Disposable income
Q2 Q3 Q4 Q5 Q1 Q2 Q3 Q4 Q5
Q1 Q2 Q3 Q4 Q5 Q1 Q2 Q3 Q4 Q5
Q1 Q2 Q3 Q4 Q5 Q1 Q2 Q3 Q4 Q5
5
1
0
-1
-3
-2
3
2
4
5
1
0
-1
-3
-2
3
2
4
5
1
0
-1
-3
-2
3
2
4
5
1
0
-1
-3
-2
3
2
4
5
1
0
-1
-3
-2
3
2
4
5
1
0
-1
-3
-2
3
2
4
Market income
Ireland
Netherlands
Sweden
Italy
Norway
United Kingdom
Q1
Disposable income
Q2 Q3 Q4 Q5 Q1 Q2 Q3 Q4 Q5
Q1 Q2 Q3 Q4 Q5 Q1 Q2 Q3 Q4 Q5
Q1 Q2 Q3 Q4 Q5 Q1 Q2 Q3 Q4 Q5
publi.sgml.compo.fm Page 27 Friday, August 2, 2002 8:31 AM
OECD Economic Studies No. 34, 2002/I
28
© OECD 2002
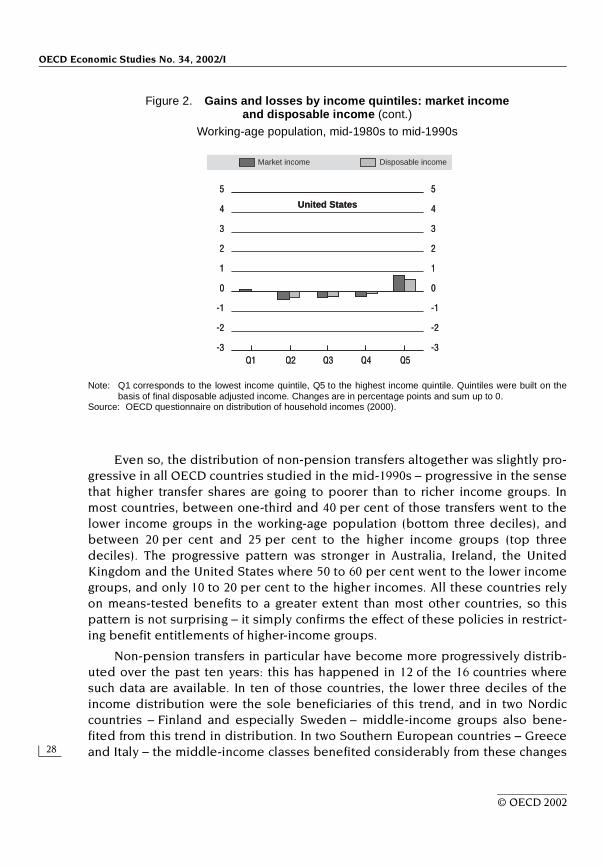
Even so, the distribution of non-pension transfers altogether was slightly pro-gressive in all OECD countries studied in the mid-1990s – progressive in the sensethat higher transfer shares are going to poorer than to richer income groups. Inmost countries, between one-third and 40 per cent of those transfers went to thelower income groups in the working-age population (bottom three deciles), andbetween 20 per cent and 25 per cent to the higher income groups (top threedeciles). The progressive pattern was stronger in Australia, Ireland, the UnitedKingdom and the United States where 50 to 60 per cent went to the lower incomegroups, and only 10 to 20 per cent to the higher incomes. All these countries relyon means-tested benefits to a greater extent than most other countries, so thispattern is not surprising – it simply confirms the effect of these policies in restrict-ing benefit entitlements of higher-income groups.
Non-pension transfers in particular have become more progressively distrib-uted over the past ten years: this has happened in 12 of the 16 countries wheresuch data are available. In ten of those countries, the lower three deciles of theincome distribution were the sole beneficiaries of this trend, and in two Nordiccountries – Finland and especially Sweden – middle-income groups also bene-fited from this trend in distribution. In two Southern European countries – Greeceand Italy – the middle-income classes benefited considerably from these changes
Figure 2. Gains and losses by income quintiles: market income and disposable income (cont.)
Working-age population, mid-1980s to mid-1990s
Note: Q1 corresponds to the lowest income quintile, Q5 to the highest income quintile. Quintiles were built on thebasis of final disposable adjusted income. Changes are in percentage points and sum up to 0.
Source: OECD questionnaire on distribution of household incomes (2000).
5
1
0
-1
-3
-2
4
3
2
5
1
0
-1
-3
-2
4
3
2
Market income Disposable income
United States
Q1 Q2 Q3 Q4 Q5
5
1
0
-1
-3
-2
4
3
2
5
1
0
-1
-3
-2
4
3
2
Market income Disposable income
United States
Q1 Q2 Q3 Q4 Q5
publi.sgml.compo.fm Page 28 Friday, August 2, 2002 8:31 AM
Income Distribution and Poverty in the OECD Area: Trends and Driving Forces
29
© OECD 2002
at the expense of both lower- and higher-income groups. Canada and, in particular,the United States stand apart. In these countries a change towards a less progres-sive distribution of non-pension transfers among the working-age populationtook place.
Förster and Pellizzari (2000) compared the distributional patterns of two ofthe most important benefits among non-pension transfers: family cash benefits,and unemployment benefits.9 For family cash benefits, two groups of countriesemerge:
• Australia, Canada, Denmark, France, Ireland, the Netherlands, theUnited Kingdom and the United States all show a progressive distributionof family cash benefits; moreover, most of these countries (the exceptionsbeing Denmark, the Netherlands and the United States) also clearly movedtowards a more progressive distribution during the last decade;
• in Austria, Belgium (data for 1995 only), Finland, Hungary, Norway andSweden in the mid-1980s, family cash benefits seemed to be distributedmore equally across the income distribution with an emphasis on themiddle class; a distributional pattern sometimes described as “targeted tothe middle classes”. However, Hungary moved towards a progressivepattern in the 1990s.
By 1995, in all countries considered except Belgium, the proportion of familybenefits going to the bottom three deciles was higher than the proportion going tothe top three income deciles. Family benefits, therefore, played a role in theredistribution of incomes to lower segments among the working-age population.
As to unemployment benefits, the country patterns are different:
• unemployment benefits show a clear progressive pattern in sevencountries: Australia, Austria, Belgium, Finland, Hungary, Ireland and theUnited Kingdom. In Hungary, they became considerably more progressivelydistributed over the years, while their distribution became somewhat lessprogressive in the United Kingdom. In Ireland, changes favoured lowermiddle and middle income groups and in Australia and Finland, no signifi-cant change occurred;
• in the remaining seven countries, unemployment benefits are almostequally distributed across income groups of the working-age population.This is particularly the case in the Netherlands. In Canada, Norway, Swedenand, to a lesser degree, Denmark, the distribution of unemployment bene-fits showed some signs of a “targeting to the middle class”. And in Franceand the United States, the distribution of these benefits moved from such apattern to a slightly regressive one.
publi.sgml.compo.fm Page 29 Friday, August 2, 2002 8:31 AM
OECD Economic Studies No. 34, 2002/I
30
© OECD 2002
Taken together, family cash benefits seemed to be a more important tool forredistributing incomes from higher to lower segments than unemployment bene-fits in Canada, Denmark, France, the Netherlands and the United States, whereasthe inverse was the case in Austria, Belgium, Finland and Hungary. In Australia,Ireland and the United Kingdom, both benefits played an important redistributiverole. Only in Norway and Sweden were both benefits more middle-income classoriented. This has to be seen against the background that, in a majority of thecountries considered here, the prime aim of those benefits is not a redistributionof incomes towards lower income groups but the maintenance of the incomestatus in case of child rearing and compensation for loss of employment, regard-less of income status.
Overall effects of tax/transfers among the working-age population
Just because a benefit system is proportional (in the sense that benefits areequally distributed across the population) does not mean that it plays no role inredistributing income. Poor households (by definition) have less other incomethan richer ones, so the higher is the level of a benefit, the greater will be thereduction in inequality, even if everyone receives exactly the same amount ofbenefit. It follows that just because a benefit system is not particularly targeted onthe poor, it cannot be concluded that the effects on poverty are necessarily small.
Table 7 summarises the distribution of all benefit payments taken together,together with tax payments and social security contributions of employees acrossthe income distribution of the working-age population. On average the bottom30 per cent of the population do get more than 30 per cent of total benefitpayments, but not by much. The top 30 per cent of the population get, on average,over 25 per cent of all benefits. In other words, the benefit system does not have avery different effect on final income inequality from paying everyone in the popu-lation a fixed amount of benefit, regardless of income level.
Of course, averages hide a lot of cross-country variation. Australia, theUnited Kingdom, the Netherlands, Ireland and some of the Nordic countries targetpayments towards the poorer end of the distribution to a much greater extentthan Austria, Hungary, Italy and Greece, where the poorest 30 per cent of the pop-ulation receive less than 30 per cent of all benefit payments. In Turkey andMexico, benefits are even more likely to be targeted towards richer groups,reflecting “dual” labour markets – individuals have to be in the “modern” sectorsof the economy to qualify for social insurance.
Taxes, on the other hand, are very strongly related to income. Of course, thisis not the full story as regards taxes – the figures in the table exclude consumptiontaxes and social security contributions paid by employers, both of which bearmuch more heavily on lower income groups than the personal income taxes and
publi.sgml.compo.fm Page 30 Friday, August 2, 2002 8:31 AM

Income Distribution and Poverty in the OECD Area: Trends and Driving Forces
31
© OECD 2002
Table 7. Redistribution by government: proportion of total transfers (taxes) received (paid) by different income deciles of the working-age population
Notes: General government transfers include all public cash transfer benefits. Taxes include all direct income taxes,including employees social security contributions. Income groups were built on the basis of final disposableadjusted income.
Source: OECD questionnaire on distribution of household incomes (2000).
General government transfers Taxes
Poorest 30% Middle 40% Richest 30% Poorest 30% Middle 40% Richest 30%
Panel A: Distribution of benefits received and taxes paidAustralia, 1994 62.3 31.1 6.5 3.7 31.1 65.1Austria, 1993 26.8 40.9 32.3 . . . . . .Belgium, 1995 36.0 41.6 22.5 3.9 32.6 63.5Canada, 1995 41.5 37.7 20.8 6.2 33.4 60.4Denmark, 1994 43.4 38.9 17.7 14.1 37.2 48.7Finland, 1995 43.2 40.4 16.4 9.8 33.4 56.8France, 1994 35.6 39.3 25.1 8.7 23.5 67.9Germany, 1994 31.7 37.6 30.7 10.0 36.5 53.6Greece, 1994 20.9 37.7 41.5 . . . . . .Hungary, 1997 28.7 42.8 28.5 . . . . . .Ireland, 1994 47.1 38.1 14.8 3.3 30.3 66.4Italy, 1993 20.5 45.0 34.5 6.7 31.0 62.3Mexico, 1994 13.7 27.2 59.1 . . . . . .Netherlands, 1995 45.8 36.1 18.1 11.7 36.1 52.2Norway, 1995 45.1 36.6 18.3 10.2 36.1 53.8Sweden, 1995 33.7 40.5 25.8 11.0 35.8 53.3Turkey, 1994 15.2 40.2 44.6 . . . . . .United Kingdom, 1995 54.5 33.9 11.7 6.0 32.0 62.0United States, 1995 41.4 35.5 23.0 6.3 28.4 65.3Average level 36.2 37.9 25.9 8.0 32.7 59.4
Panel B: Changes in redistribution, mid-1980s to mid-1990s, percentage pointsAustralia, 1984-1994 4.2 –0.3 –4.0 –6.6 –3.1 9.8Austria, 1983-1993 2.3 –0.3 –2.0 . . . . . .Canada, 1983-1994 –0.3 –0.6 0.9 –0.8 –0.7 1.4Denmark, 1983-1994 5.1 –1.4 –3.7 0.2 –2.2 2.0Finland, 1986-1995 2.2 1.5 –3.8 –1.1 –1.0 2.1France, 1984-1994 2.3 0.8 –3.1 –3.8 –2.3 6.1Germany, 1984-1994 –2.2 0.9 1.3 –1.1 2.9 –1.9Greece, 1988-1994 4.1 1.8 –5.9 . . . . . .Hungary, 1991-1997 –1.4 0.7 0.7 . . . . . .Ireland, 1987-1994 4.8 –2.9 –1.9 –0.5 –0.5 1.0Italy, 1984-1993 –5.4 3.3 2.1 –4.1 –1.1 5.2Mexico, 1989-1994 8.7 –0.5 –8.2 . . . . . .Netherlands, 1985-1995 5.0 –2.2 –2.8 –1.7 0.6 1.1Norway, 1986-1995 3.2 –1.3 –2.0 –2.9 –1.8 4.6Sweden, 1983-1995 1.3 0.6 –1.9 –1.3 –0.7 2.0Turkey, 1987-1994 1.2 –1.6 0.4 . . . . . .United Kingdom, 1985-1995 0.4 1.3 –1.7 –1.3 –3.7 5.0United States, 1985-1995 –2.0 –0.6 2.6 1.0 –1.4 0.4Average change 1.8 0.0 –1.7 –1.7 –1.1 2.8
publi.sgml.compo.fm Page 31 Friday, August 2, 2002 8:31 AM

OECD Economic Studies No. 34, 2002/I
32
© OECD 2002
employee social security contributions which are included. But nevertheless, it isreadily apparent that taxes have a great effect in equalising incomes acrosshouseholds.
The trend has been towards a greater share of taxation being paid by higherincome groups. This is not the same as saying that there is greater progressivity inthe tax system than previously. In fact, if compared with changes in the distribu-tion of market income, only in Australia, France, Ireland and the United Kingdomhas the share of taxes paid by the top 30 per cent gone up significantly morerapidly than market income. In the Nordic countries, the increases in taxes paid bythe upper income groups was less than the increase in their market incomes – inother words, their average tax rate fell relative to lower income groups.
The analysis above referred to the distribution of a given overall level of non-pension transfers among the working-age population. However, although a specifictransfer might be distributed more progressively in one country than in another,its weight for the lower income groups might be higher in another country becauseof a higher overall level of this transfer. An equally important question thereforeconcerns the relative importance of those transfer payments in the disposableincomes of lower, middle and higher income groups. Förster and Pellizzari (2000)analysed non-pension transfer shares in the disposable income of income groups.Those shares rose for the working-age population as a whole in the last ten years,from below 10 per cent on average, to 11.4 per cent. The increase for the lowerincome groups, however, was much stronger: it varied on average across the coun-tries from around one-quarter of their disposable income to around one-third.Those increases were recorded in all countries but were strongest in the fourNordic countries (where more than 10 percentage point increases were recorded).This underlines the growing importance of non-pension transfers for lower incomegroups of the working-age population.
Poverty alleviation through taxes and transfers
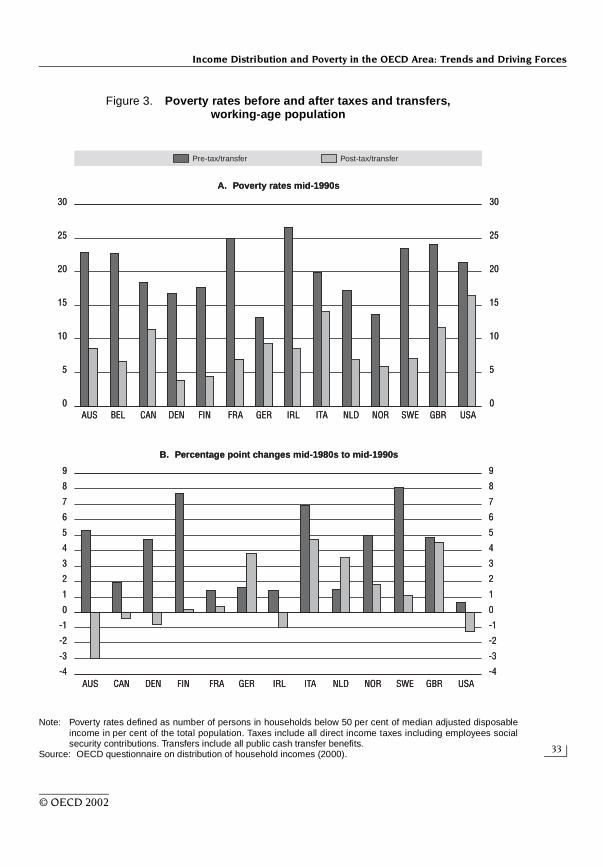
Results from earlier analysis based on a smaller sample of five OECDcountries (Burniaux et al., 1998, Oxley et al., 1999) showed that tax/transfer systemsreduced substantially aggregate poverty rates in those countries. This isconfirmed by the results from the present analysis, which are available for14 countries and which consider poverty among the working-age population.Whereas poverty rates based on pre-tax and transfer incomes amounted tobetween 14 and 26 per cent in the countries studied, post-tax and transfer rateswere considerably lower – between 4 and 17 per cent. Furthermore, this effective-ness tended to strengthen in a majority of countries as is shown in Figure 3. Whilepre-tax/transfer poverty rates rose in all countries, on average by more than3 percentage points, post-tax/transfer poverty rates fell in half the countries and
publi.sgml.compo.fm Page 32 Friday, August 2, 2002 8:31 AM
Income Distribution and Poverty in the OECD Area: Trends and Driving Forces
33
© OECD 2002
Figure 3. Poverty rates before and after taxes and transfers, working-age population
Note: Poverty rates defined as number of persons in households below 50 per cent of median adjusted disposableincome in per cent of the total population. Taxes include all direct income taxes including employees socialsecurity contributions. Transfers include all public cash transfer benefits.
Source: OECD questionnaire on distribution of household incomes (2000).
30
25
20
15
10
5
0
30
25
20
15
10
5
0
9
8
7
6
5
4
3
2
1
0
-1
-2
-3
-4
9
8
7
6
5
4
3
2
1
0
-1
-2
-3
-4
Pre-tax/transfer Post-tax/transfer
A. Poverty rates mid-1990s
B. Percentage point changes mid-1980s to mid-1990s
AUS BEL CAN DEN FIN FRA GER IRL ITA NLD NOR SWE GBR USA
AUS CAN DEN FIN FRA GER IRL ITA NLD NOR SWE GBR USA
30
25
20
15
10
5
0
30
25
20
15
10
5
0
9
8
7
6
5
4
3
2
1
0
-1
-2
-3
-4
9
8
7
6
5
4
3
2
1
0
-1
-2
-3
-4
Pre-tax/transfer Post-tax/transfer
A. Poverty rates mid-1990s
B. Percentage point changes mid-1980s to mid-1990s
AUS BEL CAN DEN FIN FRA GER IRL ITA NLD NOR SWE GBR USA
AUS CAN DEN FIN FRA GER IRL ITA NLD NOR SWE GBR USA
publi.sgml.compo.fm Page 33 Friday, August 2, 2002 8:31 AM

OECD Economic Studies No. 34, 2002/I
34
© OECD 2002
decreased by less than the pre-tax/transfer poverty rate in the others, except inGermany and the Netherlands. Absolute rates of reduction in poverty were higherin Australia, Belgium, France, Ireland and the Nordic countries (Norway excepted),and lower in Canada, Germany, Italy and the United States.
Driving factors: III. Underlying demographic changes
Putting the two pieces of the equation together – trends in market incomeand trends in government tax and transfer policy – gives most of the informationnecessary to understand the overall picture of income distribution. One last pieceof the jigsaw puzzle remains to be inserted: changes in the demographic structureof the population.
There are considerable differences between countries and country groups asto the levels of these shares: in the Nordic and the Continental European countries,children are 20 per cent of the population; in the Anglo-Saxon countries, theyaccount for around 25 per cent, and in Mexico and Turkey the share of children inthe population is much higher, around 40 per cent.
At the same time, there have been very large changes in the structure ofpopulations in OECD countries. In nearly all countries, the proportion of chil-dren in the total population decreased from the mid-1980s to the mid-1990s,on average by some 2 percentage points.10 Similarly, the share of young peo-ple – those aged 18 to 25 – fell in most countries, on average by 1 percentagepoint. On the other hand, the proportion of persons aged 65 and overincreased in all countries but Sweden, on average by over 1 percentage point(Förster and Pearson, 2000).
The changes do not stop there. The fewer children are much more likely to bein households where there is only one adult – the proportion of lone parent fami-lies has been increasing. In the Anglo-Saxon countries and the Nordic countries,between 10 and 20 per cent of those households with children live in lone parenthouseholds. In the Continental European countries their share is just below 10 percent, and in the Southern European countries, Turkey and Mexico, below 5 percent. The proportion of children who are in lone parent households rather thanhouseholds with two or more adults has also been rising, and is around 25 percent of the total in Sweden. Within the working-age population, fewer people livein households without children than in households with children, but their shareincreased from one-third to almost 40 per cent in the ten years from the mid-80sto the mid-90s.
Furthermore, mainly as a consequence of population ageing (but also reflect-ing an increased preference for living alone among younger age groups), theaverage household size has also been falling for the last ten to 20 years through-out the OECD area, and is close to being just two people in some of the Nordic
publi.sgml.compo.fm Page 34 Friday, August 2, 2002 8:31 AM

Income Distribution and Poverty in the OECD Area: Trends and Driving Forces
35
© OECD 2002
and Continental European countries. The average household size is closer tothree in the Southern European countries and still above four in Mexico andTurkey.
Such changes may not sound very significant. In fact, taken together theyamount to a huge change in the structure of the population, in many countries to anextent unprecedented in recent times outside of war, famine or epidemic. Here, it isworth noting simply that these demographic trends directly affect trends in inequal-ity. If older people have less income than younger people, then as there are more ofthem in the population, so income distribution will apparently widen. Similarly, ifsmall households are poorer than large ones, so will the trends described abovelead to a stretching out of the income distribution, regardless of whether theaverage income of small households is changing relative to larger ones.
CONCLUSIONS: 12 STYLISED FACTS ON TRENDS IN INCOME INEQUALITY AND POVERTY
Overall distributional trends and movements at the bottom
i) There has been no generalised long-term trend in the distribution of dis-posable household incomes since the mid-1970s. However, during themore recent period (mid-1980s to mid-1990s), income inequality hasincreased in at least half the countries, while none of the remaining coun-tries recorded an unambiguous decrease in inequality.
ii) There is no trend towards a “hollowing out” of the income distribution atthe expense of the middle-income class. Simultaneous gains of both thelower and higher incomes relative to the middle incomes occurred in onlya few countries (Belgium and, marginally, France and the United Statesduring the past decade, and Canada and Finland over the last 20 years).
iii) Relative poverty rates have remained broadly stable over the last tenyears. Some countries have, however, experienced declines (in particularBelgium and Denmark) and some others increases (in particular Italy andthe United Kingdom). Poverty rates based on constant thresholds fell inmost of the countries in which real incomes increased.
Changes in relative positions of specific social groups
iv) In those countries where inequalities increased, this happened mostlyamong the working-age population, whilst there were fewer changes amongthe retirement-age population.
publi.sgml.compo.fm Page 35 Friday, August 2, 2002 8:31 AM
OECD Economic Studies No. 34, 2002/I
36
© OECD 2002
v) Changes in income distribution in the past ten years generally favouredthe prime-age and elderly age groups, particularly those around retire-ment age. Younger age groups lost ground, in particular those aged18 to 25, reflecting delayed labour market entry. Similarly, poverty rates forthe elderly fell in all but four countries, youth poverty rates increased, andchild poverty rates increased slightly in a number of countries.
vi) Relative income levels of single parents and persons in workless house-holds are very low and have worsened in a number of countries.
Driving factors
vii) Market income inequality has widened in every country. The increaseddispersion from gross earnings has been the main cause. A variety offactors have explained this, in turn, increased inequality in earnings them-selves and a trend towards “employment polarisation” in many countries,leading to a simultaneous increase in “work-rich” and “work-poor” sharesof households.
viii) Capital and self-employment incomes are distributed more unequallythan earnings. However, as their share in total disposable income is lower,their contribution to levels and, in most cases, changes in overall inequal-ity is less important than that of earnings (with the notable exception ofItaly).
ix) Joblessness is the main cause of poverty.
Distributional effects of public transfers and taxes
x) The effectiveness of taxes and transfers in reducing inequality and povertyhas increased. As a result, the increase in market income inequality wasnot, or not entirely, translated into higher inequality of disposable incomesfor the working-age population.
xi) Targeting of benefits has increased. The shares of family cash benefits and/or unemployment benefits going to lower income groups among theworking-age population increased in a majority of countries.
xii) Non-pension transfers form an increasingly large part of the income of low-income households among the working-age population in all countries.
publi.sgml.compo.fm Page 36 Friday, August 2, 2002 8:31 AM

Income Distribution and Poverty in the OECD Area: Trends and Driving Forces
37
© OECD 2002
NOTES
1. The full analysis upon which this article is based is reported in Förster and Pellizzari(2000).
2. “Household income” is often used synonymously with “household resources”. It is not:households have access to goods and services provided to them at no cost by thestate; indirect taxes affect the purchasing power of a given amount of resources; barter,charity and mutual exchange between and within families play a greater or lesser rolein different countries. The absolute level of measured income inequality or poverty,however interesting, cannot be used to make reliable cross-country comparisons. Buttrends in income distribution and poverty, if measured on a comparable basis, do per-mit a number of key findings to be drawn from the analysis.
3. The data for Hungary refer to the period 1991 to 1997.
4. This country experienced a deep recession at the beginning of its economic transition(between 1990 and 1993/94) during which real incomes fell for the population as awhole. At the same time, the distribution of those incomes flattened slightly.
5. This means that other dimensions, such as benefits in-kind, consumption, wealth,deprivation or social exclusion have not been taken into account for the analysis (for aconceptual discussion of using different criteria and methods in the frame of inter-national comparisons, see Förster, 1994).
6. As public transfers are the main component of income for retired persons in mostOECD countries, an increasing transfer share in the incomes of the entire population,and effects on inequality, might simply reflect the increased share of pensioners in thepopulation.
7. It should be noted that governments’ redistribution is not only confined to taxes andtransfers but also influences market distribution directly, e.g. via minimum wage policies.
8. Förster and Pellizzari (2000) used the MLD as the summary inequality index whichallows for this decomposition. Overall trends on the basis of the MLD differ somewhatwith respect to results obtained from other indicators (see annex). For the methodol-ogy of the decomposition, see Burniaux et al. (1998).
9. Other cash transfers going to the working-age population, such as housing benefits orsocial assistance payments have not been included in the detailed analysis becauseinformation was often not available separately; lumped together, these “other”transfers constitute approximately 10 to 20 per cent of all non-pension transfers inmost countries (30 per cent in Sweden and the United Kingdom).
10. Exceptions were Germany, Sweden, the United Kingdom and the United States.
publi.sgml.compo.fm Page 37 Friday, August 2, 2002 8:31 AM
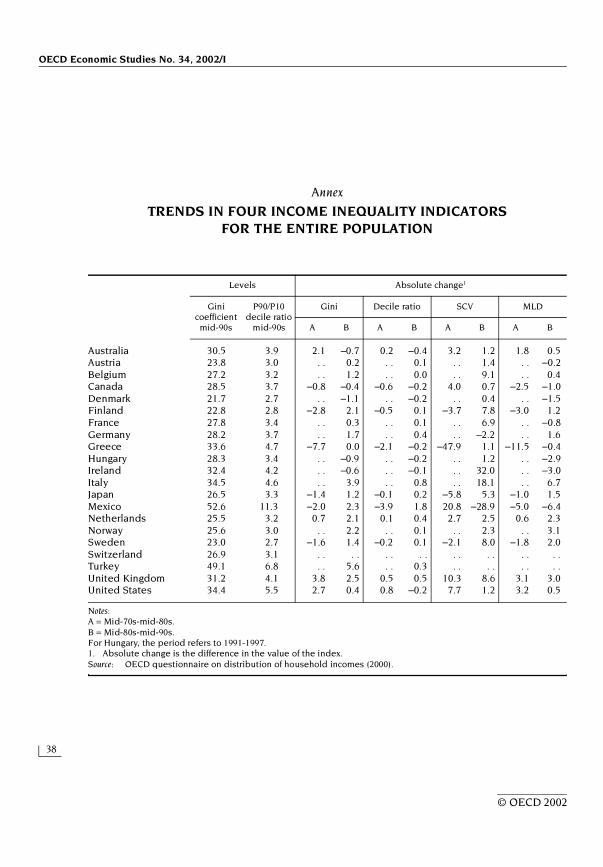
OECD Economic Studies No. 34, 2002/I
38
© OECD 2002
Annex
TRENDS IN FOUR INCOME INEQUALITY INDICATORS FOR THE ENTIRE POPULATION
Notes:A = Mid-70s-mid-80s.B = Mid-80s-mid-90s.For Hungary, the period refers to 1991-1997.1. Absolute change is the difference in the value of the index.Source: OECD questionnaire on distribution of household incomes (2000).
Levels Absolute change1
Gini coefficient
mid-90s
P90/P10 decile ratio
mid-90s
Gini Decile ratio SCV MLD
A B A B A B A B
Australia 30.5 3.9 2.1 –0.7 0.2 –0.4 3.2 1.2 1.8 0.5Austria 23.8 3.0 . . 0.2 . . 0.1 . . 1.4 . . –0.2Belgium 27.2 3.2 . . 1.2 . . 0.0 . . 9.1 . . 0.4Canada 28.5 3.7 –0.8 –0.4 –0.6 –0.2 4.0 0.7 –2.5 –1.0Denmark 21.7 2.7 . . –1.1 . . –0.2 . . 0.4 . . –1.5Finland 22.8 2.8 –2.8 2.1 –0.5 0.1 –3.7 7.8 –3.0 1.2France 27.8 3.4 . . 0.3 . . 0.1 . . 6.9 . . –0.8Germany 28.2 3.7 . . 1.7 . . 0.4 . . –2.2 . . 1.6Greece 33.6 4.7 –7.7 0.0 –2.1 –0.2 –47.9 1.1 –11.5 –0.4Hungary 28.3 3.4 . . –0.9 . . –0.2 . . 1.2 . . –2.9Ireland 32.4 4.2 . . –0.6 . . –0.1 . . 32.0 . . –3.0Italy 34.5 4.6 . . 3.9 . . 0.8 . . 18.1 . . 6.7Japan 26.5 3.3 –1.4 1.2 –0.1 0.2 –5.8 5.3 –1.0 1.5Mexico 52.6 11.3 –2.0 2.3 –3.9 1.8 20.8 –28.9 –5.0 –6.4Netherlands 25.5 3.2 0.7 2.1 0.1 0.4 2.7 2.5 0.6 2.3Norway 25.6 3.0 . . 2.2 . . 0.1 . . 2.3 . . 3.1Sweden 23.0 2.7 –1.6 1.4 –0.2 0.1 –2.1 8.0 –1.8 2.0Switzerland 26.9 3.1 . . . . . . . . . . . . . . . .Turkey 49.1 6.8 . . 5.6 . . 0.3 . . . . . . . .United Kingdom 31.2 4.1 3.8 2.5 0.5 0.5 10.3 8.6 3.1 3.0United States 34.4 5.5 2.7 0.4 0.8 –0.2 7.7 1.2 3.2 0.5
publi.sgml.compo.fm Page 38 Friday, August 2, 2002 8:31 AM
Income Distribution and Poverty in the OECD Area: Trends and Driving Forces
39
© OECD 2002
BIBLIOGRAPHY
ATKINSON, A.B., L. RAINWATER and T.M. SMEEDING (1995),“Income distribution in OECD countries, Evidence from the Luxembourg IncomeStudy”, Income Distribution in OECD Countries, OECD Social Policy Studies No. 18, Paris.
FÖRSTER, M. (1994),“Measurement of poverty and low incomes in a perspective of international compari-sons”, OECD Labour Market and Social Policy Occasional Paper, No. 14, Paris.
FÖRSTER, M., assisted by M. PELLIZZARI (2000),“Trends and driving factors in income inequality and poverty in the OECD area”, OECDLabour Market and Social Policy Occasional Papers, No. 42, Paris.
FÖRSTER, M. and M. PEARSON (2000),“Income distribution in OECD countries”, OECD Development Centre Conference onPoverty and Income Inequality in Developing Countries: A Policy Dialogue on theEffects of Globalisation, Paris, November/December.
GREGG, P. and J. WADSWORTH (1996),“It takes two: employment polarisation in the OECD”, Centre for Economic PerformanceDiscussion Papers, No. 304. London.
OECD (1996),Employment Outlook, June, Paris.
OECD (1998),Employment Outlook, June, Paris.
OECD (1999),A Caring World – The New Social Policy Agenda, Chapter 3: “The distribution of income”,pp. 65-80, Paris.
OECD (2001),Employment Outlook, June, Paris.
OXLEY, H., J.M. BURNIAUX, T.T. DANG and M. MIRA D’ERCOLE (1999),“Income distribution and poverty in 13 OECD countries”, OECD Economic Studies, No. 29,pp. 55-94, Paris.
OXLEY, H., T.T. DANG and P. ANTOLÍN (2000),“Poverty dynamics in six OECD countries”, OECD Economic Studies No. 30, pp. 7-52, Paris.
OXLEY, H., T.T. DANG, M. FÖRSTER and M. PELLIZZARI (2001),“Income inequality and poverty among children and households with children inselected OECD countries: trends and determinants”, in Child Well-being, Child Poverty andChild Policy in Modern Nations: What Do We Know?, Smeeding and Vleminckx (eds.),pp. 371-405, The Policy Press, Bristol.
publi.sgml.compo.fm Page 39 Friday, August 2, 2002 8:31 AM