Embed Size (px)
Citation preview

Income and Wealth Concentration in a Historical and
International Perspective
Emmanuel Saez, UC Berkeley and NBER∗
February 21, 2004
Abstract
This paper summarizes the main findings of the recent studies that have constructed top
income and wealth shares series over the century for Northern American countries (the United
States and Canada), and a number of European countries (the United Kingdom, France,
the Netherlands, and Switzerland) using tax statistics. All countries except Switzerland
experience a dramatic drop in top income shares in the first part of the century due to a
precipitous drop in large wealth holdings. A plausible explanation is that the development of
very progressive tax systems, by reducing drastically the rate of wealth accumulation at the
top of the wealth distribution, has prevented large fortunes from recovering from the shocks
of the World Wars and the Great Depression. Over the last 25 years, top income shares have
increased substantially in English speaking countries but not at all in continental Europe
countries. This increase is due to an unprecedented surge in top wage incomes starting in
the 1970s and accelerating in the 1990s. As a result, top wage earners have replaced capital
income earners at the top of the income distribution in English speaking countries. We
discuss the proposed explanations and the main questions that remain open.
∗Emmanuel Saez, University of California, Department of Economics, 549 Evans Hall #3880, Berkeley, CA
94720, [email protected]. This paper has been prepared for the Berkeley Symposium on Poverty, the
Distribution of Income, and Public Policy, a Conference Honoring Gene Smolensky. I thank Tony Atkinson and
Thomas Piketty for very helpful discussions, as well as having provided the key impetus to the development
of the new “high incomes” studies, which this paper summarizes. I have also benefitted from comments and
discussions with Alan Auerbach, David Card, Roger Gordon, John Quigley, Karl Scholz, as well as numerous
conference participants. Financial support from the Sloan Foundation and NSF Grant SES-0134946 is gratefully
acknowledged.
1

1 Introduction
The evolution of income and wealth inequality during the process of development of modern
economies has attracted enormous attention in the economics literature. Liberals have blamed
income and wealth concentration because of concerns for equity and in particular for tilting the
political process in favor of the wealthy. They have proposed progressive taxation as an appro-
priate counter-force against wealth concentration. For conservatives, concentration of income
and wealth is considered as a natural and necessary outcome of an environment that provides
incentives for work, entrepreneurship, and wealth accumulation, key elements of macro-economic
success. Progressive taxation may redistribute resources away from the rich and reduce wealth
concentration but it might also weaken those incentives and generate large efficiency costs. In
order to cast light on this controversial political debate, it is of great importance to understand
the forces driving income and wealth concentration over time and understand whether govern-
ment interventions through taxation are effective and/or harmful to curb wealth inequality. To
make progress on those questions, the availability of long and homogeneous series of income or
wealth concentration is clearly necessary.
However, constructing such series is a challenging task because of lack of good data cover-
ing the top of the income and wealth distributions. Household surveys have become available
in many countries only in the recent decades, and hardly existed before the 1960s. Moreover,
household surveys, such as the Current Population Survey in the United States for example,
cannot be used to analyze high incomes because of small samples and top coding issues. There-
fore, to study the top of the income or wealth distributions, tax statistics remain the best source.
Those statistics have two important advantages relative to survey data. First, they often span
very long time periods as fiscal administrations in most countries have begun publishing such
statistics since the creation of those taxes, in general in the early part of the 20th century. Sec-
ond, those statistics in general provide tabulations by brackets of income or wealth, and those
brackets are in general detailed enough to allow a precise analysis of very small groups at the
top of the distribution, such as the top 0.1%, or even the top 0.01%.
Of course, such tax data have also important drawbacks. First and most important, the
data are based on income or wealth reported for tax purposes. As a result, the data might
2

not reflect real income or wealth because of tax evasion (fraudulent under-reporting or non
reporting) or tax avoidance (using legal means to repackage reported incomes in order to reduce
tax liabilities). The extent of tax evasion or tax avoidance is related to the level of taxes, the
enforcement of the tax law, and to the more general legal tax environment which might make
it more or less difficult to avoid taxes. Therefore, when using tax data to study top incomes,
it is necessary to analyze the tax structure at the same time in order to tell apart real changes
in income or wealth concentration from changes in reported income or wealth due to changes in
tax avoidance following a tax reform.1
Second, the tax statistics cover only the fraction of the population filing tax returns. His-
torically in most countries, because of large exemption levels, the fraction of filers was small
in the first part of the century (less than 10% for example in the United States before World
War II). As a result, using solely tax data is not sufficient to compare the evolution of top
incomes relative to average incomes. The key innovation of the famous study by Kuznets (1953)
on income concentration in the United States for the period 1913-1948 was to use, in addition
to income tax statistics, National Accounts data to compute total personal income and obtain
shares of total personal income accruing to various upper income groups.2
In the decades following the study of Kuznets (1953), the tax statistics have been used
relatively rarely to study inequality for two main reasons. First, micro-survey data had started
becoming available, making the analysis of the complete distribution possible as well as the
relation between income and demographics such as age, gender, education, etc. Second, the
decades following World War II were characterized by a relative stability of the upper ends
of the income and wealth distributions in most countries. Following the impetus of Piketty
(2001, 2004) who presented a comprehensive analysis of the income tax statistics for France
since the beginning of the century, a number of very recent studies have constructed series of
shares of income or wealth accruing to upper groups of the income and wealth distribution for1The analysis of the behavioral responses to tax changes is of much interest in itself for tax policy analysis,
and is quite developed in the case of the United States. See for example Saez (2004) for a recent survey.2Wealth or income tax statistics tabulated by brackets had been used, at least since Pareto (1897), to compute
Pareto parameters of the top tails of the distributions, which amounts to computing income or wealth concen-
tration within the upper end of the distribution, as opposed to relative to the average as in Kuznets (1953). See
Atkinson (2003) for a more detailed presentation of that point.
3

various countries. Top income shares have been constructed by Atkinson (2002) for the United
Kingdom, by Piketty and Saez (2003) for the United States, by Saez and Veall (2003) for Canada,
by Atkinson and Salverda (2003) for the Netherlands, and by Dell, Piketty, and Saez (2003) for
Switzerland.3 Shares of wealth accruing to top wealth groups have also been constructed for
some countries as well using either estate or wealth individual tax data: Kopczuk and Saez
(2003) for the United States, Piketty, Postel-Viney, and Rosenthal (2003) for France, and Dell,
Piketty, and Saez (2003) for Switzerland.4
The goal of this paper is to summarize the main empirical findings that have emerged out
of this new top incomes and top wealth literature, as well as the central explanations that have
been proposed to account for the facts. The paper will also emphasize the questions or issues
that remain unsolved and discuss which avenues of research could be helpful to make further
progress. Most of the series constructed share two important and striking characteristics. First,
in all the countries, except Switzerland, a dramatic reduction in top income and wealth shares is
observed from the early part of the century to the decades following World War II. In virtually all
cases, the share of income or wealth accruing to the top 1% has been divided by a factor two and
sometimes, by a much greater factor. For example, in the United Kingdom, the top 1% income
share falls from almost 20% in 1918 to around 6% in the 1970s (Atkinson and Salverda, 2003,
Table 2UK). Second, in all those countries as well, those dramatic decreases are concentrated
in the very top groups of the income or wealth distribution. There are relatively little secular
changes for the bottom part of the top decile or even the bottom part of the top percentile, and
the majority of the decrease is actually concentrated in the top 0.1%. Those changes are the
consequence of a drastic reduction in top wealth holdings and in the large capital income they
generate.
In contrast, the evolution of top income shares in the recent decades has been different
across countries: the United States, Canada, and the United Kingdom have experienced a large
increase in top income shares while France, the Netherlands, or Switzerland display hardly any3Earlier historical studies on income concentration are summarized in Morrisson (2000) (for European coun-
tries) and Lindert (2000) (for Britain and America). Series for Germany and for Australia and New Zealand are
being constructed by Dell (2003) and Atkinson and Leigh (2003).4Such wealth concentration series had also been constructed for the United Kingdom by Atkinson and Harrison
(1978) and Atkinson et al. (1989), and the United States by Lampman (1962).
4

change in top income shares. For the anglo-saxon countries, this dramatic increase has been due
to a dramatic increase in top wages and salaries.5 In both the United States and the United
Kingdom, the increase in top wealth shares has been small and almost negligible relative to the
dramatic increase in top income shares. This suggests that, although income concentration has
increased sharply in the United States and the United Kingdom, it has not yet translated into a
significant increase in wealth concentration. As a result, in the English speaking countries, the
working rich deriving very large salaries have replaced the rentiers deriving very large capital
incomes at the top of the income distribution.6
Following Piketty (2001, 2003), most authors have argued that the dramatic increase in tax
progressivity that has taken place in the inter-war period in all the countries studied and which
remained in place at least until the recent decades, has been the main factor preventing top
income and wealth shares from coming back to the very high levels observed at the beginning of
the century. Indeed, with marginal income tax rates in excess of 60%, and sometimes reaching
even 90% for very high incomes, a wealthy individual has to pay in taxes a very large fraction
of its returns on capital, and accumulating or sustaining a fortune requires much higher saving
rates. However, because the effects of taxes on wealth concentration are a long-term process,
it is nearly impossible to provide a rigorous and direct proof of this hypothesis.7 The case of
Switzerland, a country which did not experience the shocks of the two World Wars and never
established a very progressive tax structure, offers an interesting test of the hypothesis. Dell,
Piketty, and Saez (2003) analyze income and wealth concentration in Switzerland and their
results support the tax explanation discussed above: Switzerland is the only country, among
those studies so far, to display the same concentration of wealth or income in the early part of
the century and in the decades following World War II.
Explaining the surge in top wage incomes in the United States, Canada, and the United
Kingdom over the last 30 years is more difficult. Several points can however be emphasized.
First, this change cannot be simply explained by pure technological change (such as the computer5See Piketty and Saez (2003) for the United States, Saez, and Veall (2003) for Canada and the recent study
by Atkinson and Voitchovsky (2004) on top wage incomes in the United Kingdom.6In continental Europe, it is still the case that top incomes are composed primarily of capital income.7See however Atkinson and Leigh (2003) for an attempt at capturing this effect by regressing top income shares
on lagged tax rates.
5

revolution) because no such changes in top wages happened in continental European countries
(France, the Netherlands, or Switzerland) which have experienced similar technological changes.
Second, this surge in top wage incomes cannot be entirely due to changes in tax avoidance (such
as a shift from perquisites or deferred compensation to current cash compensation) following
the large tax rate cuts at the top in the United States and the United Kingdom because Canada
implemented much smaller tax changes and yet also experienced very large increases in top
wage incomes. It is, however, plausible to think that, had the United States and the United
Kingdom kept the extremely high marginal tax rates on very large incomes (in excess of 80%)
they implemented up to the 1960s or 1970s, such a surge in top wage incomes might not have
happened. In other words, it is probably a combination of technological changes, changes in the
fiscal environment, as well as changes in corporate governance which produced such a drastic
change in the top of the earnings distribution in Anglo-saxon countries although the relative
contribution of each change is still open to debate as well as the causality relation between those
various changes.
The paper is organized as follows. Section 2 describes briefly the general methodology and
data sources that have been used to estimate top income and wealth shares, as well as the main
potential sources of bias. Section 3 presents the central findings on the dramatic reduction in
income and wealth concentration and discusses the tax progressivity explanation. Section 4
focuses on the recent changes in income concentration that have taken place in English speaking
countries.
2 Data Sources, Methodology, and Potential Biases
Most top incomes and top wealth studies mentioned above follow the same broad estimation
methodology and use similar data sources. Atkinson (2003) describes in detail the method-
ological issues involved in those estimations. We present here a brief summary of those main
issues.
6

2.1 Tax Units and Population Totals
Top income or wealth groups are defined relative to the complete population even if only a
fraction of the population is required to file tax returns. The unit of analysis is defined as the
tax filing unit. The income tax law can be family based (as in the United States or France)
or individually based (as in Canada or the United Kingdom since 1990).8 In family tax based
systems, a tax unit family is defined as a married couple with dependent children, or a single
adult, or a single parent with dependent children. In individually based systems, each adult
is taxed independently.9 Thus, top groups such as the top decile or top percentile are defined
relative to the total number of families (in the case of family based systems) or relative to the
total number of adults (in the case of individually based systems). Such totals for families or
adults can be obtained from census or population survey data for most countries. It is important
to note that individually and family based top income shares can differ both in levels and patterns
depending on the levels and patterns of correlation of incomes between spouses.10 In the case of
Canada, both family and individually based top income shares can be constructed for the recent
period using micro-data. Saez and Veall (2003) show that the level and the upward pattern
of top income shares is almost identical for individuals and families suggesting that changes in
the correlation of incomes between spouses do not explain any significant change in top income
shares, at least in the case of Canada in the recent decades.
Once the total tax units series are obtained, all upper income groups, such as the top 10%,
the top 1%, etc., are defined relative to that total, irrespective of the actual number of returns
filed. When exemptions levels are high, tax return data covers only the top of the distribution.
2.2 Interpolations from Tax Statistics
Tax statistics for individual incomes, wealth, or estates present in general the number of returns
and amounts reported by brackets. In all countries studied, the base for individual income
taxes is comprehensive and includes both labor income (wages and salaries, pension income,8Changes in the tax unit definition as happened in the United Kingdom in 1990 create an additional difficulty
to construct homogeneous series.9In general, dependent minors are not taxed separately, their incomes are added to the incomes of the parents.
10Atkinson (2003) discusses this point formally.
7

self-employment income, etc.) and capital income (profits from small businesses, dividends
from stock, interest income, rents, etc.). In most countries, capital gains and imputed rent
of homeowners are not taxable and hence are excluded from the income definition. In some
countries such as the United States, realized capital gains are in part taxable and can also be
analyzed to check the sensitivity of results to the exclusion of capital gains (see below). The
income definition that is used is before deductions such as personal and family exemptions, and
other deductions.11 In all the series presented here, income is defined as total market income
accruing to individuals (including labor, business, and capital income) but excluding realized
capital gains and most transfers from the government such as welfare or unemployment benefits.
In most cases in the published tabulations, the top brackets contain few individuals, and
therefore allow a very precise analysis of very top groups, especially during the first part of
the century.12 In the United States today, the top bracket is for annual incomes above $10
million, and this group contains less than 20,000 taxpayers (see Statistic of Income, U.S. Treasury
Department). In many cases, the amounts reported are further divided by source of income (or
wealth) (such as wages and salaries, business income, dividends, interest income, etc.). Assuming
that the income or wealth distribution is Pareto distributed in each bracket, and using a simple
interpolation technique, it is straightforward to obtain the thresholds corresponding to each
percentile cut-off (such as the top 10%, top 1%, etc.), and then compute the total amounts
reported in each upper group. Linear interpolations can be used to compute the fractions of
income from each source using the composition tables. In practice, the estimation is complicated
by the fact that brackets are not always defined in terms of gross income but sometimes in terms
of income after deductions. For a number of countries, micro-files of individual tax returns are
also available and can be used to check the accuracy of the interpolations and other adjustments
made when using tabulated data.13
11For example, in the United States, charitable contributions can be deducted from income for tax purposes.12In most cases, statistics reported for the top brackets are based on the universe of tax returns and not a
sub-sample.13For example, for the United States, large micro datasets of individual tax returns with over-sampling of higher
incomes are publicly available since 1960.
8

2.3 Income Denominators
Once the amounts of income in each upper group are obtained, a denominator representing
total personal income is required to obtain shares of income accruing to upper groups. This
denominator would be straightforward to obtain had everybody been required to file a tax
return. However, when only a small fraction of individuals file tax returns, National Accounts
must be used to estimate total personal income. Personal income from National Accounts must
be corrected to exclude items such as government transfers, imputed rent, imputed interest on
bank accounts, and other forms of income that are not reported on tax returns. Government
transfers are reported separately in National Accounts and are easy to correct but other items
must be estimated. In general, those correction coefficients are estimated using data for the
recent period where, in many countries, almost all individuals with positive income file income
tax returns, and then extrapolated back to the earlier periods.
Figure 1 reports the average real income per family in France, the United Kingdom, the
United States, and Switzerland expressed in 2000 dollars (incomes are first expressed in real
value in each currency using a price deflator based on year 2000 and then amounts are converted
in dollars using the 2/20/2004 exchange rate). Although France, and to a lesser extent the
United Kingdom, appear to have significantly lower average real income than the United States
and especially than Switzerland, one should be careful when comparing levels across countries
because of large and fast exchange rate fluctuations, as well as important differences in the level
of payroll taxes.14 The four series, however, display a strikingly similar pattern over time. In
all countries growth in real incomes is very small from 1913 to the beginning of World War II,
with very large fluctuations in the United States due to the extremely strong business cycle.
Real income growth is very fast in the decades following World War II (and during World War
II in the United States). Real income growth has been much slower over the last 25 years.
It is therefore important to keep in mind that the macro-economic performance of these four
countries has been quite similar over the 20th century in spite of the quite different patterns of
taxation and income and wealth concentration as we describe below.
As we have noted, it is difficult to compare levels of income across countries because of14For example, the dollar depreciated by more than 30% relative to the Euro from the end of 2001 to the the
beginning of 2004.
9

movements in exchange rates. Similarly, even within countries, comparing real incomes over
time is difficult because it requires to use a price index and there is substantial controversy
about how to construct such an index and account properly for the introduction of new goods.15
As a result, it is important to measure inequality between and within countries in a way that
is independent of exchange rates fluctuations and price fluctuations. That is why top income
or wealth shares, which are by definition independent of price levels, are valuable measures to
make inter-temporal and cross-country comparisons.
2.4 Tax Evasion and Avoidance
As we mentioned above, top income (or wealth) shares can be underestimated because of tax
evasion or tax avoidance. Tax evasion is fraudulent non-reporting or under-reporting of income
for tax purposes. Fiscal administrations carry audits and impose penalties on tax evaders, and
sometimes publish detailed reports on the extent of under-reporting by income sources.16 The
main lesson from those studies is that tax evasion is minimal for income sources such as wages
and salaries, dividend or interest income that are reported to the fiscal administration both by
the payer and the payee, but can be substantial for sources such as self-employment or informal
small business income where there is no such double reporting. Income from foreign accounts in
tax havens is also likely to be under-reported and might also escape audits. There are no good
estimates of the amount of capital income earned by wealthy residents from Northern America
or European countries in tax havens and which escapes taxation, and it would be a very useful
project to try to gather systematically available sources from tax havens.17
Most audit studies suggest that the extent of tax evasion has declined over time as the15In the United States, for example, the methods for constructing the Consumer Price Index (CPI) have evolved
overtime. As a result, the historical CPI series and the new series incorporating retrospectively the improvements
in the methodology differ considerably with a cumulative gap of about 15% over the last 25 years. This gap
implies that income series deflated using the official CPI underestimate real growth since 1978 by about 15%. See
Stewart and Reed (1999) for more details.16See e.g. U.S. Treasury Department (1996) for a recent U.S. analysis.17Evidence from Switzerland reported in Dell, Piketty, and Saez (2003) shows that the amounts earned in
Switzerland from all non-residents and never reported by taxpayers in their own country of residence is very small
relative to the amounts reported by high incomes in the United States (less than 10% than all incomes earned by
the top .01% income earners in the United States).
10

systems of reporting and especially double reporting have improved substantially over time.
Today, virtually all wages and salaries at the high end of the distribution are accurately reported
in all the countries studied as well as capital income in the form of dividends or interest income
earned at home. Thus, if one could correct the series for tax evasion accurately, it is likely that
the secular drop in top income shares that has been documented in most countries would be
even more dramatic.
Tax avoidance consists in using legal means to reduce tax liabilities. Tax avoidance is a
concern for top income shares estimates because some forms of real economic income might
fail to appear on individual tax returns. The extent of tax avoidance depends also to a large
extent on the general fiscal environment: not only the level of taxes but also the interactions
between various taxes and the laws regulating various forms of payments and legal structures.
Tax avoidance can take three main forms.
First, individuals supplying labor might be paid with non-taxable perquisites such as better
offices, health insurance, company cars or jets, conferences in attractive vacation locations, etc.
instead of taxable salary compensation. All countries impose rules on perquisites in order to
prevent excesses. As a result, perquisites are far from perfect substitutes to cash compensation,
and thus should not be included in full in the definition of economic income. More importantly,
the changes in top wage incomes that have taken place in North America in the recent decades
seem to be far too large to be explained by a shift away from perquisites toward cash compen-
sation. Cash compensation can also be deferred through the use of pension plans (taxable in
general when cashed out at retirement) or through stock-option plans (which are taxed only at
when exercised and/or when the shares are finally sold), creating a substantial delay between
the compensation decision and the time the income is effectively realized.18
Second, individuals may re-arrange the legal structures of their businesses in order to reduce
their tax liability. The most important element is the interface between the corporate and the
individual sectors. Businesses can be incorporated and taxed on their profits by the corporate
income tax before those profits are distributed as dividends to shareholders. Businesses can18This issue is especially important in the case of stock-options which are in general exercised in a lumpy way
and are not an annual stream of income like salaries. In most countries, profits from exercised stock-options are
reported as wages and salaries on income tax returns.
11

also be, under some important restrictions on the number of shareholders, be unincorporated.
In that case, profits are reported and taxed uniquely at the individual level. Therefore, profits
from incorporated businesses do not appear on individual returns until they are distributed as
dividends or shares are sold and capital gains are realized (in those countries where capital gains
are taxed). In principle, because capital gains are either not observed at all or observed only
at realization, one would like to impute profits instead of distributed dividends. Unfortunately,
this is impossible due to data limitations in general. That is why it is important, whenever
possible, to supplement top income shares series with information on the composition of those
top incomes, pay-out ratios of corporations at the aggregate level, the importance of realized
capital gains, and perhaps more importantly with data on wealth distribution either from wealth
taxes or from estate taxes.
A change in the corporate status can change dramatically reported incomes on individual
returns with no real economic change. The corporate status is sensitive to the relative levels
of taxes on the corporate and the individual sector. In the United States, such shifts from the
corporate to the individual sector have been documented in detail following the large tax changes
of the 1980s (see for example Gordon and MacKie-Mason (1990), Slemrod (1996), and Gordon
and Slemrod (2000)). The extent of those shifts also depends on whether the tax law imposes
substantial restrictions on unincorporated businesses. Sole proprietorships and partnerships
can always choose to be unincorporated but, in general, businesses with many shareholders
have to incorporated. In the United States, the so-called S-corporation entity is taxed, like
unincorporated businesses, only at the individual level but can have up to 65 shareholders. As
a result, there is little cost of switching from S-corporation status to the corporate sector for
many closely held businesses and indeed behavioral responses along that margin are large. In
contrast, Canada only allows partnerships and sole proprietorships to be taxed at the individual
level and hence there is no evidence of behavioral responses at the individual-corporate interface
in that country.
Finally, owners of closely held businesses, in addition to changing the legal status of their
business, may also have substantial flexibility in the form of payment they choose: larger salaries
for themselves or accumulation within the corporation, decision to pay-out dividends versus to
12

retain earnings.19 Those shifting strategies blur the distinction between labor and capital income
for small business owners and makes it important to supplement tax data on top wage incomes
with other data such as executive compensation data where management and ownership are
separated.
3 The Pattern of Top Income Shares
Figure 2, Panel A plots the top 1% income share in France and the United States since 1913.20
The patterns are strikingly parallel from the beginning of the century up to the 1970s. The
shares were very high, around 18-20% in both countries, at the eve of the first World War.21
The top 1% share is highest in the United States in 1929, at the onset of the Great Depression.
The top 1% income share falls in both countries during the Great Depression, and especially
during World War II. The fall during World War II is more pronounced in France, which suffered
much more directly from the shock of the war than the United States. By the end of World War
II, top 1% income shares are around 11% in the United States and 9% in France, about only
50% of their pre-World War I level. Strikingly, in the prosperous years and decades following
World War II, top income shares do not come back to their high levels of the pre-war period,
but remain relatively stable in France or decrease further (and slowly) in the United States. In
the 1970s, the top 1% income share is around 8% in both countries. The pattern of top income
shares in the two countries displays a striking contrast over the last 25 years. While the top
1% income share in France has remained stable around 8% up to year 1998, the top 1% income
share has increased dramatically and is around 17% in 2000, almost as high as in 1913.
Figure 2, Panel B plots the top 10-1% income share (defined as the top decile excluding
the top 1%) for France and the United States.22 In sharp contrast to the top 1%, there are no19Gordon and Slemrod (2000) show evidence of tax minimization strategies along those lines for the United
States.20In year 2000, in the United States, the top 1% is formed of tax units with annual incomes above $280,000,
corresponding perhaps to the popular view of the affluent. In both countries, the series do not include realized
capital gains.21This means that taxpayers in the top 1% earned 18 to 20 times the average income.22The average annual income of a tax unit in this group is $120,000 in the United States in year 2000 (and
about $75,000 in France in 1998). This group corresponds perhaps to the popular view of the upper middle class.
13

secular changes for the upper middle income class share. In both countries, the share of this
group fluctuates around 25%, and the levels are almost identical at the beginning and at the
end of the period. In both countries, the upper middle class reaches a secular maximum around
30% during the Great Depression and a secular minimum by the end of World War II, around
21%. Composition analysis in Piketty (2001) and Piketty and Saez (2003) shows that incomes
in this group are overwhelmingly composed of wages and salaries.23 During the deflation of the
Great Depression, because wages were nominally rigid downward, this upper middle class group
did better than the top 1% incomes, composed primarily of capital and business income, and
than bottom or middle income earners which suffered from unemployment.
This phenomenon can be observed more directly looking at wages series by occupation. For
example, Saez and Veall (2003) use surveys of the manufacturing sector in Canada which report
the number and amounts paid to wage earners (employees paid at an hourly or daily wage rate)
and to salary earners (supervisory employees and officers paid at a monthly or annual salary
rate). Those series show very clearly that during the downturns of the inter-war period (1920-
1 and 1930-2), both the number of salaried workers and the average salary rose substantially
relative to the number of wage workers and the average wage. This evidence shows that upper
income earners were gaining relative to the average worker in the economy during the depression
episodes, explaining why the share of the top 10-1% increases during the downturns of the inter-
war period.
In contrast, World War II led to a significant wage compression which reduced significantly
the share of the upper middle income class. The wage compression during World War II for
France and Canada is analyzed in detail by Piketty (2001) and Saez and Veall (2003). In the
United States, a large literature has also documented the “Great Compression” of wages during
World War II (see e.g., Goldin and Margo (1992) and Piketty and Saez (2003). This explains
why the share of the top 10-1% falls significantly during World War II.
Figure 2, Panel B shows that there is no secular trend in inequality, measured by the disparity
between the upper middle class and the average, casting doubts on the traditional Kuznets (1955)
theory of the inverted U-curve of inequality during the process of development.24 It is striking to23At the end of the period, wages and salaries form about 85% of incomes in this group. The share of wage
income for that group was around 60% at the beginning of the period.24The Kuznets theory is based on the comparison between wages in the old (agricultural) sector and the new
14

note the contrast between the flat pattern of the upper middle income class and the skyrocketing
pattern of the top 1% share over the last 25 years in the United States: while the top 1% share
increased by 9 percentage points, the upper middle income class shares increased by only 2
percentage points.
Figure 3, Panel A displays the top 0.1% income share in three English speaking countries:
the United States, the United Kingdom, and Canada.25 It shows that the pattern for this very
top group income share has been quite similar across the three countries. There has been a sharp
drop in the first part of the century, especially in the United Kingdom and the United States,
followed by a slower decline during the post World War II decades. Finally, all three countries
display a substantial increase in the top 0.1% income share over the last 25 years. This increase
is largest in the United States, and lowest in the United Kingdom but the timing is remarkably
similar across the three anglo-saxon countries.
Figure 3, Panel B displays the same top 0.1% income share for two continental countries
in Europe: France and Netherlands. Those two series share a very similar pattern over the
full century. As in the English speaking countries, the top 0.1% income share experiences a
dramatic drop in the first part of the century followed by a almost flat pattern afterwards. But,
in contrast to English speaking countries, those two countries do not experience any noticeable
increase in the top 0.1% income share in the recent decades. As a result, the secular decline in
the share of income going to the top is dramatic. While the top 0.1% accounted for around 8%
of total income in France and 10% in the Netherlands in the beginning of the century, by the
late 1990s, those shares are only 2% in France and around 1.2% in the Netherlands.
The next sections will try to explain the two main empirical facts described here: the dra-
matic decline in very top shares in the first part of the century and the recent and large increase
in those top income shares over the last 25 years but limited to English speaking countries.
(industrial) sector. Thus, one would expect the upper middle income class share, which amounts roughly to
comparing skilled wage earners to unskilled wage earners, to capture well the Kuznets effect.25In the United States in 2000, the top 0.1% incomes represent the top 1.3 million tax units with annual incomes
above around 1 million dollars.
15

4 The Secular Decline in Top Capital Incomes
The drop in top income shares over the first part of the century is extremely concentrated. There
is no such decline below the top 1%, and even within the top 1%, most of decline is actually
concentrated in the upper parts of the top percentile such as the top 0.1%. As we expect very
top incomes to be composed primarily of capital income, this suggests that this decline in very
top shares is primarily driven by a reduction in top capital incomes and hence by the top wealth
holdings which generated such incomes.
Indeed, Figure 4 displays the composition of the top 0.1% income share for France (Panel
A) and the United States (Panel B). In both countries in the first part of the century, top 0.1%
incomes are composed primarily of capital income (dividends is by far the largest item in this
category which also comprises interest income, rents, but excludes capital gains) and business
income (profits from non incorporated businesses), while the fraction of wages and salaries is
very small (around 15%). At the beginning of the period, the relative fraction of business income
is much larger in France than in the United States, probably due to the fact that relatively fewer
businesses were incorporated in France.
In both countries, the dramatic fall in the top 0.1% income share is thus due to a sharp decline
in business income and capital income suggesting that the reduction in income concentration was
the consequence of a decline in large wealth holdings. One might also be tempted to interpret
the large upturn in top income shares observed since the 1970s in English speaking countries as
a revival of very high capital incomes, but this is not the case. As shown in Panel B, the main
factor that has driven up the top 0.1% income share in the United States is an unprecedented
increase in the fraction of wages and salaries which now represent about 60% of incomes in the
top 0.1% group.26 Therefore, the composition of high incomes at the end of the century in the
United States (as well as in Canada and most likely in the United Kingdom as well) is very26There is a discontinuous increase in the fraction of business income in the United States from 1986 to 1988.
This was the consequence of shifting of income from the corporate sector toward the individual sector using
the S-corporation status which had become fiscally more advantageous than traditional corporations (C-status)
following the Tax Reform Act of 1986. This shift has been documented in detail in Slemrod (1996) and Gordon
and Slemrod (2000). Note however that this jump in business income remains small relative to the increase in
wages and salaries over the last 25 years.
16

different from those earlier in the century: today, highly paid executives seem to have replaced
the capitalists and rentiers of the early part of the century at the top of the income distribution.
It is important to note that the secular decline of top capital incomes is due to a decreased
concentration of capital income rather than a decline in the share of capital income in the
economy as a whole. First, National Income Accounts series from France and the United States
show that the capital income share in personal income has not declined over the century: it
displays medium term fluctuations but no secular trend down (see Piketty (2003) and Piketty
and Saez (2003)).
Second and more importantly, series on wealth concentration have been constructed for
various countries from estate or wealth tax statistics. Although estimates from such tax statistics
can also be biased,27 they are a valuable alternative source to analyze and cast further light on
the issue of wealth and capital income concentration. Figure 5 displays the share of total personal
wealth accruing to the wealthiest 1% adults in the population for the United States, the United
Kingdom, and France.28 Figure 5 shows that wealth concentration has indeed declined very
significantly from the early part of the century to the decades following World War II. The top
1% wealth shares were around 60% in the United Kindgom and France, and around 40% in the
United States in the early decades of the century. By the end of the century, those top 1%
wealth shares have converged to around 22% in all three countries.
Interestingly, in contrast to the surge in the top income shares, there has been only a modest
increase in the top wealth shares in the United States and the United Kingdom over the last 25
years. This is consistent with the wage income surge explanation we described. The surge in
top incomes seems to be due primarily to a dramatic increase in top wage incomes and not to
an increase in top capital incomes. As a result, the increased income concentration has not yet
translated into increased wealth concentration.
How can we explain the steep secular decline in capital income concentration? The very
large downturns of the inter-war period and especially the Great Depression in the United27See Atkinson and Harrison (1978) for a detailed discussion on methodological issues.28In all three cases, the top wealth share is estimated from estate tax return data using the estate multiplier
method which amounts to re-weight the sample of estates by the inverse of the probability of death in order to
obtain the wealth distribution for the living.
17

States resulted in many business failures as well as a dramatic decline in corporate equity prices
relative to other assets such as real estate or fixed claims assets (such as bonds). As a result, top
fortunes and top incomes composed primarily of corporate equities and dividends from those
equities fell relative to the average.29 At the eve of World War II, top fortunes and top incomes
had clearly not yet recovered from the dramatic shock of the Great Depression.
The world wars and especially World War II produced additional shocks on top incomes
and top fortunes. In countries such as France or the Netherlands (and to some extent the
United Kingdom), the war directly destroyed a substantial fraction of the capital stock. The
German occupation and the subsequent liberation of those countries also generated substantial
confiscations and redistributions of businesses and assets. However, Figure 3 shows clearly that
top income shares also fell substantially in the United States and Canada, two countries which
did not experience war on their soil or direct destruction of property. As discussed in detail
Piketty and Saez (2003) and Saez and Veall (2003), these two countries increased substantially
individual and especially corporate income taxes in order to finance the war effort. In spite or
surging corporate profits during the war, profits after tax and especially dividends distributed
to stock-holders did not increase much during the war years. As a result, top incomes composed
primarily of dividends declined relative to the increasing average income of the war economy,
explaining the decline in the top 0.1% income share displayed on Figure 3.30
Financing World War I also generated a fiscal shock but much less pronounced than dur-
ing World War II. During World War I, top income shares declined in the United States and
the United Kingdom but remained stable in France and actually increased substantially in the
Netherlands. This shows that World War I did not necessarily benefit capitalists in all coun-
tries.31
While it is easy to understand how the macro-economic shocks of the Great Depression29Kopczuk and Saez (2004) who analyze the composition of top wealth holdings in the United States since 1916
discuss this point in detail.30It is interesting to note on Figure 5 that wealth concentration did not decline as much as income concentration
in the United States during World War II. This is consistent with a large temporary decline in dividend payments
but a much smaller decrease in stock-prices during the war.31It would be interesting to analyze in detail the evolution of taxation during World War I in each of those
countries to see whether the distribution of the fiscal burden to finance the war can explain the patterns of top
income shares that we observe across countries.
18

and the World war shocks have had a negative impact on capital concentration, the difficult
question to answer is why large fortunes did not recover from these shocks during the very
prosperous decades following World War II. The most natural and realistic candidate for an
explanation seems to be the creation and the development of the progressive income tax (and
of the progressive estate tax and corporate income tax). The very large fortunes that generated
the top 0.1% incomes observed at the beginning of the century were accumulated during the
nineteenth century, at a time where progressive taxes hardly existed and capitalists could dispose
of almost all their income to consume and to accumulate. The fiscal situation faced by capitalists
in the twentieth century to recover from the shocks incurred during the 1914 to 1945 period has
been substantially different. All the countries for which we have presented top income share
results in Figure 3 have started to adopt very progressive income and inheritance tax structures
during the inter-war period, with top marginal tax rates often in excess of 75%. During the
decades following World War II, those top rates have remained extremely high. For example,
the top marginal tax rate in the United States was 91% up to 1963. These very high marginal
rates applied to only a very small fraction of taxpayers, but created a substantial burden on the
very top income groups (such as the top 0.1%) composed primarily of capital income.
It is difficult to prove in a rigorous way that the dynamic effects of progressive taxation
on capital accumulation and pre-tax income inequality have the right quantitative magnitude
and account for the observed facts because it is a long-term phenomenon and there is, unfortu-
nately, no direct evidence on the savings rates and accumulation strategies of top wealth holders
overtime. The case of Switzerland, a country which did not experience the shocks of the two
World Wars and never established a very progressive tax structure, offers an interesting test
of the hypothesis. Dell, Piketty, and Saez (2003) analyze income and wealth concentration in
Switzerland. For most of the century, and is still true today, the majority of income taxes in
Switzerland are levied at the local level (county level and municipal level). Probably because
of fiscal competition and mobility across counties, these local income and wealth taxes have a
relatively flat rate structure with low marginal tax rates. The federal income and wealth tax
rate has been only modestly progressive with very low top rates for almost every year. Thus
over the 20th century, the average tax rate in Switzerland on capital income of the very wealthy
including federal and local income, wealth, and inheritance taxes, has been much lower than in
19
the other countries that we have analyzed.
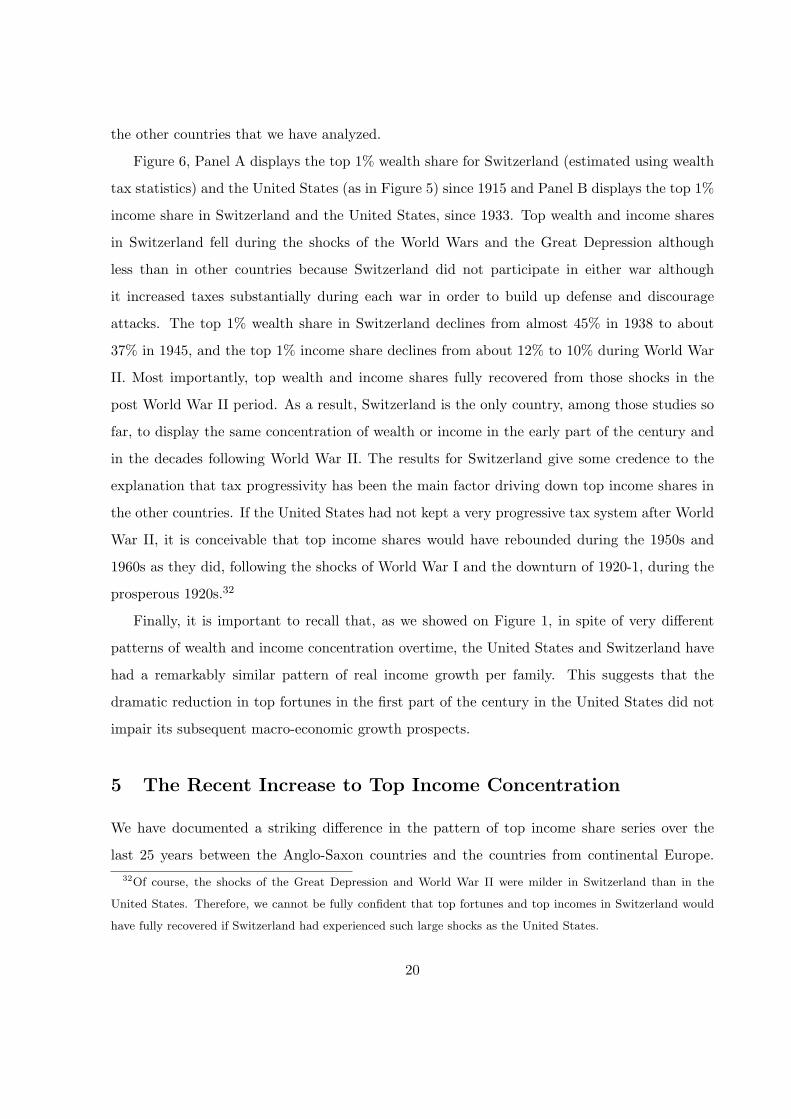
Figure 6, Panel A displays the top 1% wealth share for Switzerland (estimated using wealth
tax statistics) and the United States (as in Figure 5) since 1915 and Panel B displays the top 1%
income share in Switzerland and the United States, since 1933. Top wealth and income shares
in Switzerland fell during the shocks of the World Wars and the Great Depression although
less than in other countries because Switzerland did not participate in either war although
it increased taxes substantially during each war in order to build up defense and discourage
attacks. The top 1% wealth share in Switzerland declines from almost 45% in 1938 to about
37% in 1945, and the top 1% income share declines from about 12% to 10% during World War
II. Most importantly, top wealth and income shares fully recovered from those shocks in the
post World War II period. As a result, Switzerland is the only country, among those studies so
far, to display the same concentration of wealth or income in the early part of the century and
in the decades following World War II. The results for Switzerland give some credence to the
explanation that tax progressivity has been the main factor driving down top income shares in
the other countries. If the United States had not kept a very progressive tax system after World
War II, it is conceivable that top income shares would have rebounded during the 1950s and
1960s as they did, following the shocks of World War I and the downturn of 1920-1, during the
prosperous 1920s.32
Finally, it is important to recall that, as we showed on Figure 1, in spite of very different
patterns of wealth and income concentration overtime, the United States and Switzerland have
had a remarkably similar pattern of real income growth per family. This suggests that the
dramatic reduction in top fortunes in the first part of the century in the United States did not
impair its subsequent macro-economic growth prospects.
5 The Recent Increase to Top Income Concentration
We have documented a striking difference in the pattern of top income share series over the
last 25 years between the Anglo-Saxon countries and the countries from continental Europe.32Of course, the shocks of the Great Depression and World War II were milder in Switzerland than in the
United States. Therefore, we cannot be fully confident that top fortunes and top incomes in Switzerland would
have fully recovered if Switzerland had experienced such large shocks as the United States.
20

We have argued that the dramatic increase in top income shares which has taken place in the
United States, Canada, and the United Kingdom has been primarily driven by an unprecedented
surge in top wage incomes. In this section, we analyze this phenomenon looking directly at the
evidence on top wage incomes, and discuss the proposed explanations.
For a few countries such as the United States or France, which have published tax statistics
on the distribution of wage income, it is possible to construct shares of total wages accruing to
top wage income earners for most of the twentieth century.33 In the recent period when micro
tax return data are available, those series can be constructed for a larger number of countries.
Panel A in Figure 7 displays the top 1% wage income share in France and the United States
since the 1920s. In France, there is no secular change in top 1% wage income share. The series
displays moderate medium run fluctuations, but the levels are almost identical in the early 1920s
and the late 1990s, around 6%. In contrast, the top 1% wage income share in the United States
displays striking fluctuations. Consistent with our previous discussion, Figure 7 shows clearly
that World War II generated a sharp wage income compression in the United States. The top
1% wage income share declines from more than 8% to less than 6% in just three years from 1941
to 1944 and does not recover afterwards.
The most impressive feature of the U.S. series, however, is the dramatic increase in the top
wage income share which started in the early 1970s and accelerated in the 1980s, and especially
the late 1990s, and has driven the top 1% share from about 5% in the 1960s to 12.5% in 2000,
a level much higher than in the pre-World War II period. This feature confirms our previous
explanation that the increase in top income shares in the United States since the 1970s is a
labor income phenomenon driven by an unprecedented surge in top wage incomes. Panel B in
Figure 7 displays the top 0.1% wage income share in the United States and Canada. There is a
striking parallelism between the two series. In both countries, the top 0.1% is around 1% in the
early 1970s and grows to 5.4% in the United States and to 4.3% in Canada. Thus, the surge in
top wages has been almost as large in Canada as in the United States.
All our evidence so far has been based on cross-sectional annual income concentration. How-
ever, if the increased cross-sectional income concentration that we documented in Anglo-Saxon33Atkinson and Voitchovsky (2004) have constructed top earnings shares for the United Kingdom for the post-
World War II period.
21

countries has been associated with a substantial increase in income mobility, it might be the case
that permanent income inequality has not changed much. For example, a substantial fraction of
the increase in top wage incomes in North-America has been due to the explosion of stock-option
compensation. As stock-options are reported as wage income on tax returns only when they are
exercised, it is plausible to think that top wage income earners today experience much larger
year to year fluctuations in earnings than 25 years ago. As permanent income inequality is a
better measure of disparity in welfare, it is therefore very important to analyze as how income
mobility at the top has evolved in the recent decades.
In most countries, there is no longitudinal data on top income earners to carry out such
a study. Canada, however, has constructed a longitudinal administrative database (LAD) of
individual tax returns since 1982 which is analyzed in Saez and Veall (2004). They explore
income mobility at the top in two ways. First, they recompute top income shares based on
average income over three or five years instead of a single year. If high incomes were relatively
transitory, we would expect to see less concentration when incomes are measured over a longer
time period. Figure 8, Panel A plots the top 0.1% income share using one year, three year and
five year centered averages. The three curves match almost perfectly suggesting that income
mobility has not increased significantly in recent years. Second and more directly, Panel B
reports the probability of remaining in the top 0.1% group is about 60% one year later, about
50% two years later and between 40% and 50% three years later. This suggests that mobility
at the top is quite modest. Consistent with the Panel A results, there is no increase in mobility
since 1982, perhaps even a slight decrease. Those Canadian results suggest that the surge in
annual income concentration documented in Canada is associated with a similar increase in
longer term income concentration and welfare. From the Canadian findings, it seems plausible
that the surge in top U.S. incomes is also not primarily due to increased mobility.
A number of studies (see e.g., Feldstein (1995) and Feenberg and Poterba (1993,2000)) have
argued that the dramatic increase in those top incomes in the United States might have been the
consequence of the very large marginal tax rate reductions which took place in the 1980s during
the Reagan Administrations. Indeed, similar tax changes took place in the United Kingdom, a
country which also experienced a rise in top income shares, but no such reductions took place in
22

France which experienced no increase in top incomes.34 Saez (2004) analyzes the link between
top income shares and marginal tax rates in the United States for the 1960-2000 period. Panel
A of Figure 9 displays the average (income weighted) marginal income tax rate for the top 0.1%
income group, along with the share of income accruing for this group in the United States from
1960 to 2000. The figure clearly shows a jump in the top income share from 1986 to 1988, exactly
when the tax rates for high income earners were reduced by the Tax Reform Act of 1986 from
50% to 28% (a point first noted by Feenberg and Poterba, 1993).35 However, although top tax
rates decreased substantially in the early 1960s (from around 90% to 70% at the very top), the
surge in top incomes did not start before the 1970s. Second, the surge in top incomes has been
strongest in the late 1990s, when the top marginal tax rate increased significantly from around
30% to around 40%.36
A more detailed analysis presented in Saez (2004) shows that there is clear evidence of income
shifting (from the corporate sector toward the individual sector) following the tax cuts of the
1980s, and that there is evidence of short-term responses to top wage incomes around the Tax
Reform Act of 1986 and the tax increase of 1993.37 However, the evidence suggests that the
secular increase in top wage incomes is not closely related to the timing of tax changes in the
United States. If there is a substantial lag in the response of top wage incomes to changes in
tax rates, it becomes very difficult to distinguish the impact of tax effects from other effects on
the top tail of the wage income distribution.
The case of Canada, analyzed by Saez and Veall (2003), casts interesting light on this issue.
As we showed on Panel B of Figure 7, Canada experienced almost the same increase in top wage34The Netherlands experienced also small top tax rates reductions and no increase in top incomes.35The top income share also increased following the marginal tax cuts of the early 1980s (a point first noted by
Lindsey, 1987) but much less than from 1986 to 1988.36Companies, however, might have started granting stock-options more aggressively after the Tax Reform Act
of 1986 because of the decrease in individual tax rates. Those options can be exercised (and thus appear on
individual income tax returns) only a number of years later. Hall and Murphy (2003) show, however, that grants
of new stock-options, valued using the Black-Scholes formula, increased massively after the tax increase of 1993.37Goolsbee (2000) showed convincingly, using executive compensation data, that most of the short-term response
in wage income around the 1993 tax increase was due to a surge in stock-option exercises in 1992 in order to
take advantage of the last year with low tax rates. Goolsbee (2000) finds no evidence of a long-term response of
executive compensation to changes in tax rates.
23

incomes as the United States. However, the fiscal developments in the two countries have been
quite different. Panel B of Figure 9 displays the average marginal tax rate for the top 0.1%
incomes in Canada (along the top 0.1% income share). While the top 0.1% income group in the
United States experienced a reduction in marginal tax rates from 70% to less than 30% from
the early 1960s to the late 1980s, marginal tax rates in Canada for the top 0.1% were about the
same (around 50%) in the early 1960s and the 1990s. Therefore, it seems difficult to attribute
the dramatic increase in top wage income shares in Canada uniquely to the modest tax cuts
that have been implemented there.
Saez and Veall (2003) show that Francophones in Quebec experienced a much smaller increase
in top wage income shares than Canadians in other provinces. This evidence, together with
direct evidence on the migration of highly skilled and educated workers from Canada toward
the United States, suggests that the surge in top wages in Canada might have been driven
by brain-drain threats from the United States. As top wages in the United States increased,
migrating to the United States became more attractive for highly skilled Canadians, and thus
Canadian companies had to increase the salaries of their best paid workers in order to retain
them. If this explanation is true, it cannot be the case that the surge in top wages that has been
observed in the United States can be entirely due to changes in tax avoidance such as shifts
from the corporate to the individual sector or repackaging of income. If that were the case, the
United States would not have become a significantly more attractive option for Canadians and
hence wages would not have increased in Canada.
Thus, the extraordinary increase in top wage incomes in anglo-saxon countries, a phe-
nomenon certainly closely related to the explosion of the compensation of CEOs and other
top executives, sports, movies, and television stars does not appear to be obviously and directly
related to changes in tax code. A more pertinent question to ask is perhaps whether this surge
in top wages could have occurred in the United States, had the tax structure remained the same
as in the early 1960s, and the working rich had to pay in taxes more than three quarters of their
earnings. It is plausible to think that the drastic reduction in top marginal tax rates, which
started in the 1960s, opened the possibility of the dramatic increase in top wages that started
in the 1970s, and accelerated in the 1980s and the 1990s. It is of course impossible to provide a
convincing answer to that important question by looking only at individual income tax statistics
24

in the United States. A promising way to make progress would be look more closely into the top
salaries surge phenomenon by analyzing executive compensation data. There is a large literature
on executive compensation (see Murphy, 1999 for a survey). However, although there are many
studies explaining disparity of CEO pay in cross-sectional data, no convincing explanation for
the time series evidence seems to have been provided.38 There is strong evidence that pay might
not reflect marginal productivity for top executives. For example, Bertrand and Mullainathan
(2001) have shown convincingly that CEOs’ pay reacts to shocks outside of CEOs control, such
as oil price shocks, which suggests that the standard model where compensation equals marginal
productivity is excessively naive. The question that arises is whether the recent surge in top
wage incomes has reduced or increased the gap between CEO pay and marginal productivity.
If increased CEO pay represents increased skimming of corporations rather than increases in
managerial productivity, it is important to understand whether tax policy (such as an increase
in top income tax rates) or regulatory policies (such as requiring the inclusion of stock-options
grants as costs in corporations’ public accounts) can be effective to curb this market failure.38It is quite telling to read in the recent survey of Hall and Murphy (2003), two prominent and conservative
researchers in this field, that their best explanation for the surge in stock-option compensation was that “boards
and managers falsely perceive stock options to be inexpensive because of accounting and cash-flow considerations”.
25

References
Atkinson, Anthony B. (2002) “Top Incomes in the United Kingdom over the Twentieth Century”,
mimeo Nuffield College, Oxford.
Atkinson, Anthony B. (2003) “Measuring Top Incomes: Methodological Issues”, mimeo Nuffield
College, Oxford.
Atkinson, Anthony B. and A. J. Harrison (1978) Distribution of Personal Wealth in Britain,
Cambridge University Press: Cambridge.
Atkinson, Anthony B. ,Gordon, J. P. F. and Harrison A. J., (1989), “Trends in the Shares of
Top Wealth Holders in Britain, 1923-1981”, Oxford Bulletin of Economics and Statistics, 51(3),
315-332.
Atkinson, Anthony B. and Andrew Leigh (2003) “The Distribution of Top Incomes in Anglo-
Saxon Countries over the Twentieth Century”, mimeo Nuffield College, Oxford.
Atkinson, Anthony B. and Wiemer Salverda (2003) “Top Incomes in the Netherlands and the
United Kingdom over the Twentieth Century”, mimeo Nuffield College, Oxford.
Atkinson, Anthony B. and S. Voitchovsky (2004) “The Distribution of Top Earnings in the
United Kingdom since the Second World War”, mimeo Nuffield College, Oxford.
Bertrand, Marianne and Mullainathan, Sendhil (2001) “Are CEOs Rewarded for Luck? The
Ones Without Principals Are” Quarterly Journal of Economics 116(3), 901-932
Dell, Fabien (2003) “Top Incomes in Germany over the Twentieth Century: 1895-1995”, INSEE
mimeo.
Dell, Fabien, Thomas Piketty, and Emmanuel Saez (2003) “The Evolution of Income and Wealth
Concentration in Switzerland over the 20th Century”, mimeo UC Berkeley.
Feenberg, Daniel, and James Poterba (1993). “Income Inequality and the Incomes of Very High
Income Taxpayers: Evidence from Tax Returns”, In Tax Policy and the Economy ed. J. Poterba,
(MIT Press: Cambridge), 7, 145-177.
Feenberg, Daniel, and James Poterba (2000). “The Income and Tax Share of Very High Income
Households, 1960-1995”, American Economic Review, 90(2), 264-270.
Feldstein, Martin (1995). “The Effect of Marginal Tax Rates on Taxable Income: A Panel Study
of the 1986 Tax Reform Act.” Journal of Political Economy 103(3), 551-572.
26

Goldin, Claudia and Robert Margo (1992) “The Great Compression: The Wage Structure in
the United States at Mid-Century”, Quarterly Journal of Economics 107(1), 1-34.
Goolsbee, Austan (2000). “What Happens When You Tax the Rich? Evidence from executive
compensation.” Journal of Political Economy 108(2), 352-378.
Gordon, Roger, and Jeffrey MacKie-Mason (1990). “Effects of the Tax Reform Act of 1986 on
Corporate Financial Policy and Organizational Form” In Slemrod J. (Ed.) Do Taxes Matter?
The Impact of the Tax Reform Act of 1986, Cambridge: MIT Press.
Gordon, Roger, and Joel Slemrod (2000). “Are ‘Real’ Responses to Taxes Simply Income
Shifting Between Corporate and Personal Tax Bases?” In Slemrod J. (Ed.) Does Atlas Shrug?
The Economic Consequences of Taxing the Rich, New York: Russell Sage Foundation.
Hall, Brian, and Kevin Murphy (2003) “The Trouble with Stock Options”, NBER Working
Paper No. 9784.
Kopczuk, Wojciech and Emmanuel Saez (2004) “Top Wealth Shares in the United States, 1916-
2000: Evidence from Estate Tax Returns”, NBER Working Paper, forthcoming.
Kuznets, Simon. (1953), Shares of Upper Income Groups in Income and Savings, National
Bureau of Economic Research.
Kuznets, Simon. (1955). “Economic Growth and Economic Inequality.” American Economic
Review 45, 1-28.
Lampman, Robert J. (1962), The Share of Top Wealth-Holders in National Wealth, 1922-1956,
NBER and Princeton University Press.
Lindert, Peter (2000), “Three Centuries of Inequality in Britain and America”, in Handbook of
Income Distribution, edited by A. Atkinson and F. Bourguignon, 167-216, North-Holland.
Lindsey, Lawrence (1987). “Individual Taxpayer Response to Tax Cuts: 1982-1984, with Impli-
cations for the Revenue Maximizing Tax Rate.” Journal of Public Economics 33, 173-206.
Morrison, Christian (2000), “Historical Perspectives on Income Distribution: The Case of Eu-
rope”, in Handbook of Income Distribution, edited by A. Atkinson and F. Bourguignon, 217-260,
North-Holland.
Murphy, Kevin J. (1999). “Executive Compensation.” in Handbook of Labor Economics, eds.
O. Ashenfelter and D. Card, Amsterdam: North-Holland, Volume 3B.
Pareto, Vilfredo (1897). Cours d’Economie Politique, Volume II, (Pichon: Paris)
27

Piketty, Thomas (2001), Les hauts revenus en France au 20eme siecle - Inegalites et redistribu-
tions, 1901-1998, Paris : Editions Grasset.
Piketty, Thomas (2003), “Income Inequality in France, 1901-1998”, Journal of Political Economy
111(5), 1004-1042.
Piketty Thomas, and Emmanuel Saez (2003), “Income Inequality in the United States, 1913-
1998”, Quarterly Journal of Economics, 118(1), 1-39, series updated to year 2000.
Saez, Emmanuel (2004). “Reported Incomes and Marginal Tax Rates, 1960-2000: Evidence and
Policy Implications.” in ed. J. Poterba, Tax Policy and the Economy (MIT Press: Cambridge),
18.
Saez, Emmanuel and Michael R. Veall (2003), “The Evolution of Top Incomes in Canada, 1920-
2000”, NBER Working Paper No. 9607.
Saez, Emmanuel and Michael R. Veall (2004), “The Evolution of High Incomes in Northern
America: Lessons from Canadian Evidence”, University of California at Berkeley mimeo.
Slemrod, Joel (1996). “High Income Families and the Tax Changes of the 1980s: the Anatomy
of Behavioral Response.” In Empirical Foundations of Household Taxation, eds. M. Feldstein
and J. Poterba, University of Chicago.
Stewart, Kenneth J., and Stephen B. Reed (1999). “CPI Research Series Using Current Methods,
1978-98.” Monthly Labor Review, 122(6), June, 29-38.
U.S. Treasury Department, Internal Revenue Service (1996) “Federal Tax Compliance Research:
Individual Income Tax Gap Estimates for 1985, 1988, and 1992.” Publication 1415, (Washing-
ton, D.C.).
U.S. Treasury Department, Internal Revenue Service, Annual since 1916 Statistics of Income:
Individual Income Tax Returns. (Washington, D.C.).
28

FIGURE 1Average Real Incomes in the US, UK, France, and Switzerland, 1913-2000
Sources: France, Piketty (2001), Figure 1-6, United States, Piketty and Saez (2003), Table 2 Switzerland, Dell, Piketty, and Saez (2003), Table A; United Kingdom, Aktinson and Salverda (2003)Average real income per tax unit (defined at the family level as in the current US tax code)All incomes figures are first expressed in real value in the domestic currency for year 2000 and then convertedin dollars using the 2/20/2004 exchange rate.
$0
$5,000
$10,000
$15,000
$20,000
$25,000
$30,000
$35,000
$40,000
$45,000
$50,000
1913
1918
1923
1928
1933
1938
1943
1948
1953
1958
1963
1968
1973
1978
1983
1988
1993
1998
Ave
rage
Rea
l Inc
omes
France
Switzerland
United Kingdom
United States

FIGURE 2.Top 1% and Top 10-1% Income Shares in the United States and France, 1913-2000
Source: United States, Piketty and Saez (2003), France, Piketty (2001)Top 10-1% is the top decile excluding the top 1%.The unit is the family.
A. Top 1% Income Share
0%
2%
4%
6%
8%
10%
12%
14%
16%
18%
20%
22%19
13
1918
1923
1928
1933
1938
1943
1948
1953
1958
1963
1968
1973
1978
1983
1988
1993
1998
Inco
me
Shar
e
United States France
B. Top 10-1% Income Share
0%
5%
10%
15%
20%
25%
30%
35%
1913
1918
1923
1928
1933
1938
1943
1948
1953
1958
1963
1968
1973
1978
1983
1988
1993
1998
Inco
me
Shar
e
United States France

FIGURE 3.Top 0.1% Income Shares in Anglo-Saxon countries versus Continental Europe, 1913-2000
Source: United States, Piketty and Saez (2003), United Kingdom, Atkinson (2002), Canada, Saez and Veall (2003)France, Piketty (2001), Netherlands, Atkinson and Salverda (2003)The unit for all countries except Canada is the family. The unit for Canada is the individual adult.
A. Top 0.1% incomne share in Anglo-Saxon Countries
0%
2%
4%
6%
8%
10%
12%19
13
1918
1923
1928
1933
1938
1943
1948
1953
1958
1963
1968
1973
1978
1983
1988
1993
1998
Inco
me
Shar
e
United States United Kingdom Canada
B. Top 0.1% income share in Continental Europe Countries
0%
2%
4%
6%
8%
10%
12%
14%
1913
1918
1923
1928
1933
1938
1943
1948
1953
1958
1963
1968
1973
1978
1983
1988
1993
1998
Inco
me
Shar
e
Netherlands France

FIGURE 4.Top 0.1% Income Share and Composition in France and the United States, 1916-2000
Source: United States, Piketty and Saez (2003), France, Piketty (2001), Table B-18Capital income is dividends, interest income, rents, etc. but excludes capital gainsBusiness income is self-employment income and profits from unincorporated businesses (and S-corporations in the US) Wages and salaries include also pensions (and stock options exercises).
A. Top 0.1% share and composition in France
0%
1%
2%
3%
4%
5%
6%
7%
8%
9%
10%19
17
1922
1927
1932
1937
1942
1947
1952
1957
1962
1967
1972
1977
1982
1987
1992
1997
Inco
me
Shar
e
Capital Income Business Income Wages and Salaries
B. Top 0.1% share and composition in the United States
0%
1%
2%
3%
4%
5%
6%
7%
8%
9%
10%
1916
1921
1926
1931
1936
1941
1946
1951
1956
1961
1966
1971
1976
1981
1986
1991
1996
Inco
me
Shar
e
Capital Income Business Income Wages and Salaries

FIGURE 5The Top 1% Wealth Share in the United States, the United Kingdom, and France
Sources: United States, Kopczuk and Saez (2003)United Kingdom: 1913-1972, Atkinson and Harrison (1978), p. 159, Column Top 1%, England and Wales. 1976-2000: Inland Revenue Personal Wealth (Top 1% Marketable net worth series for adult population, Table 13.5) http://www.inlandrevenue.gov.uk/stats/personal_wealth/dopw_t05_1.htmFrance: Piketty, Postel-Vinay, and Rosenthal (2003), Table 4, Top 1% estate share (wealth shares not yet available)
0%
10%
20%
30%
40%
50%
60%19
13
1918
1923
1928
1933
1938
1943
1948
1953
1958
1963
1968
1973
1978
1983
1988
1993
1998
Wea
lth S
hare
(in
%)
United States United Kingdom France

FIGURE 6.Comparing Switzerland to the United States
Source: United States, Piketty and Saez (2003), Switzerland, Dell, Piketty, and Saez (2003)
A. Top 1% wealth share, 1915-2000
0%
5%
10%
15%
20%
25%
30%
35%
40%
45%
50%19
15
1920
1925
1930
1935
1940
1945
1950
1955
1960
1965
1970
1975
1980
1985
1990
1995
2000
Inco
me
Shar
e
Switzerland United States
B. Top 1% income share, 1933-2000
0%
2%
4%
6%
8%
10%
12%
14%
16%
18%
20%
1933
1938
1943
1948
1953
1958
1963
1968
1973
1978
1983
1988
1993
1998
Inco
me
Shar
e
Switzerland United States

FIGURE 7.The Pattern of Top Wage Income Shares
Source: United States, Piketty and Saez (2003), France, Piketty (2001)
A. Top 1% Wage Income Share in France and the US, 1923-2000
0%
2%
4%
6%
8%
10%
12%
14%19
23
1928
1933
1938
1943
1948
1953
1958
1963
1968
1973
1978
1983
1988
1993
1998
Inco
me
Shar
e
United States France
B. Top 0.1% Wage Income Share in Canada and the US
0%
1%
2%
3%
4%
5%
6%
1972
1974
1976
1978
1980
1982
1984
1986
1988
1990
1992
1994
1996
1998
2000
Inco
me
Shar
e
United States Canada

FIGURE 8Mobility of High Incomes in Canada, 1982-2000
Source: Saez and Veall (2004). Computations based on the Longitudinal Administrative Database of individual Canadian tax returns.Panel A reports to top 0.1% income share for incomes averaged over one year, three years, and five years.Panel B reports the probability of staying in top 0.1% income group one year, two years, and three years after.
A. Top 0.1% Income Share, centered averages over various years
0%
1%
2%
3%
4%
5%
6%19
82
1984
1986
1988
1990
1992
1994
1996
1998
2000
Inco
me
Shar
e
1 year 3 years 5 years
B. Probability of staying in top 0.1% group
0%
10%
20%
30%
40%
50%
60%
70%
1982
1984
1986
1988
1990
1992
1994
1996
1998
Prob
abili
ty o
f sta
ying
in to
p gr
oup
1 year after 2 years after 3 years after

FIGURE 9Marginal Tax Rates and Income Share for the Top 0.1% in the United States and Canada, 1960-2000
Source: Saez and Veall (2004) for Canada and Saez (2004) for the United States. Marginal income tax rates are weighted by income.Marginal tax rates in Canada include federal and Ontario provincial income taxes, as well as applicable surtaxes and creditsUnited States marginal tax rates do not include state income taxes
B. Canada (including Ontario Provincial Tax)
0%
10%
20%
30%
40%
50%
60%
70%
80%
1960
1965
1970
1975
1980
1985
1990
1995
2000
Mar
gina
l Tax
Rat
e
0%
1%
2%
3%
4%
5%
6%
7%
8%
Inco
me
Shar
e
Marginal Tax Rate Top 0.1% Share
A. United States (excluding state income taxes)
0%
10%
20%
30%
40%
50%
60%
70%
80%19
60
1965
1970
1975
1980
1985
1990
1995
2000
Mar
gina
l Tax
Rat
e
0%
1%
2%
3%
4%
5%
6%
7%
8%
Inco
me
Shar
e
Marginal Tax Rate Top 0.1% Share