Embed Size (px)
Citation preview
NBER WORKING PAPER SERIES
NEW THEORETICAL PERSPECTIVES ON THE DISTRIBUTION OF
INCOME AND WEALTH AMONG INDIVIDUALS: PART III:LIFE CYCLE SAVINGS VS. INHERITED SAVINGS
Joseph E. Stiglitz
Working Paper 21191http://www.nber.org/papers/w21191
NATIONAL BUREAU OF ECONOMIC RESEARCH1050 Massachusetts Avenue
Cambridge, MA 02138May 2015
Financial support was provided by INET (the Institute for New Economic Thinking) and the FordFoundation Inequality Project at Roosevelt Institute, supported by the Ford and MacArthur Foundations,and the Bernard and Irene Schwartz Foundation. The views expressed herein are those of the authorand do not necessarily reflect the views of the National Bureau of Economic Research.
NBER working papers are circulated for discussion and comment purposes. They have not been peer-reviewed or been subject to the review by the NBER Board of Directors that accompanies officialNBER publications.
© 2015 by Joseph E. Stiglitz. All rights reserved. Short sections of text, not to exceed two paragraphs,may be quoted without explicit permission provided that full credit, including © notice, is given tothe source.
New Theoretical Perspectives on the Distribution of Income and Wealth among Individuals:Part III: Life Cycle Savings vs. Inherited SavingsJoseph E. StiglitzNBER Working Paper No. 21191May 2015JEL No. D31,D91,E21,E22
ABSTRACT
This paper extends the standard life cycle model to a world in which there are also capitalists. Weobtain simple formulae describing the equilibrium fraction of wealth held by life-cycle savers.
Using these formulae, we ascertain the effects of tax policy or changes in the parameters of the economy.The relative role of life cycle savings increases with the rate of growth and with the relative savingsrate of life-cycle savers and capitalists. An increase in the savings rate of workers has no effect onoutput per capita; life cycle savings simply crowds out inherited savings. A tax on capital (even ifproceeds are paid out to workers) is so shifted that capitalists are unaffected and that workers’ income(after transfers) and their share in national wealth are reduced. If the government invests the proceeds,the share of capital owned by life cycle savers may increase.
We extend the analysis to endogenously derive the distribution of the population between life cyclesavers and capitalists, in a model in which all individuals have identical non-linear savings functions.When wealth is low enough, bequests drop to zero. With stochastic returns, individuals move betweenthe two groups.
A second extension analyzes the effects of land. We ask whether land holding displaces the holdingof capital, resulting in workers being worse off. A tax on land, while reducing the value of land, leavesunchanged the capital-labor ratio, output per capita, and wages. But the tax reduces the aggregatevalue of wealth, and if the proceeds of the tax are distributed to workers, their income and life cyclesavings are increased. On both accounts, wealth inequality is reduced. Thus, consistent with HenryGeorge’s views, a tax on the returns on land, including capital gains, reduces inequality with no adverseeffect on national income.
Joseph E. StiglitzUris Hall, Columbia University3022 Broadway, Room 212New York, NY 10027and [email protected]
2
Introduction
A key concern in the growing inequality in the United States and other advanced countries is the worry
that we are giving rise to an inherited plutocracy. Piketty (2014) emphasized that with and the
rate of interest were greater than the rate of growth, inherited wealth would increase. On the other
hand, the fact that individuals are living longer and must save for their retirement means that life cycle
savings is increasing, reflected in part in the huge increase in pension funds.2 In this paper, one of a four
part series providing new theoretical perspectives on the distribution of income and wealth among
individuals, we construct a simple model incorporating both inherited and life cycle savings. (Part I
argued that one could not explain the increase in the wealth income ratio by standard neoclassical
models; but once one took into account rents and changes in the capitalized value of rents, one could;
Part II explained the distribution of wealth among individuals within a standard neoclassical model, but
again suggested that these models may not be able to explain the full extent of inequality in our society;
the final part, Part IV, explains the growth of rents more fully, and links this growth to the
financialization of the economy.)
We are able to obtain simple formulae describing the equilibrium share of wealth held by life cycle
savers. Using these formulae, we can easily ascertain the effects of, say, tax policy or changes in the
parameters of the economy. We show that an increase in the savings rate of workers (as a result, for
instance of encouraging them to save more) has no effect on output per capita, but does increase the
share of wealth of life cycle savers. Life cycle savings crowds out inherited savings. On the other hand, a
tax on capital (even if it is paid disproportionately by the rich capitalists, with proceeds paid out to
workers, and so is therefore viewed as progressive) will be so shifted that capitalists are unaffected and
workers’ income, including transfers, actually goes down, as does their share in national wealth. This
bears out a general theme of all four parts of this paper: tax policies have to be constructed to take into
account general equilibrium incidence effects.
The paper is divided into three parts, beyond the introduction and conclusion. The first is based on the
standard neoclassical model, without land and uncertainty. In the second, we derive endogenously the
distribution of the population between life cycle savers and capitalists. The two groups have identical
savings functions. The only difference is that when wealth is low enough, bequests drop to zero. With
stochastic returns, individuals move between the two groups. In the third section, we introduce land.
2 See Milevsky and Huang (2011). For statistics on the size of pension funds, see OECD (2013)
3
1. Basic Model
We assume two groups: There are workers who live two periods, and save for their retirement.3 Their
savings is referred to as “life cycle savings.” Then there are the capitalists, who save a fixed percentage
of their income, .4 For simplicity, we use a discrete time model.
In this section, output is produced by means of a neoclassical constant returns to scale production
function Q = F(K,L), where K is the capital stock and L the labor supply (there is full employment). k = K/L
is the capital labor ratio. Q/L = F/L = f(k) gives output per worker as a function of the capital labor ratio.
The return to capital is f’, and the wage rate is f – kf’. We assume that the number of capitalists and
workers increase at the same rate, n (assumed here to be exogenous.) (In this simple version, we ignore
labor augmenting technological progress. It is straightforward to bring it into the analysis.)
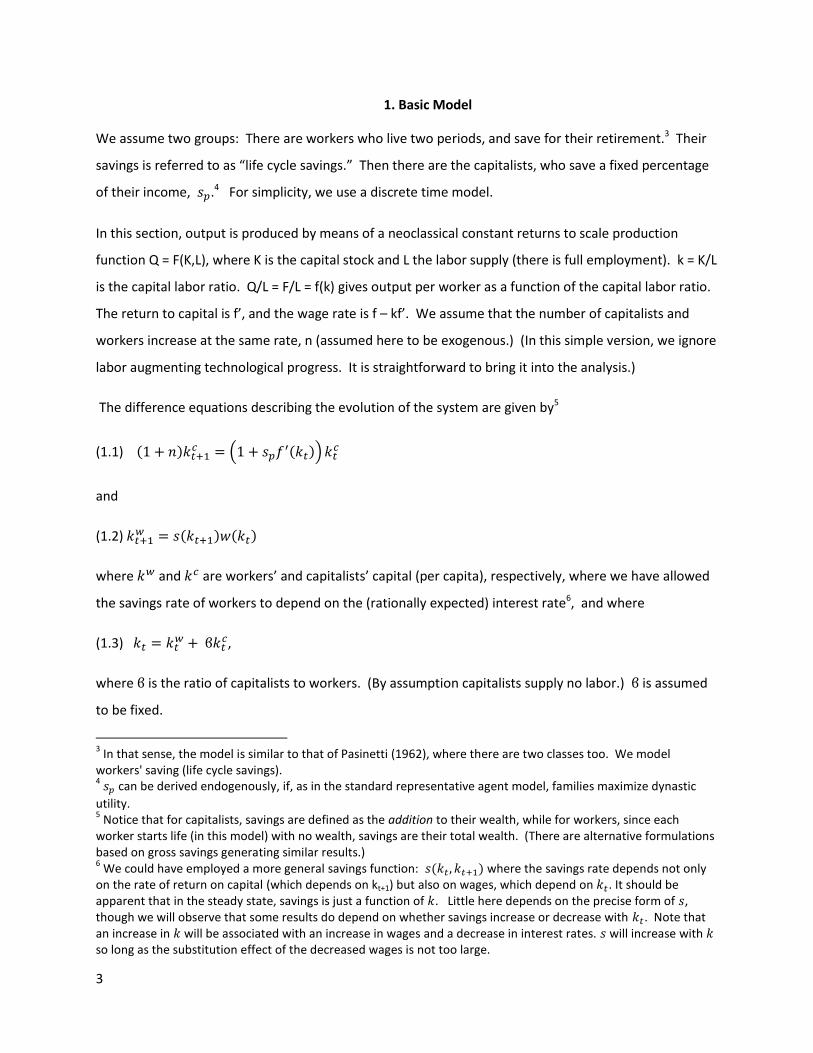
The difference equations describing the evolution of the system are given by5
(1.1)
and
(1.2)
where and are workers’ and capitalists’ capital (per capita), respectively, where we have allowed
the savings rate of workers to depend on the (rationally expected) interest rate6, and where
(1.3)
,
where is the ratio of capitalists to workers. (By assumption capitalists supply no labor.) is assumed
to be fixed.
3 In that sense, the model is similar to that of Pasinetti (1962), where there are two classes too. We model
workers' saving (life cycle savings). 4 can be derived endogenously, if, as in the standard representative agent model, families maximize dynastic
utility. 5 Notice that for capitalists, savings are defined as the addition to their wealth, while for workers, since each
worker starts life (in this model) with no wealth, savings are their total wealth. (There are alternative formulations based on gross savings generating similar results.) 6 We could have employed a more general savings function: where the savings rate depends not only
on the rate of return on capital (which depends on kt+1) but also on wages, which depend on . It should be apparent that in the steady state, savings is just a function of . Little here depends on the precise form of , though we will observe that some results do depend on whether savings increase or decrease with . Note that an increase in will be associated with an increase in wages and a decrease in interest rates. will increase with so long as the substitution effect of the decreased wages is not too large.
4
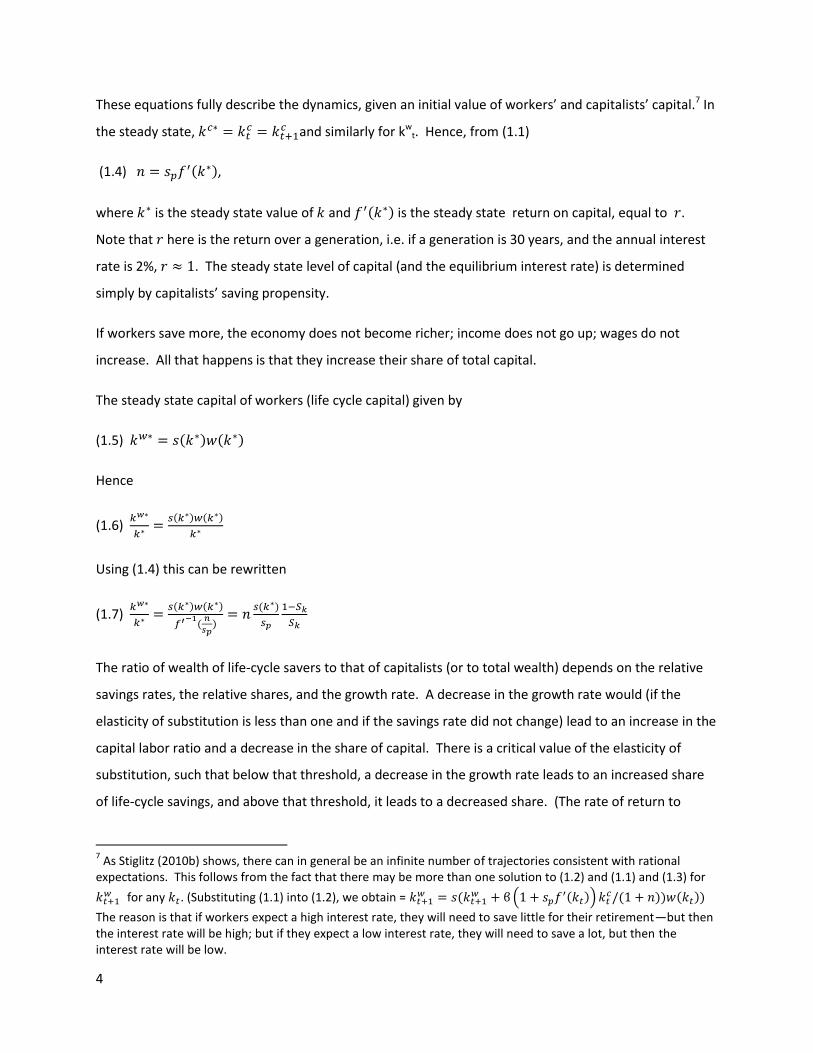
These equations fully describe the dynamics, given an initial value of workers’ and capitalists’ capital.7 In
the steady state,
and similarly for kwt. Hence, from (1.1)
(1.4) ,
where is the steady state value of and is the steady state return on capital, equal to .
Note that here is the return over a generation, i.e. if a generation is 30 years, and the annual interest
rate is 2%, . The steady state level of capital (and the equilibrium interest rate) is determined
simply by capitalists’ saving propensity.
If workers save more, the economy does not become richer; income does not go up; wages do not
increase. All that happens is that they increase their share of total capital.
The steady state capital of workers (life cycle capital) given by
(1.5)
Hence
(1.6)
Using (1.4) this can be rewritten
(1.7)
The ratio of wealth of life-cycle savers to that of capitalists (or to total wealth) depends on the relative
savings rates, the relative shares, and the growth rate. A decrease in the growth rate would (if the
elasticity of substitution is less than one and if the savings rate did not change) lead to an increase in the
capital labor ratio and a decrease in the share of capital. There is a critical value of the elasticity of
substitution, such that below that threshold, a decrease in the growth rate leads to an increased share
of life-cycle savings, and above that threshold, it leads to a decreased share. (The rate of return to
7 As Stiglitz (2010b) shows, there can in general be an infinite number of trajectories consistent with rational
expectations. This follows from the fact that there may be more than one solution to (1.2) and (1.1) and (1.3) for
for any . (Substituting (1.1) into (1.2), we obtain =
The reason is that if workers expect a high interest rate, they will need to save little for their retirement—but then the interest rate will be high; but if they expect a low interest rate, they will need to save a lot, but then the interest rate will be low.
5
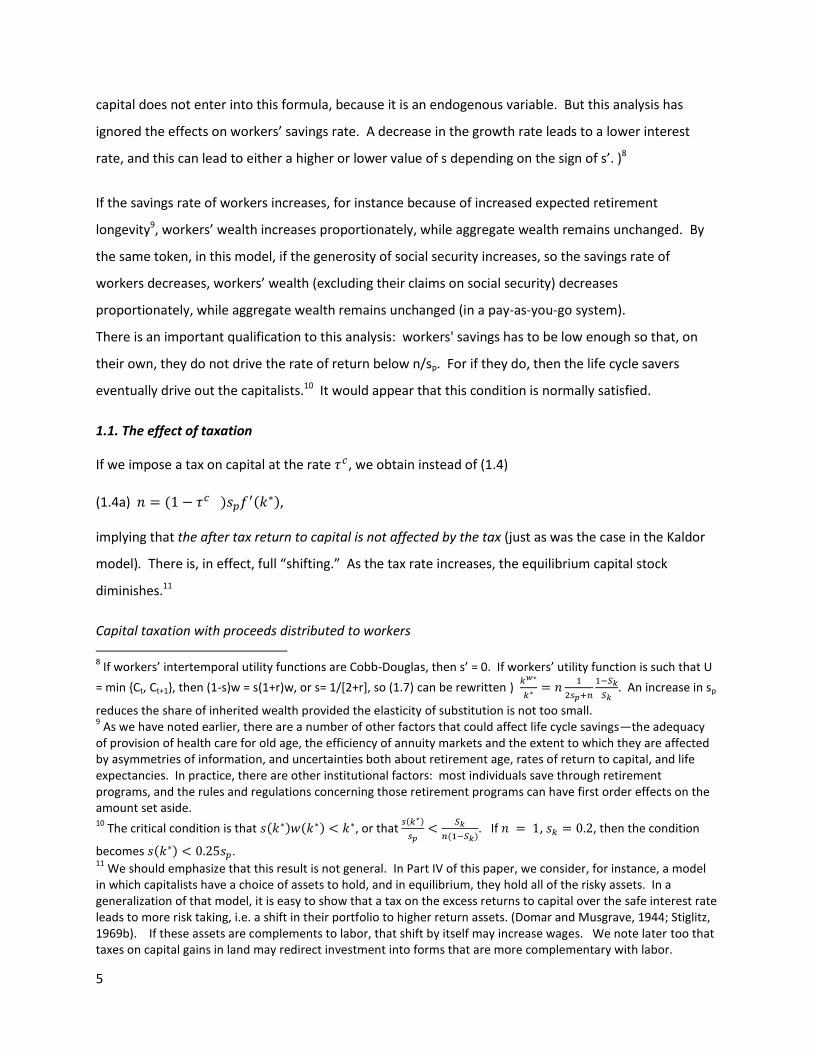
capital does not enter into this formula, because it is an endogenous variable. But this analysis has
ignored the effects on workers’ savings rate. A decrease in the growth rate leads to a lower interest
rate, and this can lead to either a higher or lower value of s depending on the sign of s’. )8
If the savings rate of workers increases, for instance because of increased expected retirement
longevity9, workers’ wealth increases proportionately, while aggregate wealth remains unchanged. By
the same token, in this model, if the generosity of social security increases, so the savings rate of
workers decreases, workers’ wealth (excluding their claims on social security) decreases
proportionately, while aggregate wealth remains unchanged (in a pay-as-you-go system).
There is an important qualification to this analysis: workers' savings has to be low enough so that, on
their own, they do not drive the rate of return below n/sp. For if they do, then the life cycle savers
eventually drive out the capitalists.10 It would appear that this condition is normally satisfied.
1.1. The effect of taxation
If we impose a tax on capital at the rate , we obtain instead of (1.4)
(1.4a) ,
implying that the after tax return to capital is not affected by the tax (just as was the case in the Kaldor
model). There is, in effect, full “shifting.” As the tax rate increases, the equilibrium capital stock
diminishes.11
Capital taxation with proceeds distributed to workers
8 If workers’ intertemporal utility functions are Cobb-Douglas, then s’ = 0. If workers’ utility function is such that U
= min {Ct, Ct+1}, then (1-s)w = s(1+r)w, or s= 1/[2+r], so (1.7) can be rewritten )
. An increase in sp
reduces the share of inherited wealth provided the elasticity of substitution is not too small. 9 As we have noted earlier, there are a number of other factors that could affect life cycle savings—the adequacy
of provision of health care for old age, the efficiency of annuity markets and the extent to which they are affected by asymmetries of information, and uncertainties both about retirement age, rates of return to capital, and life expectancies. In practice, there are other institutional factors: most individuals save through retirement programs, and the rules and regulations concerning those retirement programs can have first order effects on the amount set aside. 10
The critical condition is that , or that
. If , , then the condition
becomes . 11
We should emphasize that this result is not general. In Part IV of this paper, we consider, for instance, a model in which capitalists have a choice of assets to hold, and in equilibrium, they hold all of the risky assets. In a generalization of that model, it is easy to show that a tax on the excess returns to capital over the safe interest rate leads to more risk taking, i.e. a shift in their portfolio to higher return assets. (Domar and Musgrave, 1944; Stiglitz, 1969b). If these assets are complements to labor, that shift by itself may increase wages. We note later too that taxes on capital gains in land may redirect investment into forms that are more complementary with labor.
6
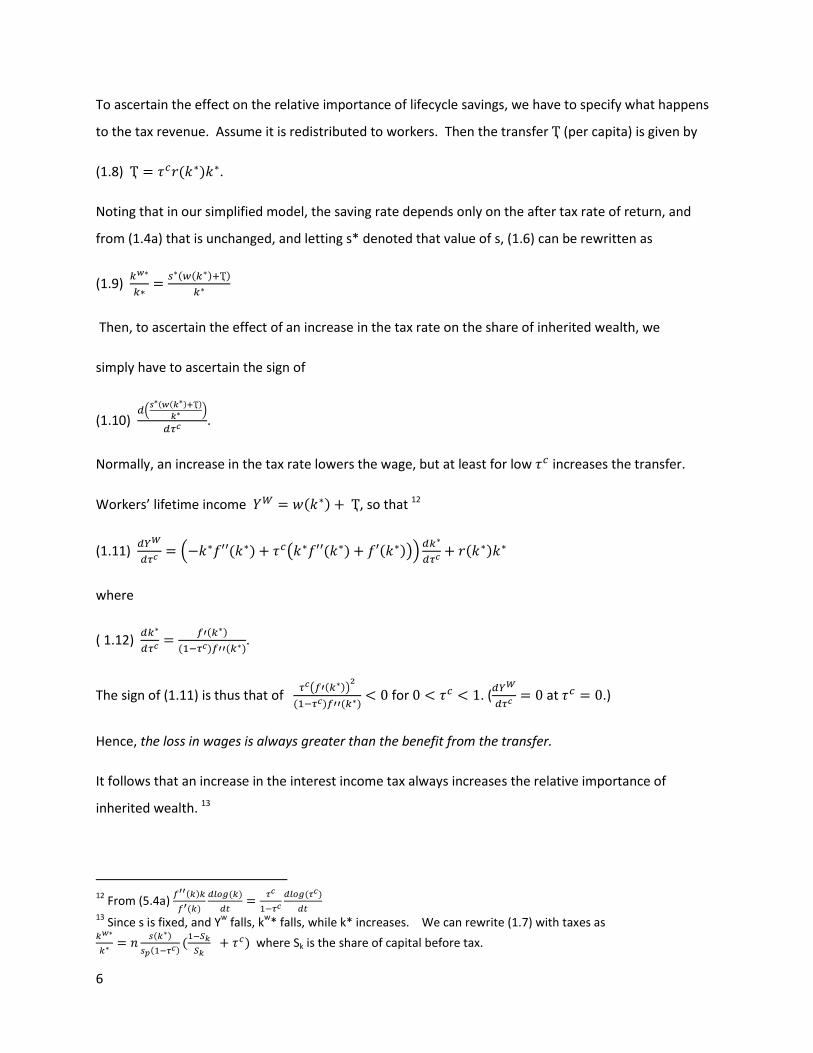
To ascertain the effect on the relative importance of lifecycle savings, we have to specify what happens
to the tax revenue. Assume it is redistributed to workers. Then the transfer (per capita) is given by
(1.8) .
Noting that in our simplified model, the saving rate depends only on the after tax rate of return, and
from (1.4a) that is unchanged, and letting s* denoted that value of s, (1.6) can be rewritten as
(1.9)
Then, to ascertain the effect of an increase in the tax rate on the share of inherited wealth, we
simply have to ascertain the sign of
(1.10)
.
Normally, an increase in the tax rate lowers the wage, but at least for low increases the transfer.
Workers’ lifetime income , so that 12
(1.11)
where
( 1.12)
.
The sign of (1.11) is thus that of
for . (
at .)
Hence, the loss in wages is always greater than the benefit from the transfer.
It follows that an increase in the interest income tax always increases the relative importance of
inherited wealth. 13
12
From (5.4a)
13 Since s is fixed, and Y
w falls, k
w* falls, while k* increases. We can rewrite (1.7) with taxes as
where Sk is the share of capital before tax.
7
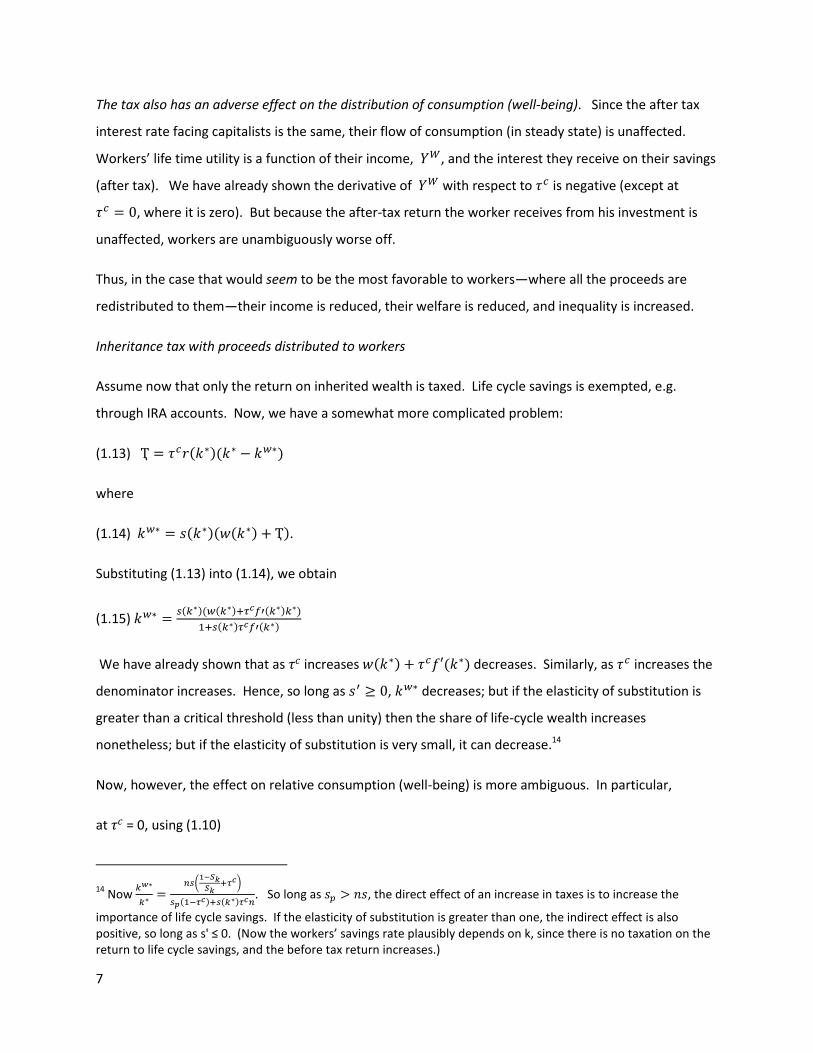
The tax also has an adverse effect on the distribution of consumption (well-being). Since the after tax
interest rate facing capitalists is the same, their flow of consumption (in steady state) is unaffected.
Workers’ life time utility is a function of their income, , and the interest they receive on their savings
(after tax). We have already shown the derivative of with respect to is negative (except at
, where it is zero). But because the after-tax return the worker receives from his investment is
unaffected, workers are unambiguously worse off.
Thus, in the case that would seem to be the most favorable to workers—where all the proceeds are
redistributed to them—their income is reduced, their welfare is reduced, and inequality is increased.
Inheritance tax with proceeds distributed to workers
Assume now that only the return on inherited wealth is taxed. Life cycle savings is exempted, e.g.
through IRA accounts. Now, we have a somewhat more complicated problem:
(1.13)
where
(1.14) .
Substituting (1.13) into (1.14), we obtain
(1.15)
We have already shown that as increases decreases. Similarly, as increases the
denominator increases. Hence, so long as , decreases; but if the elasticity of substitution is
greater than a critical threshold (less than unity) then the share of life-cycle wealth increases
nonetheless; but if the elasticity of substitution is very small, it can decrease.14
Now, however, the effect on relative consumption (well-being) is more ambiguous. In particular,
at = 0, using (1.10)
14 Now
. So long as , the direct effect of an increase in taxes is to increase the
importance of life cycle savings. If the elasticity of substitution is greater than one, the indirect effect is also positive, so long as s' ≤ 0. (Now the workers’ savings rate plausibly depends on k, since there is no taxation on the return to life cycle savings, and the before tax return increases.)
8
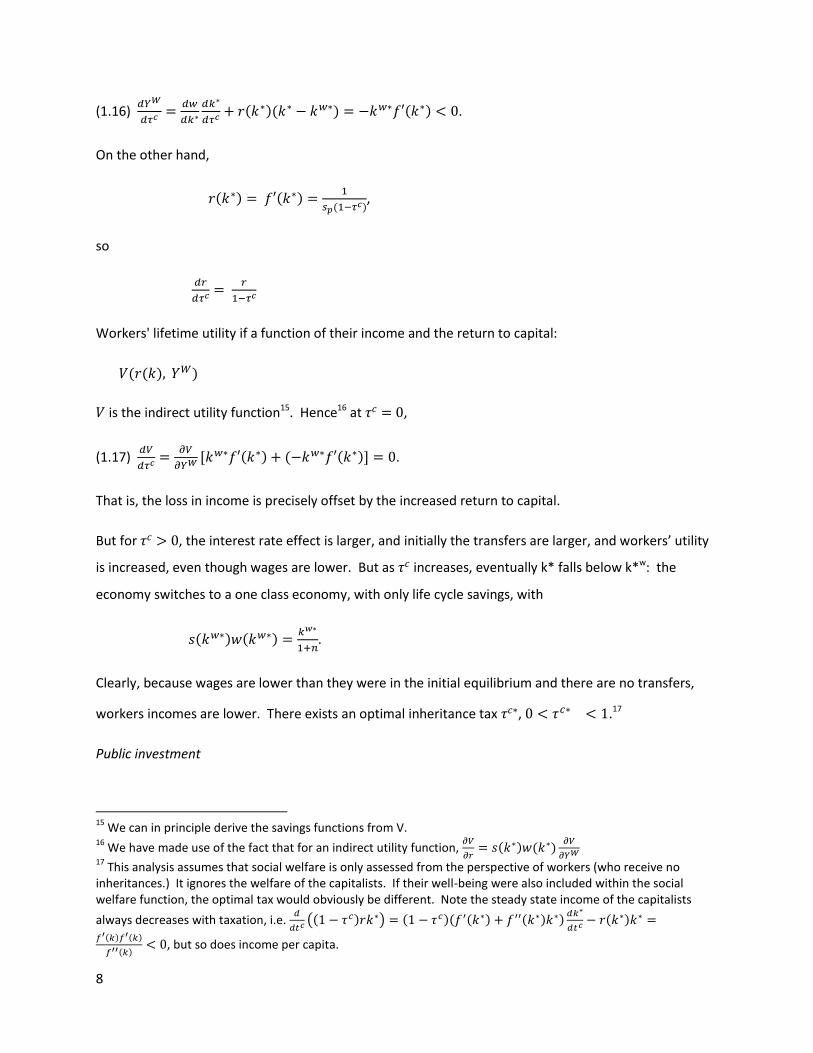
(1.16)
.
On the other hand,
,
so
Workers' lifetime utility if a function of their income and the return to capital:
is the indirect utility function15. Hence16 at ,
(1.17)
.
That is, the loss in income is precisely offset by the increased return to capital.
But for , the interest rate effect is larger, and initially the transfers are larger, and workers’ utility
is increased, even though wages are lower. But as increases, eventually k* falls below k*w: the
economy switches to a one class economy, with only life cycle savings, with
.
Clearly, because wages are lower than they were in the initial equilibrium and there are no transfers,
workers incomes are lower. There exists an optimal inheritance tax , .17
Public investment
15
We can in principle derive the savings functions from V. 16
We have made use of the fact that for an indirect utility function,
17 This analysis assumes that social welfare is only assessed from the perspective of workers (who receive no
inheritances.) It ignores the welfare of the capitalists. If their well-being were also included within the social welfare function, the optimal tax would obviously be different. Note the steady state income of the capitalists
always decreases with taxation, i.e.
, but so does income per capita.
9
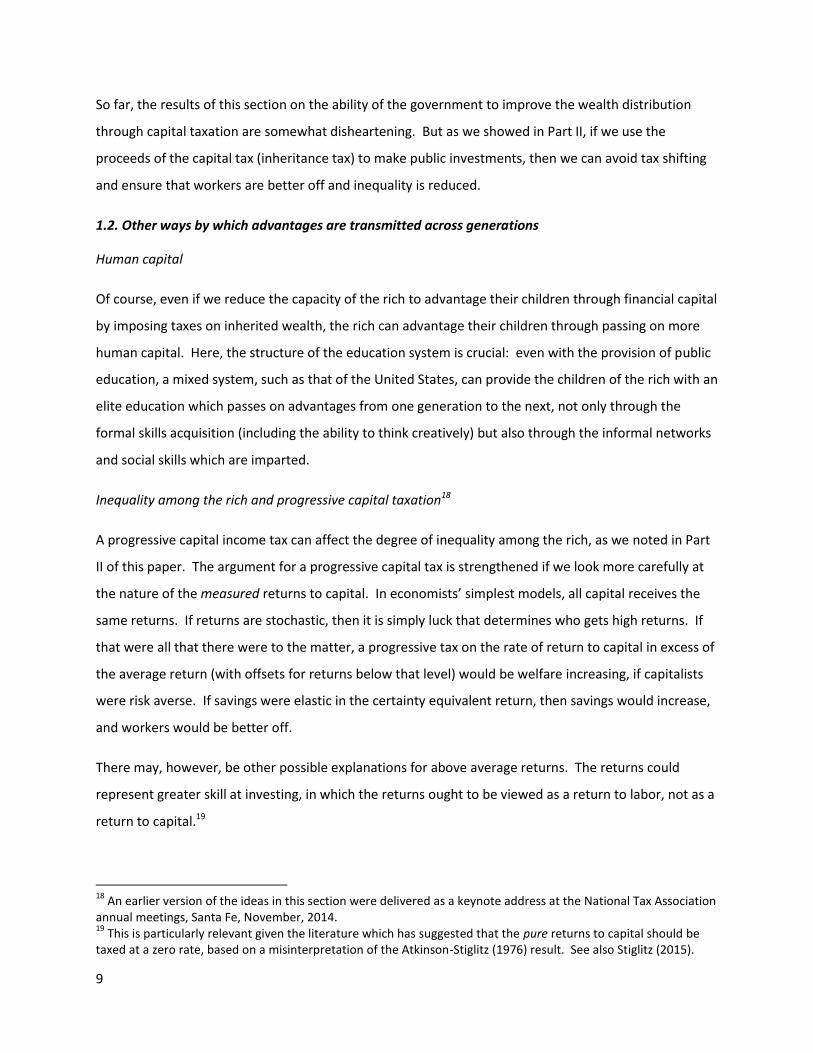
So far, the results of this section on the ability of the government to improve the wealth distribution
through capital taxation are somewhat disheartening. But as we showed in Part II, if we use the
proceeds of the capital tax (inheritance tax) to make public investments, then we can avoid tax shifting
and ensure that workers are better off and inequality is reduced.
1.2. Other ways by which advantages are transmitted across generations
Human capital
Of course, even if we reduce the capacity of the rich to advantage their children through financial capital
by imposing taxes on inherited wealth, the rich can advantage their children through passing on more
human capital. Here, the structure of the education system is crucial: even with the provision of public
education, a mixed system, such as that of the United States, can provide the children of the rich with an
elite education which passes on advantages from one generation to the next, not only through the
formal skills acquisition (including the ability to think creatively) but also through the informal networks
and social skills which are imparted.
Inequality among the rich and progressive capital taxation18
A progressive capital income tax can affect the degree of inequality among the rich, as we noted in Part
II of this paper. The argument for a progressive capital tax is strengthened if we look more carefully at
the nature of the measured returns to capital. In economists’ simplest models, all capital receives the
same returns. If returns are stochastic, then it is simply luck that determines who gets high returns. If
that were all that there were to the matter, a progressive tax on the rate of return to capital in excess of
the average return (with offsets for returns below that level) would be welfare increasing, if capitalists
were risk averse. If savings were elastic in the certainty equivalent return, then savings would increase,
and workers would be better off.
There may, however, be other possible explanations for above average returns. The returns could
represent greater skill at investing, in which the returns ought to be viewed as a return to labor, not as a
return to capital.19
18
An earlier version of the ideas in this section were delivered as a keynote address at the National Tax Association annual meetings, Santa Fe, November, 2014. 19
This is particularly relevant given the literature which has suggested that the pure returns to capital should be taxed at a zero rate, based on a misinterpretation of the Atkinson-Stiglitz (1976) result. See also Stiglitz (2015).
10
The returns could represent a return to risk taking. If capital markets are imperfect (so risk is not fully
diversified) and individuals are risk averse, riskier investments will yield higher returns than safe. A
proportional capital tax on excess returns (over the safe rate of interest) would, under these
circumstances, increase risk taking, and thereby average incomes.
Finally, the returns could in part be a return to exploitation. To the extent that that is the case20, then a
progressive tax would discourage such rent seeking behavior, increase economic efficiency, improve the
well-being of those who are being exploited, and reduce overall inequality.
2. Toward a more general model
The previous section assumed that society is composed of two groups of individuals, workers who
engage in life cycle savings, and capitalists who pass on wealth from one generation to the other. We
have for the most part ignored the kinds of inequalities within each group that were the focus of Part II
of this paper. Obviously, we could combine the analyses: wage inequalities will give rise to inequality in
life cycle savings; inherited inequalities will be passed on from one generation to the other, as described
earlier. We can also formulate models in which there can be transitions from one “class” to another.
Assume, for instance, that providing bequests is a “luxury,” and that when individuals wealth exceeds a
certain level, they begin to act like capitalists. On the other hand, with stochastic returns to wealth, the
wealth of dynastic families can fall below that critical threshold, in which case they stop providing
inheritances: their only savings would then be life-cycle savings.
More generally, let us assume savings of any individual are a function of his end of period wealth, which
is just his wage and the return on the capital from the previous period: , where
(2.1)
But assume is S-shaped, the extreme version of which would be for and
for .21 Then there exists a two-class equilibrium. To see the nature of the
equilibrium, assume initially that there is no uncertainty, and a fixed fraction of the population are in
the upper income group. Then
20
We cited evidence that that was the case earlier. 21
This particular formulation has the characteristic of a jump in the level of savings. A formulation with similar consequences is s(W)= so for W ≤W1; s(W)W = soW1 + s1(W – W1) for W1 ≤ W ≤ W2; and s(W)W = soW1 + s1(W2 – W1) + s2(W – W2) for W ≥ W2, with s1 > > so and s1 >> s2.
11
(2.2) ,
(2.3)
For each value of , there is a different equilibrium, i.e. . For instance, if , (5.19) can
be approximated by
(2.4) ,
Here, it is not that the workers have a different savings function from that of the capitalists; it is only
that their income is low so they save little. On the other hand, if , we obtain the discrete variant
of the Solow model. Most importantly, we have endogenously derived a two class model out of a S-
shaped savings function.
Now, let us assume that there is variability, e.g. in the rate of return. A few families in the lower class
have the good fortune of having a run of good luck, and cross the critical threshold, while a few
families in the upper class have the bad fortune of having a run of bad luck, and move into the lower
class. The fraction of those crossing depends, of course, on the risk associated with the return to capital,
the average value of those returns, and the distance of the average member of the class from the critical
threshold. We thus write, in reduced form
(2.5)
where is the probability of an upper class individual falling below the threshold , and is the
probability of a lower class individual making it into the upper class, with . Hence
(2.6) = 1/ (1 + ( / )).
We can now solve (2.2), (2.3) and (2.5) simultaneously for { , and we can analyze how various
changes in the economy might affect the distribution of wealth in the tails and the distribution of
income. The solution clear depends on the stochastic processes governing the relevant variables. And
using this model, we can analyze the effects of policy on the proportion of the population in each group
as well as the magnitude of the tail inequality.22 More broadly, we can envisage changes in policy,
22
Assume, for instance, that we impose a progressive tax on capital, such that all the wealthy pay the tax at the
rate , with all the proceeds redistributed to workers in the lower class. Converting back to the continuous time formulation and using the diffusion model introduced earlier, we obtain the result that so long there is not full shifting of the tax and the tax reduces tail-wealth inequality. We can rewrite the equilibrium condition for group
12
behavior and technology (the savings functions, the stochastic processes) that could move the economy
from one in which most individuals are in the “upper group” (the middle class society of the past) to one
in which most are in the lower group (the “99%/1% society of the present.) Financial sector
“innovations” that encouraged those at lower wealth not to save and regressive capital taxation might,
for instance, accomplish this.
1 in the continuous time formulation as , where
, the ratio of factor shares times
the proportion of the population in the upper group, itself an endogenous variable . Hence if is the case that an
increase in with proceeds distributed to workers makes it more likely that someone of the lower class moves up to the upper and someone of the upper moves down to the lower, but the former effect is stronger than the latter, as one might expect, from (2.6) increases. So long as the elasticity of substitution is not too low, increases. There is some shifting, but not complete shifting. Hence the drift, increases (consistent with the hypothesis that increases). At the same time, the variability in net returns, decreases. The effect on the distribution of income is more complicated. If increases, there are more individuals in the upper group, but the differences in income between the two groups is smaller, so long as the elasticity of substitution is not too small.
13
3. Land in a life cycle model
In section 1, we formulated a life cycle model, and used it to explain the division of wealth between
capitalists and workers (life time savers). It is easy to incorporate land into this framework. Now,
however, because land is a store of value that is alternative to capital, there is an important question:
could savings that otherwise be used for capital accumulation be deflected into land, thereby harming
workers.
3.1 Pure life cycle model
We begin our analysis with the case where there are only life cycle savers, but there is a fixed asset,
which we will call land. For simplicity, we focus only on the steady state.23 But this poses a problem in
the absence of land augmenting technological change and population growth: if the equilibrium interest
rate would go to zero (as it would if were equal to zero), the value of land would go to infinity. There
are at least two ways out of this puzzle: (a) assume land does not yield any return or (b) assume land
augmenting technological progress at the rate n. Here, we take the latter tack, and express all units in
per capita terms (per unit of effective land).
The variables of interest can all be expressed as functions of . The returns to land must equal the
returns to holding capital. In steady state, the price of a unit of effective land, denoted by , will be
constant. Letting denote the marginal return of a unit of effective land, which in steady state is
constant,
, and
(3.1)
,
in the obvious notation, where wages and returns to capital are functions of the capital stock per capita,
and where we have normalized the land supply (per capita) at unity. Workers save a fraction of their
wage income, with the fraction depending on their wages and the rate of return to capital. Savings are
put either into capital goods or into land holdings.
It is useful to rewrite (3.1) to focus on “savings in capital”:
(3.1a)
.
23
For a more complete analysis of this model, see Stiglitz (2010b) . Similar results hold with money, rather than land, as we show in the Part IV of this paper.
14
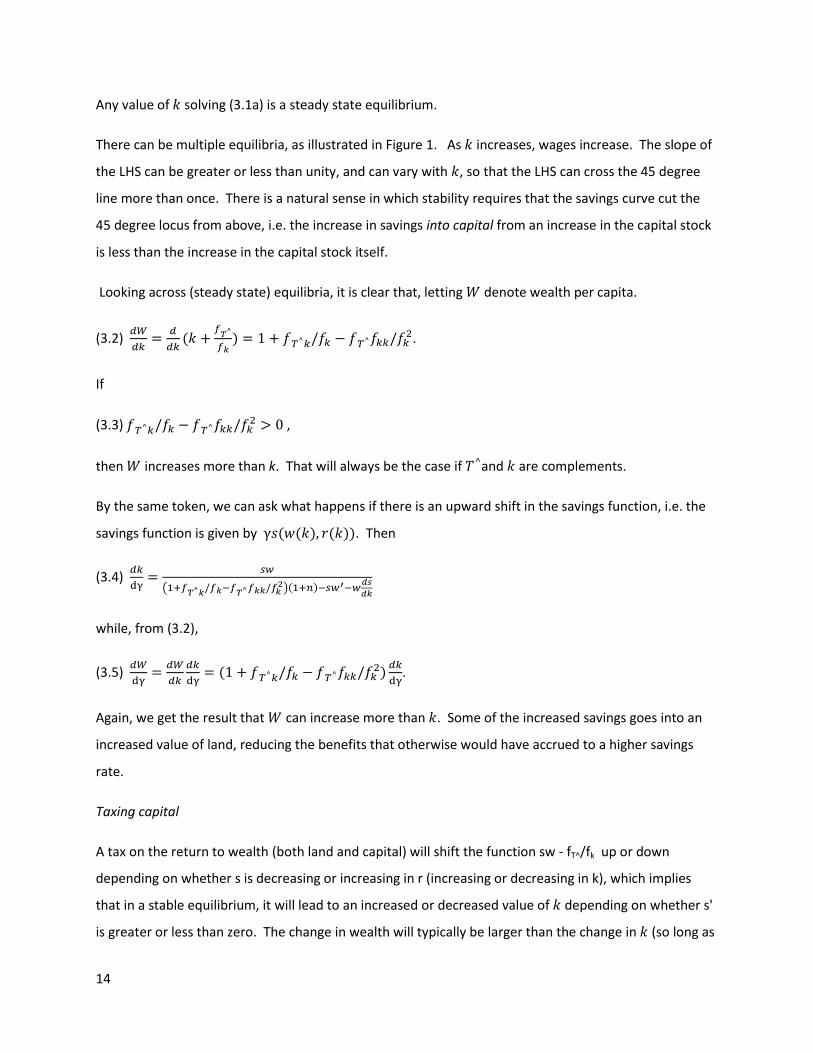
Any value of solving (3.1a) is a steady state equilibrium.
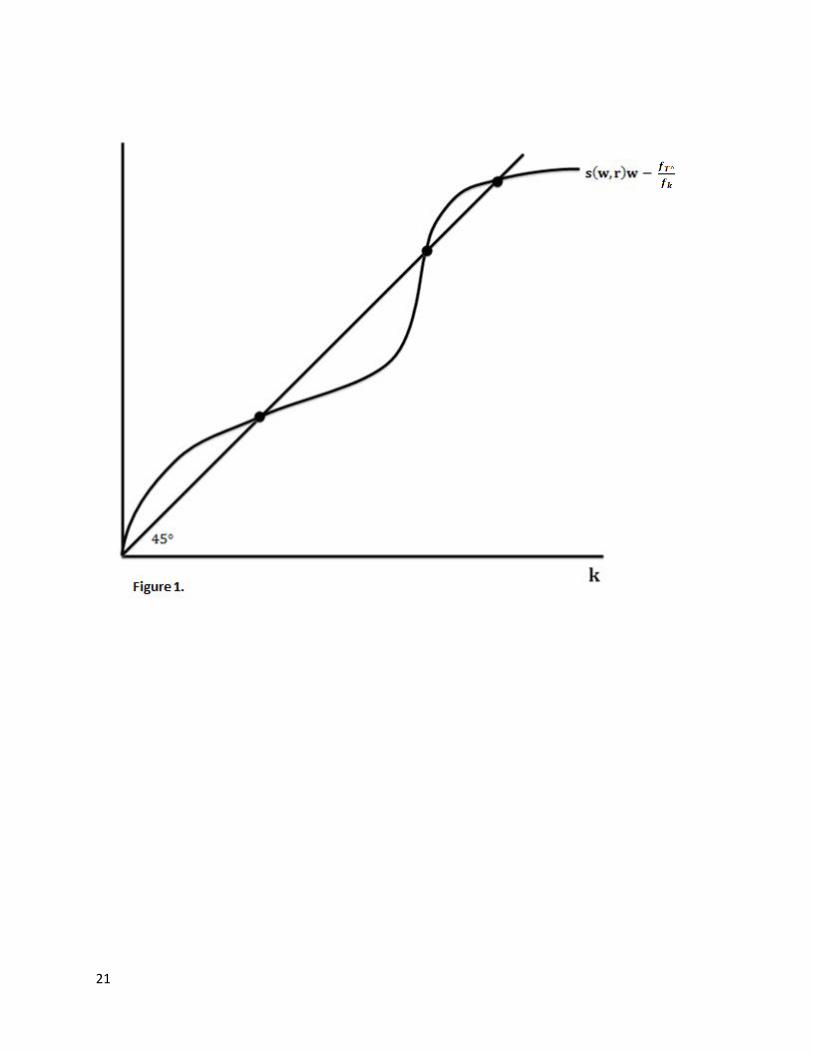
There can be multiple equilibria, as illustrated in Figure 1. As increases, wages increase. The slope of
the LHS can be greater or less than unity, and can vary with , so that the LHS can cross the 45 degree
line more than once. There is a natural sense in which stability requires that the savings curve cut the
45 degree locus from above, i.e. the increase in savings into capital from an increase in the capital stock
is less than the increase in the capital stock itself.
Looking across (steady state) equilibria, it is clear that, letting denote wealth per capita.
(3.2)
.
If
(3.3) ,
then increases more than k. That will always be the case if and are complements.
By the same token, we can ask what happens if there is an upward shift in the savings function, i.e. the
savings function is given by . Then
(3.4)
while, from (3.2),
(3.5)
.
Again, we get the result that can increase more than . Some of the increased savings goes into an
increased value of land, reducing the benefits that otherwise would have accrued to a higher savings
rate.
Taxing capital
A tax on the return to wealth (both land and capital) will shift the function sw - fT^/fk up or down
depending on whether s is decreasing or increasing in r (increasing or decreasing in k), which implies
that in a stable equilibrium, it will lead to an increased or decreased value of depending on whether s'
is greater or less than zero. The change in wealth will typically be larger than the change in (so long as
15
inequality (3.3) is satisfied). But while in a two factor production function, a decrease in necessarily
leads to a lower wage, now it may not. Capital and labor may be substitutes rather than complements.
(Robots may be a substitute for unskilled labor.)
Taxing land
It is easy to see that in this model, a tax on the value of land the proceeds of which are distributed to
workers results in an increase in investment and a reduction in the return to capital (in a stable
equilibrium). 24 If FKL > 0 (labor and capital are complements) wages will rise. A fortiori, if the revenues
are fully invested, wages go up even more.
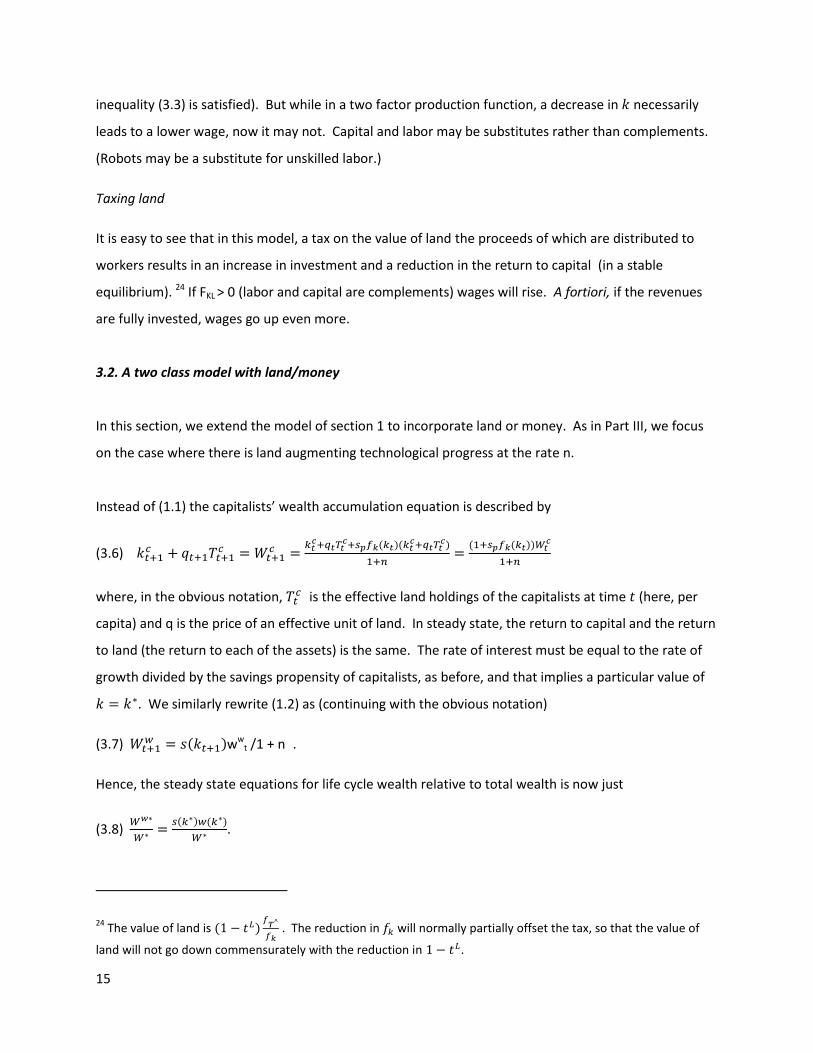
3.2. A two class model with land/money
In this section, we extend the model of section 1 to incorporate land or money. As in Part III, we focus
on the case where there is land augmenting technological progress at the rate n.
Instead of (1.1) the capitalists’ wealth accumulation equation is described by
(3.6)
where, in the obvious notation,
is the effective land holdings of the capitalists at time (here, per
capita) and q is the price of an effective unit of land. In steady state, the return to capital and the return
to land (the return to each of the assets) is the same. The rate of interest must be equal to the rate of
growth divided by the savings propensity of capitalists, as before, and that implies a particular value of
. We similarly rewrite (1.2) as (continuing with the obvious notation)
(3.7) w
wt /1 + n .
Hence, the steady state equations for life cycle wealth relative to total wealth is now just
(3.8)
.
24 The value of land is
. The reduction in will normally partially offset the tax, so that the value of
land will not go down commensurately with the reduction in .
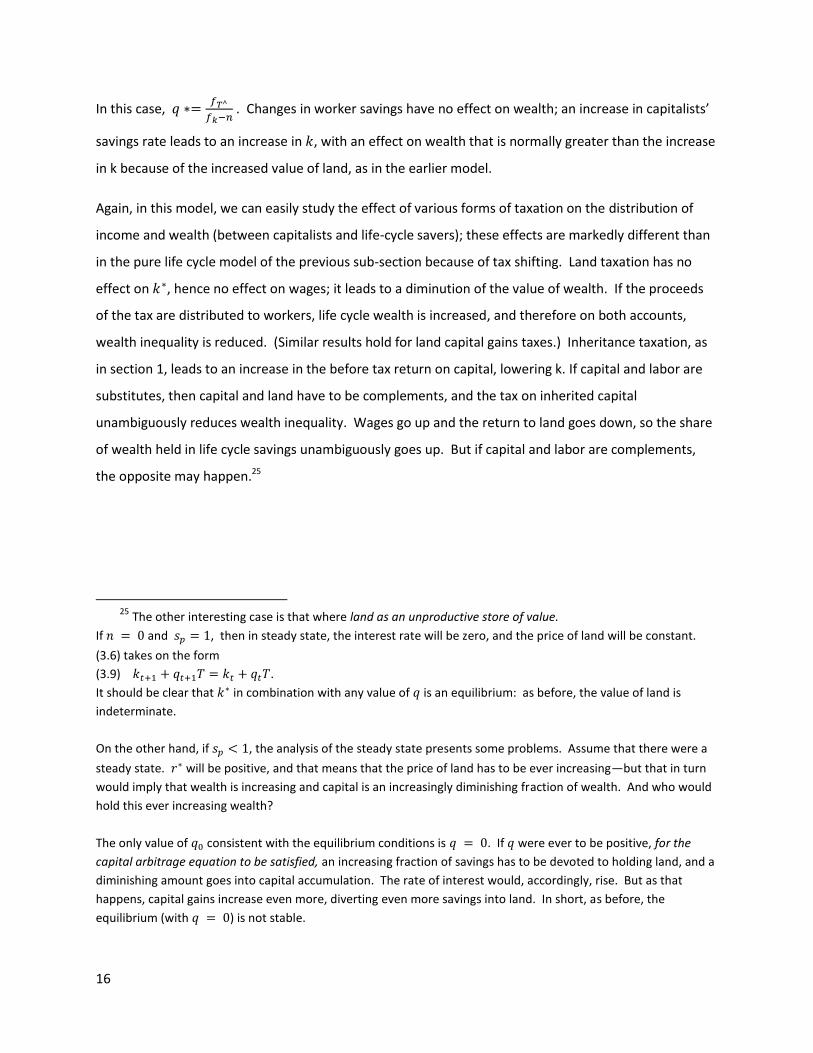
16
In this case,
. Changes in worker savings have no effect on wealth; an increase in capitalists’
savings rate leads to an increase in , with an effect on wealth that is normally greater than the increase
in k because of the increased value of land, as in the earlier model.
Again, in this model, we can easily study the effect of various forms of taxation on the distribution of
income and wealth (between capitalists and life-cycle savers); these effects are markedly different than
in the pure life cycle model of the previous sub-section because of tax shifting. Land taxation has no
effect on , hence no effect on wages; it leads to a diminution of the value of wealth. If the proceeds
of the tax are distributed to workers, life cycle wealth is increased, and therefore on both accounts,
wealth inequality is reduced. (Similar results hold for land capital gains taxes.) Inheritance taxation, as
in section 1, leads to an increase in the before tax return on capital, lowering k. If capital and labor are
substitutes, then capital and land have to be complements, and the tax on inherited capital
unambiguously reduces wealth inequality. Wages go up and the return to land goes down, so the share
of wealth held in life cycle savings unambiguously goes up. But if capital and labor are complements,
the opposite may happen.25
25 The other interesting case is that where land as an unproductive store of value.
If and , then in steady state, the interest rate will be zero, and the price of land will be constant.
(3.6) takes on the form
(3.9) .
It should be clear that in combination with any value of is an equilibrium: as before, the value of land is
indeterminate.
On the other hand, if , the analysis of the steady state presents some problems. Assume that there were a
steady state. will be positive, and that means that the price of land has to be ever increasing—but that in turn
would imply that wealth is increasing and capital is an increasingly diminishing fraction of wealth. And who would
hold this ever increasing wealth?
The only value of consistent with the equilibrium conditions is . If were ever to be positive, for the
capital arbitrage equation to be satisfied, an increasing fraction of savings has to be devoted to holding land, and a
diminishing amount goes into capital accumulation. The rate of interest would, accordingly, rise. But as that
happens, capital gains increase even more, diverting even more savings into land. In short, as before, the
equilibrium (with ) is not stable.
17
4. Concluding Comments
A central concern in the growth of wealth inequality is whether an increasing fraction of wealth will be
controlled by a class of wealthy “capitalists,” passing their wealth down from generation to generation.
This picture contrasted markedly with the more hopeful note that emerged in the middle of the last
century, that an increasing fraction of wealth would be held by ordinary citizens for their own
retirement. As pension funds and IRA accounts built up, the latter view gained in ascendancy. But in
spite of the growth of such accounts, especially as firms switched from defined benefit programs to
defined contribution systems, the increasing concentration of wealth at the top seems to belie this
notion of the creation of a “people’s capitalism.”
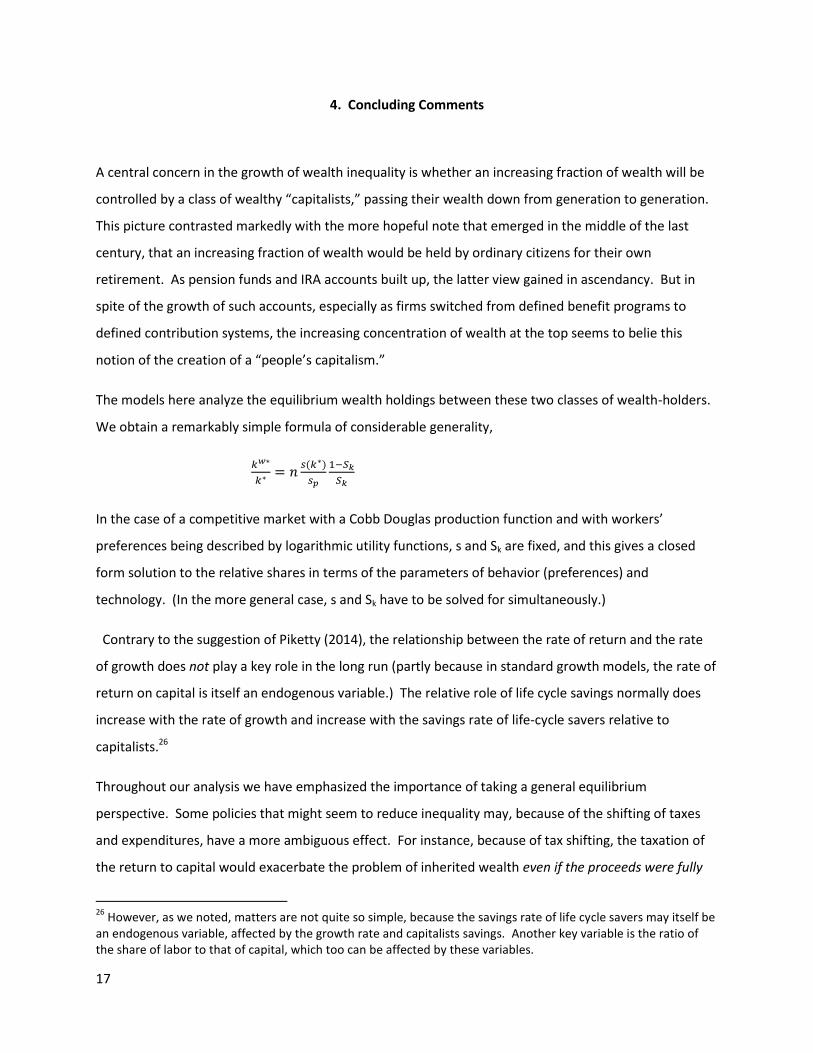
The models here analyze the equilibrium wealth holdings between these two classes of wealth-holders.
We obtain a remarkably simple formula of considerable generality,
In the case of a competitive market with a Cobb Douglas production function and with workers’
preferences being described by logarithmic utility functions, s and Sk are fixed, and this gives a closed
form solution to the relative shares in terms of the parameters of behavior (preferences) and
technology. (In the more general case, s and Sk have to be solved for simultaneously.)
Contrary to the suggestion of Piketty (2014), the relationship between the rate of return and the rate
of growth does not play a key role in the long run (partly because in standard growth models, the rate of
return on capital is itself an endogenous variable.) The relative role of life cycle savings normally does
increase with the rate of growth and increase with the savings rate of life-cycle savers relative to
capitalists.26
Throughout our analysis we have emphasized the importance of taking a general equilibrium
perspective. Some policies that might seem to reduce inequality may, because of the shifting of taxes
and expenditures, have a more ambiguous effect. For instance, because of tax shifting, the taxation of
the return to capital would exacerbate the problem of inherited wealth even if the proceeds were fully
26
However, as we noted, matters are not quite so simple, because the savings rate of life cycle savers may itself be an endogenous variable, affected by the growth rate and capitalists savings. Another key variable is the ratio of the share of labor to that of capital, which too can be affected by these variables.
18
redistributed to workers. Only if the government investment the proceeds and especially if public
investments were designed to be complementary with labor would the share of capital owned by life
cycle savers increase. Matters are somewhat better in the case of an inheritance tax.
In Part I of “New Theoretical Perspectives on the Distribution of Income and Wealth among Individuals,”
we explained that it was hard to account for the increase in the wealth income ratio in a standard
neoclassical model. In Part II, we explained that it was hard to account for the increase in wealth and
income inequality in a standard neoclassical model. A major omission in these models (and a major
lacuna in my earlier 1966 and 1969 papers) was rents, both land rents and those associated with market
distortions, deviations from the competitive paradigm, such as monopoly power.
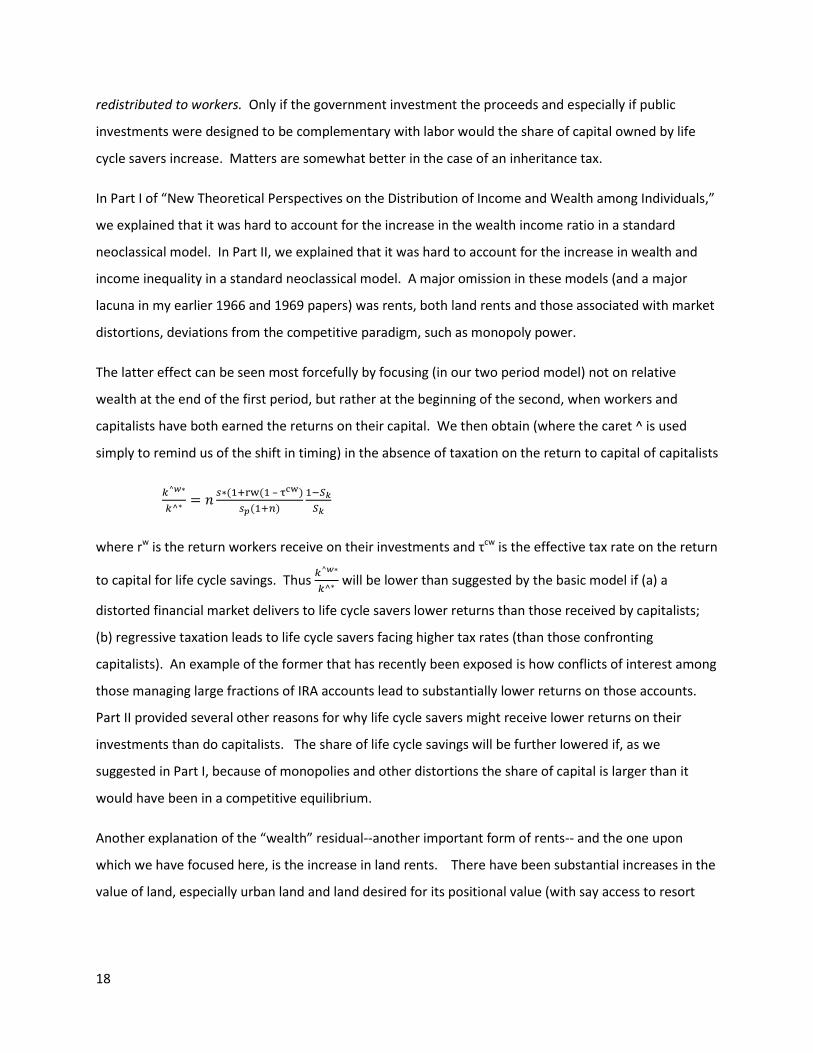
The latter effect can be seen most forcefully by focusing (in our two period model) not on relative
wealth at the end of the first period, but rather at the beginning of the second, when workers and
capitalists have both earned the returns on their capital. We then obtain (where the caret ^ is used
simply to remind us of the shift in timing) in the absence of taxation on the return to capital of capitalists
–
where rw is the return workers receive on their investments and τcw is the effective tax rate on the return
to capital for life cycle savings. Thus
will be lower than suggested by the basic model if (a) a
distorted financial market delivers to life cycle savers lower returns than those received by capitalists;
(b) regressive taxation leads to life cycle savers facing higher tax rates (than those confronting
capitalists). An example of the former that has recently been exposed is how conflicts of interest among
those managing large fractions of IRA accounts lead to substantially lower returns on those accounts.
Part II provided several other reasons for why life cycle savers might receive lower returns on their
investments than do capitalists. The share of life cycle savings will be further lowered if, as we
suggested in Part I, because of monopolies and other distortions the share of capital is larger than it
would have been in a competitive equilibrium.
Another explanation of the “wealth” residual--another important form of rents-- and the one upon
which we have focused here, is the increase in land rents. There have been substantial increases in the
value of land, especially urban land and land desired for its positional value (with say access to resort
19
activities or scenic views)27. As we noted in Part I, the amount of capital goods might actually decrease,
and society’s future prospects become worse even as the value of its wealth increases, a result which is
strikingly different from that of the standard model. And if the increase in the capital stock is not large
enough to offset the increasing population and to offset the fact that the land supply is fixed, it means
that the country (at least on a per capita basis) is poorer. And it also means that wages are lower than
they otherwise would have been.
Some have suggested that land holding displace the holding of capital, and thus result in workers being
worse off. In this view, a tax on land would lead to higher wages and per capita incomes. We have
shown that in most models we have explored, this is true; but in the special case (the life cycle model
with capitalists, where capitalists save a fixed fraction of their income) it is not. Just as there is full
shifting of taxes (imposing a tax on capital has no effect), so too for land. But even in this polar case, a
tax on land, reducing the value of land, it reduces wealth inequality, for the workers' savings is given by
their wage plus transfers, and with wages unchanged, transfers increased, and interest rate unchanged,
their savings increases, and their wealth-holdings crowd out those of the capitalists. Thus, as Henry
George (1879) argued long ago, land taxes can be an important instrument for increasing equality. He
explained how such a tax was non-distortionary. But in many of the models presented here, we obtain a
stronger result: a land tax actually leads to higher wages and a higher level of national output.
This paper has considered a very simple equilibrium model for the determination of land rents. The
models presented here do not, I think, fully explain the extent of increase in land prices, which, as we
noted in Part I of this paper, play an important role in recent increases in wealth and wealth inequality.
In Part IV of this paper, we present alternative theories of the determination of land prices, which we
believe may provide a better description of what has been happening.
27
In Part IV of this paper, we analyze the value of positional goods and land more generally.
20
References
Atkinson, A. B. and J. E. Stiglitz (1976). “The Design of Tax Structure: Direct Versus Indirect Taxation,” , Journal of Public Economics, 6, July-August 1976, pp. 55-75
Domar, Evsey D., and Richard A. Musgrave, (1944). “Proportional Income Taxation and Risk-taking,” Quarterly Journal of Economics 58(3):388-422
George, Henry (1879). Progress and Poverty: An Inquiry into the Cause of Industrial Depressions and of Increase of Want with Increase of Wealth VI. New York: Robert Schalkenbach Foundation.
Milevsky, Moshe A, and Huaxiong Huang (2011). “Spending Retirement on Planet Vulcan: The Impact of Longevity Risk Aversion on Optimal Withdrawal Rates,” Financial Analysts Journal 67(2): 45-58.
OECD (2013). Pension Markets in Focus.
Pasinetti, L. (1962). “The Rate of Profit and Income Distribution in Relation to the Rate of Economic Growth,” Review of Economic Studies, 29(4): 267-279.
Piketty, Thomas (2014). Capital in the Twenty-First Century, Cambridge Massachusetts : The Belknap Press of Harvard University Press.
Stiglitz, Joseph E. (1966) "The Distribution of Income and Wealth Among Individuals,” Presented at the December 1966 meetings of the Econometric Society, San Francisco , December 29. (MIT, mimeo)
——(1969a). “Distribution of Income and Wealth Among Individuals,” Econometrica, 37(3): 382-397. )
——(1969b). “The Effects of Income, Wealth and Capital Gains Taxation on Risk-Taking,” Quarterly Journal of Economics, 83(2), May 1969, pp. 263-283.
—— (2010b). “The Wobbly Economy,” mimeo, Columbia University.
—— (2015). In Praise of Frank Ramsey's Contribution to the Theory of Taxation, Economic Journal.
21