Embed Size (px)
Citation preview

Issued September 2018P60-263
By Kayla Fontenot, Jessica Semega, and Melissa Kollar
Income and Poverty in the United States: 2017 Current Population ReportsCurrent Population Reports
Income and Poverty in the United States: 2017
Issued September 2018P60-263
By Kayla Fontenot, Jessica Semega, and Melissa Kollar
Acknowledgments Jessica Semega and Melissa Kollar prepared the income sections of this report under the direction of Jonathan L. Rothbaum, Chief of the Income Statistics Branch. Kayla Fontenot prepared the poverty section under the direction of Ashley N. Edwards, Chief of the Poverty Statistics Branch. Trudi J. Renwick, Assistant Division Chief for Economic Characteristics in the Social, Economic, and Housing Statistics Division, provided overall direction.
Susan S. Gajewski and Nancy Hunter, Demographic Surveys Division, and Lisa P. Cheok, Associate Directorate Demographic Programs, processed the Current Population Survey 2018 Annual Social and Economic Supplement file.
Kirk E. Davis, Raymond E. Dowdy, Shawna Evers, Ryan C. Fung, Lan N. Huynh, and Chandararith R. Phe programmed and produced the historical, detailed, and publication tables under the direction of Hung X. Pham, Chief of the Tabulation and Applications Branch, Demographic Surveys Division.
Nghiep Huynh and Alfred G. Meier, under the supervision of KeTrena Farnham and David V. Hornick, all of the Demographic Statistical Methods Division, con-ducted statistical review.
Tim J. Marshall, Assistant Survey Director of the Current Population Survey, provided overall direction for the survey implementation. Lisa P. Cheok and Aaron Cantu, Associate Directorate Demographic Programs, and Charlie Carter, Agatha Jung, and Johanna Rupp of the Application Development and Services Division prepared and programmed the computer-assisted interviewing instru-ment used to conduct the Annual Social and Economic Supplement.
Additional people within the U.S. Census Bureau also made significant contribu-tions to the preparation of this report. Gloria G. Guzmán, Brian E. Glassman, Laryssa Mykyta, Bernadette D. Proctor, Bruce H. Webster, Jr., and Edward J. Welniak, Jr. reviewed the contents.
Census Bureau field representatives and telephone interviewers collected the data. Without their dedication, the preparation of this report or any report from the Current Population Survey would be impossible.
Anthony Richards, Amanda J. Perry, Christine E. Geter, and Janet S. Sweeney of the Public Information Office provided publication management, graph-ics design and composition, and editorial review for print and electronic media. William A. Burbano and George E. Williams of the Census Bureau’s Administrative and Customer Services Division provided printing management.

U.S. Department of Commerce Wilbur Ross,
Secretary
Karen Dunn Kelley, Performing the Nonexclusive
Duties of the Deputy Secretary
Economics and Statistics Administration Karen Dunn Kelley,
Under Secretary for Economic Affairs
U.S. CENSUS BUREAU Ron Jarmin,
Performing the Nonexclusive Functions and Duties of the Director
P60-263
Income and Poverty in the United States: 2017 Issued September 2018

Suggested Citation Fontenot, Kayla, Jessica Semega,
and Melissa Kollar, U.S. Census Bureau,
Current Population Reports, P60-263,
Income and Poverty in the United States: 2017,
U.S. Government Printing Office, Washington, DC,
2018.
Economics and Statistics Administration
Karen Dunn Kelley, Under Secretary for Economic Affairs
U.S. CENSUS BUREAU Ron Jarmin, Performing the Nonexclusive Functions and Duties of the Director
Enrique Lamas, Performing the Nonexclusive Functions and Duties of the Deputy Director and Chief Operating Officer
Eloise Parker, Acting Associate Director for Demographic Programs
David G. Waddington, Chief, Social, Economic, and Housing Statistics Division

U.S. Census Bureau Income and Poverty in the United States: 2017 iii
Contents TEXT
INTRODUCTION . . . . . . . . . . . . . . . . . . . . . . . . . . . . . . . . . . . . . . . . . . . . . . . 1Summary of Findings . . . . . . . . . . . . . . . . . . . . . . . . . . . . . . . . . . . . . . . . . . . 1
INCOME IN THE UNITED STATES . . . . . . . . . . . . . . . . . . . . . . . . . . . . . . . . 1Highlights . . . . . . . . . . . . . . . . . . . . . . . . . . . . . . . . . . . . . . . . . . . . . . . . . . . . . 1Caution for Historical Comparisons . . . . . . . . . . . . . . . . . . . . . . . . . . . . . . . 4Household Income . . . . . . . . . . . . . . . . . . . . . . . . . . . . . . . . . . . . . . . . . . . . . 4Type of Household . . . . . . . . . . . . . . . . . . . . . . . . . . . . . . . . . . . . . . . . . . . . . 4Race and Hispanic Origin . . . . . . . . . . . . . . . . . . . . . . . . . . . . . . . . . . . . . . . 4Age of Householder . . . . . . . . . . . . . . . . . . . . . . . . . . . . . . . . . . . . . . . . . . . . 6Nativity . . . . . . . . . . . . . . . . . . . . . . . . . . . . . . . . . . . . . . . . . . . . . . . . . . . . . . . 6Region . . . . . . . . . . . . . . . . . . . . . . . . . . . . . . . . . . . . . . . . . . . . . . . . . . . . . . . . 6Residence . . . . . . . . . . . . . . . . . . . . . . . . . . . . . . . . . . . . . . . . . . . . . . . . . . . . . 7Income Inequality . . . . . . . . . . . . . . . . . . . . . . . . . . . . . . . . . . . . . . . . . . . . . . 7Equivalence-Adjusted Income Inequality . . . . . . . . . . . . . . . . . . . . . . . . . . 7Earnings and Work Experience . . . . . . . . . . . . . . . . . . . . . . . . . . . . . . . . . . 9
POVERTY IN THE UNITED STATES . . . . . . . . . . . . . . . . . . . . . . . . . . . . . . . 11Highlights . . . . . . . . . . . . . . . . . . . . . . . . . . . . . . . . . . . . . . . . . . . . . . . . . . . . . 11Race and Hispanic Origin . . . . . . . . . . . . . . . . . . . . . . . . . . . . . . . . . . . . . . . 14Sex . . . . . . . . . . . . . . . . . . . . . . . . . . . . . . . . . . . . . . . . . . . . . . . . . . . . . . . . . . . 14Age . . . . . . . . . . . . . . . . . . . . . . . . . . . . . . . . . . . . . . . . . . . . . . . . . . . . . . . . . . . 14Nativity . . . . . . . . . . . . . . . . . . . . . . . . . . . . . . . . . . . . . . . . . . . . . . . . . . . . . . . 15Region . . . . . . . . . . . . . . . . . . . . . . . . . . . . . . . . . . . . . . . . . . . . . . . . . . . . . . . . 16Residence . . . . . . . . . . . . . . . . . . . . . . . . . . . . . . . . . . . . . . . . . . . . . . . . . . . . . 16Work Experience . . . . . . . . . . . . . . . . . . . . . . . . . . . . . . . . . . . . . . . . . . . . . . . 16Disability Status . . . . . . . . . . . . . . . . . . . . . . . . . . . . . . . . . . . . . . . . . . . . . . . . 16Educational Attainment . . . . . . . . . . . . . . . . . . . . . . . . . . . . . . . . . . . . . . . . . 16Families . . . . . . . . . . . . . . . . . . . . . . . . . . . . . . . . . . . . . . . . . . . . . . . . . . . . . . . 17Depth of Poverty . . . . . . . . . . . . . . . . . . . . . . . . . . . . . . . . . . . . . . . . . . . . . . . 17Ratio of Income to Poverty . . . . . . . . . . . . . . . . . . . . . . . . . . . . . . . . . . . . . . 17Income Deficit . . . . . . . . . . . . . . . . . . . . . . . . . . . . . . . . . . . . . . . . . . . . . . . . . 17Shared Households . . . . . . . . . . . . . . . . . . . . . . . . . . . . . . . . . . . . . . . . . . . . . 19
ADDITIONAL INFORMATION ON INCOME AND POVERTY . . . . . . . . . 21State and Local Estimates of Income and Poverty . . . . . . . . . . . . . . . . . 21Longitudinal Estimates . . . . . . . . . . . . . . . . . . . . . . . . . . . . . . . . . . . . . . . . . . 21The Supplemental Poverty Measure . . . . . . . . . . . . . . . . . . . . . . . . . . . . . . 21
SOURCE AND ACCURACY OF THE ESTIMATES . . . . . . . . . . . . . . . . . . . 22Redesigned CPS ASEC . . . . . . . . . . . . . . . . . . . . . . . . . . . . . . . . . . . . . . . . . . 23

iv Income and Poverty in the United States: 2017 U.S. Census Bureau
FIGURES
Figure 1. Real Median Household Income by Race and Hispanic Origin: 1967 to 2017 . . . . . . . . . . . . . . . . . . . . . 5
Figure 2. Female-to-Male Earnings Ratio and Median Earnings of Full-Time, Year-Round Workers 15 Years and Older by Sex: 1960 to 2017 . . . . . . . . . . . . . . . . . . . . . . . . . . . . . . . . . . . . . . . . . . . . . . . . . . . 9
Figure 3. Total and Full-Time, Year-Round Workers With Earnings by Sex: 1967 to 2017 . . . . . . . . . . . . . . . . . . . 10
Figure 4. Number in Poverty and Poverty Rate: 1959 to 2017 . . . . . . . . . . . . . . . . . . . . . . . . . . . . . . . . . . . . . . . . . . . 11
Figure 5. Poverty Rates by Age and Sex: 2017 . . . . . . . . . . . . . . . . . . . . . . . . . . . . . . . . . . . . . . . . . . . . . . . . . . . . . . . . 14
Figure 6. Poverty Rates by Age: 1959 to 2017 . . . . . . . . . . . . . . . . . . . . . . . . . . . . . . . . . . . . . . . . . . . . . . . . . . . . . . . . . 15
Figure 7. Demographic Makeup of the Population at Varying Degrees of Poverty: 2017 . . . . . . . . . . . . . . . . . . . 19
TABLES
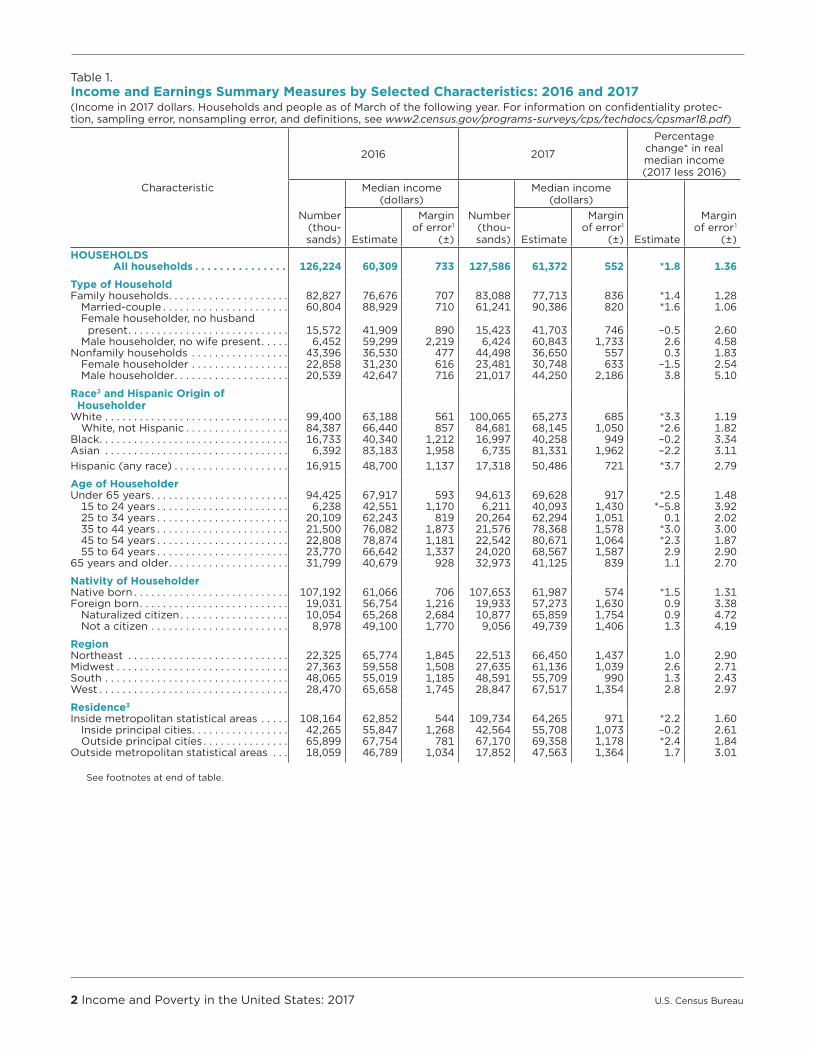
Table 1. Income and Earnings Summary Measures by Selected Characteristics: 2016 and 2017 . . . . . . . . . . . . . 2
Table 2. Income Distribution Measures Using Money Income and Equivalence–Adjusted Income: 2016 and 2017 . . . . . . . . . . . . . . . . . . . . . . . . . . . . . . . . . . . . . . . . . . . . . . . . . . . . . . . . . . . . . . . . . . . . . . . . . . . 8
Table 3. People in Poverty by Selected Characteristics: 2016 and 2017 . . . . . . . . . . . . . . . . . . . . . . . . . . . . . . . . . . . 12
Table 4. Families and People in Poverty by Type of Family: 2016 and 2017 . . . . . . . . . . . . . . . . . . . . . . . . . . . . . . . 13
Table 5. People With Income Below Specified Ratios of Their Poverty Thresholds by Selected Characteristics: 2017 . . . . . . . . . . . . . . . . . . . . . . . . . . . . . . . . . . . . . . . . . . . . . . . . . . . . . . . . . . . . . 18
Table 6. Income Deficit or Surplus of Families and Unrelated Individuals by Poverty Status: 2017 . . . . . . . . . . . 20

U.S. Census Bureau Income and Poverty in the United States: 2017 v
APPENDIXES
Appendix A. Estimates of Income . . . . . . . . . . . . . . . . . . . . . . . . . . . . . . . . . . . . . . . . . . . . . . . . . . . . . . . . . . . . . . . . . . . 25
How Income Is Measured . . . . . . . . . . . . . . . . . . . . . . . . . . . . . . . . . . . . . . . . . . . . . . . . . . . . . . . . . . . . . . . . . . . . . . . . . 25Business Cycles . . . . . . . . . . . . . . . . . . . . . . . . . . . . . . . . . . . . . . . . . . . . . . . . . . . . . . . . . . . . . . . . . . . . . . . . . . . . . . . . . . 25Annual Average Consumer Price Index Research Series (CPI-U-RS) Using Current Methods
All Items: 1947 to 2017 . . . . . . . . . . . . . . . . . . . . . . . . . . . . . . . . . . . . . . . . . . . . . . . . . . . . . . . . . . . . . . . . . . . . . . . . 26Cost-of-Living Adjustment . . . . . . . . . . . . . . . . . . . . . . . . . . . . . . . . . . . . . . . . . . . . . . . . . . . . . . . . . . . . . . . . . . . . . . . . 26Poverty Threshold Adjustment . . . . . . . . . . . . . . . . . . . . . . . . . . . . . . . . . . . . . . . . . . . . . . . . . . . . . . . . . . . . . . . . . . . . 26
Appendix B. Estimates of Poverty . . . . . . . . . . . . . . . . . . . . . . . . . . . . . . . . . . . . . . . . . . . . . . . . . . . . . . . . . . . . . . . . . . . 47
How Poverty Is Calculated . . . . . . . . . . . . . . . . . . . . . . . . . . . . . . . . . . . . . . . . . . . . . . . . . . . . . . . . . . . . . . . . . . . . . . . . 47Poverty Thresholds for 2017 by Size of Family and Number of Related Children Under 18 Years . . . . . . . . . 47Weighted Average Poverty Thresholds in 2017 by Size of Family . . . . . . . . . . . . . . . . . . . . . . . . . . . . . . . . . . . . . 47
Appendix C. Replicate Weights . . . . . . . . . . . . . . . . . . . . . . . . . . . . . . . . . . . . . . . . . . . . . . . . . . . . . . . . . . . . . . . . . . . . . 61
References . . . . . . . . . . . . . . . . . . . . . . . . . . . . . . . . . . . . . . . . . . . . . . . . . . . . . . . . . . . . . . . . . . . . . . . . . . . . . . . . . . . . . . 61Appendix D. Additional Data and Contacts . . . . . . . . . . . . . . . . . . . . . . . . . . . . . . . . . . . . . . . . . . . . . . . . . . . . . . . . . . . 63
Customized Tables . . . . . . . . . . . . . . . . . . . . . . . . . . . . . . . . . . . . . . . . . . . . . . . . . . . . . . . . . . . . . . . . . . . . . . . . . . . . . . 63 The CPS Table Creator . . . . . . . . . . . . . . . . . . . . . . . . . . . . . . . . . . . . . . . . . . . . . . . . . . . . . . . . . . . . . . . . . . . . . . . . . 63
Public Use Microdata . . . . . . . . . . . . . . . . . . . . . . . . . . . . . . . . . . . . . . . . . . . . . . . . . . . . . . . . . . . . . . . . . . . . . . . . . . . . . 63 CPS ASEC . . . . . . . . . . . . . . . . . . . . . . . . . . . . . . . . . . . . . . . . . . . . . . . . . . . . . . . . . . . . . . . . . . . . . . . . . . . . . . . . . . . . 63 Taxes and Noncash Benefits . . . . . . . . . . . . . . . . . . . . . . . . . . . . . . . . . . . . . . . . . . . . . . . . . . . . . . . . . . . . . . . . . . . . 63 Research Files . . . . . . . . . . . . . . . . . . . . . . . . . . . . . . . . . . . . . . . . . . . . . . . . . . . . . . . . . . . . . . . . . . . . . . . . . . . . . . . . 63
Census Data API . . . . . . . . . . . . . . . . . . . . . . . . . . . . . . . . . . . . . . . . . . . . . . . . . . . . . . . . . . . . . . . . . . . . . . . . . . . . . . . . 63Topcoding . . . . . . . . . . . . . . . . . . . . . . . . . . . . . . . . . . . . . . . . . . . . . . . . . . . . . . . . . . . . . . . . . . . . . . . . . . . . . . . . . . . . . . 63Comments . . . . . . . . . . . . . . . . . . . . . . . . . . . . . . . . . . . . . . . . . . . . . . . . . . . . . . . . . . . . . . . . . . . . . . . . . . . . . . . . . . . . . . 63
APPENDIX TABLES
Table A-1. Households by Total Money Income, Race, and Hispanic Origin of Householder: 1967 to 2017 . . . . 27
Table A-2. Selected Measures of Household Income Dispersion: 1967 to 2017 . . . . . . . . . . . . . . . . . . . . . . . . . . . . 35
Table A-3. Selected Measures of Equivalence-Adjusted Income Dispersion: 1967 to 2017 . . . . . . . . . . . . . . . . . . 41
Table A-4. Number and Real Median Earnings of Total Workers and Full-Time, Year-Round Workers by Sex and Female-to-Male Earnings Ratio: 1960 to 2017 . . . . . . . . . . . . . . . . . . . . . . . . . . . . . . . . . . . 45
Table B-1. Poverty Status of People by Family Relationship, Race, and Hispanic Origin: 1959 to 2017 . . . . . . . 48
Table B-2. Poverty Status of People by Age, Race, and Hispanic Origin: 1959 to 2017 . . . . . . . . . . . . . . . . . . . . . 54
Table B-3. Poverty Status of Families by Type of Family: 1959 to 2017 . . . . . . . . . . . . . . . . . . . . . . . . . . . . . . . . . . . 60


U.S. Census Bureau Income and Poverty in the United States: 2017 1
Income and Poverty in the United States: 2017
INTRODUCTION
The U.S. Census Bureau collects data and publishes estimates on income and poverty in order to evaluate national economic trends as well as to understand their impact on the well-being of households, families, and individu-als. This report presents data on income and poverty in the United States based on information collected in the 2018 and earlier Current Population Survey (CPS) Annual Social and Economic Supplements (ASEC) conducted by the Census Bureau.
This report contains two main sec-tions, one focuses on income and the other on poverty. Each section presents estimates by characteris-tics such as race, Hispanic origin, nativity, and region. Other topics, such as earnings and family pov-erty rates are included only in the relevant section.
Summary of Findings
• Real median household income increased 1.8 percent between 2016 and 2017.1 This is the third consecutive annual increase in median household income.
1 “Real” refers to income after adjusting for inflation. All income values are adjusted to reflect 2017 dollars. The adjustment is based on percentage changes in prices between 2017 and earlier years and is computed by dividing the annual average Consumer Price Index Research Series (CPI-U-RS) for 2017 by the annual average for earlier years. The CPI-U-RS values for 1947 to 2017 are available in Appendix A. Consumer prices increased by 2.2 percent between 2016 and 2017.
• The 2017 real median earnings of all male workers increased 3.0 percent from 2016, while real median earnings for their female counterparts saw no statistically significant change between 2016 and 2017.
• In 2017, the real median earn-ings of men and women work-ing full-time, year-round each decreased from their respective 2016 medians by 1.1 percent.2
• The number of men and women with earnings working full-time, year-round increased by 1.4 mil-lion and 1.0 million, respectively, between 2016 and 2017.3
• The official poverty rate decreased by 0.4 percentage points between 2016 and 2017. This is the third consecutive annual decrease in the poverty rate.
• The number of people in pov-erty in 2017 was not statistically different from 2016.
For most demographic groups shown in Table 1 (see page 2), the 2017 median household income estimates were higher or were not statistically different from the 2016 estimates. Householders aged 15 to 24 were the only group to experience a decline in median household income between 2016 and 2017. For most demographic
2 The difference between the 2016–2017 percentage change in median earnings for men and women working full-time, year-round was not statistically significant.
3 The difference between the 2016–2017 increases in the number of men and women working full-time, year-round was not sta-tistically significant.
groups shown in Table 3 (see page 12), poverty rates in 2017 were either lower than in 2016 or not statistically different. The only group to experience a statisti-cally significant increase in pov-erty rates from 2016 to 2017 were people with at least a bachelor’s degree.
INCOME IN THE UNITED STATES
Highlights
• Median household income was $61,372 in 2017, an increase in real terms of 1.8 percent from the 2016 median of $60,309 (Figure 1 and Table 1). This is the third consecutive annual increase in median household income.
• The 2017 real median income of family households increased 1.4 percent from 2016 to $77,713 (Table 1). Real median income for married-couple households increased 1.6 percent between 2016 and 2017.4
• The real median income of households maintained by non-Hispanic Whites ($68,145) and Hispanics ($50,486) increased 2.6 percent and 3.7 percent, respectively, between 2016 and 2017.5 This is the third annual
4 The difference between the 2016–2017 percentage change in median income for family households (1.4 percent) and married-couple households (1.6 percent) was not statistically significant.
5 The differences between the 2016–2017 percentage changes in median income for non-Hispanic White (2.6 percent) and Hispanic (3.7 percent) households were not statistically significant.
2 Income and Poverty in the United States: 2017 U.S. Census Bureau
Table 1.Income and Earnings Summary Measures by Selected Characteristics: 2016 and 2017—Con.(Income in 2017 dollars. Households and people as of March of the following year. For information on confidentiality protec-tion, sampling error, nonsampling error, and definitions, see www2.census.gov/programs-surveys/cps/techdocs/cpsmar18.pdf)
Characteristic
2016 2017
Percentage change* in real median income (2017 less 2016)
Number (thou-sands)
Median income (dollars)
Number (thou-sands)
Median income (dollars)
Estimate
Margin of error 1
(±)Estimate
Margin of error1
(±) Estimate
Margin of error1
(±)HOUSEHOLDS All households . . . . . . . . . . . . . . . 126,224 60,309 733 127,586 61,372 552 *1.8 1.36
Type of HouseholdFamily households . . . . . . . . . . . . . . . . . . . . . 82,827 76,676 707 83,088 77,713 836 *1.4 1.28 Married-couple . . . . . . . . . . . . . . . . . . . . . . 60,804 88,929 710 61,241 90,386 820 *1.6 1.06 Female householder, no husband
present . . . . . . . . . . . . . . . . . . . . . . . . . . . . 15,572 41,909 890 15,423 41,703 746 –0.5 2.60 Male householder, no wife present . . . . . 6,452 59,299 2,219 6,424 60,843 1,733 2.6 4.58Nonfamily households . . . . . . . . . . . . . . . . . 43,396 36,530 477 44,498 36,650 557 0.3 1.83 Female householder . . . . . . . . . . . . . . . . . 22,858 31,230 616 23,481 30,748 633 –1.5 2.54 Male householder . . . . . . . . . . . . . . . . . . . . 20,539 42,647 716 21,017 44,250 2,186 3.8 5.10
Race2 and Hispanic Origin of Householder
White . . . . . . . . . . . . . . . . . . . . . . . . . . . . . . . . 99,400 63,188 561 100,065 65,273 685 *3.3 1.19 White, not Hispanic . . . . . . . . . . . . . . . . . . 84,387 66,440 857 84,681 68,145 1,050 *2.6 1.82Black . . . . . . . . . . . . . . . . . . . . . . . . . . . . . . . . . 16,733 40,340 1,212 16,997 40,258 949 –0.2 3.34Asian . . . . . . . . . . . . . . . . . . . . . . . . . . . . . . . . 6,392 83,183 1,958 6,735 81,331 1,962 –2.2 3.11Hispanic (any race) . . . . . . . . . . . . . . . . . . . . 16,915 48,700 1,137 17,318 50,486 721 *3.7 2.79
Age of HouseholderUnder 65 years . . . . . . . . . . . . . . . . . . . . . . . . 94,425 67,917 593 94,613 69,628 917 *2.5 1.48 15 to 24 years . . . . . . . . . . . . . . . . . . . . . . . 6,238 42,551 1,170 6,211 40,093 1,430 *–5.8 3.92 25 to 34 years . . . . . . . . . . . . . . . . . . . . . . . 20,109 62,243 819 20,264 62,294 1,051 0.1 2.02 35 to 44 years . . . . . . . . . . . . . . . . . . . . . . . 21,500 76,082 1,873 21,576 78,368 1,578 *3.0 3.00 45 to 54 years . . . . . . . . . . . . . . . . . . . . . . . 22,808 78,874 1,181 22,542 80,671 1,064 *2.3 1.87 55 to 64 years . . . . . . . . . . . . . . . . . . . . . . . 23,770 66,642 1,337 24,020 68,567 1,587 2.9 2.9065 years and older . . . . . . . . . . . . . . . . . . . . . 31,799 40,679 928 32,973 41,125 839 1.1 2.70
Nativity of HouseholderNative born . . . . . . . . . . . . . . . . . . . . . . . . . . . 107,192 61,066 706 107,653 61,987 574 *1.5 1.31Foreign born . . . . . . . . . . . . . . . . . . . . . . . . . . 19,031 56,754 1,216 19,933 57,273 1,630 0.9 3.38 Naturalized citizen . . . . . . . . . . . . . . . . . . . 10,054 65,268 2,684 10,877 65,859 1,754 0.9 4.72 Not a citizen . . . . . . . . . . . . . . . . . . . . . . . . 8,978 49,100 1,770 9,056 49,739 1,406 1.3 4.19
RegionNortheast . . . . . . . . . . . . . . . . . . . . . . . . . . . . 22,325 65,774 1,845 22,513 66,450 1,437 1.0 2.90Midwest . . . . . . . . . . . . . . . . . . . . . . . . . . . . . . 27,363 59,558 1,508 27,635 61,136 1,039 2.6 2.71South . . . . . . . . . . . . . . . . . . . . . . . . . . . . . . . . 48,065 55,019 1,185 48,591 55,709 990 1.3 2.43West . . . . . . . . . . . . . . . . . . . . . . . . . . . . . . . . . 28,470 65,658 1,745 28,847 67,517 1,354 2.8 2.97
Residence3
Inside metropolitan statistical areas . . . . . 108,164 62,852 544 109,734 64,265 971 *2.2 1.60 Inside principal cities . . . . . . . . . . . . . . . . . 42,265 55,847 1,268 42,564 55,708 1,073 –0.2 2.61 Outside principal cities . . . . . . . . . . . . . . . 65,899 67,754 781 67,170 69,358 1,178 *2.4 1.84Outside metropolitan statistical areas . . . 18,059 46,789 1,034 17,852 47,563 1,364 1.7 3.01
See footnotes at end of table.

U.S. Census Bureau Income and Poverty in the United States: 2017 3
increase in median household income for these two groups. Among the race groups, house-holds maintained by Asians had the highest median income in 2017, $81,331 (Figure 1 and Table 1).
• The real median income of households maintained by a native-born person increased 1.5 percent between 2016 and 2017, while the 2017 real median income of households main-tained by a foreign-born person was not statistically different from 2016 (Table 1).6
6 The difference between the 2016–2017 percentage changes in median income for households maintained by a foreign-born person and those maintained by a native-born person was not statistically significant.
• The 2017 real median earnings of all male workers increased 3.0 percent from 2016 to $44,408, while real median earnings for their female counterparts ($31,610) saw no statistically significant change between 2016 and 2017 (Table 1).
• In 2017, the real median earn-ings of men ($52,146) and women ($41,977) working full-time, year-round each decreased from their respec-tive 2016 medians by 1.1 percent (Table 1 and Figure 2).7 The
7 The difference between the 2016–2017 percentage change in median earnings for men and women working full-time, year-round was not statistically significant.
2017 female-to-male earnings ratio was 0.805, not statistically different from the 2016 ratio.
• The number of men and women working full-time, year-round increased by 1.4 million and 1.0 million, respectively, between 2016 and 2017.8
8 The difference between the 2016–2017 increases in the number of men and women working full-time, year-round was not sta-tistically significant.
Table 1.Income and Earnings Summary Measures by Selected Characteristics: 2016 and 2017—Con.(Income in 2017 dollars. Households and people as of March of the following year. For information on confidentiality protec-tion, sampling error, nonsampling error, and definitions, see www2.census.gov/programs-surveys/cps/techdocs/cpsmar18.pdf)
Characteristic
2016 2017
Percentage change* in real median income (2017 less 2016)
Number (thou-sands)
Median income (dollars)
Number (thou-sands)
Median income (dollars)
Estimate
Margin of error 1
(±)Estimate
Margin of error1
(±) Estimate
Margin of error1
(±)EARNINGSTotal WorkersMen with earnings . . . . . . . . . . . . . . . . . . . . . 86,886 43,128 239 88,101 44,408 1,226 *3.0 2.78Women with earnings . . . . . . . . . . . . . . . . . . 77,742 31,546 206 78,196 31,610 171 0.2 0.74
Full-Time, Year-Round Workers Men with earnings . . . . . . . . . . . . . . . . . . . . . 64,953 52,751 215 66,379 52,146 225 *–1.1 0.56Women with earnings . . . . . . . . . . . . . . . . . . 48,328 42,448 251 49,293 41,977 208 *–1.1 0.65Female-to-male earnings ratio . . . . . . . . . . N 0.805 0.0052 N 0.805 0.0047 Z 0.79
* An asterisk preceding an estimate indicates change is statistically different from zero at the 90 percent confidence level. N Not applicable.Z Represents or rounds to zero.1 A margin of error is a measure of an estimate’s variability. The larger the margin of error in relation to the size of the estimate, the less reli-
able the estimate. This number, when added to and subtracted from the estimate, forms the 90 percent confidence interval. Margins of error shown in this table are based on standard errors calculated using replicate weights. For more information, see “Standard Errors and Their Use” at <www2.census.gov/library/publications/2018/demo/p60-263sa.pdf>.
2 Federal surveys give respondents the option of reporting more than one race. Therefore, two basic ways of defining a race group are possible. A group such as Asian may be defined as those who reported Asian and no other race (the race-alone or single-race concept) or as those who reported Asian regardless of whether they also reported another race (the race-alone-or-in-combination concept). This table shows data using the first approach (race alone). The use of the single-race population does not imply that it is the preferred method of presenting or analyzing data. The Census Bureau uses a variety of approaches. Information on people who reported more than one race, such as White and American Indian and Alaska Native or Asian and Black or African American, is available from the 2010 Census through American FactFinder. About 2.9 percent of people reported more than one race in the 2010 Census. Data for American Indians and Alaska Natives, Native Hawaiians and Other Pacific Islanders, and those reporting two or more races are not shown separately.
3 The 2016 estimates presented for residence may not match the previously published estimates due to a correction in the assignment of prin-cipal city status for a small number of households. For the definition of metropolitan statistical areas and principal cities, see <www.census.gov /programs-surveys/metro-micro/about/glossary.html>.
Note: Inflation-adjusted estimates may differ slightly from other published data due to rounding.Source: U.S. Census Bureau, Current Population Survey, 2017 and 2018 Annual Social and Economic Supplements.

4 Income and Poverty in the United States: 2017 U.S. Census Bureau
Household Income9
For the third consecutive year, households in the United States experienced an increase in real annual median income. Median household income was $61,372 in 2017, a 1.8 percent increase from the 2016 median of $60,309 in real terms (Figure 1 and Table 1). Since 2014, median household income has increased 10.4 percent in real terms (Table A-1).
Type of Household10
The 2017 real median income of family households increased 1.4 percent from 2016 to $77,713, while real median income of nonfamily households in 2017 ($36,650) was not statistically different from 2016 (Table 1).11 This is the third consecutive annual increase in median household income for family households. Real median income of married-couple households increased 1.6 percent between 2016 and 2017, while median income of house-holds maintained by women with no spouse present and house-holds maintained by men with no spouse present were not
⁹ The householder is the person (or one of the people) in whose name the home is owned or rented and the person to whom the relationship of other household mem-bers is recorded. If a married couple owns the home jointly, either the husband or the wife may be listed as the householder. Since only one person in each household is designated as the householder, the number of householders is equal to the number of households. This report uses the charac-teristics of the householder to describe the household.
10 A family household is a household maintained by a householder who is related to at least one other person in the house-hold by birth, marriage, or adoption and includes any unrelated individuals who may be residing there. A nonfamily household is a householder living alone (a one-person household) or sharing the home exclusively with nonrelatives.
11 The difference between the 2016–2017 percentage change in median income for family (1.4 percent) and nonfamily (0.3 percent) households was not statistically significant.
statistically different from 2016 medians in real terms.12 Looking at nonfamily households by sex, the changes in real median incomes were not statistically significant between 2016 and 2017.
For family households, married-couple households had the highest median income in 2017 ($90,386), followed by households
12 The differences between the 2016–2017 percentage changes in median income for each type of family household were not statistically significant.
maintained by men with no wife present ($60,843). Family house-holds maintained by women with no husband present had the low-est median income ($41,703).
Race and Hispanic Origin13
Between 2016 and 2017, the real median income of
13 Federal surveys give respondents the option of reporting more than one race. Therefore, two basic ways of defining a race group are possible. A group such as Asian may be defined as those who reported Asian and no other race (the race-alone
Caution for Historical Comparisons
Although 2017 median household income appears to be the highest median household income ever reported from the CPS ASEC, comparisons to estimates prior to 2013 must be made with caution as the income questions were redesigned in the 2014 CPS ASEC (for income in 2013). To better understand how the survey changes would affect income estimates, the 2014 CPS ASEC used a split-panel design. In the split-panel design, about 70 percent of the sample was randomly selected to receive the traditional income questions, which matched those administered prior to 2014. The other 30 percent of the sample received the redesigned questions. For a description of the split-panel design and results comparing the traditional and redesigned questionnaires, see Appendix D of Income and Poverty in the United States: 2014 at <www.census.gov/content/dam/Census/library/publications /2015/demo/p60-252.pdf#page=67>.
A comparison of data collected from both sets of questions showed a 3.17 percent increase in overall median household income due to the redesigned questions. One method for adjusting pre-2013 median household income estimates to make them compa-rable to current estimates is to increase them by this 3.17 percent. With this adjustment, the 2017 real median household income is not statistically different from the estimates in any year between 1998 and 2001 or 2005 through 2007, but is higher than all other years since 1967. This method of adjusting by 3.17 percent should be used with caution as the adjustment only applies to overall household median income and not to the medians for household subgroups. These adjustments are not made in our official publications and table packages because they require the assumption that the 3.17 percent difference between responses to the historical questions and the redesigned questions in 2013 would have been identical in all years before 2013. For more details, see <www.census.gov /newsroom/blogs/random-samplings/2017/09/was_median _household.html>.

U.S. Census Bureau Income and Poverty in the United States: 2017 5
or single-race concept) or as those who reported Asian regardless of whether they also reported another race (the race-alone-or-in-combination concept). The body of this report (text, figures, and tables) shows data using the first approach (race alone). The appendix tables show data using both approaches. Use of the single-race popula-tion does not imply that it is the preferred method of presenting or analyzing data. The Census Bureau uses a variety of approaches.
In this report, the terms “White, not Hispanic” and “non-Hispanic White” are used interchangeably and refer to people who are not Hispanic and who reported White and no other race. The Census Bureau uses non-Hispanic Whites as the comparison group for other race groups and Hispanics.
Since Hispanics may be any race, data in this report for Hispanics overlap with data for race groups. Being Hispanic was reported by 15.4 percent of White house-holders who reported only one race, 4.8 percent of Black householders who reported only one race, and 2.2 percent of Asian householders who reported only one race.
Data users should exercise caution when interpreting aggregate results for the Hispanic population or for race groups
non-Hispanic White and Hispanic-origin households increased 2.6 percent and 3.7 percent, respec-tively. The 2017 real median incomes of Black and Asian households were not statistically different from their 2016 medi-ans (Table 1 and Figure 1).14 This is the third consecutive annual
because these populations consist of many distinct groups that differ in socioeconomic characteristics, culture, and nativity. Data were first collected for Hispanics in 1972 and for Asians and Pacific Islanders in 1987. For further information, see <www.census .gov/programs-surveys/cps.html>.
14 The differences between the 2016–2017 percentage changes in median income for non-Hispanic White (2.6 percent), Black (–0.2 percent), and Hispanic (3.7 percent) households were not statistically signifi-cant. The difference between the 2016–2017 percentage changes in median income for Black (–0.2 percent) and Asian (–2.2 percent) households were not statistically significant.
increase in median household income for both non-Hispanic White and Hispanic-origin house-holds. Among the race groups, Asian households had the highest median income in 2017 ($81,331).15
The real median income of differ-ent groups can be compared by calculating the ratio of the median income of a specific group to the
15 The small sample size of the Asian population and the fact that the CPS ASEC does not use separate population controls for weighting the Asian sample to national totals contribute to the large variances surrounding estimates for this group. As a result, we are unable to detect statisti-cally significant year-to-year differences between some estimates for the Asian population. The American Community Survey (ACS), based on a much larger sample of the population, is a better source for estimating and identifying changes for small subgroups of the population.
Figure 1.Real Median Household Income by Race and Hispanic Origin: 1967 to 2017
Note: The data for 2013 and beyond reflect the implementation of the redesigned income questions. The data points are placed at the midpoints of the respective years. Median household income data are not available prior to 1967. For information on recessions, see Appendix A. For information on confidentiality protection, sampling error, nonsampling error, and definitions, see <www2.census.gov/programs-surveys/cps/techdocs/cpsmar18.pdf>.Source: U.S. Census Bureau, Current Population Survey, 1968 to 2018 Annual Social and Economic Supplements.
2017 dollars Recession
0
10,000
20,000
30,000
40,000
50,000
60,000
70,000
80,000
90,000
2017201020052000 19951990198519801975197019651959
$81,331
$68,145
$61,372
$50,486
$40,258
All races
White, not Hispanic
Black
Asian
Hispanic (any race)

6 Income and Poverty in the United States: 2017 U.S. Census Bureau
median income of non-Hispanic White households. For 2017, the ratio of Asian to non-Hispanic White income was 1.19, the ratio of Black to non-Hispanic White income was 0.59, while the ratio of Hispanic to non-Hispanic White income was 0.74. Between 2016 and 2017, the ratio of Asian to non-Hispanic White income decreased 4.7 percent, while the income ratios were not statistically different from 2016 for Black to non-Hispanic White and Hispanic to non-Hispanic White.16 Since 2014, the ratio of Hispanic to non-Hispanic White income increased 5.1 percent. Over the same period, the changes in the ratios of Black and Asian to non-Hispanic White income were not statistically sig-nificant (Table A-1).17
Age of Householder
For householders under the age of 65, the median household income increased 2.5 percent between 2016 and 2017, while median household income of household-ers aged 65 and over was not sta-tistically different from their 2016 median (Table 1).18 Specifically for householders under the age of 65, those aged 15 to 24 experienced a decrease of 5.8 percent in real median income between 2016 and 2017, while the 2017 real median incomes of householders aged 35
16 The difference between the 2016–2017 percentage changes in the ratios of Asian and Black to non-Hispanic White income was not statistically significant.
17 The difference between the 2014–2017 percentage changes in the ratios of Hispanic and Black to non-Hispanic White income was not statistically significant.
18 The difference between the 2016–2017 percentage changes in median income for householders under the age of 65 (2.5 percent) and by householders aged 65 and over (1.1 percent) was not statistically significant.
to 44 and 45 to 54 increased 3.0 percent and 2.3 percent, respec-tively, from their 2016 medians.19
Householders aged 45 to 54 had the highest median income in 2017 ($80,671), followed by house-holders aged 35 to 44 ($78,368), householders aged 55 to 64 ($68,567), and householders aged 25 to 34 ($62,294). Householders aged 65 and over ($41,125) and householders aged 15 to 24 ($40,093) had the lowest median incomes.20
Nativity21
Between 2016 and 2017, the real median income of households maintained by a native-born person increased 1.5 percent, from $61,066 to $61,987, while the median income of households maintained by a foreign-born person was not statistically dif-ferent from 2016 (Table 1). The foreign born can be classified into two categories: those who are
19 The only significant differences between the 2016–2017 percentage changes in median household income for each age group comparison were house-holders aged 15 to 24 (–5.8 percent) and all other householders by age group and between householders aged 25 to 34 (0.1 percent) and those under the age of 65 (2.5 percent).
20 The difference between the 2017 median household income among those with householders aged 15 to 24 ($40,039) and householders aged 65 and over ($41,125) was not statistically different.
21 Native-born households are those in which the householder was born in the United States, Puerto Rico, the U.S. Island Areas of Guam, the Commonwealth of the Northern Mariana Islands, American Samoa, the Virgin Islands of the United States or was born in a foreign country but had at least one parent who was a U.S. citizen. All other households are considered foreign born regardless of the date of entry into the United States or citizenship status. The CPS does not interview households in Puerto Rico. Of all householders, 84.4 percent were native born; 8.5 percent were foreign-born, naturalized citizens; and 7.1 percent were not U.S. citizens.
naturalized U.S. citizens and those who are not U.S. citizens. Neither group experienced a statistically significant change in their median household income between 2016 and 2017 (Table 1).22
In 2017, households maintained by a naturalized citizen ($65,859) had the highest median household income, followed by households maintained by a native-born per-son ($61,987). Households main-tained by a noncitizen had the lowest median household income ($49,739).
Region23
Between 2016 and 2017, the changes in real median incomes of households by region were not statistically significant.24 Median incomes were highest in the West ($67,517) and the Northeast ($66,450), followed by the Midwest ($61,136) and the South ($55,709) (Table 1).25
22 The difference between the 2016–2017 percentage changes in median income for households by specific nativity status was not statistically significant.
23 The Northeast region includes Connecticut, Maine, Massachusetts, New Hampshire, New Jersey, New York, Pennsylvania, Rhode Island, and Vermont. The Midwest region includes Illinois, Indiana, Iowa, Kansas, Michigan, Minnesota, Missouri, Nebraska, North Dakota, Ohio, South Dakota, and Wisconsin. The South region includes Alabama, Arkansas, Delaware, Florida, Georgia, Kentucky, Louisiana, Maryland, Mississippi, North Carolina, Oklahoma, South Carolina, Tennessee, Texas, Virginia, West Virginia, and the District of Columbia. The West region includes Alaska, Arizona, California, Colorado, Hawaii, Idaho, Montana, Nevada, New Mexico, Oregon, Utah, Washington, and Wyoming.
24 The differences between the 2016–2017 percentage changes in median income for households in all regions were not statistically significant.
25 The difference in 2017 median household incomes for the West and the Northeast was not statistically significant.

U.S. Census Bureau Income and Poverty in the United States: 2017 7
Residence26
Between 2016 and 2017, real median income for households within metropolitan statistical areas increased 2.2 percent from $62,852 to $64,265, while the change for households outside of metropolitan statistical areas was not statistically significant. This is the third consecutive annual increase in median income for households within metropolitan statistical areas. For households inside metropolitan areas, those outside principal cities experi-enced an increase of 2.4 percent in real median income, from $67,754 to $69,358, while the change in median income for households in principal cities was not statistically significant (Table 1).27
In 2017, households inside metro-politan areas but outside princi-pal cities had the highest median income ($69,358), followed by households inside principal cities ($55,708). Households outside metropolitan areas had the lowest median income ($47,563).
Income Inequality
The Census Bureau reports vari-ous measures of income inequal-ity: (1) the Gini index; (2) the shares of aggregate household income received by quintiles; (3) the ratio of income percentiles;
26 The 2016 estimates presented for residence may not match the previously published estimates due to a correction in the assignment of principal city status for a small number of households. For the defini-tion of metropolitan statistical areas and principal cities, see <www.census.gov /programs-surveys/metro-micro/about /glossary.html>.
27 The differences between the 2016–2017 percentage changes in median household income by residence were not significant except for inside metropolitan statistical areas (2.2 percent) and inside principal cities (–0.2 percent).
(4) the Theil index; (5) the mean logarithmic deviation of income (MLD); and (6) the Atkinson measures.28 The Gini index is a statistical measure of income inequality ranging from 0 to 1, with a measure of 1 indicating perfect inequality (one household having all the income and the rest having none) and a measure of 0 indicating perfect equality (all households having an equal share of income). The Theil index and the MLD are similar to the Gini index in that they are single sta-tistics that summarize the disper-sion of income across the entire income distribution. The Atkinson measures are useful in determin-ing which end of the income distribution contributed most to inequality.
Based on money income, none of the inequality measures shown in this report showed a statistically significant change between 2016 and 2017 (Table 2). The money income Gini index was 0.482 in 2017, and the MLD was 0.609; while the Theil index was 0.424.29 Table A-2 shows money income measures of the income distribu-tion at selected percentiles as well as the Gini index, MLD, Theil index, and Atkinson measures for income years 1967 to 2017. Comparing changes in household income at selected percentiles between 2016 and 2017, incomes at the 50th,
28 For an explanation of these inequal-ity measures, see James Foster, Suman Seth, Michael Lokshin, and Zurab Sajaia, “A Unified Approach to Measuring Poverty and Inequality: Theory and Practice,” World Bank, Washington, DC, 2013, <https://openknowledge.worldbank.org /bitstream/handle/10986/13731 /9780821384619.pdf>.
29 The differences between these index values did not undergo statistical test-ing because these indices are not directly comparable.
80th, 90th, and 95th percentiles increased 1.8 percent, 2.6 per-cent, 2.8 percent, and 3.0 percent, respectively, while changes in income at the other percentiles were not statistically significant.30
Households in the lowest quintile had incomes of $24,638 or less in 2017. Households in the sec-ond quintile had incomes from $24,639 to $47,110, those in the third quintile had incomes from $47,111 to $77,552, and those in the fourth quintile had incomes from $77,553 to $126,855. Households in the highest quintile had incomes of $126,856 or more. The top 5 percent of households in the income distribution had incomes of $237,035 or more (Table A-2).
Equivalence-Adjusted Income Inequality
Another way to measure income inequality is to use an equivalence-adjusted income estimate that takes into consideration the num-ber of people living in the house-hold and how these people share resources and take advantage of economies of scale. For example, the money-income-based distribu-tion treats an income of $30,000 for a single-person household and a family household similarly. However, the equivalence-adjusted income would be the same for a single-person household with an income of $30,000 and a family household with two adults and two children and an income of nearly $65,000. The equivalence
30 The differences between the 2016-2017 percentage changes in household income at the 50th (1.8 percent), 80th (2.6 percent), 90th (2.8 percent), and 95th (3.0 percent) percentiles were not statistically significant.

8 Income and Poverty in the United States: 2017 U.S. Census Bureau
adjustment used here is based on a three-parameter scale.31
Table 2 shows several income inequality measures, including aggregate income shares and the Gini index, using both money income and equivalence-adjusted income for 2016 and 2017. For both 2016 and 2017, the Gini index was lower when based on an equivalence-adjusted income
31 The three-parameter scale used here is the same as the one used in the Supplemental Poverty Measure. For details on the derivation of the three-parameter scale, see Liana Fox, “The Supplemental Poverty Measure: 2017,” Current Population Reports, P60-265, U.S. Census Bureau, September 2018, <www.census.gov/library /publications/2018/demo/p60-265.html>.
estimate than on the traditional money-income estimate, sug-gesting a more equal income distribution. Generally, the income shares in the lower quintiles are higher with equivalence-adjusted income than money income while the reverse is true for the higher quintiles. This redistribution would be expected because the lower end of the income distribu-tion has a higher concentration of single-person households and smaller family sizes than those at the upper end of the distribu-tion. Thus, equivalence-adjusting increases the relative income of
people living in lower-income groups.
Based on equivalence-adjusted income, changes in inequality between 2016 and 2017 were not statistically significant as mea-sured by the Gini index, the MLD, the Theil index, and the Atkinson measures (Table 2). After a 1.5 percent decrease between 2015 and 2016, the share of aggregate household income in the fourth quintile increased 0.9 percent between 2016 and 2017; the changes in the other quintiles were not statistically significant
Table 2. Income Distribution Measures Using Money Income and Equivalence–Adjusted Income: 2016 and 2017(For information on confidentiality protection, sampling error, nonsampling error, and definitions, see www2.census.gov /programs–surveys/cps/techdocs/cpsmar18.pdf )
Measure
2016 2017 Percentage change2,*
Money income
Equivalence– adjusted income
Money income
Equivalence– adjusted income
Money income
Equivalence– adjusted income
Esti-mate
Mar-gin of error1
(±)Esti-mate
Mar-gin of error1
(±)Esti-mate
Mar-gin of error1
(±)Esti-mate
Mar-gin of error1
(±)Esti-mate
Mar-gin of error1
(±)Esti-mate
Mar-gin of error1
(±)
Shares of Aggregate Income by Percentile
Lowest quintile . . . . . . . . . . . . . 3.1 0.05 3.5 0.05 3.1 0.05 3.5 0.07 –1.2 2.03 –0.2 2.21Second quintile . . . . . . . . . . . . 8.3 0.08 9.1 0.09 8.2 0.08 9.0 0.08 –1.1 1.24 –0.4 1.12Middle quintile . . . . . . . . . . . . . 14.2 0.12 14.7 0.12 14.3 0.11 14.7 0.11 0.4 1.08 –0.2 0.94Fourth quintile . . . . . . . . . . . . . 22.9 0.16 22.5 0.16 23.0 0.15 22.7 0.14 0.3 0.83 *0.9 0.83Highest quintile . . . . . . . . . . . . 51.5 0.34 50.2 0.36 51.5 0.33 50.1 0.33 Z 0.82 –0.3 0.80 Top 5 percent . . . . . . . . . . . . 22.6 0.42 22.4 0.42 22.3 0.40 21.8 0.38 –0.9 2.16 *–2.4 2.00
Summary MeasuresGini index of income
inequality . . . . . . . . . . . . . . . . 0.481 0.0035 0.464 0.0036 0.482 0.0034 0.463 0.0035 0.1 0.89 –0.2 0.88Mean logarithmic deviation
of income . . . . . . . . . . . . . . . . 0.601 0.0113 0.629 0.0121 0.609 0.0121 0.639 0.0151 1.5 2.62 1.7 2.83Theil . . . . . . . . . . . . . . . . . . . . . . 0.426 0.0092 0.403 0.0093 0.424 0.0089 0.397 0.0086 –0.5 2.55 –1.4 2.49Atkinson: e=0.25 . . . . . . . . . . . . . . . . . 0.103 0.0018 0.097 0.0019 0.103 0.0018 0.096 0.0018 –0.2 2.15 –0.9 2.11 e=0.50 . . . . . . . . . . . . . . . . 0.201 0.0030 0.192 0.0030 0.202 0.0030 0.191 0.0030 0.2 1.84 –0.4 1.82 e=0.75 . . . . . . . . . . . . . . . . . 0.305 0.0038 0.297 0.0039 0.307 0.0040 0.298 0.0045 0.6 1.66 0.3 1.71
* An asterisk preceding an estimate indicates change is statistically different from zero at the 90 percent confidence level.Z Represents or rounds to zero. 1 A margin of error is a measure of an estimate’s variability. The larger the margin of error in relation to the size of the estimate, the less reliable
the estimate. This number, when added to and subtracted from the estimate, forms the 90 percent confidence interval. Margins of error shown in this table are based on standard errors calculated using replicate weights. For more information, see “Standard Errors and Their Use” at <www2.census.gov/library/publications/2018/demo/p60–263.pdf>.
2 Calculated estimate may be different due to rounded components.Source: U.S. Census Bureau, Current Population Survey, 2017 and 2018 Annual Social and Economic Supplements.

U.S. Census Bureau Income and Poverty in the United States: 2017 9
between 2016 and 2017.32 The share of aggregate household income in the top 5 percent decreased 2.4 percent between 2016 and 2017; this is the first annual decrease in the share of aggregate income in the top 5 percent since 2010. Table A-3 shows equivalence-adjusted mea-sures of the income distribution as well as the Gini index, MLD, Theil index, and Atkinson measures for income years 1967 to 2017.
32 For the share of aggregate income in the fourth quintile, the difference between the 2015–2016 percent change and the 2016–2017 percent change was not statisti-cally significant.
Earnings and Work Experience33
The 2017 real median earnings of all male workers increased 3.0 percent from 2016 to $44,408,
33 Earnings are the sum of wage and salary income and nonfarm and farm self-employment income (gross receipts expenses). In 2017, 79 percent of aggregate income came from earnings. In this section, all workers includes people 15 years and older with earnings who, during the preced-ing calendar year worked on a part-time or full-time basis. A full-time, year-round worker is a person who worked at least 35 hours per week (full-time) and at least 50 weeks during the previous calendar year (year-round). For school personnel, sum-mer vacation is counted as weeks worked if they are scheduled to return to their job in the fall. For detailed information on work experience, see Table PINC-05, “Work Experience in 2017—People 15 Years Old and Over by Total Money Earnings in 2017, Age, Race, Hispanic Origin, and Sex” at <www.census.gov/data/tables/time-series /demo/income-poverty/cps-pinc/pinc-05 .html>.
while the change in median earn-ings for their female counterparts ($31,610) were not statistically different from the 2016 estimate (Table 1). In 2017, the real median earnings of men ($52,146) and women ($41,977) who worked full-time, year-round each decreased from their respective 2016 medi-ans by 1.1 percent (Table 1 and Figure 2).34, 35
34 For more detailed information on the relationship between earnings and household income, see “Understanding the Relationship Between Individual Earnings and Household Income” at <www.census.gov/newsroom/blogs /random-samplings/2017/11 /earnings-income.html>.
35 The difference between the 2016–2017 percentage change in median earnings for men and women working full-time, year-round was not statistically significant.
Ratio in percent Recession
80.5 percent
Female-to-male earnings ratio
Earnings of men
Earnings of women
Earnings in thousands (2017 dollars)
40
50
60
70
80
90
100
0
10
20
30
40
50
60
2017201020052000 19951990198519801975197019651959
Figure 2.Female-to-Male Earnings Ratio and Median Earnings of Full-Time, Year-Round Workers15 Years and Older by Sex: 1960 to 2017
Note: The data for 2013 and beyond reflect the implementation of the redesigned income questions. The data points are placed at the midpoints of the respective years. Data on earnings of full-time, year-round workers are not readily available before 1960. For information on recessions, see Appendix A. For information on confidentiality protection, sampling error, nonsampling error, and definitions, see <www2.census.gov/programs-surveys/cps/techdocs/cpsmar18.pdf>.Source: U.S. Census Bureau, Current Population Survey, 1961 to 2018 Annual Social and Economic Supplements.
$52,146
$41,977

10 Income and Poverty in the United States: 2017 U.S. Census Bureau
After adjusting for inflation, median earnings of full-time, year-round working women in 2017 were 0.9 percent higher than their 2007 median, the year before the most recent recession. The real median earnings of full-time, year-round working men were 2.5 percent lower in 2017 than in 2007 (Table A-4).
The female-to-male earnings ratio compares the median earnings of women working full-time, year-round to the median earnings of men working full-time, year-round. The 2017 female-to-male earnings ratio was 0.805, not statistically different from the 2016 ratio. Year-to-year changes in this ratio are
not common. The annual increase in the ratio from 2015 to 2016 was the first annual increase since 2007, the year before the most recent recession. However, the female-to-male earnings ratio has increased 3.5 percent from 0.778 in 2007.
Between 2016 and 2017, the total number of people with earn-ings, regardless of work experi-ence, increased by 1.7 million. The number of men with earnings increased by 1.2 million, while the change for women was not statis-tically significant.36 The number
36 The difference between the 2016–2017 increases in the number of total people with earnings (1.7 million) and the number of men with earnings (1.2 million) was not statistically significant.
of men and women full-time, year-round workers increased by 1.4 million and 1.0 million, respec-tively, between 2016 and 2017, continuing a shift from part-time, part-year work status to full-time, year-round work status (Figure 3 and Table A-4).37 An estimated 75.3 percent of working men with earnings and 63.0 percent of working women with earn-ings worked full-time, year-round in 2017; both percentages were higher than the 2016 estimates of 74.8 percent and 62.2 percent, respectively.
37 The difference between the 2016–2017 increases in the number of men and women working full-time, year-round was not sta-tistically significant.
Figure 3.Total and Full-Time, Year-Round Workers With Earnings by Sex: 1967 to 2017
Note: The data for 2013 and beyond reflect the implementation of the redesigned income questions. The data points are placed at the midpoints of the respective years. Data on number of workers are not readily available before 1967. Data are for people aged 15 and older beginning in 1980 and people aged 14 and older for previous years. Before 1989, data are for civilian workers only. For information on recessions, see Appendix A. For information on confidentiality protection, sampling error, nonsampling error, and definitions, see <www2.census.gov/programs-surveys/cps/techdocs/cpsmar18.pdf>.Source: U.S. Census Bureau, Current Population Survey, 1968 to 2018 Annual Social and Economic Supplements.
Numbers in millions Recession88.1 million
78.2 million
66.4 million
49.3 million
0
10
20
30
40
50
60
70
80
90
2017201020052000 19951990198519801975197019651959
Female full-time, year-round workers
Male workers
Female workers
Male full-time, year-round workers

U.S. Census Bureau Income and Poverty in the United States: 2017 11
POVERTY IN THE UNITED STATES
Highlights
• The official poverty rate in 2017 was 12.3 percent, down 0.4 percentage points from 12.7 percent in 2016 (Figure 4 and Table 3).38 This is the third consecutive annual decline in poverty. Since 2014, the pov-erty rate has fallen 2.5 percent-age points, from 14.8 percent to 12.3 percent (Table B-1).
• In 2017, there were 39.7 million people in poverty, not statisti-cally different from the number in poverty in 2016 (Figure 4 and Table 3).
38 The Office of Management and Budget determined the official definition of poverty in Statistical Policy Directive 14. Appendix B provides a more detailed description of how the Census Bureau cal-culates poverty.
• Between 2016 and 2017, the poverty rate for adults aged 18 to 64 declined 0.4 percentage points, from 11.6 percent to 11.2 percent, while poverty rates for individuals under the age of 18 and for people aged 65 and older were not statistically dif-ferent from 2016 (Table 3 and Figure 6).39
• Between 2016 and 2017, peo-ple with at least a bachelor’s degree were the only group to have an increase in the poverty rate or the number of people in poverty. Among this group, the poverty rate increased 0.3 percentage points and the number in poverty increased by
39 Since unrelated individuals under the age of 15 are excluded from the pov-erty universe, there were 607,000 fewer children in the poverty universe than in the total civilian noninstitutionalized population.
363,000 individuals between 2016 and 2017. Even with this increase, among educational attainment groups, people with at least a bachelor’s degree had the lowest poverty rates in 2017 (Table 3).
• From 2016 to 2017 the number of people in poverty decreased for people in families; people living in the West; people living outside metropolitan statistical areas; all workers; workers who worked less than full-time, year-round; people with a disabil-ity; people with a high school diploma but no college degree; and people with some college but no degree (Table 3 and Table 4).40
40 Individuals aged 25 and older with an associate degree are included in the some college, no degree category.
Figure 4.Number in Poverty and Poverty Rate: 1959 to 2017
Note: The data for 2013 and beyond reflect the implementation of the redesigned income questions. The data points are placed at the midpoints of the respective years. For information on recessions, see Appendix A. For information on confidentiality protection, sampling error, nonsampling error, and definitions, see <www2.census.gov/programs-surveys/cps/techdocs/cpsmar18.pdf>.Source: U.S. Census Bureau, Current Population Survey, 1960 to 2018 Annual Social and Economic Supplements.
Numbers in millions Recession
39.7 million
12.3 percent
Number in poverty
Poverty rate
Percent
20
25
30
35
40
45
50
0
5
10
15
20
25
2017201020052000 19951990198519801975197019651959

12 Income and Poverty in the United States: 2017 U.S. Census Bureau
Table 3.People in Poverty by Selected Characteristics: 2016 and 2017(Numbers in thousands, margin of error in thousands or percentage points as appropriate. People as of March of the following year. For information on confidentiality protec-tion, sampling error, nonsampling error, and definitions, see www2.census.gov/programs-surveys/cps/techdocs/cpsmar18.pdf )
Characteristic
2016 2017 Change in poverty (2017 less 2016)2,*
Total
Below poverty
Total
Below poverty
Number
Margin of error1
(±) Percent
Margin of error1
(±) Number
Margin of error1
(±) Percent
Margin of error1
(±) Number PercentPEOPLE Total . . . . . . . . . . . . . . . . . 319,911 40,616 739 12.7 0.2 322,549 39,698 915 12.3 0.3 –918 *–0.4Race3 and Hispanic OriginWhite . . . . . . . . . . . . . . . . . . . . . . . . . . 245,985 27,113 547 11.0 0.2 247,272 26,436 714 10.7 0.3 –677 *–0.3 White, not Hispanic . . . . . . . . . . . 195,221 17,263 493 8.8 0.3 195,256 16,993 571 8.7 0.3 –270 –0.1Black . . . . . . . . . . . . . . . . . . . . . . . . . . 41,962 9,234 388 22.0 0.9 42,474 8,993 373 21.2 0.9 –241 –0.8Asian . . . . . . . . . . . . . . . . . . . . . . . . . . 18,879 1,908 175 10.1 0.9 19,475 1,953 190 10.0 1.0 45 –0.1Hispanic (any race) . . . . . . . . . . . . . . 57,556 11,137 399 19.4 0.7 59,053 10,790 423 18.3 0.7 –348 *–1.1
SexMale . . . . . . . . . . . . . . . . . . . . . . . . . . . 156,677 17,685 395 11.3 0.3 158,116 17,365 483 11.0 0.3 –321 –0.3Female . . . . . . . . . . . . . . . . . . . . . . . . . 163,234 22,931 460 14.0 0.3 164,433 22,333 525 13.6 0.3 –598 *–0.5
AgeUnder age 18 . . . . . . . . . . . . . . . . . . . 73,586 13,253 370 18.0 0.5 73,356 12,808 425 17.5 0.6 –445 –0.6Aged 18 to 64 . . . . . . . . . . . . . . . . . . 197,051 22,795 473 11.6 0.2 198,113 22,209 564 11.2 0.3 –586 *–0.4Aged 65 and older . . . . . . . . . . . . . . 49,274 4,568 198 9.3 0.4 51,080 4,681 190 9.2 0.4 114 –0.1
NativityNative born . . . . . . . . . . . . . . . . . . . . . 276,089 33,999 670 12.3 0.2 277,158 33,095 850 11.9 0.3 –904 *–0.4Foreign born . . . . . . . . . . . . . . . . . . . 43,822 6,617 268 15.1 0.6 45,391 6,603 295 14.5 0.6 –14 –0.6 Naturalized citizen . . . . . . . . . . . . 20,409 2,045 143 10.0 0.7 21,851 2,213 146 10.1 0.6 168 0.1 Not a citizen . . . . . . . . . . . . . . . . . . 23,413 4,572 222 19.5 0.9 23,540 4,390 238 18.6 0.9 –182 –0.9
RegionNortheast . . . . . . . . . . . . . . . . . . . . . . 55,470 5,969 350 10.8 0.6 55,972 6,373 339 11.4 0.6 404 0.6Midwest . . . . . . . . . . . . . . . . . . . . . . . . 66,897 7,809 355 11.7 0.5 67,345 7,647 397 11.4 0.6 –162 –0.3South . . . . . . . . . . . . . . . . . . . . . . . . . . 121,166 17,028 524 14.1 0.4 122,250 16,609 587 13.6 0.5 –420 –0.5West . . . . . . . . . . . . . . . . . . . . . . . . . . . 76,377 9,810 373 12.8 0.5 76,982 9,069 400 11.8 0.5 *–740 *–1.1
Residence4
Inside metropolitan statistical areas . . . . . . . . . . . . . . . . . . . . . . . . . 276,296 33,718 835 12.2 0.3 279,537 33,322 857 11.9 0.3 –396 –0.3
Inside principal cities . . . . . . . . . . 103,252 16,495 643 16.0 0.5 103,860 16,218 634 15.6 0.5 –277 –0.4 Outside principal cities . . . . . . . . 173,044 17,223 577 10.0 0.3 175,677 17,105 577 9.7 0.3 –119 –0.2Outside metropolitan statistical
areas . . . . . . . . . . . . . . . . . . . . . . . . . 43,614 6,898 600 15.8 0.8 43,012 6,376 523 14.8 0.7 *–522 *–1.0
Work Experience Total, aged 18 to 64 . . . . 197,051 22,795 473 11.6 0.2 198,113 22,209 564 11.2 0.3 –586 *–0.4All workers . . . . . . . . . . . . . . . . . . . . . 150,904 8,743 254 5.8 0.2 152,199 8,135 259 5.3 0.2 *–608 *–0.4 Worked full-time,
year-round . . . . . . . . . . . . . . . . . . 107,781 2,416 131 2.2 0.1 109,700 2,422 128 2.2 0.1 6 Z Less than full-time,
year-round . . . . . . . . . . . . . . . . . . 43,123 6,327 223 14.7 0.5 42,499 5,714 224 13.4 0.5 *–613 *–1.2Did not work at least 1 week . . . . . 46,148 14,052 381 30.5 0.7 45,914 14,073 440 30.7 0.7 21 0.2
Disability Status5
Total, aged 18 to 64 . . . . 197,051 22,795 473 11.6 0.2 198,113 22,209 564 11.2 0.3 –586 *–0.4With a disability . . . . . . . . . . . . . . . . 15,405 4,123 191 26.8 1.1 15,116 3,764 170 24.9 1.0 *–360 *–1.9With no disability . . . . . . . . . . . . . . . 180,783 18,629 409 10.3 0.2 182,042 18,412 504 10.1 0.3 –217 –0.2
Educational Attainment Total, aged 25 and
older . . . . . . . . . . . . . . . . . 216,921 22,636 425 10.4 0.2 219,830 22,163 516 10.1 0.2 –473 *–0.4No high school diploma . . . . . . . . . 22,541 5,599 214 24.8 0.8 22,411 5,485 217 24.5 0.9 –113 –0.4High school, no college . . . . . . . . . . 62,512 8,309 250 13.3 0.4 62,685 7,942 285 12.7 0.4 *–367 *–0.6Some college, no degree . . . . . . . . 57,765 5,430 202 9.4 0.3 57,810 5,075 206 8.8 0.4 *–356 *–0.6Bachelor’s degree or higher . . . . . . 74,103 3,299 167 4.5 0.2 76,924 3,661 181 4.8 0.2 *363 *0.3
* An asterisk preceding an estimate indicates change is statistically different from zero at the 90 percent confidence level .Z Represents or rounds to zero . 1 A margin of error is a measure of an estimate’s variability . The larger the margin of error in relation to the size of the estimate, the less reliable the estimate . This number, when
added to and subtracted from the estimate, forms the 90 percent confidence interval . Margins of error shown in this table are based on standard errors calculated using replicate weights . For more information, see “Standard Errors and Their Use” at <www2 .census .gov/library/publications/2018/demo/p60-263sa .pdf> .
2 Details may not sum to totals because of rounding .3 Federal surveys give respondents the option of reporting more than one race . Therefore, two basic ways of defining a race group are possible . A group such as Asian may be
defined as those who reported Asian and no other race (the race-alone or single-race concept) or as those who reported Asian regardless of whether they also reported another race (the race-alone-or-in- combination concept) . This table shows data using the first approach (race alone) . The use of the single-race population does not imply that it is the preferred method of presenting or analyzing data . The Census Bureau uses a variety of approaches . Information on people who reported more than one race, such as White and American Indian and Alaska Native or Asian and Black or African American, is available from the 2010 Census through American FactFinder . About 2 .9 percent of people reported more than one race in the 2010 Census . Data for American Indians and Alaska Natives, Native Hawaiians and Other Pacific Islanders, and those reporting two or more races are not shown separately .
4 The 2016 estimates presented for residence may not match the previously published estimates due to a correction in the assignment of principal city status for a small number of households . For the definition of metropolitan statistical areas and principal cities, see <www .census .gov/programs-surveys/metro-micro/about/glossary .html> .
5 The sum of those with and without a disability does not equal the total because disability status is not defined for individuals in the armed forces .Source: U .S . Census Bureau, Current Population Survey, 2017 and 2018 Annual Social and Economic Supplements .

U.S. Census Bureau Income and Poverty in the United States: 2017 13
Table 4 .Families and People in Poverty by Type of Family: 2016 and 2017(Numbers in thousands, margin of error in thousands or percentage points as appropriate . Families as of March of the following year . For information on confidentiality protec-tion, sampling error, nonsampling error, and definitions, see www2.census.gov/programs-surveys/cps/techdocs/cpsmar18.pdf )
Characteristic
2016 2017 Change in poverty (2017 less 2016)2,*
Total
Below poverty
Total
Below poverty
Number
Margin of error1
(±) Percent
Margin of error1
(±) Number
Margin of error1
(±) Percent
Margin of error1
(±) Number Percent
FAMILIESPrimary Families3 . . . . . . . . . . . . . . . . . 82,854 8,081 199 9.8 0.2 83,103 7,758 223 9.3 0.3 *–324 *–0.4 Married-couple . . . . . . . . . . . . . . . . . . 60,821 3,096 139 5.1 0.2 61,254 3,005 136 4.9 0.2 –90 –0.2 Female householder, no husband
present . . . . . . . . . . . . . . . . . . . . . . . . 15,581 4,138 164 26.6 0.9 15,425 3,959 140 25.7 0.8 –179 –0.9 Male householder, no wife
present . . . . . . . . . . . . . . . . . . . . . . . . 6,452 847 72 13.1 1.1 6,424 793 72 12.4 1.0 –54 –0.8
Unrelated Subfamilies4 . . . . . . . . . . . . 496 202 34 40.6 5.6 446 137 29 30.8 5.5 *–64 *–9.9
PEOPLEPersons in FamiliesIn primary families . . . . . . . . . . . . . . . . . 259,863 27,762 654 10.7 0.3 260,709 26,766 769 10.3 0.3 *–995 *–0.4 Related children under age 18 . . 72,674 12,803 370 17.6 0.5 72,532 12,439 415 17.1 0.6 –364 –0.5 Related children under age 6 . . 23,531 4,586 180 19.5 0.8 23,574 4,525 225 19.2 1.0 –61 –0.3 In married-couple families . . . . . . . . 192,838 11,252 504 5.8 0.3 194,037 11,000 492 5.7 0.3 –252 –0.2 Related children under age 18 . . 49,480 4,177 253 8.4 0.5 49,436 4,174 240 8.4 0.5 –3 Z Related children under age 6 . . 16,460 1,561 119 9.5 0.7 16,535 1,577 131 9.5 0.8 17 0.1 In families with a female
householder, no husband present . . . . . . . . . . . . . . . . . . . . . . . . 48,243 13,914 524 28.8 1.0 47,999 13,378 496 27.9 0.9 –535 –1.0
Related children under age 18 . . 18,088 7,613 321 42.1 1.4 17,766 7,244 319 40.8 1.4 –369 –1.3 Related children under age 6 . . 5,404 2,656 160 49.1 2.2 5,263 2,546 158 48.4 2.2 –109 –0.8 In families with a male
householder, no wife present . . . . 18,782 2,596 218 13.8 1.1 18,674 2,388 219 12.8 1.1 –208 –1.0 Related children under age 18 . . 5,106 1,014 110 19.9 1.9 5,330 1,021 115 19.1 1.9 7 –0.7 Related children under age 6 . . 1,666 370 55 22.2 2.8 1,776 402 71 22.6 3.4 32 0.4
In unrelated subfamilies . . . . . . . . . . . . 1,208 519 89 43.0 5.8 1,054 339 70 32.2 5.7 *–180 *–10.8 Children under age 18 . . . . . . . . . . . . 622 298 57 48.0 6.6 514 193 40 37.5 6.7 *–106 *–10.5
Persons Not in FamiliesUnrelated individuals . . . . . . . . . . . . . . . 58,839 12,336 365 21.0 0.5 60,786 12,593 377 20.7 0.5 257 –0.2 Male . . . . . . . . . . . . . . . . . . . . . . . . . . . . 28,721 5,259 243 18.3 0.7 29,810 5,413 226 18.2 0.7 154 –0.2 Female . . . . . . . . . . . . . . . . . . . . . . . . . 30,119 7,076 236 23.5 0.7 30,976 7,180 251 23.2 0.7 104 –0.3
*An asterisk preceding an estimate indicates change is statistically different from zero at the 90 percent confidence level .Z Represents or rounds to zero .1 A margin of error is a measure of an estimate’s variability . The larger the margin of error in relation to the size of the estimate, the less reliable the estimate . This number, when
added to and subtracted from the estimate, forms the 90 percent confidence interval . Margins of error shown in this table are based on standard errors calculated using replicate weights . For more information, see “Standard Errors and Their Use” at <www2 .census .gov/library /publications/2018/demo/p60-263sa .pdf> .
2 Details may not sum to totals because of rounding .3 A primary family is a group of two or more people, one of whom is the householder, related by birth, marriage, or adoption and residing together . All such people (including
related subfamily members) are considered as members of one family .4 An unrelated subfamily is defined as a married couple with or without children or a single parent with one or more own, never-married, children under the age of 18 living in a
household and not related by birth, marriage, or adoption to the householder .Source: U .S . Census Bureau, Current Population Survey, 2017 and 2018 Annual Social and Economic Supplements .

14 Income and Poverty in the United States: 2017 U.S. Census Bureau
Race and Hispanic Origin
The poverty rate for non-Hispanic Whites was 8.7 percent in 2017 with 17.0 million individuals in poverty. Neither the poverty rate nor the number in poverty was statistically different from 2016. The poverty rate for non-Hispanic Whites was lower than the poverty rates for other racial groups. Non-Hispanic Whites accounted for 60.5 percent of the total population and 42.8 percent of the people in poverty in 2017 (Table 3).
The poverty rate for Blacks was 21.2 percent in 2017, representing 9.0 million people in poverty. For Asians, the 2017 poverty rate and the number in poverty were 10.0 percent and 2.0 million, respec-tively. Among Blacks and Asians, neither the poverty rate nor the number in poverty was statistically different from 2016. The poverty rate for Hispanics was 18.3 percent in 2017, down from 19.4 percent in 2016. In 2017, the number of Hispanics in poverty was 10.8 mil-lion, not significantly different from the number in 2016.
Sex
In 2017, the poverty rate for males was 11.0 percent, not statistically different from 2016. The 2017 poverty rate for females was 13.6 percent, down from 14.0 percent in 2016 (Table 3).
The poverty rate in 2017 for women aged 18 to 64 was 13.0 percent while the poverty rate for men aged 18 to 64 was 9.4 percent. The poverty rate for women aged 65 and older was 10.5 percent while the poverty rate for men aged 65 and older was 7.5 percent. For people under the age of 18, the poverty rate for girls (17.7 percent) and the poverty rate for boys
(17.3 percent) were not statistically different (Figure 5).
Age
Between 2016 and 2017, the pov-erty rate for people aged 18 to 64 decreased to 11.2 percent, down from 11.6 percent. The number of people in poverty within this age group was 22.2 million in 2017, not statistically different from 2016. For people aged 65 and older, the 2017 poverty rate was 9.2 percent, representing 4.7 million individu-als in poverty. Neither the poverty rate nor the number in poverty was statistically different from 2016 for this age group (Table 3 and Figure 6).
For people under the age of 18, 17.5 percent (12.8 million) were in poverty in 2017, neither esti-mate statistically different from 2016. This group represented 22.7 percent of the total population in 2017 and 32.3 percent of the people in poverty.
Related children are people under the age of 18 related to the householder by birth, marriage, or adoption who are not them-selves householders or spouses of householders.41 In 2017, 17.1 percent (12.4 million) of related children under the age of 18 were in poverty, not statistically differ-ent from 2016 (Table 4).
The number and percent of related children in poverty were not statistically different from 2016 to 2017 across all household types—those living with married, female, or male householders.42 In 2017, the proportion and number
41 Official poverty estimates for children are compiled in two ways—estimates for all children and estimates for related chil-dren. In 2017, estimates for related children excluded 824,000 children. About 514,000 of these children were members of unre-lated subfamilies. The rest were unrelated individuals between the ages of 15 and 17 or householders and spouses of householders under 18 years of age.
42 For more information on related children, see detailed table POV03 “People in Families with Related Children Under 18 by Family Structure, Age, and Sex, Iterated by Income-to-Poverty Ratio and Race” at <www.census.gov/data/tables/time-series /demo/income-poverty/cps-pov/pov-03 .html>.
Figure 5.Poverty Rates by Age and Sex: 2017(In percent)
Female
Male
17.7
17.3
13.0
7.5
10.5
9.4
Under age 18
Aged18 to 64
Aged65 and older
Note: For information on confidentiality protection, sampling error, nonsampling error, and definitions, see <www2.census.gov/programs-surveys/cps/techdocs/cpsmar18.pdf>.Source: U.S. Census Bureau, Current Population Survey, 2018 Annual Social and Economic Supplement.

U.S. Census Bureau Income and Poverty in the United States: 2017 15
of related children in poverty were 8.4 percent and 4.2 million among married-couple families, 40.8 percent and 7.2 million among female-householder families, and 19.1 percent and 1.0 million among male-householder families.43
One group of children did expe-rience a statistically-significant decline in their poverty rate: children living in unrelated sub-families. These are children whose parents (or parent) are not related by birth, marriage, or adoption to the householder. The poverty rate for these children fell by 10.5 per-centage points: from 48.0 percent
43 In the text of this report, families with a female householder with no husband present will be referred to as families with a female householder. Families with a male householder with no wife present will be referred to as families with a male householder.
in 2016 to 37.5 percent in 2017. Note, however, that these children represent less than 1.0 percent of all children (Table 4).
The poverty rate and the number in poverty for related children under the age of 6 were 19.2 percent and 4.5 million in 2017, not statistically different from 2016. About half (48.4 percent) of related children under the age of 6 in families with a female house-holder were in poverty. This was more than four times the rate of their counterparts in married- couple families (9.5 percent).
Nativity
The poverty rate for the native-born population decreased to 11.9 percent in 2017, down from 12.3 percent in 2016. The number of
native-born individuals in pov-erty was 33.1 million in 2017, not significantly different from 2016. Among the foreign-born popula-tion, 14.5 percent and 6.6 million were in poverty in 2017. Neither the poverty rate nor the number of foreign-born individuals in poverty were statistically different from the 2016 estimate (Table 3).
The poverty rate in 2017 for foreign-born naturalized citizens (10.1 percent) was lower than the poverty rates for noncitizens and native-born citizens (18.6 percent and 11.9 percent, respectively). Neither the poverty rate nor the number of foreign-born natural-ized citizens in poverty in 2017 (2.2 million) were statistically dif-ferent from the 2016 estimate. The poverty rate for those who were
Figure 6.Poverty Rates by Age: 1959 to 2017
Note: The data for 2013 and beyond reflect the implementation of the redesigned income questions. The data points are placed at the midpoints of the respective years. Data for people aged 18 to 64 and aged 65 and older are not available from 1960 to 1965. For information on recessions, see Appendix A. For information on confidentiality protection, sampling error, nonsampling error, and definitions, see <www2.census.gov/programs-surveys/cps/techdocs/cpsmar18.pdf>.Source: U.S. Census Bureau, Current Population Survey, 1960 to 2018 Annual Social and Economic Supplements.
Percent
0
5
10
15
20
25
30
35
40
45
50
2017201020052000 19951990198519801975197019651959
Recession
11.2 percent9.2 percent
17.5 percent
Aged 18 to 64
Under age 18
Aged 65 and older

16 Income and Poverty in the United States: 2017 U.S. Census Bureau
not U.S. citizens in 2017 was 18.6 percent, representing 4.4 million individuals in poverty. Neither the 2017 poverty rate for noncitizens nor the number in poverty were significantly dif-ferent from the 2016 estimate. Within the foreign-born popula-tion in 2017, 48.1 percent were naturalized U.S. citizens, while the remaining were not citizens of the United States.
Region
Between 2016 and 2017, the West was the only region to experience a statistically-significant change in the poverty rate or the number of people in poverty. The 2017 pov-erty rate and number in poverty for the West was 11.8 percent and 9.1 million, down from 12.8 percent and 9.8 million in 2016. In 2017, the poverty rate and the number in poverty was 11.4 percent and 6.4 million for the Northeast, 11.4 percent and 7.6 million for the Midwest, and 13.6 percent and 16.6 million for the South. The South had the highest poverty rate in 2017 relative to the other three regions (Table 3).44
Residence45
Inside metropolitan statistical areas, the poverty rate and the
44 The 2017 poverty rate for the Northeast was not significantly different from the poverty rates for the Midwest or for the West. The 2017 poverty rates for the Midwest and West regions were not statisti-cally different from one another.
45 The 2016 estimates presented for residence may not match the previously published estimates due to a correction in the assignment of principal city status for a small number of households. For the defini-tion of metropolitan statistical areas and principal cities, see <www.census.gov /programs-surveys/metro-micro/about /glossary.html>.
number of people in poverty in 2017 were 11.9 percent and 33.3 million, neither statistically differ-ent from 2016. Among those living outside metropolitan statistical areas, the poverty rate decreased to 14.8 percent in 2017, down from 15.8 percent in 2016. The number in poverty decreased to 6.4 mil-lion, down from 6.9 million (Table 3).
The 2017 poverty rate for those living inside metropolitan areas but not in principal cities was 9.7 percent, and the number in poverty was 17.1 million. Among those who lived in principal cit-ies, the poverty rate in 2017 was 15.6 percent and the number in poverty was 16.2 million. Neither group experienced a statistically-significant change in the poverty rate nor in the number in poverty between 2016 and 2017.
Work Experience
In 2017, 5.3 percent of workers aged 18 to 64 were in poverty, a decline from 5.8 percent in 2016. For those who worked full-time, year-round, 2.2 percent were in poverty in 2017, not statistically different from 2016. Those work-ing less than full-time, year-round had a poverty rate in 2017 of 13.4 percent, down from 14.7 percent in 2016 (Table 3).
Among those aged 18 to 64 who did not work at least 1 week dur-ing the calendar year, 30.7 per-cent were in poverty in 2017, not statistically different from 2016. Those who did not work at least 1 week in 2017 represented 23.2 percent of all people aged 18 to
64, while they made up 63.4 per-cent of people aged 18 to 64 in poverty.
Disability Status
For people aged 18 to 64 with a disability, the poverty rate in 2017 was 24.9 percent, down from 26.8 percent in 2016. The number in poverty with a dis-ability was 3.8 million, a decline from 4.1 million in 2016. In 2017, 10.1 percent of people aged 18 to 64 without a disability were in poverty, representing 18.4 million people. Neither the poverty rate nor the number in poverty without a disability showed any statistical change between 2016 and 2017 (Table 3).
Among people aged 18 to 64, those with a disability represented 7.6 percent of all people, com-pared with 16.9 percent of people aged 18 to 64 in poverty.
Educational Attainment
In 2017, 24.5 percent of people aged 25 and older without a high school diploma were in poverty, not significantly different from 2016. The 2017 poverty rate for those with a high school diploma but with no college was 12.7 per-cent, down from 13.3 percent in 2016. For those with some college but no degree, 8.8 percent were in poverty in 2017, a decline from 9.4 percent in 2016 (Table 3).
Among people with at least a bachelor’s degree, the poverty rate and the number in poverty were 4.8 percent and 3.7 million in 2017, up from 4.5 percent and 3.3 million in 2016. This was the

U.S. Census Bureau Income and Poverty in the United States: 2017 17
only group to have an increase in the poverty rate or the number of people in poverty between 2016 and 2017. Even with this increase, among educational attainment groups, people with at least a bachelor’s degree had the lowest poverty rates in 2017. People with at least a bache-lor’s degree in 2017 represented 35.0 percent of all people aged 25 and older, compared with 16.5 percent of people aged 25 and older in poverty.
Families
The poverty rate for primary families in 2017 was 9.3 percent, represent-ing 7.8 million families, a decline from 9.8 percent and 8.1 million families in 2016.46 The poverty rate for unrelated subfamilies was 30.8 percent, representing 137,000 fami-lies, a decline from 40.6 percent and 202,000 families in 2016 (Table 4).47
The poverty rate and the number in poverty in 2017 were 4.9 percent and 3.0 million for married-couple primary families, 25.7 percent and 4.0 million for primary families with a female householder, and 12.4 per-cent and 793,000 for primary fami-lies with a male householder. None of these family types experienced a statistically-significant change in the rate or number of families in poverty between 2016 and 2017.
Depth of Poverty
Categorizing a person as “in pov-erty” or “not in poverty” is one way to describe his or her economic
46 A primary family is a group of two or more people, one of whom is the householder, related by birth, marriage, or adoption and residing together. All such people (including related subfamily members) are considered as members of one family.
47 An unrelated subfamily is defined as a married couple with or without children or a single parent with one or more own, never-married, children under the age of 18 living in a household and not related by birth, marriage, or adoption to the householder.
situation. The income-to-poverty ratio and the income deficit or surplus describe additional aspects of economic well-being. While the poverty rate shows the proportion of people with income below the rel-evant poverty threshold, the income-to-poverty ratio gauges the depth of poverty and shows how close a family’s income is to its poverty threshold. The income-to-poverty ratio is reported as a percentage that compares a family’s or an unrelated person’s income with the applicable threshold. For example, a family with an income-to-poverty ratio of 125 percent has income that is 25 per-cent above its poverty threshold.
The income deficit or surplus shows how many dollars a family’s or an individual’s income is below (or above) their poverty threshold. For those with an income deficit, the measure is an estimate of the dol-lar amount necessary to reach their poverty threshold.
Ratio of Income to Poverty
Table 5 presents the number and the percentage of people with specified income-to-poverty ratios—those below 50 percent of poverty (“Under 0.50”), those below 125 percent of poverty (“Under 1.25”), those below 150 percent of poverty (“Under 1.50”), and those below 200 percent of poverty (“Under 2.00”).
In 2017, 18.5 million people reported family income below one-half of their poverty threshold. They repre-sented 5.7 percent of all people and 46.7 percent of those in poverty. Approximately 16.7 percent of indi-viduals had family income below 125 percent of their threshold, 21.0 per-cent had family income below 150 percent of their poverty threshold, and 29.7 percent had family income
below 200 percent of their threshold (Table 5).
Of the 18.5 million people in 2017 with family income below one-half of their poverty threshold, 5.9 million were individuals under the age of 18, 11.0 million were aged 18 to 64, and 1.7 million were aged 65 and older (Table 5). The demographic makeup of the population differs at vary-ing degrees of poverty (Figure 7). In 2017, people under the age of 18 represented:
• 22.7 percent of the overall population.
• 19.8 percent of people in families with income above 200 percent of their poverty threshold.
• 27.9 percent of people in families with income between 100 percent and 200 percent of their poverty threshold.
• 31.6 percent of people in families below 50 percent of their poverty threshold.
By comparison, people aged 65 and older represented:
• 15.8 percent of the overall population.
• 15.7 percent of people in families with income above 200 percent of their poverty threshold.48
• 19.1 percent of people in families between 100 percent and 200 percent of their poverty threshold.
• 8.9 percent of people in families below 50 percent of their poverty threshold.
Income Deficit
The income deficit for families in poverty (the difference in dollars between a family’s income and its
48 The percentage of all people aged 65 and older was not statistically different from the percentage of people aged 65 and older above 200 percent of their poverty threshold.

18 Income and Poverty in the United States: 2017 U.S. Census Bureau
Tab
le 5
.P
eop
le W
ith
Inco
me
Bel
ow S
pec
ified
Rat
ios
of
Thei
r P
over
ty T
hres
hold
s by
Sel
ecte
d C
hara
cter
isti
cs: 2
017
(Num
ber
s in
tho
usan
ds,
mar
gin
of
erro
r in
tho
usan
ds
or
per
cent
age
po
ints
as
app
rop
riat
e. P
eop
le a
s o
f M
arch
of
the
follo
win
g y
ear.
Fo
r in
form
atio
n o
n co
nfid
enti
alit
y p
rote
ctio
n, s
am-
plin
g e
rro
r, no
nsam
plin
g e
rro
r, an
d d
efini
tio
ns, s
ee w
ww
2.ce
nsus
.gov
/pro
gra
ms-
surv
eys/
cps/
tech
do
cs/c
psm
ar18
.pd
f )
Cha
ract
eris
tic
Tota
l
Inco
me-
to-p
over
ty r
atio
1
Und
er 0
.50
Und
er 1
.25
Und
er 1
.50
Und
er 2
.00
Num
ber
Mar
gin
o
f er
ror2
(±)
Per
cent
Mar
gin
o
f er
ror2
(±)
Num
ber
Mar
gin
o
f er
ror2
(±)
Per
cent
Mar
gin
o
f er
ror2
(±)
Num
ber
Mar
gin
o
f er
ror2
(±)
Per
cent
Mar
gin
o
f er
ror2
(±)
Num
ber
Mar
gin
o
f er
ror2
(±)
Per
cent
Mar
gin
o
f er
ror2
(±)
All
peo
ple
...
....
.32
2,54
918
,544
640
5.7
0.2
54,0
101,
010
16.7
0.3
67,5
991,
062
21.0
0.3
95,7
021,
193
29.7
0.4
Ag
eU
nder
ag
e 18
....
....
....
..73
,356
5,86
427
88.
00.
417
,293
443
23.6
0.6
21,1
7045
328
.90.
628
,426
449
38.8
0.6
Ag
ed 1
8 t
o 6
4
....
....
....
198,
113
11,0
2840
45.
60.
229
,538
622
14.9
0.3
36,4
1066
818
.40.
351
,880
810
26.2
0.4
Ag
ed 6
5 an
d o
lder
...
....
.51
,080
1,65
213
23.
20.
37,
179
250
14.1
0.5
10,0
1930
519
.60.
615
,396
384
30.1
0.8
Sex
Mal
e .
....
....
....
....
....
158,
116
8,10
734
45.
10.
223
,903
530
15.1
0.3
30,0
5856
819
.00.
443
,170
661
27.3
0.4
Fem
ale
....
....
....
....
...
164,
433
10,4
3738
16.
30.
230
,107
586
18.3
0.4
37,5
4161
422
.80.
452
,532
653
31.9
0.4
Rac
e3 an
d H
isp
anic
Ori
gin
Whi
te .
....
....
....
....
...
247,
272
12,2
0950
44.
90.
236
,503
796
14.8
0.3
46,1
9885
318
.70.
366
,857
973
27.0
0.4
W
hite
, no
t H
isp
anic
...
..19
5,25
68,
232
390
4.2
0.2
23,1
7264
611
.90.
329
,751
695
15.2
0.4
44,0
9982
922
.60.
4B
lack
....
....
....
....
....
.42
,474
4,41
329
810
.40.
711
,848
419
27.9
1.0
14,2
8644
633
.61.
118
,950
454
44.6
1.1
Asi
an .
....
....
....
....
...
19,4
751,
027
135
5.3
0.7
2,54
522
013
.11.
13,
254
240
16.7
1.2
4,62
926
423
.81.
3
His
pan
ic (
any
race
) ..
....
..59
,053
4,49
929
77.
60.
515
,208
471
25.8
0.8
18,6
9950
331
.70.
925
,729
531
43.6
0.9
Fam
ily S
tatu
sIn
fam
ilies
...
....
....
....
.26
0,70
911
,631
488
4.5
0.2
37,3
2684
414
.30.
347
,564
867
18.2
0.3
68,9
6899
826
.50.
4
Ho
useh
old
er .
....
....
...
83,1
033,
521
138
4.2
0.2
10,7
5825
412
.90.
313
,821
265
16.6
0.3
20,2
3832
124
.40.
4
Rel
ated
chi
ldre
n un
der
age
18 ..
....
....
....
...
72,5
325,
575
267
7.7
0.4
16,8
6743
323
.30.
620
,689
440
28.5
0.6
27,8
4344
338
.40.
6
R
elat
ed c
hild
ren
und
er
age
6 .
....
....
....
..23
,574
2,10
014
98.
90.
66,
105
215
25.9
0.9
7,37
021
931
.30.
99,
671
217
41.0
0.9
In u
nrel
ated
sub
fam
ilies
...
.1,
054
242
6122
.95.
241
177
39.0
5.7
496
8647
.16.
063
810
260
.66.
0U
nrel
ated
ind
ivid
uals
...
...
60,7
866,
671
273
11.0
0.4
16,2
7343
126
.80.
619
,539
487
32.1
0.6
26,0
9556
942
.90.
7
1 The
est
imat
es f
or
peo
ple
wit
h in
com
e b
elo
w 1
00
per
cent
of
thei
r p
over
ty t
hres
hold
s (u
nder
1.0
0)
can
be
foun
d in
Tab
le 3
.2
A m
arg
in o
f er
ror
is a
mea
sure
of
an e
stim
ate’
s va
riab
ility
. The
larg
er t
he m
arg
in o
f er
ror
in r
elat
ion
to t
he s
ize
of
the
esti
mat
e, t
he le
ss r
elia
ble
the
est
imat
e. T
his
num
ber
, whe
n ad
ded
to
and
sub
trac
ted
fro
m
the
esti
mat
e, f
orm
s th
e 9
0 p
erce
nt c
onfi
den
ce in
terv
al. M
arg
ins
of
erro
r sh
own
in t
his
tab
le a
re b
ased
on
stan
dar
d e
rro
rs c
alcu
late
d u
sing
rep
licat
e w
eig
hts.
Fo
r m
ore
info
rmat
ion,
see
“S
tand
ard
Err
ors
and
The
ir U
se”
at
<ww
w2.
cens
us.g
ov/l
ibra
ry/p
ublic
atio
ns/2
018
/dem
o/p
60
-26
3sa.
pd
f>.
3 F
eder
al s
urve
ys g
ive
resp
ond
ents
the
op
tio
n o
f re
po
rtin
g m
ore
tha
n o
ne r
ace.
The
refo
re, t
wo
bas
ic w
ays
of
defi
ning
a r
ace
gro
up a
re p
oss
ible
. A g
roup
suc
h as
Asi
an m
ay b
e d
efine
d a
s th
ose
who
rep
ort
ed A
sian
and
no
oth
er r
ace
(the
rac
e-al
one
or
sing
le-r
ace
conc
ept)
or
as t
hose
who
rep
ort
ed A
sian
reg
ard
less
of
whe
ther
the
y al
so r
epo
rted
ano
ther
rac
e (t
he r
ace-
alo
ne-o
r-in
-co
mb
inat
ion
conc
ept)
. Thi
s ta
ble
sho
ws
dat
a us
ing
the
fi
rst
app
roac
h (r
ace
alo
ne).
The
use
of
the
sing
le-r
ace
po
pul
atio
n d
oes
no
t im
ply
tha
t it
is t
he p
refe
rred
met
hod
of
pre
sent
ing
or
anal
yzin
g d
ata.
The
Cen
sus
Bur
eau
uses
a v
arie
ty o
f ap
pro
ache
s. In
form
atio
n o
n p
eop
le w
ho
rep
ort
ed m
ore
tha
n o
ne r
ace,
suc
h as
Whi
te a
nd A
mer
ican
Ind
ian
and
Ala
ska
Nat
ive
or
Asi
an a
nd B
lack
or
Afr
ican
Am
eric
an, i
s av
aila
ble
fro
m t
he 2
010
Cen
sus
thro
ugh
Am
eric
an F
actF
ind
er. A
bo
ut 2
.9 p
erce
nt o
f p
eop
le
rep
ort
ed m
ore
tha
n o
ne r
ace
in t
he 2
010
Cen
sus.
Dat
a fo
r A
mer
ican
Ind
ians
and
Ala
ska
Nat
ives
, Nat
ive
Haw
aiia
ns a
nd O
ther
Pac
ific
Isla
nder
s, a
nd t
hose
rep
ort
ing
tw
o o
r m
ore
rac
es a
re n
ot
sho
wn
sep
arat
ely.
No
te: D
etai
ls m
ay n
ot
sum
to
to
tals
bec
ause
of
roun
din
g.
So
urce
: U.S
. Cen
sus
Bur
eau,
Cur
rent
Po
pul
atio
n S
urve
y, 2
018
Ann
ual S
oci
al a
nd E
cono
mic
Sup
ple
men
t.

U.S. Census Bureau Income and Poverty in the United States: 2017 19
poverty threshold) averaged $10,819 in 2017, not statistically different than the inflation-adjusted income deficit for fami-lies in poverty in 2016. The aver-age income deficit was larger for families with a female householder ($11,460) than for married-couple families ($10,309) (Table 6).
The average per capita income deficit was also larger for fami-lies with a female householder ($3,391) than for married-couple families ($2,817).49 For unrelated individuals, the average income deficit for those in poverty was
49 The income deficit per capita is computed by dividing the average deficit by the average number of people in that type of family. Since families with a female householder were smaller on average than married-couple families, the larger per cap-ita deficit for female-householder families reflects their smaller average family size as well as their lower average family income.
$7,327 in 2017. The $7,013 deficit for unrelated women was lower than the $7,744 deficit for unre-lated men.
Shared Households
Shared households are defined as households that include at least one “additional” adult, a person aged 18 or older, who is not the householder, spouse, or cohabit-ing partner of the householder.50 Adults aged 18 to 24 who are enrolled in school are not counted as additional adults.
In 2018, the number and per-centage of shared households remained higher than in 2007, the year before the most recent
50 For more detailed information on shared households, see <www2.census .gov/programs-surveys/demo/tables /p60/263/SharedHoushold2017.xlsx>.
recession.51 In 2007, 17.0 percent of all households were shared households, totaling 19.7 million shared households. In 2018, 19.5 percent of all households were shared households, totaling 24.9 million shared households. The number and percentage of shared households in 2018 were not sta-tistically different from 2017.
In 2018, an estimated 28.1 percent (12.6 million) of adults aged 25 to 34 were additional adults in someone else’s household, neither of which was statistically different from 2017. Of young adults aged 25 to 34, 16.8 percent lived with their parents in 2018, not statisti-cally different from 2017. However, the number of these young adults residing with their parents increased by 430,000 individu-als between 2017 and 2018, to 7.5 million.
It is difficult to assess the precise impact of household sharing on overall poverty rates. Adults aged 25 to 34 living with their parents in 2018 had an official 2017 pov-erty rate of 6.2 percent (when the entire family’s income is compared with the threshold that includes the young adult as a member of the family). However, if pov-erty status had been determined using only the young adult’s own income, 35.4 percent of those aged 25 to 34 would have been below the poverty threshold for a single person under the age of 65. However, although 6.1 percent
51 While poverty estimates are based on income in the previous calendar year, estimates of living arrangements, includ-ing shared households, reflect household composition at the time of the survey. The CPS ASEC is collected during the months of February, March, and April each year.
Figure 7.Demographic Makeup of the Population at Varying Degrees of Poverty: 2017
Below 50%
From 50% to 99%
From 100% to 199%
200% and above
Population withincome-to-poverty
ratios
Total
(In percent)
22.7 61.4 15.8
64.5 15.7
19.1
14.3
8.9
53.0
52.9
59.5
19.8
27.9
32.8
31.6
People underage 18
People aged 18 to 64
People aged 65 and older
Note: For information on confidentiality protection, sampling error, nonsampling error, and definitions, see <www2.census.gov/programs-surveys/cps/techdocs/cpsmar18.pdf>.Source: U.S. Census Bureau, Current Population Survey, 2018 Annual Social and Economic Supplement.

20 Income and Poverty in the United States: 2017 U.S. Census Bureau
Tab
le 6
.In
com
e D
efici
t o
r Su
rplu
s o
f Fa
mili
es a
nd U
nrel
ated
Ind
ivid
uals
by
Pov
erty
Sta
tus:
20
17(N
umb
ers
of
fam
ilies
and
unr
elat
ed in
div
idua
ls in
tho
usan
ds,
defi
cits
and
sur
plu
ses
and
the
ir m
arg
in o
f er
ror
in 2
017
do
llars
. Fo
r in
form
atio
n o
n co
nfid
enti
alit
y p
rote
ctio
n, s
amp
ling
er
ror,
nons
amp
ling
err
or,
and
defi
niti
ons
, see
ww
w2.
cens
us.g
ov/p
rog
ram
s-su
rvey
s/cp
s/te
chd
ocs
/cp
smar
18.p
df )
Cha
ract
eris
tic
Tota
l
Siz
e o
f d
efici
t o
r su
rplu
sA
vera
ge
defi
cit
or
surp
lus
(do
llars
)
Defi
cit
or
surp
lus
per
cap
ita
(do
llars
)
Und
er$
1,00
0
$1,0
00
to
$
2,4
99
$2,
500
to
$
4,9
99
$5,
00
0
to
$7,
49
9
$7,
500
to
$
9,9
99
$10
,00
0
to
$12
,49
9
$12
,50
0
to
$14
,99
9
$15
,00
0
or
mo
reE
stim
ate
Mar
gin
o
f er
ror1
(±)
Est
imat
e
Mar
gin
o
f er
ror1
(±)
Bel
ow P
over
ty T
hres
hold
, Defi
cit
All
fam
ilies
....
....
....
....
....
....
....
...
7,75
838
074
11,
146
952
785
626
828
2,30
110
,819
197
3,13
560
M
arri
ed-c
oup
le f
amili
es .
....
....
....
....
3,00
518
130
848
336
829
524
239
873
010
,309
382
2,81
711
1
Fam
ilies
wit
h a
fem
ale
hous
eho
lder
, no
husb
and
pre
sent
....
....
....
....
....
...
3,95
915
734
750
647
141
933
436
41,
363
11,4
6026
83,
391
88
Fam
ilies
wit
h a
mal
e ho
useh
old
er, n
o
w
ife
pre
sent
...
....
....
....
....
....
...
793
4286
157
113
7050
6720
99,
545
685
3,17
123
3U
nrel
ated
ind
ivid
uals
...
....
....
....
....
..12
,593
1,14
71,
445
2,67
91,
134
1,09
01,
545
3,55
3Z
7,32
712
67,
327
126
Ab
ove
Pov
erty
Thr
esho
ld, S
urp
lus
All
fam
ilies
....
....
....
....
....
....
....
...
75,3
4661
976
71,
471
1,67
31,
642
1,66
51,
606
65,9
0189
,256
1,05
428
,747
352
M
arri
ed-c
oup
le f
amili
es .
....
....
....
....
58,2
4929
738
573
489
693
394
998
253
,072
100,
419
1,24
231
,957
401
F
amili
es w
ith
a fe
mal
e ho
useh
old
er, n
o
hu
sban
d p
rese
nt ..
....
....
....
....
....
.11
,466
239
303
600
562
511
573
453
8,22
546
,628
1,59
515
,443
542
F
amili
es w
ith
a m
ale
hous
eho
lder
, no
wif
e p
rese
nt .
....
....
....
....
....
....
.5,
630
8379
137
215
199
143
171
4,60
460
,581
2,80
320
,944
1,05
3U
nrel
ated
ind
ivid
uals
...
....
....
....
....
..48
,193
1,14
41,
921
2,58
13,
147
2,27
02,
629
1,90
132
,602
41,5
9398
541
,593
985
Z R
epre
sent
s o
r ro
und
s to
zer
o.
1 A m
arg
in o
f er
ror
is a
mea
sure
of
an e
stim
ate’
s va
riab
ility
. The
larg
er t
he m
arg
in o
f er
ror
in r
elat
ion
to t
he s
ize
of
the
esti
mat
e, t
he le
ss r
elia
ble
the
est
imat
e. T
his
num
ber
, whe
n ad
ded
to
and
su
btr
acte
d f
rom
the
est
imat
e, f
orm
s th
e 9
0 p
erce
nt c
onfi
den
ce in
terv
al. M
arg
ins
of
erro
r sh
own
in t
his
tab
le a
re b
ased
on
stan
dar
d e
rro
rs c
alcu
late
d u
sing
rep
licat
e w
eig
hts.
Fo
r m
ore
info
rmat
ion,
se
e “S
tand
ard
Err
ors
and
The
ir U
se”
at <
ww
w2.
cens
us.g
ov/l
ibra
ry/p
ublic
atio
ns/2
018
/dem
o/p
60
-26
3sa.
pd
f>.
No
te: D
etai
ls m
ay n
ot
sum
to
to
tals
bec
ause
of
roun
din
g.
So
urce
: U.S
. Cen
sus
Bur
eau,
Cur
rent
Po
pul
atio
n S
urve
y, 2
018
Ann
ual S
oci
al a
nd E
cono
mic
Sup
ple
men
t.

U.S. Census Bureau Income and Poverty in the United States: 2017 21
of families including at least one adult child (aged 25 to 34) of the householder were in poverty in 2017, the poverty rate for these families would have increased to 12.5 percent if the young adult were not living in—and contributing to—the household.52
ADDITIONAL INFORMATION ON INCOME AND POVERTY
State and Local Estimates of Income and Poverty
Since the CPS ASEC produces more complete and thorough esti-mates of income and poverty, the Census Bureau recommends that people use it as the data source for national estimates. However, the Census Bureau also reports income and poverty estimates based on data from the American Community Survey (ACS) and the Small Area Income and Poverty Estimates (SAIPE) program.
The ACS is part of the decennial census program and eliminates the need for a long-form census questionnaire. The ACS offers broad, comprehensive information on social, economic, and housing topics and provides this informa-tion at many levels of geography.
The Census Bureau presents annual estimates of median household income and poverty by state and other smaller geo-graphic units based on data collected in the ACS. Single-year estimates from the ACS are avail-able for geographic units with populations of 65,000 or more. Estimates of income and poverty for all geographic units, including census tracts and block groups, are available by pooling 5 years
52 The poverty rate for adults aged 25 to 34 living with their parents was not statistically different from the poverty rate for families that included at least one adult child (aged 25 to 34) of the householder.
of ACS data. Income and poverty estimates from the ACS are available at <www.census.gov /programs-surveys/acs/>.
Using statistical models, SAIPE produces estimates of median household income and poverty for states and all counties, as well as population and poverty esti-mates for school districts. The SAIPE approach combines data from a variety of sources, includ-ing administrative records, popu-lation estimates, the decennial census, and the ACS, to provide consistent and reliable single-year estimates. In general, SAIPE esti-mates have lower variances than ACS estimates but are released later because they incorporate ACS data in the models. The 2016 income and poverty estimates from this program are available at <www.census.gov/programs -surveys/saipe.html>. Estimates for 2017 will be available later this year.
Longitudinal Estimates
The CPS ASEC provides reliable estimates of the net change, from one year to the next, in the overall distribution of economic charac-teristics such as income and earn-ings. It does not, however, show how these characteristics change for the same person, family, or household. Longitudinal measures of income and poverty based on following the same people over time are available from the Survey of Income and Program Participation (SIPP).
SIPP provides monthly data about labor force participation and income sources and amounts for individuals, families, and house-holds. The data yield insights into the dynamic nature of these expe-riences and the economic mobility
of U.S. residents. For example, the data demonstrate that using a longer time frame to measure poverty (e.g., 4 years) yields, on average, a lower poverty rate than the annual measures presented in this report, while using a shorter time frame (e.g., 2 months) yields higher poverty rates. Some other specific findings include:
• Households with householders who had lower levels of educa-tion were more likely to remain in, or move into, a lower income quintile than households where householders had higher levels of education.
• During the 4-year period from 2009 to 2012, 34.5 percent of the population had at least one spell of poverty lasting 2 or more months.
• Chronic poverty over the 4-year period from 2009 to 2012 was relatively uncommon, with 2.7 percent of the population living in poverty all 48 months.
More information based on these data is available in the Census Bureau’s P70 Series Reports, as well as in table packages and working papers. For more infor-mation, see <www.census.gov /programs-surveys/sipp/library /publications.html>.
The Supplemental Poverty Measure
The income and poverty estimates shown in this report are based solely on money income before taxes and do not include the value of noncash benefits, such as those provided by the Supplemental Nutrition Assistance Program (SNAP), Medicare, Medicaid, pub-lic housing, or employer-provided fringe benefits.

22 Income and Poverty in the United States: 2017 U.S. Census Bureau
Since the publication of the first U.S. poverty estimates, there has been a continuing debate about the best approach to measur-ing income and poverty in the United States. Recognizing that alternative estimates of income and poverty can provide useful information to the public as well as to the federal government, in 2010, an interagency technical working group (which included representatives from the Bureau of Labor Statistics [BLS], the Census Bureau, the Economics and Statistics Administration, the Council of Economic Advisers, the U.S. Department of Health and Human Services, and the Office of Management and Budget) issued a series of suggestions to the Census Bureau and BLS on how to develop the Supplemental Poverty Measure (SPM). Their suggestions drew on the recommendations of a 1995 National Academy of Sciences report and the sub-sequent extensive research on poverty measurement. For more information, see <www.census.gov /library/visualizations/2017/demo /poverty_measure-how.html>.
Based on these suggestions, the SPM serves as an additional indicator of economic well-being and provides a deeper under-standing of economic conditions and policy effects. SPM estimates incorporate deductions such as tax payments, work expenses, and medical costs in its resource estimates as well as additions to reflect noncash resource trans-fers such as housing subsidies and food assistance programs. Thresholds used in the SPM are produced by the BLS and derived from Consumer Expenditure Survey data on spending for basic
necessities (food, clothing, shel-ter, and utilities) and are adjusted for geographic differences in the cost of housing.53 The SPM is not intended to assess eligibility for government programs.
The Census Bureau began pub-lishing annual poverty estimates using this new approach in November 2011. SPM estimates for 2017 will be released in a sepa-rate report, “The Supplemental Poverty Measure: 2017,” Current Population Reports, P60-265, U.S. Census Bureau, September 2018 at <www2.census.gov /library/publications/2018 /demo/p60-265.pdf>.
SOURCE AND ACCURACY OF THE ESTIMATES
The CPS is the longest-running survey conducted by the Census Bureau. The CPS is a household survey primarily used to collect employment data. The sample uni-verse for the basic CPS consists of the resident civilian noninstitution-alized population of the United States. People in institutions, such as prisons, long-term care hospi-tals, and nursing homes, are not eligible to be interviewed in the CPS. Students living in dormito-ries are included in the estimates only if information about them is reported in an interview at their parents’ home. Since the CPS is a household survey, people who are homeless and not living in shelters are not included in the sample.
The CPS ASEC collects data in February, March, and April each year, asking detailed questions categorizing income into over 50
53 Thresholds for the SPM are produced by the BLS Division of Price and Index Number Research <www.bls.gov/pir /spmhome.htm>.
sources. The key purpose of the CPS ASEC is to provide timely and comprehensive estimates of income and poverty and to measure change in these national-level estimates. The CPS ASEC is the official source of national poverty estimates calculated in accordance with the Office of Management and Budget’s Statistical Policy Directive 14 (Appendix B). The Census Bureau introduced redesigned questions for income and health insurance coverage in the 2014 CPS ASEC. For more details, see text box “Redesigned CPS ASEC.”
The CPS ASEC collects data in the 50 states and the District of Columbia; these data do not represent residents of Puerto Rico or U.S. Island Areas.54 The 2018 CPS ASEC sample consists of about 92,000 addresses, slightly larger than that of the CPS since it includes military personnel who live in a household with at least one other civilian adult, regard-less of whether they live off post or on post. All other armed forces personnel are excluded. The estimates in this report are con-trolled to March 2018 independent national population estimates by age, sex, race, and Hispanic origin. Beginning with 2010, popula-tion estimates are based on 2010 Census population counts and are updated annually taking into account births, deaths, emigra-tion, and immigration. For further documentation about the CPS ASEC, see <www2.census.gov /programs-surveys/cps/techdocs /cpsmar18.pdf>.
54 U.S. Island Areas include American Samoa, Guam, the Commonwealth of the Northern Mariana Islands, and the Virgin Islands of the United States.

U.S. Census Bureau Income and Poverty in the United States: 2017 23
The estimates in this report (which may be shown in text, figures, and tables) are based on responses from a sample of the population and may differ from actual values because of sampling variabil-ity or other factors. As a result, apparent differences between the estimates for two or more groups may not be statistically significant. All comparative statements have undergone statistical testing and are significant at the 90 percent confidence level unless otherwise noted. In this report, the variances of estimates were calculated using both the Successive Difference Replication (SDR) method and the Generalized Variance Function (GVF) approach. See Appendix C for a more extensive discussion of these methods. Further informa-tion about the source and accu-racy of the estimates is available at <www2.census.gov/library /publications/2018/demo /p60-263sa.pdf>.
Redesigned CPS ASEC
The 2014 CPS ASEC included redesigned questions for income and health insurance coverage. All of the approximately 98,000 sam-pled addresses received historically consistent questions on earn-ings from jobs and were eligible to respond to the redesigned set of health insurance coverage questions. The redesigned income ques-tions were implemented to a subsample of these 98,000 addresses using a probability split panel design. Approximately 68,000 addresses were eligible to receive a set of income questions similar to those used in the 2013 CPS ASEC and prior years. The remaining 30,000 addresses were eligible to receive the redesigned income questions, which have been used since.
Since earnings questions remained consistent and total poverty estimates showed no statistical difference across the split panel design, we continue to make historical comparisons of earnings and poverty rates prior to reference year 2013. However, since there was a statistically-significant increase in income with the redesigned questions, historical comparisons of income prior to reference year 2013 should be made with caution. For more details see, “Description of the Split Panel Test of the Current Population Survey Annual Social and Economic Supplement (CPS ASEC) Income Redesign and Time Series Guidance” at <www.census.gov/content/dam/Census/library/publications /2014/demo/p60-249description.pdf>.


U.S. Census Bureau Income and Poverty in the United States: 2017 25
APPENDIX A. ESTIMATES OF INCOME
How Income Is Measured
For each person 15 years and older in the sample, the Annual Social and Economic Supplement (ASEC) asks questions on the amount of money income received in the preceding calendar year from each of the fol-lowing sources:
1. Earnings
2. Unemployment compensation
3. Workers’ compensation
4. Social security
5. Supplemental security income
6. Public assistance
7. Veterans’ payments
8. Survivor benefits
9. Disability benefits
10. Pension or retirement income
11. Interest
12. Dividends
13. Rents, royalties, and estates and trusts
14. Educational assistance
15. Alimony
16. Child support
17. Financial assistance from outside of the household
18. Other income
It should be noted that although the income statistics refer to receipts during the preceding calendar year, the demographic characteristics, such as age, labor force status, and household composition, are as of the survey date. The income of the household does not include amounts received by people who were mem-bers during all or part of the previ-ous year if these people no longer resided in the household at the time
of the interview. The ASEC collects income data for people who are cur-rent residents but did not reside in the household during the previous year.
Data on income collected in the ASEC by the Census Bureau cover money income received (exclusive of certain money receipts such as capital gains) before payments for personal income taxes, social secu-rity, union dues, Medicare deduc-tions, etc. Therefore, money income does not reflect the fact that some families receive noncash benefits, such as Supplemental Nutrition Assistance/food stamps, health benefits, and subsidized housing. In addition, money income does not reflect the fact that noncash benefits often take the form of the use of business transportation and facilities, full or partial payments by business for retirement programs, medi-cal and educational expenses, etc.
Data users should consider these elements when comparing income levels. Moreover, readers should be aware that for many different rea-sons there is a tendency in house-hold surveys for respondents to underreport their income. Based on an analysis of independently derived income estimates, the Census Bureau determined that respondents report income earned from wages or salaries more accurately than other sources of income, and that the reported wage and salary income is nearly equal to independent esti-mates of aggregate income.
Business Cycles
Business cycle peaks and troughs used to delineate the beginning and end of recessions, as shown in the text box above, are determined by the National Bureau of Economic Research, a private research orga-nization. The data points in the time
Business Cycles
Peak month Year Trough month Year
November 1948 October 1949
July 1953 May 1954
August 1957 April 1958
April 1960 February 1961
December 1969 November 1970
November 1973 March 1975
January 1980 July 1980
July 1981 November 1982
July 1990 March 1991
March 2001 November 2001
December 2007 June 2009
Source: National Bureau of Economic Research, Cambridge, MA 02138, <www.nber.org/cycles.html>.

26 Income and Poverty in the United States: 2017 U.S. Census Bureau
Annual Average Consumer Price Index Research Series (CPI-U-RS) Using Current Methods All Items: 1947 to 2017
YearCPI-U-RS1 index
(December 1977 = 100)Year
CPI-U-RS1 index(December 1977 = 100)
1947� � � � � � � � � � � 37�5 1983� � � � � � � � � � � 153�81948� � � � � � � � � � � 40�5 1984� � � � � � � � � � � 160�21949� � � � � � � � � � � 40�0 1985� � � � � � � � � � � 165�71950� � � � � � � � � � � 40�5 1986� � � � � � � � � � � 168�61951� � � � � � � � � � � 43�7 1987� � � � � � � � � � � 174�41952� � � � � � � � � � � 44�5 1988� � � � � � � � � � � 180�71953� � � � � � � � � � � 44�8 1989� � � � � � � � � � � 188�61954� � � � � � � � � � � 45�2 1990� � � � � � � � � � � 197�91955� � � � � � � � � � � 45�0 1991� � � � � � � � � � � 205�11956� � � � � � � � � � � 45�7 1992� � � � � � � � � � � 210�21957� � � � � � � � � � � 47�2 1993� � � � � � � � � � � 215�51958� � � � � � � � � � � 48�5 1994� � � � � � � � � � � 220�01959� � � � � � � � � � � 48�9 1995� � � � � � � � � � � 225�31960� � � � � � � � � � � 49�7 1996� � � � � � � � � � � 231�31961� � � � � � � � � � � 50�2 1997� � � � � � � � � � � 236�31962� � � � � � � � � � � 50�7 1998� � � � � � � � � � � 239�51963� � � � � � � � � � � 51�4 1999� � � � � � � � � � � 244�61964� � � � � � � � � � � 52�1 2000� � � � � � � � � � � 252�91965� � � � � � � � � � � 52�9 2001� � � � � � � � � � � 260�11966� � � � � � � � � � � 54�4 2002� � � � � � � � � � � 264�21967� � � � � � � � � � � 56�1 2003� � � � � � � � � � � 270�21968� � � � � � � � � � � 58�3 2004� � � � � � � � � � � 277�51969� � � � � � � � � � � 60�9 2005� � � � � � � � � � � 286�91970� � � � � � � � � � � 63�9 2006� � � � � � � � � � � 296�21971� � � � � � � � � � � 66�7 2007� � � � � � � � � � � 304�61972� � � � � � � � � � � 68�7 2008� � � � � � � � � � � 316�31973� � � � � � � � � � � 73�0 2009� � � � � � � � � � � 315�21974� � � � � � � � � � � 80�3 2010� � � � � � � � � � � 320�41975� � � � � � � � � � � 86�9 2011� � � � � � � � � � � 330�51976� � � � � � � � � � � 91�9 2012� � � � � � � � � � � 337�51977� � � � � � � � � � � 97�7 2013� � � � � � � � � � � 342�51978� � � � � � � � � � � 104�4 2014� � � � � � � � � � � 348�31979� � � � � � � � � � � 114�3 2015� � � � � � � � � � � 348�91980� � � � � � � � � � � 127�1 2016� � � � � � � � � � � 353�41981� � � � � � � � � � � 139�1 2017� � � � � � � � � � � 361�01982� � � � � � � � � � � 147�5
1 The Census Bureau uses the Bureau of Labor Statistics’ (BLS) Consumer Price Index Research Series (CPI-U-RS) for 1977 through 2017. The Census Bureau derived the CPI-U-RS for years before 1977 by applying the 1977 CPI-U-RS-to-CPI-U ratio to the 1947 to 1976 CPI-U. Based on revised estimates provided by BLS in 2018.
Note: Data users can compute the percentage changes in prices between earlier years’ data and 2017 data by dividing the annual average CPI-U-RS for 2017 by the annual average for the earlier year(s).
For more information on the CPI-U-RS, see <www.bls.gov/cpi/research-series /home.htm>.
series charts in this report use July as a reference.
Cost-of-Living Adjustment
In order to accurately assess changes in income and earnings over time, an adjustment for changes in the cost of living is required. The Census Bureau uses the research series of the Consumer Price Index (CPI-U-RS), provided by the U.S. Bureau of Labor Statistics for 1977 through 2017, to adjust for changes in the cost of living. The index used to make the constant dollar conversions is shown in the text box “Annual Average Consumer Price Index Research Series (CPI-U-RS) Using Current Methods All Items: 1947 to 2017.”
Poverty Threshold Adjustment
The Office of Management and Budget’s (OMB) Statistical Policy Directive 14 directed the Census Bureau to use the CPI-U to update the poverty thresholds each year for changes in the cost of living. These thresholds are compared to current year (unadjusted for inflation) money income. If, alternatively, the CPI-U-RS index had been used to infla-tion-adjust poverty thresholds from previous years, current poverty rates would be lower. This is because the CPI-U-RS results in a smaller cost of living adjustment over time than the CPI-U.

U.S. Census Bureau Income and Poverty in the United States: 2017 27
Tab
le A
-1.
Ho
useh
old
s by
To
tal M
one
y In
com
e, R
ace,
and
His
pan
ic O
rig
in o
f H
ous
eho
lder
: 19
67 t
o 2
017
—C
on.
(Inco
me
in 2
017 C
PI-U
-RS
adju
sted
dol
lars
. Hou
seho
lds
as o
f M
arch
of th
e fo
llow
ing y
ear.
Begin
ning
with
2010, s
tand
ard e
rror
s w
ere
calc
ulat
ed u
sing
rep
licat
e w
eight
s. B
efor
e 2010, s
tand
ard e
rror
s w
ere
calc
ulat
ed
usin
g t
he g
ener
aliz
ed v
aria
nce
func
tion
. For
info
rmat
ion
on c
onfiden
tial
ity
pro
tect
ion,
sam
plin
g e
rror
, non
sam
plin
g e
rror
, and
def
initio
ns, s
ee w
ww
2.c
ensu
s.go
v/pr
ogra
ms-
surv
eys/
cps/
tech
docs
/cps
mar
18.p
df )
Rac
e an
d H
isp
anic
o
rig
in o
f ho
use-
hold
er a
nd y
ear
Num
ber
(t
hou-
sand
s)
Per
cent
age
dis
trib
utio
nM
edia
n in
com
e (d
olla
rs)
Mea
n in
com
e (d
olla
rs)
Tota
lU
nder
$1
5,00
0
$15,
000
to
$2
4,99
9
$25,
000
to
$3
4,99
9
$35,
000
to
$4
9,99
9
$50,
000
to
$7
4,99
9
$75,
000
to
$9
9,99
9
$100
,000
to
$1
49,9
99
$150
,000
to
$1
99,9
99$2
00,0
00
and
ove
rE
stim
ate
Sta
ndar
d
erro
r E
stim
ate
Sta
ndar
d
erro
r
ALL
RA
CE
S20
17 .
....
....
....
.12
7,58
610
0.0
10.7
9.6
9.2
12.3
16.5
12.5
14.5
7.0
7.7
61,3
7233
586
,220
520
2016
...
....
....
...
126,
224
100.
011
.09.
59.
312
.616
.912
.214
.46.
87.
260
,309
445
84,9
3147
920
15 .
....
....
....
.12
5,81
910
0.0
11.2
10.4
9.6
12.6
16.5
12.2
14.4
6.7
6.5
58,4
7633
282
,012
417
2014
...
....
....
...
124,
587
100.
012
.210
.89.
713
.017
.011
.613
.76.
06.
155
,613
406
78,5
0046
220
131 .
....
....
....
123,
931
100.
012
.010
.89.
812
.417
.212
.013
.36.
36.
156
,479
689
79,2
5770
020
132 .
....
....
....
122,
952
100.
011
.910
.810
.213
.217
.412
.113
.15.
85.
554
,744
291
76,5
6552
620
12 .
....
....
....
.12
2,45
910
0.0
12.0
11.0
10.5
13.0
17.5
11.9
13.2
5.7
5.3
54,5
6922
476
,237
450
2011
...
....
....
...
121,
084
100.
012
.210
.710
.713
.417
.112
.013
.15.
75.
254
,673
274
76,1
0740
220
103 .
....
....
....
119,
927
100.
012
.011
.010
.212
.917
.312
.013
.75.
75.
355
,520
366
75,9
3240
620
094 .
....
....
....
117,
538
100.
011
.010
.410
.413
.217
.712
.114
.05.
75.
457
,010
244
77,8
5327
820
08 .
....
....
....
.11
7,18
110
0.0
11.0
10.3
10.3
13.1
17.4
12.3
14.4
5.8
5.4
57,4
1215
678
,094
276
2007
...
....
....
...
116,
783
100.
010
.510
.49.
113
.417
.512
.414
.96.
25.
759
,534
166
80,1
2828
020
06 .
....
....
....
.11
6,01
110
0.0
10.5
9.9
9.4
13.8
17.6
12.4
14.3
6.2
5.8
58,7
4625
281
,134
313
2005
...
....
....
...
114,
384
100.
010
.610
.19.
812
.917
.813
.014
.35.
95.
658
,291
195
79,7
0430
120
045 .
....
....
....
113,
343
100.
010
.810
.210
.013
.117
.512
.814
.35.
95.
357
,674
255
78,6
6029
720
03 .
....
....
....
.11
2,00
010
0.0
10.9
10.2
9.8
13.0
17.6
12.4
14.9
5.7
5.6
57,8
7525
178
,916
289
2002
...
....
....
...
111,
278
100.
010
.510
.39.
813
.217
.412
.914
.95.
85.
357
,947
190
79,0
4829
720
01 .
....
....
....
.10
9,29
710
0.0
10.2
10.1
9.6
13.4
17.5
12.9
14.9
5.8
5.6
58,6
0917
980
,788
322
2000
6 .
....
....
....
108,
209
100.
09.
99.
69.
313
.517
.913
.114
.96.
15.
559
,938
188
81,5
5732
119
997 .
....
....
....
106,
434
100.
09.
89.
89.
513
.118
.113
.115
.05.
95.
760
,062
280
80,7
8541
919
98 .
....
....
....
.10
3,87
410
0.0
10.3
10.3
9.4
13.6
17.7
13.7
14.5
5.6
5.0
58,6
1234
778
,161
422
1997
...
....
....
...
102,
528
100.
010
.810
.79.
713
.518
.213
.313
.95.
34.
556
,533
261
75,9
1542
519
96 .
....
....
....
.10
1,01
810
0.0
11.2
11.0
9.9
14.0
18.0
13.4
13.5
5.0
4.0
55,3
9427
973
,547
412
1995
8 .
....
....
....
99,6
2710
0.0
11.2
11.2
10.2
13.9
18.7
13.1
13.3
4.6
3.9
54,6
0031
672
,005
394
1994
9 .
....
....
....
98,9
9010
0.0
12.2
11.3
10.3
13.9
18.5
12.5
13.0
4.5
3.8
52,9
4224
170
,777
381
1993
10 .
....
....
....
97,1
0710
0.0
12.5
11.0
10.5
14.0
18.7
12.8
12.7
4.5
3.4
52,3
3424
569
,399
375
1992
11 .
....
....
....
96,4
2610
0.0
12.5
11.1
10.5
13.9
18.9
13.3
12.6
4.2
3.0
52,6
1524
966
,704
280
1991
...
....
....
...
95,6
6910
0.0
12.3
10.8
9.8
14.8
19.2
13.2
12.8
4.3
2.9
53,0
2525
566
,747
275
1990
...
....
....
...
94,3
1210
0.0
11.8
10.4
9.8
14.4
19.9
13.3
13.0
4.2
3.2
54,6
2127
968
,229
288
1989
...
....
....
...
93,3
4710
0.0
11.4
10.5
9.8
14.0
19.2
13.9
13.2
4.5
3.4
55,3
2930
469
,903
304
1988
...
....
....
...
92,8
3010
0.0
12.3
10.2
10.1
13.8
19.5
13.7
13.2
4.2
3.1
54,3
9026
667
,959
304
1987
12 .
....
....
....
91,1
2410
0.0
12.4
10.5
9.8
14.1
19.5
13.6
13.1
4.0
2.9
53,9
4525
567
,087
275
1986
...
....
....
...
89,4
7910
0.0
12.8
10.2
10.4
14.0
19.6
13.7
12.6
4.0
2.7
53,3
0927
665
,860
268
1985
13 .
....
....
....
88,4
5810
0.0
12.8
11.0
10.7
14.3
20.1
13.3
12.2
3.4
2.3
51,4
5527
963
,324
251
1984
14 .
....
....
....
86,7
8910
0.0
12.8
11.4
10.7
14.8
20.1
13.2
11.6
3.3
2.1
50,5
1123
061
,888
228
1983
...
....
....
...
85,4
0710
0.0
13.4
11.4
10.8
15.5
20.1
13.2
10.8
3.0
1.9
49,0
2122
359
,621
223
1982
...
....
....
...
83,9
1810
0.0
13.6
11.3
11.0
15.2
20.7
12.8
10.8
2.9
1.8
49,3
6822
359
,495
220
1981
...
....
....
...
83,5
2710
0.0
13.1
11.4
11.5
14.8
20.6
13.7
10.8
2.7
1.5
49,5
0226
059
,138
215
1980
...
....
....
...
82,3
6810
0.0
13.0
11.0
11.1
14.8
21.5
13.5
10.9
2.7
1.6
50,3
0125
859
,825
219
1979
15 .
....
....
....
80,7
7610
0.0
12.4
10.7
10.7
14.6
21.1
14.6
11.1
3.0
1.8
51,9
9024
661
,758
234
1978
...
....
....
...
77,3
3010
0.0
12.3
11.1
10.6
14.4
21.4
14.3
11.4
2.8
1.7
52,0
8921
161
,308
235
1977
...
....
....
...
76,0
3010
0.0
12.7
11.5
10.7
15.0
21.7
14.0
10.3
2.4
1.6
50,1
4818
859
,489
181
1976
16 .
....
....
....
74,1
4210
0.0
12.7
11.6
10.7
15.2
22.3
13.9
9.9
2.3
1.4
49,8
3318
558
,616
181
1975
17 .
....
....
....
72,8
6710
0.0
13.2
11.9
10.7
15.7
22.1
13.4
9.5
2.1
1.3
49,0
2019
957
,241
179
1974
17, 1
8 ...
....
....
71,1
6310
0.0
12.6
11.0
10.4
16.1
22.2
14.0
9.9
2.3
1.4
50,3
3819
358
,866
184
1973
...
....
....
...
69,8
5910
0.0
12.5
11.2
9.8
15.0
22.4
14.2
10.6
2.5
1.7
51,9
8419
860
,119
183
1972
19 .
....
....
....
68,2
5110
0.0
13.1
10.6
10.3
15.3
22.8
14.0
9.9
2.4
1.5
50,9
5519
459
,305
184
1971
20 .
....
....
....
66,6
7610
0.0
13.9
10.7
10.7
16.3
23.4
13.3
8.6
2.0
1.2
48,8
6218
956
,196
179
1970
...
....
....
...
64,7
7810
0.0
13.9
10.4
10.5
16.2
24.3
13.0
8.8
1.8
1.3
49,3
4218
156
,500
181
1969
...
....
....
...
63,4
0110
0.0
13.8
10.4
9.7
16.9
24.4
13.3
8.5
1.8
1.2
49,7
2818
456
,574
178
1968
...
....
....
...
62,2
1410
0.0
14.1
10.8
10.5
17.8
24.6
12.6
7.1
1.5
1.0
47,9
4617
354
,243
173
1967
21 .
....
....
....
60,8
1310
0.0
15.4
10.4
11.4
17.9
24.3
11.6
6.5
1.5
1.1
45,9
6516
751
,409
167
See
fo
otn
ote
s at
end
of
tab
le.

28 Income and Poverty in the United States: 2017 U.S. Census Bureau
Tab
le A
-1.
Ho
useh
old
s by
To
tal M
one
y In
com
e, R
ace,
and
His
pan
ic O
rig
in o
f H
ous
eho
lder
: 19
67 t
o 2
017
—C
on.
(Inco
me
in 2
017 C
PI-U
-RS
adju
sted
dol
lars
. Hou
seho
lds
as o
f M
arch
of th
e fo
llow
ing y
ear.
Begin
ning
with
2010, s
tand
ard e
rror
s w
ere
calc
ulat
ed u
sing
rep
licat
e w
eight
s. B
efor
e 2010, s
tand
ard e
rror
s w
ere
calc
ulat
ed
usin
g t
he g
ener
aliz
ed v
aria
nce
func
tion
. For
info
rmat
ion
on c
onfiden
tial
ity
pro
tect
ion,
sam
plin
g e
rror
, non
sam
plin
g e
rror
, and
def
initio
ns, s
ee w
ww
2.c
ensu
s.go
v/pr
ogra
ms-
surv
eys/
cps/
tech
docs
/cps
mar
18.p
df )
Rac
e an
d H
isp
anic
o
rig
in o
f ho
use-
hold
er a
nd y
ear
Num
ber
(t
hou-
sand
s)
Per
cent
age
dis
trib
utio
nM
edia
n in
com
e (d
olla
rs)
Mea
n in
com
e (d
olla
rs)
Tota
lU
nder
$1
5,00
0
$15,
000
to
$2
4,99
9
$25,
000
to
$3
4,99
9
$35,
000
to
$4
9,99
9
$50,
000
to
$7
4,99
9
$75,
000
to
$9
9,99
9
$100
,000
to
$1
49,9
99
$150
,000
to
$1
99,9
99$2
00,0
00
and
ove
rE
stim
ate
Sta
ndar
d
erro
r E
stim
ate
Sta
ndar
d
erro
r
WH
ITE
ALO
NE
22
2017
...
....
....
...
100,
065
100.
09.
19.
29.
012
.116
.712
.915
.47.
58.
265
,273
416
89,6
3260
220
16 .
....
....
....
.99
,400
100.
09.
49.
09.
112
.717
.012
.715
.27.
27.
763
,188
341
88,2
0154
520
15 .
....
....
....
.99
,313
100.
09.
510
.09.
512
.616
.712
.715
.37.
06.
962
,194
394
85,0
7848
620
14 .
....
....
....
.98
,679
100.
010
.610
.49.
412
.917
.412
.114
.46.
46.
658
,939
368
81,7
6754
220
131 .
....
....
....
98,8
0710
0.0
10.4
10.4
9.6
12.2
17.5
12.7
13.8
6.8
6.5
59,8
1054
582
,029
799
2013
2 .
....
....
....
97,7
7410
0.0
10.3
10.4
9.9
13.1
17.8
12.8
13.8
6.1
5.8
58,2
4244
879
,935
573
2012
...
....
....
...
97,7
0510
0.0
10.2
10.6
10.3
13.0
17.8
12.5
13.9
6.0
5.7
57,4
4641
179
,598
496
2011
...
....
....
...
96,9
6410
0.0
10.4
10.1
10.5
13.5
17.5
12.4
13.8
6.2
5.6
57,0
3324
679
,531
461
2010
3 .
....
....
....
96,3
0610
0.0
10.1
10.7
9.9
12.9
17.6
12.5
14.5
6.0
5.7
58,2
6128
579
,334
456
2009
4 .
....
....
....
95,4
8910
0.0
9.4
10.1
10.1
13.1
18.1
12.6
14.7
6.1
5.8
59,3
9717
680
,794
312
2008
...
....
....
...
95,2
9710
0.0
9.5
10.0
10.0
12.9
17.7
12.8
15.2
6.2
5.8
59,7
0517
381
,252
313
2007
...
....
....
...
95,1
1210
0.0
9.0
10.0
8.9
13.3
17.6
12.8
15.7
6.5
6.1
61,7
6518
383
,354
318
2006
...
....
....
...
94,7
0510
0.0
9.0
9.5
9.2
13.7
17.9
12.9
15.1
6.5
6.2
61,7
5917
984
,226
351
2005
...
....
....
...
93,5
8810
0.0
9.1
9.6
9.7
12.9
18.0
13.5
14.9
6.2
6.0
61,0
9426
782
,999
344
2004
5 .
....
....
....
92,8
8010
0.0
9.3
10.0
9.8
12.9
17.8
13.2
15.1
6.2
5.7
60,6
9723
881
,838
337
2003
...
....
....
...
91,9
6210
0.0
9.4
9.9
9.6
13.1
17.7
12.8
15.7
6.0
6.0
60,9
6523
982
,283
330
2002
...
....
....
...
91,6
4510
0.0
9.1
9.9
9.5
12.8
17.7
13.4
15.7
6.1
5.7
61,6
0525
082
,210
335
WH
ITE
23
2001
...
....
....
...
90,6
8210
0.0
8.8
9.9
9.4
13.2
17.7
13.2
15.6
6.1
6.1
61,7
8629
083
,986
361
2000
6 .
....
....
....
90,0
3010
0.0
8.7
9.3
9.0
13.4
18.0
13.5
15.7
6.4
6.0
62,6
8827
784
,582
363
1999
7 .
....
....
....
88,8
9310
0.0
8.3
9.5
9.4
13.0
18.4
13.5
15.8
6.1
6.0
62,4
6731
683
,721
474
1998
...
....
....
...
87,2
1210
0.0
8.7
9.8
9.2
13.5
18.0
14.2
15.2
6.0
5.4
61,6
6730
981
,707
481
1997
...
....
....
...
86,1
0610
0.0
9.3
10.3
9.5
13.4
18.4
13.8
14.7
5.7
4.9
59,5
3837
779
,292
483
1996
...
....
....
...
85,0
5910
0.0
9.6
10.6
9.7
14.0
18.4
13.9
14.2
5.3
4.4
57,9
9930
076
,467
453
1995
8 .
....
....
....
84,5
1110
0.0
9.6
10.7
10.0
13.8
19.1
13.6
14.0
4.9
4.2
57,3
0830
074
,874
434
1994
9 .
....
....
....
83,7
3710
0.0
10.4
10.8
10.2
13.9
19.1
13.0
13.7
4.9
4.1
55,8
3731
373
,897
430
1993
10 .
....
....
....
82,3
8710
0.0
10.5
10.5
10.2
14.0
19.3
13.5
13.4
4.8
3.8
55,2
1432
272
,510
419
1992
11 .
....
....
....
81,7
9510
0.0
10.5
10.6
10.3
14.0
19.4
14.0
13.4
4.5
3.3
55,3
1626
869
,717
311
1991
...
....
....
...
81,6
7510
0.0
10.3
10.5
9.6
14.9
19.7
13.8
13.6
4.6
3.2
55,5
6526
969
,565
303
1990
...
....
....
...
80,9
6810
0.0
9.9
10.0
9.7
14.4
20.4
13.9
13.7
4.5
3.5
56,9
7026
170
,981
317
1989
...
....
....
...
80,1
6310
0.0
9.6
10.1
9.6
14.0
19.6
14.6
13.9
4.9
3.6
58,2
0028
372
,814
337
1988
...
....
....
...
79,7
3410
0.0
10.4
9.5
9.9
13.8
20.2
14.3
14.0
4.5
3.4
57,4
9834
070
,857
334
1987
12 .
....
....
....
78,5
1910
0.0
10.5
9.9
9.7
14.1
20.2
14.3
13.9
4.3
3.1
56,8
3728
669
,954
302
1986
...
....
....
...
77,2
8410
0.0
11.0
9.7
10.2
14.0
20.2
14.4
13.3
4.3
2.9
56,0
4527
268
,603
293
1985
13 .
....
....
....
76,5
7610
0.0
11.1
10.4
10.4
14.4
20.7
13.9
12.9
3.7
2.6
54,2
6529
065
,923
277
1984
14 .
....
....
....
75,3
2810
0.0
11.1
10.7
10.5
14.8
20.8
13.9
12.3
3.5
2.4
53,2
8726
864
,441
250
1983
...
....
....
...
74,3
7610
0.0
11.5
10.7
10.6
15.7
20.8
13.8
11.5
3.2
2.1
51,4
0823
262
,095
242
1982
...
....
....
...
73,1
8210
0.0
11.9
10.7
10.8
15.4
21.3
13.4
11.5
3.1
1.9
51,6
8323
561
,948
242
1981
...
....
....
...
72,8
4510
0.0
11.3
10.8
11.2
14.9
21.3
14.4
11.5
2.9
1.7
52,3
0224
161
,617
234
1980
...
....
....
...
71,8
7210
0.0
11.3
10.4
10.8
14.8
22.2
14.2
11.6
3.0
1.7
53,0
6827
362
,239
239
1979
15 .
....
....
....
70,7
6610
0.0
10.9
10.0
10.4
14.6
21.7
15.3
11.8
3.2
2.0
54,5
1025
964
,194
256
1978
...
....
....
...
68,0
2810
0.0
10.8
10.6
10.3
14.4
21.9
15.0
12.0
3.0
1.9
54,1
5023
963
,580
256
1977
...
....
....
...
66,9
3410
0.0
11.3
10.8
10.4
15.0
22.4
14.8
11.0
2.7
1.7
52,7
3522
261
,813
200
1976
16 .
....
....
....
65,3
5310
0.0
11.3
10.9
10.4
15.2
22.9
14.6
10.6
2.5
1.5
52,2
0221
660
,871
196
1975
17 .
....
....
....
64,3
9210
0.0
11.8
11.3
10.5
15.7
22.8
14.1
10.2
2.2
1.4
51,2
6318
759
,355
195
1974
17, 1
8 ...
....
....
62,9
8410
0.0
11.3
10.4
10.0
16.0
23.0
14.7
10.6
2.5
1.5
52,6
4419
861
,046
198
1973
...
....
....
...
61,9
6510
0.0
11.2
10.5
9.4
14.9
23.1
15.0
11.3
2.7
1.9
54,4
8120
862
,443
198
1972
19 .
....
....
....
60,6
1810
0.0
11.8
9.9
9.8
15.2
23.6
14.7
10.6
2.6
1.7
53,4
5620
561
,612
200
1971
20 .
....
....
....
59,4
6310
0.0
12.6
10.1
10.3
16.2
24.2
14.0
9.2
2.1
1.3
51,1
0819
558
,231
189
1970
...
....
....
...
57,5
7510
0.0
12.7
9.7
10.0
16.1
25.1
13.6
9.3
2.0
1.4
51,3
9319
858
,477
192
1969
...
....
....
...
56,2
4810
0.0
12.6
9.6
9.2
16.8
25.4
14.1
9.1
1.9
1.3
51,8
9719
058
,673
196
1968
...
....
....
...
55,3
9410
0.0
12.9
9.9
10.0
18.0
25.6
13.3
7.6
1.6
1.1
49,9
2118
656
,193
186
1967
21 .
....
....
....
54,1
8810
0.0
14.1
9.7
10.9
18.1
25.3
12.2
6.9
1.6
1.2
47,9
3417
453
,288
180
See
fo
otn
ote
s at
end
of
tab
le.

U.S. Census Bureau Income and Poverty in the United States: 2017 29
Tab
le A
-1.
Ho
useh
old
s by
To
tal M
one
y In
com
e, R
ace,
and
His
pan
ic O
rig
in o
f H
ous
eho
lder
: 19
67 t
o 2
017
—C
on.
(Inco
me
in 2
017 C
PI-U
-RS
adju
sted
dol
lars
. Hou
seho
lds
as o
f M
arch
of th
e fo
llow
ing y
ear.
Begin
ning
with
2010, s
tand
ard e
rror
s w
ere
calc
ulat
ed u
sing
rep
licat
e w
eight
s. B
efor
e 2010, s
tand
ard e
rror
s w
ere
calc
ulat
ed
usin
g t
he g
ener
aliz
ed v
aria
nce
func
tion
. For
info
rmat
ion
on c
onfiden
tial
ity
pro
tect
ion,
sam
plin
g e
rror
, non
sam
plin
g e
rror
, and
def
initio
ns, s
ee w
ww
2.c
ensu
s.go
v/pr
ogra
ms-
surv
eys/
cps/
tech
docs
/cps
mar
18.p
df )
Rac
e an
d H
isp
anic
o
rig
in o
f ho
use-
hold
er a
nd y
ear
Num
ber
(t
hou-
sand
s)
Per
cent
age
dis
trib
utio
nM
edia
n in
com
e (d
olla
rs)
Mea
n in
com
e (d
olla
rs)
Tota
lU
nder
$1
5,00
0
$15,
000
to
$2
4,99
9
$25,
000
to
$3
4,99
9
$35,
000
to
$4
9,99
9
$50,
000
to
$7
4,99
9
$75,
000
to
$9
9,99
9
$100
,000
to
$1
49,9
99
$150
,000
to
$1
99,9
99$2
00,0
00
and
ove
rE
stim
ate
Sta
ndar
d
erro
r E
stim
ate
Sta
ndar
d
erro
r W
HIT
E A
LON
E,
NO
T H
ISPA
NIC
22
2017
...
....
....
...
84,6
8110
0.0
8.5
8.9
8.6
11.6
16.4
13.0
16.0
8.0
8.9
68,1
4563
893
,453
661
2016
...
....
....
...
84,3
8710
0.0
8.9
8.6
8.7
12.1
16.9
12.7
15.9
7.8
8.4
66,4
4052
191
,687
622
2015
...
....
....
...
84,4
4510
0.0
8.9
9.5
9.0
12.1
16.5
13.0
16.2
7.5
7.5
65,1
3356
188
,553
549
2014
...
....
....
...
84,2
2810
0.0
10.0
9.8
9.0
12.4
17.3
12.3
15.1
6.9
7.3
62,4
5338
185
,472
600
2013
1 .
....
....
....
84,4
3210
0.0
9.7
9.8
8.8
11.7
17.6
13.2
14.6
7.3
7.1
63,5
8856
285
,615
894
2013
2 .
....
....
....
83,6
4110
0.0
9.5
9.9
9.4
12.6
17.9
13.2
14.5
6.6
6.4
61,4
1764
583
,626
665
2012
...
....
....
...
83,7
9210
0.0
9.3
10.1
9.8
12.6
17.8
12.9
14.7
6.5
6.2
60,9
7938
483
,263
551
2011
...
....
....
...
83,5
7310
0.0
9.6
9.7
10.0
13.0
17.5
12.8
14.6
6.7
6.2
60,5
2635
883
,082
522
2010
3 .
....
....
....
83,3
1410
0.0
9.4
10.3
9.4
12.5
17.5
12.8
15.3
6.4
6.3
61,3
6150
382
,626
518
2009
4 .
....
....
....
83,1
5810
0.0
8.7
9.6
9.6
12.9
18.1
12.8
15.5
6.5
6.3
62,3
7432
083
,882
342
2008
...
....
....
...
82,8
8410
0.0
8.7
9.6
9.6
12.4
17.7
13.2
15.9
6.6
6.3
63,3
7825
784
,574
346
2007
...
....
....
...
82,7
6510
0.0
8.4
9.6
8.5
12.7
17.5
13.0
16.5
7.0
6.7
65,0
8929
386
,732
350
2006
...
....
....
...
82,6
7510
0.0
8.4
9.1
8.9
13.2
17.7
13.2
15.8
6.9
6.7
63,8
9222
987
,441
386
2005
...
....
....
...
82,0
0310
0.0
8.6
9.3
9.2
12.4
17.8
13.9
15.6
6.7
6.5
63,9
0021
686
,322
381
2004
5 .
....
....
....
81,6
2810
0.0
8.8
9.6
9.3
12.5
17.5
13.6
15.8
6.7
6.2
63,6
2729
184
,894
369
2003
...
....
....
...
81,1
4810
0.0
8.9
9.4
9.1
12.5
17.6
13.1
16.4
6.5
6.5
63,8
3230
985
,356
362
2002
...
....
....
...
81,1
6610
0.0
8.7
9.5
9.1
12.4
17.6
13.7
16.5
6.5
6.1
64,0
8425
184
,873
361
WH
ITE
, NO
T H
ISPA
NIC
23
2001
...
....
....
...
80,8
1810
0.0
8.5
9.4
9.1
12.8
17.6
13.4
16.3
6.4
6.5
64,2
6826
686
,668
393
2000
6 .
....
....
....
80,5
2710
0.0
8.3
8.9
8.7
13.0
17.8
13.8
16.3
6.8
6.4
65,1
2426
187
,155
391
1999
7 .
....
....
....
79,8
1910
0.0
7.9
9.1
9.1
12.6
18.2
13.8
16.4
6.5
6.5
65,1
7041
286
,466
512
1998
...
....
....
...
78,5
7710
0.0
8.1
9.3
8.8
13.2
18.0
14.6
15.9
6.4
5.8
63,9
6936
884
,323
515
1997
...
....
....
...
77,9
3610
0.0
8.6
9.9
9.1
13.1
18.4
14.2
15.4
6.0
5.2
61,9
9032
481
,832
(X)
1996
...
....
....
...
77,2
4010
0.0
9.0
10.0
9.3
13.8
18.4
14.3
14.9
5.6
4.6
60,5
3741
578
,780
(X)
1995
8 .
....
....
....
76,9
3210
0.0
8.7
10.1
9.7
13.6
19.4
14.1
14.7
5.2
4.5
59,5
7131
177
,316
463
1994
9 .
....
....
....
77,0
0410
0.0
9.7
10.4
10.0
13.7
19.2
13.4
14.3
5.1
4.3
57,6
3930
575
,779
450
1993
10 .
....
....
....
75,6
9710
0.0
10.0
10.1
9.9
13.8
19.4
13.9
13.9
5.0
4.0
57,2
4633
574
,421
444
1992
11 .
....
....
....
75,1
0710
0.0
9.9
10.2
10.1
13.7
19.6
14.3
14.0
4.7
3.5
57,1
7335
471
,487
330
1991
...
....
....
...
75,6
2510
0.0
9.8
10.1
9.4
14.7
19.8
14.0
14.1
4.8
3.3
56,8
9228
071
,058
317
1990
...
....
....
...
75,0
3510
0.0
9.4
9.6
9.5
14.3
20.5
14.1
14.2
4.7
3.6
58,2
7327
272
,554
328
1989
...
....
....
...
74,4
9510
0.0
9.1
9.8
9.4
13.9
19.7
14.9
14.3
5.1
3.8
59,4
5229
174
,273
364
1988
...
....
....
...
74,0
6710
0.0
9.8
9.3
9.7
13.6
20.3
14.6
14.6
4.7
3.6
59,0
8334
872
,304
340
1987
12 .
....
....
....
73,1
2010
0.0
10.0
9.5
9.5
13.9
20.4
14.6
14.4
4.5
3.3
58,4
0032
571
,322
331
1986
...
....
....
...
72,0
6710
0.0
10.5
9.4
10.0
13.9
20.3
14.7
13.7
4.5
3.1
57,3
1929
569
,965
321
1985
13 .
....
....
....
71,5
4010
0.0
10.7
10.0
10.3
14.3
20.8
14.2
13.3
3.8
2.7
55,4
8628
367
,207
305
1984
14 .
....
....
....
70,5
8610
0.0
10.6
10.4
10.3
14.8
20.9
14.2
12.7
3.7
2.5
54,3
9330
265
,561
293
1983
...
....
....
...
69,6
4810
0.0
11.0
10.5
10.5
15.7
20.9
14.1
11.8
3.3
2.2
52,7
3026
563
,727
272
1982
...
....
....
...
69,2
1410
0.0
11.5
10.4
10.6
15.3
21.4
13.6
11.8
3.3
2.0
52,5
4926
462
,858
269
1981
...
....
....
...
68,9
9610
0.0
11.1
10.6
11.0
14.7
21.4
14.6
11.8
3.0
1.8
53,0
5727
062
,393
260
1980
...
....
....
...
68,1
0610
0.0
11.0
10.1
10.6
14.7
22.3
14.5
11.9
3.1
1.8
54,0
0830
763
,057
284
1979
15 .
....
....
....
67,2
0310
0.0
10.7
9.8
10.2
14.5
21.7
15.5
12.1
3.3
2.1
55,2
7830
664
,936
284
1978
...
....
....
...
64,8
3610
0.0
10.6
10.4
10.2
14.2
22.0
15.2
12.3
3.1
2.0
55,1
7029
064
,330
277
1977
...
....
....
...
63,7
2110
0.0
11.1
10.6
10.2
14.8
22.5
15.0
11.3
2.7
1.8
53,7
8130
362
,578
296
1976
16 .
....
....
....
62,3
6510
0.0
11.1
10.7
10.3
15.1
23.0
14.9
10.9
2.6
1.6
53,2
6631
061
,653
275
1975
17 .
....
....
....
61,5
3310
0.0
11.5
11.1
10.3
15.5
22.9
14.4
10.5
2.3
1.5
51,6
4927
460
,082
291
1974
17, 1
8 ...
....
....
60,1
6410
0.0
11.1
10.1
9.9
15.9
23.1
14.9
10.9
2.6
1.6
53,0
9426
161
,734
270
1973
...
....
....
...
59,2
3610
0.0
11.1
10.4
9.2
14.7
23.1
15.2
11.6
2.8
1.9
54,9
6125
763
,140
267
1972
19 .
....
....
....
58,0
0510
0.0
11.8
9.6
9.6
15.0
23.7
15.0
10.9
2.7
1.7
54,2
1825
762
,326
279
See
fo
otn
ote
s at
end
of
tab
le.

30 Income and Poverty in the United States: 2017 U.S. Census Bureau
Tab
le A
-1.
Ho
useh
old
s by
To
tal M
one
y In
com
e, R
ace,
and
His
pan
ic O
rig
in o
f H
ous
eho
lder
: 19
67 t
o 2
017
—C
on.
(Inco
me
in 2
017 C
PI-U
-RS
adju
sted
dol
lars
. Hou
seho
lds
as o
f M
arch
of th
e fo
llow
ing y
ear.
Begin
ning
with
2010, s
tand
ard e
rror
s w
ere
calc
ulat
ed u
sing
rep
licat
e w
eight
s. B
efor
e 2010, s
tand
ard e
rror
s w
ere
calc
ulat
ed
usin
g t
he g
ener
aliz
ed v
aria
nce
func
tion
. For
info
rmat
ion
on c
onfiden
tial
ity
pro
tect
ion,
sam
plin
g e
rror
, non
sam
plin
g e
rror
, and
def
initio
ns, s
ee w
ww
2.c
ensu
s.go
v/pr
ogra
ms-
surv
eys/
cps/
tech
docs
/cps
mar
18.p
df )
Rac
e an
d H
isp
anic
o
rig
in o
f ho
use-
hold
er a
nd y
ear
Num
ber
(t
hou-
sand
s)
Per
cent
age
dis
trib
utio
nM
edia
n in
com
e (d
olla
rs)
Mea
n in
com
e (d
olla
rs)
Tota
lU
nder
$1
5,00
0
$15,
000
to
$2
4,99
9
$25,
000
to
$3
4,99
9
$35,
000
to
$4
9,99
9
$50,
000
to
$7
4,99
9
$75,
000
to
$9
9,99
9
$100
,000
to
$1
49,9
99
$150
,000
to
$1
99,9
99$2
00,0
00
and
ove
rE
stim
ate
Sta
ndar
d
erro
r E
stim
ate
Sta
ndar
d
erro
r B
LAC
K A
LON
E O
R
IN
CO
MB
INAT
ION
2017
...
....
....
...
17,8
0110
0.0
19.6
12.6
11.6
14.1
15.8
10.1
9.6
3.5
3.1
40,5
9450
158
,985
799
2016
...
....
....
...
17,5
0510
0.0
20.0
13.0
11.5
13.8
16.5
9.7
9.2
3.5
2.8
40,9
2759
659
,372
956
2015
...
....
....
...
17,3
2210
0.0
21.0
13.9
11.5
13.3
16.1
9.3
9.0
3.3
2.5
38,5
0156
556
,706
897
2014
...
....
....
...
17,1
9810
0.0
21.7
14.1
12.0
14.7
15.3
8.4
8.4
3.0
2.3
36,9
5348
953
,503
718
2013
1 .
....
....
....
16,7
2310
0.0
21.5
13.8
12.4
14.6
15.6
7.6
9.1
3.1
2.2
37,6
9682
054
,465
1,39
420
132 .
....
....
....
16,8
5510
0.0
21.3
14.6
12.7
14.6
15.3
8.2
8.4
2.8
2.0
36,6
5373
852
,391
918
2012
...
....
....
...
16,5
5910
0.0
22.7
14.5
12.0
13.6
15.7
8.6
8.3
2.7
1.8
36,0
6685
451
,513
789
2011
...
....
....
...
16,1
6510
0.0
23.5
14.3
12.1
13.6
15.1
8.8
8.0
2.7
1.9
35,3
5360
451
,890
844
2010
3 .
....
....
....
15,9
0910
0.0
23.1
13.7
12.1
14.0
15.3
9.3
7.9
2.7
1.7
36,2
3153
051
,264
706
2009
4 .
....
....
....
15,2
1210
0.0
20.7
13.6
13.2
14.1
16.0
9.5
8.3
2.7
1.7
37,5
0947
953
,005
591
2008
...
....
....
...
15,0
5610
0.0
20.2
13.1
12.8
14.9
16.8
9.1
8.6
2.7
1.8
39,1
9950
153
,276
557
2007
...
....
....
...
14,9
7610
0.0
20.2
13.6
10.6
15.1
16.5
9.5
9.6
3.0
2.0
40,4
0355
155
,502
607
2006
...
....
....
...
14,7
0910
0.0
20.2
13.3
11.1
15.9
16.2
9.3
8.9
2.9
2.2
39,1
6229
055
,446
680
2005
...
....
....
...
14,3
9910
0.0
20.4
13.9
11.9
13.7
16.9
9.6
8.8
3.1
1.7
38,9
4937
153
,762
585
2004
5 .
....
....
....
14,1
5110
0.0
20.9
12.5
12.4
15.1
16.0
10.1
8.5
2.6
1.8
39,3
3336
053
,023
563
2003
...
....
....
...
13,9
6910
0.0
20.6
13.0
12.3
13.7
17.1
9.5
9.2
2.7
1.9
39,6
6649
853
,864
570
2002
...
....
....
...
13,7
7810
0.0
19.7
13.7
11.8
15.4
15.6
9.9
8.9
2.9
2.1
39,8
6752
555
,112
642
BLA
CK
ALO
NE
24
2017
...
....
....
...
16,9
9710
0.0
19.9
12.7
11.6
14.1
15.7
9.8
9.5
3.5
3.1
40,2
5857
758
,593
825
2016
...
....
....
...
16,7
3310
0.0
20.4
13.1
11.6
13.7
16.3
9.6
9.2
3.5
2.8
40,3
3973
758
,680
952
2015
...
....
....
...
16,5
3910
0.0
21.2
14.0
11.5
13.4
16.0
9.1
8.9
3.3
2.4
38,1
7853
156
,237
891
2014
...
....
....
...
16,4
3710
0.0
21.9
14.2
12.1
14.7
15.3
8.3
8.3
3.0
2.3
36,6
8947
853
,098
716
2013
1 .
....
....
....
16,0
0910
0.0
22.1
13.8
12.3
14.5
15.6
7.7
8.9
3.0
2.1
37,2
3290
353
,179
1,24
920
132 .
....
....
....
16,1
0810
0.0
21.5
14.6
12.5
14.5
15.3
8.2
8.4
2.8
2.0
36,4
6776
752
,310
933
2012
...
....
....
...
15,8
7210
0.0
22.9
14.7
12.0
13.6
15.8
8.7
8.1
2.7
1.7
35,6
4184
551
,061
805
2011
...
....
....
...
15,5
8310
0.0
23.6
14.3
12.2
13.6
15.1
8.8
7.9
2.7
1.8
35,2
0355
651
,616
877
2010
3 .
....
....
....
15,2
6510
0.0
23.3
13.7
12.0
14.0
15.5
9.3
7.8
2.7
1.6
36,1
9556
250
,654
705
2009
4 .
....
....
....
14,7
3010
0.0
20.7
13.8
13.2
14.2
16.0
9.4
8.3
2.7
1.7
37,3
1945
152
,737
601
2008
...
....
....
...
14,5
9510
0.0
20.3
13.1
12.8
14.9
16.8
9.1
8.5
2.7
1.8
39,0
5450
353
,109
568
2007
...
....
....
...
14,5
5110
0.0
20.2
13.6
10.7
15.0
16.6
9.6
9.4
2.9
1.9
40,1
9656
355
,265
616
2006
...
....
....
...
14,3
5410
0.0
20.4
13.4
11.2
15.9
16.2
9.4
8.8
2.8
2.1
38,9
6329
454
,999
680
2005
...
....
....
...
14,0
0210
0.0
20.5
13.9
11.9
13.8
16.9
9.6
8.6
3.1
1.7
38,8
2837
953
,419
580
2004
5 .
....
....
....
13,8
0910
0.0
21.0
12.5
12.5
15.3
15.8
10.1
8.4
2.6
1.8
39,1
5140
752
,860
572
2003
...
....
....
...
13,6
2910
0.0
20.7
13.0
12.3
13.7
17.2
9.4
9.2
2.6
1.9
39,6
0751
653
,617
575
2002
...
....
....
...
13,4
6510
0.0
19.8
13.7
11.8
15.4
15.6
9.9
8.9
2.9
2.0
39,6
6153
454
,671
631
See
fo
otn
ote
s at
end
of
tab
le.

U.S. Census Bureau Income and Poverty in the United States: 2017 31
Tab
le A
-1.
Ho
useh
old
s by
To
tal M
one
y In
com
e, R
ace,
and
His
pan
ic O
rig
in o
f H
ous
eho
lder
: 19
67 t
o 2
017
—C
on.
(Inco
me
in 2
017 C
PI-U
-RS
adju
sted
dol
lars
. Hou
seho
lds
as o
f M
arch
of th
e fo
llow
ing y
ear.
Begin
ning
with
2010, s
tand
ard e
rror
s w
ere
calc
ulat
ed u
sing
rep
licat
e w
eight
s. B
efor
e 2010, s
tand
ard e
rror
s w
ere
calc
ulat
ed
usin
g t
he g
ener
aliz
ed v
aria
nce
func
tion
. For
info
rmat
ion
on c
onfiden
tial
ity
pro
tect
ion,
sam
plin
g e
rror
, non
sam
plin
g e
rror
, and
def
initio
ns, s
ee w
ww
2.c
ensu
s.go
v/pr
ogra
ms-
surv
eys/
cps/
tech
docs
/cps
mar
18.p
df )
Rac
e an
d H
isp
anic
o
rig
in o
f ho
use-
hold
er a
nd y
ear
Num
ber
(t
hou-
sand
s)
Per
cent
age
dis
trib
utio
nM
edia
n in
com
e (d
olla
rs)
Mea
n in
com
e (d
olla
rs)
Tota
lU
nder
$1
5,00
0
$15,
000
to
$2
4,99
9
$25,
000
to
$3
4,99
9
$35,
000
to
$4
9,99
9
$50,
000
to
$7
4,99
9
$75,
000
to
$9
9,99
9
$100
,000
to
$1
49,9
99
$150
,000
to
$1
99,9
99$2
00,0
00
and
ove
rE
stim
ate
Sta
ndar
d
erro
r E
stim
ate
Sta
ndar
d
erro
r B
LAC
K23
2001
...
....
....
...
13,3
1510
0.0
19.5
12.9
11.6
15.1
16.8
10.3
9.5
2.6
1.6
40,9
0248
254
,473
575
2000
6 .
....
....
....
13,1
7410
0.0
18.4
12.2
11.8
14.9
18.1
10.3
9.2
3.4
1.7
42,3
4856
155
,924
567
1999
7 .
....
....
....
12,8
3810
0.0
19.2
12.6
11.4
14.5
16.7
10.6
9.2
3.7
2.2
41,1
9276
756
,765
815
1998
...
....
....
...
12,5
7910
0.0
21.4
14.0
11.6
14.1
16.0
10.4
8.4
2.5
1.6
38,2
1259
851
,458
687
1997
...
....
....
...
12,4
7410
0.0
21.1
14.0
11.7
15.1
16.5
10.2
7.9
2.4
1.1
38,2
6965
850
,358
723
1996
...
....
....
...
12,1
0910
0.0
22.2
14.5
11.7
14.7
16.0
10.2
7.5
2.0
1.2
36,6
4972
150
,662
990
1995
8 .
....
....
....
11,5
7710
0.0
22.5
14.8
11.8
14.9
16.3
8.9
7.9
1.8
1.1
35,8
8061
248
,710
833
1994
9 .
....
....
....
11,6
5510
0.0
24.6
14.4
11.6
14.5
14.9
9.2
7.4
2.2
1.3
34,5
0364
248
,011
689
1993
10 .
....
....
....
11,2
8110
0.0
26.1
14.4
12.3
14.0
15.2
8.1
6.8
2.1
1.0
32,7
2164
745
,613
757
1992
11 .
....
....
....
11,2
6910
0.0
26.7
15.0
11.5
14.2
15.4
8.6
6.0
1.9
0.7
32,2
1065
843
,708
593
1991
...
....
....
...
11,0
8310
0.0
27.2
13.5
11.3
14.1
16.1
8.9
6.4
1.8
0.7
33,1
0369
544
,079
576
1990
...
....
....
...
10,6
7110
0.0
26.0
14.0
11.0
14.2
16.7
8.9
6.7
1.7
0.8
34,0
6877
745
,265
611
1989
...
....
....
...
10,4
8610
0.0
25.4
14.2
11.2
14.2
16.4
8.4
7.7
1.9
0.6
34,6
1370
445
,929
624
1988
...
....
....
...
10,5
6110
0.0
26.7
14.8
11.1
14.4
14.4
9.0
7.1
1.6
1.0
32,7
7868
344
,904
655
1987
12 .
....
....
....
10,1
9210
0.0
26.8
14.8
11.3
15.3
14.7
8.4
6.4
1.3
0.9
32,4
4062
143
,802
602
1986
...
....
....
...
9,92
210
0.0
27.0
14.2
12.2
14.0
15.8
8.6
6.0
1.6
0.6
32,2
8963
443
,320
589
1985
13 .
....
....
....
9,79
710
0.0
25.8
15.5
12.8
14.1
15.7
8.6
5.9
1.1
0.4
32,2
8562
742
,124
547
1984
14 .
....
....
....
9,48
010
0.0
26.7
16.7
12.6
14.6
14.7
7.7
5.8
1.0
0.3
30,3
5658
440
,485
498
1983
...
....
....
...
9,23
610
0.0
28.1
16.1
12.7
14.4
14.7
7.8
5.0
0.9
0.2
29,1
7354
738
,802
479
1982
...
....
....
...
8,91
610
0.0
27.6
16.3
13.2
14.0
16.1
8.0
3.9
0.7
0.3
29,2
9147
038
,540
482
1981
...
....
....
...
8,96
110
0.0
27.6
16.2
13.7
14.0
15.1
7.8
4.7
0.7
0.1
29,3
5049
338
,555
467
1980
...
....
....
...
8,84
710
0.0
26.1
16.5
13.3
14.4
16.2
7.6
5.0
0.7
0.3
30,5
7357
739
,679
489
1979
15 .
....
....
....
8,58
610
0.0
24.4
16.5
13.6
14.1
16.3
8.9
5.3
0.7
0.3
32,0
0458
441
,065
505
1978
...
....
....
...
8,06
610
0.0
24.7
16.0
12.7
14.5
17.1
8.2
5.7
0.9
0.2
32,5
4268
841
,588
543
1977
...
....
....
...
7,97
710
0.0
24.2
17.8
13.4
15.5
15.9
7.6
4.6
0.7
0.3
31,1
1941
839
,873
355
1976
16 .
....
....
....
7,77
610
0.0
24.4
17.5
12.7
15.2
17.5
7.5
4.4
0.6
0.2
31,0
4138
539
,659
354
1975
17 .
....
....
....
7,48
910
0.0
25.7
17.5
12.5
16.2
16.1
7.4
3.9
0.6
0.1
30,7
7445
338
,414
341
1974
17, 1
8 ...
....
....
7,26
310
0.0
24.2
16.7
14.0
16.6
16.0
8.2
3.8
0.5
0.1
31,3
0837
838
,937
346
1973
...
....
....
...
7,04
010
0.0
23.2
17.3
13.0
16.3
17.4
7.8
4.1
0.7
0.3
32,0
7049
939
,824
396
1972
19 .
....
....
....
6,80
910
0.0
24.7
16.6
13.7
16.3
15.5
8.5
3.8
0.5
0.4
31,2
0346
839
,416
420
1971
20 .
....
....
....
6,57
810
0.0
25.7
16.5
14.4
17.0
15.9
6.6
3.3
0.4
0.2
30,1
9044
937
,410
384
1970
...
....
....
...
6,18
010
0.0
25.2
16.2
14.3
16.3
16.7
7.1
3.5
0.5
0.2
31,2
8142
938
,196
412
1969
...
....
....
...
6,05
310
0.0
24.8
17.0
14.2
17.6
16.3
6.3
3.4
0.4
0.1
31,3
7046
237
,345
397
1968
...
....
....
...
5,87
010
0.0
25.4
18.3
15.2
16.7
15.5
5.8
2.7
0.3
0.1
29,4
3742
735
,852
378
1967
21 .
....
....
....
5,72
810
0.0
28.2
17.4
15.7
16.4
14.2
4.9
2.3
0.6
0.3
27,8
3146
333
,442
373
See
fo
otn
ote
s at
end
of
tab
le.

32 Income and Poverty in the United States: 2017 U.S. Census Bureau
Tab
le A
-1.
Ho
useh
old
s by
To
tal M
one
y In
com
e, R
ace,
and
His
pan
ic O
rig
in o
f H
ous
eho
lder
: 19
67 t
o 2
017
—C
on.
(Inco
me
in 2
017 C
PI-U
-RS
adju
sted
dol
lars
. Hou
seho
lds
as o
f M
arch
of th
e fo
llow
ing y
ear.
Begin
ning
with
2010, s
tand
ard e
rror
s w
ere
calc
ulat
ed u
sing
rep
licat
e w
eight
s. B
efor
e 2010, s
tand
ard e
rror
s w
ere
calc
ulat
ed
usin
g t
he g
ener
aliz
ed v
aria
nce
func
tion
. For
info
rmat
ion
on c
onfiden
tial
ity
pro
tect
ion,
sam
plin
g e
rror
, non
sam
plin
g e
rror
, and
def
initio
ns, s
ee w
ww
2.c
ensu
s.go
v/pr
ogra
ms-
surv
eys/
cps/
tech
docs
/cps
mar
18.p
df )
Rac
e an
d H
isp
anic
o
rig
in o
f ho
use-
hold
er a
nd y
ear
Num
ber
(t
hou-
sand
s)
Per
cent
age
dis
trib
utio
nM
edia
n in
com
e (d
olla
rs)
Mea
n in
com
e (d
olla
rs)
Tota
lU
nder
$1
5,00
0
$15,
000
to
$2
4,99
9
$25,
000
to
$3
4,99
9
$35,
000
to
$4
9,99
9
$50,
000
to
$7
4,99
9
$75,
000
to
$9
9,99
9
$100
,000
to
$1
49,9
99
$150
,000
to
$1
99,9
99$2
00,0
00
and
ove
rE
stim
ate
Sta
ndar
d
erro
r E
stim
ate
Sta
ndar
d
erro
r A
SIA
N A
LON
E O
R
IN
CO
MB
INA
TIO
N20
17 .
....
....
....
.7,
114
100.
08.
96.
56.
19.
714
.612
.716
.410
.514
.680
,961
1,15
211
3,72
02,
407
2016
...
....
....
...
6,75
010
0.0
8.9
6.5
6.3
8.2
15.6
13.3
17.1
11.2
12.9
82,5
601,
155
109,
183
1,81
020
15 .
....
....
....
.6,
640
100.
09.
76.
95.
99.
715
.312
.216
.610
.912
.779
,423
1,44
810
8,77
82,
275
2014
...
....
....
...
6,33
310
0.0
9.9
6.8
7.5
9.5
15.3
12.3
18.1
10.2
10.5
77,5
572,
053
101,
721
1,99
720
131 .
....
....
....
6,16
010
0.0
10.0
7.5
5.3
10.3
15.8
13.2
17.4
8.4
12.0
76,3
873,
364
106,
538
4,45
220
132 .
....
....
....
6,11
110
0.0
10.6
6.5
7.9
10.8
16.8
12.1
16.5
8.9
9.9
71,0
051,
920
96,2
652,
387
2012
...
....
....
...
5,87
210
0.0
9.9
6.6
7.6
10.0
17.4
12.7
16.6
9.3
9.8
72,9
291,
858
98,0
882,
026
2011
...
....
....
...
5,70
510
0.0
9.5
8.6
7.9
10.4
16.2
13.3
17.6
7.9
8.7
70,9
931,
708
93,7
022,
242
2010
3 .
....
....
....
5,55
010
0.0
9.8
8.2
7.8
9.4
17.3
11.3
17.2
9.6
9.4
71,5
771,
651
94,3
211,
812
2009
4 .
....
....
....
4,94
010
0.0
10.6
6.6
7.9
9.9
15.6
11.7
17.8
9.2
10.7
74,5
281,
644
103,
203
2,02
720
08 .
....
....
....
.4,
805
100.
010
.37.
37.
210
.814
.912
.218
.49.
010
.074
,833
1,61
398
,522
1,69
720
07 .
....
....
....
.4,
715
100.
08.
87.
06.
610
.116
.113
.018
.610
.29.
678
,074
1,64
310
0,21
81,
714
2006
...
....
....
...
4,66
410
0.0
8.7
6.4
6.7
10.3
16.7
12.5
18.0
10.9
9.8
77,8
791,
971
106,
677
2,23
320
05 .
....
....
....
.4,
500
100.
09.
46.
87.
08.
916
.412
.919
.48.
710
.576
,815
917
100,
658
1,75
720
045 .
....
....
....
4,34
610
0.0
8.8
7.1
7.4
9.3
17.5
14.0
17.4
9.4
9.0
74,7
351,
506
99,0
391,
869
2003
...
....
....
...
4,23
510
0.0
11.8
8.1
6.0
8.5
16.6
13.3
18.2
8.6
9.0
73,8
331,
646
92,7
381,
595
2002
...
....
....
...
4,07
910
0.0
8.9
7.2
7.6
11.4
17.1
12.6
18.1
8.6
8.5
71,4
421,
081
94,9
311,
805
ASI
AN
ALO
NE
25
2017
...
....
....
...
6,73
510
0.0
9.0
6.6
5.8
9.6
14.5
12.9
16.3
10.8
14.6
81,3
311,
193
114,
105
2,45
620
16 .
....
....
....
.6,
392
100.
08.
96.
46.
48.
115
.413
.317
.111
.313
.283
,182
1,19
011
0,31
41,
859
2015
...
....
....
...
6,32
810
0.0
9.5
6.7
6.0
9.6
15.3
12.3
16.8
10.9
12.9
79,8
421,
756
109,
073
2,30
420
14 .
....
....
....
.6,
040
100.
010
.26.
87.
49.
615
.211
.818
.210
.410
.577
,006
2,18
410
1,11
91,
990
2013
1 .
....
....
....
5,81
810
0.0
10.1
7.7
5.0
9.9
16.3
12.7
17.7
8.4
12.2
76,2
933,
544
106,
676
4,70
720
132 .
....
....
....
5,75
910
0.0
10.7
6.7
8.0
10.7
16.8
12.0
16.2
9.1
9.8
70,6
871,
813
95,6
542,
431
2012
...
....
....
...
5,56
010
0.0
10.0
6.6
7.6
9.9
17.2
12.8
16.7
9.4
9.7
73,4
152,
022
97,7
641,
964
2011
...
....
....
...
5,37
410
0.0
9.4
8.5
8.1
10.3
16.3
13.3
17.7
8.0
8.4
71,1
391,
712
93,5
482,
264
2010
3 .
....
....
....
5,21
210
0.0
10.0
8.1
7.6
8.9
17.3
11.3
17.3
9.9
9.6
72,4
021,
775
95,3
021,
911
2009
4 .
....
....
....
4,68
710
0.0
10.6
6.6
7.9
9.6
15.7
11.8
17.8
9.3
10.7
74,9
821,
451
104,
006
2,11
320
08 .
....
....
....
.4,
573
100.
010
.57.
27.
310
.515
.012
.018
.39.
210
.074
,913
1,58
298
,365
1,71
520
07 .
....
....
....
.4,
494
100.
08.
87.
16.
69.
916
.112
.718
.910
.09.
878
,343
1,64
110
0,76
01,
778
2006
...
....
....
...
4,45
410
0.0
8.8
6.5
6.7
10.3
16.5
12.3
18.0
10.9
10.1
78,2
912,
040
107,
609
2,31
620
05 .
....
....
....
.4,
273
100.
09.
57.
06.
98.
716
.313
.019
.38.
810
.576
,873
896
100,
783
1,77
820
045 .
....
....
....
4,12
310
0.0
8.8
7.1
7.5
9.2
17.5
13.8
17.6
9.3
9.2
74,8
071,
590
99,5
411,
925
2003
...
....
....
...
4,04
010
0.0
11.9
8.1
5.8
8.5
16.3
13.3
18.2
8.7
9.2
74,4
171,
462
93,4
871,
655
2002
...
....
....
...
3,91
710
0.0
8.7
7.2
7.5
11.5
16.8
12.6
18.2
8.7
8.7
71,9
081,
258
95,7
111,
866
ASI
AN
AN
D
PA
CIF
IC
ISL
AN
DE
R23
2001
...
....
....
...
4,07
110
0.0
9.1
6.9
7.3
11.0
16.0
13.8
17.6
9.2
9.2
74,4
421,
777
101,
539
2,39
720
006 .
....
....
....
3,96
310
0.0
8.0
6.3
6.5
11.2
15.6
13.8
18.7
9.8
10.0
79,5
901,
357
103,
913
2,15
719
997 .
....
....
....
3,74
210
0.0
9.3
6.6
6.1
11.2
17.0
12.7
17.2
9.1
10.9
75,2
112,
651
99,4
552,
521
1998
...
....
....
...
3,30
810
0.0
8.9
7.8
7.0
11.7
17.7
12.7
19.1
7.9
7.1
70,2
961,
956
90,7
522,
621
1997
...
....
....
...
3,12
510
0.0
9.7
8.2
6.7
10.8
18.5
14.2
17.1
8.3
6.5
69,1
281,
922
89,9
672,
788
1996
...
....
....
...
2,99
810
0.0
10.8
7.5
7.2
10.9
19.1
13.0
17.0
9.0
5.5
67,5
432,
421
88,2
553,
165
1995
8 .
....
....
....
2,77
710
0.0
10.3
9.1
7.2
11.7
18.6
13.9
16.1
6.7
6.3
65,0
761,
633
88,4
923,
570
1994
9 .
....
....
....
2,04
010
0.0
10.0
9.5
6.9
12.5
16.7
14.0
16.9
7.1
6.4
66,4
272,
517
86,2
493,
073
1993
10 .
....
....
....
2,23
310
0.0
12.6
8.2
9.0
10.8
15.7
13.4
18.3
6.7
5.3
64,2
383,
159
84,1
673,
389
1992
11 .
....
....
....
2,26
210
0.0
10.0
8.7
9.2
10.4
19.0
13.3
17.7
6.5
5.2
64,9
201,
874
80,4
612,
212
1991
...
....
....
...
2,09
410
0.0
10.6
8.2
8.1
13.0
17.4
13.9
16.0
7.5
5.4
64,1
552,
070
81,4
552,
401
1990
...
....
....
...
1,95
810
0.0
9.0
7.4
8.1
11.3
18.0
15.3
17.9
6.7
6.2
70,1
392,
078
84,6
632,
397
1989
...
....
....
...
1,98
810
0.0
8.4
7.5
7.7
11.6
19.3
15.8
16.9
6.5
6.4
69,1
031,
868
85,9
052,
500
1988
...
....
....
...
1,91
310
0.0
8.6
9.4
9.4
11.0
18.6
14.4
15.8
7.3
5.5
64,4
632,
649
80,5
932,
407
1987
12 .
....
....
....
N10
0.0
10.3
10.2
7.8
10.9
17.5
13.6
17.9
8.1
3.8
66,7
062,
480
NN
See
fo
otn
ote
s at
end
of
tab
le.

U.S. Census Bureau Income and Poverty in the United States: 2017 33
Tab
le A
-1.
Ho
useh
old
s by
To
tal M
one
y In
com
e, R
ace,
and
His
pan
ic O
rig
in o
f H
ous
eho
lder
: 19
67 t
o 2
017
—C
on.
(Inco
me
in 2
017 C
PI-U
-RS
adju
sted
dol
lars
. Hou
seho
lds
as o
f M
arch
of th
e fo
llow
ing y
ear.
Begin
ning
with
2010, s
tand
ard e
rror
s w
ere
calc
ulat
ed u
sing
rep
licat
e w
eight
s. B
efor
e 2010, s
tand
ard e
rror
s w
ere
calc
ulat
ed
usin
g t
he g
ener
aliz
ed v
aria
nce
func
tion
. For
info
rmat
ion
on c
onfiden
tial
ity
pro
tect
ion,
sam
plin
g e
rror
, non
sam
plin
g e
rror
, and
def
initio
ns, s
ee w
ww
2.c
ensu
s.go
v/pr
ogra
ms-
surv
eys/
cps/
tech
docs
/cps
mar
18.p
df )
Rac
e an
d H
isp
anic
o
rig
in o
f ho
use-
hold
er a
nd y
ear
Num
ber
(t
hou-
sand
s)
Per
cent
age
dis
trib
utio
nM
edia
n in
com
e (d
olla
rs)
Mea
n in
com
e (d
olla
rs)
Tota
lU
nder
$1
5,00
0
$15,
000
to
$2
4,99
9
$25,
000
to
$3
4,99
9
$35,
000
to
$4
9,99
9
$50,
000
to
$7
4,99
9
$75,
000
to
$9
9,99
9
$100
,000
to
$1
49,9
99
$150
,000
to
$1
99,9
99$2
00,0
00
and
ove
rE
stim
ate
Sta
ndar
d
erro
r E
stim
ate
Sta
ndar
d
erro
r H
ISPA
NIC
(
AN
Y R
AC
E)26
2017
...
....
....
...
17,3
1810
0.0
12.0
11.1
11.3
15.0
18.1
12.6
11.5
4.5
3.8
50,4
8643
868
,319
864
2016
...
....
....
...
16,9
1510
0.0
12.4
11.5
11.2
15.8
17.9
12.0
11.6
4.0
3.5
48,7
0069
168
,252
825
2015
...
....
....
...
16,6
6710
0.0
13.4
12.7
12.0
15.4
17.8
11.2
9.9
4.1
3.4
46,7
1463
665
,818
866
2014
...
....
....
...
16,2
3910
0.0
14.3
13.9
11.7
15.6
18.0
10.9
10.1
3.2
2.3
44,0
4053
559
,632
680
2013
1 .
....
....
....
16,0
8810
0.0
14.6
14.0
14.1
14.9
16.7
9.6
9.1
3.8
3.1
41,8
311,
252
60,7
291,
794
2013
2 .
....
....
....
15,8
1110
0.0
15.2
13.0
13.2
15.8
17.5
10.4
9.8
3.1
2.2
43,1
7658
257
,596
777
2012
...
....
....
...
15,5
8910
0.0
15.9
13.3
13.7
15.2
17.9
10.0
8.8
3.0
2.3
41,7
2157
157
,142
747
2011
...
....
....
...
14,9
3910
0.0
15.3
13.0
13.8
16.4
17.4
9.9
8.8
3.3
2.1
42,1
8859
757
,183
649
2010
3 .
....
....
....
14,4
3510
0.0
15.5
13.2
13.5
14.7
18.2
10.3
9.3
3.3
2.1
42,3
9965
657
,906
744
2009
4 .
....
....
....
13,2
9810
0.0
14.2
13.1
13.3
15.3
18.1
10.4
9.8
3.2
2.5
43,5
6657
559
,818
656
2008
...
....
....
...
13,4
2510
0.0
14.5
13.0
13.1
16.4
17.6
10.0
10.0
3.5
2.1
43,2
7155
558
,860
609
2007
...
....
....
...
13,3
3910
0.0
13.0
13.2
11.4
17.0
18.6
11.5
9.8
3.3
2.2
45,8
4161
660
,239
634
2006
...
....
....
...
12,9
7310
0.0
13.1
12.7
11.3
17.1
18.8
11.0
9.9
3.7
2.3
46,0
4661
561
,639
707
2005
...
....
....
...
12,5
1910
0.0
13.0
12.5
12.8
16.5
19.1
11.2
9.4
3.1
2.4
45,2
5644
959
,313
596
2004
5 .
....
....
....
12,1
7810
0.0
13.2
12.9
13.5
15.8
19.4
10.5
9.4
2.9
2.4
44,5
8362
459
,681
730
2003
...
....
....
...
11,6
9310
0.0
13.1
12.9
13.2
16.9
18.2
10.5
9.9
2.7
2.6
44,0
8661
359
,411
657
2002
...
....
....
...
11,3
3910
0.0
12.4
12.9
13.0
16.6
18.3
11.4
10.0
3.1
2.4
45,2
3265
961
,333
820
2001
...
....
....
...
10,4
9910
0.0
12.2
13.4
12.1
16.3
18.5
11.8
10.2
3.3
2.3
46,5
8659
161
,600
779
2000
6 .
....
....
....
10,0
3410
0.0
11.9
12.6
11.7
16.7
19.7
11.7
10.3
3.0
2.4
47,3
4568
262
,776
904
1999
7 .
....
....
....
9,57
910
0.0
12.6
13.3
12.2
16.8
19.2
10.8
10.2
2.6
2.2
45,3
7766
059
,611
1,05
819
98 .
....
....
....
.9,
060
100.
014
.914
.412
.116
.817
.711
.08.
62.
72.
042
,702
823
57,7
001,
227
1997
...
....
....
...
8,59
010
0.0
16.5
14.4
12.9
15.9
18.6
9.7
7.9
2.3
1.9
40,6
8072
654
,819
1,10
619
96 .
....
....
....
.8,
225
100.
016
.515
.913
.316
.217
.39.
57.
72.
21.
638
,872
754
53,0
731,
228
1995
8 .
....
....
....
7,93
910
0.0
18.4
16.2
13.5
16.0
16.2
9.6
6.9
2.0
1.3
36,6
2979
849
,994
1,12
219
949 .
....
....
....
7,73
510
0.0
18.6
15.3
12.4
16.0
17.3
9.0
7.7
2.2
1.5
38,4
3271
451
,823
1,29
319
9310
...
....
....
..7,
362
100.
017
.115
.313
.816
.217
.98.
97.
71.
81.
338
,338
771
50,7
431,
067
1992
11 .
....
....
....
7,15
310
0.0
17.6
14.6
13.6
16.7
17.4
9.8
7.2
2.1
1.0
38,8
0880
249
,499
778
1991
...
....
....
...
6,37
910
0.0
16.8
14.5
12.4
17.0
18.2
10.1
7.6
2.2
1.2
39,9
3983
150
,818
813
1990
...
....
....
...
6,22
010
0.0
16.4
15.3
12.2
16.3
19.1
10.1
7.5
1.9
1.2
40,7
3383
551
,025
841
1989
...
....
....
...
5,93
310
0.0
16.3
13.5
12.2
16.2
18.3
11.6
8.1
2.4
1.4
41,9
5981
353
,580
921
1988
...
....
....
...
5,91
010
0.0
17.9
13.0
13.2
15.9
18.5
10.6
7.3
2.2
1.3
40,6
731,
031
51,9
281,
101
1987
12 .
....
....
....
5,64
210
0.0
18.2
14.5
11.7
16.8
17.8
10.2
7.5
1.9
1.4
40,0
2586
951
,306
950
1986
...
....
....
...
5,41
810
0.0
17.5
14.4
13.4
15.3
18.6
10.2
8.1
1.8
0.7
39,2
951,
023
49,6
1781
619
8513
...
....
....
..5,
213
100.
017
.916
.212
.515
.818
.89.
37.
51.
30.
738
,050
889
47,5
4477
319
8414
...
....
....
..4,
883
100.
018
.615
.113
.215
.219
.410
.06.
51.
50.
738
,290
960
47,6
1392
819
83 .
....
....
....
.4,
326
100.
019
.615
.012
.817
.118
.49.
36.
21.
20.
437
,335
946
45,4
6387
319
82 .
....
....
....
.4,
085
100.
018
.716
.013
.017
.518
.09.
06.
11.
00.
737
,148
981
45,8
4693
019
81 .
....
....
....
.3,
980
100.
016
.014
.613
.617
.819
.410
.56.
41.
20.
639
,707
1,08
747
,683
911
1980
...
....
....
...
3,90
610
0.0
16.7
14.6
14.4
16.8
19.4
10.3
5.8
1.2
0.6
38,7
731,
051
47,3
5994
319
7915
...
....
....
..3,
684
100.
015
.113
.713
.916
.821
.010
.37.
01.
50.
841
,191
1,18
849
,839
1,00
119
78 .
....
....
....
.3,
291
100.
015
.013
.813
.917
.920
.811
.05.
81.
30.
440
,813
989
48,2
0997
519
77 .
....
....
....
.3,
304
100.
014
.914
.914
.219
.320
.110
.05.
11.
20.
339
,341
691
46,4
2771
719
7616
...
....
....
..3,
081
100.
017
.116
.213
.517
.920
.49.
44.
40.
80.
337
,589
801
44,4
2072
319
7517
...
....
....
..2,
948
100.
017
.116
.014
.918
.220
.68.
23.
90.
70.
536
,827
814
43,7
1977
719
7417
, 18 .
....
....
..2,
897
100.
014
.215
.514
.218
.821
.49.
45.
10.
90.
540
,038
877
46,3
8275
519
73 .
....
....
....
.2,
722
100.
013
.314
.714
.919
.322
.09.
85.
00.
80.
340
,274
915
46,7
9276
219
7219
...
....
....
..2,
655
100.
012
.716
.314
.420
.621
.98.
64.
00.
90.
540
,341
788
46,3
6878
8
See
fo
otn
ote
s at
end
of
tab
le.

34 Income and Poverty in the United States: 2017 U.S. Census Bureau
. All
of
the
ses
usin
g -
om
e q
ues e as e
eiv
age ec
SE
C s
amp
le
ensu
s
om
e
allin
g in
al
w
o r
er esvo ta, t
he C
e c
er ed t
he in
c
e. M
edia
ns f
erv
age
00
0 h
ous
eho
ld
,
vo anc
e el
igib
le t
eiv
om
e d
a
win
g. I
n ad
dit
ion,
ease
d
tio
nnai
r,9
99
;
o
e lim
its
incr
ease
d t
o $
99
9
tio
n o
f 19
80
ed q
ues
ease
d t
tanc
e c 0
00
ad
dr
e a
set
of
inc
er ec
00
0 o
r m
or
sis
eiv
, the
up
per
op
en-e
nded
int
op
olit
an d
efini
tio
ns, 7
ervi
e
y lim
its
dec
r
om
e am
oun
ts o
n se
lect
. Ful
l im
ple
men
ta
anc
om
e an
d h
ealt
h in
sur
edes
igne
d s
et o
f he
alth
insu
ro
a s
ubsa
mp
le o
f th
e 9
8,
ec ses
w
SE
C.
o r ed
int
,
es ses.
o $
250
tsi
s
,99
9
es
er-a
s
,00
0 a
dd
res
ses.
o $
299
ere
elig
ible
tem
aini
ng 3
0
, SE
C s
amp
le w
hich
r
om
e an
d p
ublic
as
t
00
0 a
dd
r
om
put
ed t
ses
w
es is
the
po
rtio
n o
f th
e C
PS
A0
00
ad
dr
als.
Beg
inni
ng w
ith
200
9 in
c
e 20
09
tim
ael
y 30
e m
edia
ns t
or
or
inc
ely
68
,
eig
hts
in t
he 2
00
5 C
PS
A
ols
.
tio
ns f
edes
igne
d q
ues
o r
e el
igib
le t
es is
the
po
rtio
n o
f th
e C
PS
A
” B
ef
ecti
on
tas
use
d.
orr
ensu
s-b
ased
sam
ple
des
ign
and
met
r
om
pap
er a
nd p
enci
l to
c ent
inc
ols
.
er ego
ries
: ear
ning
s lim
its
incr
t urit
y in
c
ease
d t
e th
e r
eiv
e im
ple
men
t es
13 e
s t
00
0 a
dd
r erv .
t ont
r
SE
C a
nd t
he r o
ntr t
xim
a
ula . em
.
om
e in
t e
e o
f th
ese
20
tio
n c
o c
alc ac
ts
o
xim
a 00
0, xp
ansi
on.
o o t
he w
win
g c
a
tio
n c
ols
.y
t jo
b in
cr
ec od
ing
of
diff
er
tio
ns, a
pp
r
SE
C, a
pp
ren
sus-
bas
ed p
op
ula
,99
9; a
nd c
hild
sup
po
rt a
nd a
limo
no
$9
9
ont
r
ely
68
,ti
ons
wxi
mat
er 13 C
PS
Ahe
so
urc
tim
at
SE
C p
r
que
so
bab
ility
sp
lit p
anel
des
ign.
Ap
pro
om
e q
ues
13 C
PS
A
om
e in
t
eflec
t a
c
,99
9; s
upp
lem
enta
l sec
9
SE
C in
clud
ed r
ses
w
o $
4
om
e
tio
ns. T
13 e
s ensu
s p
op
ula
10 C
ed u
sing
$2,
500
inc
t
e p
lug
ged
wit
h “$
250
ollo
sing
s
als
used
t
ensu
s-b
ased
po
pul
a
or
the
c
eso
m lo
nges
erv
w f
ease
d in
the
f
ease
d t
oc
00
0”
w
o a
llo
al a
r,
es ula 0
00
ho
useh
old
sam
ple
e
esp
ons
es o
n r
vise
d e
dit
ing
of
ren
sus
sam
ple
des
ign.
tio
n c
o r
olle
ctio
n m
etho
d c
hang
ed f
r
w C
PS
A
vise
d t
or
earn
ing
s fr
om
e q
ues
edes
igne
d in
c
xpan
ded
the
up
per
inc
ease
d o
r d
ecr
.
edes
igne
d in
c
erv
vise
d t
00
0 a
dd
r
o t
hose
use
d in
the
20
as r
t tio
n o
f 20
the
upp
er o
pen
-end
ed in
t ease
d t
e b
een
re
14 C
PS
A
e o
f th
ese
20en
t w
ith
the
20
om
e is
cal
c
tio
n o
f a
28,
tio
n o
f 20
00
C
e F
ull i
mp
lem
enta
educ
tio
n, a
nd r
od
ucti
on
of
199
0 C e
edes
igne
d in
ced
the
r
00
0 a
nd a
plu
g o
f “$
100
tio
n o
f 19
90
C
SE
C w
ans’
ben
efits
lim
its
incr
tio
n o
f 19
90
Cti
on
of
a ne
ons
is er
din
g o
f am
oun
ts f
he s
our
c v
urit
y lim
its
incr
et
N N
ot
aai
lab
lev el
y 9
8,
he r
he 2
0
ta h
a
o tio
ns. T
tio
ns s
imila
r t
eiv
tio
ns c
Imp
lem
enta
Med
ian
inc
eau
e
Imp
lem
enta
ta c
xim
at or
ec
sam
ple
r ec
whi
ch r T , Da
Imp
lem
enta
Intr
Da
T
ems.
Lim
its
eith
er in
cr
R
2
the
199
4 C
PS
A
Imp
lem
enta
1 5 10
4,9
99
; v
Imp
lem
enta
soci
al s
ec
,99
9.
app
rq
ues
$10
0 9
o $
2 11 12
a p
r
the
r
que
s 3 4 6 7 8 13
Bur 9 en
sus-
bas
ed s
amp
le d
esig
n.
it t $4
C
ensu
s-b
ased
sam
ple
or
alue
s
er
sib
le v
, all
med
ians
ent
of -
e
e hit
10
ed o
nly
one
ti
on
and
fac
t
7 p
os
ear
w 2
e th
is y
o s
ho
ta,
om
pub
lishe
d d
a e al
one
ac 10
oup
s.
om
e hit
he u
se o
f th
is s
ing
le-r
ensu
s
es. W
he C
, suc
h as
Wo
m t
he 2
0e
in t
he 2
0
.o
up
.. acia
l gr c
e g
r
ac epo
rt
ono
mic
cha
r
o a
sk 1
1 in
c
ac
, 4.8
per
e r e o
r r
ta. T e
ac ego
ry
act oun
din
g.
ono
mic
c
od
ucti
on
of
198
0 C
or
xpan
ded
t
o c
hoo
se o
ne o
r m
or
. T zing
the
da
tio
n. B
ef
ace
than
one
r
ego
ry
e th
an o
ne r
epo
rt o
nly
one
r ta f
e ca
e ca
t
ed o
nly
one
r
or
the
His
pan
ic p
op
ula
er in
so
cio
ec o r
er f
r
aila
ble
fr
erla
p w
ith
da
2.
ac ac 7
v
ta d
ue t
xpan
ded
t
y d
iff
e e
ego
ry
y o
ther
ry
oth
er r
ed m
or
vep
ort
t d
iff
o r
ols
and
intr e
e
erp
ola
tio
n an
d m
a
ols
. t
ed m
or
e ca
epo
rt a
nep
ort
an
or
His
pan
ics
in 1
9
18 A
nnua
l So
cial
and
E
tio
nnai
r
fric
an A
mer
ican
, is
a
ont
r esp
ond
ents
t
or
His
pan
ics
o
esul
ts f
tio
nnai
r
esen
ting
or
anal
y
oup
s th
a
ols
. Que
s
ed r
eig
htin
g c w
ont
r o a
nd li
near
int
et
ont
r
ed t e r
ac epo
rt
epo
rt
t
w o 2
0
erp
ola
tio
n c
y o
ther
r
ega
e al
lo
ent
of
Asi
an h
ous
eho
lder
s w
ho r
ed f
tinc
t g
ro
llect
, 19
68
t
o in
t
em. Q
ues
t c
e
sing
s
ensu
s-b
ased
sam
ple
des
ign.
ensu
s sa
mp
le d
esig
n an
d p
op
ula c
em. er om
oth
er p
ublis
hed
da
yts
et y ts
ar
ed m
etho
d o
f p
r
ed B
lack
and
did
no
t r
epo
rt f
y
epo
rt a
n
ent
of
peo
ple
r
sing
s c
ed A
sian
and
did
no
t r
e ho
useh
old
ers
who
r
esp
ond
ents
w
SE
C a
llo
ta in
thi
s r
hit
, and
2.3
per
y d
ise
firs
ed u
sing
bo
th P
ed u
sing
P
tio
n o
n p
eop
le w
ho r
Bla
ck o
r A
etin
g a
gg
r
ar
and
erp
r
tio
n c
es t o
f m
aner
er s
light
ly f
rti
on
Sur
v
oc es
tio
n. err
ent
of
W e ta w
tio
n w
ons
is
y d
iffo
pul
a
tio
n o
f H
isp
anic
po
pul
a
ensu
s p
op
ula
epo
rt ac
SE
C p
r oc
epo
rt
SE
C p
rS
EC
, r efo
rma
e o
r A
sian
tio
n. D
a
tio
n.
e an
d d
id n
ot
r
. Ab
out
2.9
per
om
e. , the
CP
S A
, da
e d
eriv
erp
ola e
e d
eriv
erp
ola er
w C
PS
A
0 C
7
w C
PS
A3
CP
S A
hit
es w
ed W t
it is
the
pr
oac
hes.
Inf
tiv
a N
a
ed o
nly
one
r
er
tim
at
actF
ind
er
es o
f in
c
tio
n o
f 19
0 C
epo
rt
1 an
d e
arlie
ro
peo
ple
who
ro
peo
ple
who
r ac
a ent
P
1 p
erc
y r
cise
cau
tio
n w
hen
int
tio
ns c
es m
at
tio
n o
f 19
80
Cc
ed u
sing
line
ar in
t
y b
e an
tim
a
Beg
inni
ng w
ith
the
200
tio
n d
oes
no
t im
ply
tha
arie
ty o
f ap
pr
Am
eric
an In
dia
n an
d A
lask
y 15
.ed
b
y o
f im
mig
r
eau,
Cur
red
es
ear
med
ians
wed
usi
ng li
near
int
tio
n o
f a
ne epo
rt
7
So
me
of
thes
e es
od
ucti
on
of
19ti
on
of
ne
oug
h A
mer
ican
F er
ers
ter
s t
epo
rt x
sib
le s
our
Imp
lem
enta
Ful
l im
ple
men
ta
enc
tio
n-ad
just
Imp
lem
enta
t y e d
eriv
Imp
lem
enta
o p
eop
le w
ho r
ear
200
eau
uses
a v
Bla
ck a
lone
ref
er or
the
y
efA
sian
alo
ne r
e d
eriv
Bec
ause
His
pan
ics
ma
as r
ta u
sers
sho
uld
e
ec
ensu
s B
ur
Imp
lem
enta
Bei
ng H
isp
anic
w
, and
r
.S. C
om
51
po
s
ensu
s th
r
oup
s b
ecau
se t
hese
po
pul
a
Bla
ck h
ous
eho
lder
s w
ho r
ultu
ree:
Infl
ae:
U
Fir
s
Intr c
F
14 tio
ns.
des
ign.
15 16 17 18 19 20 21 22 So
ur
ers
t
23 24 25
26
. Da
No
t
e e g
r
er ef ac ac tics
, c
fr w whi
ch w
que
s
r po
pul
aB
uran
dC C
ensu
s.
r r is Sup
ple
men
ts.

U.S. Census Bureau Income and Poverty in the United States: 2017 35
Table A-2.Selected Measures of Household Income Dispersion: 1967 to 2017(Income in 2017 CPI-U-RS adjusted dollars. Beginning with 2010, standard errors were calculated using replicate weights. For further explanation of income inequality measures, see “The Changing Shape of the Nation’s Income Distribution: 1947–1998,” Current Population Reports, Series P60-204. For information on confidentiality protection, sampling error, nonsampling error, and definitions, see www2.census.gov/programs-surveys/cps/techdocs/cpsmar18.pdf )
Measures of income dispersion 2017 2016 2015 2014 20131 20132 2012 2011 20103 20094 2008MEASUREHousehold Income at Selected Percentiles10th percentile limit . . . . . . . . . . . . . . . . . . . . . . . . 14,219 13,901 13,719 12,724 12,858 13,071 13,088 13,107 13,364 13,881 13,88020th percentile limit . . . . . . . . . . . . . . . . . . . . . . . . 24,638 24,518 23,591 22,213 22,134 22,029 22,033 22,132 22,534 23,425 23,63940th percentile limit . . . . . . . . . . . . . . . . . . . . . . . . 47,110 46,581 45,020 42,688 43,251 42,358 42,533 42,075 42,815 44,151 44,51250th (median) . . . . . . . . . . . . . . . . . . . . . . . . . . . . . . 61,372 60,309 58,476 55,613 56,479 54,744 54,569 54,673 55,520 57,010 57,41260th percentile limit . . . . . . . . . . . . . . . . . . . . . . . . 77,552 76,479 74,498 70,699 70,830 69,039 69,079 68,196 69,293 70,781 71,58980th percentile limit . . . . . . . . . . . . . . . . . . . . . . . . 126,855 123,621 121,060 116,355 116,186 111,631 111,344 110,956 112,704 114,530 114,40690th percentile limit . . . . . . . . . . . . . . . . . . . . . . . . 179,077 174,203 167,804 163,221 163,821 158,102 156,166 156,864 156,362 157,631 157,84595th percentile limit . . . . . . . . . . . . . . . . . . . . . . . . 237,034 230,095 221,900 214,100 216,208 206,587 204,466 203,165 203,355 206,156 205,438Household Income Ratios of
Selected Percentiles90th/10th . . . . . . . . . . . . . . . . . . . . . . . . . . . . . . . . . 12.59 12.53 12.23 12.83 12.74 12.10 11.93 11.97 11.70 11.36 11.3795th/20th . . . . . . . . . . . . . . . . . . . . . . . . . . . . . . . . . 9.62 9.38 9.41 9.64 9.77 9.38 9.28 9.18 9.02 8.80 8.6995th/50th . . . . . . . . . . . . . . . . . . . . . . . . . . . . . . . . . 3.86 3.82 3.79 3.85 3.83 3.78 3.79 3.72 3.67 3.62 3.5880th/50th . . . . . . . . . . . . . . . . . . . . . . . . . . . . . . . . . 2.07 2.05 2.07 2.09 2.06 2.04 2.07 2.03 2.04 2.01 1.9980th/20th . . . . . . . . . . . . . . . . . . . . . . . . . . . . . . . . . 5.15 5.04 5.13 5.24 5.25 5.07 5.05 5.01 5.00 4.89 4.8420th/50th . . . . . . . . . . . . . . . . . . . . . . . . . . . . . . . . . 0.40 0.41 0.40 0.40 0.39 0.40 0.41 0.41 0.41 0.41 0.41Mean Household Income of QuintilesLowest quintile . . . . . . . . . . . . . . . . . . . . . . . . . . . . . 13,258 13,221 12,889 12,102 12,220 12,280 12,290 12,276 12,387 13,231 13,303Second quintile . . . . . . . . . . . . . . . . . . . . . . . . . . . . 35,401 35,246 33,763 32,221 32,476 32,157 31,764 31,899 32,147 33,508 33,688Third quintile. . . . . . . . . . . . . . . . . . . . . . . . . . . . . . . 61,564 60,421 58,803 56,011 56,644 55,148 54,743 54,442 55,397 56,732 57,217Fourth quintile . . . . . . . . . . . . . . . . . . . . . . . . . . . . . 99,030 97,225 95,223 91,037 91,144 88,030 87,814 87,470 88,872 90,129 91,032Highest quintile . . . . . . . . . . . . . . . . . . . . . . . . . . . . 221,846 218,542 209,384 201,129 203,796 195,210 194,571 194,448 190,856 195,668 195,231 Top 5 percent . . . . . . . . . . . . . . . . . . . . . . . . . . . . 385,289 383,154 363,038 344,465 352,531 339,754 340,198 340,185 323,594 338,309 336,358Shares of Household Income of QuintilesLowest quintile . . . . . . . . . . . . . . . . . . . . . . . . . . . . . 3.1 3.1 3.1 3.1 3.1 3.2 3.2 3.2 3.3 3.4 3.4Second quintile . . . . . . . . . . . . . . . . . . . . . . . . . . . . 8.2 8.3 8.2 8.2 8.2 8.4 8.3 8.4 8.5 8.6 8.6Third quintile. . . . . . . . . . . . . . . . . . . . . . . . . . . . . . . 14.3 14.2 14.3 14.3 14.3 14.4 14.4 14.3 14.6 14.6 14.7Fourth quintile . . . . . . . . . . . . . . . . . . . . . . . . . . . . . 23.0 22.9 23.2 23.2 23.0 23.0 23.0 23.0 23.4 23.2 23.3Highest quintile . . . . . . . . . . . . . . . . . . . . . . . . . . . . 51.5 51.5 51.1 51.2 51.4 51.0 51.0 51.1 50.3 50.3 50.0 Top 5 percent . . . . . . . . . . . . . . . . . . . . . . . . . . . 22.3 22.6 22.1 21.9 22.2 22.2 22.3 22.3 21.3 21.7 21.5Summary MeasuresGini index of income inequality . . . . . . . . . . . . . . 0.482 0.481 0.479 0.480 0.482 0.476 0.477 0.477 0.470 0.468 0.466Mean logarithmic deviation of income . . . . . . . . 0.609 0.601 0.596 0.611 0.606 0.578 0.586 0.585 0.574 0.550 0.541Theil . . . . . . . . . . . . . . . . . . . . . . . . . . . . . . . . . . . . . . 0.424 0.426 0.420 0.419 0.428 0.415 0.423 0.422 0.400 0.403 0.398Atkinson: e=0.25 . . . . . . . . . . . . . . . . . . . . . . . . . . . . . . . . . . . 0.103 0.103 0.101 0.102 0.103 0.100 0.101 0.101 0.097 0.097 0.096 e=0.50 . . . . . . . . . . . . . . . . . . . . . . . . . . . . . . . . . . . 0.202 0.201 0.199 0.200 0.202 0.196 0.198 0.198 0.191 0.190 0.188 e=0.75 . . . . . . . . . . . . . . . . . . . . . . . . . . . . . . . . . . . 0.307 0.305 0.303 0.307 0.307 0.298 0.300 0.300 0.293 0.288 0.285STANDARD ERRORHousehold Income at Selected Percentiles10th percentile limit . . . . . . . . . . . . . . . . . . . . . . . . 221 205 69 207 301 181 231 17 148 97 9520th percentile limit . . . . . . . . . . . . . . . . . . . . . . . . 355 56 182 259 271 229 256 193 133 123 12240th percentile limit . . . . . . . . . . . . . . . . . . . . . . . . 420 352 502 401 483 335 358 391 148 187 18050th (median) . . . . . . . . . . . . . . . . . . . . . . . . . . . . . . 335 445 332 406 689 291 224 274 366 244 15660th percentile limit . . . . . . . . . . . . . . . . . . . . . . . . 560 560 293 539 792 528 552 510 489 199 30580th percentile limit . . . . . . . . . . . . . . . . . . . . . . . . 766 573 817 693 672 756 646 619 188 356 34990th percentile limit . . . . . . . . . . . . . . . . . . . . . . . . 1,123 924 1,148 1,124 1,832 792 989 1,049 997 731 66595th percentile limit . . . . . . . . . . . . . . . . . . . . . . . . 2,394 1,897 1,584 1,559 2,177 2,389 1,472 1,613 1,273 1,007 1,052Household Income Ratios of
Selected Percentiles90th/10th . . . . . . . . . . . . . . . . . . . . . . . . . . . . . . . . . 0.191 0.189 0.105 0.219 0.321 0.167 0.211 0.082 0.130 0.095 0.09195th/20th . . . . . . . . . . . . . . . . . . . . . . . . . . . . . . . . . 0.156 0.074 0.096 0.117 0.146 0.133 0.114 0.094 0.076 0.063 0.06395th/50th . . . . . . . . . . . . . . . . . . . . . . . . . . . . . . . . . 0.038 0.038 0.033 0.035 0.055 0.045 0.031 0.030 0.026 0.022 0.02380th/50th . . . . . . . . . . . . . . . . . . . . . . . . . . . . . . . . . 0.010 0.013 0.013 0.015 0.025 0.014 0.013 0.012 0.010 0.010 0.01080th/20th . . . . . . . . . . . . . . . . . . . . . . . . . . . . . . . . . 0.068 0.024 0.046 0.060 0.069 0.051 0.056 0.042 0.031 0.030 0.02920th/50th . . . . . . . . . . . . . . . . . . . . . . . . . . . . . . . . . 0.005 0.003 0.003 0.004 0.005 0.004 0.004 0.003 0.003 0.003 0.003Mean Household Income of QuintilesLowest quintile . . . . . . . . . . . . . . . . . . . . . . . . . . . . . 137 128 132 127 208 128 113 127 115 48 47Second quintile . . . . . . . . . . . . . . . . . . . . . . . . . . . . 244 233 225 209 363 246 199 198 222 41 41Third quintile. . . . . . . . . . . . . . . . . . . . . . . . . . . . . . . 389 351 337 315 505 375 266 280 309 54 55Fourth quintile . . . . . . . . . . . . . . . . . . . . . . . . . . . . . 555 446 486 479 719 519 414 423 456 87 86Highest quintile . . . . . . . . . . . . . . . . . . . . . . . . . . . . 1,887 1,877 1,585 1,715 2,838 1,999 1,733 1,446 1,426 963 944 Top 5 percent . . . . . . . . . . . . . . . . . . . . . . . . . . . . 5,704 5,868 5,000 5,180 9,510 6,259 5,514 4,601 4,524 3,037 2,955Shares of Household Income of QuintilesLowest quintile . . . . . . . . . . . . . . . . . . . . . . . . . . . . . 0.03 0.03 0.03 0.03 0.05 0.03 0.03 0.03 0.03 0.02 0.02Second quintile . . . . . . . . . . . . . . . . . . . . . . . . . . . . 0.05 0.05 0.05 0.05 0.09 0.06 0.05 0.04 0.05 0.06 0.06Third quintile. . . . . . . . . . . . . . . . . . . . . . . . . . . . . . . 0.07 0.07 0.07 0.07 0.12 0.08 0.07 0.06 0.06 0.10 0.10Fourth quintile . . . . . . . . . . . . . . . . . . . . . . . . . . . . . 0.09 0.10 0.09 0.09 0.17 0.11 0.09 0.08 0.09 0.15 0.15Highest quintile . . . . . . . . . . . . . . . . . . . . . . . . . . . . 0.20 0.21 0.20 0.20 0.36 0.24 0.20 0.17 0.18 0.33 0.33 Top 5 percent . . . . . . . . . . . . . . . . . . . . . . . . . . . . 0.24 0.25 0.23 0.24 0.46 0.30 0.26 0.23 0.23 0.30 0.30Summary MeasuresGini index of income inequality . . . . . . . . . . . . . . 0.0021 0.0021 0.0020 0.0021 0.0037 0.0025 0.0020 0.0018 0.0019 0.0028 0.0027Mean logarithmic deviation of income . . . . . . . . 0.0073 0.0069 0.0067 0.0073 0.0124 0.0079 0.0068 0.0067 0.0066 0.0064 0.0063Theil . . . . . . . . . . . . . . . . . . . . . . . . . . . . . . . . . . . . . . 0.0054 0.0056 0.0052 0.0054 0.0107 0.0067 0.0059 0.0050 0.0049 0.0001 0.0001Atkinson: e=0.25 . . . . . . . . . . . . . . . . . . . . . . . . . . . . . . . . . . . 0.0011 0.0011 0.0010 0.0011 0.0021 0.0013 0.0011 0.0010 0.0010 0.0011 0.0011 e=0.50 . . . . . . . . . . . . . . . . . . . . . . . . . . . . . . . . . . . 0.0018 0.0018 0.0017 0.0018 0.0033 0.0022 0.0018 0.0016 0.0016 0.0018 0.0017 e=0.75 . . . . . . . . . . . . . . . . . . . . . . . . . . . . . . . . . . . 0.0024 0.0023 0.0023 0.0025 0.0043 0.0028 0.0023 0.0021 0.0021 0.0024 0.0023
See footnotes at end of table.

36 Income and Poverty in the United States: 2017 U.S. Census Bureau
Table A-2. Selected Measures of Household Income Dispersion: 1967 to 2017—Con.(Income in 2017 CPI-U-RS adjusted dollars. Beginning with 2010, standard errors were calculated using replicate weights. For further explanation of income inequality measures, see “The Changing Shape of the Nation’s Income Distribution: 1947–1998,” Current Population Reports, Series P60-204. For information on confidentiality protection, sampling error, nonsampling error, and definitions, see www2.census.gov/programs-surveys/cps/techdocs/cpsmar18.pdf )
Measures of income dispersion 2007 2006 2005 20045 2003 2002 2001 20006 19997 1998 1997MEASUREHousehold Income at Selected Percentiles10th percentile limit . . . . . . . . . . . . . . . . . . . . . . . . 14,414 14,625 14,203 14,188 14,077 14,511 14,831 15,105 15,269 14,621 14,07820th percentile limit . . . . . . . . . . . . . . . . . . . . . . . . 24,048 24,418 24,131 24,048 24,027 24,480 24,941 25,580 25,291 24,292 23,52740th percentile limit . . . . . . . . . . . . . . . . . . . . . . . . 46,340 46,038 45,298 45,109 45,426 45,606 46,237 47,106 47,110 45,834 44,60950th (median) . . . . . . . . . . . . . . . . . . . . . . . . . . . . . . 59,534 58,746 58,291 57,674 57,875 57,947 58,609 59,938 60,062 58,612 56,53360th percentile limit . . . . . . . . . . . . . . . . . . . . . . . . 73,480 73,126 72,552 71,849 72,752 72,640 73,560 74,475 74,361 72,859 70,27580th percentile limit . . . . . . . . . . . . . . . . . . . . . . . . 118,516 118,260 115,390 114,482 116,058 114,799 115,892 116,716 116,937 113,048 109,23290th percentile limit . . . . . . . . . . . . . . . . . . . . . . . . 161,182 162,097 158,656 157,235 157,921 155,921 157,707 159,873 159,067 152,690 149,20095th percentile limit . . . . . . . . . . . . . . . . . . . . . . . . 209,773 212,081 208,874 204,439 205,912 204,961 208,882 207,293 209,575 199,264 193,333Household Income Ratios of
Selected Percentiles90th/10th . . . . . . . . . . . . . . . . . . . . . . . . . . . . . . . . . 11.18 11.08 11.17 11.08 11.22 10.75 10.63 10.58 10.42 10.44 10.6095th/20th . . . . . . . . . . . . . . . . . . . . . . . . . . . . . . . . . 8.72 8.69 8.66 8.50 8.57 8.37 8.38 8.10 8.29 8.20 8.2295th/50th . . . . . . . . . . . . . . . . . . . . . . . . . . . . . . . . . 3.52 3.61 3.58 3.54 3.56 3.54 3.56 3.46 3.49 3.40 3.4280th/50th . . . . . . . . . . . . . . . . . . . . . . . . . . . . . . . . . 1.99 2.01 1.98 1.98 2.01 1.98 1.98 1.95 1.95 1.93 1.9380th/20th . . . . . . . . . . . . . . . . . . . . . . . . . . . . . . . . . 4.93 4.84 4.78 4.76 4.83 4.69 4.65 4.56 4.62 4.65 4.6420th/50th . . . . . . . . . . . . . . . . . . . . . . . . . . . . . . . . . 0.40 0.42 0.41 0.42 0.42 0.42 0.43 0.43 0.42 0.41 0.42Mean Household Income of QuintilesLowest quintile . . . . . . . . . . . . . . . . . . . . . . . . . . . . . 13,690 13,835 13,407 13,326 13,355 13,650 14,068 14,499 14,633 13,902 13,504Second quintile . . . . . . . . . . . . . . . . . . . . . . . . . . . . 34,894 35,073 34,423 34,099 34,307 34,706 35,348 36,201 35,930 35,102 33,760Third quintile. . . . . . . . . . . . . . . . . . . . . . . . . . . . . . . 59,220 58,773 58,260 57,774 58,236 58,484 59,166 60,285 60,142 58,735 56,796Fourth quintile . . . . . . . . . . . . . . . . . . . . . . . . . . . . . 93,759 93,028 91,634 91,097 92,179 91,994 92,768 93,716 93,605 90,839 87,969Highest quintile . . . . . . . . . . . . . . . . . . . . . . . . . . . . 199,073 204,961 200,800 197,006 196,503 196,409 202,596 203,081 199,613 192,225 187,549 Top 5 percent . . . . . . . . . . . . . . . . . . . . . . . . . . . . 340,368 362,469 353,771 343,303 338,339 342,977 361,505 360,286 346,945 335,049 329,126Shares of Household Income of QuintilesLowest quintile . . . . . . . . . . . . . . . . . . . . . . . . . . . . . 3.4 3.4 3.4 3.4 3.4 3.5 3.5 3.6 3.6 3.6 3.6Second quintile . . . . . . . . . . . . . . . . . . . . . . . . . . . . 8.7 8.6 8.6 8.7 8.7 8.8 8.7 8.9 8.9 9.0 8.9Third quintile. . . . . . . . . . . . . . . . . . . . . . . . . . . . . . . 14.8 14.5 14.6 14.7 14.8 14.8 14.6 14.8 14.9 15.0 15.0Fourth quintile . . . . . . . . . . . . . . . . . . . . . . . . . . . . . 23.4 22.9 23.0 23.2 23.4 23.3 23.0 23.0 23.2 23.2 23.2Highest quintile . . . . . . . . . . . . . . . . . . . . . . . . . . . . 49.7 50.5 50.4 50.1 49.8 49.7 50.1 49.8 49.4 49.2 49.4 Top 5 percent . . . . . . . . . . . . . . . . . . . . . . . . . . . . 21.2 22.3 22.2 21.8 21.4 21.7 22.4 22.1 21.5 21.4 21.7Summary MeasuresGini index of income inequality . . . . . . . . . . . . . . 0.463 0.470 0.469 0.466 0.464 0.462 0.466 0.462 0.458 0.456 0.459Mean logarithmic deviation of income . . . . . . . . 0.532 0.543 0.545 0.543 0.530 0.514 0.515 0.490 0.476 0.488 0.484Theil . . . . . . . . . . . . . . . . . . . . . . . . . . . . . . . . . . . . . . 0.391 0.417 0.411 0.406 0.397 0.398 0.413 0.404 0.386 0.389 0.396Atkinson: e=0.25 . . . . . . . . . . . . . . . . . . . . . . . . . . . . . . . . . . . 0.095 0.099 0.098 0.097 0.095 0.095 0.098 0.096 0.092 0.093 0.094 e=0.50 . . . . . . . . . . . . . . . . . . . . . . . . . . . . . . . . . . . 0.185 0.192 0.192 0.190 0.187 0.186 0.189 0.185 0.180 0.181 0.183 e=0.75 . . . . . . . . . . . . . . . . . . . . . . . . . . . . . . . . . . . 0.281 0.289 0.289 0.286 0.283 0.279 0.282 0.275 0.268 0.271 0.272STANDARD ERRORHousehold Income at Selected Percentiles10th percentile limit . . . . . . . . . . . . . . . . . . . . . . . . 96 100 97 96 96 97 101 103 103 101 10520th percentile limit . . . . . . . . . . . . . . . . . . . . . . . . 133 134 135 135 134 141 137 146 140 148 13940th percentile limit . . . . . . . . . . . . . . . . . . . . . . . . 148 217 157 169 218 213 212 231 170 234 29250th (median) . . . . . . . . . . . . . . . . . . . . . . . . . . . . . . 166 252 195 255 251 190 179 188 280 347 26160th percentile limit . . . . . . . . . . . . . . . . . . . . . . . . 318 199 317 235 253 303 294 271 224 375 32780th percentile limit . . . . . . . . . . . . . . . . . . . . . . . . 356 446 405 405 426 313 336 343 365 353 48490th percentile limit . . . . . . . . . . . . . . . . . . . . . . . . 699 689 676 639 676 615 598 692 667 579 61795th percentile limit . . . . . . . . . . . . . . . . . . . . . . . . 1,016 1,221 1,405 1,192 951 974 1,049 1,329 1,167 1,156 1,010Household Income Ratios of
Selected Percentiles90th/10th . . . . . . . . . . . . . . . . . . . . . . . . . . . . . . . . . 0.089 0.090 0.090 0.088 0.091 0.083 0.083 0.085 0.083 0.082 0.09195th/20th . . . . . . . . . . . . . . . . . . . . . . . . . . . . . . . . . 0.064 0.069 0.076 0.069 0.062 0.062 0.063 0.070 0.065 0.069 0.06595th/50th . . . . . . . . . . . . . . . . . . . . . . . . . . . . . . . . . 0.021 0.025 0.028 0.025 0.021 0.022 0.023 0.026 0.024 0.024 0.02280th/50th . . . . . . . . . . . . . . . . . . . . . . . . . . . . . . . . . 0.009 0.011 0.010 0.011 0.011 0.009 0.010 0.009 0.010 0.010 0.01180th/20th . . . . . . . . . . . . . . . . . . . . . . . . . . . . . . . . . 0.031 0.032 0.031 0.032 0.032 0.030 0.029 0.029 0.029 0.032 0.03420th/50th . . . . . . . . . . . . . . . . . . . . . . . . . . . . . . . . . 0.003 0.003 0.003 0.003 0.003 0.003 0.003 0.003 0.003 0.003 0.003Mean Household Income of QuintilesLowest quintile . . . . . . . . . . . . . . . . . . . . . . . . . . . . . 47 50 49 49 48 49 50 51 50 50 49Second quintile . . . . . . . . . . . . . . . . . . . . . . . . . . . . 44 43 44 43 44 44 44 46 46 47 44Third quintile. . . . . . . . . . . . . . . . . . . . . . . . . . . . . . . 56 55 54 56 56 56 57 57 58 57 55Fourth quintile . . . . . . . . . . . . . . . . . . . . . . . . . . . . . 89 90 87 86 88 86 87 87 89 86 82Highest quintile . . . . . . . . . . . . . . . . . . . . . . . . . . . . 955 1,151 1,077 1,065 1,010 1,060 1,196 1,185 1,043 1,088 1,117 Top 5 percent . . . . . . . . . . . . . . . . . . . . . . . . . . . . 3,003 3,783 3,460 3,473 3,241 3,434 3,933 3,891 3,287 4,988 5,190Shares of Household Income of QuintilesLowest quintile . . . . . . . . . . . . . . . . . . . . . . . . . . . . . 0.02 0.02 0.02 0.02 0.02 0.02 0.02 0.03 0.03 0.03 0.03Second quintile . . . . . . . . . . . . . . . . . . . . . . . . . . . . 0.06 0.06 0.06 0.06 0.06 0.06 0.06 0.06 0.06 0.06 0.06Third quintile. . . . . . . . . . . . . . . . . . . . . . . . . . . . . . . 0.10 0.10 0.10 0.10 0.10 0.10 0.10 0.10 0.10 0.11 0.11Fourth quintile . . . . . . . . . . . . . . . . . . . . . . . . . . . . . 0.16 0.15 0.15 0.16 0.16 0.16 0.16 0.16 0.16 0.16 0.17Highest quintile . . . . . . . . . . . . . . . . . . . . . . . . . . . . 0.33 0.34 0.34 0.34 0.34 0.34 0.35 0.34 0.35 0.35 0.35 Top 5 percent . . . . . . . . . . . . . . . . . . . . . . . . . . . . 0.29 0.31 0.31 0.31 0.30 0.31 0.32 0.32 0.31 0.44 0.45Summary MeasuresGini index of income inequality . . . . . . . . . . . . . . 0.0027 0.0028 0.0028 0.0029 0.0028 0.0029 0.0030 0.0030 0.0041 0.0042 0.0043Mean logarithmic deviation of income . . . . . . . . 0.0062 0.0063 0.0063 0.0063 0.0054 0.0052 0.0051 0.0049 0.0058 0.0069 0.0067Theil . . . . . . . . . . . . . . . . . . . . . . . . . . . . . . . . . . . . . . 0.0001 0.0002 0.0001 0.0001 0.0001 0.0001 0.0002 0.0002 0.0001 0.0002 0.0002Atkinson: e=0.25 . . . . . . . . . . . . . . . . . . . . . . . . . . . . . . . . . . . 0.0011 0.0014 0.0013 0.0013 0.0012 0.0012 0.0014 0.0013 0.0013 0.0015 0.0016 e=0.50 . . . . . . . . . . . . . . . . . . . . . . . . . . . . . . . . . . . 0.0018 0.0021 0.0020 0.0020 0.0018 0.0020 0.0022 0.0021 0.0021 0.0023 0.0025 e=0.75 . . . . . . . . . . . . . . . . . . . . . . . . . . . . . . . . . . . 0.0024 0.0027 0.0026 0.0026 0.0024 0.0025 0.0027 0.0026 0.0027 0.0029 0.0030
See footnotes at end of table.

U.S. Census Bureau Income and Poverty in the United States: 2017 37
Table A-2. Selected Measures of Household Income Dispersion: 1967 to 2017—Con.(Income in 2017 CPI-U-RS adjusted dollars. Beginning with 2010, standard errors were calculated using replicate weights. For further explanation of income inequality measures, see “The Changing Shape of the Nation’s Income Distribution: 1947–1998,” Current Population Reports, Series P60-204. For information on confidentiality protection, sampling error, nonsampling error, and definitions, see www2.census.gov/programs-surveys/cps/techdocs/cpsmar18.pdf )
Measures of income dispersion 1996 19958 19949 199310 199211 1991 1990 1989 1988 198712
MEASUREHousehold Income at Selected Percentiles10th percentile limit . . . . . . . . . . . . . . . . . . . . . . . . 13,906 13,902 13,173 12,875 12,881 13,064 13,353 13,782 13,113 12,91020th percentile limit . . . . . . . . . . . . . . . . . . . . . . . . 23,049 23,073 22,031 21,722 21,639 22,162 22,802 23,153 22,739 22,35640th percentile limit . . . . . . . . . . . . . . . . . . . . . . . . 43,326 43,125 41,351 41,342 41,458 42,243 43,163 44,024 42,952 42,43450th (median) . . . . . . . . . . . . . . . . . . . . . . . . . . . . . . 55,394 54,600 52,942 52,334 52,615 53,025 54,621 55,329 54,390 53,94560th percentile limit . . . . . . . . . . . . . . . . . . . . . . . . 68,682 67,300 65,800 64,985 65,090 65,248 66,034 67,664 66,938 66,23980th percentile limit . . . . . . . . . . . . . . . . . . . . . . . . 106,154 104,349 103,116 101,013 99,622 99,902 100,702 102,807 101,074 100,10990th percentile limit . . . . . . . . . . . . . . . . . . . . . . . . 143,666 140,521 139,285 136,930 133,185 133,563 135,170 137,727 133,852 132,07195th percentile limit . . . . . . . . . . . . . . . . . . . . . . . . 186,571 181,061 180,206 175,289 170,058 169,675 172,835 175,619 171,090 167,517Household Income Ratios of
Selected Percentiles90th/10th . . . . . . . . . . . . . . . . . . . . . . . . . . . . . . . . . 10.33 10.11 10.57 10.64 10.34 10.22 10.12 9.99 10.21 10.2395th/20th . . . . . . . . . . . . . . . . . . . . . . . . . . . . . . . . . 8.09 7.85 8.18 8.07 7.86 7.66 7.58 7.59 7.52 7.4995th/50th . . . . . . . . . . . . . . . . . . . . . . . . . . . . . . . . . 3.37 3.32 3.40 3.35 3.23 3.20 3.16 3.17 3.15 3.1180th/50th . . . . . . . . . . . . . . . . . . . . . . . . . . . . . . . . . 1.92 1.91 1.95 1.93 1.89 1.88 1.84 1.86 1.86 1.8680th/20th . . . . . . . . . . . . . . . . . . . . . . . . . . . . . . . . . 4.61 4.52 4.68 4.65 4.60 4.51 4.42 4.44 4.45 4.4820th/50th . . . . . . . . . . . . . . . . . . . . . . . . . . . . . . . . . 0.42 0.42 0.42 0.42 0.41 0.42 0.42 0.42 0.42 0.41Mean Household Income of QuintilesLowest quintile . . . . . . . . . . . . . . . . . . . . . . . . . . . . . 13,415 13,371 12,658 12,328 12,462 12,719 13,072 13,387 12,916 12,693Second quintile . . . . . . . . . . . . . . . . . . . . . . . . . . . . 32,927 32,682 31,545 31,252 31,224 31,946 32,889 33,307 32,598 32,258Third quintile. . . . . . . . . . . . . . . . . . . . . . . . . . . . . . . 55,385 54,648 53,141 52,386 52,606 53,064 54,325 55,365 54,522 53,933Fourth quintile . . . . . . . . . . . . . . . . . . . . . . . . . . . . . 85,719 84,007 82,694 81,412 80,754 80,890 81,906 83,748 82,417 81,521Highest quintile . . . . . . . . . . . . . . . . . . . . . . . . . . . . 180,288 175,310 173,846 169,616 156,473 155,114 158,951 163,711 157,344 155,033 Top 5 percent . . . . . . . . . . . . . . . . . . . . . . . . . . . . 314,053 302,561 300,359 291,118 248,352 242,069 253,112 264,500 248,155 244,255Shares of Household Income of QuintilesLowest quintile . . . . . . . . . . . . . . . . . . . . . . . . . . . . . 3.6 3.7 3.6 3.6 3.8 3.8 3.8 3.8 3.8 3.8Second quintile . . . . . . . . . . . . . . . . . . . . . . . . . . . . 9.0 9.1 8.9 9.0 9.4 9.6 9.6 9.5 9.6 9.6Third quintile. . . . . . . . . . . . . . . . . . . . . . . . . . . . . . . 15.1 15.2 15.0 15.1 15.8 15.9 15.9 15.8 16.0 16.1Fourth quintile . . . . . . . . . . . . . . . . . . . . . . . . . . . . . 23.3 23.3 23.4 23.5 24.2 24.2 24.0 24.0 24.2 24.3Highest quintile . . . . . . . . . . . . . . . . . . . . . . . . . . . . 49.0 48.7 49.1 48.9 46.9 46.5 46.6 46.8 46.3 46.2 Top 5 percent . . . . . . . . . . . . . . . . . . . . . . . . . . . . 21.4 21.0 21.2 21.0 18.6 18.1 18.5 18.9 18.3 18.2Summary MeasuresGini index of income inequality . . . . . . . . . . . . . . 0.455 0.450 0.456 0.454 0.433 0.428 0.428 0.431 0.426 0.426Mean logarithmic deviation of income . . . . . . . . 0.464 0.452 0.471 0.467 0.416 0.411 0.402 0.406 0.401 0.414Theil . . . . . . . . . . . . . . . . . . . . . . . . . . . . . . . . . . . . . . 0.389 0.378 0.387 0.385 0.323 0.313 0.317 0.324 0.314 0.311Atkinson: e=0.25 . . . . . . . . . . . . . . . . . . . . . . . . . . . . . . . . . . . 0.093 0.090 0.092 0.092 0.080 0.078 0.078 0.080 0.078 0.077 e=0.50 . . . . . . . . . . . . . . . . . . . . . . . . . . . . . . . . . . . 0.179 0.175 0.180 0.178 0.160 0.156 0.156 0.158 0.155 0.155 e=0.75 . . . . . . . . . . . . . . . . . . . . . . . . . . . . . . . . . . . 0.266 0.261 0.268 0.266 0.242 0.237 0.236 0.239 0.236 0.238STANDARD ERRORHousehold Income at Selected Percentiles10th percentile limit . . . . . . . . . . . . . . . . . . . . . . . . 98 99 92 92 91 95 102 101 102 10120th percentile limit . . . . . . . . . . . . . . . . . . . . . . . . 140 130 128 131 131 136 140 144 142 14340th percentile limit . . . . . . . . . . . . . . . . . . . . . . . . 282 236 248 246 256 252 261 276 246 24650th (median) . . . . . . . . . . . . . . . . . . . . . . . . . . . . . . 279 316 241 245 249 255 279 304 266 25560th percentile limit . . . . . . . . . . . . . . . . . . . . . . . . 359 296 305 360 328 276 275 304 350 29080th percentile limit . . . . . . . . . . . . . . . . . . . . . . . . 370 393 336 379 330 363 387 320 356 34490th percentile limit . . . . . . . . . . . . . . . . . . . . . . . . 665 609 615 479 440 479 518 831 543 47895th percentile limit . . . . . . . . . . . . . . . . . . . . . . . . 918 1,077 1,021 871 860 868 976 938 1,063 780Household Income Ratios of
Selected Percentiles90th/10th . . . . . . . . . . . . . . . . . . . . . . . . . . . . . . . . . 0.087 0.084 0.087 0.085 0.081 0.082 0.087 0.095 0.089 0.08895th/20th . . . . . . . . . . . . . . . . . . . . . . . . . . . . . . . . . 0.063 0.064 0.066 0.063 0.062 0.061 0.063 0.062 0.066 0.06095th/50th . . . . . . . . . . . . . . . . . . . . . . . . . . . . . . . . . 0.022 0.023 0.024 0.022 0.021 0.021 0.022 0.021 0.023 0.02080th/50th . . . . . . . . . . . . . . . . . . . . . . . . . . . . . . . . . 0.011 0.010 0.010 0.011 0.010 0.011 0.010 0.009 0.010 0.01080th/20th . . . . . . . . . . . . . . . . . . . . . . . . . . . . . . . . . 0.032 0.031 0.031 0.033 0.032 0.032 0.032 0.031 0.032 0.03320th/50th . . . . . . . . . . . . . . . . . . . . . . . . . . . . . . . . . 0.003 0.003 0.003 0.003 0.003 0.003 0.003 0.003 0.003 0.003Mean Household Income of QuintilesLowest quintile . . . . . . . . . . . . . . . . . . . . . . . . . . . . . 45 46 46 45 45 46 47 48 48 48Second quintile . . . . . . . . . . . . . . . . . . . . . . . . . . . . 44 43 43 44 45 44 46 46 46 46Third quintile. . . . . . . . . . . . . . . . . . . . . . . . . . . . . . . 55 53 53 52 52 51 51 54 54 54Fourth quintile . . . . . . . . . . . . . . . . . . . . . . . . . . . . . 80 80 82 80 76 76 77 78 76 77Highest quintile . . . . . . . . . . . . . . . . . . . . . . . . . . . . 1,086 1,022 1,026 1,025 568 542 598 660 599 588 Top 5 percent . . . . . . . . . . . . . . . . . . . . . . . . . . . . 5,097 4,756 4,787 4,846 2,027 1,924 2,180 2,490 2,252 2,306Shares of Household Income of QuintilesLowest quintile . . . . . . . . . . . . . . . . . . . . . . . . . . . . . 0.03 0.03 0.03 0.03 0.03 0.03 0.03 0.03 0.03 0.03Second quintile . . . . . . . . . . . . . . . . . . . . . . . . . . . . 0.06 0.07 0.07 0.07 0.07 0.07 0.07 0.07 0.07 0.07Third quintile. . . . . . . . . . . . . . . . . . . . . . . . . . . . . . . 0.11 0.11 0.11 0.11 0.12 0.12 0.12 0.12 0.12 0.12Fourth quintile . . . . . . . . . . . . . . . . . . . . . . . . . . . . . 0.17 0.17 0.17 0.17 0.18 0.18 0.18 0.18 0.18 0.19Highest quintile . . . . . . . . . . . . . . . . . . . . . . . . . . . . 0.35 0.35 0.36 0.36 0.35 0.34 0.35 0.35 0.35 0.35 Top 5 percent . . . . . . . . . . . . . . . . . . . . . . . . . . . . 0.45 0.44 0.45 0.45 0.38 0.37 0.39 0.40 0.38 0.41Summary MeasuresGini index of income inequality . . . . . . . . . . . . . . 0.0043 0.0043 0.0042 0.0042 0.0038 0.0038 0.0039 0.0040 0.0041 0.0038Mean logarithmic deviation of income . . . . . . . . 0.0064 0.0063 0.0061 0.0061 0.0055 0.0056 0.0053 0.0053 0.0055 0.0055Theil . . . . . . . . . . . . . . . . . . . . . . . . . . . . . . . . . . . . . . 0.0002 0.0002 0.0002 0.0002 0.0001 0.0001 0.0001 0.0001 0.0001 0.0001Atkinson: e=0.25 . . . . . . . . . . . . . . . . . . . . . . . . . . . . . . . . . . . 0.0016 0.0015 0.0015 0.0015 0.0007 0.0007 0.0007 0.0008 0.0008 0.0007 e=0.50 . . . . . . . . . . . . . . . . . . . . . . . . . . . . . . . . . . . 0.0024 0.0024 0.0023 0.0024 0.0013 0.0012 0.0013 0.0014 0.0014 0.0013 e=0.75 . . . . . . . . . . . . . . . . . . . . . . . . . . . . . . . . . . . 0.0030 0.0029 0.0028 0.0029 0.0019 0.0018 0.0018 0.0019 0.0020 0.0018
See footnotes at end of table.

38 Income and Poverty in the United States: 2017 U.S. Census Bureau
Table A-2. Selected Measures of Household Income Dispersion: 1967 to 2017—Con.(Income in 2017 CPI-U-RS adjusted dollars. Beginning with 2010, standard errors were calculated using replicate weights. For further explanation of income inequality measures, see “The Changing Shape of the Nation’s Income Distribution: 1947–1998,” Current Population Reports, Series P60-204. For information on confidentiality protection, sampling error, nonsampling error, and definitions, see www2.census.gov/programs-surveys/cps/techdocs/cpsmar18.pdf )
Measures of income dispersion 1986 198513 198414 1983 1982 1981 1980 197915 1978MEASUREHousehold Income at Selected Percentiles10th percentile limit . . . . . . . . . . . . . . . . . . . . . . . . 12,808 12,847 12,838 12,339 12,387 12,613 12,781 12,965 13,20620th percentile limit . . . . . . . . . . . . . . . . . . . . . . . . 21,940 21,658 21,408 21,005 20,559 20,824 21,240 22,108 21,84740th percentile limit . . . . . . . . . . . . . . . . . . . . . . . . 41,967 40,749 40,066 39,057 39,101 38,929 39,832 41,059 41,30850th (median) . . . . . . . . . . . . . . . . . . . . . . . . . . . . . . 53,309 51,455 50,511 49,021 49,368 49,502 50,301 51,990 52,08960th percentile limit . . . . . . . . . . . . . . . . . . . . . . . . 65,132 63,126 61,728 59,945 59,742 60,210 61,066 63,170 62,50180th percentile limit . . . . . . . . . . . . . . . . . . . . . . . . 98,455 94,941 93,247 90,593 89,087 89,017 89,412 91,592 90,90090th percentile limit . . . . . . . . . . . . . . . . . . . . . . . . 129,219 124,526 122,654 118,569 117,485 116,280 116,176 118,561 117,56795th percentile limit . . . . . . . . . . . . . . . . . . . . . . . . 165,096 156,871 154,360 149,047 147,058 143,258 143,892 148,001 145,420Household Income Ratios of
Selected Percentiles90th/10th . . . . . . . . . . . . . . . . . . . . . . . . . . . . . . . . . 10.09 9.69 9.55 9.61 9.48 9.22 9.09 9.14 8.9095th/20th . . . . . . . . . . . . . . . . . . . . . . . . . . . . . . . . . 7.52 7.24 7.21 7.10 7.15 6.88 6.77 6.69 6.6695th/50th . . . . . . . . . . . . . . . . . . . . . . . . . . . . . . . . . 3.10 3.05 3.06 3.04 2.98 2.89 2.86 2.85 2.7980th/50th . . . . . . . . . . . . . . . . . . . . . . . . . . . . . . . . . 1.85 1.85 1.85 1.85 1.80 1.80 1.78 1.76 1.7580th/20th . . . . . . . . . . . . . . . . . . . . . . . . . . . . . . . . . 4.49 4.38 4.36 4.31 4.33 4.27 4.21 4.14 4.1620th/50th . . . . . . . . . . . . . . . . . . . . . . . . . . . . . . . . . 0.41 0.42 0.42 0.43 0.42 0.42 0.42 0.43 0.42Mean Household Income of QuintilesLowest quintile . . . . . . . . . . . . . . . . . . . . . . . . . . . . . 12,363 12,231 12,250 11,860 11,723 11,943 12,242 12,652 12,742Second quintile . . . . . . . . . . . . . . . . . . . . . . . . . . . . 31,803 30,995 30,511 29,793 29,666 29,752 30,468 31,470 31,294Third quintile. . . . . . . . . . . . . . . . . . . . . . . . . . . . . . . 53,219 51,448 50,563 49,258 49,106 49,286 50,276 51,885 51,671Fourth quintile . . . . . . . . . . . . . . . . . . . . . . . . . . . . . 80,172 77,390 76,130 73,918 73,032 73,469 74,069 76,142 75,692Highest quintile . . . . . . . . . . . . . . . . . . . . . . . . . . . . 151,746 144,559 139,986 135,713 133,947 131,237 132,065 136,646 135,136 Top 5 percent . . . . . . . . . . . . . . . . . . . . . . . . . . . . 237,720 222,992 211,313 205,049 202,397 195,018 197,354 208,401 205,694Shares of Household Income of QuintilesLowest quintile . . . . . . . . . . . . . . . . . . . . . . . . . . . . . 3.8 3.9 4.0 4.0 4.0 4.1 4.2 4.1 4.2Second quintile . . . . . . . . . . . . . . . . . . . . . . . . . . . . 9.7 9.8 9.9 9.9 10.0 10.1 10.2 10.2 10.2Third quintile. . . . . . . . . . . . . . . . . . . . . . . . . . . . . . . 16.2 16.2 16.3 16.4 16.5 16.7 16.8 16.8 16.8Fourth quintile . . . . . . . . . . . . . . . . . . . . . . . . . . . . . 24.3 24.4 24.6 24.6 24.5 24.8 24.7 24.6 24.7Highest quintile . . . . . . . . . . . . . . . . . . . . . . . . . . . . 46.1 45.6 45.2 45.1 45.0 44.3 44.1 44.2 44.1 Top 5 percent . . . . . . . . . . . . . . . . . . . . . . . . . . . . 18.0 17.6 17.1 17.0 17.0 16.5 16.5 16.9 16.8Summary MeasuresGini index of income inequality . . . . . . . . . . . . . . 0.425 0.419 0.415 0.414 0.412 0.406 0.403 0.404 0.402Mean logarithmic deviation of income . . . . . . . . 0.416 0.403 0.391 0.397 0.401 0.387 0.375 0.369 0.363Theil . . . . . . . . . . . . . . . . . . . . . . . . . . . . . . . . . . . . . . 0.310 0.300 0.290 0.288 0.287 0.277 0.274 0.279 0.275Atkinson: e=0.25 . . . . . . . . . . . . . . . . . . . . . . . . . . . . . . . . . . . 0.077 0.075 0.073 0.072 0.072 0.070 0.069 0.070 0.069 e=0.50 . . . . . . . . . . . . . . . . . . . . . . . . . . . . . . . . . . . 0.155 0.151 0.147 0.147 0.146 0.141 0.140 0.141 0.139 e=0.75 . . . . . . . . . . . . . . . . . . . . . . . . . . . . . . . . . . . 0.237 0.231 0.225 0.226 0.226 0.220 0.216 0.216 0.213STANDARD ERRORHousehold Income at Selected Percentiles10th percentile limit . . . . . . . . . . . . . . . . . . . . . . . . 103 98 97 99 98 148 145 145 14520th percentile limit . . . . . . . . . . . . . . . . . . . . . . . . 146 142 128 131 132 135 139 152 15240th percentile limit . . . . . . . . . . . . . . . . . . . . . . . . 248 235 246 214 223 234 241 250 22150th (median) . . . . . . . . . . . . . . . . . . . . . . . . . . . . . . 276 279 230 223 223 260 258 246 21160th percentile limit . . . . . . . . . . . . . . . . . . . . . . . . 268 303 282 263 274 304 250 262 28780th percentile limit . . . . . . . . . . . . . . . . . . . . . . . . 383 312 331 300 330 265 312 265 33590th percentile limit . . . . . . . . . . . . . . . . . . . . . . . . 589 529 421 523 450 436 494 477 39195th percentile limit . . . . . . . . . . . . . . . . . . . . . . . . 689 1,309 771 714 847 797 764 818 795Household Income Ratios of
Selected Percentiles90th/10th . . . . . . . . . . . . . . . . . . . . . . . . . . . . . . . . . 0.093 0.085 0.079 0.088 0.084 0.114 0.110 0.108 0.10295th/20th . . . . . . . . . . . . . . . . . . . . . . . . . . . . . . . . . 0.059 0.077 0.056 0.056 0.062 0.059 0.057 0.059 0.05995th/50th . . . . . . . . . . . . . . . . . . . . . . . . . . . . . . . . . 0.018 0.028 0.020 0.019 0.021 0.020 0.019 0.020 0.02080th/50th . . . . . . . . . . . . . . . . . . . . . . . . . . . . . . . . . 0.011 0.010 0.010 0.010 0.010 0.009 0.010 0.009 0.01080th/20th . . . . . . . . . . . . . . . . . . . . . . . . . . . . . . . . . 0.034 0.032 0.030 0.031 0.032 0.030 0.031 0.031 0.03320th/50th . . . . . . . . . . . . . . . . . . . . . . . . . . . . . . . . . 0.003 0.003 0.003 0.003 0.003 0.003 0.003 0.003 0.003Mean Household Income of QuintilesLowest quintile . . . . . . . . . . . . . . . . . . . . . . . . . . . . . 47 48 47 47 49 49 48 51 52Second quintile . . . . . . . . . . . . . . . . . . . . . . . . . . . . 45 44 43 42 44 42 45 47 48Third quintile. . . . . . . . . . . . . . . . . . . . . . . . . . . . . . . 54 52 52 49 49 52 51 54 55Fourth quintile . . . . . . . . . . . . . . . . . . . . . . . . . . . . . 75 74 74 70 69 67 68 69 69Highest quintile . . . . . . . . . . . . . . . . . . . . . . . . . . . . 555 505 444 430 431 405 437 486 484 Top 5 percent . . . . . . . . . . . . . . . . . . . . . . . . . . . . 1,923 1,725 1,408 1,326 1,356 1,277 1,485 1,589 1,570Shares of Household Income of QuintilesLowest quintile . . . . . . . . . . . . . . . . . . . . . . . . . . . . . 0.03 0.03 0.03 0.03 0.03 0.03 0.03 0.03 0.04Second quintile . . . . . . . . . . . . . . . . . . . . . . . . . . . . 0.07 0.08 0.08 0.08 0.08 0.08 0.08 0.08 0.09Third quintile. . . . . . . . . . . . . . . . . . . . . . . . . . . . . . . 0.12 0.13 0.13 0.13 0.13 0.13 0.14 0.14 0.14Fourth quintile . . . . . . . . . . . . . . . . . . . . . . . . . . . . . 0.19 0.19 0.19 0.19 0.20 0.20 0.20 0.20 0.21Highest quintile . . . . . . . . . . . . . . . . . . . . . . . . . . . . 0.35 0.35 0.35 0.36 0.36 0.35 0.35 0.36 0.37 Top 5 percent . . . . . . . . . . . . . . . . . . . . . . . . . . . . 0.37 0.37 0.36 0.36 0.36 0.35 0.36 0.35 0.35Summary MeasuresGini index of income inequality . . . . . . . . . . . . . . 0.0038 0.0037 0.0037 0.0037 0.0038 0.0038 0.0036 0.0038 0.0039Mean logarithmic deviation of income . . . . . . . . 0.0057 0.0056 0.0055 0.0056 0.0057 0.0056 0.0051 0.0050 0.0054Theil . . . . . . . . . . . . . . . . . . . . . . . . . . . . . . . . . . . . . . 0.0001 0.0001 0.0001 0.0001 0.0001 0.0001 0.0001 0.0001 0.0001Atkinson: e=0.25 . . . . . . . . . . . . . . . . . . . . . . . . . . . . . . . . . . . 0.0007 0.0006 0.0006 0.0006 0.0006 0.0006 0.0006 0.0006 0.0006 e=0.50 . . . . . . . . . . . . . . . . . . . . . . . . . . . . . . . . . . . 0.0012 0.0011 0.0011 0.0011 0.0011 0.0011 0.0010 0.0011 0.0011 e=0.75 . . . . . . . . . . . . . . . . . . . . . . . . . . . . . . . . . . . 0.0018 0.0017 0.0016 0.0016 0.0017 0.0016 0.0016 0.0017 0.0016
See footnotes at end of table.

U.S. Census Bureau Income and Poverty in the United States: 2017 39
Table A-2. Selected Measures of Household Income Dispersion: 1967 to 2017—Con.(Income in 2017 CPI-U-RS adjusted dollars. Beginning with 2010, standard errors were calculated using replicate weights. For further explanation of income inequality measures, see “The Changing Shape of the Nation’s Income Distribution: 1947–1998,” Current Population Reports, Series P60-204. For information on confidentiality protection, sampling error, nonsampling error, and definitions, see www2.census.gov/programs-surveys/cps/techdocs/cpsmar18.pdf )
Measures of income dispersion 1977 197616 197517 197417, 18 1973 197219 197120 1970 1969 1968 196721
MEASUREHousehold Income at Selected Percentiles10th percentile limit . . . . . . . . . . . . . . . . . . . . . . . . 12,940 12,782 12,712 13,069 12,981 12,396 11,626 11,446 11,713 11,418 10,48920th percentile limit . . . . . . . . . . . . . . . . . . . . . . . . 21,187 21,232 20,771 21,849 21,744 21,282 20,567 20,835 21,192 20,576 19,30540th percentile limit . . . . . . . . . . . . . . . . . . . . . . . . 39,906 39,557 38,983 40,528 41,812 40,987 39,207 39,913 40,664 39,010 37,64450th (median) . . . . . . . . . . . . . . . . . . . . . . . . . . . . . . 50,148 49,833 49,020 50,338 51,984 50,955 48,862 49,342 49,728 47,946 45,96560th percentile limit . . . . . . . . . . . . . . . . . . . . . . . . 60,827 60,258 58,907 59,886 61,865 60,577 57,695 58,054 58,809 55,915 53,42980th percentile limit . . . . . . . . . . . . . . . . . . . . . . . . 88,680 86,695 84,580 86,914 89,073 86,703 82,267 82,827 82,396 78,565 76,19090th percentile limit . . . . . . . . . . . . . . . . . . . . . . . . 113,103 111,168 108,425 112,072 114,976 111,400 105,540 105,504 104,548 99,074 96,78195th percentile limit . . . . . . . . . . . . . . . . . . . . . . . . 140,409 137,486 133,470 137,567 143,164 139,539 130,642 130,926 129,225 122,913 122,264Household Income Ratios of
Selected Percentiles90th/10th . . . . . . . . . . . . . . . . . . . . . . . . . . . . . . . . . 8.74 8.70 8.53 8.58 8.86 8.99 9.08 9.22 8.93 8.68 9.2395th/20th . . . . . . . . . . . . . . . . . . . . . . . . . . . . . . . . . 6.63 6.48 6.43 6.30 6.58 6.56 6.35 6.28 6.10 5.97 6.3395th/50th . . . . . . . . . . . . . . . . . . . . . . . . . . . . . . . . . 2.80 2.76 2.72 2.73 2.75 2.74 2.67 2.65 2.60 2.56 2.6680th/50th . . . . . . . . . . . . . . . . . . . . . . . . . . . . . . . . . 1.77 1.74 1.73 1.73 1.71 1.70 1.68 1.68 1.66 1.64 1.6680th/20th . . . . . . . . . . . . . . . . . . . . . . . . . . . . . . . . . 4.19 4.08 4.07 3.98 4.10 4.07 4.00 3.98 3.89 3.82 3.9520th/50th . . . . . . . . . . . . . . . . . . . . . . . . . . . . . . . . . 0.42 0.43 0.42 0.43 0.42 0.42 0.42 0.42 0.43 0.43 0.42Mean Household Income of QuintilesLowest quintile . . . . . . . . . . . . . . . . . . . . . . . . . . . . . 12,323 12,382 12,085 12,511 12,556 11,997 11,323 11,254 11,452 11,183 10,296Second quintile . . . . . . . . . . . . . . . . . . . . . . . . . . . . 30,332 30,314 29,686 31,096 31,570 30,987 29,925 30,484 30,919 29,982 28,526Third quintile. . . . . . . . . . . . . . . . . . . . . . . . . . . . . . . 50,174 49,853 48,704 50,113 51,781 50,572 48,521 49,088 49,408 47,555 45,540Fourth quintile . . . . . . . . . . . . . . . . . . . . . . . . . . . . . 73,515 72,396 70,771 72,375 74,495 72,605 68,980 69,194 69,206 66,336 63,719Highest quintile . . . . . . . . . . . . . . . . . . . . . . . . . . . . 131,098 128,133 124,950 128,229 133,288 130,344 122,226 122,497 121,637 115,272 114,671 Top 5 percent . . . . . . . . . . . . . . . . . . . . . . . . . . . . 200,553 195,231 189,614 194,909 205,305 202,029 187,471 188,019 187,228 176,234 180,886Shares of Household Income of QuintilesLowest quintile . . . . . . . . . . . . . . . . . . . . . . . . . . . . . 4.2 4.3 4.3 4.3 4.2 4.1 4.1 4.1 4.1 4.2 4.0Second quintile . . . . . . . . . . . . . . . . . . . . . . . . . . . . 10.2 10.3 10.4 10.6 10.4 10.4 10.6 10.8 10.9 11.1 10.8Third quintile. . . . . . . . . . . . . . . . . . . . . . . . . . . . . . . 16.9 17.0 17.0 17.0 17.0 17.0 17.3 17.4 17.5 17.6 17.3Fourth quintile . . . . . . . . . . . . . . . . . . . . . . . . . . . . . 24.7 24.7 24.7 24.6 24.5 24.5 24.5 24.5 24.5 24.5 24.2Highest quintile . . . . . . . . . . . . . . . . . . . . . . . . . . . . 44.0 43.7 43.6 43.5 43.9 43.9 43.5 43.3 43.0 42.6 43.6 Top 5 percent . . . . . . . . . . . . . . . . . . . . . . . . . . . . 16.8 16.6 16.5 16.5 16.9 17.0 16.7 16.6 16.6 16.3 17.2Summary MeasuresGini index of income inequality . . . . . . . . . . . . . . 0.402 0.398 0.397 0.395 0.400 0.401 0.396 0.394 0.391 0.386 0.397Mean logarithmic deviation of income . . . . . . . . 0.364 0.361 0.361 0.352 0.355 0.370 0.370 0.370 0.357 0.356 0.380Theil . . . . . . . . . . . . . . . . . . . . . . . . . . . . . . . . . . . . . . 0.276 0.271 0.270 0.267 0.270 0.279 0.273 0.271 0.268 0.273 0.287Atkinson: e=0.25 . . . . . . . . . . . . . . . . . . . . . . . . . . . . . . . . . . . 0.069 0.068 0.067 0.067 0.068 0.070 0.068 0.068 0.067 0.067 0.071 e=0.50 . . . . . . . . . . . . . . . . . . . . . . . . . . . . . . . . . . . 0.139 0.137 0.136 0.134 0.136 0.140 0.138 0.138 0.135 0.135 0.143 e=0.75 . . . . . . . . . . . . . . . . . . . . . . . . . . . . . . . . . . . 0.213 0.211 0.210 0.207 0.210 0.216 0.214 0.214 0.209 0.208 0.220STANDARD ERRORHousehold Income at Selected Percentiles10th percentile limit . . . . . . . . . . . . . . . . . . . . . . . . 137 137 133 139 138 137 135 136 142 136 13520th percentile limit . . . . . . . . . . . . . . . . . . . . . . . . 148 149 154 184 183 184 179 186 190 186 18040th percentile limit . . . . . . . . . . . . . . . . . . . . . . . . 229 228 228 238 252 247 233 237 237 223 21250th (median) . . . . . . . . . . . . . . . . . . . . . . . . . . . . . . 188 185 199 193 198 194 189 181 184 173 16760th percentile limit . . . . . . . . . . . . . . . . . . . . . . . . 251 251 262 279 302 247 244 260 237 235 24580th percentile limit . . . . . . . . . . . . . . . . . . . . . . . . 259 299 357 247 287 336 401 215 225 254 30290th percentile limit . . . . . . . . . . . . . . . . . . . . . . . . 536 389 490 405 415 562 303 339 403 533 71495th percentile limit . . . . . . . . . . . . . . . . . . . . . . . . 687 793 719 908 653 878 525 650 800 551 521Household Income Ratios of
Selected Percentiles90th/10th . . . . . . . . . . . . . . . . . . . . . . . . . . . . . . . . . 0.102 0.099 0.097 0.096 0.100 0.109 0.107 0.115 0.113 0.115 0.13695th/20th . . . . . . . . . . . . . . . . . . . . . . . . . . . . . . . . . 0.056 0.059 0.059 0.068 0.063 0.070 0.060 0.064 0.066 0.060 0.06595th/50th . . . . . . . . . . . . . . . . . . . . . . . . . . . . . . . . . 0.018 0.020 0.019 0.022 0.018 0.021 0.016 0.017 0.020 0.016 0.01680th/50th . . . . . . . . . . . . . . . . . . . . . . . . . . . . . . . . . 0.009 0.010 0.010 0.009 0.010 0.010 0.011 0.008 0.008 0.009 0.01080th/20th . . . . . . . . . . . . . . . . . . . . . . . . . . . . . . . . . 0.032 0.032 0.035 0.036 0.037 0.038 0.040 0.037 0.036 0.036 0.04020th/50th . . . . . . . . . . . . . . . . . . . . . . . . . . . . . . . . . 0.003 0.004 0.004 0.004 0.004 0.004 0.004 0.004 0.004 0.004 0.004Mean Household Income of QuintilesLowest quintile . . . . . . . . . . . . . . . . . . . . . . . . . . . . . 52 51 50 54 54 53 54 56 53 56 51Second quintile . . . . . . . . . . . . . . . . . . . . . . . . . . . . 48 47 46 49 54 53 49 51 53 50 51Third quintile. . . . . . . . . . . . . . . . . . . . . . . . . . . . . . . 52 51 50 49 54 53 49 51 47 50 45Fourth quintile . . . . . . . . . . . . . . . . . . . . . . . . . . . . . 70 67 66 67 69 68 65 68 65 62 58Highest quintile . . . . . . . . . . . . . . . . . . . . . . . . . . . . 495 491 494 499 539 568 536 554 563 526 573 Top 5 percent . . . . . . . . . . . . . . . . . . . . . . . . . . . . 1,670 1,685 1,736 1,695 1,830 1,997 1,943 2,011 2,075 1,938 2,091Shares of Household Income of QuintilesLowest quintile . . . . . . . . . . . . . . . . . . . . . . . . . . . . . 0.04 0.04 0.04 0.04 0.04 0.04 0.04 0.04 0.04 0.04 0.04Second quintile . . . . . . . . . . . . . . . . . . . . . . . . . . . . 0.09 0.09 0.09 0.09 0.09 0.09 0.10 0.10 0.10 0.11 0.10Third quintile. . . . . . . . . . . . . . . . . . . . . . . . . . . . . . . 0.14 0.15 0.15 0.15 0.15 0.15 0.16 0.16 0.16 0.17 0.17Fourth quintile . . . . . . . . . . . . . . . . . . . . . . . . . . . . . 0.21 0.21 0.21 0.21 0.22 0.22 0.22 0.23 0.23 0.23 0.23Highest quintile . . . . . . . . . . . . . . . . . . . . . . . . . . . . 0.37 0.37 0.37 0.38 0.39 0.39 0.39 0.40 0.40 0.40 0.41 Top 5 percent . . . . . . . . . . . . . . . . . . . . . . . . . . . . 0.36 0.36 0.36 0.36 0.38 0.38 0.38 0.39 0.39 0.39 0.41Summary MeasuresGini index of income inequality . . . . . . . . . . . . . . 0.0039 0.0041 0.0056 0.0066 0.0040 0.0069 0.0063 0.0078 0.0066 0.0042 0.0044Mean logarithmic deviation of income . . . . . . . . 0.0054 0.0054 0.0059 0.0058 0.0057 0.0060 0.0061 0.0060 0.0058 0.0057 0.0060Theil . . . . . . . . . . . . . . . . . . . . . . . . . . . . . . . . . . . . . . 0.0001 0.0001 0.0001 0.0001 0.0001 0.0001 0.0001 0.0001 0.0001 0.0001 0.0001Atkinson: e=0.25 . . . . . . . . . . . . . . . . . . . . . . . . . . . . . . . . . . . 0.0006 0.0006 0.0007 0.0006 0.0007 0.0007 0.0007 0.0007 0.0008 0.0007 0.0008 e=0.50 . . . . . . . . . . . . . . . . . . . . . . . . . . . . . . . . . . . 0.0011 0.0011 0.0012 0.0011 0.0012 0.0013 0.0013 0.0013 0.0014 0.0012 0.0014 e=0.75 . . . . . . . . . . . . . . . . . . . . . . . . . . . . . . . . . . . 0.0017 0.0017 0.0018 0.0017 0.0017 0.0018 0.0019 0.0019 0.0020 0.0018 0.0020
See footnotes on next page.

40 Income and Poverty in the United States: 2017 U.S. Census Bureau
1 The 2014 CPS ASEC included redesigned questions for income and health insur-ance coverage. All of the approximately 98,000 addresses were eligible to receive the redesigned set of health insurance coverage questions. The redesigned income questions were implemented to a subsample of these 98,000 addresses using a prob-ability split panel design. Approximately 68,000 addresses were eligible to receive a set of income questions similar to those used in the 2013 CPS ASEC and the remaining 30,000 addresses were eligible to receive the redesigned income questions. The source of these 2013 estimates is the portion of the CPS ASEC sample which received the redesigned income questions, approximately 30,000 addresses.
2 The source of these 2013 estimates is the portion of the CPS ASEC sample which received the income questions consistent with the 2013 CPS ASEC, approximately 68,000 addresses.
3 Implementation of 2010 Census-based population controls.4 Medians are calculated using $2,500 income intervals. Beginning with 2009
income data, the Census Bureau expanded the upper income intervals used to calculate medians to $250,000 or more. Medians falling in the upper open-ended interval are plugged with “$250,000.” Before 2009, the upper open-ended interval was $100,000 and a plug of “$100,000” was used.
5 The 2004 data have been revised to reflect a correction to the weights in the 2005 CPS ASEC.
6 Implementation of a 28,000 household sample expansion.7 Implementation of 2000 Census-based population controls.8 Full implementation of 1990 Census-based sample design and metropolitan defi-
nitions, 7,000 household sample reduction, and revised editing of responses on race.9 Introduction of 1990 Census sample design.10 Data collection method changed from paper and pencil to computer-assisted
interviewing. In addition, the 1994 CPS ASEC was revised to allow for the coding of different income amounts on selected questionnaire items. Limits either increased or decreased in the following categories: earnings limits increased to $999,999; social security limits increased to $49,999; supplemental security income and public assis-tance limits increased to $24,999; veterans’ benefits limits increased to $99,999; and child support and alimony limits decreased to $49,999.
11 Implementation of 1990 Census population controls.12 Implementation of a new CPS ASEC processing system.13 Recording of amounts for earnings from longest job increased to $299,999. Full
implementation of 1980 Census-based sample design. 14 Implementation of Hispanic population weighting controls and introduction of
1980 Census-based sample design.15 Implementation of 1980 Census population controls. Questionnaire expanded
to allow the recording of up to 27 possible values from a list of 51 possible sources of income.
16 First year medians were derived using both Pareto and linear interpolation. Before this year, all medians were derived using linear interpolation.
17 Some of these estimates were derived using Pareto interpolation and may differ from published data, which were derived using linear interpolation.
18 Implementation of a new CPS ASEC processing system. Questionnaire expanded to ask 11 income questions.
19 Full implementation of 1970 Census-based sample design.20 Introduction of 1970 Census sample design and population controls.21 Implementation of a new CPS ASEC processing system. Source: U.S. Census Bureau, Current Population Survey, 1968 to 2018 Annual Social
and Economic Supplements.

U.S. Census Bureau Income and Poverty in the United States: 2017 41
Tab
le A
-3.
Sele
cted
Mea
sure
s o
f E
qui
vale
nce-
Ad
just
ed In
com
e D
isp
ersi
on:
19
67 t
o 2
017
(Beg
inni
ng w
ith
200
9, s
tand
ard
err
ors
wer
e ca
lcul
ated
usi
ng r
eplic
ate
wei
ght
s. F
or
furt
her
exp
lana
tio
n o
f in
com
e in
equa
lity
mea
sure
s, s
ee “
The
Cha
ngin
g S
hap
e o
f th
e N
atio
n’s
Inco
me
Dis
trib
utio
n: 1
94
7–19
98
,” C
urre
nt P
op
ulat
ion
Rep
ort
s, S
erie
s P
60
-20
4. F
or
info
rmat
ion
on
confi
den
tial
ity
pro
tect
ion,
sam
plin
g e
rro
r, no
nsam
plin
g e
rro
r, an
d
defi
niti
ons
, see
ww
w2.
cens
us.g
ov/p
rog
ram
s-su
rvey
s/cp
s/te
chd
ocs
/cp
smar
18.p
df )
Mea
sure
s o
f in
com
e d
isp
ersi
on
2017
2016
2015
2014
2013
120
132
2012
2011
2010
320
0920
0820
0720
0620
05M
EA
SUR
ES
Shar
es o
f E
qui
vale
nce-
Ad
just
ed
Inc
om
e o
f Q
uint
iles
Low
est
qui
ntile
...
....
....
....
....
....
....
..3.
53.
53.
43.
33.
43.
53.
43.
43.
43.
63.
73.
83.
83.
8S
eco
nd q
uint
ile .
....
....
....
....
....
....
...
9.0
9.1
9.0
9.0
8.8
9.1
9.0
9.0
9.2
9.3
9.4
9.5
9.4
9.5
Thi
rd q
uint
ile. .
. . .
. . .
. . .
. . .
. . .
. . .
. . .
. . .
. . .
. .
14.7
14.7
14.8
14.8
14.7
14.9
14.8
14.8
15.0
15.0
15.1
15.3
14.9
15.1
Fo
urth
qui
ntile
...
....
....
....
....
....
....
..22
.722
.522
.922
.922
.822
.922
.922
.823
.122
.922
.822
.922
.522
.6H
ighe
st q
uint
ile .
....
....
....
....
....
....
...
50.1
50.2
49.8
50.0
50.3
49.6
49.9
50.0
49.2
49.4
48.9
48.5
49.3
49.1
Sum
mar
y M
easu
res
Gin
i ind
ex o
f in
com
e in
equa
lity
...
....
....
...
0.46
30.
464
0.46
20.
464
0.46
70.
459
0.46
30.
463
0.45
60.
456
0.45
00.
444
0.45
20.
450
Mea
n lo
gar
ithm
ic d
evia
tio
n o
f in
com
e .
....
...
0.63
90.
629
0.62
30.
648
0.63
50.
620
0.62
90.
626
0.61
70.
605
0.56
80.
548
0.55
70.
571
The
il ..
....
....
....
....
....
....
....
....
....
0.39
70.
403
0.39
60.
397
0.40
90.
392
0.40
50.
404
0.38
20.
390
0.37
70.
368
0.39
30.
386
Atk
inso
n:
e=0.
25 ..
....
....
....
....
....
....
....
....
.0.
096
0.09
70.
096
0.09
60.
098
0.09
50.
097
0.09
70.
093
0.09
40.
091
0.08
90.
093
0.09
2
e=0.
50 ..
....
....
....
....
....
....
....
....
.0.
191
0.19
20.
190
0.19
20.
194
0.18
80.
192
0.19
10.
185
0.18
60.
180
0.17
50.
182
0.18
1
e=0.
75 ..
....
....
....
....
....
....
....
....
.0.
298
0.29
70.
295
0.30
10.
301
0.29
30.
298
0.29
70.
290
0.28
90.
278
0.27
10.
278
0.28
0
STA
ND
AR
D E
RR
OR
SSh
ares
of
Eq
uiva
lenc
e-A
dju
sted
I
nco
me
of
Qui
ntile
sLo
wes
t q
uint
ile .
....
....
....
....
....
....
....
0.07
0.03
0.04
0.03
0.06
0.04
0.03
0.03
0.03
0.03
0.04
0.04
0.04
0.04
Sec
ond
qui
ntile
...
....
....
....
....
....
....
.0.
080.
060.
060.
050.
090.
060.
050.
040.
050.
050.
090.
100.
090.
09T
hird
qui
ntile
. . .
. . .
. . .
. . .
. . .
. . .
. . .
. . .
. . .
. . .
.0.
110.
080.
070.
070.
120.
080.
070.
060.
060.
070.
150.
150.
150.
15F
our
th q
uint
ile .
....
....
....
....
....
....
....
0.14
0.10
0.08
0.09
0.16
0.11
0.10
0.09
0.08
0.09
0.23
0.23
0.23
0.23
Hig
hest
qui
ntile
...
....
....
....
....
....
....
.0.
330.
230.
200.
190.
370.
250.
210.
180.
180.
210.
490.
480.
490.
49
Sum
mar
y M
easu
res
Gin
i ind
ex o
f in
com
e in
equa
lity
...
....
....
...
0.00
30.
0023
0.00
210.
0020
0.00
390.
0026
0.00
220.
0019
0.00
190.
0021
0.00
180.
0018
0.00
180.
0018
Mea
n lo
gar
ithm
ic d
evia
tio
n o
f in
com
e .
....
...
0.01
50.
0077
0.00
710.
0076
0.01
230.
0083
0.00
720.
0073
0.00
800.
0069
0.00
430.
0042
0.00
420.
0043
The
il ..
....
....
....
....
....
....
....
....
....
0.00
90.
0057
0.00
520.
0054
0.01
110.
0067
0.00
620.
0053
0.00
480.
0053
0.00
010.
0001
0.00
010.
0001
Atk
inso
n:
e=0.
25 ..
....
....
....
....
....
....
....
....
.0.
002
0.00
110.
0011
0.00
110.
0021
0.00
130.
0012
0.00
100.
0010
0.00
110.
0007
0.00
080.
0009
0.00
09
e=0.
50 ..
....
....
....
....
....
....
....
....
.0.
003
0.00
190.
0018
0.00
170.
0034
0.00
220.
0019
0.00
160.
0016
0.00
170.
0012
0.00
120.
0014
0.00
13
e=0.
75 ..
....
....
....
....
....
....
....
....
.0.
004
0.00
250.
0024
0.00
240.
0044
0.00
280.
0024
0.00
220.
0023
0.00
230.
0015
0.00
160.
0017
0.00
17
See
fo
otn
ote
s at
end
of
tab
le.
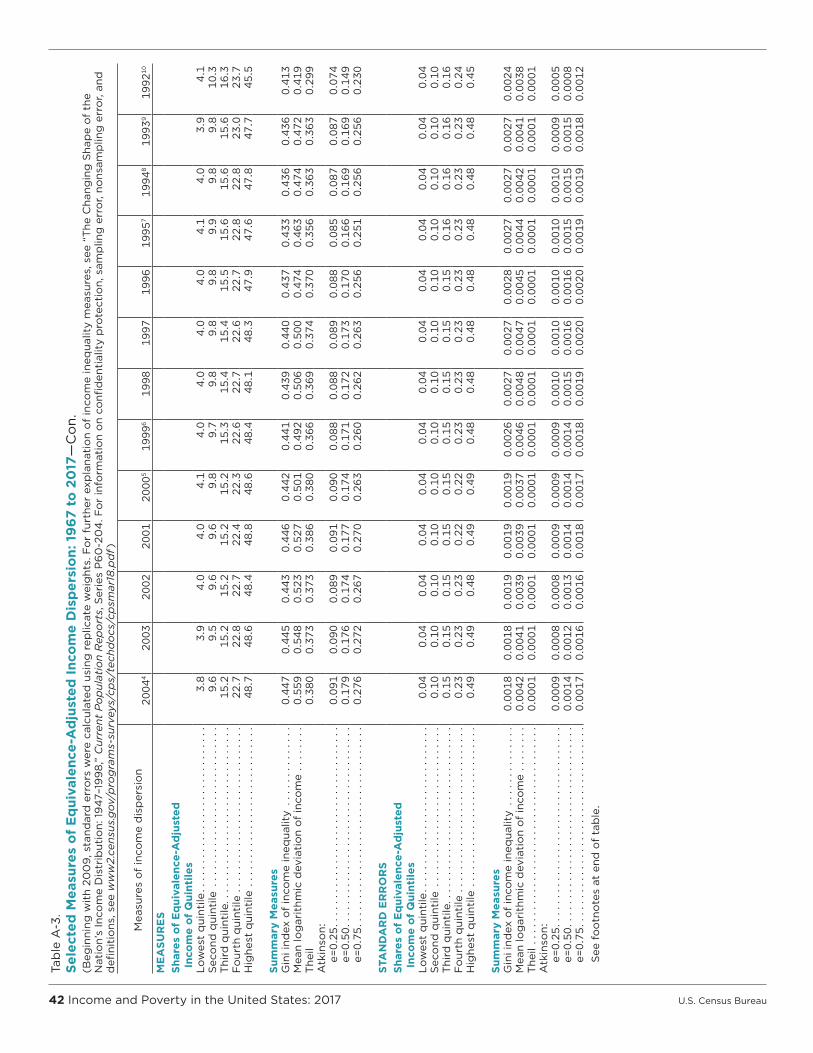
42 Income and Poverty in the United States: 2017 U.S. Census Bureau
Tab
le A
-3.
Sele
cted
Mea
sure
s o
f E
qui
vale
nce-
Ad
just
ed In
com
e D
isp
ersi
on:
19
67 t
o 2
017
—C
on.
(Beg
inni
ng w
ith
200
9, s
tand
ard
err
ors
wer
e ca
lcul
ated
usi
ng r
eplic
ate
wei
ght
s. F
or
furt
her
exp
lana
tio
n o
f in
com
e in
equa
lity
mea
sure
s, s
ee “
The
Cha
ngin
g S
hap
e o
f th
e N
atio
n’s
Inco
me
Dis
trib
utio
n: 1
94
7–19
98
,” C
urre
nt P
op
ulat
ion
Rep
ort
s, S
erie
s P
60
-20
4. F
or
info
rmat
ion
on
confi
den
tial
ity
pro
tect
ion,
sam
plin
g e
rro
r, no
nsam
plin
g e
rro
r, an
d
defi
niti
ons
, see
ww
w2.
cens
us.g
ov/p
rog
ram
s-su
rvey
s/cp
s/te
chd
ocs
/cp
smar
18.p
df )
Mea
sure
s o
f in
com
e d
isp
ersi
on
2004
420
0320
0220
0120
005
1999
619
9819
9719
9619
957
1994
819
939
1992
10
ME
ASU
RE
SSh
ares
of
Eq
uiva
lenc
e-A
dju
sted
I
nco
me
of
Qui
ntile
sLo
wes
t q
uint
ile .
....
....
....
....
....
....
....
3.8
3.9
4.0
4.0
4.1
4.0
4.0
4.0
4.0
4.1
4.0
3.9
4.1
Sec
ond
qui
ntile
...
....
....
....
....
....
....
.9.
69.
59.
69.
69.
89.
79.
89.
89.
89.
99.
89.
810
.3T
hird
qui
ntile
. . .
. . .
. . .
. . .
. . .
. . .
. . .
. . .
. . .
. . .
.15
.215
.215
.215
.215
.215
.315
.415
.415
.515
.615
.615
.616
.3F
our
th q
uint
ile .
....
....
....
....
....
....
....
22.7
22.8
22.7
22.4
22.3
22.6
22.7
22.6
22.7
22.8
22.8
23.0
23.7
Hig
hest
qui
ntile
...
....
....
....
....
....
....
.48
.748
.648
.448
.848
.648
.448
.148
.347
.947
.647
.847
.745
.5
Sum
mar
y M
easu
res
Gin
i ind
ex o
f in
com
e in
equa
lity
...
....
....
...
0.44
70.
445
0.44
30.
446
0.44
20.
441
0.43
90.
440
0.43
70.
433
0.43
60.
436
0.41
3M
ean
log
arit
hmic
dev
iati
on
of
inco
me
...
....
.0.
559
0.54
80.
523
0.52
70.
501
0.49
20.
506
0.50
00.
474
0.46
30.
474
0.47
20.
419
The
il0.
380
0.37
30.
373
0.38
60.
380
0.36
60.
369
0.37
40.
370
0.35
60.
363
0.36
30.
299
Atk
inso
n:
e=0.
25 ..
....
....
....
....
....
....
....
....
.0.
091
0.09
00.
089
0.09
10.
090
0.08
80.
088
0.08
90.
088
0.08
50.
087
0.08
70.
074
e=
0.50
....
....
....
....
....
....
....
....
...
0.17
90.
176
0.17
40.
177
0.17
40.
171
0.17
20.
173
0.17
00.
166
0.16
90.
169
0.14
9
e=0.
75 ..
....
....
....
....
....
....
....
....
.0.
276
0.27
20.
267
0.27
00.
263
0.26
00.
262
0.26
30.
256
0.25
10.
256
0.25
60.
230
STA
ND
AR
D E
RR
OR
SSh
ares
of
Eq
uiva
lenc
e-A
dju
sted
I
nco
me
of
Qui
ntile
sLo
wes
t q
uint
ile .
....
....
....
....
....
....
....
0.04
0.04
0.04
0.04
0.04
0.04
0.04
0.04
0.04
0.04
0.04
0.04
0.04
Sec
ond
qui
ntile
...
....
....
....
....
....
....
.0.
100.
100.
100.
100.
100.
100.
100.
100.
100.
100.
100.
100.
10T
hird
qui
ntile
. . .
. . .
. . .
. . .
. . .
. . .
. . .
. . .
. . .
. . .
.0.
150.
150.
150.
150.
150.
150.
150.
150.
150.
160.
160.
160.
16F
our
th q
uint
ile .
....
....
....
....
....
....
....
0.23
0.23
0.23
0.22
0.22
0.23
0.23
0.23
0.23
0.23
0.23
0.23
0.24
Hig
hest
qui
ntile
...
....
....
....
....
....
....
.0.
490.
490.
480.
490.
490.
480.
480.
480.
480.
480.
480.
480.
45
Sum
mar
y M
easu
res
Gin
i ind
ex o
f in
com
e in
equa
lity
...
....
....
...
0.00
180.
0018
0.00
190.
0019
0.00
190.
0026
0.00
270.
0027
0.00
280.
0027
0.00
270.
0027
0.00
24M
ean
log
arit
hmic
dev
iati
on
of
inco
me
...
....
.0.
0042
0.00
410.
0039
0.00
390.
0037
0.00
460.
0048
0.00
470.
0045
0.00
440.
0042
0.00
410.
0038
The
il ..
....
....
....
....
....
....
....
....
....
0.00
010.
0001
0.00
010.
0001
0.00
010.
0001
0.00
010.
0001
0.00
010.
0001
0.00
010.
0001
0.00
01A
tkin
son:
e=
0.25
....
....
....
....
....
....
....
....
...
0.00
090.
0008
0.00
080.
0009
0.00
090.
0009
0.00
100.
0010
0.00
100.
0010
0.00
100.
0009
0.00
05
e=0.
50 ..
....
....
....
....
....
....
....
....
.0.
0014
0.00
120.
0013
0.00
140.
0014
0.00
140.
0015
0.00
160.
0016
0.00
150.
0015
0.00
150.
0008
e=
0.75
....
....
....
....
....
....
....
....
...
0.00
170.
0016
0.00
160.
0018
0.00
170.
0018
0.00
190.
0020
0.00
200.
0019
0.00
190.
0018
0.00
12
See
fo
otn
ote
s at
end
of
tab
le.

U.S. Census Bureau Income and Poverty in the United States: 2017 43
Tab
le A
-3.
Sele
cted
Mea
sure
s o
f E
qui
vale
nce-
Ad
just
ed In
com
e D
isp
ersi
on:
19
67 t
o 2
017
—C
on.
(Beg
inni
ng w
ith
200
9, s
tand
ard
err
ors
wer
e ca
lcul
ated
usi
ng r
eplic
ate
wei
ght
s. F
or
furt
her
exp
lana
tio
n o
f in
com
e in
equa
lity
mea
sure
s, s
ee “
The
Cha
ngin
g S
hap
e o
f th
e N
atio
n’s
Inco
me
Dis
trib
utio
n: 1
94
7–19
98
,” C
urre
nt P
op
ulat
ion
Rep
ort
s, S
erie
s P
60
-20
4. F
or
info
rmat
ion
on
confi
den
tial
ity
pro
tect
ion,
sam
plin
g e
rro
r, no
nsam
plin
g e
rro
r, an
d
defi
niti
ons
, see
ww
w2.
cens
us.g
ov/p
rog
ram
s-su
rvey
s/cp
s/te
chd
ocs
/cp
smar
18.p
df )
Mea
sure
s o
f in
com
e d
isp
ersi
on
1991
1990
1989
1988
1987
1119
8619
8512
1984
1319
8319
8219
8119
8019
7914
ME
ASU
RE
SSh
ares
of
Eq
uiva
lenc
e-A
dju
sted
I
nco
mes
of
Qui
ntile
sLo
wes
t q
uint
ile .
....
....
....
....
....
....
...
4.3
4.4
4.4
4.4
4.4
4.5
4.6
4.6
4.6
4.7
5.0
5.2
5.3
Sec
ond
qui
ntile
...
....
....
....
....
....
....
10.6
10.6
10.5
10.7
10.8
10.8
10.9
11.0
11.0
11.1
11.4
11.6
11.7
Thi
rd q
uint
ile. .
. . .
. . .
. . .
. . .
. . .
. . .
. . .
. . .
. . .
.16
.516
.316
.316
.516
.716
.616
.716
.816
.917
.017
.217
.317
.2F
our
th q
uint
ile .
....
....
....
....
....
....
...
23.7
23.5
23.4
23.7
23.8
23.8
23.7
24.0
24.0
23.9
24.0
24.0
23.8
Hig
hest
qui
ntile
...
....
....
....
....
....
....
45.0
45.1
45.4
44.7
44.4
44.3
44.1
43.6
43.5
43.2
42.4
41.9
41.9
Sum
mar
y M
easu
res
Gin
i ind
ex o
f in
com
e in
equa
lity
...
....
....
..0.
406
0.40
60.
408
0.40
20.
399
0.39
70.
394
0.38
90.
389
0.38
40.
373
0.36
70.
366
Mea
n lo
gar
ithm
ic d
evia
tio
n o
f in
com
e .
....
..0.
402
0.38
80.
393
0.38
00.
381
0.37
50.
369
0.36
60.
373
0.37
00.
352
0.33
00.
322
The
il ..
....
....
....
....
....
....
....
....
...
0.28
90.
293
0.29
80.
285
0.28
10.
276
0.26
90.
261
0.26
00.
255
0.24
10.
234
0.23
4A
tkin
son:
e=
0.25
....
....
....
....
....
....
....
....
..0.
072
0.07
20.
073
0.07
00.
069
0.06
80.
067
0.06
50.
065
0.06
40.
060
0.05
80.
058
e=
0.50
....
....
....
....
....
....
....
....
..0.
144
0.14
40.
145
0.14
10.
139
0.13
70.
135
0.13
20.
132
0.12
90.
123
0.11
90.
118
e=
0.75
....
....
....
....
....
....
....
....
..0.
223
0.22
00.
222
0.21
60.
215
0.21
20.
208
0.20
50.
207
0.20
30.
194
0.18
60.
184
STA
ND
AR
D E
RR
OR
SSh
ares
of
Eq
uiva
lenc
e-A
dju
sted
I
nco
me
of
Qui
ntile
sLo
wes
t q
uint
ile .
....
....
....
....
....
....
...
0.04
0.04
0.04
0.04
0.04
0.05
0.05
0.05
0.05
0.05
0.05
0.05
0.05
Sec
ond
qui
ntile
...
....
....
....
....
....
....
0.11
0.11
0.11
0.11
0.11
0.11
0.11
0.11
0.11
0.11
0.11
0.12
0.12
Thi
rd q
uint
ile. .
. . .
. . .
. . .
. . .
. . .
. . .
. . .
. . .
. . .
.0.
160.
160.
160.
170.
170.
170.
170.
170.
170.
170.
170.
170.
17F
our
th q
uint
ile .
....
....
....
....
....
....
...
0.24
0.24
0.23
0.24
0.24
0.24
0.24
0.24
0.24
0.24
0.24
0.24
0.24
Hig
hest
qui
ntile
...
....
....
....
....
....
....
0.45
0.45
0.45
0.45
0.44
0.44
0.44
0.44
0.44
0.43
0.42
0.42
0.42
Sum
mar
y M
easu
res
Gin
i ind
ex o
f in
com
e in
equa
lity
...
....
....
..0.
0024
0.00
250.
0025
0.00
260.
0024
0.00
240.
0024
0.00
230.
0023
0.00
230.
0023
0.00
220.
0023
Mea
n lo
gar
ithm
ic d
evia
tio
n o
f in
com
e .
....
..0.
0037
0.00
350.
0035
0.00
360.
0035
0.00
350.
0035
0.00
350.
0035
0.00
360.
0035
0.00
310.
0030
The
il ..
....
....
....
....
....
....
....
....
...
0.00
010.
0001
0.00
010.
0001
0.00
010.
0001
0.00
010.
0001
0.00
010.
0001
0.00
010.
0001
0.00
01A
tkin
son:
e=
0.25
....
....
....
....
....
....
....
....
..0.
0004
0.00
050.
0005
0.00
060.
0005
0.00
040.
0004
0.00
040.
0004
0.00
040.
0004
0.00
030.
0004
e=
0.50
....
....
....
....
....
....
....
....
..0.
0008
0.00
090.
0009
0.00
100.
0008
0.00
080.
0007
0.00
070.
0007
0.00
070.
0007
0.00
060.
0007
e=
0.75
....
....
....
....
....
....
....
....
..0.
0012
0.00
120.
0013
0.00
130.
0012
0.00
110.
0011
0.00
110.
0011
0.00
110.
0011
0.00
100.
0010
S
ee f
oo
tno
tes
at e
nd o
f ta
ble
.

44 Income and Poverty in the United States: 2017 U.S. Census Bureau
Tab
le A
-3.
Sele
cted
Mea
sure
s o
f E
qui
vale
nce-
Ad
just
ed In
com
e D
isp
ersi
on:
19
67 t
o 2
017
—C
on.
(Beg
inni
ng w
ith
200
9, s
tand
ard
err
ors
wer
e ca
lcul
ated
usi
ng r
eplic
ate
wei
ght
s. F
or
furt
her
exp
lana
tio
n o
f in
com
e in
equa
lity
mea
sure
s, s
ee “
The
Cha
ngin
g S
hap
e o
f th
e N
atio
n’s
Inco
me
Dis
trib
utio
n: 1
94
7–19
98
,” C
urre
nt P
op
ulat
ion
Rep
ort
s, S
erie
s P
60
-20
4. F
or
info
rmat
ion
on
confi
den
tial
ity
pro
tect
ion,
sam
plin
g e
rro
r, no
nsam
plin
g e
rro
r, an
d
defi
niti
ons
, see
ww
w2.
cens
us.g
ov/p
rog
ram
s-su
rvey
s/cp
s/te
chd
ocs
/cp
smar
18.p
df )
Mea
sure
s o
f in
com
e d
isp
ersi
on
1978
1977
1976
1519
7516
1974
16, 1
719
7319
7218
1971
1919
7019
6919
6819
6720
ME
ASU
RE
SSh
ares
of
Eq
uiva
lenc
e-A
dju
sted
I
nco
mes
of
Qui
ntile
sLo
wes
t q
uint
ile .
....
....
....
....
....
....
....
5.4
5.5
5.6
5.6
5.8
5.6
5.6
5.7
5.7
5.8
5.8
5.6
Sec
ond
qui
ntile
...
....
....
....
....
....
....
.11
.811
.711
.811
.912
.112
.011
.912
.012
.112
.212
.312
.0T
hird
qui
ntile
. . .
. . .
. . .
. . .
. . .
. . .
. . .
. . .
. . .
. . .
.17
.317
.317
.417
.317
.317
.217
.217
.217
.317
.317
.417
.1F
our
th q
uint
ile .
....
....
....
....
....
....
....
23.7
23.7
23.8
23.6
23.6
23.5
23.4
23.4
23.4
23.4
23.4
23.2
Hig
hest
qui
ntile
...
....
....
....
....
....
....
.41
.841
.741
.541
.641
.241
.741
.941
.741
.541
.341
.142
.1
Sum
mar
y M
easu
res
Gin
i ind
ex o
f in
com
e in
equa
lity
...
....
....
...
0.36
30.
362
0.35
90.
359
0.35
40.
360
0.36
20.
359
0.35
70.
353
0.35
10.
362
Mea
n lo
gar
ithm
ic d
evia
tio
n o
f in
com
e .
....
...
0.31
50.
315
0.31
10.
306
0.29
50.
298
0.30
20.
300
0.29
90.
283
0.28
50.
303
The
il ..
....
....
....
....
....
....
....
....
....
0.23
10.
231
0.22
70.
227
0.22
10.
230
0.23
30.
229
0.22
80.
224
0.22
00.
238
Atk
inso
n:
e=0.
25 ..
....
....
....
....
....
....
....
....
.0.
057
0.05
70.
056
0.05
60.
055
0.05
70.
057
0.05
70.
056
0.05
50.
054
0.05
8
e=0.
50 ..
....
....
....
....
....
....
....
....
.0.
116
0.11
60.
113
0.11
40.
110
0.11
40.
115
0.11
30.
113
0.11
00.
109
0.11
6
e=0.
75 ..
....
....
....
....
....
....
....
....
.0.
180
0.18
00.
177
0.17
60.
171
0.17
60.
177
0.17
50.
175
0.16
90.
169
0.17
9
STA
ND
AR
D E
RR
OR
SSh
ares
of
Eq
uiva
lenc
e-A
dju
sted
I
nco
me
of
Qui
ntile
sLo
wes
t q
uint
ile .
....
....
....
....
....
....
....
0.05
0.05
0.06
0.06
0.06
0.06
0.06
0.06
0.06
0.06
0.06
0.06
Sec
ond
qui
ntile
...
....
....
....
....
....
....
.0.
120.
120.
120.
120.
120.
120.
120.
120.
120.
120.
120.
12T
hird
qui
ntile
. . .
. . .
. . .
. . .
. . .
. . .
. . .
. . .
. . .
. . .
.0.
170.
170.
170.
170.
170.
170.
170.
170.
170.
170.
170.
17F
our
th q
uint
ile .
....
....
....
....
....
....
....
0.24
0.24
0.24
0.24
0.24
0.23
0.23
0.23
0.23
0.23
0.23
0.23
Hig
hest
qui
ntile
...
....
....
....
....
....
....
.0.
420.
420.
410.
420.
410.
420.
420.
420.
420.
410.
410.
42
Sum
mar
y M
easu
res
Gin
i ind
ex o
f in
com
e in
equa
lity
...
....
....
...
0.00
230.
0023
0.00
240.
0024
0.00
260.
0027
0.00
290.
0028
0.00
350.
0062
0.00
700.
0025
Mea
n lo
gar
ithm
ic d
evia
tio
n o
f in
com
e .
....
...
0.00
320.
0032
0.00
320.
0034
0.00
330.
0032
0.00
330.
0032
0.00
310.
0030
0.00
300.
0031
The
il ..
....
....
....
....
....
....
....
....
....
0.00
010.
0001
0.00
010.
0001
0.00
010.
0001
0.00
010.
0001
0.00
010.
0001
0.00
010.
0001
Atk
inso
n:
e=0.
25 ..
....
....
....
....
....
....
....
....
.0.
0004
0.00
040.
0004
0.00
040.
0004
0.00
040.
0004
0.00
040.
0004
0.00
040.
0004
0.00
05
e=0.
50 ..
....
....
....
....
....
....
....
....
.0.
0007
0.00
070.
0007
0.00
070.
0007
0.00
070.
0007
0.00
070.
0007
0.00
080.
0007
0.00
08
e=0.
75 ..
....
....
....
....
....
....
....
....
.0.
0010
0.00
110.
0010
0.00
110.
0010
0.00
110.
0011
0.00
110.
0011
0.00
110.
0010
0.00
111 T
he 2
014
CP
S A
SE
C in
clud
ed r
edes
igne
d q
uest
ions
fo
r in
com
e an
d h
ealt
h in
sura
nce
cove
rag
e. A
ll o
f th
e ap
pro
xim
atel
y 9
8,0
00
ad
dre
sses
wer
e el
igib
le t
o r
ecei
ve t
he r
edes
igne
d s
et o
f he
alth
insu
ranc
e co
vera
ge
que
stio
ns. T
he r
edes
igne
d in
com
e q
uest
ions
wer
e im
ple
men
ted
to
a s
ubsa
mp
le o
f th
ese
98
,00
0 a
dd
ress
es u
sing
a p
rob
abili
ty s
plit
pan
el d
esig
n. A
pp
roxi
mat
ely
68
,00
0 a
dd
ress
es w
ere
elig
ible
to
rec
eive
a s
et o
f in
com
e q
uest
ions
sim
ilar
to t
hose
use
d in
the
20
13 C
PS
AS
EC
and
the
rem
aini
ng
30,0
00
ad
dre
sses
wer
e el
igib
le t
o r
ecei
ve t
he r
edes
igne
d in
com
e q
uest
ions
. The
so
urce
of
thes
e 20
13
esti
mat
es is
the
po
rtio
n o
f th
e C
PS
AS
EC
sam
ple
whi
ch r
ecei
ved
the
red
esig
ned
inco
me
que
stio
ns,
app
roxi
mat
ely
30,0
00
ad
dre
sses
.2
The
sour
ce o
f th
ese
2013
est
imat
es is
the
po
rtio
n o
f th
e C
PS
AS
EC
sam
ple
whi
ch r
ecei
ved
the
in
com
e q
uest
ions
co
nsis
tent
wit
h th
e 20
13 C
PS
AS
EC
, ap
pro
xim
atel
y 6
8,0
00
ad
dre
sses
.3
Imp
lem
enta
tio
n o
f 20
10 C
ensu
s-b
ased
po
pul
atio
n co
ntro
ls.
4 D
ata
have
bee
n re
vise
d t
o r
eflec
t a
corr
ecti
on
to t
he w
eig
hts
in t
he 2
00
5 C
PS
AS
EC
.5
Imp
lem
enta
tio
n o
f a
28,0
00
ho
useh
old
sam
ple
exp
ansi
on.
6 Im
ple
men
tati
on
of
200
0 C
ensu
s-b
ased
po
pul
atio
n co
ntro
ls.
7 F
ull i
mp
lem
enta
tio
n o
f 19
90
Cen
sus-
bas
ed s
amp
le d
esig
n an
d m
etro
po
litan
defi
niti
ons
, 7,0
00
ho
useh
old
sam
ple
red
ucti
on,
and
rev
ised
ed
itin
g o
f re
spo
nses
on
race
.8 In
tro
duc
tio
n o
f 19
90
Cen
sus
sam
ple
des
ign.
9 D
ata
colle
ctio
n m
etho
d c
hang
ed f
rom
pap
er a
nd p
enci
l to
co
mp
uter
-ass
iste
d in
terv
iew
ing
. In
add
itio
n, t
he 1
99
4 C
PS
AS
EC
was
rev
ised
to
allo
w f
or
the
cod
ing
of
diff
eren
t in
com
e am
oun
ts o
n se
lect
ed
que
stio
nnai
re it
ems.
Lim
its
eith
er in
crea
sed
or
dec
reas
ed in
the
fo
llow
ing
cat
ego
ries
: ear
ning
s lim
its
incr
ease
d t
o $
99
9,9
99
; so
cial
sec
urit
y lim
its
incr
ease
d t
o $
49
,99
9; s
upp
lem
enta
l sec
urit
y in
com
e an
d
pub
lic a
ssis
tanc
e lim
its
incr
ease
d t
o $
24,9
99
; vet
eran
s’ b
enefi
ts li
mit
s in
crea
sed
to
$9
9,9
99
; and
chi
ld
sup
po
rt a
nd a
limo
ny li
mit
s d
ecre
ased
to
$4
9,9
99
.10
Imp
lem
enta
tio
n o
f 19
90
Cen
sus
po
pul
atio
n co
ntro
ls.
11 Im
ple
men
tati
on
of
a ne
w C
PS
AS
EC
pro
cess
ing
sys
tem
.12 R
eco
rdin
g o
f am
oun
ts f
or
earn
ing
s fr
om
long
est
job
incr
ease
d t
o $
299
,99
9. F
ull i
mp
lem
enta
tio
n o
f 19
80
Cen
sus-
bas
ed s
amp
le d
esig
n.13 Im
ple
men
tati
on
of
His
pan
ic p
op
ulat
ion
wei
ght
ing
co
ntro
ls a
nd in
tro
duc
tio
n o
f 19
80
Cen
sus-
bas
ed
sam
ple
des
ign.
14 Im
ple
men
tati
on
of
198
0 C
ensu
s p
op
ulat
ion
cont
rols
. Que
stio
nnai
re e
xpan
ded
to
allo
w t
he
reco
rdin
g o
f up
to
27
po
ssib
le v
alue
s fr
om
a li
st o
f 51
po
ssib
le s
our
ces
of
inco
me.
15 F
irst
yea
r m
edia
ns w
ere
der
ived
usi
ng b
oth
Par
eto
and
line
ar in
terp
ola
tio
n. B
efo
re t
his
year
, all
med
ians
wer
e d
eriv
ed u
sing
line
ar in
terp
ola
tio
n.16 S
om
e o
f th
ese
esti
mat
es w
ere
der
ived
usi
ng P
aret
o in
terp
ola
tio
n an
d m
ay d
iffer
fro
m p
ublis
hed
d
ata
whi
ch w
ere
der
ived
usi
ng li
near
inte
rpo
lati
on.
17 Im
ple
men
tati
on
of
a ne
w C
PS
AS
EC
pro
cess
ing
sys
tem
. Que
stio
nnai
re e
xpan
ded
to
ask
11
inco
me
que
stio
ns.
18 F
ull i
mp
lem
enta
tio
n o
f 19
70 C
ensu
s-b
ased
sam
ple
des
ign.
19 In
tro
duc
tio
n o
f 19
70 C
ensu
s sa
mp
le d
esig
n an
d p
op
ulat
ion
cont
rols
.20
Imp
lem
enta
tio
n o
f a
new
CP
S A
SE
C p
roce
ssin
g s
yste
m.
So
urce
: U.S
. Cen
sus
Bur
eau,
Cur
rent
Po
pul
atio
n S
urve
y, 1
96
8 t
o 2
018
Ann
ual S
oci
al a
nd E
cono
mic
S
upp
lem
ents
.

U.S. Census Bureau Income and Poverty in the United States: 2017 45
Table A-4.Number and Real Median Earnings of Total Workers and Full-Time, Year-Round Workers by Sex and Female-to-Male Earnings Ratio: 1960 to 2017(Earnings in 2017 CPI-U-RS adjusted dollars. People 15 years and older beginning in 1980 and people 14 years and older as of the following year for previous years. Before 1989, earnings are for civilian workers only. Beginning with 2010, standard errors were calculated using replicate weights. Before 2010, standard errors were calculated using the generalized variance function. See Appendix C for more information. For information on confidentiality protection, sampling error, nonsampling error, and definitions, see www2.census.gov/programs-surveys/cps/techdocs/cpsmar18.pdf)
Year
Total workers Full-time, year-round workersMale Female Male Female
Female-to-
maleearnings
ratio
Number of workers
(thousands)
Median earnings (dollars)
Number of workers
(thousands)
Median earnings (dollars)
Number of workers
(thousands)
Median earnings (dollars)
Number of workers
(thousands)
Median earnings (dollars)
TotalWith
earningsEsti-
mate
Stan-dard error Total
With earnings
Esti-mate
Stan-dard error Total
With earnings
Esti-mate
Stan-dard error Total
With earnings
Esti-mate
Stan-dard error
2017 . . . . . . 88,140 88,101 44,408 746 78,260 78,196 31,610 104 66,397 66,379 52,146 137 49,308 49,293 41,977 126 0.8052016 . . . . . . 86,945 86,886 43,128 146 77,813 77,742 31,546 126 64,990 64,953 52,751 131 48,345 48,328 42,448 152 0.8052015 . . . . . . 86,466 86,435 43,058 145 77,066 76,974 31,295 111 63,891 63,887 52,988 141 47,232 47,211 42,155 151 0.7962014 . . . . . . 84,539 84,494 42,120 135 75,639 75,572 29,429 299 62,466 62,455 52,220 137 46,246 46,226 41,066 452 0.78620131 . . . . . 83,916 83,855 42,402 319 74,892 74,821 28,869 297 61,240 61,240 52,717 599 44,629 44,629 40,888 734 0.77620132 . . . . . 83,605 83,555 42,058 461 74,598 74,545 29,234 384 60,781 60,769 52,736 259 45,081 45,068 41,272 383 0.7832012 . . . . . . 83,070 83,003 40,556 443 74,252 74,188 28,754 147 59,028 59,009 52,838 500 44,059 44,042 40,422 386 0.7652011 . . . . . . 81,418 81,366 40,787 181 73,178 73,094 29,000 144 58,014 57,993 52,650 518 43,702 43,683 40,543 168 0.77020103 . . . . . 80,893 80,856 41,445 179 72,789 72,716 29,861 148 56,294 56,283 54,027 551 43,184 43,179 41,562 165 0.769
20094 . . . . . 81,979 81,934 41,610 135 73,063 72,972 29,812 107 56,072 56,053 53,975 168 43,253 43,217 41,549 120 0.7702008 . . . . . . 84,088 84,039 41,736 122 74,600 74,538 29,275 111 59,875 59,861 52,920 165 44,163 44,156 40,797 121 0.7712007 . . . . . . 84,532 84,482 43,418 126 74,382 74,295 30,670 108 63,000 62,984 53,466 178 45,640 45,613 41,602 121 0.7782006 . . . . . . 83,980 83,928 43,728 130 73,761 73,683 29,818 186 63,070 63,055 51,506 107 44,682 44,663 39,628 225 0.7692005 . . . . . . 82,987 82,934 43,221 354 72,544 72,476 29,034 180 61,515 61,500 52,075 113 43,369 43,351 40,086 102 0.77020045 . . . . . 81,503 81,448 42,257 209 72,016 71,930 28,953 103 60,103 60,088 53,072 117 42,414 42,380 40,640 103 0.7662003 . . . . . . 80,554 80,508 42,818 106 71,446 71,372 29,398 108 58,784 58,772 54,334 120 41,922 41,908 41,049 111 0.7552002 . . . . . . 80,548 80,500 43,242 112 71,500 71,411 29,280 102 58,774 58,761 53,875 333 41,900 41,876 41,269 109 0.7662001 . . . . . . 80,300 80,209 43,531 110 71,308 71,232 28,940 110 58,728 58,712 53,123 358 41,651 41,639 40,548 229 0.76320006 . . . . . 80,572 80,494 44,181 111 71,758 71,657 28,930 110 59,619 59,602 53,175 144 41,744 41,719 39,200 146 0.737
19997 . . . . . 79,360 79,322 44,393 214 71,153 71,053 27,215 239 58,318 58,299 53,709 201 40,890 40,871 38,839 167 0.7231998 . . . . . . 77,323 77,295 43,343 351 68,950 68,846 26,703 243 56,957 56,951 53,276 200 38,819 38,785 38,982 178 0.7321997 . . . . . . 76,731 76,694 41,009 186 67,851 67,736 25,537 165 54,933 54,909 51,444 490 37,715 37,683 38,152 237 0.7421996 . . . . . . 76,165 76,121 40,244 192 66,744 66,661 25,016 170 53,801 53,787 50,169 179 36,457 36,430 37,005 259 0.73819958 . . . . . 74,681 74,619 40,087 253 65,657 65,557 24,551 163 52,675 52,667 50,466 184 35,502 35,482 36,047 220 0.71419949 . . . . . 74,326 74,264 38,817 304 64,803 64,706 23,503 215 51,597 51,580 50,629 203 34,182 34,155 36,436 181 0.720199310 . . . . . 73,287 73,198 37,596 219 63,808 63,660 23,278 228 49,838 49,818 50,937 196 33,552 33,524 36,430 161 0.715199211 . . . . . 73,142 73,120 37,616 198 62,535 62,408 23,231 230 48,554 48,551 51,861 196 33,296 33,241 36,710 175 0.7081991 . . . . . . 72,064 72,040 38,471 194 61,959 61,796 22,677 220 47,987 47,888 51,784 389 32,491 32,436 36,176 172 0.6991990 . . . . . . 72,380 72,348 39,259 186 61,946 61,732 22,346 146 49,181 49,171 50,489 378 31,758 31,682 36,158 232 0.716
1989 . . . . . . 72,093 72,045 40,916 199 61,586 61,338 22,464 149 49,698 49,678 52,314 214 31,428 31,340 35,926 241 0.6871988 . . . . . . 70,496 70,467 41,178 226 60,873 60,658 22,167 158 48,303 48,285 53,253 234 31,334 31,237 35,173 252 0.660198712 . . . . . 69,624 69,545 41,022 300 59,557 59,359 21,981 145 47,048 47,013 53,707 224 29,982 29,912 35,005 164 0.6521986 . . . . . . 68,783 68,728 40,215 298 57,932 57,686 21,446 178 45,912 45,912 54,077 231 28,493 28,420 34,755 182 0.643198513 . . . . . 67,852 67,809 38,734 294 56,592 56,296 20,322 205 44,952 44,943 52,712 307 27,470 27,383 34,039 179 0.646198414 . . . . . 66,513 66,454 38,367 214 55,596 55,226 19,549 189 43,836 43,808 52,320 268 26,587 26,466 33,306 196 0.6371983 . . . . . . 65,216 65,138 37,724 207 53,413 53,108 19,317 141 41,548 41,528 51,359 235 25,288 25,166 32,661 200 0.6361982 . . . . . . 64,827 64,730 37,625 213 52,299 51,820 18,811 137 40,135 40,105 51,585 218 23,845 23,702 31,851 215 0.6171981 . . . . . . 65,362 65,233 39,087 223 52,504 51,940 18,743 135 41,811 41,773 52,580 184 23,488 23,329 31,146 130 0.5921980 . . . . . . 64,861 64,730 39,795 276 51,988 51,448 18,814 153 41,923 41,881 52,863 267 23,025 22,859 31,803 139 0.602
197915 . . . . . 64,769 64,648 40,894 275 51,462 50,897 18,877 161 42,469 42,437 53,736 212 22,248 22,082 32,060 164 0.5971978 . . . . . . 63,101 62,903 41,954 204 49,214 48,398 18,150 166 41,078 41,036 54,392 187 21,131 20,914 32,331 180 0.5941977 . . . . . . 61,959 61,704 40,782 211 47,333 46,194 17,270 151 39,325 39,263 54,043 255 19,544 19,238 31,843 144 0.589197616 . . . . . 60,703 60,450 40,464 185 45,659 44,565 16,875 157 38,214 38,184 52,854 208 18,372 18,073 31,814 157 0.602197517 . . . . . 59,509 59,268 40,188 216 43,725 42,926 16,422 174 37,316 37,267 52,999 208 17,738 17,452 31,173 158 0.588197417, 18 . . . 60,102 59,866 41,005 N 43,694 42,854 16,018 N N 37,916 53,332 229 N 16,945 31,335 153 0.5881973 . . . . . . 59,816 59,438 42,934 N 42,835 41,583 16,161 N 39,643 39,581 55,317 N 17,547 17,195 31,328 N 0.566197219 . . . . . 58,194 57,774 41,991 N 40,723 39,470 16,721 N 38,234 38,184 53,609 N 16,976 16,675 31,019 N 0.579197120 . . . . . 57,303 56,886 39,986 N 39,910 38,485 16,161 N 36,868 36,819 50,870 N 16,353 16,002 30,271 N 0.5951970 . . . . . . 56,265 55,821 40,405 N 39,682 38,273 15,423 N 36,193 36,132 50,653 N 15,805 15,476 30,072 N 0.594
1969 . . . . . . 55,700 55,273 40,896 N 39,060 37,737 15,199 N 37,055 37,008 48,768 N 15,678 15,374 29,502 N 0.6051968 . . . . . . 55,095 54,026 39,890 N 38,279 35,695 15,555 N 37,099 37,068 47,456 N 15,336 15,013 27,598 N 0.582196721 . . . . . 54,412 53,222 38,738 N 36,971 34,391 15,129 N 36,695 36,645 46,216 N 15,141 14,846 26,705 N 0.578196622 . . . . . 53,016 N 39,172 N 35,295 N 15,688 N N N 45,497 N N N 26,186 N 0.576196523 . . . . . N N 36,878 N N N 15,825 N N N 43,593 N N N 26,123 N 0.5991964 . . . . . . 51,978 N 36,523 N 33,146 N 14,828 N N N 42,980 N N N 25,422 N 0.5911963 . . . . . . 51,039 N 38,853 N 32,188 N 14,278 N N N 42,000 N N N 24,757 N 0.589196224 . . . . . 50,639 N 34,989 N 31,418 N 13,970 N N N 40,970 N N N 24,295 N 0.593196125 . . . . . 49,854 N 33,914 N 30,433 N 13,455 N N N 40,235 N N N 23,839 N 0.5921960 . . . . . . 50,033 N 32,686 N 30,585 N 13,285 N N N 38,991 N N N 23,657 N 0.607See footnotes on next page.

46 Income and Poverty in the United States: 2017 U.S. Census Bureau
N Not available.1 The 2014 CPS ASEC included redesigned questions for income and health
insurance coverage. All of the approximately 98,000 addresses were eligible to receive the redesigned set of health insurance coverage questions. The redesigned income questions were implemented to a subsample of the 98,000 addresses using a probability split panel design. Approximately 68,000 addresses were eligible to receive a set of income questions similar to those used in the 2013 CPS ASEC and the remaining 30,000 addresses were eligible to receive the redesigned income questions. The source of these 2013 estimates is the portion of the CPS ASEC sample which received the redesigned income questions, approximately 30,000 addresses.
2 The source of these 2013 estimates is the portion of the CPS ASEC sample which received the income questions consistent with the 2013 CPS ASEC, approximately 68,000 addresses.
3 Implementation of 2010 Census-based population controls.4 Medians are calculated using $2,500 income intervals. Beginning with 2009
income data, the Census Bureau expanded the upper income intervals used to calculate medians to $250,000 or more. Medians falling in the upper open-ended interval are plugged with “$250,000.” Before 2009, the upper open-ended interval was $100,000 and a plug of “$100,000” was used.
5 The 2004 data have been revised to reflect a correction to the weights in the 2005 CPS ASEC.
6 Implementation of a 28,000 household sample expansion.7 Implementation of 2000 Census-based population controls.8 Full implementation of 1990 Census-based sample design and metropolitan
definitions, 7,000 household sample reduction, and revised editing of responses on race.
9 Introduction of 1990 Census sample design.10 Data collection method changed from paper and pencil to computer-assisted
interviewing. In addition, the 1994 CPS ASEC was revised to allow for the coding of different income amounts on selected questionnaire items. Limits either increased or decreased in the following categories: earnings limits increased to $999,999; social security limits increased to $49,999; supplemental security income and public assistance limits increased to $24,999; veterans’ benefits limits increased to $99,999; and child support and alimony limits decreased to $49,999.
11 Implementation of 1990 Census population controls.12 Implementation of a new CPS ASEC processing system.13 Recording of amounts for earnings from longest job increased to $299,999. Full
implementation of 1980 Census-based sample design.14 Implementation of Hispanic population weighting controls and introduction of
1980 Census-based sample design.15 Implementation of 1980 Census population controls. Questionnaire expanded
to allow the recording of up to 27 possible values from a list of 51 possible sources of income.
16 First year medians were derived using both Pareto and linear interpolation. Before this year, all medians were derived using linear interpolation.
17 Some of these estimates were derived using Pareto interpolation and may differ from published data, which were derived using linear interpolation.
18 Implementation of a new CPS ASEC processing system. Questionnaire expanded to ask 11 income questions.
19 Full implementation of 1970 Census-based sample design.20 Introduction of 1970 Census sample design and population controls.21 Implementation of a new CPS ASEC processing system.22 Questionnaire expanded to ask eight income questions.23 Implementation of new procedures to impute missing data only.24 Full implementation of 1960 Census-based sample design and population
controls.25 Introduction of 1960 Census-based sample design. Implementation of first
hotdeck procedure to impute missing income entries.Source: U.S. Census Bureau, Current Population Survey, 1961 to 2018 Annual Social
and Economic Supplements.

U.S. Census Bureau Income and Poverty in the United States: 2017 47
APPENDIX B. ESTIMATES OF POVERTY
How Poverty Is Calculated
Following the Office of Management and Budget’s (OMB) Statistical Policy Directive 14, the U.S. Census Bureau uses a set of dollar value thresholds that vary by family size and composition to determine who is in poverty (see the matrix below).
If a family’s total money income is less than the applicable threshold, then that family and every individ-ual in it are considered in poverty. The official poverty thresholds are updated annually for inflation using the Consumer Price Index (CPI-U). The official poverty definition uses money income before taxes or tax credits and excludes capital gains and noncash benefits (such as Supplemental Nutrition Assistance Program benefits and housing assis-tance). The thresholds do not vary geographically.
Example: Suppose Family A consists of five people: two children, their mother, their father, and their great-aunt. Family A’s poverty threshold in 2017 is $29,986. Each member of Family A had the following income in 2017:
Mother $11,000 Father $9,000 Great-aunt $10,000 First child 0 Second child 0 Total: $30,000
Since their total family income, $30,000, was higher than their threshold ($29,986), Family A would not be considered “in poverty.”
While the thresholds, in some sense, represent the needs of families, they should be interpreted as a statistical yardstick rather than as a complete description of what people and fami-lies need to live. Many government assistance programs use different income eligibility cutoffs. While offi-cial poverty rates and the number of people or families in poverty are important, other poverty indicators are considered in the section “Depth of Poverty Measures” and another approach to setting thresholds and defining resources is discussed in the section “Supplemental Poverty Measure.”
For a history of the official poverty measure, see “Poverty: The History of the Official Poverty Measure” available at <www.census.gov/topics /income-poverty/poverty/about /history-of-the-poverty-measure .html> or “The Development of
the Orshansky Poverty Thresholds and Their Subsequent History as the Official U.S. Poverty Measure” by Gordon M. Fisher, available at <www.census.gov/hhes/povmeas /publications/orshansky.html>.
Weighted Average Thresholds: Since some data users want a summary of the 48 thresholds to get a general sense of the “poverty line,” the fol-lowing table provides the weighted average thresholds for 2017. The weighted average thresholds are based on the relative number of families of each size and composi-tion and are not used in computing poverty estimates.
Poverty Thresholds for 2017 by Size of Family and Number of Related Children Under 18 Years
(Dollars)
Size of family unitRelated children under 18 years
None One Two Three Four Five Six Seven Eight or
moreOne person (unrelated individual): Under age 65 . . . . . . . . . . . . . . . . . . 12,752 Aged 65 and older . . . . . . . . . . . . . . 11,756
Two people: Householder under age 65 . . . . . . 16,414 16,895 Householder aged 65 and older . . 14,816 16,831
Three people. . . . . . . . . . . . . . . . . . . . . 19,173 19,730 19,749Four people . . . . . . . . . . . . . . . . . . . . . 25,283 25,696 24,858 24,944Five people . . . . . . . . . . . . . . . . . . . . . . 30,490 30,933 29,986 29,253 28,805Six people . . . . . . . . . . . . . . . . . . . . . . . 35,069 35,208 34,482 33,787 32,753 32,140Seven people . . . . . . . . . . . . . . . . . . . . 40,351 40,603 39,734 39,129 38,001 36,685 35,242Eight people . . . . . . . . . . . . . . . . . . . . . 45,129 45,528 44,708 43,990 42,971 41,678 40,332 39,990Nine people or more . . . . . . . . . . . . . . 54,287 54,550 53,825 53,216 52,216 50,840 49,595 49,287 47,389
Source: U.S. Census Bureau.
Weighted Average Poverty Thresholds in 2017 by Size of Family(Dollars) One person 12,488 Two people 15,877 Three people 19,515 Four people 25,094 Five people 29,714 Six people 33,618 Seven people 38,173 Eight people 42,684 Nine people or more 50,681
Source: U.S. Census Bureau.

48 Income and Poverty in the United States: 2017 U.S. Census Bureau
Table B-1.Poverty Status of People by Family Relationship, Race, and Hispanic Origin: 1959 to 2017—Con.(Numbers in thousands. People as of March of the following year. For information on confidentiality protection, sampling error, nonsampling error, and definitions, see www2.census.gov/programs-surveys/cps/techdocs/cpsmar18.pdf )
Race, Hispanic origin, and year
All people People in families Unrelated individuals
Total
Below poverty All familiesFamilies with female
householder, no husband present
Total
Below poverty
Number Percent TotalBelow poverty
TotalBelow poverty
Number PercentNumber Percent Number PercentALL RACES2017 . . . . . . . . . . . . . . . . . . 322,549 39,698 12.3 260,709 26,766 10.3 47,999 13,378 27.9 60,786 12,593 20.72016 . . . . . . . . . . . . . . . . . . 319,911 40,616 12.7 259,863 27,762 10.7 48,243 13,914 28.8 58,839 12,336 21.02015 . . . . . . . . . . . . . . . . . . 318,454 43,123 13.5 258,121 29,893 11.6 48,497 14,719 30.4 58,988 12,671 21.52014 . . . . . . . . . . . . . . . . . . 315,804 46,657 14.8 256,308 32,615 12.7 48,019 15,905 33.1 57,937 13,374 23.120131 . . . . . . . . . . . . . . . . . 313,096 46,269 14.8 256,070 32,786 12.8 49,951 17,170 34.4 55,400 12,707 22.920132 . . . . . . . . . . . . . . . . . 312,965 45,318 14.5 254,988 31,530 12.4 47,007 15,606 33.2 56,564 13,181 23.3
2012 . . . . . . . . . . . . . . . . . . 310,648 46,496 15.0 252,863 33,198 13.1 47,085 15,957 33.9 56,185 12,558 22.42011 . . . . . . . . . . . . . . . . . . 308,456 46,247 15.0 252,316 33,126 13.1 48,103 16,451 34.2 54,517 12,416 22.820103 . . . . . . . . . . . . . . . . . 306,130 46,343 15.1 250,200 33,120 13.2 46,454 15,911 34.3 54,250 12,449 22.92009 . . . . . . . . . . . . . . . . . . 303,820 43,569 14.3 249,384 31,197 12.5 45,315 14,746 32.5 53,079 11,678 22.02008 . . . . . . . . . . . . . . . . . . 301,041 39,829 13.2 248,301 28,564 11.5 44,027 13,812 31.4 51,534 10,710 20.8
2007 . . . . . . . . . . . . . . . . . . 298,699 37,276 12.5 245,443 26,509 10.8 43,961 13,478 30.7 51,740 10,189 19.72006 . . . . . . . . . . . . . . . . . . 296,450 36,460 12.3 245,199 25,915 10.6 43,223 13,199 30.5 49,884 9,977 20.02005 . . . . . . . . . . . . . . . . . . 293,135 36,950 12.6 242,389 26,068 10.8 42,244 13,153 31.1 49,526 10,425 21.120044 . . . . . . . . . . . . . . . . . 290,617 37,040 12.7 240,754 26,544 11.0 42,053 12,832 30.5 48,609 9,926 20.42003 . . . . . . . . . . . . . . . . . . 287,699 35,861 12.5 238,903 25,684 10.8 41,311 12,413 30.0 47,594 9,713 20.4
2002 . . . . . . . . . . . . . . . . . . 285,317 34,570 12.1 236,921 24,534 10.4 40,529 11,657 28.8 47,156 9,618 20.42001 . . . . . . . . . . . . . . . . . . 281,475 32,907 11.7 233,911 23,215 9.9 39,261 11,223 28.6 46,392 9,226 19.920005 . . . . . . . . . . . . . . . . . 278,944 31,581 11.3 231,909 22,347 9.6 38,375 10,926 28.5 45,624 8,653 19.019996 . . . . . . . . . . . . . . . . . 276,208 32,791 11.9 230,789 23,830 10.3 38,580 11,764 30.5 43,977 8,400 19.11998 . . . . . . . . . . . . . . . . . . 271,059 34,476 12.7 227,229 25,370 11.2 39,000 12,907 33.1 42,539 8,478 19.9
1997 . . . . . . . . . . . . . . . . . . 268,480 35,574 13.3 225,369 26,217 11.6 38,412 13,494 35.1 41,672 8,687 20.81996 . . . . . . . . . . . . . . . . . . 266,218 36,529 13.7 223,955 27,376 12.2 38,584 13,796 35.8 40,727 8,452 20.81995 . . . . . . . . . . . . . . . . . . 263,733 36,425 13.8 222,792 27,501 12.3 38,908 14,205 36.5 39,484 8,247 20.91994 . . . . . . . . . . . . . . . . . . 261,616 38,059 14.5 221,430 28,985 13.1 37,253 14,380 38.6 38,538 8,287 21.51993 . . . . . . . . . . . . . . . . . . 259,278 39,265 15.1 219,489 29,927 13.6 37,861 14,636 38.7 38,038 8,388 22.1
19927 . . . . . . . . . . . . . . . . . 256,549 38,014 14.8 217,936 28,961 13.3 36,446 14,205 39.0 36,842 8,075 21.919918 . . . . . . . . . . . . . . . . . 251,192 35,708 14.2 212,723 27,143 12.8 34,795 13,824 39.7 36,845 7,773 21.11990 . . . . . . . . . . . . . . . . . . 248,644 33,585 13.5 210,967 25,232 12.0 33,795 12,578 37.2 36,056 7,446 20.71989 . . . . . . . . . . . . . . . . . . 245,992 31,528 12.8 209,515 24,066 11.5 32,525 11,668 35.9 35,185 6,760 19.219889 . . . . . . . . . . . . . . . . . 243,530 31,745 13.0 208,056 24,048 11.6 32,164 11,972 37.2 34,340 7,070 20.6
19879 . . . . . . . . . . . . . . . . . 240,982 32,221 13.4 206,877 24,725 12.0 31,893 12,148 38.1 32,992 6,857 20.81986 . . . . . . . . . . . . . . . . . . 238,554 32,370 13.6 205,459 24,754 12.0 31,152 11,944 38.3 31,679 6,846 21.61985 . . . . . . . . . . . . . . . . . . 236,594 33,064 14.0 203,963 25,729 12.6 30,878 11,600 37.6 31,351 6,725 21.51984 . . . . . . . . . . . . . . . . . . 233,816 33,700 14.4 202,288 26,458 13.1 30,844 11,831 38.4 30,268 6,609 21.81983 . . . . . . . . . . . . . . . . . . 231,700 35,303 15.2 201,338 27,933 13.9 30,049 12,072 40.2 29,158 6,740 23.1
1982 . . . . . . . . . . . . . . . . . . 229,412 34,398 15.0 200,385 27,349 13.6 28,834 11,701 40.6 27,908 6,458 23.11981 . . . . . . . . . . . . . . . . . . 227,157 31,822 14.0 198,541 24,850 12.5 28,587 11,051 38.7 27,714 6,490 23.41980 . . . . . . . . . . . . . . . . . . 225,027 29,272 13.0 196,963 22,601 11.5 27,565 10,120 36.7 27,133 6,227 22.91979 . . . . . . . . . . . . . . . . . . 222,903 26,072 11.7 195,860 19,964 10.2 26,927 9,400 34.9 26,170 5,743 21.91978 . . . . . . . . . . . . . . . . . . 215,656 24,497 11.4 191,071 19,062 10.0 26,032 9,269 35.6 24,585 5,435 22.1
1977 . . . . . . . . . . . . . . . . . . 213,867 24,720 11.6 190,757 19,505 10.2 25,404 9,205 36.2 23,110 5,216 22.61976 . . . . . . . . . . . . . . . . . . 212,303 24,975 11.8 190,844 19,632 10.3 24,204 9,029 37.3 21,459 5,344 24.91975 . . . . . . . . . . . . . . . . . . 210,864 25,877 12.3 190,630 20,789 10.9 23,580 8,846 37.5 20,234 5,088 25.11974 . . . . . . . . . . . . . . . . . . 209,362 23,370 11.2 190,436 18,817 9.9 23,165 8,462 36.5 18,926 4,553 24.11973 . . . . . . . . . . . . . . . . . . 207,621 22,973 11.1 189,361 18,299 9.7 21,823 8,178 37.5 18,260 4,674 25.6
1972 . . . . . . . . . . . . . . . . . . 206,004 24,460 11.9 189,193 19,577 10.3 21,264 8,114 38.2 16,811 4,883 29.01971 . . . . . . . . . . . . . . . . . . 204,554 25,559 12.5 188,242 20,405 10.8 20,153 7,797 38.7 16,311 5,154 31.61970 . . . . . . . . . . . . . . . . . . 202,183 25,420 12.6 186,692 20,330 10.9 19,673 7,503 38.1 15,491 5,090 32.91969 . . . . . . . . . . . . . . . . . . 199,517 24,147 12.1 184,891 19,175 10.4 17,995 6,879 38.2 14,626 4,972 34.01968 . . . . . . . . . . . . . . . . . . 197,628 25,389 12.8 183,825 20,695 11.3 18,048 6,990 38.7 13,803 4,694 34.0
1967 . . . . . . . . . . . . . . . . . . 195,672 27,769 14.2 182,558 22,771 12.5 17,788 6,898 38.8 13,114 4,998 38.11966 . . . . . . . . . . . . . . . . . . 193,388 28,510 14.7 181,117 23,809 13.1 17,240 6,861 39.8 12,271 4,701 38.31965 . . . . . . . . . . . . . . . . . . 191,413 33,185 17.3 179,281 28,358 15.8 16,371 7,524 46.0 12,132 4,827 39.81964 . . . . . . . . . . . . . . . . . . 189,710 36,055 19.0 177,653 30,912 17.4 N 7,297 44.4 12,057 5,143 42.71963 . . . . . . . . . . . . . . . . . . 187,258 36,436 19.5 176,076 31,498 17.9 N 7,646 47.7 11,182 4,938 44.2
1962 . . . . . . . . . . . . . . . . . . 184,276 38,625 21.0 173,263 33,623 19.4 N 7,781 50.3 11,013 5,002 45.41961 . . . . . . . . . . . . . . . . . . 181,277 39,628 21.9 170,131 34,509 20.3 N 7,252 48.1 11,146 5,119 45.91960 . . . . . . . . . . . . . . . . . . 179,503 39,851 22.2 168,615 34,925 20.7 N 7,247 48.9 10,888 4,926 45.21959 . . . . . . . . . . . . . . . . . . 176,557 39,490 22.4 165,858 34,562 20.8 N 7,014 49.4 10,699 4,928 46.1
See footnotes at end of table.

U.S. Census Bureau Income and Poverty in the United States: 2017 49
Table B-1.Poverty Status of People by Family Relationship, Race, and Hispanic Origin: 1959 to 2017—Con.(Numbers in thousands. People as of March of the following year. For information on confidentiality protection, sampling error, nonsampling error, and definitions, see www2.census.gov/programs-surveys/cps/techdocs/cpsmar18.pdf )
Race, Hispanic origin, and year
All people People in families Unrelated individuals
Total
Below poverty All familiesFamilies with female
householder, no husband present
Total
Below poverty
Number Percent TotalBelow poverty
TotalBelow poverty
Number PercentNumber Percent Number PercentWHITE ALONE10
2017 . . . . . . . . . . . . . . . . . . 247,272 26,436 10.7 199,462 17,386 8.7 29,019 7,473 25.8 47,005 8,779 18.72016 . . . . . . . . . . . . . . . . . . 245,985 27,113 11.0 199,330 18,022 9.0 29,420 7,793 26.5 45,643 8,661 19.02015 . . . . . . . . . . . . . . . . . . 245,536 28,566 11.6 198,571 19,444 9.8 29,396 8,205 27.9 45,963 8,717 19.02014 . . . . . . . . . . . . . . . . . . 244,253 31,089 12.7 197,607 21,072 10.7 29,134 8,680 29.8 45,409 9,476 20.920131 . . . . . . . . . . . . . . . . . 243,346 31,287 12.9 198,041 21,486 10.8 30,428 9,796 32.2 43,924 9,132 20.820132 . . . . . . . . . . . . . . . . . 243,085 29,936 12.3 197,001 19,944 10.1 28,795 8,404 29.2 44,998 9,544 21.2
2012 . . . . . . . . . . . . . . . . . . 242,147 30,816 12.7 196,378 21,328 10.9 28,707 8,691 30.3 44,509 8,940 20.12011 . . . . . . . . . . . . . . . . . . 241,334 30,849 12.8 196,709 21,456 10.9 29,636 8,999 30.4 43,295 8,809 20.320103 . . . . . . . . . . . . . . . . . 239,982 31,083 13.0 195,441 21,543 11.0 28,032 8,721 31.1 43,324 8,971 20.72009 . . . . . . . . . . . . . . . . . . 242,047 29,830 12.3 197,938 20,701 10.5 28,163 8,283 29.4 43,010 8,580 19.92008 . . . . . . . . . . . . . . . . . . 240,548 26,990 11.2 197,763 18,558 9.4 27,010 7,340 27.2 41,810 7,982 19.1
2007 . . . . . . . . . . . . . . . . . . 239,133 25,120 10.5 195,944 17,141 8.7 27,159 7,188 26.5 41,931 7,505 17.92006 . . . . . . . . . . . . . . . . . . 237,619 24,416 10.3 196,061 16,644 8.5 27,057 7,160 26.5 40,461 7,334 18.12005 . . . . . . . . . . . . . . . . . . 235,430 24,872 10.6 194,277 16,782 8.6 25,943 7,021 27.1 40,164 7,718 19.220044 . . . . . . . . . . . . . . . . . 233,741 25,327 10.8 193,024 17,445 9.0 26,139 6,892 26.4 39,712 7,416 18.72003 . . . . . . . . . . . . . . . . . . 231,866 24,272 10.5 192,074 16,740 8.7 25,536 6,530 25.6 38,913 7,225 18.62002 . . . . . . . . . . . . . . . . . . 230,376 23,466 10.2 190,823 16,043 8.4 24,903 5,992 24.1 38,575 7,105 18.4
WHITE11
2001 . . . . . . . . . . . . . . . . . . 229,675 22,739 9.9 190,413 15,369 8.1 24,619 5,972 24.3 38,294 6,996 18.320005 . . . . . . . . . . . . . . . . . 227,846 21,645 9.5 188,966 14,692 7.8 24,166 5,609 23.2 37,699 6,454 17.119996 . . . . . . . . . . . . . . . . . 225,361 22,169 9.8 187,833 15,353 8.2 23,913 5,947 24.9 36,441 6,411 17.61998 . . . . . . . . . . . . . . . . . . 222,837 23,454 10.5 186,184 16,549 8.9 24,211 6,674 27.6 35,563 6,386 18.01997 . . . . . . . . . . . . . . . . . . 221,200 24,396 11.0 185,147 17,258 9.3 23,773 7,296 30.7 34,858 6,593 18.9
1996 . . . . . . . . . . . . . . . . . . 219,656 24,650 11.2 184,119 17,621 9.6 23,744 7,073 29.8 34,247 6,463 18.91995 . . . . . . . . . . . . . . . . . . 218,028 24,423 11.2 183,450 17,593 9.6 23,732 7,047 29.7 33,399 6,336 19.01994 . . . . . . . . . . . . . . . . . . 216,460 25,379 11.7 182,546 18,474 10.1 22,713 7,228 31.8 32,569 6,292 19.31993 . . . . . . . . . . . . . . . . . . 214,899 26,226 12.2 181,330 18,968 10.5 23,224 7,199 31.0 32,112 6,443 20.119927 . . . . . . . . . . . . . . . . . 213,060 25,259 11.9 180,409 18,294 10.1 22,453 6,907 30.8 31,170 6,147 19.7
19918 . . . . . . . . . . . . . . . . . 210,133 23,747 11.3 177,619 17,268 9.7 21,608 6,806 31.5 31,207 5,872 18.81990 . . . . . . . . . . . . . . . . . . 208,611 22,326 10.7 176,504 15,916 9.0 20,845 6,210 29.8 30,833 5,739 18.61989 . . . . . . . . . . . . . . . . . . 206,853 20,785 10.0 175,857 15,179 8.6 20,362 5,723 28.1 29,993 5,063 16.919889 . . . . . . . . . . . . . . . . . 205,235 20,715 10.1 175,111 15,001 8.6 20,396 5,950 29.2 29,315 5,314 18.119879 . . . . . . . . . . . . . . . . . 203,605 21,195 10.4 174,488 15,593 8.9 20,244 5,989 29.6 28,290 5,174 18.3
1986 . . . . . . . . . . . . . . . . . . 202,282 22,183 11.0 174,024 16,393 9.4 20,163 6,171 30.6 27,143 5,198 19.21985 . . . . . . . . . . . . . . . . . . 200,918 22,860 11.4 172,863 17,125 9.9 20,105 5,990 29.8 27,067 5,299 19.61984 . . . . . . . . . . . . . . . . . . 198,941 22,955 11.5 171,839 17,299 10.1 19,727 5,866 29.7 26,094 5,181 19.91983 . . . . . . . . . . . . . . . . . . 197,496 23,984 12.1 171,407 18,377 10.7 19,256 6,017 31.2 25,206 5,189 20.61982 . . . . . . . . . . . . . . . . . . 195,919 23,517 12.0 170,748 18,015 10.6 18,374 5,686 30.9 24,300 5,041 20.7
1981 . . . . . . . . . . . . . . . . . . 194,504 21,553 11.1 169,868 16,127 9.5 18,795 5,600 29.8 23,913 5,061 21.21980 . . . . . . . . . . . . . . . . . . 192,912 19,699 10.2 168,756 14,587 8.6 17,642 4,940 28.0 23,370 4,760 20.41979 . . . . . . . . . . . . . . . . . . 191,742 17,214 9.0 168,461 12,495 7.4 17,349 4,375 25.2 22,587 4,452 19.71978 . . . . . . . . . . . . . . . . . . 186,450 16,259 8.7 165,193 12,050 7.3 16,877 4,371 25.9 21,257 4,209 19.81977 . . . . . . . . . . . . . . . . . . 185,254 16,416 8.9 165,385 12,364 7.5 16,721 4,474 26.8 19,869 4,051 20.4
1976 . . . . . . . . . . . . . . . . . . 184,165 16,713 9.1 165,571 12,500 7.5 15,941 4,463 28.0 18,594 4,213 22.71975 . . . . . . . . . . . . . . . . . . 183,164 17,770 9.7 165,661 13,799 8.3 15,577 4,577 29.4 17,503 3,972 22.71974 . . . . . . . . . . . . . . . . . . 182,376 15,736 8.6 166,081 12,181 7.3 15,433 4,278 27.7 16,295 3,555 21.81973 . . . . . . . . . . . . . . . . . . 181,185 15,142 8.4 165,424 11,412 6.9 14,303 4,003 28.0 15,761 3,730 23.71972 . . . . . . . . . . . . . . . . . . 180,125 16,203 9.0 165,630 12,268 7.4 13,739 3,770 27.4 14,495 3,935 27.1
1971 . . . . . . . . . . . . . . . . . . 179,398 17,780 9.9 165,184 13,566 8.2 13,502 4,099 30.4 14,214 4,214 29.61970 . . . . . . . . . . . . . . . . . . 177,376 17,484 9.9 163,875 13,323 8.1 13,226 3,761 28.4 13,500 4,161 30.81969 . . . . . . . . . . . . . . . . . . 175,349 16,659 9.5 162,779 12,623 7.8 12,285 3,577 29.1 12,570 4,036 32.11968 . . . . . . . . . . . . . . . . . . 173,732 17,395 10.0 161,777 13,546 8.4 12,190 3,551 29.1 11,955 3,849 32.21967 . . . . . . . . . . . . . . . . . . 172,038 18,983 11.0 160,720 14,851 9.2 12,131 3,453 28.5 11,318 4,132 36.5
1966 . . . . . . . . . . . . . . . . . . 170,247 19,290 11.3 159,561 15,430 9.7 12,261 3,646 29.7 10,686 3,860 36.11965 . . . . . . . . . . . . . . . . . . 168,732 22,496 13.3 158,255 18,508 11.7 11,573 4,092 35.4 10,477 3,988 38.11964 . . . . . . . . . . . . . . . . . . 167,313 24,957 14.9 156,898 20,716 13.2 N 3,911 33.4 10,415 4,241 40.71963 . . . . . . . . . . . . . . . . . . 165,309 25,238 15.3 155,584 21,149 13.6 N 4,051 35.6 9,725 4,089 42.0
1962 . . . . . . . . . . . . . . . . . . 162,842 26,672 16.4 153,348 22,613 14.7 N 4,089 37.9 9,494 4,059 42.71961 . . . . . . . . . . . . . . . . . . 160,306 27,890 17.4 150,717 23,747 15.8 N 4,062 37.6 9,589 4,143 43.21960 . . . . . . . . . . . . . . . . . . 158,863 28,309 17.8 149,458 24,262 16.2 N 4,296 39.0 9,405 4,047 43.01959 . . . . . . . . . . . . . . . . . . 156,956 28,484 18.1 147,802 24,443 16.5 N 4,232 40.2 9,154 4,041 44.1 See footnotes at end of table.

50 Income and Poverty in the United States: 2017 U.S. Census Bureau
Table B-1.Poverty Status of People by Family Relationship, Race, and Hispanic Origin: 1959 to 2017—Con.(Numbers in thousands. People as of March of the following year. For information on confidentiality protection, sampling error, nonsampling error, and definitions, see www2.census.gov/programs-surveys/cps/techdocs/cpsmar18.pdf )
Race, Hispanic origin, and year
All people People in families Unrelated individuals
Total
Below poverty All familiesFamilies with female
householder, no husband present
Total
Below poverty
Number Percent TotalBelow poverty
TotalBelow poverty
Number PercentNumber Percent Number PercentWHITE ALONE, NOT HISPANIC10
2017 . . . . . . . . . . . . . . . . . . 195,256 16,993 8.7 153,956 9,732 6.3 18,597 3,893 20.9 40,760 7,096 17.42016 . . . . . . . . . . . . . . . . . . 195,221 17,263 8.8 154,627 9,853 6.4 19,390 4,252 21.9 39,875 7,108 17.82015 . . . . . . . . . . . . . . . . . . 195,450 17,786 9.1 154,713 10,373 6.7 19,339 4,404 22.8 40,043 7,122 17.82014 . . . . . . . . . . . . . . . . . . 195,208 19,652 10.1 154,734 11,566 7.5 19,015 4,630 24.4 39,603 7,779 19.620131 . . . . . . . . . . . . . . . . . 195,118 19,552 10.0 155,965 11,688 7.5 19,141 5,123 26.8 38,256 7,492 19.620132 . . . . . . . . . . . . . . . . . 195,167 18,796 9.6 155,119 10,710 6.9 18,889 4,325 22.9 39,245 7,758 19.82012 . . . . . . . . . . . . . . . . . . 195,112 18,940 9.7 155,395 11,387 7.3 19,180 4,655 24.3 38,822 7,202 18.62011 . . . . . . . . . . . . . . . . . . 194,960 19,171 9.8 155,982 11,562 7.4 19,909 4,746 23.8 38,003 7,222 19.020103 . . . . . . . . . . . . . . . . . 194,783 19,251 9.9 155,723 11,509 7.4 18,914 4,689 24.8 38,211 7,351 19.22009 . . . . . . . . . . . . . . . . . . 197,164 18,530 9.4 158,646 11,211 7.1 19,033 4,532 23.8 37,757 6,946 18.42008 . . . . . . . . . . . . . . . . . . 196,940 17,024 8.6 159,344 10,138 6.4 18,799 4,046 21.5 36,848 6,539 17.72007 . . . . . . . . . . . . . . . . . . 196,583 16,032 8.2 158,703 9,553 6.0 19,179 4,099 21.4 36,909 6,155 16.72006 . . . . . . . . . . . . . . . . . . 196,049 16,013 8.2 159,572 9,676 6.1 19,349 4,353 22.5 35,642 6,021 16.92005 . . . . . . . . . . . . . . . . . . 195,553 16,227 8.3 159,204 9,604 6.0 18,899 4,278 22.6 35,626 6,393 17.920044 . . . . . . . . . . . . . . . . . 195,098 16,908 8.7 159,221 10,323 6.5 19,009 4,116 21.7 35,141 6,237 17.72003 . . . . . . . . . . . . . . . . . . 194,595 15,902 8.2 159,215 9,658 6.1 18,792 3,959 21.1 34,683 6,015 17.32002 . . . . . . . . . . . . . . . . . . 194,144 15,567 8.0 158,764 9,389 5.9 18,664 3,733 20.0 34,614 5,947 17.2WHITE, NOT HISPANIC11
2001 . . . . . . . . . . . . . . . . . . 194,538 15,271 7.8 159,178 9,122 5.7 18,365 3,661 19.9 34,603 5,882 17.020005 . . . . . . . . . . . . . . . . . 193,691 14,366 7.4 158,838 8,664 5.5 18,196 3,412 18.8 33,943 5,356 15.819996 . . . . . . . . . . . . . . . . . 192,565 14,735 7.7 158,550 9,013 5.7 17,892 3,545 19.8 33,189 5,412 16.31998 . . . . . . . . . . . . . . . . . . 192,754 15,799 8.2 159,301 10,061 6.3 18,547 4,074 22.0 32,573 5,352 16.41997 . . . . . . . . . . . . . . . . . . 191,859 16,491 8.6 158,796 10,401 6.5 18,474 4,604 24.9 32,049 5,632 17.6
1996 . . . . . . . . . . . . . . . . . . 191,459 16,462 8.6 159,044 10,553 6.6 18,597 4,339 23.3 31,410 5,455 17.41995 . . . . . . . . . . . . . . . . . . 190,951 16,267 8.5 159,402 10,599 6.6 18,340 4,183 22.8 30,586 5,303 17.31994 . . . . . . . . . . . . . . . . . . 192,543 18,110 9.4 161,254 12,118 7.5 18,186 4,743 26.1 30,157 5,500 18.21993 . . . . . . . . . . . . . . . . . . 190,843 18,882 9.9 160,062 12,756 8.0 18,508 4,724 25.5 29,681 5,570 18.819927 . . . . . . . . . . . . . . . . . 189,001 18,202 9.6 159,102 12,277 7.7 18,016 4,640 25.8 28,775 5,350 18.619918 . . . . . . . . . . . . . . . . . 189,116 17,741 9.4 158,850 11,998 7.6 17,609 4,710 26.7 29,215 5,261 18.01990 . . . . . . . . . . . . . . . . . . 188,129 16,622 8.8 158,394 11,086 7.0 17,160 4,284 25.0 28,688 5,002 17.41989 . . . . . . . . . . . . . . . . . . 186,979 15,599 8.3 158,127 10,723 6.8 16,827 3,922 23.3 28,055 4,466 15.919889 . . . . . . . . . . . . . . . . . 185,961 15,565 8.4 157,687 10,467 6.6 16,828 3,988 23.7 27,552 4,746 17.219879 . . . . . . . . . . . . . . . . . 184,936 16,029 8.7 157,785 11,051 7.0 16,787 4,075 24.3 26,439 4,613 17.41986 . . . . . . . . . . . . . . . . . . 184,119 17,244 9.4 157,665 12,078 7.7 16,739 4,350 26.0 25,525 4,668 18.31985 . . . . . . . . . . . . . . . . . . 183,455 17,839 9.7 157,106 12,706 8.1 16,749 4,136 24.7 25,544 4,789 18.71984 . . . . . . . . . . . . . . . . . . 182,469 18,300 10.0 156,930 13,234 8.4 16,742 4,193 25.0 24,671 4,659 18.91983 . . . . . . . . . . . . . . . . . . 181,393 19,538 10.8 156,719 14,437 9.2 16,369 4,448 27.2 23,894 4,746 19.91982 . . . . . . . . . . . . . . . . . . 181,903 19,362 10.6 157,818 14,271 9.0 15,830 4,161 26.3 23,329 4,701 20.21981 . . . . . . . . . . . . . . . . . . 180,909 17,987 9.9 157,330 12,903 8.2 16,323 4,222 25.9 22,950 4,769 20.81980 . . . . . . . . . . . . . . . . . . 179,798 16,365 9.1 156,633 11,568 7.4 15,358 3,699 24.1 22,455 4,474 19.91979 . . . . . . . . . . . . . . . . . . 178,814 14,419 8.1 156,567 10,009 6.4 15,410 3,371 21.9 21,638 4,179 19.31978 . . . . . . . . . . . . . . . . . . 174,731 13,755 7.9 154,321 9,798 6.3 15,132 3,390 22.4 20,410 3,957 19.41977 . . . . . . . . . . . . . . . . . . 173,563 13,802 8.0 154,449 9,977 6.5 14,888 3,429 23.0 19,114 3,825 20.01976 . . . . . . . . . . . . . . . . . . 173,235 14,025 8.1 155,324 10,066 6.5 14,261 3,516 24.7 17,912 3,959 22.11975 . . . . . . . . . . . . . . . . . . 172,417 14,883 8.6 155,539 11,137 7.2 13,809 3,570 25.9 16,879 3,746 22.21974 . . . . . . . . . . . . . . . . . . 171,463 13,217 7.7 155,764 9,854 6.3 13,763 3,379 24.6 15,699 3,364 21.41973 . . . . . . . . . . . . . . . . . . 170,488 12,864 7.5 155,330 9,262 6.0 12,731 3,185 25.0 15,158 3,602 23.8BLACK ALONE OR IN COMBINATION2017 . . . . . . . . . . . . . . . . . . 46,391 9,820 21.2 36,702 7,013 19.1 15,297 5,089 33.3 9,535 2,758 28.92016 . . . . . . . . . . . . . . . . . . 45,683 9,965 21.8 36,463 7,353 20.2 15,315 5,231 34.2 9,105 2,563 28.22015 . . . . . . . . . . . . . . . . . . 45,227 10,797 23.9 36,028 7,965 22.1 15,809 5,642 35.7 8,999 2,744 30.52014 . . . . . . . . . . . . . . . . . . 44,566 11,581 26.0 35,545 8,711 24.5 15,304 6,179 40.4 8,836 2,793 31.620131 . . . . . . . . . . . . . . . . . 44,154 11,162 25.3 35,958 8,533 23.7 16,188 6,277 38.8 8,045 2,588 32.220132 . . . . . . . . . . . . . . . . . 44,112 11,959 27.1 35,657 9,174 25.7 14,906 6,319 42.4 8,199 2,657 32.42012 . . . . . . . . . . . . . . . . . . 43,583 11,809 27.1 35,205 9,016 25.6 15,113 6,220 41.2 8,179 2,663 32.62011 . . . . . . . . . . . . . . . . . . 42,648 11,730 27.5 34,495 9,012 26.1 15,282 6,500 42.5 7,986 2,635 33.020103 . . . . . . . . . . . . . . . . . 42,385 11,597 27.4 34,347 8,891 25.9 15,362 6,269 40.8 7,730 2,587 33.52009 . . . . . . . . . . . . . . . . . . 40,876 10,575 25.9 33,330 8,184 24.6 14,463 5,755 39.8 7,368 2,285 31.02008 . . . . . . . . . . . . . . . . . . 40,097 9,882 24.6 32,818 7,768 23.7 14,332 5,782 40.3 7,123 2,042 28.72007 . . . . . . . . . . . . . . . . . . 39,564 9,668 24.4 32,427 7,668 23.6 14,396 5,702 39.6 7,036 1,968 28.02006 . . . . . . . . . . . . . . . . . . 39,013 9,447 24.2 32,130 7,411 23.1 13,848 5,422 39.2 6,715 1,935 28.82005 . . . . . . . . . . . . . . . . . . 38,551 9,517 24.7 31,663 7,459 23.6 14,080 5,524 39.2 6,754 2,003 29.720044 . . . . . . . . . . . . . . . . . 38,037 9,411 24.7 31,468 7,495 23.8 13,830 5,484 39.7 6,418 1,840 28.72003 . . . . . . . . . . . . . . . . . . 37,503 9,108 24.3 31,059 7,162 23.1 13,664 5,312 38.9 6,194 1,814 29.32002 . . . . . . . . . . . . . . . . . . 37,207 8,884 23.9 31,008 6,985 22.5 13,551 5,145 38.0 6,034 1,851 30.7 See footnotes at end of table.

U.S. Census Bureau Income and Poverty in the United States: 2017 51
Table B-1.Poverty Status of People by Family Relationship, Race, and Hispanic Origin: 1959 to 2017—Con.(Numbers in thousands. People as of March of the following year. For information on confidentiality protection, sampling error, nonsampling error, and definitions, see www2.census.gov/programs-surveys/cps/techdocs/cpsmar18.pdf )
Race, Hispanic origin, and year
All people People in families Unrelated individuals
Total
Below poverty All familiesFamilies with female
householder, no husband present
Total
Below poverty
Number Percent TotalBelow poverty
TotalBelow poverty
Number PercentNumber Percent Number PercentBLACK ALONE12
2017 . . . . . . . . . . . . . . . . . . 42,474 8,993 21.2 33,250 6,315 19.0 14,066 4,628 32.9 9,101 2,644 29.12016 . . . . . . . . . . . . . . . . . . 41,962 9,234 22.0 33,199 6,709 20.2 13,964 4,777 34.2 8,679 2,484 28.62015 . . . . . . . . . . . . . . . . . . 41,625 10,020 24.1 32,890 7,305 22.2 14,549 5,198 35.7 8,549 2,635 30.82014 . . . . . . . . . . . . . . . . . . 41,112 10,755 26.2 32,546 8,013 24.6 14,091 5,670 40.2 8,419 2,685 31.920131 . . . . . . . . . . . . . . . . . 40,498 10,186 25.2 32,658 7,665 23.5 14,838 5,759 38.8 7,717 2,483 32.220132 . . . . . . . . . . . . . . . . . 40,615 11,041 27.2 32,564 8,390 25.8 13,816 5,871 42.5 7,842 2,536 32.32012 . . . . . . . . . . . . . . . . . . 40,125 10,911 27.2 32,122 8,251 25.7 13,931 5,735 41.2 7,841 2,549 32.5
2011 . . . . . . . . . . . . . . . . . . 39,609 10,929 27.6 31,800 8,334 26.2 14,145 5,980 42.3 7,659 2,524 33.020103 . . . . . . . . . . . . . . . . . 39,283 10,746 27.4 31,596 8,181 25.9 14,236 5,831 41.0 7,419 2,479 33.42009 . . . . . . . . . . . . . . . . . . 38,556 9,944 25.8 31,306 7,642 24.4 13,680 5,427 39.7 7,102 2,209 31.12008 . . . . . . . . . . . . . . . . . . 37,966 9,379 24.7 30,986 7,339 23.7 13,648 5,533 40.5 6,835 1,970 28.82007 . . . . . . . . . . . . . . . . . . 37,665 9,237 24.5 30,778 7,312 23.8 13,741 5,459 39.7 6,807 1,898 27.9
2006 . . . . . . . . . . . . . . . . . . 37,306 9,048 24.3 30,621 7,072 23.1 13,244 5,180 39.1 6,545 1,897 29.02005 . . . . . . . . . . . . . . . . . . 36,802 9,168 24.9 30,154 7,164 23.8 13,481 5,303 39.3 6,521 1,949 29.920044 . . . . . . . . . . . . . . . . . 36,426 9,014 24.7 30,065 7,153 23.8 13,244 5,247 39.6 6,217 1,792 28.82003 . . . . . . . . . . . . . . . . . . 35,989 8,781 24.4 29,727 6,870 23.1 13,118 5,115 39.0 6,034 1,781 29.52002 . . . . . . . . . . . . . . . . . . 35,678 8,602 24.1 29,671 6,761 22.8 13,030 4,980 38.2 5,858 1,800 30.7
BLACK11
2001 . . . . . . . . . . . . . . . . . . 35,871 8,136 22.7 29,869 6,389 21.4 12,550 4,694 37.4 5,873 1,692 28.820005 . . . . . . . . . . . . . . . . . 35,425 7,982 22.5 29,378 6,221 21.2 12,383 4,774 38.6 5,885 1,702 28.919996 . . . . . . . . . . . . . . . . . 35,756 8,441 23.6 29,819 6,758 22.7 12,823 5,232 40.8 5,668 1,562 27.51998 . . . . . . . . . . . . . . . . . . 34,877 9,091 26.1 29,333 7,259 24.7 13,156 5,629 42.8 5,390 1,752 32.51997 . . . . . . . . . . . . . . . . . . 34,458 9,116 26.5 28,962 7,386 25.5 13,218 5,654 42.8 5,316 1,645 31.0
1996 . . . . . . . . . . . . . . . . . . 34,110 9,694 28.4 28,933 7,993 27.6 13,193 6,123 46.4 4,989 1,606 32.21995 . . . . . . . . . . . . . . . . . . 33,740 9,872 29.3 28,777 8,189 28.5 13,604 6,553 48.2 4,756 1,551 32.61994 . . . . . . . . . . . . . . . . . . 33,353 10,196 30.6 28,499 8,447 29.6 12,926 6,489 50.2 4,649 1,617 34.81993 . . . . . . . . . . . . . . . . . . 32,910 10,877 33.1 28,106 9,242 32.9 13,132 6,955 53.0 4,608 1,541 33.419927 . . . . . . . . . . . . . . . . . 32,411 10,827 33.4 27,790 9,134 32.9 12,591 6,799 54.0 4,410 1,569 35.6
19918 . . . . . . . . . . . . . . . . . 31,313 10,242 32.7 26,565 8,504 32.0 11,960 6,557 54.8 4,505 1,590 35.31990 . . . . . . . . . . . . . . . . . . 30,806 9,837 31.9 26,296 8,160 31.0 11,866 6,005 50.6 4,244 1,491 35.11989 . . . . . . . . . . . . . . . . . . 30,332 9,302 30.7 25,931 7,704 29.7 11,190 5,530 49.4 4,180 1,471 35.219889 . . . . . . . . . . . . . . . . . 29,849 9,356 31.3 25,484 7,650 30.0 10,794 5,601 51.9 4,095 1,509 36.819879 . . . . . . . . . . . . . . . . . 29,362 9,520 32.4 25,128 7,848 31.2 10,701 5,789 54.1 3,977 1,471 37.0
1986 . . . . . . . . . . . . . . . . . . 28,871 8,983 31.1 24,910 7,410 29.7 10,175 5,473 53.8 3,714 1,431 38.51985 . . . . . . . . . . . . . . . . . . 28,485 8,926 31.3 24,620 7,504 30.5 10,041 5,342 53.2 3,641 1,264 34.71984 . . . . . . . . . . . . . . . . . . 28,087 9,490 33.8 24,387 8,104 33.2 10,384 5,666 54.6 3,501 1,255 35.81983 . . . . . . . . . . . . . . . . . . 27,678 9,882 35.7 24,138 8,376 34.7 10,059 5,736 57.0 3,287 1,338 40.71982 . . . . . . . . . . . . . . . . . . 27,216 9,697 35.6 23,948 8,355 34.9 9,699 5,698 58.8 3,051 1,229 40.3
1981 . . . . . . . . . . . . . . . . . . 26,834 9,173 34.2 23,423 7,780 33.2 9,214 5,222 56.7 3,277 1,296 39.61980 . . . . . . . . . . . . . . . . . . 26,408 8,579 32.5 23,084 7,190 31.1 9,338 4,984 53.4 3,208 1,314 41.01979 . . . . . . . . . . . . . . . . . . 25,944 8,050 31.0 22,666 6,800 30.0 9,065 4,816 53.1 3,127 1,168 37.31978 . . . . . . . . . . . . . . . . . . 24,956 7,625 30.6 22,027 6,493 29.5 8,689 4,712 54.2 2,929 1,132 38.61977 . . . . . . . . . . . . . . . . . . 24,710 7,726 31.3 21,850 6,667 30.5 8,315 4,595 55.3 2,860 1,059 37.0
1976 . . . . . . . . . . . . . . . . . . 24,399 7,595 31.1 21,840 6,576 30.1 7,926 4,415 55.7 2,559 1,019 39.81975 . . . . . . . . . . . . . . . . . . 24,089 7,545 31.3 21,687 6,533 30.1 7,679 4,168 54.3 2,402 1,011 42.11974 . . . . . . . . . . . . . . . . . . 23,699 7,182 30.3 21,341 6,255 29.3 7,483 4,116 55.0 2,359 927 39.31973 . . . . . . . . . . . . . . . . . . 23,512 7,388 31.4 21,328 6,560 30.8 7,188 4,064 56.5 2,183 828 37.91972 . . . . . . . . . . . . . . . . . . 23,144 7,710 33.3 21,116 6,841 32.4 7,125 4,139 58.1 2,028 870 42.9
1971 . . . . . . . . . . . . . . . . . . 22,784 7,396 32.5 20,900 6,530 31.2 6,398 3,587 56.1 1,884 866 46.01970 . . . . . . . . . . . . . . . . . . 22,515 7,548 33.5 20,724 6,683 32.2 6,225 3,656 58.7 1,791 865 48.31969 . . . . . . . . . . . . . . . . . . 22,011 7,095 32.2 20,192 6,245 30.9 5,537 3,225 58.2 1,819 850 46.71968 . . . . . . . . . . . . . . . . . . 21,944 7,616 34.7 N 6,839 33.7 N 3,312 58.9 N 777 46.31967 . . . . . . . . . . . . . . . . . . 21,590 8,486 39.3 N 7,677 38.4 N 3,362 61.6 N 809 49.31966 . . . . . . . . . . . . . . . . . . 21,206 8,867 41.8 N 8,090 40.9 N 3,160 65.3 N 777 54.41959 . . . . . . . . . . . . . . . . . . 18,013 9,927 55.1 N 9,112 54.9 N 2,416 70.6 1,430 815 57.0 See footnotes at end of table.

52 Income and Poverty in the United States: 2017 U.S. Census Bureau
Table B-1.Poverty Status of People by Family Relationship, Race, and Hispanic Origin: 1959 to 2017—Con.(Numbers in thousands. People as of March of the following year. For information on confidentiality protection, sampling error, nonsampling error, and definitions, see www2.census.gov/programs-surveys/cps/techdocs/cpsmar18.pdf )
Race, Hispanic origin, and year
All people People in families Unrelated individuals
Total
Below poverty All familiesFamilies with female
householder, no husband present
Total
Below poverty
Number Percent TotalBelow poverty
TotalBelow poverty
Number PercentNumber Percent Number PercentASIAN ALONE OR IN COMBINATION2017 . . . . . . . . . . . . . . . . . . 21,511 2,104 9.8 18,484 1,379 7.5 2,086 338 16.2 2,963 720 24.32016 . . . . . . . . . . . . . . . . . . 20,756 2,062 9.9 17,856 1,287 7.2 1,931 365 18.9 2,858 761 26.62015 . . . . . . . . . . . . . . . . . . 20,037 2,234 11.1 17,183 1,361 7.9 1,675 254 15.2 2,762 839 30.42014 . . . . . . . . . . . . . . . . . . 19,685 2,268 11.5 16,964 1,479 8.7 1,994 355 17.8 2,621 754 28.820131 . . . . . . . . . . . . . . . . . 19,182 2,398 12.5 16,800 1,680 10.0 1,873 525 28.1 2,339 700 29.920132 . . . . . . . . . . . . . . . . . 19,023 1,974 10.4 16,642 1,305 7.8 1,923 323 16.8 2,333 660 28.32012 . . . . . . . . . . . . . . . . . . 18,173 2,072 11.4 15,751 1,467 9.3 1,756 374 21.3 2,334 580 24.8
2011 . . . . . . . . . . . . . . . . . . 17,813 2,189 12.3 15,591 1,550 9.9 1,847 411 22.2 2,133 614 28.820103 . . . . . . . . . . . . . . . . . 17,237 2,064 12.0 14,950 1,463 9.8 1,804 386 21.4 2,208 578 26.22009 . . . . . . . . . . . . . . . . . . 15,272 1,901 12.4 13,403 1,361 10.2 1,539 290 18.9 1,826 527 28.82008 . . . . . . . . . . . . . . . . . . 14,543 1,686 11.6 12,817 1,270 9.9 1,471 228 15.5 1,707 410 24.02007 . . . . . . . . . . . . . . . . . . 14,430 1,467 10.2 12,527 1,012 8.1 1,421 250 17.6 1,837 426 23.2
2006 . . . . . . . . . . . . . . . . . . 14,331 1,447 10.1 12,463 984 7.9 1,210 220 18.1 1,801 449 24.92005 . . . . . . . . . . . . . . . . . . 13,731 1,501 10.9 11,931 1,039 8.7 1,223 220 18.0 1,771 457 25.820044 . . . . . . . . . . . . . . . . . 13,291 1,295 9.7 11,661 876 7.5 1,190 170 14.3 1,599 417 26.12003 . . . . . . . . . . . . . . . . . . 12,891 1,527 11.8 11,266 1,116 9.9 1,184 294 24.8 1,590 402 25.32002 . . . . . . . . . . . . . . . . . . 12,487 1,243 10.0 10,742 816 7.6 1,146 175 15.3 1,708 417 24.4
ASIAN ALONE13
2017 . . . . . . . . . . . . . . . . . . 19,475 1,953 10.0 16,666 1,276 7.7 1,757 275 15.7 2,758 674 24.42016 . . . . . . . . . . . . . . . . . . 18,879 1,908 10.1 16,220 1,179 7.3 1,657 326 19.7 2,627 715 27.22015 . . . . . . . . . . . . . . . . . . 18,241 2,078 11.4 15,597 1,260 8.1 1,435 222 15.5 2,556 784 30.72014 . . . . . . . . . . . . . . . . . . 17,790 2,137 12.0 15,261 1,391 9.1 1,725 315 18.2 2,431 713 29.320131 . . . . . . . . . . . . . . . . . 17,257 2,255 13.1 15,057 1,589 10.6 1,574 442 28.1 2,180 661 30.320132 . . . . . . . . . . . . . . . . . 17,063 1,785 10.5 14,895 1,154 7.7 1,657 228 13.7 2,128 623 29.32012 . . . . . . . . . . . . . . . . . . 16,417 1,921 11.7 14,190 1,357 9.6 1,515 309 20.4 2,156 547 25.4
2011 . . . . . . . . . . . . . . . . . . 16,086 1,973 12.3 14,100 1,389 9.9 1,570 327 20.8 1,921 571 29.720103 . . . . . . . . . . . . . . . . . 15,611 1,899 12.2 13,515 1,341 9.9 1,471 327 22.2 2,040 547 26.82009 . . . . . . . . . . . . . . . . . . 14,005 1,746 12.5 12,296 1,244 10.1 1,353 250 18.5 1,673 491 29.32008 . . . . . . . . . . . . . . . . . . 13,310 1,576 11.8 11,719 1,192 10.2 1,308 209 16.0 1,574 378 24.02007 . . . . . . . . . . . . . . . . . . 13,257 1,349 10.2 11,471 930 8.1 1,256 217 17.3 1,720 391 22.7
2006 . . . . . . . . . . . . . . . . . . 13,177 1,353 10.3 11,428 912 8.0 1,057 187 17.7 1,683 428 25.42005 . . . . . . . . . . . . . . . . . . 12,580 1,402 11.1 10,911 970 8.9 1,059 189 17.8 1,645 427 26.020044 . . . . . . . . . . . . . . . . . 12,231 1,201 9.8 10,734 812 7.6 1,024 135 13.2 1,472 388 26.32003 . . . . . . . . . . . . . . . . . . 11,856 1,401 11.8 10,333 1,017 9.8 1,028 242 23.6 1,494 375 25.12002 . . . . . . . . . . . . . . . . . . 11,541 1,161 10.1 9,899 763 7.7 1,019 155 15.2 1,613 390 24.2
ASIAN AND PACIFIC ISLANDER11
2001 . . . . . . . . . . . . . . . . . . 12,465 1,275 10.2 10,745 873 8.1 1,333 198 14.8 1,682 393 23.420005 . . . . . . . . . . . . . . . . . 12,672 1,258 9.9 11,044 895 8.1 1,231 289 23.4 1,588 350 22.019996 . . . . . . . . . . . . . . . . . 11,955 1,285 10.7 10,507 1,010 9.6 1,201 275 22.9 1,415 270 19.11998 . . . . . . . . . . . . . . . . . . 10,873 1,360 12.5 9,576 1,087 11.4 1,123 373 33.2 1,266 257 20.31997 . . . . . . . . . . . . . . . . . . 10,482 1,468 14.0 9,312 1,116 12.0 932 313 33.6 1,134 327 28.9
1996 . . . . . . . . . . . . . . . . . . 10,054 1,454 14.5 8,900 1,172 13.2 1,018 300 29.5 1,120 255 22.81995 . . . . . . . . . . . . . . . . . . 9,644 1,411 14.6 8,582 1,112 13.0 919 266 28.9 1,013 260 25.61994 . . . . . . . . . . . . . . . . . . 6,654 974 14.6 5,915 776 13.1 582 137 23.6 696 179 25.71993 . . . . . . . . . . . . . . . . . . 7,434 1,134 15.3 6,609 898 13.6 725 126 17.4 791 228 28.819927 . . . . . . . . . . . . . . . . . 7,779 985 12.7 6,922 787 11.4 729 183 25.0 828 193 23.3
19918 . . . . . . . . . . . . . . . . . 7,192 996 13.8 6,367 773 12.1 721 177 24.6 785 209 26.61990 . . . . . . . . . . . . . . . . . . 7,014 858 12.2 6,300 712 11.3 638 132 20.7 668 124 18.51989 . . . . . . . . . . . . . . . . . . 6,673 939 14.1 5,917 779 13.2 614 212 34.6 712 144 20.219889 . . . . . . . . . . . . . . . . . 6,447 1,117 17.3 5,767 942 16.3 650 263 40.5 651 160 24.519879 . . . . . . . . . . . . . . . . . 6,322 1,021 16.1 5,785 875 15.1 584 187 32.0 516 138 26.8
See footnotes at end of table.

U.S. Census Bureau Income and Poverty in the United States: 2017 53
Table B-1.Poverty Status of People by Family Relationship, Race, and Hispanic Origin: 1959 to 2017—Con.(Numbers in thousands. People as of March of the following year. For information on confidentiality protection, sampling error, nonsampling error, and definitions, see www2.census.gov/programs-surveys/cps/techdocs/cpsmar18.pdf )
Race, Hispanic origin, and year
All people People in families Unrelated individuals
Total
Below poverty All familiesFamilies with female
householder, no husband present
Total
Below poverty
Number Percent TotalBelow poverty
TotalBelow poverty
Number PercentNumber Percent Number PercentHISPANIC (ANY RACE)2017 . . . . . . . . . . . . . . . . . . 59,053 10,790 18.3 51,517 8,708 16.9 12,244 4,198 34.3 7,206 1,954 27.12016 . . . . . . . . . . . . . . . . . . 57,556 11,137 19.4 50,525 9,200 18.2 11,926 4,136 34.7 6,697 1,793 26.82015 . . . . . . . . . . . . . . . . . . 56,780 12,133 21.4 49,524 10,109 20.4 11,878 4,401 37.1 6,884 1,876 27.22014 . . . . . . . . . . . . . . . . . . 55,504 13,104 23.6 48,296 10,853 22.5 11,919 4,817 40.4 6,776 1,981 29.220131 . . . . . . . . . . . . . . . . . 54,181 13,356 24.7 47,266 11,128 23.5 13,060 5,406 41.4 6,414 1,915 29.920132 . . . . . . . . . . . . . . . . . 54,145 12,744 23.5 47,254 10,536 22.3 11,679 4,860 41.6 6,545 2,063 31.52012 . . . . . . . . . . . . . . . . . . 53,105 13,616 25.6 46,183 11,358 24.6 11,255 4,816 42.8 6,502 2,018 31.0
2011 . . . . . . . . . . . . . . . . . . 52,279 13,244 25.3 45,781 11,143 24.3 11,368 4,996 44.0 6,096 1,882 30.920103 . . . . . . . . . . . . . . . . . 50,971 13,522 26.5 44,612 11,384 25.5 10,719 4,748 44.3 5,846 1,863 31.92009 . . . . . . . . . . . . . . . . . . 48,811 12,350 25.3 42,717 10,345 24.2 10,283 4,176 40.6 5,718 1,801 31.52008 . . . . . . . . . . . . . . . . . . 47,398 10,987 23.2 41,732 9,303 22.3 9,265 3,751 40.5 5,417 1,577 29.12007 . . . . . . . . . . . . . . . . . . 45,933 9,890 21.5 40,125 8,248 20.6 8,917 3,527 39.6 5,508 1,490 27.1
2006 . . . . . . . . . . . . . . . . . . 44,784 9,243 20.6 39,177 7,650 19.5 8,652 3,189 36.9 5,317 1,468 27.62005 . . . . . . . . . . . . . . . . . . 43,020 9,368 21.8 37,759 7,767 20.6 7,868 3,069 39.0 4,971 1,451 29.220044 . . . . . . . . . . . . . . . . . 41,690 9,122 21.9 36,438 7,705 21.1 7,825 3,072 39.3 4,971 1,293 26.02003 . . . . . . . . . . . . . . . . . . 40,300 9,051 22.5 35,469 7,637 21.5 7,452 2,861 38.4 4,620 1,325 28.72002 . . . . . . . . . . . . . . . . . . 39,216 8,555 21.8 34,598 7,184 20.8 7,013 2,554 36.4 4,364 1,255 28.8
2001 . . . . . . . . . . . . . . . . . . 37,312 7,997 21.4 33,110 6,674 20.2 6,830 2,585 37.8 3,981 1,211 30.420005 . . . . . . . . . . . . . . . . . 35,955 7,747 21.5 31,700 6,430 20.3 6,469 2,444 37.8 3,978 1,163 29.219996 . . . . . . . . . . . . . . . . . 34,632 7,876 22.7 30,872 6,702 21.7 6,527 2,642 40.5 3,481 1,068 30.71998 . . . . . . . . . . . . . . . . . . 31,515 8,070 25.6 28,055 6,814 24.3 6,074 2,837 46.7 3,218 1,097 34.11997 . . . . . . . . . . . . . . . . . . 30,637 8,308 27.1 27,467 7,198 26.2 5,718 2,911 50.9 2,976 1,017 34.2
1996 . . . . . . . . . . . . . . . . . . 29,614 8,697 29.4 26,340 7,515 28.5 5,641 3,020 53.5 2,985 1,066 35.71995 . . . . . . . . . . . . . . . . . . 28,344 8,574 30.3 25,165 7,341 29.2 5,785 3,053 52.8 2,947 1,092 37.01994 . . . . . . . . . . . . . . . . . . 27,442 8,416 30.7 24,390 7,357 30.2 5,328 2,920 54.8 2,798 926 33.11993 . . . . . . . . . . . . . . . . . . 26,559 8,126 30.6 23,439 6,876 29.3 5,333 2,837 53.2 2,717 972 35.819927 . . . . . . . . . . . . . . . . . 25,646 7,592 29.6 22,695 6,455 28.4 4,806 2,474 51.5 2,577 881 34.2
19918 . . . . . . . . . . . . . . . . . 22,070 6,339 28.7 19,658 5,541 28.2 4,326 2,282 52.7 2,146 667 31.11990 . . . . . . . . . . . . . . . . . . 21,405 6,006 28.1 18,912 5,091 26.9 3,993 2,115 53.0 2,254 774 34.31989 . . . . . . . . . . . . . . . . . . 20,746 5,430 26.2 18,488 4,659 25.2 3,763 1,902 50.6 2,045 634 31.019889 . . . . . . . . . . . . . . . . . 20,064 5,357 26.7 18,102 4,700 26.0 3,734 2,052 55.0 1,864 597 32.019879 . . . . . . . . . . . . . . . . . 19,395 5,422 28.0 17,342 4,761 27.5 3,678 2,045 55.6 1,933 598 31.0
1986 . . . . . . . . . . . . . . . . . . 18,758 5,117 27.3 16,880 4,469 26.5 3,631 1,921 52.9 1,685 553 32.81985 . . . . . . . . . . . . . . . . . . 18,075 5,236 29.0 16,276 4,605 28.3 3,561 1,983 55.7 1,602 532 33.21984 . . . . . . . . . . . . . . . . . . 16,916 4,806 28.4 15,293 4,192 27.4 3,139 1,764 56.2 1,481 545 36.81983 . . . . . . . . . . . . . . . . . . 16,544 4,633 28.0 15,075 4,113 27.3 3,032 1,670 55.1 1,364 457 33.51982 . . . . . . . . . . . . . . . . . . 14,385 4,301 29.9 13,242 3,865 29.2 2,664 1,601 60.1 1,018 358 35.1
1981 . . . . . . . . . . . . . . . . . . 14,021 3,713 26.5 12,922 3,349 25.9 2,622 1,465 55.9 1,005 313 31.11980 . . . . . . . . . . . . . . . . . . 13,600 3,491 25.7 12,547 3,143 25.1 2,421 1,319 54.5 970 312 32.21979 . . . . . . . . . . . . . . . . . . 13,371 2,921 21.8 12,291 2,599 21.1 2,058 1,053 51.2 991 286 28.81978 . . . . . . . . . . . . . . . . . . 12,079 2,607 21.6 11,193 2,343 20.9 1,817 1,024 56.4 886 264 29.81977 . . . . . . . . . . . . . . . . . . 12,046 2,700 22.4 11,249 2,463 21.9 1,901 1,077 56.7 797 237 29.8
1976 . . . . . . . . . . . . . . . . . . 11,269 2,783 24.7 10,552 2,516 23.8 1,766 1,000 56.6 716 266 37.21975 . . . . . . . . . . . . . . . . . . 11,117 2,991 26.9 10,472 2,755 26.3 1,842 1,053 57.2 645 236 36.61974 . . . . . . . . . . . . . . . . . . 11,201 2,575 23.0 10,584 2,374 22.4 1,723 915 53.1 617 201 32.61973 . . . . . . . . . . . . . . . . . . 10,795 2,366 21.9 10,269 2,209 21.5 1,534 881 57.4 526 157 29.91972 . . . . . . . . . . . . . . . . . . 10,588 2,414 22.8 10,099 2,252 22.3 1,370 733 53.5 488 162 33.2
N Not available .1 The 2014 CPS ASEC included redesigned questions for income and health insurance
coverage . All of the approximately 98,000 addresses were eligible to receive the redesigned set of health insurance coverage questions . The redesigned income questions were implemented to a subsample of these 98,000 addresses using a probability split panel design . Approximately 68,000 addresses were eligible to receive a set of income questions similar to those used in the 2013 CPS ASEC and the remaining 30,000 addresses were eligible to receive the redesigned income questions . The source of these 2013 estimates is the portion of the CPS ASEC sample which received the redesigned income questions, approximately 30,000 addresses .
2 The source of these 2013 estimates is the portion of the CPS ASEC sample which received the income questions consistent with the 2013 CPS ASEC, approximately 68,000 addresses . .
3 Implementation of 2010 Census-based population controls .4 For 2004, estimates are revised to reflect a correction to the weights in the 2005 CPS
ASEC .5 Implementation of 2000 Census-based population controls and a 28,000 household
sample expansion .6 For 1999, estimates are based on 2000 Census population controls .7 For 1992, estimates are based on 1990 Census population controls .8 For 1991, estimates are revised to correct for nine omitted weights from the original
March 1992 CPS ASEC file .
9 For 1988 and 1987, estimates are based on new processing procedures and are also revised to reflect corrections to the files after publication of the 1988 advance report “Money Income and Poverty Status in the United States: 1988,” P-60, No . 166 .
10 The 2003 CPS allowed respondents to choose more than one race . White alone refers to people who reported White and did not report any other race category . The use of this single-race population does not imply that it is the preferred method of presenting or analyzing data . The Census Bureau uses a variety of approaches . Information on people who reported more than one race, such as White and American Indian and Alaska Native or Asian and Black or African American, is available from the 2010 Census through American FactFinder . About 2 .9 percent of people reported more than one race in the 2010 Census .
11 For 2001 and earlier years, the CPS allowed respondents to report only one race group . The reference race groups for 2001 and earlier poverty data are White, non-Hispanic White, Black, and Asian and Pacific Islander .
12 Black alone refers to people who reported Black and did not report any other race .13 Asian alone refers to people who reported Asian and did not report any other race .Note: Before 1979, people in unrelated subfamilies were included as people in families .
Beginning in 1979, people in unrelated subfamilies are included in all people but are excluded from people in families .
Source: U .S . Census Bureau, Current Population Survey, 1960 to 2018 Annual Social and Economic Supplements .

54 Income and Poverty in the United States: 2017 U.S. Census Bureau
Race, Hispanic origin, and year
Under 18 years 18 to 64 years 65 years and olderAll people Related children in families
Total
Below poverty
Total
Below poverty
TotalBelow poverty
TotalBelow poverty
Number Percent Number Percent Number Percent Number PercentALL RACES2017 . . . . . . . . . . . . . . . . . . . . . . . . 73,356 12,808 17.5 72,532 12,439 17.1 198,113 22,209 11.2 51,080 4,681 9.22016 . . . . . . . . . . . . . . . . . . . . . . . . 73,586 13,253 18.0 72,674 12,803 17.6 197,051 22,795 11.6 49,274 4,568 9.32015 . . . . . . . . . . . . . . . . . . . . . . . . 73,647 14,509 19.7 72,558 13,962 19.2 197,260 24,414 12.4 47,547 4,201 8.82014 . . . . . . . . . . . . . . . . . . . . . . . . 73,556 15,540 21.1 72,383 14,987 20.7 196,254 26,527 13.5 45,994 4,590 10.020131 . . . . . . . . . . . . . . . . . . . . . . . 73,439 15,801 21.5 72,246 15,116 20.9 194,694 25,899 13.3 44,963 4,569 10.220132 . . . . . . . . . . . . . . . . . . . . . . . 73,625 14,659 19.9 72,573 14,142 19.5 194,833 26,429 13.6 44,508 4,231 9.52012 . . . . . . . . . . . . . . . . . . . . . . . . 73,719 16,073 21.8 72,545 15,437 21.3 193,642 26,497 13.7 43,287 3,926 9.1
2011 . . . . . . . . . . . . . . . . . . . . . . . . 73,737 16,134 21.9 72,568 15,539 21.4 193,213 26,492 13.7 41,507 3,620 8.720103 . . . . . . . . . . . . . . . . . . . . . . . 73,873 16,286 22.0 72,581 15,598 21.5 192,481 26,499 13.8 39,777 3,558 8.92009 . . . . . . . . . . . . . . . . . . . . . . . . 74,579 15,451 20.7 73,410 14,774 20.1 190,627 24,684 12.9 38,613 3,433 8.92008 . . . . . . . . . . . . . . . . . . . . . . . . 74,068 14,068 19.0 72,980 13,507 18.5 189,185 22,105 11.7 37,788 3,656 9.72007 . . . . . . . . . . . . . . . . . . . . . . . . 73,996 13,324 18.0 72,792 12,802 17.6 187,913 20,396 10.9 36,790 3,556 9.7
2006 . . . . . . . . . . . . . . . . . . . . . . . . 73,727 12,827 17.4 72,609 12,299 16.9 186,688 20,239 10.8 36,035 3,394 9.42005 . . . . . . . . . . . . . . . . . . . . . . . . 73,285 12,896 17.6 72,095 12,335 17.1 184,345 20,450 11.1 35,505 3,603 10.120044 . . . . . . . . . . . . . . . . . . . . . . . 73,241 13,041 17.8 72,133 12,473 17.3 182,166 20,545 11.3 35,209 3,453 9.82003 . . . . . . . . . . . . . . . . . . . . . . . . 72,999 12,866 17.6 71,907 12,340 17.2 180,041 19,443 10.8 34,659 3,552 10.22002 . . . . . . . . . . . . . . . . . . . . . . . . 72,696 12,133 16.7 71,619 11,646 16.3 178,388 18,861 10.6 34,234 3,576 10.4
2001 . . . . . . . . . . . . . . . . . . . . . . . . 72,021 11,733 16.3 70,950 11,175 15.8 175,685 17,760 10.1 33,769 3,414 10.120005 . . . . . . . . . . . . . . . . . . . . . . . 71,741 11,587 16.2 70,538 11,005 15.6 173,638 16,671 9.6 33,566 3,323 9.919996 . . . . . . . . . . . . . . . . . . . . . . . 71,685 12,280 17.1 70,424 11,678 16.6 171,146 17,289 10.1 33,377 3,222 9.71998 . . . . . . . . . . . . . . . . . . . . . . . . 71,338 13,467 18.9 70,253 12,845 18.3 167,327 17,623 10.5 32,394 3,386 10.51997 . . . . . . . . . . . . . . . . . . . . . . . . 71,069 14,113 19.9 69,844 13,422 19.2 165,329 18,085 10.9 32,082 3,376 10.5
1996 . . . . . . . . . . . . . . . . . . . . . . . . 70,650 14,463 20.5 69,411 13,764 19.8 163,691 18,638 11.4 31,877 3,428 10.81995 . . . . . . . . . . . . . . . . . . . . . . . . 70,566 14,665 20.8 69,425 13,999 20.2 161,508 18,442 11.4 31,658 3,318 10.51994 . . . . . . . . . . . . . . . . . . . . . . . . 70,020 15,289 21.8 68,819 14,610 21.2 160,329 19,107 11.9 31,267 3,663 11.71993 . . . . . . . . . . . . . . . . . . . . . . . . 69,292 15,727 22.7 68,040 14,961 22.0 159,208 19,781 12.4 30,779 3,755 12.219927 . . . . . . . . . . . . . . . . . . . . . . . 68,440 15,294 22.3 67,256 14,521 21.6 157,680 18,793 11.9 30,430 3,928 12.9
19918 . . . . . . . . . . . . . . . . . . . . . . . 65,918 14,341 21.8 64,800 13,658 21.1 154,684 17,586 11.4 30,590 3,781 12.41990 . . . . . . . . . . . . . . . . . . . . . . . . 65,049 13,431 20.6 63,908 12,715 19.9 153,502 16,496 10.7 30,093 3,658 12.21989 . . . . . . . . . . . . . . . . . . . . . . . . 64,144 12,590 19.6 63,225 12,001 19.0 152,282 15,575 10.2 29,566 3,363 11.419889 . . . . . . . . . . . . . . . . . . . . . . . 63,747 12,455 19.5 62,906 11,935 19.0 150,761 15,809 10.5 29,022 3,481 12.019879 . . . . . . . . . . . . . . . . . . . . . . . 63,294 12,843 20.3 62,423 12,275 19.7 149,201 15,815 10.6 28,487 3,563 12.5
1986 . . . . . . . . . . . . . . . . . . . . . . . . 62,948 12,876 20.5 62,009 12,257 19.8 147,631 16,017 10.8 27,975 3,477 12.41985 . . . . . . . . . . . . . . . . . . . . . . . . 62,876 13,010 20.7 62,019 12,483 20.1 146,396 16,598 11.3 27,322 3,456 12.61984 . . . . . . . . . . . . . . . . . . . . . . . . 62,447 13,420 21.5 61,681 12,929 21.0 144,551 16,952 11.7 26,818 3,330 12.41983 . . . . . . . . . . . . . . . . . . . . . . . . 62,334 13,911 22.3 61,578 13,427 21.8 143,052 17,767 12.4 26,313 3,625 13.81982 . . . . . . . . . . . . . . . . . . . . . . . . 62,345 13,647 21.9 61,565 13,139 21.3 141,328 17,000 12.0 25,738 3,751 14.6
1981 . . . . . . . . . . . . . . . . . . . . . . . . 62,449 12,505 20.0 61,756 12,068 19.5 139,477 15,464 11.1 25,231 3,853 15.31980 . . . . . . . . . . . . . . . . . . . . . . . . 62,914 11,543 18.3 62,168 11,114 17.9 137,428 13,858 10.1 24,686 3,871 15.71979 . . . . . . . . . . . . . . . . . . . . . . . . 63,375 10,377 16.4 62,646 9,993 16.0 135,333 12,014 8.9 24,194 3,682 15.21978 . . . . . . . . . . . . . . . . . . . . . . . . 62,311 9,931 15.9 61,987 9,722 15.7 130,169 11,332 8.7 23,175 3,233 14.01977 . . . . . . . . . . . . . . . . . . . . . . . . 63,137 10,288 16.2 62,823 10,028 16.0 128,262 11,316 8.8 22,468 3,177 14.1
1976 . . . . . . . . . . . . . . . . . . . . . . . . 64,028 10,273 16.0 63,729 10,081 15.8 126,175 11,389 9.0 22,100 3,313 15.01975 . . . . . . . . . . . . . . . . . . . . . . . . 65,079 11,104 17.1 64,750 10,882 16.8 124,122 11,456 9.2 21,662 3,317 15.31974 . . . . . . . . . . . . . . . . . . . . . . . . 66,134 10,156 15.4 65,802 9,967 15.1 122,101 10,132 8.3 21,127 3,085 14.61973 . . . . . . . . . . . . . . . . . . . . . . . . 66,959 9,642 14.4 66,626 9,453 14.2 120,060 9,977 8.3 20,602 3,354 16.31972 . . . . . . . . . . . . . . . . . . . . . . . . 67,930 10,284 15.1 67,592 10,082 14.9 117,957 10,438 8.8 20,117 3,738 18.6
1971 . . . . . . . . . . . . . . . . . . . . . . . . 68,816 10,551 15.3 68,474 10,344 15.1 115,911 10,735 9.3 19,827 4,273 21.61970 . . . . . . . . . . . . . . . . . . . . . . . . 69,159 10,440 15.1 68,815 10,235 14.9 113,554 10,187 9.0 19,470 4,793 24.61969 . . . . . . . . . . . . . . . . . . . . . . . . 69,090 9,691 14.0 68,746 9,501 13.8 111,528 9,669 8.7 18,899 4,787 25.31968 . . . . . . . . . . . . . . . . . . . . . . . . 70,385 10,954 15.6 70,035 10,739 15.3 108,684 9,803 9.0 18,559 4,632 25.01967 . . . . . . . . . . . . . . . . . . . . . . . . 70,408 11,656 16.6 70,058 11,427 16.3 107,024 10,725 10.0 18,240 5,388 29.5
1966 . . . . . . . . . . . . . . . . . . . . . . . . 70,218 12,389 17.6 69,869 12,146 17.4 105,241 11,007 10.5 17,929 5,114 28.51965 . . . . . . . . . . . . . . . . . . . . . . . . 69,986 14,676 21.0 69,638 14,388 20.7 N N N N N N1964 . . . . . . . . . . . . . . . . . . . . . . . . 69,711 16,051 23.0 69,364 15,736 22.7 N N N N N N1963 . . . . . . . . . . . . . . . . . . . . . . . . 69,181 16,005 23.1 68,837 15,691 22.8 N N N N N N1962 . . . . . . . . . . . . . . . . . . . . . . . . 67,722 16,963 25.0 67,385 16,630 24.7 N N N N N N1961 . . . . . . . . . . . . . . . . . . . . . . . . 66,121 16,909 25.6 65,792 16,577 25.2 N N N N N N1960 . . . . . . . . . . . . . . . . . . . . . . . . 65,601 17,634 26.9 65,275 17,288 26.5 N N N N N N1959 . . . . . . . . . . . . . . . . . . . . . . . . 64,315 17,552 27.3 63,995 17,208 26.9 96,685 16,457 17.0 15,557 5,481 35.2
Table B-2.Poverty Status of People by Age, Race, and Hispanic Origin: 1959 to 2017(Numbers in thousands. People as of March of the following year. For information on confidentiality protection, sampling error, nonsampling error, and definitions, see www2.census.gov/programs-surveys/cps/techdocs/cpsmar18.pdf)
See footnotes at end of table.

U.S. Census Bureau Income and Poverty in the United States: 2017 55
Race, Hispanic origin, and year
Under 18 years 18 to 64 years 65 years and olderAll people Related children in families
Total
Below poverty
Total
Below poverty
TotalBelow poverty
TotalBelow poverty
Number Percent Number Percent Number Percent Number PercentWHITE ALONE10
2017 . . . . . . . . . . . . . . . . . . . . . . . . 53,022 8,041 15.2 52,412 7,772 14.8 151,259 15,027 9.9 42,991 3,368 7.82016 . . . . . . . . . . . . . . . . . . . . . . . . 53,319 8,324 15.6 52,594 7,963 15.1 151,044 15,467 10.2 41,623 3,322 8.02015 . . . . . . . . . . . . . . . . . . . . . . . . 53,550 9,204 17.2 52,786 8,838 16.7 151,731 16,325 10.8 40,254 3,037 7.52014 . . . . . . . . . . . . . . . . . . . . . . . . 53,637 9,602 17.9 52,732 9,172 17.4 151,562 18,086 11.9 39,054 3,400 8.720131 . . . . . . . . . . . . . . . . . . . . . . . 53,638 10,296 19.2 52,657 9,702 18.4 151,234 17,629 11.7 38,475 3,362 8.720132 . . . . . . . . . . . . . . . . . . . . . . . 53,846 8,808 16.4 53,074 8,428 15.9 151,334 17,931 11.8 37,905 3,197 8.42012 . . . . . . . . . . . . . . . . . . . . . . . . 54,066 9,979 18.5 53,201 9,547 17.9 151,042 17,946 11.9 37,039 2,891 7.8
2011 . . . . . . . . . . . . . . . . . . . . . . . . 54,186 10,103 18.6 53,268 9,643 18.1 151,416 18,007 11.9 35,732 2,739 7.720103 . . . . . . . . . . . . . . . . . . . . . . . 54,490 10,092 18.5 53,573 9,590 17.9 151,218 18,353 12.1 34,274 2,638 7.72009 . . . . . . . . . . . . . . . . . . . . . . . . 56,266 9,938 17.7 55,397 9,440 17.0 152,367 17,391 11.4 33,414 2,501 7.52008 . . . . . . . . . . . . . . . . . . . . . . . . 56,153 8,863 15.8 55,339 8,441 15.3 151,681 15,356 10.1 32,714 2,771 8.52007 . . . . . . . . . . . . . . . . . . . . . . . . 56,419 8,395 14.9 55,483 8,002 14.4 150,875 14,135 9.4 31,839 2,590 8.1
2006 . . . . . . . . . . . . . . . . . . . . . . . . 56,205 7,908 14.1 55,330 7,522 13.6 150,143 14,035 9.3 31,270 2,473 7.92005 . . . . . . . . . . . . . . . . . . . . . . . . 56,075 8,085 14.4 55,152 7,652 13.9 148,450 14,086 9.5 30,905 2,700 8.720044 . . . . . . . . . . . . . . . . . . . . . . . 56,053 8,308 14.8 55,212 7,876 14.3 146,974 14,486 9.9 30,714 2,534 8.32003 . . . . . . . . . . . . . . . . . . . . . . . . 55,779 7,985 14.3 54,989 7,624 13.9 145,783 13,622 9.3 30,303 2,666 8.82002 . . . . . . . . . . . . . . . . . . . . . . . . 55,703 7,549 13.6 54,900 7,203 13.1 144,694 13,178 9.1 29,980 2,739 9.1
WHITE11
2001 . . . . . . . . . . . . . . . . . . . . . . . . 56,089 7,527 13.4 55,238 7,086 12.8 143,796 12,555 8.7 29,790 2,656 8.920005 . . . . . . . . . . . . . . . . . . . . . . . 55,980 7,307 13.1 55,021 6,834 12.4 142,164 11,754 8.3 29,703 2,584 8.719996 . . . . . . . . . . . . . . . . . . . . . . . 55,833 7,639 13.7 54,873 7,194 13.1 139,974 12,085 8.6 29,553 2,446 8.31998 . . . . . . . . . . . . . . . . . . . . . . . . 56,016 8,443 15.1 55,126 7,935 14.4 138,061 12,456 9.0 28,759 2,555 8.91997 . . . . . . . . . . . . . . . . . . . . . . . . 55,863 8,990 16.1 54,870 8,441 15.4 136,784 12,838 9.4 28,553 2,569 9.0
1996 . . . . . . . . . . . . . . . . . . . . . . . . 55,606 9,044 16.3 54,599 8,488 15.5 135,586 12,940 9.5 28,464 2,667 9.41995 . . . . . . . . . . . . . . . . . . . . . . . . 55,444 8,981 16.2 54,532 8,474 15.5 134,149 12,869 9.6 28,436 2,572 9.01994 . . . . . . . . . . . . . . . . . . . . . . . . 55,186 9,346 16.9 54,221 8,826 16.3 133,289 13,187 9.9 27,985 2,846 10.21993 . . . . . . . . . . . . . . . . . . . . . . . . 54,639 9,752 17.8 53,614 9,123 17.0 132,680 13,535 10.2 27,580 2,939 10.719927 . . . . . . . . . . . . . . . . . . . . . . . 54,110 9,399 17.4 53,110 8,752 16.5 131,694 12,871 9.8 27,256 2,989 11.0
19918 . . . . . . . . . . . . . . . . . . . . . . . 52,523 8,848 16.8 51,627 8,316 16.1 130,312 12,097 9.3 27,297 2,802 10.31990 . . . . . . . . . . . . . . . . . . . . . . . . 51,929 8,232 15.9 51,028 7,696 15.1 129,784 11,387 8.8 26,898 2,707 10.11989 . . . . . . . . . . . . . . . . . . . . . . . . 51,400 7,599 14.8 50,704 7,164 14.1 128,974 10,647 8.3 26,479 2,539 9.619889 . . . . . . . . . . . . . . . . . . . . . . . 51,203 7,435 14.5 50,590 7,095 14.0 128,031 10,687 8.3 26,001 2,593 10.019879 . . . . . . . . . . . . . . . . . . . . . . . 51,012 7,788 15.3 50,360 7,398 14.7 126,991 10,703 8.4 25,602 2,704 10.6
1986 . . . . . . . . . . . . . . . . . . . . . . . . 51,111 8,209 16.1 50,356 7,714 15.3 125,998 11,285 9.0 25,173 2,689 10.71985 . . . . . . . . . . . . . . . . . . . . . . . . 51,031 8,253 16.2 50,358 7,838 15.6 125,258 11,909 9.5 24,629 2,698 11.01984 . . . . . . . . . . . . . . . . . . . . . . . . 50,814 8,472 16.7 50,192 8,086 16.1 123,922 11,904 9.6 24,206 2,579 10.71983 . . . . . . . . . . . . . . . . . . . . . . . . 50,726 8,862 17.5 50,183 8,534 17.0 123,014 12,347 10.0 23,754 2,776 11.71982 . . . . . . . . . . . . . . . . . . . . . . . . 50,920 8,678 17.0 50,305 8,282 16.5 121,766 11,971 9.8 23,234 2,870 12.4
1981 . . . . . . . . . . . . . . . . . . . . . . . . 51,140 7,785 15.2 50,553 7,429 14.7 120,574 10,790 8.9 22,791 2,978 13.11980 . . . . . . . . . . . . . . . . . . . . . . . . 51,653 7,181 13.9 51,002 6,817 13.4 118,935 9,478 8.0 22,325 3,042 13.61979 . . . . . . . . . . . . . . . . . . . . . . . . 52,262 6,193 11.8 51,687 5,909 11.4 117,583 8,110 6.9 21,898 2,911 13.31978 . . . . . . . . . . . . . . . . . . . . . . . . 51,669 5,831 11.3 51,409 5,674 11.0 113,832 7,897 6.9 20,950 2,530 12.11977 . . . . . . . . . . . . . . . . . . . . . . . . 52,563 6,097 11.6 52,299 5,943 11.4 112,374 7,893 7.0 20,316 2,426 11.9
1976 . . . . . . . . . . . . . . . . . . . . . . . . 53,428 6,189 11.6 53,167 6,034 11.3 110,717 7,890 7.1 20,020 2,633 13.21975 . . . . . . . . . . . . . . . . . . . . . . . . 54,405 6,927 12.7 54,126 6,748 12.5 109,105 8,210 7.5 19,654 2,634 13.41974 . . . . . . . . . . . . . . . . . . . . . . . . 55,590 6,223 11.2 55,320 6,079 11.0 107,579 7,053 6.6 19,206 2,460 12.81973 . . . . . . . . . . . . . . . . . . . . . . . . N N N 56,211 5,462 9.7 N N N N 2,698 14.41972 . . . . . . . . . . . . . . . . . . . . . . . . N N N 57,181 5,784 10.1 N N N N 3,072 16.8
1971 . . . . . . . . . . . . . . . . . . . . . . . . N N N 58,119 6,341 10.9 N N N N 3,605 19.91970 . . . . . . . . . . . . . . . . . . . . . . . . N N N 58,472 6,138 10.5 N N N N 4,011 22.61969 . . . . . . . . . . . . . . . . . . . . . . . . N N N 58,578 5,667 9.7 N N N N 4,052 23.31968 . . . . . . . . . . . . . . . . . . . . . . . . N N N N 6,373 10.7 N N N 17,062 3,939 23.11967 . . . . . . . . . . . . . . . . . . . . . . . . N N N N 6,729 11.3 N N N 16,791 4,646 27.7
1966 . . . . . . . . . . . . . . . . . . . . . . . . N N N N 7,204 12.1 N N N 16,514 4,357 26.41965 . . . . . . . . . . . . . . . . . . . . . . . . N N N N 8,595 14.4 N N N N N N1960 . . . . . . . . . . . . . . . . . . . . . . . . N N N N 11,229 20.0 N N N N N N1959 . . . . . . . . . . . . . . . . . . . . . . . . N N N N 11,386 20.6 N N N N 4,744 33.1
Table B-2.Poverty Status of People by Age, Race, and Hispanic Origin: 1959 to 2017—Con.(Numbers in thousands. People as of March of the following year. For information on confidentiality protection, sampling error, nonsampling error, and definitions, see www2.census.gov/programs-surveys/cps/techdocs/cpsmar18.pdf)
See footnotes at end of table.

56 Income and Poverty in the United States: 2017 U.S. Census Bureau
Race, Hispanic origin, and year
Under 18 years 18 to 64 years 65 years and olderAll people Related children in families
Total
Below poverty
Total
Below poverty
TotalBelow poverty
TotalBelow poverty
Number Percent Number Percent Number Percent Number PercentWHITE ALONE, NOT HISPANIC10
2017 . . . . . . . . . . . . . . . . . . . . . . . . 37,047 4,026 10.9 36,655 3,860 10.5 119,078 10,230 8.6 39,131 2,737 7.02016 . . . . . . . . . . . . . . . . . . . . . . . . 37,485 4,050 10.8 36,982 3,799 10.3 119,785 10,526 8.8 37,951 2,687 7.12015 . . . . . . . . . . . . . . . . . . . . . . . . 37,859 4,563 12.1 37,342 4,301 11.5 120,908 10,812 8.9 36,682 2,411 6.62014 . . . . . . . . . . . . . . . . . . . . . . . . 38,057 4,679 12.3 37,457 4,440 11.9 121,424 12,173 10.0 35,727 2,801 7.820131 . . . . . . . . . . . . . . . . . . . . . . . 38,167 5,116 13.4 37,572 4,784 12.7 121,629 11,691 9.6 35,322 2,745 7.820132 . . . . . . . . . . . . . . . . . . . . . . . 38,395 4,094 10.7 37,849 3,833 10.1 121,991 12,133 9.9 34,781 2,569 7.42012 . . . . . . . . . . . . . . . . . . . . . . . . 38,759 4,782 12.3 38,167 4,510 11.8 122,221 11,833 9.7 34,131 2,324 6.8
2011 . . . . . . . . . . . . . . . . . . . . . . . . 38,955 4,850 12.5 38,322 4,554 11.9 123,101 12,112 9.8 32,904 2,210 6.720103 . . . . . . . . . . . . . . . . . . . . . . . 39,437 4,866 12.3 38,823 4,544 11.7 123,731 12,230 9.9 31,616 2,155 6.82009 . . . . . . . . . . . . . . . . . . . . . . . . 40,917 4,850 11.9 40,319 4,518 11.2 125,511 11,658 9.3 30,736 2,022 6.62008 . . . . . . . . . . . . . . . . . . . . . . . . 41,309 4,364 10.6 40,707 4,059 10.0 125,482 10,380 8.3 30,149 2,280 7.62007 . . . . . . . . . . . . . . . . . . . . . . . . 41,979 4,255 10.1 41,304 3,996 9.7 125,161 9,598 7.7 29,442 2,179 7.4
2006 . . . . . . . . . . . . . . . . . . . . . . . . 42,212 4,208 10.0 41,563 3,930 9.5 124,847 9,761 7.8 28,990 2,044 7.02005 . . . . . . . . . . . . . . . . . . . . . . . . 42,523 4,254 10.0 41,867 3,973 9.5 124,326 9,708 7.8 28,704 2,264 7.920044 . . . . . . . . . . . . . . . . . . . . . . . 42,978 4,519 10.5 42,363 4,190 9.9 123,481 10,236 8.3 28,639 2,153 7.52003 . . . . . . . . . . . . . . . . . . . . . . . . 43,150 4,233 9.8 42,547 3,957 9.3 123,110 9,391 7.6 28,335 2,277 8.02002 . . . . . . . . . . . . . . . . . . . . . . . . 43,614 4,090 9.4 43,017 3,848 8.9 122,511 9,157 7.5 28,018 2,321 8.3
WHITE, NOT HISPANIC11
2001 . . . . . . . . . . . . . . . . . . . . . . . . 44,095 4,194 9.5 43,459 3,887 8.9 122,470 8,811 7.2 27,973 2,266 8.120005 . . . . . . . . . . . . . . . . . . . . . . . 44,244 4,018 9.1 43,554 3,715 8.5 121,499 8,130 6.7 27,948 2,218 7.919996 . . . . . . . . . . . . . . . . . . . . . . . 44,272 4,155 9.4 43,570 3,832 8.8 120,341 8,462 7.0 27,952 2,118 7.61998 . . . . . . . . . . . . . . . . . . . . . . . . 45,355 4,822 10.6 44,670 4,458 10.0 120,282 8,760 7.3 27,118 2,217 8.21997 . . . . . . . . . . . . . . . . . . . . . . . . 45,491 5,204 11.4 44,665 4,759 10.7 119,373 9,088 7.6 26,995 2,200 8.1
1996 . . . . . . . . . . . . . . . . . . . . . . . . 45,605 5,072 11.1 44,844 4,656 10.4 118,822 9,074 7.6 27,033 2,316 8.61995 . . . . . . . . . . . . . . . . . . . . . . . . 45,689 5,115 11.2 44,973 4,745 10.6 118,228 8,908 7.5 27,034 2,243 8.31994 . . . . . . . . . . . . . . . . . . . . . . . . 46,668 5,823 12.5 45,874 5,404 11.8 119,192 9,732 8.2 26,684 2,556 9.61993 . . . . . . . . . . . . . . . . . . . . . . . . 46,096 6,255 13.6 45,322 5,819 12.8 118,475 9,964 8.4 26,272 2,663 10.119927 . . . . . . . . . . . . . . . . . . . . . . . 45,590 6,017 13.2 44,833 5,558 12.4 117,386 9,461 8.1 26,025 2,724 10.5
19918 . . . . . . . . . . . . . . . . . . . . . . . 45,236 5,918 13.1 44,506 5,497 12.4 117,672 9,244 7.9 26,208 2,580 9.81990 . . . . . . . . . . . . . . . . . . . . . . . . 44,797 5,532 12.3 44,045 5,106 11.6 117,477 8,619 7.3 25,854 2,471 9.61989 . . . . . . . . . . . . . . . . . . . . . . . . 44,492 5,110 11.5 43,938 4,779 10.9 116,983 8,154 7.0 25,504 2,335 9.219889 . . . . . . . . . . . . . . . . . . . . . . . 44,438 4,888 11.0 43,910 4,594 10.5 116,479 8,293 7.1 25,044 2,384 9.519879 . . . . . . . . . . . . . . . . . . . . . . . 44,461 5,230 11.8 43,907 4,902 11.2 115,721 8,327 7.2 24,754 2,472 10.0
1986 . . . . . . . . . . . . . . . . . . . . . . . . 44,664 5,789 13.0 44,041 5,388 12.2 115,157 8,963 7.8 24,298 2,492 10.31985 . . . . . . . . . . . . . . . . . . . . . . . . 44,752 5,745 12.8 44,199 5,421 12.3 114,969 9,608 8.4 23,734 2,486 10.51984 . . . . . . . . . . . . . . . . . . . . . . . . 44,886 6,156 13.7 44,349 5,828 13.1 114,180 9,734 8.5 23,402 2,410 10.31983 . . . . . . . . . . . . . . . . . . . . . . . . 44,830 6,649 14.8 44,374 6,381 14.4 113,570 10,279 9.1 22,992 2,610 11.41982 . . . . . . . . . . . . . . . . . . . . . . . . 45,531 6,566 14.4 45,001 6,229 13.8 113,717 10,082 8.9 22,655 2,714 12.0
1981 . . . . . . . . . . . . . . . . . . . . . . . . 45,950 5,946 12.9 45,440 5,639 12.4 112,722 9,207 8.2 22,237 2,834 12.71980 . . . . . . . . . . . . . . . . . . . . . . . . 46,578 5,510 11.8 45,989 5,174 11.3 111,460 7,990 7.2 21,760 2,865 13.21979 . . . . . . . . . . . . . . . . . . . . . . . . 46,967 4,730 10.1 46,448 4,476 9.6 110,509 6,930 6.3 21,339 2,759 12.91978 . . . . . . . . . . . . . . . . . . . . . . . . 46,819 4,506 9.6 46,606 4,383 9.4 107,481 6,837 6.4 20,431 2,412 11.8
1977 . . . . . . . . . . . . . . . . . . . . . . . . 47,689 4,714 9.9 47,459 4,582 9.7 106,063 6,772 6.4 19,812 2,316 11.71976 . . . . . . . . . . . . . . . . . . . . . . . . 48,824 4,799 9.8 48,601 4,664 9.6 104,846 6,720 6.4 19,565 2,506 12.81975 . . . . . . . . . . . . . . . . . . . . . . . . 49,670 5,342 10.8 49,421 5,185 10.5 103,496 7,039 6.8 19,251 2,503 13.01974 . . . . . . . . . . . . . . . . . . . . . . . . 50,759 4,820 9.5 50,520 4,697 9.3 101,894 6,051 5.9 18,810 2,346 12.5
BLACK ALONE OR IN COMBINATION2017 . . . . . . . . . . . . . . . . . . . . . . . . 13,187 3,731 28.3 13,042 3,663 28.1 28,253 5,142 18.2 4,952 948 19.12016 . . . . . . . . . . . . . . . . . . . . . . . . 13,190 3,916 29.7 13,084 3,866 29.5 27,834 5,186 18.6 4,660 864 18.52015 . . . . . . . . . . . . . . . . . . . . . . . . 13,128 4,146 31.6 12,944 4,052 31.3 27,653 5,835 21.1 4,447 816 18.42014 . . . . . . . . . . . . . . . . . . . . . . . . 12,875 4,639 36.0 12,706 4,564 35.9 27,442 6,137 22.4 4,249 805 19.020131 . . . . . . . . . . . . . . . . . . . . . . . 13,044 4,359 33.4 12,915 4,325 33.5 27,056 6,031 22.3 4,054 772 19.020132 . . . . . . . . . . . . . . . . . . . . . . . 13,104 4,838 36.9 12,882 4,730 36.7 26,923 6,410 23.8 4,085 712 17.42012 . . . . . . . . . . . . . . . . . . . . . . . . 13,108 4,815 36.7 12,908 4,675 36.2 26,482 6,265 23.7 3,993 730 18.3
2011 . . . . . . . . . . . . . . . . . . . . . . . . 12,968 4,849 37.4 12,815 4,762 37.2 25,962 6,241 24.0 3,718 640 17.220103 . . . . . . . . . . . . . . . . . . . . . . . 13,015 4,923 37.8 12,759 4,814 37.7 25,815 6,031 23.4 3,555 643 18.12009 . . . . . . . . . . . . . . . . . . . . . . . . 12,655 4,480 35.4 12,445 4,349 34.9 24,815 5,441 21.9 3,405 655 19.22008 . . . . . . . . . . . . . . . . . . . . . . . . 12,388 4,202 33.9 12,201 4,104 33.6 24,404 5,017 20.6 3,305 663 20.02007 . . . . . . . . . . . . . . . . . . . . . . . . 12,380 4,178 33.7 12,227 4,106 33.6 23,968 4,742 19.8 3,215 748 23.32006 . . . . . . . . . . . . . . . . . . . . . . . . 12,375 4,086 33.0 12,206 3,977 32.6 23,510 4,652 19.8 3,128 710 22.72005 . . . . . . . . . . . . . . . . . . . . . . . . 12,159 4,074 33.5 11,975 3,972 33.2 23,338 4,735 20.3 3,053 708 23.220044 . . . . . . . . . . . . . . . . . . . . . . . 12,190 4,059 33.3 12,012 3,962 33.0 22,842 4,638 20.3 3,005 714 23.82003 . . . . . . . . . . . . . . . . . . . . . . . . 12,215 4,108 33.6 11,989 3,977 33.2 22,355 4,313 19.3 2,933 688 23.52002 . . . . . . . . . . . . . . . . . . . . . . . . 12,114 3,817 31.5 11,931 3,733 31.3 22,170 4,376 19.7 2,922 691 23.6
Table B-2.Poverty Status of People by Age, Race, and Hispanic Origin: 1959 to 2017—Con.(Numbers in thousands. People as of March of the following year. For information on confidentiality protection, sampling error, nonsampling error, and definitions, see www2.census.gov/programs-surveys/cps/techdocs/cpsmar18.pdf)
See footnotes at end of table.

U.S. Census Bureau Income and Poverty in the United States: 2017 57
Race, Hispanic origin, and year
Under 18 years 18 to 64 years 65 years and olderAll people Related children in families
Total
Below poverty
Total
Below poverty
TotalBelow poverty
TotalBelow poverty
Number Percent Number Percent Number Percent Number PercentBLACK ALONE12
2017 . . . . . . . . . . . . . . . . . . . . . . . . 10,991 3,184 29.0 10,882 3,134 28.8 26,648 4,877 18.3 4,834 932 19.32016 . . . . . . . . . . . . . . . . . . . . . . . . 11,115 3,418 30.8 11,040 3,382 30.6 26,286 4,963 18.9 4,561 853 18.72015 . . . . . . . . . . . . . . . . . . . . . . . . 11,087 3,651 32.9 10,928 3,571 32.7 26,194 5,568 21.3 4,343 801 18.42014 . . . . . . . . . . . . . . . . . . . . . . . . 11,015 4,090 37.1 10,887 4,036 37.1 25,954 5,869 22.6 4,143 796 19.220131 . . . . . . . . . . . . . . . . . . . . . . . 11,003 3,708 33.7 10,896 3,678 33.8 25,562 5,742 22.5 3,933 736 18.720132 . . . . . . . . . . . . . . . . . . . . . . . 11,088 4,244 38.3 10,916 4,153 38.0 25,552 6,099 23.9 3,975 698 17.62012 . . . . . . . . . . . . . . . . . . . . . . . . 11,078 4,201 37.9 10,931 4,097 37.5 25,154 6,002 23.9 3,893 708 18.2
2011 . . . . . . . . . . . . . . . . . . . . . . . . 11,138 4,320 38.8 11,005 4,247 38.6 24,831 5,980 24.1 3,640 630 17.320103 . . . . . . . . . . . . . . . . . . . . . . . 11,173 4,355 39.0 10,953 4,271 39.0 24,667 5,775 23.4 3,443 617 17.92009 . . . . . . . . . . . . . . . . . . . . . . . . 11,282 4,033 35.7 11,102 3,919 35.3 23,953 5,264 22.0 3,320 647 19.52008 . . . . . . . . . . . . . . . . . . . . . . . . 11,172 3,878 34.7 10,998 3,781 34.4 23,565 4,855 20.6 3,229 646 20.02007 . . . . . . . . . . . . . . . . . . . . . . . . 11,302 3,904 34.5 11,174 3,838 34.3 23,213 4,602 19.8 3,150 731 23.2
2006 . . . . . . . . . . . . . . . . . . . . . . . . 11,315 3,777 33.4 11,168 3,690 33.0 22,907 4,570 19.9 3,085 701 22.72005 . . . . . . . . . . . . . . . . . . . . . . . . 11,136 3,841 34.5 10,962 3,743 34.2 22,659 4,627 20.4 3,007 701 23.320044 . . . . . . . . . . . . . . . . . . . . . . . 11,244 3,788 33.7 11,080 3,702 33.4 22,226 4,521 20.3 2,956 705 23.82003 . . . . . . . . . . . . . . . . . . . . . . . . 11,367 3,877 34.1 11,162 3,750 33.6 21,746 4,224 19.4 2,876 680 23.72002 . . . . . . . . . . . . . . . . . . . . . . . . 11,275 3,645 32.3 11,111 3,570 32.1 21,547 4,277 19.9 2,856 680 23.8
BLACK11
2001 . . . . . . . . . . . . . . . . . . . . . . . . 11,556 3,492 30.2 11,419 3,423 30.0 21,462 4,018 18.7 2,853 626 21.920005 . . . . . . . . . . . . . . . . . . . . . . . 11,480 3,581 31.2 11,296 3,495 30.9 21,160 3,794 17.9 2,785 607 21.819996 . . . . . . . . . . . . . . . . . . . . . . . 11,488 3,813 33.2 11,260 3,698 32.8 21,518 4,000 18.6 2,750 628 22.81998 . . . . . . . . . . . . . . . . . . . . . . . . 11,317 4,151 36.7 11,176 4,073 36.4 20,837 4,222 20.3 2,723 718 26.41997 . . . . . . . . . . . . . . . . . . . . . . . . 11,367 4,225 37.2 11,193 4,116 36.8 20,400 4,191 20.5 2,691 700 26.0
1996 . . . . . . . . . . . . . . . . . . . . . . . . 11,338 4,519 39.9 11,155 4,411 39.5 20,155 4,515 22.4 2,616 661 25.31995 . . . . . . . . . . . . . . . . . . . . . . . . 11,369 4,761 41.9 11,198 4,644 41.5 19,892 4,483 22.5 2,478 629 25.41994 . . . . . . . . . . . . . . . . . . . . . . . . 11,211 4,906 43.8 11,044 4,787 43.3 19,585 4,590 23.4 2,557 700 27.41993 . . . . . . . . . . . . . . . . . . . . . . . . 11,127 5,125 46.1 10,969 5,030 45.9 19,272 5,049 26.2 2,510 702 28.019927 . . . . . . . . . . . . . . . . . . . . . . . 10,956 5,106 46.6 10,823 5,015 46.3 18,952 4,884 25.8 2,504 838 33.5
19918 . . . . . . . . . . . . . . . . . . . . . . . 10,350 4,755 45.9 10,178 4,637 45.6 18,355 4,607 25.1 2,606 880 33.81990 . . . . . . . . . . . . . . . . . . . . . . . . 10,162 4,550 44.8 9,980 4,412 44.2 18,097 4,427 24.5 2,547 860 33.81989 . . . . . . . . . . . . . . . . . . . . . . . . 10,012 4,375 43.7 9,847 4,257 43.2 17,833 4,164 23.3 2,487 763 30.719889 . . . . . . . . . . . . . . . . . . . . . . . 9,865 4,296 43.5 9,681 4,148 42.8 17,548 4,275 24.4 2,436 785 32.219879 . . . . . . . . . . . . . . . . . . . . . . . 9,730 4,385 45.1 9,546 4,234 44.4 17,245 4,361 25.3 2,387 774 32.4
1986 . . . . . . . . . . . . . . . . . . . . . . . . 9,629 4,148 43.1 9,467 4,037 42.7 16,911 4,113 24.3 2,331 722 31.01985 . . . . . . . . . . . . . . . . . . . . . . . . 9,545 4,157 43.6 9,405 4,057 43.1 16,667 4,052 24.3 2,273 717 31.51984 . . . . . . . . . . . . . . . . . . . . . . . . 9,480 4,413 46.6 9,356 4,320 46.2 16,369 4,368 26.7 2,238 710 31.71983 . . . . . . . . . . . . . . . . . . . . . . . . 9,417 4,398 46.7 9,245 4,273 46.2 16,065 4,694 29.2 2,197 791 36.01982 . . . . . . . . . . . . . . . . . . . . . . . . 9,400 4,472 47.6 9,269 4,388 47.3 15,692 4,415 28.1 2,124 811 38.2
1981 . . . . . . . . . . . . . . . . . . . . . . . . 9,374 4,237 45.2 9,291 4,170 44.9 15,358 4,117 26.8 2,102 820 39.01980 . . . . . . . . . . . . . . . . . . . . . . . . 9,368 3,961 42.3 9,287 3,906 42.1 14,987 3,835 25.6 2,054 783 38.11979 . . . . . . . . . . . . . . . . . . . . . . . . 9,307 3,833 41.2 9,172 3,745 40.8 14,596 3,478 23.8 2,040 740 36.21978 . . . . . . . . . . . . . . . . . . . . . . . . 9,229 3,830 41.5 9,168 3,781 41.2 13,774 3,133 22.7 1,954 662 33.91977 . . . . . . . . . . . . . . . . . . . . . . . . 9,296 3,888 41.8 9,253 3,850 41.6 13,483 3,137 23.3 1,930 701 36.3
1976 . . . . . . . . . . . . . . . . . . . . . . . . 9,322 3,787 40.6 9,291 3,758 40.4 13,224 3,163 23.9 1,852 644 34.81975 . . . . . . . . . . . . . . . . . . . . . . . . 9,421 3,925 41.7 9,374 3,884 41.4 12,872 2,968 23.1 1,795 652 36.31974 . . . . . . . . . . . . . . . . . . . . . . . . 9,439 3,755 39.8 9,384 3,713 39.6 12,539 2,836 22.6 1,721 591 34.31973 . . . . . . . . . . . . . . . . . . . . . . . . N N N 9,405 3,822 40.6 N N N 1,672 620 37.11972 . . . . . . . . . . . . . . . . . . . . . . . . N N N 9,426 4,025 42.7 N N N 1,603 640 39.9
1971 . . . . . . . . . . . . . . . . . . . . . . . . N N N 9,414 3,836 40.4 N N N 1,584 623 39.31970 . . . . . . . . . . . . . . . . . . . . . . . . N N N 9,448 3,922 41.5 N N N 1,422 683 48.01969 . . . . . . . . . . . . . . . . . . . . . . . . N N N 9,290 3,677 39.6 N N N 1,373 689 50.21968 . . . . . . . . . . . . . . . . . . . . . . . . N N N N 4,188 43.1 N N N 1,374 655 47.71967 . . . . . . . . . . . . . . . . . . . . . . . . N N N N 4,558 47.4 N N N 1,341 715 53.31966 . . . . . . . . . . . . . . . . . . . . . . . . N N N N 4,774 50.6 N N N 1,311 722 55.11965 . . . . . . . . . . . . . . . . . . . . . . . . N N N N 5,022 65.6 N N N N 711 62.5
Table B-2.Poverty Status of People by Age, Race, and Hispanic Origin: 1959 to 2017—Con.(Numbers in thousands. People as of March of the following year. For information on confidentiality protection, sampling error, nonsampling error, and definitions, see www2.census.gov/programs-surveys/cps/techdocs/cpsmar18.pdf)
See footnotes at end of table.
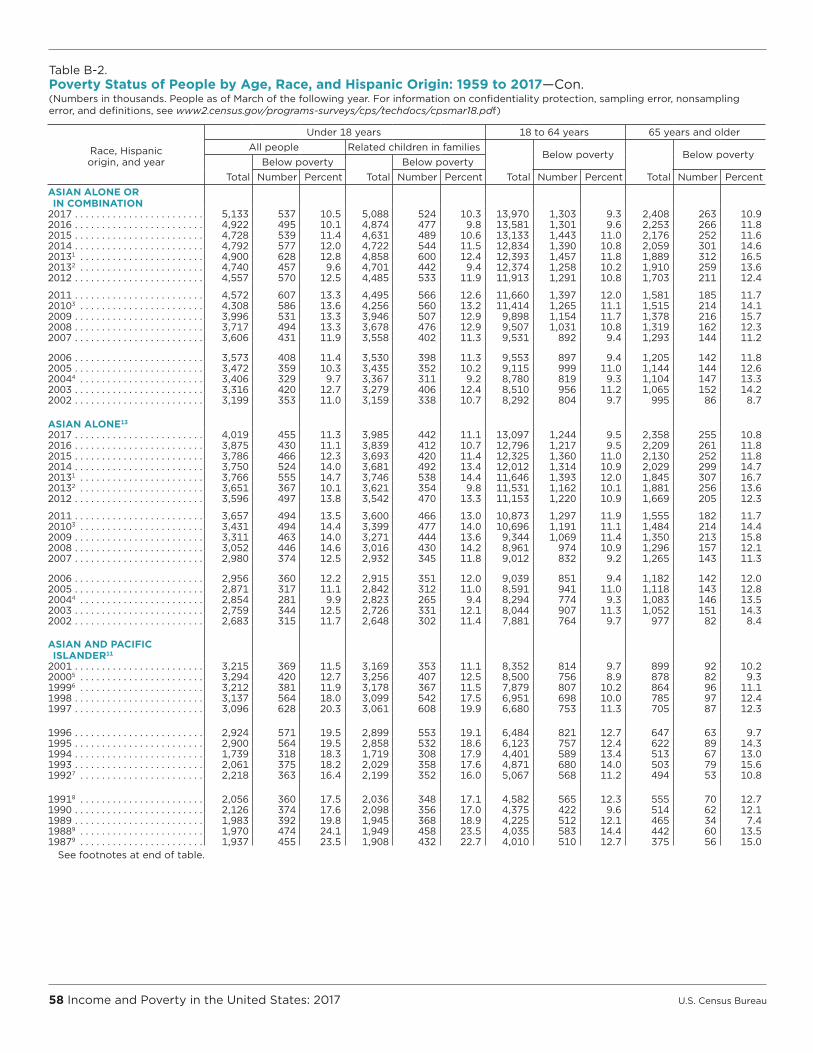
58 Income and Poverty in the United States: 2017 U.S. Census Bureau
Race, Hispanic origin, and year
Under 18 years 18 to 64 years 65 years and olderAll people Related children in families
Total
Below poverty
Total
Below poverty
TotalBelow poverty
TotalBelow poverty
Number Percent Number Percent Number Percent Number PercentASIAN ALONE OR IN COMBINATION2017 . . . . . . . . . . . . . . . . . . . . . . . . 5,133 537 10.5 5,088 524 10.3 13,970 1,303 9.3 2,408 263 10.92016 . . . . . . . . . . . . . . . . . . . . . . . . 4,922 495 10.1 4,874 477 9.8 13,581 1,301 9.6 2,253 266 11.82015 . . . . . . . . . . . . . . . . . . . . . . . . 4,728 539 11.4 4,631 489 10.6 13,133 1,443 11.0 2,176 252 11.62014 . . . . . . . . . . . . . . . . . . . . . . . . 4,792 577 12.0 4,722 544 11.5 12,834 1,390 10.8 2,059 301 14.620131 . . . . . . . . . . . . . . . . . . . . . . . 4,900 628 12.8 4,858 600 12.4 12,393 1,457 11.8 1,889 312 16.520132 . . . . . . . . . . . . . . . . . . . . . . . 4,740 457 9.6 4,701 442 9.4 12,374 1,258 10.2 1,910 259 13.62012 . . . . . . . . . . . . . . . . . . . . . . . . 4,557 570 12.5 4,485 533 11.9 11,913 1,291 10.8 1,703 211 12.4
2011 . . . . . . . . . . . . . . . . . . . . . . . . 4,572 607 13.3 4,495 566 12.6 11,660 1,397 12.0 1,581 185 11.720103 . . . . . . . . . . . . . . . . . . . . . . . 4,308 586 13.6 4,256 560 13.2 11,414 1,265 11.1 1,515 214 14.12009 . . . . . . . . . . . . . . . . . . . . . . . . 3,996 531 13.3 3,946 507 12.9 9,898 1,154 11.7 1,378 216 15.72008 . . . . . . . . . . . . . . . . . . . . . . . . 3,717 494 13.3 3,678 476 12.9 9,507 1,031 10.8 1,319 162 12.32007 . . . . . . . . . . . . . . . . . . . . . . . . 3,606 431 11.9 3,558 402 11.3 9,531 892 9.4 1,293 144 11.2
2006 . . . . . . . . . . . . . . . . . . . . . . . . 3,573 408 11.4 3,530 398 11.3 9,553 897 9.4 1,205 142 11.82005 . . . . . . . . . . . . . . . . . . . . . . . . 3,472 359 10.3 3,435 352 10.2 9,115 999 11.0 1,144 144 12.620044 . . . . . . . . . . . . . . . . . . . . . . . 3,406 329 9.7 3,367 311 9.2 8,780 819 9.3 1,104 147 13.32003 . . . . . . . . . . . . . . . . . . . . . . . . 3,316 420 12.7 3,279 406 12.4 8,510 956 11.2 1,065 152 14.22002 . . . . . . . . . . . . . . . . . . . . . . . . 3,199 353 11.0 3,159 338 10.7 8,292 804 9.7 995 86 8.7
ASIAN ALONE13
2017 . . . . . . . . . . . . . . . . . . . . . . . . 4,019 455 11.3 3,985 442 11.1 13,097 1,244 9.5 2,358 255 10.82016 . . . . . . . . . . . . . . . . . . . . . . . . 3,875 430 11.1 3,839 412 10.7 12,796 1,217 9.5 2,209 261 11.82015 . . . . . . . . . . . . . . . . . . . . . . . . 3,786 466 12.3 3,693 420 11.4 12,325 1,360 11.0 2,130 252 11.82014 . . . . . . . . . . . . . . . . . . . . . . . . 3,750 524 14.0 3,681 492 13.4 12,012 1,314 10.9 2,029 299 14.720131 . . . . . . . . . . . . . . . . . . . . . . . 3,766 555 14.7 3,746 538 14.4 11,646 1,393 12.0 1,845 307 16.720132 . . . . . . . . . . . . . . . . . . . . . . . 3,651 367 10.1 3,621 354 9.8 11,531 1,162 10.1 1,881 256 13.62012 . . . . . . . . . . . . . . . . . . . . . . . . 3,596 497 13.8 3,542 470 13.3 11,153 1,220 10.9 1,669 205 12.3
2011 . . . . . . . . . . . . . . . . . . . . . . . . 3,657 494 13.5 3,600 466 13.0 10,873 1,297 11.9 1,555 182 11.720103 . . . . . . . . . . . . . . . . . . . . . . . 3,431 494 14.4 3,399 477 14.0 10,696 1,191 11.1 1,484 214 14.42009 . . . . . . . . . . . . . . . . . . . . . . . . 3,311 463 14.0 3,271 444 13.6 9,344 1,069 11.4 1,350 213 15.82008 . . . . . . . . . . . . . . . . . . . . . . . . 3,052 446 14.6 3,016 430 14.2 8,961 974 10.9 1,296 157 12.12007 . . . . . . . . . . . . . . . . . . . . . . . . 2,980 374 12.5 2,932 345 11.8 9,012 832 9.2 1,265 143 11.3
2006 . . . . . . . . . . . . . . . . . . . . . . . . 2,956 360 12.2 2,915 351 12.0 9,039 851 9.4 1,182 142 12.02005 . . . . . . . . . . . . . . . . . . . . . . . . 2,871 317 11.1 2,842 312 11.0 8,591 941 11.0 1,118 143 12.820044 . . . . . . . . . . . . . . . . . . . . . . . 2,854 281 9.9 2,823 265 9.4 8,294 774 9.3 1,083 146 13.52003 . . . . . . . . . . . . . . . . . . . . . . . . 2,759 344 12.5 2,726 331 12.1 8,044 907 11.3 1,052 151 14.32002 . . . . . . . . . . . . . . . . . . . . . . . . 2,683 315 11.7 2,648 302 11.4 7,881 764 9.7 977 82 8.4
ASIAN AND PACIFIC ISLANDER11
2001 . . . . . . . . . . . . . . . . . . . . . . . . 3,215 369 11.5 3,169 353 11.1 8,352 814 9.7 899 92 10.220005 . . . . . . . . . . . . . . . . . . . . . . . 3,294 420 12.7 3,256 407 12.5 8,500 756 8.9 878 82 9.319996 . . . . . . . . . . . . . . . . . . . . . . . 3,212 381 11.9 3,178 367 11.5 7,879 807 10.2 864 96 11.11998 . . . . . . . . . . . . . . . . . . . . . . . . 3,137 564 18.0 3,099 542 17.5 6,951 698 10.0 785 97 12.41997 . . . . . . . . . . . . . . . . . . . . . . . . 3,096 628 20.3 3,061 608 19.9 6,680 753 11.3 705 87 12.3
1996 . . . . . . . . . . . . . . . . . . . . . . . . 2,924 571 19.5 2,899 553 19.1 6,484 821 12.7 647 63 9.71995 . . . . . . . . . . . . . . . . . . . . . . . . 2,900 564 19.5 2,858 532 18.6 6,123 757 12.4 622 89 14.31994 . . . . . . . . . . . . . . . . . . . . . . . . 1,739 318 18.3 1,719 308 17.9 4,401 589 13.4 513 67 13.01993 . . . . . . . . . . . . . . . . . . . . . . . . 2,061 375 18.2 2,029 358 17.6 4,871 680 14.0 503 79 15.619927 . . . . . . . . . . . . . . . . . . . . . . . 2,218 363 16.4 2,199 352 16.0 5,067 568 11.2 494 53 10.8
19918 . . . . . . . . . . . . . . . . . . . . . . . 2,056 360 17.5 2,036 348 17.1 4,582 565 12.3 555 70 12.71990 . . . . . . . . . . . . . . . . . . . . . . . . 2,126 374 17.6 2,098 356 17.0 4,375 422 9.6 514 62 12.11989 . . . . . . . . . . . . . . . . . . . . . . . . 1,983 392 19.8 1,945 368 18.9 4,225 512 12.1 465 34 7.419889 . . . . . . . . . . . . . . . . . . . . . . . 1,970 474 24.1 1,949 458 23.5 4,035 583 14.4 442 60 13.519879 . . . . . . . . . . . . . . . . . . . . . . . 1,937 455 23.5 1,908 432 22.7 4,010 510 12.7 375 56 15.0
Table B-2.Poverty Status of People by Age, Race, and Hispanic Origin: 1959 to 2017—Con.(Numbers in thousands. People as of March of the following year. For information on confidentiality protection, sampling error, nonsampling error, and definitions, see www2.census.gov/programs-surveys/cps/techdocs/cpsmar18.pdf)
See footnotes at end of table.

U.S. Census Bureau Income and Poverty in the United States: 2017 59
Race, Hispanic origin, and year
Under 18 years 18 to 64 years 65 years and olderAll people Related children in families
Total
Below poverty
Total
Below poverty
TotalBelow poverty
TotalBelow poverty
Number Percent Number Percent Number Percent Number PercentHISPANIC (ANY RACE)2017 . . . . . . . . . . . . . . . . . . . . . . . . 18,575 4,639 25.0 18,312 4,519 24.7 36,156 5,415 15.0 4,322 736 17.02016 . . . . . . . . . . . . . . . . . . . . . . . . 18,385 4,890 26.6 18,129 4,764 26.3 35,113 5,542 15.8 4,057 706 17.42015 . . . . . . . . . . . . . . . . . . . . . . . . 18,231 5,269 28.9 17,944 5,139 28.6 34,686 6,188 17.8 3,863 676 17.52014 . . . . . . . . . . . . . . . . . . . . . . . . 17,995 5,745 31.9 17,636 5,522 31.3 33,873 6,701 19.8 3,636 658 18.120131 . . . . . . . . . . . . . . . . . . . . . . . 17,898 5,907 33.0 17,496 5,638 32.2 32,839 6,746 20.5 3,443 704 20.420132 . . . . . . . . . . . . . . . . . . . . . . . 17,837 5,415 30.4 17,559 5,273 30.0 32,903 6,654 20.2 3,405 676 19.82012 . . . . . . . . . . . . . . . . . . . . . . . . 17,664 5,976 33.8 17,341 5,773 33.3 32,228 6,977 21.6 3,213 663 20.6
2011 . . . . . . . . . . . . . . . . . . . . . . . . 17,600 6,008 34.1 17,276 5,820 33.7 31,643 6,667 21.1 3,036 569 18.720103 . . . . . . . . . . . . . . . . . . . . . . . 17,371 6,059 34.9 16,964 5,815 34.3 30,740 6,948 22.6 2,860 516 18.02009 . . . . . . . . . . . . . . . . . . . . . . . . 16,965 5,610 33.1 16,655 5,419 32.5 29,031 6,224 21.4 2,815 516 18.32008 . . . . . . . . . . . . . . . . . . . . . . . . 16,370 5,010 30.6 16,138 4,888 30.3 28,311 5,452 19.3 2,717 525 19.32007 . . . . . . . . . . . . . . . . . . . . . . . . 15,647 4,482 28.6 15,375 4,348 28.3 27,731 4,970 17.9 2,555 438 17.1
2006 . . . . . . . . . . . . . . . . . . . . . . . . 15,147 4,072 26.9 14,907 3,959 26.6 27,209 4,698 17.3 2,428 472 19.42005 . . . . . . . . . . . . . . . . . . . . . . . . 14,654 4,143 28.3 14,361 3,977 27.7 26,051 4,765 18.3 2,315 460 19.920044 . . . . . . . . . . . . . . . . . . . . . . . 14,173 4,098 28.9 13,929 3,985 28.6 25,324 4,620 18.2 2,194 403 18.42003 . . . . . . . . . . . . . . . . . . . . . . . . 13,730 4,077 29.7 13,519 3,982 29.5 24,490 4,568 18.7 2,080 406 19.52002 . . . . . . . . . . . . . . . . . . . . . . . . 13,210 3,782 28.6 12,971 3,653 28.2 23,952 4,334 18.1 2,053 439 21.4
2001 . . . . . . . . . . . . . . . . . . . . . . . . 12,763 3,570 28.0 12,539 3,433 27.4 22,653 4,014 17.7 1,896 413 21.820005 . . . . . . . . . . . . . . . . . . . . . . . 12,399 3,522 28.4 12,115 3,342 27.6 21,734 3,844 17.7 1,822 381 20.919996 . . . . . . . . . . . . . . . . . . . . . . . 12,188 3,693 30.3 11,912 3,561 29.9 20,782 3,843 18.5 1,661 340 20.51998 . . . . . . . . . . . . . . . . . . . . . . . . 11,152 3,837 34.4 10,921 3,670 33.6 18,668 3,877 20.8 1,696 356 21.01997 . . . . . . . . . . . . . . . . . . . . . . . . 10,802 3,972 36.8 10,625 3,865 36.4 18,217 3,951 21.7 1,617 384 23.8
1996 . . . . . . . . . . . . . . . . . . . . . . . . 10,511 4,237 40.3 10,255 4,090 39.9 17,587 4,089 23.3 1,516 370 24.41995 . . . . . . . . . . . . . . . . . . . . . . . . 10,213 4,080 40.0 10,011 3,938 39.3 16,673 4,153 24.9 1,458 342 23.51994 . . . . . . . . . . . . . . . . . . . . . . . . 9,822 4,075 41.5 9,621 3,956 41.1 16,192 4,018 24.8 1,428 323 22.61993 . . . . . . . . . . . . . . . . . . . . . . . . 9,462 3,873 40.9 9,188 3,666 39.9 15,708 3,956 25.2 1,390 297 21.419927 . . . . . . . . . . . . . . . . . . . . . . . 9,081 3,637 40.0 8,829 3,440 39.0 15,268 3,668 24.0 1,298 287 22.1
19918 . . . . . . . . . . . . . . . . . . . . . . . 7,648 3,094 40.4 7,473 2,977 39.8 13,279 3,008 22.7 1,143 237 20.81990 . . . . . . . . . . . . . . . . . . . . . . . . 7,457 2,865 38.4 7,300 2,750 37.7 12,857 2,896 22.5 1,091 245 22.51989 . . . . . . . . . . . . . . . . . . . . . . . . 7,186 2,603 36.2 7,040 2,496 35.5 12,536 2,616 20.9 1,024 211 20.619889 . . . . . . . . . . . . . . . . . . . . . . . 7,003 2,631 37.6 6,908 2,576 37.3 12,056 2,501 20.7 1,005 225 22.419879 . . . . . . . . . . . . . . . . . . . . . . . 6,792 2,670 39.3 6,692 2,606 38.9 11,718 2,509 21.4 885 243 27.5
1986 . . . . . . . . . . . . . . . . . . . . . . . . 6,646 2,507 37.7 6,511 2,413 37.1 11,206 2,406 21.5 906 204 22.51985 . . . . . . . . . . . . . . . . . . . . . . . . 6,475 2,606 40.3 6,346 2,512 39.6 10,685 2,411 22.6 915 219 23.91984 . . . . . . . . . . . . . . . . . . . . . . . . 6,068 2,376 39.2 5,982 2,317 38.7 10,029 2,254 22.5 819 176 21.51983 . . . . . . . . . . . . . . . . . . . . . . . . 6,066 2,312 38.1 5,977 2,251 37.7 9,697 2,148 22.5 782 173 22.11982 . . . . . . . . . . . . . . . . . . . . . . . . 5,527 2,181 39.5 5,436 2,117 38.9 8,262 1,963 23.8 596 159 26.6
1981 . . . . . . . . . . . . . . . . . . . . . . . . 5,369 1,925 35.9 5,291 1,874 35.4 8,084 1,642 20.3 568 146 25.71980 . . . . . . . . . . . . . . . . . . . . . . . . 5,276 1,749 33.2 5,211 1,718 33.0 7,740 1,563 20.2 582 179 30.81979 . . . . . . . . . . . . . . . . . . . . . . . . 5,483 1,535 28.0 5,426 1,505 27.7 7,314 1,232 16.8 574 154 26.81978 . . . . . . . . . . . . . . . . . . . . . . . . 5,012 1,384 27.6 4,972 1,354 27.2 6,527 1,098 16.8 539 125 23.21977 . . . . . . . . . . . . . . . . . . . . . . . . 5,028 1,422 28.3 5,000 1,402 28.0 6,500 1,164 17.9 518 113 21.9
1976 . . . . . . . . . . . . . . . . . . . . . . . . 4,771 1,443 30.2 4,736 1,424 30.1 6,034 1,212 20.1 464 128 27.71975 . . . . . . . . . . . . . . . . . . . . . . . . N N N 4,896 1,619 33.1 N N N N 137 32.61974 . . . . . . . . . . . . . . . . . . . . . . . . N N N 4,939 1,414 28.6 N N N N 117 28.91973 . . . . . . . . . . . . . . . . . . . . . . . . N N N 4,910 1,364 27.8 N N N N 95 24.9
Table B-2.Poverty Status of People by Age, Race, and Hispanic Origin: 1959 to 2017—Con.(Numbers in thousands. People as of March of the following year. For information on confidentiality protection, sampling error, nonsampling error, and definitions, see www2.census.gov/programs-surveys/cps/techdocs/cpsmar18.pdf)
N Not available . 1 The 2014 CPS ASEC included redesigned questions for income and health insurance
coverage . All of the approximately 98,000 addresses were eligible to receive the redesigned set of health insurance coverage questions . The redesigned income questions were implemented to a subsample of these 98,000 addresses using a probability split panel design . Approximately 68,000 addresses were eligible to receive a set of income questions similar to those used in the 2013 CPS ASEC and the remaining 30,000 addresses were eligible to receive the redesigned income questions . The source of these 2013 estimates is the portion of the CPS ASEC sample which received the redesigned income questions, approximately 30,000 addresses .
2 The source of these 2013 estimates is the portion of the CPS ASEC sample which received the income questions consistent with the 2013 CPS ASEC, approximately 68,000 addresses .
3 Implementation of 2010 Census-based population controls .4 For 2004, estimates are revised to reflect a correction to the weights in the 2005 CPS
ASEC .5 Implementation of 2000 Census-based population controls and a 28,000 household
sample expansion .6 For 1999, estimates are based on 2000 Census population controls .7 For 1992, estimates are based on 1990 Census population controls .8 For 1991, estimates are revised to correct for nine omitted weights from the original
March 1992 CPS ASEC file .
9 For 1988 and 1987, estimates are based on new processing procedures and are also revised to reflect corrections to the files after publication of the 1988 advance report “Money Income and Poverty Status in the United States: 1988,” P-60, No . 166 .
10 The 2003 CPS allowed respondents to choose more than one race . White alone refers to people who reported White and did not report any other race category . The use of this single-race population does not imply that it is the preferred method of presenting or analyzing data . The Census Bureau uses a variety of approaches . Information on people who reported more than one race, such as White and American Indian and Alaska Native or Asian and Black or African American, is available from the 2010 Census through American FactFinder . About 2 .9 percent of people reported more than one race in the 2010 Census .
11 For 2001 and earlier years, the CPS allowed respondents to report only one race group . The reference race groups for 2001 and earlier poverty data are White, non-Hispanic White, Black, and Asian and Pacific Islander .
12 Black alone refers to people who reported Black and did not report any other race .13 Asian alone refers to people who reported Asian and did not report any other race .Note: Before 1979, people in unrelated subfamilies were included as people in families .
Beginning in 1979, people in unrelated subfamilies are included in all people but are excluded from people in families .
Source: U .S . Census Bureau, Current Population Survey, 1960 to 2018 Annual Social and Economic Supplements .

60 Income and Poverty in the United States: 2017 U.S. Census Bureau
Table B-3.Poverty Status of Families by Type of Family: 1959 to 2017(Numbers in thousands. Families as of March of the following year. For information on confidentiality protection, sampling error, nonsampling error, and definitions, see www2.census.gov/programs-surveys/cps/techdocs/cpsmar18.pdf )
Race, Hispanic origin, and year
All families Married-couple familiesMale householder,
no wife presentFemale householder, no husband present
TotalBelow poverty
TotalBelow poverty
TotalBelow poverty
TotalBelow poverty
Number Percent Number Percent Number Percent Number PercentALL RACES2017 . . . . . . . . . . . . . . . . . . . 83,103 7,758 9.3 61,254 3,005 4.9 6,424 793 12.4 15,425 3,959 25.72016 . . . . . . . . . . . . . . . . . . . 82,854 8,081 9.8 60,821 3,096 5.1 6,452 847 13.1 15,581 4,138 26.62015 . . . . . . . . . . . . . . . . . . . 82,199 8,589 10.4 60,258 3,245 5.4 6,311 939 14.9 15,630 4,404 28.22014 . . . . . . . . . . . . . . . . . . . 81,730 9,467 11.6 60,015 3,735 6.2 6,162 969 15.7 15,553 4,764 30.620131 . . . . . . . . . . . . . . . . . . 82,316 9,645 11.7 59,643 3,394 5.7 6,497 1,048 16.1 16,176 5,203 32.220132 . . . . . . . . . . . . . . . . . . 81,217 9,130 11.2 59,692 3,476 5.8 6,330 1,008 15.9 15,195 4,646 30.62012 . . . . . . . . . . . . . . . . . . . 80,944 9,520 11.8 59,224 3,705 6.3 6,231 1,023 16.4 15,489 4,793 30.92011 . . . . . . . . . . . . . . . . . . . 80,529 9,497 11.8 58,963 3,652 6.2 5,888 950 16.1 15,678 4,894 31.2
20103 . . . . . . . . . . . . . . . . . . 79,559 9,400 11.8 58,667 3,681 6.3 5,649 892 15.8 15,243 4,827 31.72009 . . . . . . . . . . . . . . . . . . . 78,867 8,792 11.1 58,428 3,409 5.8 5,582 942 16.9 14,857 4,441 29.92008 . . . . . . . . . . . . . . . . . . . 78,874 8,147 10.3 59,137 3,261 5.5 5,255 723 13.8 14,482 4,163 28.72007 . . . . . . . . . . . . . . . . . . . 77,908 7,623 9.8 58,395 2,849 4.9 5,103 696 13.6 14,411 4,078 28.32006 . . . . . . . . . . . . . . . . . . . 78,454 7,668 9.8 58,964 2,910 4.9 5,067 671 13.2 14,424 4,087 28.32005 . . . . . . . . . . . . . . . . . . . 77,418 7,657 9.9 58,189 2,944 5.1 5,134 669 13.0 14,095 4,044 28.720044 . . . . . . . . . . . . . . . . . . 76,866 7,835 10.2 57,983 3,216 5.5 4,901 657 13.4 13,981 3,962 28.32003 . . . . . . . . . . . . . . . . . . . 76,232 7,607 10.0 57,725 3,115 5.4 4,717 636 13.5 13,791 3,856 28.02002 . . . . . . . . . . . . . . . . . . . 75,616 7,229 9.6 57,327 3,052 5.3 4,663 564 12.1 13,626 3,613 26.52001 . . . . . . . . . . . . . . . . . . . 74,340 6,813 9.2 56,755 2,760 4.9 4,440 583 13.1 13,146 3,470 26.420005 . . . . . . . . . . . . . . . . . . 73,778 6,400 8.7 56,598 2,637 4.7 4,277 485 11.3 12,903 3,278 25.4
19996 . . . . . . . . . . . . . . . . . . 73,206 6,792 9.3 56,290 2,748 4.9 4,099 485 11.8 12,818 3,559 27.81998 . . . . . . . . . . . . . . . . . . . 71,551 7,186 10.0 54,778 2,879 5.3 3,977 476 12.0 12,796 3,831 29.91997 . . . . . . . . . . . . . . . . . . . 70,884 7,324 10.3 54,321 2,821 5.2 3,911 507 13.0 12,652 3,995 31.61996 . . . . . . . . . . . . . . . . . . . 70,241 7,708 11.0 53,604 3,010 5.6 3,847 531 13.8 12,790 4,167 32.61995 . . . . . . . . . . . . . . . . . . . 69,597 7,532 10.8 53,570 2,982 5.6 3,513 493 14.0 12,514 4,057 32.41994 . . . . . . . . . . . . . . . . . . . 69,313 8,053 11.6 53,865 3,272 6.1 3,228 549 17.0 12,220 4,232 34.61993 . . . . . . . . . . . . . . . . . . . 68,506 8,393 12.3 53,181 3,481 6.5 2,914 488 16.8 12,411 4,424 35.619927 . . . . . . . . . . . . . . . . . . 68,216 8,144 11.9 53,090 3,385 6.4 3,065 484 15.8 12,061 4,275 35.419918 . . . . . . . . . . . . . . . . . . 67,175 7,712 11.5 52,457 3,158 6.0 3,025 392 13.0 11,693 4,161 35.61990 . . . . . . . . . . . . . . . . . . . 66,322 7,098 10.7 52,147 2,981 5.7 2,907 349 12.0 11,268 3,768 33.4
1989 . . . . . . . . . . . . . . . . . . . 66,090 6,784 10.3 52,317 2,931 5.6 2,884 348 12.1 10,890 3,504 32.219889 . . . . . . . . . . . . . . . . . . 65,837 6,874 10.4 52,100 2,897 5.6 2,847 336 11.8 10,890 3,642 33.419879 . . . . . . . . . . . . . . . . . . 65,204 7,005 10.7 51,675 3,011 5.8 2,833 340 12.0 10,696 3,654 34.21986 . . . . . . . . . . . . . . . . . . . 64,491 7,023 10.9 51,537 3,123 6.1 2,510 287 11.4 10,445 3,613 34.61985 . . . . . . . . . . . . . . . . . . . 63,558 7,223 11.4 50,933 3,438 6.7 2,414 311 12.9 10,211 3,474 34.01984 . . . . . . . . . . . . . . . . . . . 62,706 7,277 11.6 50,350 3,488 6.9 2,228 292 13.1 10,129 3,498 34.51983 . . . . . . . . . . . . . . . . . . . 62,015 7,647 12.3 50,081 3,815 7.6 2,038 268 13.2 9,896 3,564 36.01982 . . . . . . . . . . . . . . . . . . . 61,393 7,512 12.2 49,908 3,789 7.6 2,016 290 14.4 9,469 3,434 36.31981 . . . . . . . . . . . . . . . . . . . 61,019 6,851 11.2 49,630 3,394 6.8 1,986 205 10.3 9,403 3,252 34.61980 . . . . . . . . . . . . . . . . . . . 60,309 6,217 10.3 49,294 3,032 6.2 1,933 213 11.0 9,082 2,972 32.7
1979 . . . . . . . . . . . . . . . . . . . 59,550 5,461 9.2 49,112 2,640 5.4 1,733 176 10.2 8,705 2,645 30.41978 . . . . . . . . . . . . . . . . . . . 57,804 5,280 9.1 47,692 2,474 5.2 1,654 152 9.2 8,458 2,654 31.41977 . . . . . . . . . . . . . . . . . . . 57,215 5,311 9.3 47,385 2,524 5.3 1,594 177 11.1 8,236 2,610 31.71976 . . . . . . . . . . . . . . . . . . . 56,710 5,311 9.4 47,497 2,606 5.5 1,500 162 10.8 7,713 2,543 33.01975 . . . . . . . . . . . . . . . . . . . 56,245 5,450 9.7 47,318 2,904 6.1 1,445 116 8.0 7,482 2,430 32.51974 . . . . . . . . . . . . . . . . . . . 55,698 4,922 8.8 47,069 2,474 5.3 1,399 125 8.9 7,230 2,324 32.11973 . . . . . . . . . . . . . . . . . . . 55,053 4,828 8.8 46,812 2,482 5.3 1,438 154 10.7 6,804 2,193 32.21972 . . . . . . . . . . . . . . . . . . . 54,373 5,075 9.3 46,314 N N 1,452 N N 6,607 2,158 32.71971 . . . . . . . . . . . . . . . . . . . 53,296 5,303 10.0 45,752 N N 1,353 N N 6,191 2,100 33.91970 . . . . . . . . . . . . . . . . . . . 52,227 5,260 10.1 44,739 N N 1,487 N N 6,001 1,952 32.5
1969 . . . . . . . . . . . . . . . . . . . 51,586 5,008 9.7 44,436 N N 1,559 N N 5,591 1,827 32.71968 . . . . . . . . . . . . . . . . . . . 50,511 5,047 10.0 43,842 N N 1,228 N N 5,441 1,755 32.31967 . . . . . . . . . . . . . . . . . . . 49,835 5,667 11.4 43,292 N N 1,210 N N 5,333 1,774 33.31966 . . . . . . . . . . . . . . . . . . . 48,921 5,784 11.8 42,553 N N 1,197 N N 5,171 1,721 33.11965 . . . . . . . . . . . . . . . . . . . 48,278 6,721 13.9 42,107 N N 1,179 N N 4,992 1,916 38.41964 . . . . . . . . . . . . . . . . . . . 47,836 7,160 15.0 41,648 N N 1,182 N N 5,006 1,822 36.41963 . . . . . . . . . . . . . . . . . . . 47,436 7,554 15.9 41,311 N N 1,243 N N 4,882 1,972 40.41962 . . . . . . . . . . . . . . . . . . . 46,998 8,077 17.2 40,923 N N 1,334 N N 4,741 2,034 42.91961 . . . . . . . . . . . . . . . . . . . 46,341 8,391 18.1 40,405 N N 1,293 N N 4,643 1,954 42.11960 . . . . . . . . . . . . . . . . . . . 45,435 8,243 18.1 39,624 N N 1,202 N N 4,609 1,955 42.41959 . . . . . . . . . . . . . . . . . . . 45,054 8,320 18.5 39,335 N N 1,226 N N 4,493 1,916 42.6
N Not available .1 The 2014 CPS ASEC included redesigned questions for income and health insurance
coverage . All of the approximately 98,000 addresses were eligible to receive the redesigned set of health insurance coverage questions . The redesigned income questions were implemented to a subsample of these 98,000 addresses using a probability split panel design . Approximately 68,000 addresses were eligible to receive a set of income questions similar to those used in the 2013 CPS ASEC and the remaining 30,000 addresses were eligible to receive the redesigned income questions . The source of these 2013 estimates is the portion of the CPS ASEC sample which received the redesigned income questions, approximately 30,000 addresses .
2 The source of these 2013 estimates is the portion of the CPS ASEC sample which received the income questions consistent with the 2013 CPS ASEC, approximately 68,000 addresses .
3 Implementation of 2010 Census-based population controls .4 For 2004, estimates are revised to reflect a correction to the weights in the 2005 CPS
ASEC .
5
ample expansion .6 For 1999, estimates are based on 2000 Census population controls .7 For 1992, estimates are based on 1990 Census population controls .8 For 1991, estimates are revised to correct for nine omitted weights from the original March
992 CPS ASEC file .9 For 1988 and 1987, estimates are based on new processing procedures and are also
evised to reflect corrections to the files after publication of the 1988 advance report “Money ncome and Poverty Status in the United States: 1988,” P-60, No . 166 .
Note: Before 1979, unrelated subfamilies were included in all families . Beginning in 1979, nrelated subfamilies are excluded from all families .
Source: U .S . Census Bureau, Current Population Survey, 1960 to 2018 Annual Social and conomic Supplements .
Implementation of 2000 Census-based population controls and a 28,000 household s
1
rI
u
E

U.S. Census Bureau Income and Poverty in the United States: 2017 61
APPENDIX C. REPLICATE WEIGHTS
Beginning in the 2011 Current Population Survey Annual Social and Economic Supplement (CPS ASEC) report, the variance of CPS ASEC estimates used to calculate the standard errors and confidence intervals displayed in the text tables were calculated using the Successive Difference Replication (SDR) method documented by Fay and Train (1995). This method involves the computa-tion of a set of replicate weights which account for the complex sur-vey design of the CPS.
In previous years, the standard errors of CPS ASEC estimates were calculated using a Generalized Variance Function (GVF) approach. Under this approach, generalized variance parameters were used in formulas provided in the source and accuracy (S&A) statement to esti-mate standard errors.
A study by Davern et al., 2006, found that the CPS ASEC GVF standard errors performed poorly against more precise Survey Design-Based (SDB) estimates. In most cases, Davern’s results indicated that the published GVF parameters significantly underestimated stan-dard errors in the CPS ASEC. This and other critiques prompted the Census Bureau to transition from
using the GVF method to the SDR method of estimating standard errors for the CPS ASEC. In 2009, the Census Bureau released repli-cate weights for the 2005 through 2009 CPS ASEC collection years and has released replicate weights for each year since with the release of the CPS ASEC public use data.
Following the 2009 release of CPS ASEC replicate weights, Boudreaux, Davern, and Graven (2011) compared replicate weight standard error esti-mates with SDB estimates. Replicate weight estimates performed mark-edly better against SDB standard errors than those calculated using the published GVF parameters. The Census Bureau will continue to provide the GVF parameters in the S&A statement, which can be found online at <www2.census.gov/library /publications/2018/demo /p60-263sa.pdf>.
Since the published GVF parameters generally underestimated standard errors, standard errors produced using SDR may be higher than in previous reports. For most CPS ASEC estimates, the increase in stan-dard errors from GVF to SDR will not alter the findings. However, margin-ally significant differences using the
GVF may not be significant using replicate weights.
References
Boudreaux, Michel, Michael Davern, and Peter Graven, “Alternative Variance Estimates in the Current Population Survey and the American Community Survey,” presented at the 2011 Annual Meeting of the Population Association of America. Available at <http://paa2011.princeton.edu /papers/112247>.
Davern, Michael, Arthur Jones, James Lepkowski, Gestur Davidson, and Lynn A. Blewett, “Unstable Inferences? An Examination of Complex Survey Sample Design Adjustments Using the Current Population Survey for Health Services Research,” Inquiry, Vol. 43, No. 3, 2006, pp. 283–297.
Fay, Robert E. and George F. Train, “Aspects of Survey and Model-Based Postcensal Estimation of Income and Poverty Characteristics for States and Counties,” Proceedings of the Section on Government Statistics, American Statistical Association, Alexandria, VA, 1995, pp. 154–159.


U.S. Census Bureau Income and Poverty in the United States: 2017 63
APPENDIX D. ADDITIONAL DATA AND CONTACTS
Detailed tables, historical tables, press releases, and briefings are available electronically on the Census Bureau’s income and poverty Web sites. The Web sites may be accessed through the Census Bureau’s home page at <www.census.gov> or directly at <www.census.gov/topics /income-poverty/income.html> for income data and <www.census.gov/topics /income-poverty/poverty.html> for poverty data.
For assistance with income and poverty data or questions about them, contact the U.S. Census Bureau Customer Service Center at 1-800-923-8282 (toll-free) or search your topic of interest using the Census Bureau’s “Question and Answer Center” found at <https://ask.census.gov/>.
Customized Tables
The CPS Table Creatorwww.census.gov/cps/data /cpstablecreator.html Gives data users the ability to create customized tables from the Current Population Survey Annual Social and Economic Supplement (CPS ASEC). Table Creator can access data back to the 2003 CPS ASEC.
Public Use Microdata
CPS ASECMicrodata for the 2018 CPS ASEC and earlier years are available online at <https://thedataweb .rm.census.gov/ftp/cps_ftp .html#cpsmarch>. Technical methods have been applied to CPS microdata to avoid disclosing the identities of individuals from whom data were collected.
Taxes and Noncash BenefitsIn the early 1980s, the Census Bureau embarked on a research
program to examine the effects of taxes and noncash benefits on poverty and income distributional measures. Public use data containing these additional variables are typically released later in the year and are available online at <https://thedataweb.rm.census.gov /ftp/cps_ftp.html#cpsmarch>.
Research FilesThe Census Bureau produces special research files that enable research-ers to replicate alternative poverty estimates. These files are typically released later in the year and are available online at <www.census .gov/topics/income-poverty /supplemental-poverty-measure /data/datasets.html>.
Census Data API
The Census Data Application Programming Interface (API) gives the public access to raw statistical data from various Census Bureau data programs. It is an efficient way to query data directly from Census Bureau servers with many advan-tages including the ability to eas-ily download target variables and geographies and immediate access to the most current data. The Census Data API’s simple raw format pro-vides greater ease and accessibil-ity for inputting data to whatever format is needed for presenting and manipulating these data. Users can find which datasets are currently available via API online at <www.census.gov/data /developers/data-sets.html>.
Topcoding
In its long history of releasing public use microdata files based on the CPS ASEC, the Census Bureau has always censored the release of “high income” amounts in order to meet the requirements of Title 13. This process is often called topcoding.
Prior to the March 1996 survey, this censorship was applied by limiting the values for income amounts to be no greater than a specified maximum value (the topcode), which varied by source and year. From 1996 to 2010, mean values were substituted for all amounts above the topcode. Using a specified maximum value or the mean value for all amounts above the topcode made it impos-sible to examine the distribution of income above the topcode. To allevi-ate these problems and improve the overall usefulness of the data, the Census Bureau implemented a rank proximity swapping method in the 2011 CPS ASEC. In this method, income amounts above the topcode are switched between respondents that are of similar rank. Swapped amounts are rounded following the swapping process to provide addi-tional disclosure avoidance. Extract files containing swapped income values for survey years 1975 to 2010 are available on the Census Bureau’s FTP site at <www.census.gov/data /datasets/time-series/demo /income-poverty/data-extracts .html>.
Comments
The Census Bureau welcomes the comments and advice of data and report users. If you have suggestions or comments on this report, please write to:
Trudi J. Renwick Assistant Division Chief, Economic Characteristics Social, Economic, and Housing Statistics Division U.S. Census Bureau Washington, DC 20233–8500 E-mail: [email protected]


Income and
Poverty in the U
nited States: 20
17P
60
-263
Current P
op
ulation R
epo
rtsU
.S. C
ensus Bureau
U.S. Department of CommerceEconomics and Statistics AdministrationU.S. CENSUS BUREAUWashington, DC 20233
OFFICIAL BUSINESS
Penalty for Private Use $300
FIRST-CLASS MAILPOSTAGE & FEES PAIDU.S. Census Bureau
Permit No. G-58