Embed Size (px)
Citation preview

Measuring Income and Poverty in Federal Health‐Related SurveysFederal Health Related Surveys
Constance F Citro DirectorConstance F. Citro, DirectorCommittee on National Statistics
NCVHS – Hyattsville, MD – March 8, 2012NCVHS Hyattsville, MD March 8, 2012
BOTTOM LINE
Critical (but challenging) to include goodCritical (but challenging) to include good income measures in federal health/health care surveys and to be able to approximatecare surveys and to be able to approximate the new Supplemental Poverty Measure
Just as critical not to reinvent the wheelJust as critical not to reinvent the wheel—interagency collaboration is key
M k i f d b k CNSTATMy remarks are informed by my work at CNSTAT on measuring income and poverty
What is the Committee on National Statistics?National Statistics?
Established in 1972 at the National AcademiesEstablished in 1972 at the National Academies to improve the statistical methods and information on which public policy decisionsinformation on which public policy decisions are based
Carries out studies to foster better measures ofCarries out studies to foster better measures of the economy, crime, poverty, and other domains and serves as coordinating force indomains, and serves as coordinating force in the highly decentralized U.S. federal statistical systemsystem
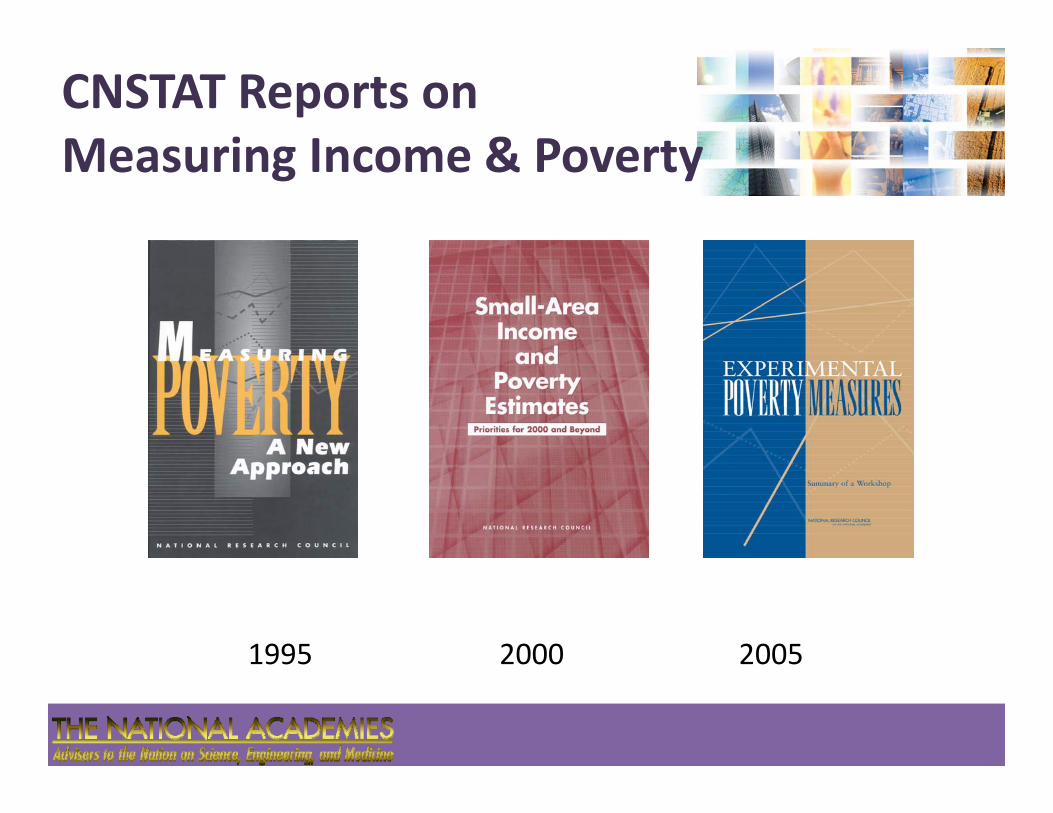
CNSTAT Reports on Measuring Income & PovertyMeasuring Income & Poverty
1995 2000 20051995 2000 2005
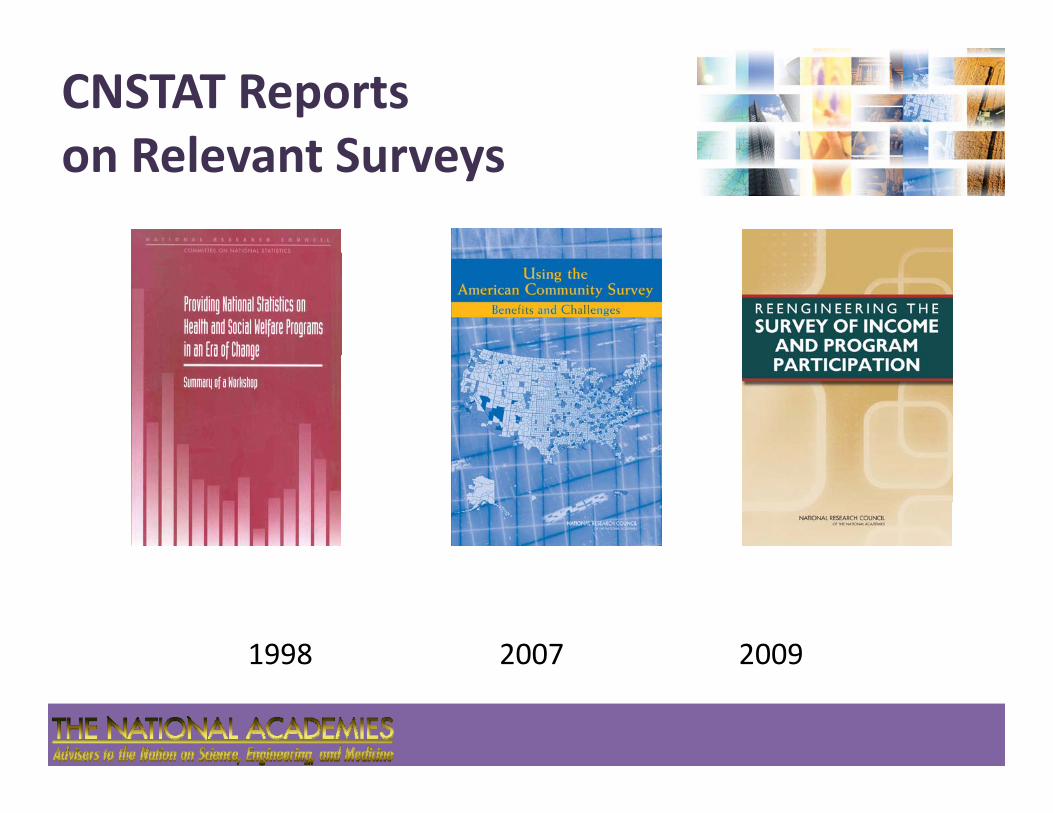
CNSTAT Reportson Relevant Surveyson Relevant Surveys
1998 2007 20091998 2007 2009
Uses of Income Statistics—To describe the populationTo describe the population
Annual income is one of the most commonlyAnnual income is one of the most commonly used measures of the economic condition of the population nationwide and for geographic areas and subgroups
Descriptions often focus on median household or family income and/or on multiples of the poverty threshold (<100%,<200%, etc.)
The Gini coefficient is another, although not as often cited, statistic on income inequality
Uses of Income Statistics—To evaluate programsTo evaluate programs
Federal agencies use income statistics to evaluate howFederal agencies use income statistics to evaluate how effectively their programs reach the target population (e.g., USDA Food and Nutrition Service regularly estimates SNAP “take‐up rates”)
DHHS will be using poverty statistics and, hopefully, a f di l i i k tnew measure of medical care economic risk to
evaluate take‐up rates and economic effects of expanded health insurance coverage under ACAexpanded health insurance coverage under ACA
Medicaid eligibility and Medicare Part D and ACA co‐pays/subsidies key off income as percent of povertyp y y p p y

Uses of Income Statistics—To understand relationshipsTo understand relationships
A mixed bag: Jim Smith et al have addressedA mixed bag: Jim Smith et al. have addressed complex relationships of health with current income and with income when growing upincome and with income when growing up
Key findings:h l h h k i l lif d i>health shocks in later life reduce income>education and childhood poverty status (not current income or wealth) positively affect health over the life course

Bottom Line
Income may be less needed than education forIncome may be less needed than education for some research (e.g., on causal pathways between SES and health) but it is key forbetween SES and health), but it is key for research on disparities in health care access, the economic effects of episodes of illness thethe economic effects of episodes of illness, the economic impact of ACA, and similar topics
Income also needed in federal health surveys forIncome also needed in federal health surveys for descriptive and program evaluation purposes
Income Is Difficult to Collect
Unfortunately income is hard to measure inUnfortunately, income is hard to measure in surveys—
>Income is underreported for many income>Income is underreported for many income types, sometimes by substantial amountsI f l f bl k>Income amounts are often left blank>Poverty measurement using the new Supplemental Poverty Measure is complicated by the need for additional information
Underreportingp g
Total annual income is underreported in surveysTotal annual income is underreported in surveys relative to administrative benchmarks:
>The underreporting is about 10% in CPS/ASEC>The underreporting is about 10% in CPS/ASEC>The underreporting is 5‐10% worse in SIPP, MEPS d NHIS d i h CPS ( dMEPS, and NHIS compared with CPS (and worse in NHIS for lower‐income)
(from National Research Council, Reengineering SIPP, 2009; Czajka and Denmead, 2009)

Underreporting, cont’dp g
Earnings is well reported in surveys BUT in SIPPEarnings is well reported in surveys , BUT in SIPP and CPS/ASEC (our best income surveys):
>TANF benefits are underreported by 40 50%>TANF benefits are underreported by 40‐50%>Social Security (OASI) is well reported, but Soc S Di bili i d d b 15 20%Sec Disability is underreported by 15‐20%
>Unemployment insurance is underreported by 25‐30%
And on it goes (from Meyer, Mok, and Sullivan, 2009)
Imputation for Missing Data
Substantial fractions of the income amounts inSubstantial fractions of the income amounts in major surveys are imputed—as much as 32‐34% in CPS SIPP and NHIS and 43% in MEPS34% in CPS, SIPP, and NHIS, and 43% in MEPS
In the CPS, three sources contribute to such high imputation rates: nonresponse to the mainimputation rates: nonresponse to the main CPS questionnaire; nonresponse to the income supplement; and item nonresponseincome supplement; and item nonresponse
(from Czajka and Denmead, 2009)
SPM Complicationsp
The new Supplemental Poverty Measure (SPM)The new Supplemental Poverty Measure (SPM) is a much better tool for policy analysis and research than the official measure but itresearch than the official measure, but it needs lots of input, not just cash income—
Family relationships employment status of—Family relationships, employment status of parent(s), in‐kind benefits, taxes, medical out of pocket expenses (MOOP) child careout‐of‐pocket expenses (MOOP), child care and child support payments
Income Is Essential—So What Do We Do?So What Do We Do?Some principles—>Health‐related surveys are just that and should not burden respondents with the detail that is pincluded in income surveys
>Goal is minimum question set to produce>Goal is minimum question set to produce reasonable estimates (perhaps a longer set when more detail would add analytic power)when more detail would add analytic power)
>Use the same (tested) format and wording—there is no reason for idiosyncratic differencesthere is no reason for idiosyncratic differences
Income Is Essential—So What Do We Do?So What Do We Do?Implementation—>Interagency group (including Census and BLS) should develop minimum set of questions that p qresearch shows produce reasonably accurate amounts—for instance, the ACS has 8 ,questions (plus total income) that have worked well (see Czajka and Denmead, 2009)( j , )
>Income should be obtained for the entire family and not just an individual respondentfamily and not just an individual respondent
Approximating the SPM IsEssential So What Do We Do?Essential—So What Do We Do?
Go after KEY information—Go after KEY information>Family size and composition (include
cohabitors and their kids as part of familycohabitors and their kids as part of family, also foster children)
E l f ( )>Employment status of parent(s)>Participation in major in‐kind programs>MOOP (two new questions in CPS on premiums
and other out‐of‐pocket work well)p )
Approximating the SPM, cont’dpp g
Ask the Census Bureau to develop an easy‐to‐Ask the Census Bureau to develop an easy touse calculator for estimating the SPM with information on family size and compositioninformation on family size and composition, cash income, in‐kind benefit participation, employment status of parent(s) and MOOPemployment status of parent(s), and MOOP
From this info, the calculator should be able to estimate the other components of the SPMestimate the other components of the SPM—child care, other work expenses, and net taxes
Other Thoughtsg
Work with the Census Bureau on methods forWork with the Census Bureau on methods for using administrative records to improve income estimates in CPS and SIPP (seeincome estimates in CPS and SIPP (see Reengineering SIPP, 2009—there is really no excuse not to have better estimatesexcuse not to have better estimates, particularly for lower income families)
From this work generate adjustment factors toFrom this work, generate adjustment factors to apply to health survey income reports

Other Thoughts, cont’dg
Obtain neighborhood estimates of medianObtain neighborhood estimates of median income and poverty for small geographic areas from ACS to append to health surveyareas from ACS to append to health survey data records (see Neighborhood Poverty: Context and Consequences for ChildrenContext and Consequences for Children, Duncan, Brooks‐Gunn, and Aber, 2000)

Thank You for Your AttentionYour Attention
Contact information
Connie [email protected]
http://www7 nationalacademies org/cnstat/http://www7.nationalacademies.org/cnstat/