Embed Size (px)
Citation preview
CHALLENGES AND BEST PRACTICE IN LCAS OF SEAFOOD AND OTHER AQUATIC PRODUCTS
Including GHG emissions from mangrove forests LULUCin LCA: a case study on shrimp farming in the Mekong Delta,Vietnam
Natasha Järviö1,2 & Patrik J. G. Henriksson3,4& Jeroen B. Guinée1
Received: 6 March 2016 /Accepted: 18 April 2017 /Published online: 23 May 2017# The Author(s) 2017. This article is an open access publication
AbstractPurpose Mangrove forests have been recognized as importantregulators of greenhouse gases (GHGs), yet the resulting landuse and land-use change (LULUC) emissions have rarely beenaccounted for in life cycle assessment (LCA) studies. Thepresent study therefore presents up-to-date estimates forGHG emissions from mangrove LULUC and applies themto a case study of shrimp farming in Vietnam.Methods To estimate the global warming impacts of man-grove LULUC, a combination of the International Panel forClimate Change (IPCC) guidelines, the Net CommittedEmissions, and the Missed Potential Carbon Sink methodwere used. A literature review was then conducted to charac-terize the most critical parameters for calculating carbonlosses, missed sequestration, methane fluxes, and dinitrogenmonoxide emissions.Results and discussion Our estimated LUC emissions frommangrove deforestation resulted in 124 t CO2 ha−1 year−1,assuming IPCC’s recommendations of 1 m of soil loss, and
96% carbon oxidation. In addition to this, 1.25 t of carbonwould no longer be sequestered annually. Discounted over20 years, this resulted in total LULUC emissions of 129 tCO2 ha−1 year−1 (CV = 0.441, lognormal distribution (ln)).Shrimp farms in the Mekong Delta, however, can today oper-ate for 50 years or more, but are 1.5 m deep (50% oxidation).In addition to this, Asian tiger shrimp farming in mixed man-grove concurrent farms (the only type of shrimp farm thatresulted in mangrove deforestation since 2000 in our casestudy) resulted in 533 kg methane and 1.67 kg dinitrogenmonoxide per hectare annually. Consequently, the LULUCGHG emissions resulted in 184 and 282 t CO2-eq t−1 liveshrimp at farm gate, using mass and economic allocation,respectively. These GHG emissions are about an order ofmagnitude higher than from semi-intensive or intensiveshrimp farming systems. Limitations in data quality and quan-tity also led us to quantify the uncertainties around our emis-sion estimates, resulting in a CVof between 0.4 and 0.5.Conclusions Our results reinforce the urgency of conservingmangrove forests and the need to quantify uncertaintiesaround LULUC emissions. It also questions mixed mangroveconcurrent shrimp farming, where partial removal of man-grove forests is endorsed based upon the benefits of partialmangrove conservation and maintenance of certain ecosystemservices. While we recognize that these activities limit thechances of complete removal, our estimates show that largeGHG emissions frommangrove LULUC question the sustain-ability of this type of shrimp farming, especially since mixedmangrove farming only provide 5% of all farmed shrimp pro-duced in Vietnam.
Keywords Aquaculture . Carbon footprint . Deforestation .
Land use . Land-use change . LCA .Mangrove . Shrimp .
Vietnam
Responsible editor: Matthias Finkbeiner
Electronic supplementary material The online version of this article(doi:10.1007/s11367-017-1332-9) contains supplementary material,which is available to authorized users.
* Jeroen B. Guiné[email protected]
1 Institute of Environmental Science CML, Leiden University,Einsteinweg 2, 2333 CC Leiden, Netherlands
2 Finnish Environment Institute (SYKE), Mechelininkatu 34a,FI-00260 Helsinki, Finland
3 Stockholm Resilience Centre, Stockholm University, Kräftriket 2B,114 19 Stockholm, Sweden
4 WorldFish, Jalan Batu Maung, 11960 Penang, Malaysia
Int J Life Cycle Assess (2018) 23:1078–1090DOI 10.1007/s11367-017-1332-9
1 Introduction
Mangrove forests are among the most productive tropicalecosystems in the world, with net annual productionexceeding that of most terrestrial forests (Twilley et al. 1992;Eong 1993; Kauffman et al. 2011; Mcleod et al. 2011). Theyhave also been recognized for their importance in providingvaluable ecosystem services (Rönnbäck 1999; Hong and Dao2004; Bouillon et al. 2008; Kristensen et al. 2008). Theseinclude coastline protection from storms, erosion, salineintrusion, and pollution (Rönnbäck 1999; Hong and Dao2004), supporting and maintaining biodiversity, and provisionof energy to adjacent ecosystems (Rönnbäck 1999; Kristensenet al. 2008). More recently, the important role of mangroveforests in the capture and sequestration of carbon dioxide(CO2) from the atmosphere has gained increasing recognition,as mangrove forests, unlike terrestrial forests, do not becomesaturated with carbon, and sediments accrete vertically(Mcleod et al. 2011). The sequestration of carbon in sedimentsand the depth of the soil may therefore continue to increaseover millennia (Eong 1993; Duarte et al. 2005; Mcleod et al.2011). Their organically rich soils, typically extendingdownward over several meters, make up one of the largestorganic carbon reserves in the terrestrial biosphere (Chmuraet al. 2003; Lovelock 2008). Sequestration rates have beenestimated at between 228 and 766 t ha−1 year−1 (Kauffmanet al. 2011; Lundstrum and Chen 2014). Hypoxic conditionsand the lack of other high-energy oxidants, in combinationwith a paucity of fungi, limit the opportunity for degrada-tion, thereby providing good conditions for long-termstorage of carbon (Middleton and McKee 2001). This, to-gether with high biomass burial rates, the high potential ageof mangrove trees, and a slow turnover rate, results incarbon storage rates relevant at global scales (Duarte et al.2005; FAO 2007).
Despite the recognition of their ecological value, mangroveforests worldwide are under threat from land-use change, withannual deforestation rates between 0.7 and 2.1%, far exceed-ing those of inland tropical forests (Murray et al. 2012). Forexample, countries like Thailand and Vietnam, which harborlarge shares of the global mangrove forests, have beenreported to have lost 43% of their mangrove forests since1980 and are to be at risk of losing an additional third of theremaining forests over the next two decades unless theirgovernments improve the protection of mangrove areas(WWF 2013). Expansions of aquaculture and especiallyshrimp farming have been held accountable for 30% of themangrove loss in SE Asia (Richards and Friess 2015). This asmost shrimp species are most productive when farmed inbrackish water, which often results in the establishment ofshrimp ponds in coastal regions where they compete withmangrove forests (Béland et al. 2006; Murray et al. 2012).Given an annual growth rate of the shrimp farming in Asia
of 8% over the last decade, alongside continued agriculturaland urban growth, the future will surely pose additional threatsto the mangrove ecosystems in the region (FAO FishstatJ2014; Richards and Friess 2015).
Already in 2007, Milà i Canals called for more papers ondealing with land use-related greenhouse gas emissions(GHG) in life cycle assessment (LCA), while growing scien-tific concerns about mangrove deforestation have been accu-mulating with regards to aquaculture and mangrove defores-tation. Despite this, few aquaculture LCAs have includedmangrove land use and land-use change (LULUC) emissionsto date (Henriksson et al. 2012). The International Panel forClimate Change (IPCC) published guidelines for the estima-tion of carbon dioxide emissions from land-use change ofmangrove forests caused by aquaculture in 2013 (IPCC2014). These guidelines, however, have their limitations, asthey provide no guidance on carbon or methane (CH4) ordinitrogen monoxide (N2O) emissions regarding land use foraquaculture purposes. This means that the continuous highrate of carbon burial into the soil of mangrove forests is notconsidered, although this is what distinguishes these forestsfrom other terrestrial forests (Duarte et al. 2005; FAO 2007;Mcleod et al. 2011), and emissions of two other potent GHGsoften go unaccounted for.
Following criticism, shrimp farming practices have beenimproved in many countries: new farms are now establishedoutside mangrove areas, productivity has increased, and betterfarm management has allowed farms to continue operationsover longer time periods without having to relocate due tosediment build-up (Lebel et al. 2002, 2010). Despite this, con-cerns about the conversion of mangrove forests into shrimpfarms were again raised by Prof. JB Kauffman during the2012 meeting of the American Association for theAdvancement of Science (Stokstad 2012). During this meet-ing, Kauffman highlighted that the carbon dioxide emissionsresulting from mangrove deforestation amounted to 198 kgCO2 per 100 g of shrimp tails. While this definitely raisesconcerns, some assumptions regarding the location of newlyestablished shrimp farms, pond productivity, and pondlifespan were later called into question by the GlobalAquaculture Alliance (Global Aquaculture Alliance 2012).
Given the controversies surrounding the emissionsresulting from LULUC due to mangrove deforestation forshrimp farming and the clear lack of its resulting emissionsin LCAs, the present study aimed to present up-to-date GHGemission estimates for mangrove LULUC. We also demon-strate our accounting methods using shrimp farming as a casestudy. To put these emissions into context, we also used theLCA framework (ISO 2006), allowing GHG emissions fromsemi-intensive and intensive shrimp production chains to beconsidered as a reference. Using the LULUC emission factorsand production data for shrimp farming in the Mekong Deltaof Vietnam, we estimated the contributions of mangrove
Int J Life Cycle Assess (2018) 23:1078–1090 1079

LULUC emissions relative to the overall carbon footprint ofshrimp farming.
In order to address our identified shortcoming in liter-ature, each section first aims to quantify the GHG emis-sion from generic mangrove deforestation using IPCC as-sumptions, followed by its application to the shrimp casestudy. Section 2 thus first identifies the relevant parame-ters for calculating the GHG emissions from mangrovedeforestation, including changes in carbon stocks as visu-alized in Fig. 1, and characteristics of CH4 and N2O-fluxes (Section 2.3). This is followed by details aboutthe case study in Section 2.3. Section 3 subsequently pre-sents the ranges of results derived from literature for eachparameter and summarizes these as easy-to-use LCA pa-rameters including uncertainty estimates. These valueswere also modified for the case study in Section 3.3 toquantify the impact of shrimp farming in previous man-grove areas in terms of CO2-equivalents (CO2-eq).Finally, in the discussion and conclusion, we expand onthe implications of our findings.
2 Materials and methods
The carbon stock dynamics resulting from mangrove defores-tation are illustrated in Fig. 1 with each, before (time < 0) andafter (time > 0) the establishment of shrimp ponds. Beforeland-use change (LUC), above- and below-ground and litterC stocks remain approximately constant over time. It is as-sumed that, in general, primary mangrove forests are in equi-librium and are therefore not storing more biomass over time(IPCC 2006). However, the carbon in the mangrove soil willincrease over time due to a continuous carbon burial rate, asseen in Fig. 1. LUC is a consequence of the establishment ofthe shrimp farm during its first year by removing the above-and below-ground vegetation and excavation of ponds,resulting in the loss and oxidization of all carbon stored inthe above- and below-ground parts of the mangrove, in thelitter and in part of the soil. The resulting emissions are there-fore allocated to the LUC activity (β). This also means that allemissions that occur during later years, i.e., oxidization of thecarbon in the soil over time (δ), are considered to be a
Fig. 1 To calculate CO2 emissions resulting from mangrove LULUC,this figure depicts the important processes behind LUC (β and δ) and LU(θ) CO2 emissions frommangrove forests. The LUC carbon losses consistof the above-ground (AG), below-ground (BG), soil (S), and litter (L)CO2 emissions, regardless of when in time they occur (i.e. the oxidizationof carbon in the soil over time, δ) (IPCC 2006; Cederberg et al. 2011). LU
CO2 emissions are based on the mangrove’s potential carbonsequestration rates. The LUC carbon losses (β and δ) are factual lossesthat can be measured at the point when they occur. The emissionsresulting from LU (θ), on the other hand, are based on potentialsequestration rates
1080 Int J Life Cycle Assess (2018) 23:1078–1090
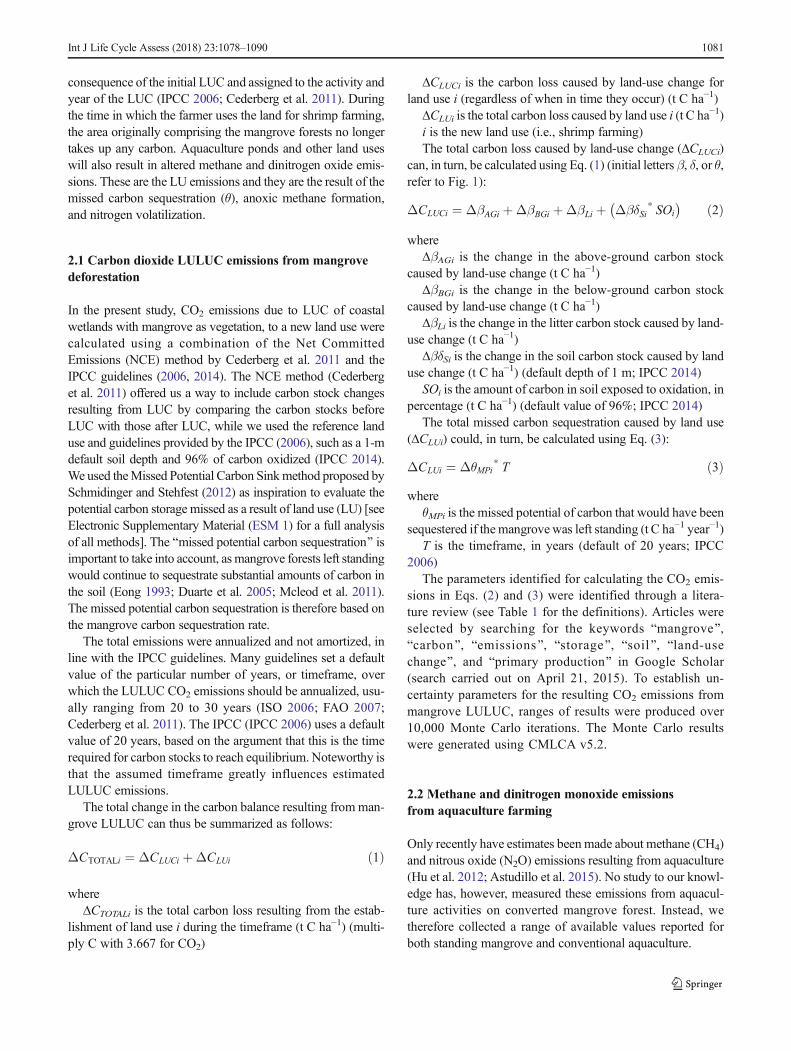
consequence of the initial LUC and assigned to the activity andyear of the LUC (IPCC 2006; Cederberg et al. 2011). Duringthe time in which the farmer uses the land for shrimp farming,the area originally comprising the mangrove forests no longertakes up any carbon. Aquaculture ponds and other land useswill also result in altered methane and dinitrogen oxide emis-sions. These are the LU emissions and they are the result of themissed carbon sequestration (θ), anoxic methane formation,and nitrogen volatilization.
2.1 Carbon dioxide LULUC emissions from mangrovedeforestation
In the present study, CO2 emissions due to LUC of coastalwetlands with mangrove as vegetation, to a new land use werecalculated using a combination of the Net CommittedEmissions (NCE) method by Cederberg et al. 2011 and theIPCC guidelines (2006, 2014). The NCE method (Cederberget al. 2011) offered us a way to include carbon stock changesresulting from LUC by comparing the carbon stocks beforeLUC with those after LUC, while we used the reference landuse and guidelines provided by the IPCC (2006), such as a 1-mdefault soil depth and 96% of carbon oxidized (IPCC 2014).We used theMissed Potential Carbon Sinkmethod proposed bySchmidinger and Stehfest (2012) as inspiration to evaluate thepotential carbon storage missed as a result of land use (LU) [seeElectronic Supplementary Material (ESM 1) for a full analysisof all methods]. The Bmissed potential carbon sequestration^ isimportant to take into account, asmangrove forests left standingwould continue to sequestrate substantial amounts of carbon inthe soil (Eong 1993; Duarte et al. 2005; Mcleod et al. 2011).The missed potential carbon sequestration is therefore based onthe mangrove carbon sequestration rate.
The total emissions were annualized and not amortized, inline with the IPCC guidelines. Many guidelines set a defaultvalue of the particular number of years, or timeframe, overwhich the LULUC CO2 emissions should be annualized, usu-ally ranging from 20 to 30 years (ISO 2006; FAO 2007;Cederberg et al. 2011). The IPCC (IPCC 2006) uses a defaultvalue of 20 years, based on the argument that this is the timerequired for carbon stocks to reach equilibrium. Noteworthy isthat the assumed timeframe greatly influences estimatedLULUC emissions.
The total change in the carbon balance resulting fromman-grove LULUC can thus be summarized as follows:
ΔCTOTALi ¼ ΔCLUCi þΔCLUi ð1Þ
whereΔCTOTALi is the total carbon loss resulting from the estab-
lishment of land use i during the timeframe (t C ha−1) (multi-ply C with 3.667 for CO2)
ΔCLUCi is the carbon loss caused by land-use change forland use i (regardless of when in time they occur) (t C ha−1)
ΔCLUi is the total carbon loss caused by land use i (t C ha−1)i is the new land use (i.e., shrimp farming)The total carbon loss caused by land-use change (ΔCLUCi)
can, in turn, be calculated using Eq. (1) (initial letters β, δ, or θ,refer to Fig. 1):
ΔCLUCi ¼ ΔβAGi þΔβBGi þΔβLi þ ΔβδSi* SOi
� � ð2Þ
whereΔβAGi is the change in the above-ground carbon stock
caused by land-use change (t C ha−1)ΔβBGi is the change in the below-ground carbon stock
caused by land-use change (t C ha−1)ΔβLi is the change in the litter carbon stock caused by land-
use change (t C ha−1)ΔβδSi is the change in the soil carbon stock caused by land
use change (t C ha−1) (default depth of 1 m; IPCC 2014)SOi is the amount of carbon in soil exposed to oxidation, in
percentage (t C ha−1) (default value of 96%; IPCC 2014)The total missed carbon sequestration caused by land use
(ΔCLUi) could, in turn, be calculated using Eq. (3):
ΔCLUi ¼ ΔθMPi* T ð3Þ
whereθMPi is the missed potential of carbon that would have been
sequestered if the mangrove was left standing (t C ha−1 year−1)T is the timeframe, in years (default of 20 years; IPCC
2006)The parameters identified for calculating the CO2 emis-
sions in Eqs. (2) and (3) were identified through a litera-ture review (see Table 1 for the definitions). Articles wereselected by searching for the keywords Bmangrove^,Bcarbon^, Bemissions^, Bstorage^, Bsoil^, Bland-usechange^, and Bprimary production^ in Google Scholar(search carried out on April 21, 2015). To establish un-certainty parameters for the resulting CO2 emissions frommangrove LULUC, ranges of results were produced over10,000 Monte Carlo iterations. The Monte Carlo resultswere generated using CMLCA v5.2.
2.2 Methane and dinitrogen monoxide emissionsfrom aquaculture farming
Only recently have estimates been made about methane (CH4)and nitrous oxide (N2O) emissions resulting from aquaculture(Hu et al. 2012; Astudillo et al. 2015). No study to our knowl-edge has, however, measured these emissions from aquacul-ture activities on converted mangrove forest. Instead, wetherefore collected a range of available values reported forboth standing mangrove and conventional aquaculture.
Int J Life Cycle Assess (2018) 23:1078–1090 1081

2.3 Case study: shrimp farming in the Mekong Delta,Vietnam.
To illustrate the potential GHG emissions from mangroveLULUC, we applied the proposed method in combinationwith data collected for 200 randomly selected shrimpfarmers in Vietnam between 2011 and 2012 as part ofthe EU FP7 SEAT project (European Commission withinthe Seventh Framework Programme, Sustainable EthicalAquaculture Trade) (www.seatglobal.eu) (Murray et al.2013; Henriksson et al. 2015). Vietnam is one of theworld’s leading exporters of shrimp, with a significantgrowth in production since the mid-1980s. Most of theshrimp farms are in the Mekong Delta, and specificallythe province of Ca Mau. This area also harbors about onethird of the remaining mangrove forests of Vietnam(Jonell and Henriksson 2014). These mangrove forestsalso support mixed mangrove concurrent farming ofAsian tiger shrimp (Penaeus monodon), an extensivefarming practice with minimal to no external inputs thattakes place within the mangrove forest. The original intentof this practice was to provide partial protection of man-grove forests by allowing families to use up to 30% of the
land and surface water to generate income, therebypreventing complete deforestation (McNally et al. 2010).Besides the mixed mangrove farms, four other kinds ofshrimp farming practices have been identified in Mekongdelta; these and their main difference are listed in Table 2(FAO 2005; Phan et al. 2011). For a more elaborate ex-planation about the differences in farming practices iden-tified during the SEAT project, we refer to Phan et al.(2011) and Henriksson et al. (2015).
Shrimp farms are established by removing the vegetation(or part of it) or transforming the land from alternative landuses (commonly rice paddies), followed by digging of ponds.Although the depth of ponds can vary slightly between farm-ing practices, an average pond depth of 1.5 m was assumed(Phan et al. 2011; Murray et al. 2013) meaning that 1.5 m ofsoil carbon was assumed to be lost. Mangrove forests haveshallow root systems, which means that most of the roots arefound in the upper 0.7 m of the soil (National Oceanic andAtmospheric Administration-Earth System 2010). All man-grove roots were therefore considered lost during pond con-struction. The exact amount of carbon that is removed as soilis more difficult to predict, as some of the sediments normallyare used to construct pond walls, where the carbon would
Table 1 Definition of parametersrelevant to the calculation of thecarbon footprint of mangroveLULUC
Parameter Alternative names Description
AG Above-ground carbon The above-ground carbon includes all carbon found in the livebiomass located above the ground, which includes the stems of thetrees, their branches, and their leaves.
BG Below-ground carbon Below-ground carbon includes all carbon found in live biomasslocated below the ground, which not only includes the carbon inactual below-ground root biomass but also the prop roots whichare in fact located above the ground. It does not include the carbonfound in soil.
S Soil/sediments Soil carbon is the carbon stored in the soil. Soil contains dead organicmaterial derived from decomposed plants and animals, andinorganic matter that have built up over time. Per IPCC, a soildepth of 1 m should be considered, but for the shrimp case study,1.5 m was adopted based upon the average depth reported byfarmers.
L Litter Litter is all dead biomass including material that was previously partof the bulk of biomass in the net primary production. Litter Cstocks include both above- and below-ground litter stocks. Littercan include just leaves, but also slash, stumps, dead trees,stipulates, reproductive parts, branches, and debris.
CS (Missed potential for)carbon sequestration
Carbon burial to soil refers to the process of the carbon being buriedin the sediments. This is caused by the production ofcarbon-containing litter in the ecosystem and the import of carbonfrom adjacent ecosystems. Part of this carbon gets trapped into thesediments, where it can remain in the soil for centuries. In theliterature, carbon sequestration is often used interchangeably withcarbon burial rates (Mcleod et al. 2011). Both refer to thelong-term storage of CO2 from the atmosphere and its depositionin reservoirs, where long-term refers to centuries to millennia(Mcleod et al. 2011). Missed potential carbon sequestration refersto the amount of carbon sequestration not realized due tomangrove forest being converted to, i.e., shrimp ponds.
1082 Int J Life Cycle Assess (2018) 23:1078–1090
degrade under hypoxic conditions (Mungkung 2005). Carbonloss due to soil removal consequently depends on many fac-tors, including the depth of the pond, the age of the shrimpfarm and wall, the size and surface area of the wall, and thefate of the sediments after the shrimp farm has been aban-doned. It has been conservatively assumed in previous studiesthat about half of the carbon is oxidized (Eong 1993), and thisassumption was adopted in the calculations for the presentstudy.
To identify which types of shrimp farms result in mangroveLULUC, the GPS coordinates from the SEAT survey wereevaluated using satellite images, comparing land use beforeand after the establishment of the farms, and categorized basedupon prior land use and farming practices. While the SEATdataset also includes farmer testimonies on prior land use,these responses were sometimes biased due to shifts in farmownership and to Vietnamese shrimp farmers being aware ofthe controversy surrounding mangrove deforestation. Satelliteimages from Google Earth (Google 2013), the Global LandCover by National Mapping Organizations (ISCGM 2003),and a map showing global mangrove distribution developedby Giri et al. (2011) were therefore used to supplement thefarmers’ responses.
The combination of three sources of satellite imageryprovided information about the historic land use goingback to the year 2000, before any of the analyzed shrimpfarms had been established. Present mangrove cover wasestimated by locating the farms on Google Earth, drawingboundary lines around the pond, and estimating the per-centage of mangrove within this boundary. All mangrovelocated within the boundary of the shrimp pond were con-sidered to be part of the pond (for an example anddescription of mixed mangrove concurrent shrimp farm,see the s tudy by Jonel l and Henr iksson 2014) .Consequently, the difference in mangrove cover beforeand after pond establishment could be determined forthe different types of shrimp farming (for more details onthe method used, see the ESM 1 of this article). Low-resolution images were excluded from further analyses.
After the shrimp farming systems that resulted in man-grove deforestation had been identified, the resultingGHG emissions from LULUC were calculated. The func-tional unit of the shrimp production was defined as 1 t of
live weight shrimp at farm. The average lifetime ofshrimp farms was deemed as the most suitable timeframe,as all shrimp produced contribute equally to the mangroveforest LULUC. A timeframe of 50 years, the current lifeexpectancy of a shrimp farm, was therefore used to annu-alize emissions (Jonell and Henriksson 2014) (see ESM2for calculations).
3 Results
3.1 Carbon dioxide emissions per hectare of deforestedmangrove
Parameters for Eqs. (2) and (3) are presented in Table 3. Due tothe limited literature values, studies describing globally diversemangrove forests were used. Our estimated emissions cantherefore be used as proxies for mangrove LULUC emissionsworldwide, but also entail large uncertainties (see ESM 1).
Given the presented ranges, all distributions except lit-ter C (assumed as normally distributed) were assumed tobe lognormal (ln). For default mangrove removal annual-ized over 20 years, as recommended by the IPCC, theresulting CO2 emissions were 129 t CO2 ha−1 year−1
(CV = 0.441, ln), while if the emissions were annualizedover 50 years, the annual emission was estimated to 54 tCO2 ha−1 year−1 (CV = 0.424, ln). The ESM 2 gives amore detailed report on the results of the literature studyand the calculated results.
3.2 Methane and dinitrogen monoxide emissions perhectare of mangrove converted to aquaculture pond
Studies on intact mangrove suggest that methane fluxes inestuarine wetlands, including mangrove forests, are re-markably low due to the inhibition of methanogenesisby sulfates (Kristensen et al. 2008; Howe et al. 2009).Deforestation and fish farming undoubtedly increasethese gas fluxes, an assumption also supported byAstudillo et al. (2015) (Table 4). We consequentlyadopted Astudillo et al.’s (2015) estimate (533 kg CH4
ha−1 year−1; CV = 0.4, ln) as a worst-case scenario. Asfor dinitrogen monoxide, emissions are more dependent
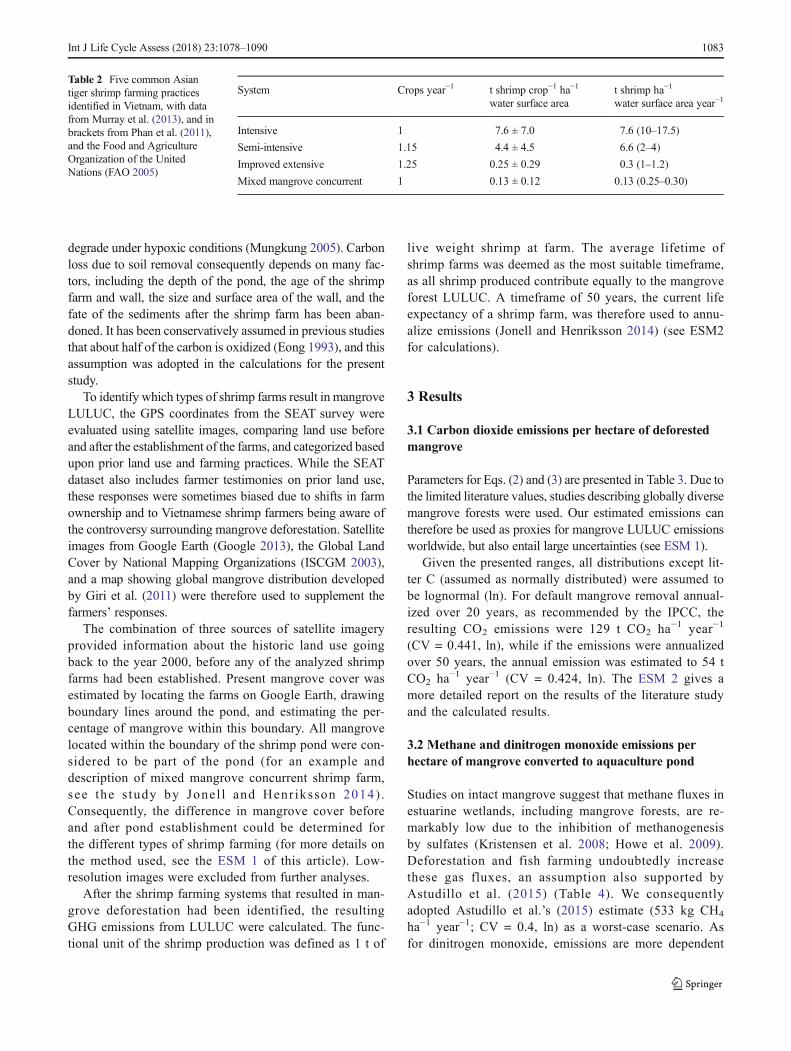
Table 2 Five common Asiantiger shrimp farming practicesidentified in Vietnam, with datafrom Murray et al. (2013), and inbrackets from Phan et al. (2011),and the Food and AgricultureOrganization of the UnitedNations (FAO 2005)
System Crops year−1 t shrimp crop−1 ha−1
water surface areat shrimp ha−1
water surface area year−1
Intensive 1 7.6 ± 7.0 7.6 (10–17.5)
Semi-intensive 1.15 4.4 ± 4.5 6.6 (2–4)
Improved extensive 1.25 0.25 ± 0.29 0.3 (1–1.2)
Mixed mangrove concurrent 1 0.13 ± 0.12 0.13 (0.25–0.30)
Int J Life Cycle Assess (2018) 23:1078–1090 1083

on the inputs of nitrogen into the ponds as feed or fertil-izer. Hu et al. (2012), for example, assumed that 1.8% ofthe nitrogen input was converted to dinitrogen monoxide(as N2O-N, or 1.15% as N2O). The IPCC (2014) alsoadopted the generic estimate of 1.69 kg N2O-N t−1 fishby Hu et al. (2012) for mangrove-integrated aquaculture.Since we know that most mixed mangrove shrimp farm-ing systems are net removers of nitrogen (Jonell andHenriksson 2014), and that standing mangrove even po-tentially could be a net inhibitor of dinitrogen monoxideemissions (Allen et al. 2007), we here assume a precau-tions scenario of 1.67 kg N2O ha−1 year−1 (CV = 0.575,ln).
3.3 Greenhouse gas emissions from shrimp farmingLULUC case study
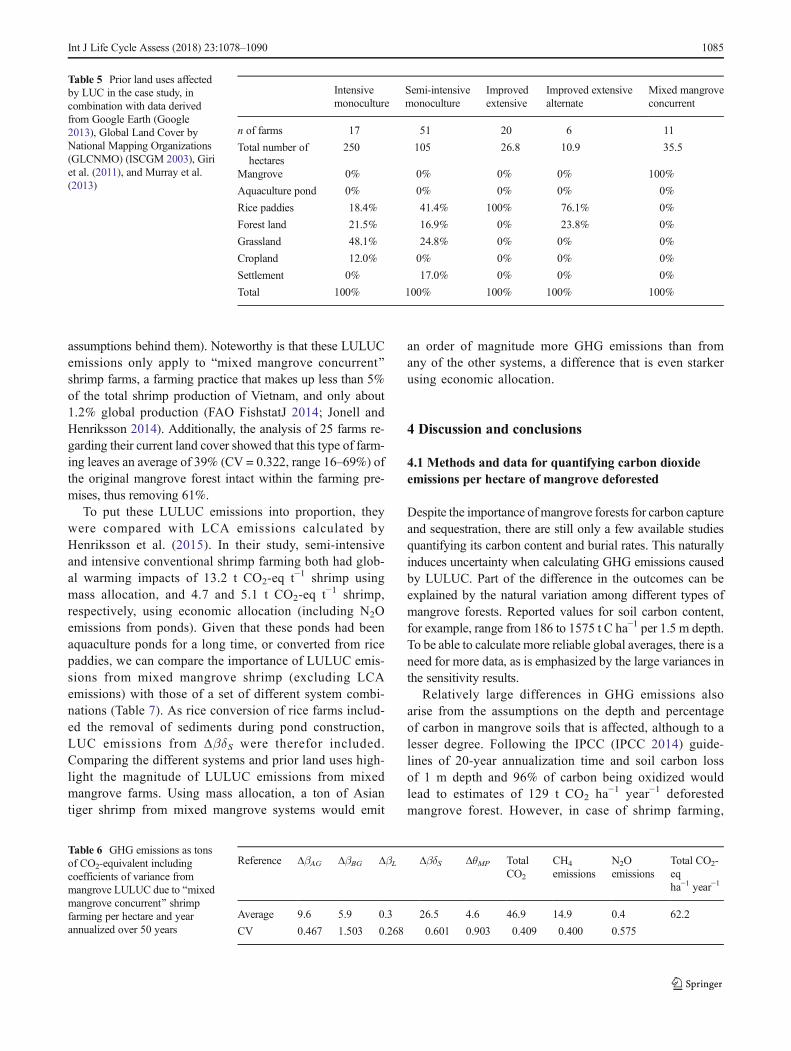
The analysis of historic land use identified only Bmixedmangrove concurrent^ shrimp farms being established informer mangrove areas (Table 5). It was assumed thatthese shrimp farms were the primary cause for the
mangrove deforestation, as there were no indications ofother activities on this land. Considering that only Bmixedmangrove concurrent^ shrimp farms were identified ascausing mangrove deforestation, the related GHG emis-sions from mangrove LULUC were only calculated forthis type of farming practice. Table 6 lists the GHG emis-sions per hectare per year for mixed mangrove concurrentshrimp farms.
The average mixed mangrove concurrent shrimp farm pro-duces about 6.5 t of shrimp by water area over 50 years.However, Asian tiger shrimp are not the only commodity pro-duced in these ponds (Vu et al. 2013; Jonell and Henriksson2014), with only about 39.2% of the total output being Asiantiger shrimp by volume and 59.7% by value. The rest of theharvest consists of a mix of other shrimps, mud crabs, andother aquaculture products (Vu et al. 2013; Jonell andHenriksson 2014). The GHG emissions from mangroveLULUC from shrimp farming were subsequently estimatedto be 184 t CO2-eq t−1 live shrimp at farm gate using massallocation and 282 t CO2-eq t−1 live shrimp using economicallocation (see ESM 2 for details on the calculations and
Table 3 Overview of averagevalues of mangrove forest carbonstocks
Reference Parameter Median CV (distribution) Range n
AG Above-ground C stock (t C ha−1)a 131 0.462 (ln) 49.5–261 9
BG Below-ground C stock (t C ha−1)b 80 1.525 (ln) 9.61–410 8
S Soil C stock per 1.5 m of depth (t C ha−1)c 724 0.595 (ln) 186.15–1575 8
L Litter loss C stocks (t C ha−1)d 4.03 0.477 (n) 0.15–7 12
CS C Missed potential (t C ha−1 year−1)e 1.25 0.936 (ln) 0.012–3.53 8
ln lognormal distribution, n normal distributiona Twilley et al. 1992; Eong 1993; Matsui 1998; Kauffman et al. 2011; Donato et al. 2011; Ray et al. 2011; Donatoet al. 2012bKomiyama et al. 1987; Twilley et al. 1992; Matsui 1998; Kauffman et al. 2011; Ray et al. 2011; Donato et al.2012c Eong 1993; Matsui 1998; Kauffman et al. 2011; Ray et al. 2011; Donato et al. 2012; Lundstrum and Chen 2014d Twilley et al. 1992; Amarasinghe and Balasubramaniam 1992; Eong 1993; Day et al. 1996; Middleton andMcKee 2001; Jennerjahn and Ittekkot 2004; Guzman et al. 2005; Ray et al. 2011e Twilley et al. 1992; Eong 1993; Duarte and Cabrián 1996; Chmura et al. 2003; Alongi 2008; Sanders et al. 2010;Ray et al. 2011; Mcleod et al. 2011
Table 4 Literature values
System Emission Mean Uncertainty estimate Reference
Intact mangrove forest kg CH4 ha−2 year−1 342 CV = 1.448 (ln) Allen et al. 2007
kg N2O ha−2 year−1 1.67 CV = 0.575 (ln) Allen et al. 2007
Open aquaculture ponds kg CH4 ha−1 year−1 533 CV = 0.40 (ln) Astrudillo et al. 2015
N2O-N 1.8% of N input – Hu et al. 2012
Rewetted land, previously vegetatedby mangrove, salinity <18 ppm
kg CH4 ha−1 year−1 194 CV = 2.290 (ln) IPCC 2014
Rewetted land, previously vegetatedby mangrove, salinity >18 ppm
kg CH4 ha−1 year−1 0 Range = 0–40 (uniform) IPCC 2014
1084 Int J Life Cycle Assess (2018) 23:1078–1090
assumptions behind them). Noteworthy is that these LULUCemissions only apply to Bmixed mangrove concurrent^shrimp farms, a farming practice that makes up less than 5%of the total shrimp production of Vietnam, and only about1.2% global production (FAO FishstatJ 2014; Jonell andHenriksson 2014). Additionally, the analysis of 25 farms re-garding their current land cover showed that this type of farm-ing leaves an average of 39% (CV = 0.322, range 16–69%) ofthe original mangrove forest intact within the farming pre-mises, thus removing 61%.
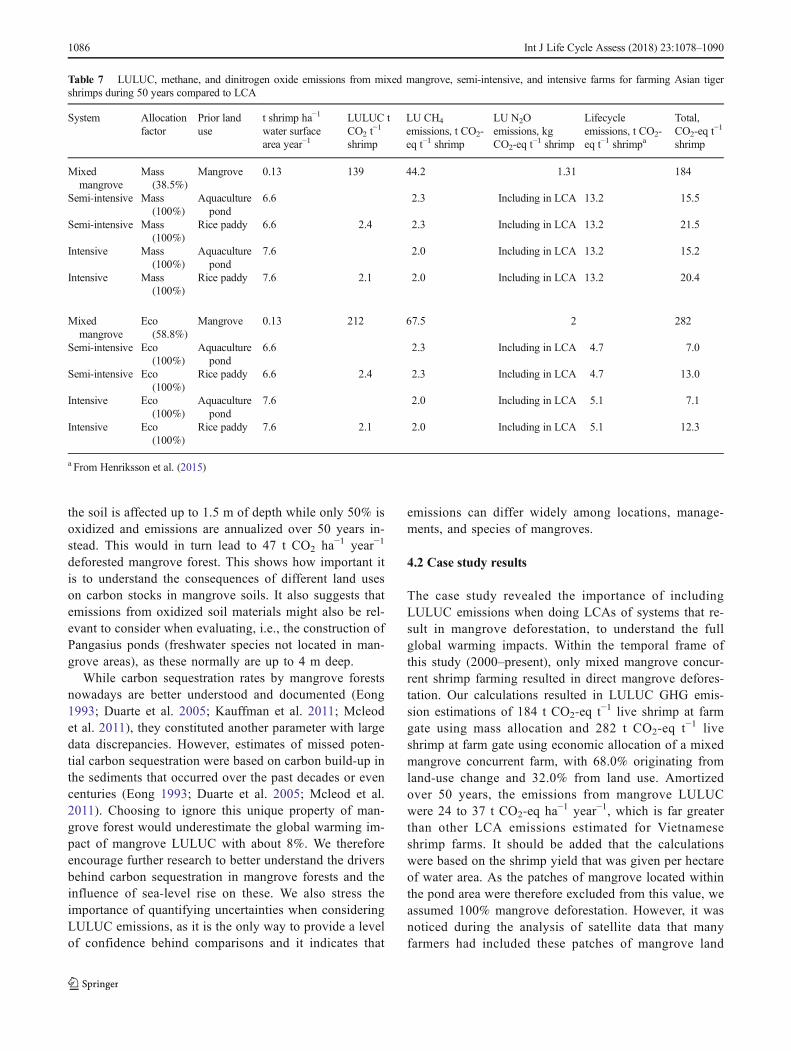
To put these LULUC emissions into proportion, theywere compared with LCA emissions calculated byHenriksson et al. (2015). In their study, semi-intensiveand intensive conventional shrimp farming both had glob-al warming impacts of 13.2 t CO2-eq t−1 shrimp usingmass allocation, and 4.7 and 5.1 t CO2-eq t−1 shrimp,respectively, using economic allocation (including N2Oemissions from ponds). Given that these ponds had beenaquaculture ponds for a long time, or converted from ricepaddies, we can compare the importance of LULUC emis-sions from mixed mangrove shrimp (excluding LCAemissions) with those of a set of different system combi-nations (Table 7). As rice conversion of rice farms includ-ed the removal of sediments during pond construction,LUC emissions from ΔβδS were therefor included.Comparing the different systems and prior land uses high-light the magnitude of LULUC emissions from mixedmangrove farms. Using mass allocation, a ton of Asiantiger shrimp from mixed mangrove systems would emit
an order of magnitude more GHG emissions than fromany of the other systems, a difference that is even starkerusing economic allocation.
4 Discussion and conclusions
4.1 Methods and data for quantifying carbon dioxideemissions per hectare of mangrove deforested
Despite the importance ofmangrove forests for carbon captureand sequestration, there are still only a few available studiesquantifying its carbon content and burial rates. This naturallyinduces uncertainty when calculating GHG emissions causedby LULUC. Part of the difference in the outcomes can beexplained by the natural variation among different types ofmangrove forests. Reported values for soil carbon content,for example, range from 186 to 1575 t C ha−1 per 1.5 m depth.To be able to calculate more reliable global averages, there is aneed for more data, as is emphasized by the large variances inthe sensitivity results.
Relatively large differences in GHG emissions alsoarise from the assumptions on the depth and percentageof carbon in mangrove soils that is affected, although to alesser degree. Following the IPCC (IPCC 2014) guide-lines of 20-year annualization time and soil carbon lossof 1 m depth and 96% of carbon being oxidized wouldlead to estimates of 129 t CO2 ha−1 year−1 deforestedmangrove forest. However, in case of shrimp farming,
Table 5 Prior land uses affectedby LUC in the case study, incombination with data derivedfrom Google Earth (Google2013), Global Land Cover byNational Mapping Organizations(GLCNMO) (ISCGM 2003), Giriet al. (2011), and Murray et al.(2013)
Intensivemonoculture
Semi-intensivemonoculture
Improvedextensive
Improved extensivealternate
Mixed mangroveconcurrent
n of farms 17 51 20 6 11
Total number ofhectares
250 105 26.8 10.9 35.5
Mangrove 0% 0% 0% 0% 100%
Aquaculture pond 0% 0% 0% 0% 0%
Rice paddies 18.4% 41.4% 100% 76.1% 0%
Forest land 21.5% 16.9% 0% 23.8% 0%
Grassland 48.1% 24.8% 0% 0% 0%
Cropland 12.0% 0% 0% 0% 0%
Settlement 0% 17.0% 0% 0% 0%
Total 100% 100% 100% 100% 100%
Table 6 GHG emissions as tonsof CO2-equivalent includingcoefficients of variance frommangrove LULUC due to Bmixedmangrove concurrent^ shrimpfarming per hectare and yearannualized over 50 years
Reference ΔβAG ΔβBG ΔβL ΔβδS ΔθMP TotalCO2
CH4
emissionsN2Oemissions
Total CO2-eqha−1 year−1
Average 9.6 5.9 0.3 26.5 4.6 46.9 14.9 0.4 62.2
CV 0.467 1.503 0.268 0.601 0.903 0.409 0.400 0.575
Int J Life Cycle Assess (2018) 23:1078–1090 1085
the soil is affected up to 1.5 m of depth while only 50% isoxidized and emissions are annualized over 50 years in-stead. This would in turn lead to 47 t CO2 ha−1 year−1
deforested mangrove forest. This shows how important itis to understand the consequences of different land useson carbon stocks in mangrove soils. It also suggests thatemissions from oxidized soil materials might also be rel-evant to consider when evaluating, i.e., the construction ofPangasius ponds (freshwater species not located in man-grove areas), as these normally are up to 4 m deep.
While carbon sequestration rates by mangrove forestsnowadays are better understood and documented (Eong1993; Duarte et al. 2005; Kauffman et al. 2011; Mcleodet al. 2011), they constituted another parameter with largedata discrepancies. However, estimates of missed poten-tial carbon sequestration were based on carbon build-up inthe sediments that occurred over the past decades or evencenturies (Eong 1993; Duarte et al. 2005; Mcleod et al.2011). Choosing to ignore this unique property of man-grove forest would underestimate the global warming im-pact of mangrove LULUC with about 8%. We thereforeencourage further research to better understand the driversbehind carbon sequestration in mangrove forests and theinfluence of sea-level rise on these. We also stress theimportance of quantifying uncertainties when consideringLULUC emissions, as it is the only way to provide a levelof confidence behind comparisons and it indicates that
emissions can differ widely among locations, manage-ments, and species of mangroves.
4.2 Case study results
The case study revealed the importance of includingLULUC emissions when doing LCAs of systems that re-sult in mangrove deforestation, to understand the fullglobal warming impacts. Within the temporal frame ofthis study (2000–present), only mixed mangrove concur-rent shrimp farming resulted in direct mangrove defores-tation. Our calculations resulted in LULUC GHG emis-sion estimations of 184 t CO2-eq t−1 live shrimp at farmgate using mass allocation and 282 t CO2-eq t−1 liveshrimp at farm gate using economic allocation of a mixedmangrove concurrent farm, with 68.0% originating fromland-use change and 32.0% from land use. Amortizedover 50 years, the emissions from mangrove LULUCwere 24 to 37 t CO2-eq ha−1 year−1, which is far greaterthan other LCA emissions estimated for Vietnameseshrimp farms. It should be added that the calculationswere based on the shrimp yield that was given per hectareof water area. As the patches of mangrove located withinthe pond area were therefore excluded from this value, weassumed 100% mangrove deforestation. However, it wasnoticed during the analysis of satellite data that manyfarmers had included these patches of mangrove land
Table 7 LULUC, methane, and dinitrogen oxide emissions from mixed mangrove, semi-intensive, and intensive farms for farming Asian tigershrimps during 50 years compared to LCA
System Allocationfactor
Prior landuse
t shrimp ha−1
water surfacearea year−1
LULUC tCO2 t
−1
shrimp
LU CH4
emissions, t CO2-eq t−1 shrimp
LU N2Oemissions, kgCO2-eq t
−1 shrimp
Lifecycleemissions, t CO2-eq t−1 shrimpa
Total,CO2-eq t−1
shrimp
Mixedmangrove
Mass(38.5%)
Mangrove 0.13 139 44.2 1.31 184
Semi-intensive Mass(100%)
Aquaculturepond
6.6 2.3 Including in LCA 13.2 15.5
Semi-intensive Mass(100%)
Rice paddy 6.6 2.4 2.3 Including in LCA 13.2 21.5
Intensive Mass(100%)
Aquaculturepond
7.6 2.0 Including in LCA 13.2 15.2
Intensive Mass(100%)
Rice paddy 7.6 2.1 2.0 Including in LCA 13.2 20.4
Mixedmangrove
Eco(58.8%)
Mangrove 0.13 212 67.5 2 282
Semi-intensive Eco(100%)
Aquaculturepond
6.6 2.3 Including in LCA 4.7 7.0
Semi-intensive Eco(100%)
Rice paddy 6.6 2.4 2.3 Including in LCA 4.7 13.0
Intensive Eco(100%)
Aquaculturepond
7.6 2.0 Including in LCA 5.1 7.1
Intensive Eco(100%)
Rice paddy 7.6 2.1 2.0 Including in LCA 5.1 12.3
a From Henriksson et al. (2015)
1086 Int J Life Cycle Assess (2018) 23:1078–1090
when reporting their total water area. This would thusmean that the emissions from mangrove deforestationresulting from shrimp farming would in practice be lowerthan those presented above. Moreover, the estimated sin-gle annual yield among intensive shrimp farmers werelikely influenced by a disease outbreak, as shrimp farmersnormally yield two, up to three, harvests per year.
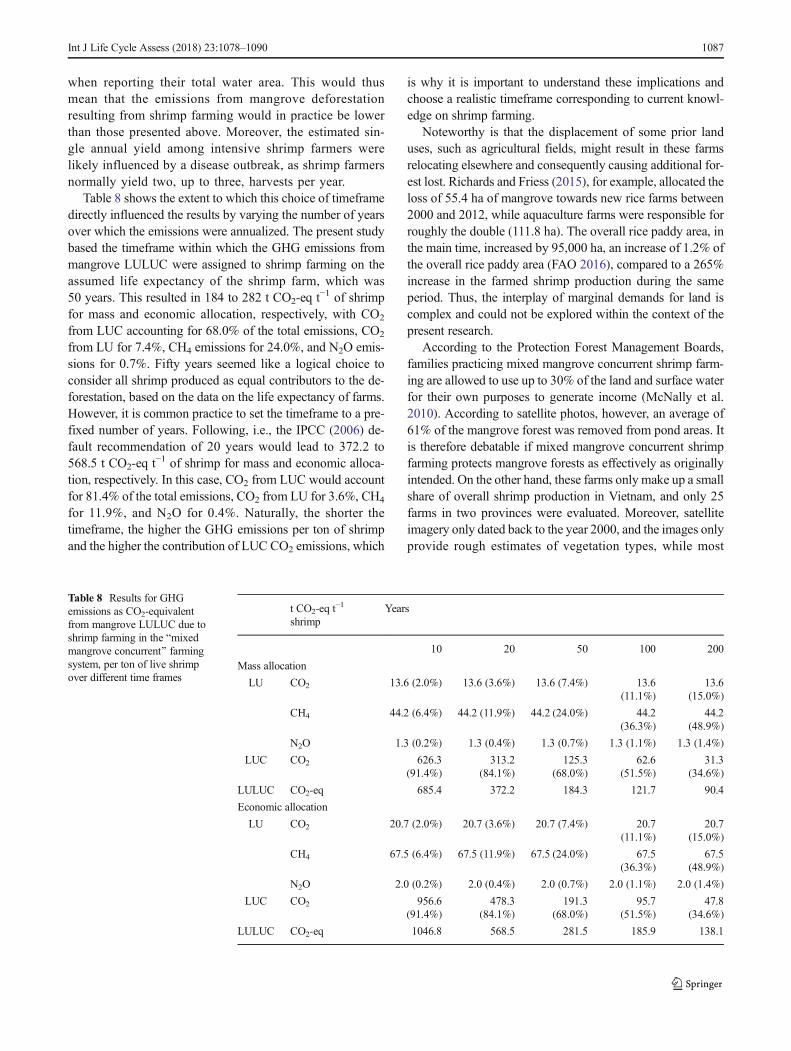
Table 8 shows the extent to which this choice of timeframedirectly influenced the results by varying the number of yearsover which the emissions were annualized. The present studybased the timeframe within which the GHG emissions frommangrove LULUC were assigned to shrimp farming on theassumed life expectancy of the shrimp farm, which was50 years. This resulted in 184 to 282 t CO2-eq t−1 of shrimpfor mass and economic allocation, respectively, with CO2
from LUC accounting for 68.0% of the total emissions, CO2
from LU for 7.4%, CH4 emissions for 24.0%, and N2O emis-sions for 0.7%. Fifty years seemed like a logical choice toconsider all shrimp produced as equal contributors to the de-forestation, based on the data on the life expectancy of farms.However, it is common practice to set the timeframe to a pre-fixed number of years. Following, i.e., the IPCC (2006) de-fault recommendation of 20 years would lead to 372.2 to568.5 t CO2-eq t−1 of shrimp for mass and economic alloca-tion, respectively. In this case, CO2 from LUC would accountfor 81.4% of the total emissions, CO2 from LU for 3.6%, CH4
for 11.9%, and N2O for 0.4%. Naturally, the shorter thetimeframe, the higher the GHG emissions per ton of shrimpand the higher the contribution of LUC CO2 emissions, which
is why it is important to understand these implications andchoose a realistic timeframe corresponding to current knowl-edge on shrimp farming.
Noteworthy is that the displacement of some prior landuses, such as agricultural fields, might result in these farmsrelocating elsewhere and consequently causing additional for-est lost. Richards and Friess (2015), for example, allocated theloss of 55.4 ha of mangrove towards new rice farms between2000 and 2012, while aquaculture farms were responsible forroughly the double (111.8 ha). The overall rice paddy area, inthe main time, increased by 95,000 ha, an increase of 1.2% ofthe overall rice paddy area (FAO 2016), compared to a 265%increase in the farmed shrimp production during the sameperiod. Thus, the interplay of marginal demands for land iscomplex and could not be explored within the context of thepresent research.
According to the Protection Forest Management Boards,families practicing mixed mangrove concurrent shrimp farm-ing are allowed to use up to 30% of the land and surface waterfor their own purposes to generate income (McNally et al.2010). According to satellite photos, however, an average of61% of the mangrove forest was removed from pond areas. Itis therefore debatable if mixed mangrove concurrent shrimpfarming protects mangrove forests as effectively as originallyintended. On the other hand, these farms only make up a smallshare of overall shrimp production in Vietnam, and only 25farms in two provinces were evaluated. Moreover, satelliteimagery only dated back to the year 2000, and the images onlyprovide rough estimates of vegetation types, while most
Table 8 Results for GHGemissions as CO2-equivalentfrom mangrove LULUC due toshrimp farming in the Bmixedmangrove concurrent^ farmingsystem, per ton of live shrimpover different time frames
t CO2-eq t−1
shrimpYears
10 20 50 100 200
Mass allocation
LU CO2 13.6 (2.0%) 13.6 (3.6%) 13.6 (7.4%) 13.6(11.1%)
13.6(15.0%)
CH4 44.2 (6.4%) 44.2 (11.9%) 44.2 (24.0%) 44.2(36.3%)
44.2(48.9%)
N2O 1.3 (0.2%) 1.3 (0.4%) 1.3 (0.7%) 1.3 (1.1%) 1.3 (1.4%)
LUC CO2 626.3(91.4%)
313.2(84.1%)
125.3(68.0%)
62.6(51.5%)
31.3(34.6%)
LULUC CO2-eq 685.4 372.2 184.3 121.7 90.4
Economic allocation
LU CO2 20.7 (2.0%) 20.7 (3.6%) 20.7 (7.4%) 20.7(11.1%)
20.7(15.0%)
CH4 67.5 (6.4%) 67.5 (11.9%) 67.5 (24.0%) 67.5(36.3%)
67.5(48.9%)
N2O 2.0 (0.2%) 2.0 (0.4%) 2.0 (0.7%) 2.0 (1.1%) 2.0 (1.4%)
LUC CO2 956.6(91.4%)
478.3(84.1%)
191.3(68.0%)
95.7(51.5%)
47.8(34.6%)
LULUC CO2-eq 1046.8 568.5 281.5 185.9 138.1
Int J Life Cycle Assess (2018) 23:1078–1090 1087
deforestation in Vietnam happened during the 1980s and1990s (WWF 2013; Richards and Friess 2015). Despite this,agencies promoting these systems (i.e., Naturland) need toreevaluate their environmental sustainability, especially incountries where this type of shrimp farming is more common,including Indonesia (DasGupta and Shaw 2013; Richards andFriess 2015).
As mentioned before, research on methane emissionsresulting from land use of mangrove area is rather limitedand most research on methane fluxes focus on integratedrice-fish ponds (Frei and Becker 2005; Datta et al. 2009) orother human disturbances of mangroves (i.e., Konnerup et al.2014). The pond conditions in the IAA systems, which wereused as a proxy for methane emissions in this study, cameclosest to those found in the mixed mangrove concurrent sys-tems (Astudillo et al. 2015). However, emissions are highlyinfluenced by farming practices (including aeration, feed use,co-stocked species, and fertilization) and environmental con-ditions (including salinity, oxygen levels, and temperature)(Alongi 2005; Howe et al. 2009; Penha-Lopes et al. 2010;Astudillo et al. 2015). For example, the presence of sulfatesin mangrove systems would limit the activity ofmethanogenesis (Howe et al. 2009), thereby lowering themethane emissions for the mixed mangrove system comparedto the IAA system. It is therefore important to remember thatour results for methane emissions are only a first proxy of thepotential magnitude of the emissions, and we therefore urgefor more research on this topic.
Despite the limitations highlighted above, our worst-caseestimates are not even close to those presented by Kauffman(Stokstad 2012), who estimated the LULUC emissions due toshrimp farming to be 198 kg CO2 per 100 g shrimp tail or1307 t CO2 t−1 shrimp (assuming an edible yield of 34%;Louisiana Direct Seafood 2011; Zirlotts Gulf Products2013), more than four times higher than our highest estimate.Kauffman’s calculations differ from ours mainly in differentassumptions regarding the percentage of shrimp farms con-structed in former mangrove areas (50–60%), early abandon-ment of farms (after 3–9 years), and an annual production ofjust 50 to 500 kg ha−1 for the average shrimp farm (Stokstad2012). Kauffman’s assumptions on early abandonment offarms can lead to the high climate warming impact, as theemissions are attributed to only a few years of shrimp farmingyields. In contrast, our study found that a mere fraction ofshrimp come from farms located in former mangrove areas, thatmanagement has improved to a point where farming can bemaintained for 50 years or more (Jonell and Henriksson 2014),that only 39.2% of the pond mass output of extensive mixedmangrove farming is shrimp, and that even these farms produce0.13 t shrimp ha−1 year−1 on average (Murray et al. 2013).
Important to highlight is that GHG emissions are only oneof the many environmental concerns associated with shrimpfarming. Others include loss of biodiversity, eutrophication,
freshwater ecotoxicity, overexploitation of juveniles, acidifi-cation, and photochemical oxidation (Jonell and Henriksson2014). LCAs including LULUC therefore also consider suchenvironmental impacts. In the process of doing so, the struc-ture of the mangrove removal should be taken into consider-ation, as it could be argued that partial removal, as is done inmixedmangrove farms, may leave enoughmangrove to buffereutrophying emissions (Jonell and Henriksson 2014).Moreover, ecosystem services maintained by preserving partof the forest should not be neglected, as phenomena like tsu-namis and typhoons are commonplace in SE Asia. Securing alivelihood in return for partial protection of the mangrove maytherefore help to conserve the remaining mangrove forests, ifproperly managed. Such socio-ecological trade-offs surelyneed to be considered before making any policy decisionssince long-term protection of the remaining mangroves inAsia is of the utmost importance.
Nonetheless, the results of our case study of shrimp farm-ing in mangrove areas show how huge mangrove LULUCemissions can be compared with similar emissions from otheractivities in the shrimp farming value chain (i.e., feed provi-sion and electricity generation). Despite uncertainties and lim-itations in the underlying data, the sheer magnitude of theemissions shows that excluding mangrove LULUC emissionsfrom LCA studies most certainly leads to a severe underesti-mation of the actual GHG emissions.
Acknowledgements In memoriam of Prof. Dr. Ir. Gerard PJ Dijkemawho was central to the early stages of shaping this research.
This work has been done as part of the Master Industrial Ecology ofLeiden University/Technical University Delft and has built on results ofthe Sustaining Ethical Aquaculture Trade (SEAT) project, which was co-funded by the European Commission within the Seventh FrameworkProgramme—Sustainable Development Global Change and Ecosystem(Project 222889); www.seatglobal.eu.
Compliance with ethical standards
Conflict of interest The authors declare that they have no conflict ofinterest.
Open Access This article is distributed under the terms of the CreativeCommons At t r ibut ion 4 .0 In te rna t ional License (h t tp : / /creativecommons.org/licenses/by/4.0/), which permits unrestricted use,distribution, and reproduction in any medium, provided you giveappropriate credit to the original author(s) and the source, provide a linkto the Creative Commons license, and indicate if changes were made.
References
Allen DE, Dalal RC, Rennenberg H, Meyer RL, Reeves S, Schmidt S(2007) Spatial and temporal variation of nitrous oxide and methaneflux between subtropical mangrove sediments and the atmosphere.Soil Biol Biochem 39(2):622–631
1088 Int J Life Cycle Assess (2018) 23:1078–1090

Alongi DM (2005) Mangrove–microbe–soil relations. In: Interactionsbetween macro- and microorganisms in marine sediments.American Geophysical Union, pp 85–103
Alongi DM (2008) Mangrove forests: resilience, protection from tsu-namis, and responses to global climate change. Estuar Coast ShelfSci 76:1–13
Amarasinghe MD, Balasubramaniam S (1992) Net primary productivityof two mangrove forest stands on the northwestern coast of SriLanka. Hydrobiologia 247:37–47
Astudillo MF, Thalwitz G, Vollrath F (2015) Modern analysis of an an-cient integrated farming arrangement: life cycle assessment of amulberry dyke and pond system. Int J Life Cycle Assess 20:1387–1398
BélandM,Goïta K, Bonn F, Pham TTH (2006) Assessment of land-coverchanges related to shrimp aquaculture using remote sensing data: acase study in the Giao Thuy District, Vietnam. Int J Remote Sens 27:1491–1510
Bouillon S, Borges AV, Castañeda-Moya E et al (2008) Mangrove pro-duction and carbon sinks: a revision of global budget estimates.Glob Biogeochem Cycles. doi:10.1029/2007GB003052
Cederberg C, Persson UM, Neovius K et al (2011) Including carbonemissions from deforestation in the carbon footprint of Brazilianbeef. Environ Sci Technol 45:1773–1779
Chmura GL, Anisfeld SC, Cahoon DR, Lynch JC (2003) Global carbonsequestration in tidal, saline wetland soils. Glob BiogeochemCycles. doi:10.1029/2002GB001917
DasGupta R, Shaw R (2013) Cumulative impacts of human interventionsand climate change onmangrove ecosystems of south and SoutheastAsia: an overview. J Ecosyst 2013:1–15
Datta A, Nayak DR, Sinhababu DP, Adhya TK (2009) Methane andnitrous oxide emissions from an integrated rainfed rice-fish farmingsystem of eastern India. Agric Ecosyst Environ 129:228–237
Day JW Jr, Coronado-Molina C, Vera-Herrera FR et al (1996) A 7 yearrecord of above-ground net primary production in a southeasternMexican mangrove forest. Aquat Bot 55:39–60
Donato DC, Kauffman JB, Murdiyarso D et al (2011) Mangroves amongthe most carbon-rich forests in the tropics. Nat Geosci 4:293–297
Donato DC, Kauffman JB, Mackenzie RA et al (2012) Whole-islandcarbon stocks in the tropical pacific: implications for mangrove con-servation and upland restoration. J Environ Manag 97:89–96
Duarte CM, Cabrián J (1996) The fate of marine autotrophic production.Limnol Oceanogr 41:1758–1766
Duarte CM, Middelburg JJ, Caraco N (2005) Major role of marine veg-etation on the oceanic carbon cycle. Biogeosciences 2:1–8
Eong OJ (1993) Mangroves—a carbon source and sink. Chemosphere27:1097–1107
FAO (2005) Cultured aquatic species information programme: Penaeusmonodon. http://www.fao.org/fishery/culturedspecies/Penaeus_monodon/en. Accessed 17 Jul 2013
FAO (2007) Mangrove trees and shrubs of the Maldives. Bangkok,Thailand
FAO (2016) FAOSTAT database. http://www.fao.org/faostat/en/#home.Accessed 1 Dec 2016
FAO FishstatJ (2014) FishstatJ—software for fishery statistical time se-ries. http://www.fao.org/fishery/statistics/software/fishstatj/en.Accessed 10 Sep 2015
Frei M, Becker K (2005) Integrated rice-fish production and methaneemission under greenhouse conditions. Agric Ecosyst Environ107:51–56
Giri C, Ochieng E, Tieszen LL et al (2011) Status and distribution ofmangrove forests of the world using earth observation satellite data.Glob Ecol Biogeogr 20:154–159
Global Aquaculture Alliance (2012) Dated, erroneous assumptions yieldmisleading BCarbon Footprint^ for farmed shrimp. http://www.gaal l iance.org/newsroom/news.php?Dated-Erroneous-
Assumptions-Yield-Misleading-Carbon-Footprint-For-Farmed-Shrimp-59. Accessed 1 Aug 2013
Google (2013) Google Earth. http://www.google.com/earth/index.html.Accessed 15 Dec 2015
Guzman HM, Barnes PAG, Lovelock CE, Feller IC (2005) A site descrip-tion of the CARICOMP mangrove, seagrass and coral reef sites inthe Bocas del Toro, Panama. Caribb J Sci 41:430–440
Henriksson PJG, Guinée JB, Kleijn R, de Snoo GR (2012) Life cycleassessment of aquaculture systems—a review of methodologies. IntJ Life Cycle Assess 17:304–313
Henriksson PJG, Rico A, Zhang W et al (2015) Comparison of Asianaquaculture products by use of statistically supported life cycle as-sessment. Environ Sci Technol 49:14176–14183
Hong PN, Dao QTQ (2004) Environmental impact of shrimp culture inthe mangrove areas of Vietnam. Annual Report of FY 2003, TheCore University Program between Japan Society for the Promotionof Science (JSPS) and National Centre for Natural Science andTechnology (NCST). Hanoi, Vietnam
Howe AJ, Rodríguez JF, Saco PM (2009) Surface evolution and carbonsequestration in disturbed and undisturbed wetland soils of the hunt-er estuary, southeast Australia. Estuar Coast Shelf Sci 84:75–83
Hu Z, Lee JW, Chandran K et al (2012) Nitrous oxide (N2O) emissionfrom aquaculture: a review. Environ Sci Technol 46:6470–6480
IPCC (2006) 2006 IPCC Guidelines for National Greenhouse GasInventories, Prepared by the National Greenhouse Gas InventoriesProgramme. Eggleston HS, Buendia L, Miwa K, Ngara T, Tanabe K(eds), Japan
IPCC (2014) 2013 Supplement to the 2006 IPCC Guidelines for NationalGreenhouse Gas Inventories: Wetlands. Hiraishi, T, Krug, T,Tanabe, K, Srivastava, N, Baasansuren, J, Fukuda, M and Troxler,TG (eds). Switzerland
ISCGM (2003) Land Cover (GLCNMO)—global version. http://www.iscgm.org/gm/glcnmo.html. Accessed 24 Jun 2013
ISO (2006) Environmental management—Life cycle assessment—Requirements and guidelines. International Standard ISO 14044;International Organisation for Standardisation: Geneva, Switzerland
Jennerjahn TC, Ittekkot V (2004) Relevance of mangroves for the pro-duction and deposition of organic matter along tropical continentalmargins. Naturwissenschaften 89:23–30
Jonell M, Henriksson PJG (2014) Mangrove-shrimp farms in Vietnam—comparing organic and conventional systems using life cycle assess-ment. Aquaculture. doi:10.1016/j.aquaculture.2014.11.001
Kauffman JB, Heider C, Cole TG et al (2011) Ecosystem carbon stocks ofMicronesian mangrove forests. Wetlands 31:343–352
Komiyama A, Ogina K, Aksornkoae S, Sabhasri S (1987) Root biomassof a mangrove forest in southern Thailand. 1. Estimation by thetrench method and the zonal structure of root biomass. J Trop Ecol3:97–108
Konnerup D, Betancourt-Portela JM, Villamil C, Parra JP (2014) Nitrousoxide and methane emissions from the restored mangrove ecosys-tem of the Ciénaga Grande de Santa Marta, Colombia. Estuar CoastShelf Sci 140:43–51
Kristensen E, Bouillon S, Dittmar T, Marchand C (2008) Organic carbondynamics in mangrove ecosystems: a review. Aquat Bot 89:201–219
Lebel L, Tri NH, Saengnoree A et al (2002) Industrial transformation andshrimp aquaculture in Thailand and Vietnam: pathways to ecologi-cal, social, and economic sustainability? Ambio 31:311–323
Lebel L,Mungkung RT, Gheewala SH, Lebel P (2010) Innovation cycles,niches and sustainability in the shrimp aquaculture industry inThailand. Environ Sci Pol 13:291–302
Louisiana Direct Seafood (2011) Seafood handbook: Shrimp story. http://louisianadirectseafood.com/handbook. Accessed 22 Jun 2013
Lovelock CE (2008) Soil respiration and belowground carbon allocationin mangrove forests. Ecosystems 11:342–354
Lundstrum A, Chen L (2014) Soil carbon stocks and accumulation inyoung mangrove forests. Soil Biol Biochem 75:223–232
Int J Life Cycle Assess (2018) 23:1078–1090 1089

Matsui N (1998) Estimated stocks of organic carbon in mangrove rootsand sediments in Hinchinbrook channel, Australia. Mangroves saltmarshes 2:199–204
Mcleod E, Chmura GL, Bouillon S et al (2011) A blueprint for bluecarbon: toward an improved understanding of the role of vegetatedcoastal habitats in sequestering CO2. Front Ecol Environ 9:552–560
McNally R, McEwin A, Holland T (2010) The potential for mangrovecarbon projects in Vietnam. Netherlands
Middleton BA, McKee KL (2001) Degradation of mangrove tissues andimplications for peat formation in Belizean island forests. J Ecol 89:818–828
Mungkung RT (2005) Shrimp aquaculture in Thailand: application of lifecycle assessment to support sustainable development, PhD thesis
Murray BC, Watt CE, Cooley DM, Pendleton LH (2012) Coastal BlueCarbon and the United Nations Current Status and FutureDirections; Policy brief
Murray FJ, Haque MM, Zhang W et al (2013) Defining boundaries to-wards understanding sustainable ethical aquaculture trade betweenAsia and Europe. SEAT Project Report 2.8. Stirling, UK
National Oceanic and Atmospheric Administration-Earth System (2010)Mangrove ecology. In: Encycl. Earth. http://www.eoearth.org/article/Mangrove_ecology?topic=49514. Accessed 28 Jun 2013
Penha-Lopes G, Kristensen E, Flindt M et al (2010) The role of biogenicstructures on the biogeochemical functioning of mangrove con-structed wetlands sediments—a mesocosm approach. Mar PollutBull 60:560–572
Phan LT, Nguyen PT, Murray FJ, Little CD (2011) Development trendsand local sustainability perceptions for the international trade in
seafood farmed in Vietnam. Deliverable 2.1c of the SEAT project.Stirling, UK
Ray R, Ganguly D, Chowdhury C et al (2011) Carbon sequestration andannual increase of carbon stock in a mangrove forest. AtmosEnviron 45:5016–5024
Richards DR, Friess DA (2015) Rates and drivers of mangrove defores-tation in Southeast Asia, 2000–2012. Proc Natl Acad Sci USA EarlyEdit:1–6. doi: 10.1073/pnas.1510272113
Rönnbäck P (1999) The ecological basis for economic value of seafoodproduction supported by mangrove ecosystems. Ecol Econ 29:235–252
Sanders CJ, Smoak JM, Naidu AS et al (2010) Organic carbon burial in amangrove forest, margin and intertial mud flat. Esturine, Coast ShelfSci 30:168–172
Schmidinger K, Stehfest E (2012) Including CO2 implications of landoccupation in LCAs—method and example for livestock products.Int J Life Cycle Assess 17:962–972
Stokstad E (2012) The carbon footprint of a shrimp cocktail. In: AAAS,Sci. News. http://news.sciencemag.org/earth/2012/02/carbon-footprint-shrimp-cocktail. Accessed 7 Sep 2015
Twilley RR, Chen RH, Hargis T (1992) Carbon sinks in mangroves andtheir implications to carbon budget of tropical coastal ecosystems.Water Air Soil Pollut 64:265–288
Vu TA, Phan LT, Do H Van et al (2013) Status of small-scale environ-mentally friendly shrimp production in Ca Mau Province, Viet Nam
WWF (2013) Ecosystems in the Greater Mekong. Past trends, currentstatus, possible futures; WWF report Greater Mekong
Zirlotts Gulf Products (2013) Shrimp. http://www.zirlottseafood.com/store/shrimp.html. Accessed 22 Jun 2013
1090 Int J Life Cycle Assess (2018) 23:1078–1090