Embed Size (px)
Citation preview
INCENTIVIZED TAX POLICY AND ITS
IMPACT ON INVESTMENT IN PAKISTAN
Khalid Mahmood Lodhi
Registration No. 051-11-114477
A Thesis Submitted in
Partial Fulfillment of the
Requirements for the Degree of
Doctorate of Philosophy in Business
Administration
Department of Business Administration
Iqra University Islamabad Campus
2017

i
THESIS APPROVAL SHEET
It is certified that PhD Dissertation titled “Incentivized Tax Policy and its Impact on
Investment in Pakistan” has been prepared by Mr. Khalid Mahmood Lodhi, Enrollment No.
051-11-114477 and approved for submission.
Supervisor,
_______________________
Prof. Dr. S M Younus Jafri
Dated:
ii
ABSTRACT
The aim of this research is to study the incentivized tax policy and its impact on investments
in Pakistan. Study period is spanned over 25 years ranging from 1990 to 2014. For data
collection and analysis, the quantitative method is predominantly used. Specifically,
inferential statistics are used and for time series data analysis multiple regressions and ARDL
approach techniques are used. The researcher adopted a model comprising variables of
incentivized tax policy like corporate tax rates and custom tariffs to analyze its impact on
(FDI) and domestic investment in Pakistan in aggregate. Findings of the study reveal that
corporate tax rate is significantly negatively associated with domestic investment.
Furthermore, tax rates for companies have important but negative relationship with FDI. In
addition the study indicates that tariff rate has no statistically significant relationship with
foreign direct investment as well as with domestic investment. Findings lead to the way
forward for economic policy makers in Pakistan. Tax incentives need to be viewed as a
component of larger picture of Pakistan’s vision and policy for the economy which aims at
creating a fair and competitive economic environment. There is need to bear the short term
results arising out of tax incentives in shape of complicated systems, inequities and untapped
revenue. In market segments, tax policy needs to be implemented with a view to eradicate
inefficiencies. Incentives should be used to promote investments in business with focus on
research and development in industry. Decrease in corporate tax rate results in significant
increase domestic investment and FDI, so government should take steps to rationalize the tax
rates, so that economic activities may be accelerated and investment may grow for overall
economic growth. Moreover, unlike many other countries, non-tax factors like political
instability, security situation, less ease and cost of doing business, lack of business
competitiveness, difficult and complicated regulatory procedures and weak physical
infrastructure immensely and negatively affect growth of domestic and foreign investment in

iii
Pakistan. The government policies should also focus on addressing and improving the
situation regarding these non-tax factors, along with providing tax incentives to promote
investment and boost economic development in the country.
Key words: Tax policy, Tax incentives, Foreign direct investment, Domestic investment,
Corporate tax rate, Tariff rate, Tax holiday, Tax exemption, Preferential treatment, Non-tax
factors, Economic development, Ease and Cost of doing business, Business Competitiveness
iv
DECLARATION FORM
I Khalid Mahmood Lodhi hereby declare that the thesis titled “Incentivized Tax Policy and
Its Impact on Investment in Pakistan” submitted by me in fulfillment of the requirements
for the degree of PhD (Management Sciences). This thesis represents research carried out at
Iqra University Islamabad Campus and aims at encouraging discussion and comment. The
observations and viewpoints expressed are the sole responsibility of the author. It does not
necessarily represent the position of Iqra University Islamabad Campus or its faculty. I also
understand that if evidence of plagiarism is found in my thesis at any stage, even after the
award of a degree, the work may be cancelled and the degree revoked.
Khalid Mahmood Lodhi
Registration # 051-11-114477

v
DEDICATION
I thankfully dedicate this piece of research to my parents, my wife and beloved children and
friends for always praying, supporting and motivating me in my endeavors.
vi
ACKNOWLEDGEMENT
In the name of Allah Almighty, the Most Gracious and the Merciful, the only Creator of the
Universe and the Source of all knowledge and wisdom, who opened the directions in my
mind and enabled me to think philosophically and bestowed upon me the guidance of my
learned teachers to accomplish this research with audacity, perseverance and success. I am
extremely grateful to my worthy and learned supervisor Dr. S.M. Younus Jafri, who provided
me consistent encouragement and guidance and contributed immensely in completion of this
thesis. I acknowledge that without his guidance and support, I would not have been able to
successfully bring out this research thesis. I am deeply indebted to Dr. Muhammad Islam who
provided me encouragement, inspiration and continued support in completing this
challenging task. I am also indebted to my family who provided me a conducive environment
and encouragement to conduct my research and complete my assignment. I should also
acknowledge the support and assistance of my friends, class fellows and colleagues who
provided me unceasing support, help, advice and aid of statistical tools during the process of
preparing this research thesis.
vii
TABLE OF CONTENTS
ABSTRACT ................................................................................................................................................................II
DEDICATION ............................................................................................................................................................ V
ACKNOWLEDGEMENT ....................................................................................................................................... VI
LIST OF TABLES .................................................................................................................................................... IX
LIST OF FIGURES .................................................................................................................................................... X
LIST OF ABBREVIATIONS .................................................................................................................................. XI
CHAPTER 1 ................................................................................................................................................................. 1
INTRODUCTION ....................................................................................................................................................... 1
1.1 Background of the Study .................................................................................................... 1
1.3 Problem Identification ....................................................................................................... 6
1.4 Statement of Problem........................................................................................................ 12
1.5 Research Questions .......................................................................................................... 13
1.6 Significance of Study ......................................................................................................... 13
1.7 Objectives of the Study ..................................................................................................... 17
1.8 Justification of the Study .................................................................................................. 17
1.9 Scope of Study ................................................................................................................... 21
1.10 Organization of the Study .............................................................................................. 22
CHAPTER 2 ............................................................................................................................................................... 23
NEXUS BETWEEN TAX POLICY AND INVESTMENT IN PAKISTAN ........................................................ 23
2.1 Tax Policy Theories ........................................................................................................... 23
2.2 Theoretical framework of Investment ............................................................................. 26
2.2.1 Domestic Investment ..................................................................................................... 26
2.2.2 Foreign Direct Investment ....................................................................................... 27
2.3 Theoretical foundations .................................................................................................... 29
2.4 Theories of FDI .................................................................................................................. 30
2.3 Investment Policy .............................................................................................................. 35
2.4 Fiscal Policy ....................................................................................................................... 38
2.4.1 Tax Policy ................................................................................................................ 38
2.4.2 Government Expenditures ....................................................................................... 42
2.5 Tax Policy and Investment Relationship ......................................................................... 42
2.6 Investment Profile of Pakistan and other countrieis ..................................................... 45
2.7 Competitiveness of Pakistan’s Economy ......................................................................... 56
2.8 Tax Reforms in Pakistan .................................................................................................. 58
2.9 Tax Policy Incentives for Investment .............................................................................. 62
CHAPTER 3 ............................................................................................................................................................... 82
LITERATURE REVIEW ......................................................................................................................................... 82
3.1 Tax Policy Incentives and Investment ............................................................................. 87
viii
3.2 Tax Incentives’ impact on FDI ......................................................................................... 99
3.3 Tax Incentives .................................................................................................................. 105
3.4 Tax and Tariff.................................................................................................................. 121
3.5 Non Tax Factors Affecting FDI...................................................................................... 130
3.6 Research Gap ................................................................................................................... 138
3.7 Theoretical Foundation .................................................................................................. 138
3.8 Hypothesis Statement ..................................................................................................... 139
CHAPTER 4 ............................................................................................................................................................. 140
RESEARCH METHODOLOGY AND MODEL ESTIMATION ....................................................................... 140
4.1 Data Description .............................................................................................................. 140
4.2 Research Design............................................................................................................... 140
4.3 Data Collection Methods ................................................................................................ 140
4.4 Methods of Data Analysis ............................................................................................... 141
4.5 Statistical Method ............................................................................................................ 141
4.6 Definitions of Variables ............................................................................................. 142
4.6.1 Domestic Investment ............................................................................................. 142
4.6.2 Foreign Direct Investment ................................................................................... 142
4.6.3 Corporate Tax Rates Concessions/Reductions .................................................... 142
4.6.4 Custom Duty Tariff Concessions/Reductions ...................................................... 142
4.6.5 Tax Holidays ......................................................................................................... 143
4.7 Model Estimation ............................................................................................................ 143
CHAPTER 5 ............................................................................................................................................................. 147
DATA ANALYSIS, EMPIRICAL RESULTS AND DISCUSSION .................................................................... 147
5.1 Descriptive Analysis ........................................................................................................ 148
5.2 Granger causality ............................................................................................................ 148
5.3 Correlation Analysis ....................................................................................................... 150
5.4 Regression Analysis ......................................................................................................... 151
5.5 Unit Root Analysis of FDI, CTR and TR ...................................................................... 151
5.6 Discussion ......................................................................................................................... 155
CHAPTER 6 ............................................................................................................................................................. 164
CONCLUSION AND RECOMMENDATIONS ................................................................................................... 164
6.1 Conclusion ........................................................................................................................ 164
6.2 Recommendations ........................................................................................................... 170
6.3 Practical Implication ....................................................................................................... 175
6.4 Future Research Directions ............................................................................................ 176
6.4 Limitations of the Study ................................................................................................. 176
REFERENCES ........................................................................................................................................................ 178
ix
LIST OF TABLES
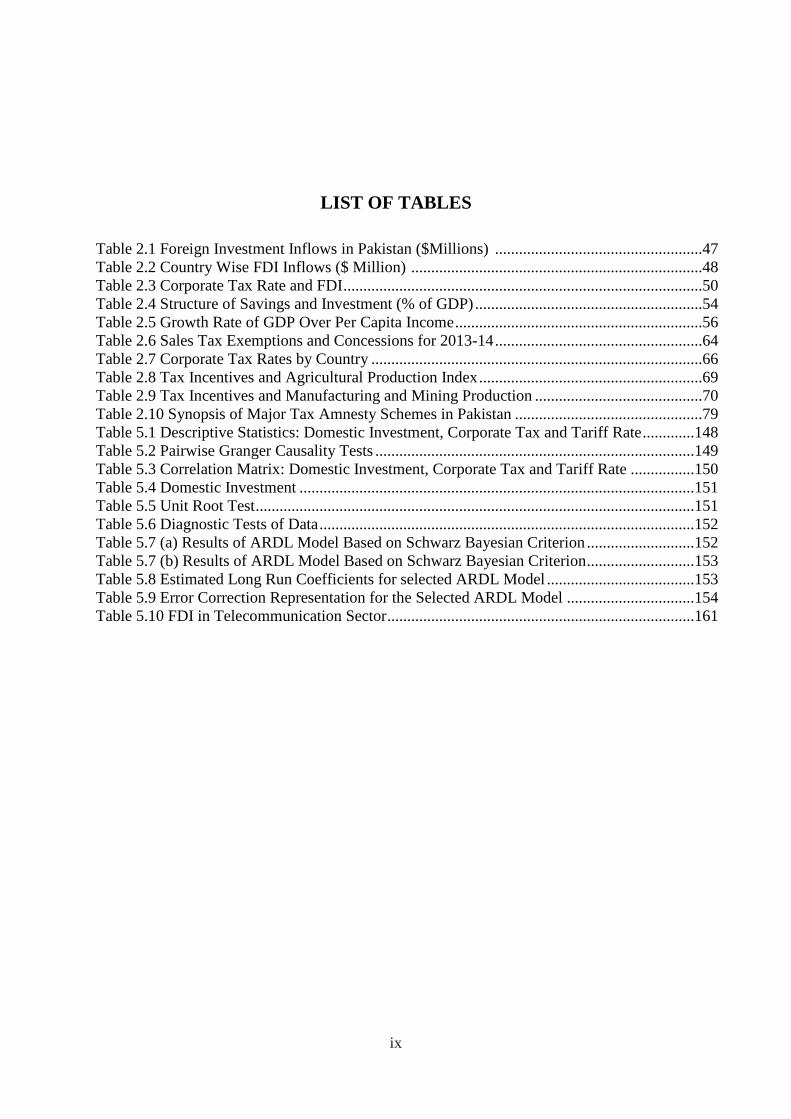
Table 2.1 Foreign Investment Inflows in Pakistan ($Millions) ....................................................47
Table 2.2 Country Wise FDI Inflows ($ Million) .........................................................................48
Table 2.3 Corporate Tax Rate and FDI ..........................................................................................50
Table 2.4 Structure of Savings and Investment (% of GDP) .........................................................54
Table 2.5 Growth Rate of GDP Over Per Capita Income ..............................................................56
Table 2.6 Sales Tax Exemptions and Concessions for 2013-14 ....................................................64
Table 2.7 Corporate Tax Rates by Country ...................................................................................66
Table 2.8 Tax Incentives and Agricultural Production Index ........................................................69
Table 2.9 Tax Incentives and Manufacturing and Mining Production ..........................................70
Table 2.10 Synopsis of Major Tax Amnesty Schemes in Pakistan ...............................................79
Table 5.1 Descriptive Statistics: Domestic Investment, Corporate Tax and Tariff Rate .............148
Table 5.2 Pairwise Granger Causality Tests ................................................................................149
Table 5.3 Correlation Matrix: Domestic Investment, Corporate Tax and Tariff Rate ................150
Table 5.4 Domestic Investment ...................................................................................................151
Table 5.5 Unit Root Test ..............................................................................................................151
Table 5.6 Diagnostic Tests of Data ..............................................................................................152
Table 5.7 (a) Results of ARDL Model Based on Schwarz Bayesian Criterion ...........................152
Table 5.7 (b) Results of ARDL Model Based on Schwarz Bayesian Criterion ...........................153
Table 5.8 Estimated Long Run Coefficients for selected ARDL Model .....................................153
Table 5.9 Error Correction Representation for the Selected ARDL Model ................................154
Table 5.10 FDI in Telecommunication Sector .............................................................................161
x
LIST OF FIGURES
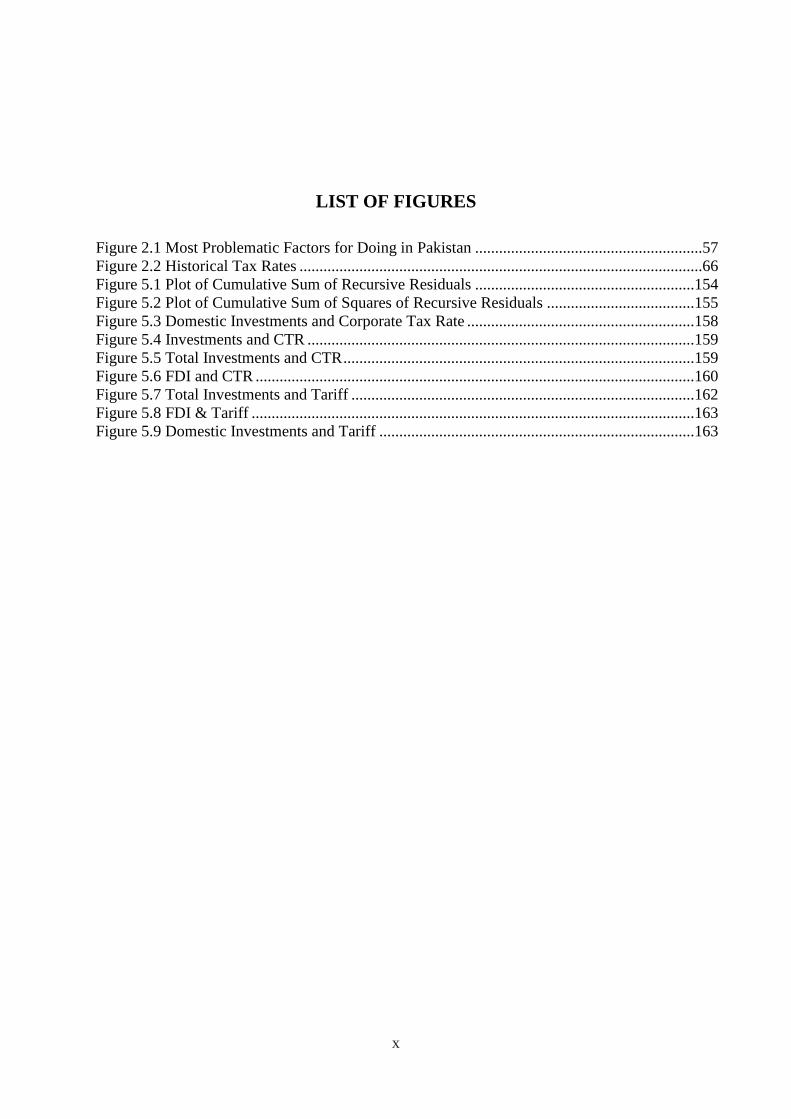
Figure 2.1 Most Problematic Factors for Doing in Pakistan .........................................................57
Figure 2.2 Historical Tax Rates .....................................................................................................66
Figure 5.1 Plot of Cumulative Sum of Recursive Residuals .......................................................154
Figure 5.2 Plot of Cumulative Sum of Squares of Recursive Residuals .....................................155
Figure 5.3 Domestic Investments and Corporate Tax Rate .........................................................158
Figure 5.4 Investments and CTR .................................................................................................159
Figure 5.5 Total Investments and CTR ........................................................................................159
Figure 5.6 FDI and CTR ..............................................................................................................160
Figure 5.7 Total Investments and Tariff ......................................................................................162
Figure 5.8 FDI & Tariff ...............................................................................................................163
Figure 5.9 Domestic Investments and Tariff ...............................................................................163
xi
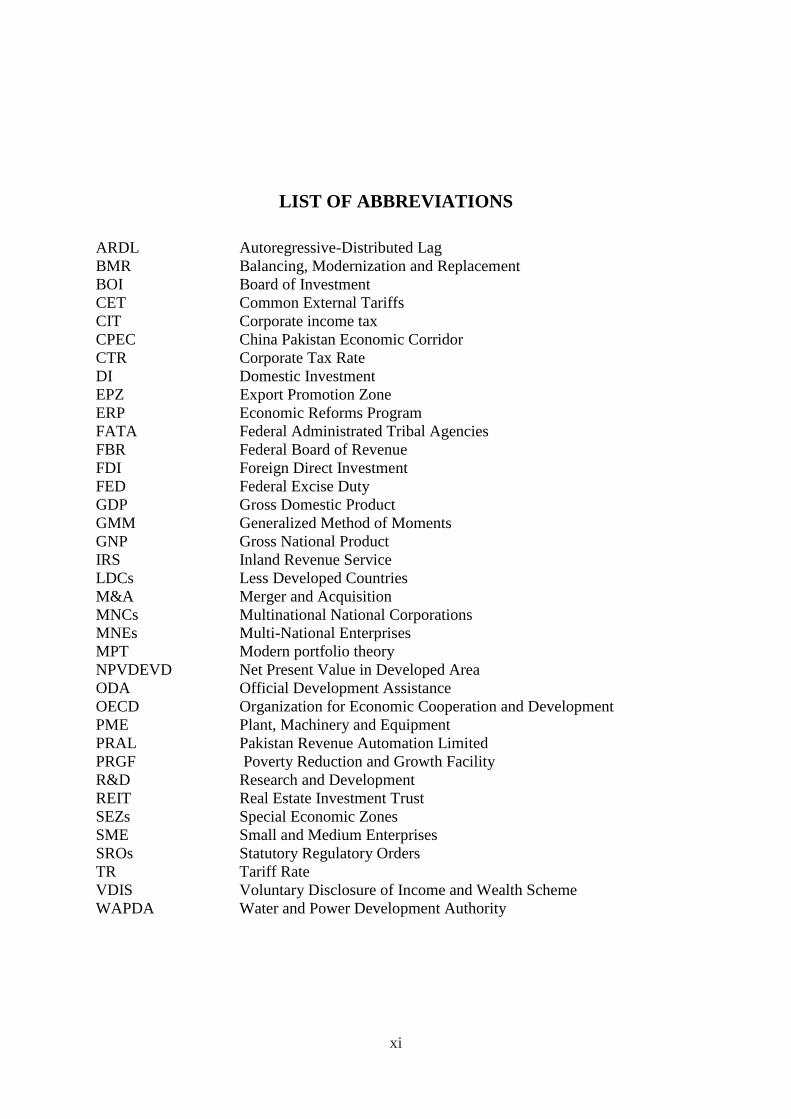
LIST OF ABBREVIATIONS
ARDL Autoregressive-Distributed Lag
BMR Balancing, Modernization and Replacement
BOI Board of Investment
CET Common External Tariffs
CIT Corporate income tax
CPEC China Pakistan Economic Corridor
CTR Corporate Tax Rate
DI Domestic Investment
EPZ Export Promotion Zone
ERP Economic Reforms Program
FATA Federal Administrated Tribal Agencies
FBR Federal Board of Revenue
FDI Foreign Direct Investment
FED Federal Excise Duty
GDP Gross Domestic Product
GMM Generalized Method of Moments
GNP Gross National Product
IRS Inland Revenue Service
LDCs Less Developed Countries
M&A Merger and Acquisition
MNCs Multinational National Corporations
MNEs Multi-National Enterprises
MPT Modern portfolio theory
NPVDEVD Net Present Value in Developed Area
ODA Official Development Assistance
OECD Organization for Economic Cooperation and Development
PME Plant, Machinery and Equipment
PRAL Pakistan Revenue Automation Limited
PRGF Poverty Reduction and Growth Facility
R&D Research and Development
REIT Real Estate Investment Trust
SEZs Special Economic Zones
SME Small and Medium Enterprises
SROs Statutory Regulatory Orders
TR Tariff Rate
VDIS Voluntary Disclosure of Income and Wealth Scheme
WAPDA Water and Power Development Authority
1
CHAPTER 1
INTRODUCTION
This chapter consists of background of the study, brief detail of FDI, domestic
investment, fiscal policy, and objectives of the research, problem identification,
problem statement, research questions, and significance of study, scope and
organization of study.
1.1 Background of the Study
Economic development of a country is a process where various factors act in cohesion
towards achieving the goal. These factors include investment in human and physical
capital, effective governance, use of technology and innovation for transformation to
a modern economy, putting institutional structures and economic reforms in place,
overcoming structural constraints, providing strong industrial base, robust services
sector, successful foreign policy, rule of law, transparent and friendly business
environment and so on. These factors are combined together to achieve economic
development of any country in relation to increase in the GDP of the country and
provide better standard of living for the population. These factors are in one way
independently required while on the other hand; these are inter-dependent on one
another. It also happens that these factors align themselves in a sequential order where
one factor leads to the other, ultimately leading to economic development in a
country.
2
Pakistan has introduced broad ranging tax reforms as part of the overall fiscal agenda.
FBR has brought major structural and policy changes to enhance revenue generation,
boosting tax to GDP ratio and broadening of tax base on the one hand while it has
introduced many fiscal measures to encourage FDI inflow and growth in domestic
investments. Government has offered many tax incentives overtime to achieve these
objectives. These incentives as part of fiscal instrument to promote growth include tax
cuts, tax holidays, tariff reductions, tax rebates and some tax amnesty schemes. Other
fiscal and tax policy incentives were offered which included import duty variations
and provision of depreciation allowance on capital assets. Mintz (1990) explores the
effectiveness of offering tax holidays simultaneously with allowing depreciation
allowances on plant and machinery and has found that tax holidays end up with
negative implications for capital formation, contrary to the objective of increasing
capital formation. Mintz’s conclusion hinges upon an assumption that in case of long
term assets, tax system provides for deduction of accelerated depreciation on capital
assets, and cannot be deferred whereas ,the tax holidays, may actually punish
investors during early days of tax holiday duration. A tax system may be generous in
supporting and providing incentives, resulting in capital formation and providing
deferred depreciation allowance.
This trend has also been witnessed in Pakistan’s tax system where accelerated
depreciation cannot be deferred during tax holidays. Once tax holiday expires, normal
depreciation can be claimed. When this situation is compared between areas with tax
holidays and without tax holidays, the areas without tax holidays can claim
accelerated depreciation as well as normal depreciation. Similarly, import duty
concessions are also focused more towards underdeveloped areas. It can be inferred
here that tax and tariff incentives affect investment differently in different regions and
3
under different conditions. Consequently various incentives impact capital cost and
investment differently.
Decreased investments are one of the most important factors impeding economic
growth in Pakistan. Tax policy of government has not always been focused on
introducing measures to attract and increase investment (both domestic and foreign)
in the country. Generally it has been focused on revenue mobilization rather than
promoting investments. Sometimes, government took some measures aimed at
attracting investments and sometimes some ancillary steps were taken to attract
investors like providing conducive and business friendly environment. FDI is a long
term venture which is dependent on many other factors beyond tax policy measures
which most of the governments have been trying to achieve through trade
liberalization and trade incentives for the investors. It is important to understand that
domestic investment is directly dependent on the economic indicators of the country,
investment opportunities in the economy, consistency of policies, law and order
situation, availability of cheap skilled labor, availability of low cost of energy and
other inputs. Pakistan is a developing country with huge potential, but it is stuck with
many other economic problems like low GDP growth, low tax to GDP ratio and
limited fiscal space. According to the economic survey of Pakistan (2014-2015) the
current state of economy in Pakistan is such that Pakistan is spending only 20% of its
GDP through public sector, which is quite low and is far less than international
standards. This problem gets aggravated as the private sector in the country is not
developed to jump in with investment to fill the social and infrastructural gap.
Another side of the story of government expenditures according to Keynesian school
of economics is that if increase in government expenditure is not wisely planned, it
may lead to undesirable impact on the economy. This negative impact is usually due
4
to crowding out effect coming into play through decrease in disposable income (due
to increase in taxes). In absence of other impetus of growth in Pakistan, government
has to resort to more public sector investment in public good and importantly to
attract private sector investment. However, due to low level of public investment and
absence of other favorable factors in the economy, the overall level of domestic
investment is also low resulting in low job opportunities and economic activity in the
country. According to the economic survey of Pakistan (2014-2015) Pakistan is facing
economic deflation, despite low fuel cost and decrease in interest rates from 9.5% to
6%, private sector credit to GDP is only 9.7 % in 2014-15 as compared to 12.8 % in
2007-08. This shows that there is a genuine flaw in the public policies which is dis-
incentivizing investments from the private sector. As successive governments have
failed to bring about structural changes in the economy, there is no visible
improvement in reversing the declining trend in private investments.
Initiatives to boost domestic investment include major reform in the tax policy to
review and refresh the tax incentives in the country. These incentives include
deregulation of sectors (from taxation point of view), tax cuts, tax rebates, tariff cuts,
tax holidays and tax amnesty schemes. Tax cuts and rebates have been aimed at
putting more money back in the pockets of the consumers, industry and businesses.
Ideally, this extra money is then spent and invested in the economy which increases
the economic activity in the country. More cash flow means more investment, which
has a direct bearing on economic growth and prosperity in the country. Governments
have been introducing several tax incentives in the country but most of them failed to
achieve desired object due to lack of consistency and credibility of tax policies,
adhoc-ism, lack of transparency and trust deficit between government officials and
business community.
5
Developing countries use fiscal policy as an important tool for promoting investment
and ensuring long term economic development. As part of tax incentives, tax
holidays have an important role in promoting industrialization in such countries.
Pakistan has also employed the same tools in anticipation of achieving the same
positive results of industrialization of backward areas. Besides tax holidays, other
measures such as changes in tariff rates, reduction in corporate tax rates and
depreciation allowances have also been used to achieve the objectives of promoting
investment, business growth and industrialization. However, the success of such
measures has been far from satisfactory and the desired results have not been fully
achieved due the various issues like inconstancy of policies, bad law and order
situation, poor infrastructure, energy crisis and lower tax revenue and narrow tax base
in Pakistan.
FDI makes contribution to economic activity through development finance, transfer of
technology and technical expertise, transfer of managerial skills and improved
efficiency. It also casts healthy impact on economic growth and prosperity and also
helps government to generate employment opportunities and additional indirect taxes.
For instance, major share of tax collection is composed of withholding taxes;
therefore, FDI can cast substantial and positive effect on revenues in Pakistan.
FDI has shown an upward trend in global scenario since early 1980’s. As companies
fiercely compete in the global market, they look for exploiting comparative advantage
that different countries offer in order to gain competitive edge. Therefore, we see that
there is a growing pattern of relocation of manufacturing concerns and businesses
worldwide. Many of Fortune 500 companies are generating over 60 percent of their
revenue from outside their home countries. Developed economies have greater choice
of investors and sources of finance, but they still prefer FDI over domestic
6
investment. Preference for foreign investors is due to the fact that they tend to bring
with them benefits which domestic investors cannot bring into the economy.
Monetary policy also influences investment decisions through changes in interest
rates. In order to induce investment in the economy, lower interest rates provide
attractive business environment. If demand of the economy requires contraction,
interest rates are increased to suppress investment. Western Europe and North
America witness high FDI. Conversely FDI is low in Africa and Asia. However, there
are examples of countries such as China where growth rate has grown in tandem with
huge FDI. Some studies have found out that economic growth in Asian countries is
significantly related to exports and FDI. However, relationship with aid was found to
be insignificant.
Generally, investors make their off-shore investment decisions on the basis of overall
socio-economic and enabling business environment in a particular economy. This
environment is usually based on many economic factors like locational advantage,
trade and industrial policies, tax rates, tariff structure, lower labor cost, access and
cost of other inputs like energy and exchange rate regime and non-economic factors
like law and order situation, infrastructure, good governance, efficient and effective
system of contract enforcement and dispute resolution. Similarly, fiscal policy also
affects investment through changes in the taxes and expenditure. These decisions
convey the message about business environment of the economy based on which
investment decisions are made.
1.3 Problem Identification
Economic development of a country is a process where various factors act in cohesion
towards achieving the common goal. These factors include investment in human and
physical capital, effective governance, use of technology and innovation for
7
transformation to a modern economy, putting institutional structures and economic
reforms in place, security, overcoming structural constraints, providing strong
industrial base, robust services sector, successful foreign policy, rule of law,
transparent and friendly business environment and so on. The government of Pakistan
undertook business process reengineering for attracting foreign investment and
provided investment friendly environment in the country. It is necessary to measure
impact of tax reforms foreign investment inflows as a huge amount has been ploughed
with the help of donors which entailed other invisible costs. Unfortunately, the tax-
GDP ratio has not been increased through reforms despite taxpayers’ facilitation,
simplification of procedures and minimization of contacts between taxpayers and tax
collector.
Pakistan’s economy is factor driven as well as situational where policies especially
fiscal policy is adopted and implemented accordingly. Taxation policies have
simultaneously been very unpopular and controversial in Pakistan. There have been
limited studies to empirically analyze whether these policies have led to sustainable
economic development. The main objective of these policies has been revenue
generation and facilitating the business community. Tax policies are usually based on
two premises i.e. firstly, more investment is essential for rapid economic growth, and
that the tax incentives can stimulate greater investment. Tax polices formulated over
the years have been inconsistent, incongruous and heavily reliant on the corporate
sector. Investment is the backbone of any country especially for developing countries
like Pakistan, but unfortunately domestic and foreign investors have been reluctant to
make big investment decisions due to unfavorable investment environment in the
country.
8
The complexity of tax structure and nature of tax of Pakistan has been the foremost
obstacle in the way of creating business friendly environment. Multiplicity of various
federal, provincial and local taxes is the basic problem in this regard. At national
level, there are different slabs of tax rates including Sales Tax, Customs Tariff,
Federal Excise duty and Income Tax. Consequent to most fundamental problem of
high tax rates, there are various prohibitions and exemptions, which offer climb to
compelling distortion. Noteworthy tax policy issue in Pakistan is the improper,
rigorous, retrogressive, unreasonable taxation arrangement, extremely narrow tax base
and a structure prompting lower tax-GDP ratio. The lack of consistency, continuity,
clarity, transparency and business unfriendly tax policy is a major cause of concern
for the investors. Historically, the governments’ primary motive of imposition of
taxes has been to boost tax collections for resource mobilization for government
spending. This would also have been helpful if this spending was made on
development which in turn stimulates overall economic development in the country
and which was not the case in this instance. Tax to GDP ratio has been hovering
around 9% for many years which is one the lowest in the region. Out of populace of
180 million, just 3.6 million are the National Tax Number (NTN) holders and less
than 1% file their annual tax returns (Financial Survey 2013-14). Pakistan has
extremely low tax GDP proportion, in comparison with other creating nations like
India and Sri Lanka.
Tax structure in Pakistan contrasts from that of the majority of other nations. While
overwhelming contribution of taxes in most growing nations is domestic taxes
whereas, in Pakistan, generous segments of taxes are earned from imports levies.
There has been a unreasonable and unhealthy tax share Vs. share to GDP of different
sectors, in which industrial sector suffers the major burden while the major
9
contributor of GDP, agriculture is exempted from federal taxes. Then, income tax
rates in Pakistan are one the highest in the world which encourages tax evasion and
impacts growth of domestic investment as well as inflows of FDI in the country. In
Pakistan, government reports have revealed that prior to tax reforms measures,
corporate income tax rate was 66% which was gradually reduced to 35% gradually
during the last half decade and further reduced to 34% for banking companies and
33% for non-banking companies.
The World Bank Study (2009) has shown that in Pakistan there is still a huge
potential of around Rs.1000 billion due to distorted tax policies, and corruption in the
organization. This tax gap can be turned into resource pool if tax policies are
appropriately prepared and fully implemented. Kemal (2001), states that the Structural
Adjustment Program policies have resulted in multiplicity of poverty level as most of
the taxes collected are indirect taxes or in indirect or withholding mode and this
passes on the burden of taxes to the poor, thus increasing poverty. Government
decided to undertake major tax policy reforms with the assistance of IMF and World
Bank in 2001.The purpose of these tax reforms was to make necessary corrections in
the tax system and machinery, remove distortions, eradicate corruption, create a
motivated and efficient tax administration broadening of narrow tax base,
simplification of tax laws and procedures and creating trust between tax collectors and
taxpayers by intruding tax friendly environment tax friendly environment.
According to the Economic Survey of Pakistan (2014-2015) Tax to GDP ratio was 9.4
in 2005-06 and reached 9.7 in 2014-15 with fluctuations during this period. The tax to
GDP fell to 8.5 in 2010-11 showing that some drastic changes are required in the tax
structure and policy. The profile of sectoral mix of taxes has also changed a lot during
the last two decades. Direct taxes share has grown to a larger extent than indirect taxes.
10
It has reached the level of 42% during 2014-15 which is quite higher from 31.5 %
during 2005-06. The share of sales tax has also simultaneously increased from 41.3 %
in 2005-06 to 44.2% during 2013-14. The share of customs duty has decreased due to
tariff exemptions and reduction, in the wake of trade liberalization and expansion of
trade agreements. The direct taxes in the country consist of tax on salaries, income
from business or profession, interest on securities, property income and capital gains
etc. Indirect taxes are comprised of sales tax and FED, whereas customs duty is levied
on imports and rarely on exports.
There are various distortions in the taxation systems which include regressive taxes
and rates of taxes higher than the capacity of the taxpayers to pay. There are different
rates for all taxes, including sales tax, customs duty, federal excise and income tax. In
addition to high tax and tariff rates, there is lack of consistency in tax policy
formulation and implementation which leads to growing trust deficit among business
enterprises and investors in Pakistan. Economists are of the opinion that higher
corporate tax rates negatively affect investment and it also generates more corruption,
encourages tax evasion, lower tax collection and consequently leads to low GDP and
low investment retarding the economic growth. Only possibility for resource
generation is a sound tax system with broad tax base, lower rates, high tax-GDP ratio
and strict enforcement for tax compliance
In this economic scenario, domestic investment has been suffering from lack of
growth for a long time. Foreign Direct Investment has also been drying up in Pakistan
due to many tax and non-tax factors. FDI inflows into Pakistan have been becoming
scarce in the course of recent years. Foreign Direct Investment (FDI) inflows into
Pakistan have been declining in the recent years. After hitting record high of $5.4
billion in 2007-08, net FDI has come to dismal low of $1,667.6 in 2013-14. Tax
11
arrangement in Pakistan differs massively from those of the many other countries.
High taxes and tariff rates on worldwide exchange moderate monetary action, making
industry less focused, and encourage tax evasion. With expanded globalization and
local incorporation, tax frameworks and strategies must be equivalent to other
comparatively stronger nations, and not operated in isolation.
In order to attract foreign investment in the country, governments offer many tax
benefits or incentives in different forms. In Pakistan governments have also been
offering many tax policy incentives to the investors but the investment has not shown
any growth or higher inflows in the country over last two decades. There is a need to
analyze as to why investments in Pakistan (domestic and FDI) have not been growing
despite the fact that government of Pakistan has taken a number of taxation and non-
taxation measures to boost investment and provide investment friendly environment
in the country to attract foreign investors. Many tax incentives like massive reduction
in corporate tax rates, reduction and even waiver of import tariffs on import of plant,
machinery and other related items, have been announced by successive governments
as part of holistic fiscal and investment policy in Pakistan. But the data has revealed
that correspondingly, growth in domestic investment and increase in FDI inflows have
not been witnessed in the investment horizon of Pakistan. Moreover, as the literature
also suggests, that there may be some non-tax factors, which have been hampering the
increase in domestic and foreign investment in Pakistan? It is, therefore, imperative to
investigate and analyze this complex problem facing the country and hindering
economic progress and to explore whether these tax incentives have cast any impact
on the investments. It would also necessary to identify the cause of success or failure
of tax reform initiatives to further reach at some conclusion and to propose further
policy recommendations to resolve the issues. Hence, after identification of the
12
problem, the researcher aims to present the problem statement to carry on the research
on the subject.
1.4 Statement of Problem
Tax Incentives are likely to continue to be part of development policy in many
developing nations around the world. In the last two decades, many governments have
actively promoted their countries as investments locations, to attract private capital
investment, technology and managerial skills associated with the idea of achieving the
development targets. Many countries, including Pakistan, have adopted measures to
facilitate the attraction of both domestic and foreign direct investment. Tax incentives
are among the important measures that are used to boost investment. As revealed by
the literature on the subject, tax incentives play a very important role in encouraging
both domestic and foreign investments. Government of Pakistan has introduced broad
ranging tax reforms as part of the overall fiscal agenda. This study attempts to analyze
the impact of various tax policy incentives on investments, both domestic and Foreign
Direct Investment in the context of Pakistan. Government has been providing
incentives like reduced CTR and Tariff rates to attract both domestic as well as
foreign investors. However, the desired increase in investment has not been observed.
This study aims to find out relationship among different variables like domestic
investment and FDI, and corporate tax rates and customs tariff rates. Moreover, it
would analyze why desired growth in domestic investment and inflows of FDI has not
been witnessed despite the tax incentives offered. The study also tries to find out the
causes of success or failure of the existing tax policy incentives and to explore any
non-tax factors which may have been affecting FDI and domestic investment. The
study will suggest future measures to be adopted to boost investments in Pakistan by
giving a clear path for future tax policy and reforms.
13
Government has been providing incentives like reduced CTR and Tariff rates to
attract both domestic as well as foreign investors. However, the desired increase in
investment has not been observed. The literature shows that there is a relationship
between tax and tariff rates and investment. The relationship has to be analyzed in
context of Pakistan. This study attempts to explore the relationship between
incentivized tax policy and investment (domestic and foreign) and also to analyze
their impact on investments. This study aims to explain how variables like corporate
tax rates and tariff rates affect growth and inflow of investment in Pakistan. The study
will further suggest future measures to be adopted to boost investments in Pakistan by
giving a clear path for future tax policy and reforms.
1.5 Research Questions
1. Does an incentivized tax policy affect domestic investment and FDI in
Pakistan?
2. What is the impact of change in Corporate tax rates and Tariff rates on
domestic investment in Pakistan
3. What is the impact of changes of CTR and TR on Foreign direct investment in
Pakistan?
4. What type of relationship exists between Tax and Tariff rates and Foreign
direct investment
1.6 Significance of Study
Economy of Pakistan is the 26th largest in the world. Pakistan was an extremely poor
country at the time of its inception. It was an agrarian economy with an insignificant
industrial base. The businesses growth was initiated with the most nominal and
underdeveloped infrastructure in the country. Pakistan's normal economic growth rate
in the initial stages had been not compatible with growth rates of the regional
14
countries and the world economy during the same period. However, the economy
started picking up in the 1960s. Normal yearly genuine GDP growth rates were 6.8%
in the 1960s, 4.8% in the 1970s, and 6.5% in the 1980s. Normal yearly growth
tumbled to 4.6% in the 1990s with essentially brought down economic growth in the
country.
Pakistan is a factor driven economy and tax policy is a tool of fiscal policy applied for
achieving all objectives like revenue generation, control money supply in the country
and to increase investment in the economy. Tax polices formulated over the years
have been inconsistent, incongruous and heavily reliant on the corporate sector.
Investment is known as the backbone of any country especially for developing
countries like Pakistan, but unfortunately investors feel hesitation in investment and
not willing to invest in Pakistan due to various tax and non- tax factors.
Successive governments in Pakistan have been making efforts to correct distortions in
the taxation systems and improve the efficiency and robustness in taxation
framework. The key issues in Pakistan’s tax system during pre-reform period 2001 in
Pakistan were: discretionary forces with tax authorities, debasement, restricted tax
base, high tax rates, SRO culture, and low share of direct taxes, substantial
dependence on indirect and withholding taxes, deferred discount installments and a
non-accommodating environment in tax workplaces (World Bank Report 2009).
Government of Pakistan took the tax reform initiative in 1985 and the task force
conducted detailed diagnosis of the tax systems and gave some recommendations for
administrative and legal and procedural reforms but unfortunately due to the political
stability, the recommendations could not be implemented. After World Bank report,
government commissioned a high power commission on tax reforms which gave out a
report known as Shahid Hussain Report 2001. It deeply analyzed the ills and
15
distortions in Pakistan’ taxation systems and gave recommendations for policy and
administrative tax reforms. Subsequently reform project named as TARP was
implemented with financial and technical assistance of World Bank during 2004 to
2012. As part of this program, the government of Pakistan undertook business process
reengineering for attracting foreign investment and provided investment friendly
environment in the country. It is necessary to measure impact of tax reforms foreign
investment inflows as a huge amount has been ploughed with the help of donors
which entailed other invisible costs. Unfortunately, the tax-GDP ratio has not
increased despite tax reforms focused on taxpayers’ facilitation, simplification of
procedures and minimization of contacts between taxpayers and tax collector. This
aspect of reforms along with tax rates rationalization is a core subject for attraction of
investment which is to be taken into account. Many important tax policy changes have
been undertaken to facilitate the foreign investors in Pakistan and tariff structure has
also been rationalized accordingly. Pakistan’s tax policy has undergone massive
reforms during the period from 2004 to 2012. The latest tax reforms were initiated in
the year 2004 and no appraisal has so far been carried out to explore the effects on
investments of different tax measures undertaken and incentives provided in Pakistan.
It is there very critical to investigate and explore what has been the impact of these tax
reforms and tax measures adopted on the overall economy of Pakistan and on
investments in particular. Hence this study is an attempt to analyze the situation and
find out the level of success of these tax measures and also find whether any further
measures are desired to be undertaken in future to achieve the desired objectives.
The studies have revealed that tax policy changes affect inflow of FDI and growth of
domestic investment, either positively or negatively. It suggests that a significant
relationship exists between tax incentives and tariff incentives and FDI and domestic
16
investments. Various tax and tariff incentives have also been provided in Pakistan to
the local and foreign investors during the last two and half decades. There is no
empirical evidence available to prove whether, any such relationship exists between
tax and tariff incentives and FDI and domestic investment in case of Pakistan and if
yes, whether this relationship is positive or negative. There has been no significant
research or study whether tax incentives have any impact on investments (FDI and
domestic) in Pakistan. There is no empirical evidence as to what relationship exists
between CTR/Tariffs with FDI and domestic investment in Pakistan. It also aims to
explore, what are the non-tax factors which may have been affecting FDI and
domestic investment. Moreover, the study also suggests measures to be adopted to
enhance investments in Pakistan.
FDI inflow into Pakistan touched its peak in 2008 and since then it has been on the
downward spiral. The key factors which have adversely affected FDI inflow are
explored with special focus on mapping the effect of tax policy measures adopted
during the last 25 years. What impact did these key taxation variables have on the
inflow of FDI and domestic investments and how altering/readjusting various tax
policy determinants can help enhance FDI and domestic investment in Pakistan.
Hence, this study tries to evaluate impact of tax policy on investment, both FDI and
domestic investments, in the country. The study also tries to find out the causes of
success or failure, whatever the case may be, of the existing tax policy in promoting
investment if any. Moreover, the study also suggests measures to be adopted to
enhance investments in Pakistan.
17
1.7 Objectives of the Study
Following are the focused objectives of this study.
To provide insight about the impact of change in Tax and Tariff rates on
domestic investment in Pakistan.
To examine and evaluate the short run impact of Tax and Tariff rates on
Foreign direct investment in Pakistan.
To explore long run relationship between Tax and Tariff rates and Foreign
direct investment
1.8 Justification of the Study
The government of Pakistan undertook business process reengineering for attracting
foreign investment and provided investment friendly environment in the country. It is
necessary to measure impact of tax reforms foreign investment inflows as a huge
amount has been ploughed with the help of donors which entailed other invisible
costs. Unfortunately, the tax-GDP ratio has not been increased through reforms
despite taxpayers’ facilitation, simplification of procedures and minimization of
contacts between taxpayers and tax collector. This aspect of reforms along with tax
rates rationalization is a core subject for attraction of investment which is to be taken
into account. Many important tax policy changes have been undertaken to facilitate
the foreign investors in Pakistan and tariff structure has also been rationalized
accordingly.
FDI inflow into Pakistan has been on the downward spiral. There is a dire need to
explore as to what are the reasons and implications of this decline in investments in
Pakistan despite the fact that government has offered various tax incentives to
encourage domestic and foreign investments. It is imperative to identify the key
factors which have adversely affected FDI inflow are explored with special focus on
impact of tax incentives adopted in the past. What impact did these key taxation
18
variables (like CTR and Customs Tariffs) have had on the inflow of FDI and domestic
investments and how altering/readjusting various tax policy determinants can help to
enhance FDI and domestic investment in Pakistan? Hence, this study tries to gauge
the impact of tax policy on investment, both FDI and domestic investments, in the
country. The study also tries to find out the causes of success or failure, whatever the
case may be, of the existing tax policy incentives in promoting investment if any. It
also aims to explore, what are the non-tax factors which may have been affecting FDI
and domestic investment along with suggesting further measures to be adopted to
enhance investments in Pakistan.
In the absence of concrete findings of impact of changes on investments (FDI and
domestic), it will be unclear whether previous and current tax policies have borne
any fruit and achieved the desired objectives or further tax policy reforms are still
required in coming years to increase the investment regime in Pakistan. If the desired
results are not materialized, it would be a great setback for the national exchequer on
one hand and for the social and economic fabric of the society on the other. In this
context, there is a need to conduct a thorough study regarding impact of the changes
and reforms in tax policy brought about in Pakistan by providing various incentives to
taxpayers and investors and its impact on the level of investments (FDI and domestic
investment). The studies on the topic suggest that various incentives measures of tax
policy significantly affect flow and growth of investments, either positively or
negatively. But it is not known whether tax policies prior to 2004 and current
reformed and incentivized tax policies have affected the flow of FDI and growth in
domestic investments in Pakistan and if yes, whether it has affected positively or
negatively? What is the relationship of tax incentives like corporate tax rates and
customs tariff rate with domestic investment and foreign direct investment. This study

19
aims to explore too whether the current tax policy is rational and appropriate to attract
FDI in Pakistan or what further recommended changes are still needed? Moreover,
the study tries to provide a clear cut direction for future tax policy and reforms needed
in a well- focused and result-oriented manner. Thus, this study undertakes to measure
the effect of tax policies on investments in Pakistan during the last 25 years. The
analysis period of the study is from fiscal year 1990 to fiscal year 2014. It is regarded
as breakthrough effort in the area and is useful for the government, academia, and
donor agencies policy formulation and implementation.
Previous studies on the subject revealed that tax policy changes affect inflow of FDI
and growth of domestic investment, either positively or negatively. It suggests that a
significant relationship exists between tax incentives and tariff incentives and FDI and
domestic investments. Various tax and tariff incentives have also been provided in
Pakistan to the local and foreign investors during the last two and half decades. There
is no empirical evidence available to prove whether, any such relationship exists
between tax and tariff incentives and FDI and domestic investment in case of Pakistan
and if yes, whether this relationship is positive or negative. There has been no
significant research or study whether tax incentives have any impact on investments
(FDI and domestic) in Pakistan. There is no empirical evidence what relationship
exists between CTR/Tariffs with FDI and domestic investment in case of Pakistan
which has been proved by the literature reviewed above. Hence, this study attempts to
explore the relationship of tax policy incentives with the investments (FDI &
domestic) in Pakistan during the last 25 years. This study has filled the research gap in
case of Pakistan where there is no empirical research to establish relationship on tax
policy incentives on investments. This relationship has been proved in case of many
other countries but not in respect of Pakistan. The available data on the topic shows
20
inconsistent trend but statistically it has given concrete findings of the relationship
among selected variables. There are many non-tax factors which affect domestic and
foreign investment growth in Pakistan which have not been taken into account by
policy makers and also these factors do not figure out in other studies carried out on
this subject in other countries. This study has added this aspect of the research to the
body of existing body of knowledge and literature in this area of knowledge which
will be very useful for policy makers, economists, business enterprises, investors,
academia and researchers with practical implications.
It is also pertinent to mention here that studies on this topic have been carried out in
various other developing and some developed countries but no focused empirical
study has been conducted in Pakistan in view of the wide range policy changes and
reforms. This study is different from other studies conducted abroad and the study
justifies its usefulness and practicability on the following grounds:
i) In Pakistan the corporate tax rates are exorbitantly higher than many other
economies leading to lower investment, both domestic and FDI. In other
countries the tax rates are rationalized to attract FDI.
ii) World Bank and IMF have supported/financed tax reform programs in
many other developing countries which successfully achieved the desired
objectives of revenue collection and investment growth but in Pakistan
TARP has not been a success story and desired outcomes have not been
achieved due to unexplored reasons presumably non-tax factors.
iii) The tax policies in Pakistan have not been very consistent and focused for
decades. The major objective of most of the policies has been time-based
revenue enhancement instead of consistent policy directed at sustainable
economic growth, and hardly any focus on promoting investments.
21
iv) The tax policies in Pakistan have not met major success due to the frequent
introduction of tax amnesty schemes, ill-timed tax incentives and irrational
tax exemptions/subsidies unlike other countries which discourage the
domestic and foreign investors, hampering FDI, simultaneously
demotivating the genuine taxpayers for honest and voluntary tax
compliance.
v) As contrary to many other countries, cost of doing business in Pakistan is
considerably high. Moreover, the business friendly environment coupled
with suitable security environment has not been provided in Pakistan.
vi) Unlike other economies, the sectorial contribution to taxes in Pakistan
(like agriculture, industry and services) is not proportionate to the sectoral
contribution of GDP. It has resulted in increasing tax burden on industrial
and services sectors as agriculture sector is exempted from federal taxes.
1.9 Scope of Study
This study attempts to analyze the impact of various tax policy incentives on
investments, both domestic and FDI in the context of Pakistan. It aims to find out
relationship among different variables like domestic investment and FDI, and
Corporate tax rates and customs tariff rates. Data of the study variables has been
collected for 25 years from FY 1990 to 2014. This study does not include any non-tax
factors which may influence inflows of FDI and growth of domestic investment. This
study is focused on the investment in Pakistan only and the results of this study
cannot be implemented on the tax rates and investment figures of countries other than
Pakistan. The selected variables in the study are domestic investment and foreign
direct investment treated as dependent variables and corporate tax rates and tariff rates
are used as independent variables.
22
1.10 Organization of the Study
The study consists of six chapters. Nature, rationale, and objectives of study, behavior
of investment, tax policy and reforms undertaken in Pakistan during the period 1990-
2015, Problem identification, problem statement, research questions, justification,
scope and organization of the study are discussed in chapter 1. Chapter 2 explores and
discusses the theoretical background and underlying factors of FDI and domestic
investments in Pakistan. It explores relationship of investment with tax incentives and
measures the effect of tax policy incentives on FDI and domestic investments and also
provides justification of the study. Chapter 3 comprises of relevant literature review to
support identification of research gap, need of study and hypothesis statement.
Chapter 4 discusses the research methodology and model of the study. Chapter 5 deals
with analysis and findings of study in relation to impact of tax policy incentives on
investments. Finally, Chapter 6 provides the conclusion, recommendations, and
practical implications for the policymakers as well as for academia. In this chapter, it
has also been outlined as to what limitations this study has, and what are the future
directions in which further research can be conducted in this area.

23
CHAPTER 2
NEXUS BETWEEN TAX POLICY AND INVESTMENT IN
PAKISTAN
Theories of investment and taxation and their relationship in the perspective of
Pakistan have been discussed here. The analysis of external relationship between
taxes and investment also provides justification of the study. More specifically, this
chapter comprises brief introduction of tax policy and investment theories based on
political risk and country risk, economy of Pakistan, theories of FDI, foreign direct
investment strategy, tax policies in Pakistan, tax reforms in Pakistan, macro-
economic reforms/incentives, tariff structure, tax amnesty schemes, tax holidays in
Pakistan and trends in global perspective.
2.1 Tax Policy Theories
Keynes (1930) argued that by changing tax rates and expenditure, as main
instruments of fiscal policy, the governments can bring about economic development.
Fiscal policy is defined as combined measure of imposing taxes and varied
government expenditure to achieve macroeconomic objectives. By expanding fiscal
policy governments aim at achieving higher economic growth and employment while
by adopting expansionist fiscal policy measure, it aims to slow the economic growth.
Fiscal policy expansion is aimed at enhanced government expenditure and/or
reduction in taxes, whereas contracting policy is contrary to the earlier one which
involves reducing government spending and/or increasing tax rates.
24
Tax policies of a government aim at determining, which taxes and how and at what
rate these should be levied which have micro-economic and macro-
economic implications. Micro-economic impact brings in fairness principle i.e. whom
to tax and efficiency principle provides for manner of levy i.e. how to ley taxes.
Revenue generation is the major macro-economic impact of tax policy. Taxes usually
distort decisions which can have impact on the economic activity, therefore, any such
policy has to keep in view all such consequences. Moreover, taxes can be imposed in a
progressive or regressive manner which takes to the question of tax incidence. An ideal
or efficient tax system can be one which has zero or minimal distortionary effect.
Economists have come up with various theories of taxes and tariffs which are part of
tax policy, indicating the direction and purpose of fiscal policy of a country.
Conduit Theory states that corporate taxes should not be imposed on an investment
company in the same manner and same tax burden as done in case of other regular
firms because the investment firm further distributes its capital gains, interest and
profits to its customers/shareholders, unlike the regular firms with a different business
strategy.
Trickle-Down Theory suggests that financial benefits and incentives in capital gains
tax should be offered to large businesses investors and entrepreneurs because it will
enhance business activities in such enterprises and will also stimulate overall
economic growth. This theory is based on two assumptions: all citizens should benefit
from growth; and this growth would be generated with the resources and skills to
increase productivity.
Tariffs, as a revenue source, formed a major chunk of national revenue collection in
the past whereas this is now mostly used as fiscal tool in developed economies.
Revenue mobilization source has shifted to levy of income taxes, at personal and
25
corporate level. Tariffs are divided into two categories: Revenue ones are levied on
imports while protective tariffs are imposed on domestic produced goods. Tariffs are
a type of tax which is passed on to the consumers leading to higher prices of imported
goods with an outcome of reduced consumption. In this perspective, domestic
producers increase their output and consumption of domestically produced goods
rises.
Tax policies indicate the level, incidence and rates of taxation and also indicate tax to
GDP ratio changes and tariff structures. Direct and indirect taxes are used for resource
mobilization and fiscal readjustments including controlling the inflation in developing
countries. Theoretically, the tax policy focusing on providing incentives for
investment, both domestic and FDI, should be one of the top priorities of government
for economic growth. Indirect taxes are ones in which the burden of tax can be passed
on. Direct taxes are usually relaxed when country’s policy is to attract investment (e.g.
tax holidays, tax credits, tax rates reduction, tax exemptions and exemptions from
import duty for new investment and on related imports).
Tax policies (tax rates, burden of taxes, level of depreciation etc.) in a country affect
investment in any country. It affects the expected rate of returns which is the prime
motive behind investment decisions. Higher returns and lower tax rates and tariffs
immensely influence investment decisions. Tax policy instrument of lowering of
Corporate Tax Rates (CTR) has been found to be a significant fiscal measure used to
attract FDI. CTR is seen to cast greater impact in attracting FDI. Lower CTRs are
generally found to cast positive impact on the investment and encourage the foreign
investors, especially Multi-National Companies, to make investment and location
decisions in such countries.
26
2.2 Theoretical framework of Investment
Classical economics see investment and saving as one phenomenon. Therefore, saving/
investment are a desire to save/invest today to have more in the future, i.e. forego
consumption today and invest for higher return in future. Keynes, on the other hand,
looks at saving and investment as two different phenomena, where investment is
motivated by optimism. Investment in economics has quite a different connotation,
from the one used in general. In general we use investment as use of money to earn
income, while in economics; it means the activities that promote the capital stock in an
economy. This point of view is very critical because it is interlinked with the
consumption pattern of the economy. The decision about how much to save arises
from the decision about how to consume. Higher consumption means lower savings
which in turn means lower investments. Higher investment means higher capital stock
of the economy which in turn means higher GDP. Investment comprises of two key
components i.e. domestic and foreign investment.
2.2.1 Domestic Investment
Domestic investment is the investment by local companies in the domestic market.
Gross private domestic investment shows the level of physical investment in any
economy. It includes addition of new capital assets, inventories and replacement
purchases. Gross investment minus depreciation is the net investment. Investment is
one of the most unsteady components of GDP. There are three types of gross private
domestic investment which include:
Non-residential investment: It is the expense by firms on tools, machinery, and
factories.
Residential Investment: It is the expense on structures and equipment.
Change in inventories.
Gross private domestic investment shows the level of physical investment in any
economy. It includes addition of new capital assets, inventories and replacement
27
purchases. As defined earlier, gross investment minus depreciation is the net
investment. Investment is one of the most unstable components of GDP. There are
three types of private domestic investments: Non-fixed investment: Investment
spending by firms on capital assets like factories: Fixed Investment: Investment
spending on structures: Change in inventories. (Inventory: means goods produced but
kept in stock inventory for future sales).
2.2.2 Foreign Direct Investment
The concept of FDI can be defined as an entity established in one country controlling
ownership of a business enterprise in another country. FDI can be distinguished
through the element of “control” from portfolio foreign inflow of investment as this is
regarded as passive investment in foreign country. FDI largely consists of
establishing new assets, mergers, reinvestment of profits etc. FDI is often explained as
a long-standing investment in a foreign country. It has three modes like equity,
investment of retained earnings and loans within the company. FDI is the investment
made by someone , may be made either "inorganically" by obtaining an association in
the target country or "normally" by developing operations of a present business in that
country. Completely, outside direct theory fuses "mergers and acquisitions, gathering
new workplaces, reinvesting advantages earned from abroad operations and intra
association credits".
Types of FDI
Foreign Direct Investment is usually of three types as under:
i) Horizontal type FDI is the one serving local market. It is aimed at reducing
cost of supplies by investing in the plants producing supplies in that
market. This allows the investment to benefit from local resources.
28
i. Vertical FDI is one which acts for cost reduction by investing in low cost
countries. This allows the investors to benefit more from the cheaper raw
materials and labor available in that foreign market.
ii. Agglomeration includes utilization and benefitting from both horizontal
and vertical FDI simultaneously.
Factors Affecting Investment
Investment fluctuates very quickly because it is easily affected even on the basis of
mere rumors. People make investment decisions on the basis of expected returns.
General perception is a big factor during the decision making process for investments.
Uncertainty and incomplete knowledge of expected returns are important factors
influencing investment decisions. Introduction of new technology attracts investment,
as new technology usually brings in higher rates of expected returns. Inventions,
innovations and new products themselves are dependent on investments but they also
tend to generate more investment.
The political climate of a country is also very important for investors as it tells a lot
about the stability in the economy and consistency of policies. Strong political setup
and culture of entrepreneurship attract investment while unrest and political turmoil
cast adverse impact on investment. Economic policies are strongly linked with the
political climate of the country. Higher levels of income, greater capital stock in the
economy and population bulge are all factors that positively attract investment in any
economy. All these factors mean that there will be greater consumption in the
economy and this greater demand can only be fulfilled through greater economic
activity, and greater economic activity requires greater level of investments in the
economy.
29
2.3 Theoretical foundations
From the periods of Adam Smith and Karl Marx, it has been believed that investment
is the monetary growth stimulant as well as the basic cause of economic retardation
simultaneously. Scholars of economics have taken long to understand the concept of
investment and implications of its variations and growth. There have been typical
concepts of investment in capital assets and in equity capital. Classical economics see
investment and saving as one phenomenon where investment/saving is a desire to
save/invest today to have more in the future, i.e. forego consumption today and invest
for higher return in future. Keynes, on the other hand, looks at saving and investment
as two different phenomenon, where investment is motivated by optimism.
Capital theory. Fisherian theory of capital describes investment in purview of
optimal decision-making in the long run. Irving Fisher is pioneer in giving first proper
analysis of the viewpoint of wealth, revenue, consumption, investment and savings,
and the consequences of such decisions through market equilibrium and growth in
resource allocation.
Investment theory of firm. On micro level, investment entails the capital investment.
In neo-classical theory, the investment in equipment and plant occurs in economical
markets, focusing on one output from two inputs, usually classified as labor and
capital. This theory illuminates the association between investment and interest rates
and other characteristics of investments like cost, depreciation of machinery and
plant.
Theory of aggregate investment: This theory describes the connection between
economy at macro level and capital accumulation. In macroeconomic terms,
investment = saving = income - consumption. It studies the association between
interest rates and investment, quantum of total output to be generated through saving
30
in an economy and how much should be invested to accumulate capital overtime.
What should be the balance in economy between substitution of consumption for
saving/investment and further distribution of profit between capital owners and labor?
It further studies the various economic causes like changes in technology, interest
rates and tax rates which affect the investment decisions.
Theoretically, private investment can be increased by macroeconomic and fiscal
stability measures that ensure such policies which are conducive to domestic
investment. Public sector investment is a great avenue for complementing private
sector investment because domestic private investment contributes more in GDP than
the foreign private investment does, which is usually made in speculative capitals.
Major problem perceived by most of the economists is the low level of investments in
developing countries.
2.4 Theories of FDI
Fama (1970) proposed that efficient market hypothesis is an investment theory which
has proposed that market forces cannot be ignored or by-passed as efficient markets
cause share prices to be considered as part of the reliable information.. This theory
suggests that barriers of maximum portfolios can be built up to hedge against the
higher expected return in view of a foreseeable risk.
International trade has provided multiple opportunities of FDI globally, like
individual investments and firms investments to finance overseas firms. In theory,
economic growth can be ensured by enabling competitive economic contributors. FDI
is a technique by which foreign currency and prowess can get into the host country.
This results into increased employment levels, and, theoretically, leads to GDP
growth. FDI also provides benefits to the investing company in shape of company
expansion and growth, and brings in higher revenues. FDI decisions are based on the
31
political, legal and fiscal environment of the recipient country. Economists and other
thinkers have come up with different theories on FDI. Availability of extensive
material on the topic has helped to review and find multiple approaches and findings
of the researchers who have done research on this theme and found varying results.
Some experts have come up with an idea that following categories explain the
theoretical aspects of FDI. Perfect competition market theories are based on
assumption of having an imperfect market and some are based on determinant's
variable (Imad, 2000).
Perfect Competition Markets theories
These theories take diversification of hypothesis, differential rate of return, and output
and market size as the main supposition to explain the concept of FDI. The hypothesis
is built on suggesting differential return rate and its reasoning on the basis of flow of
capital from counties with smaller return to countries with higher return. This will
lead economies to the actual rate of return. Due to this, in such economies business
risk becomes neutral to location, making overseas market as a substitute for domestic
market (Fahmi, 2012).
Portfolio hypothesis does not only base investment decisions on the actual return but
also takes into account the business risk as an important variable for such decisions.
Capital flows from low return countries to high return countries but at the same time
investment decision is derived from the need to lessen risk by diversification
(Agarwal, 1980). Output/market size hypotheses are different from each other as the
output hypothesis basically defines the microeconomic decisions while market size
hypothesis explains the mechanics of operating at macroeconomic level. Both these
variables have positive relationship with FDI. GDP is sometimes used as an
32
appropriate measure of market size (Cleeve, 2004). This hypothesis makes use of
economies of scale to make investment decisions (Agarwal, 1980).
Theories Assuming Imperfect Market
Some of the main theories under imperfect markets are detailed below:-
The Industrial Organization Hypothesis
This hypothesis defines decisions of a multinational company to establish its
subsidiary in another country. Such decision automatically makes the multinational a
competitor with the local companies. Multinational companies also face
disadvantageous factors due to differences in culture, language, legal system, and
higher wages as compared to local companies. Multinational companies have to make
use of their comparative advantage and strengths to succeed in overseas markets
(Agarwal, 1980).
The Internalization Hypothesis
This hypothesis postulates that FDI emanates from actions of a company to swap
market activities with domestic market activities. This theory elaborates which firms
generally prefer FDI over foreign imports and exports. FDI will lead to certainty (e.g.
shortage of any specific raw material) which may prompt company investing through
FDI to produce raw material in foreign country through a subsidiary. Investors will
have to face problems due to imperfection and failure of market mechanism
(Demirhan & Masca, 2008).
The Location Hypothesis
This hypothesis explains immobility of certain production factors i.e. labor and
natural resources. Investment decisions are, therefore, based on advantageous
conditions in the foreign market. Location advantages of cheaper factor inputs will
ultimately attract investment in the area. Difference in wages rate between two
33
countries becomes an important variable for FDI inflow. Low wage countries will
attract FDI (Kojima, 1975).
The Eclectic Theory
The eclectic theory has three interdependent variables at the heart of the theory. The
first variable is ownership specific competitive advantages of investor engaged in
FDI. This variable assumes that keeping other things constant, if there are greater
competitive advantages of the investing firms viz-a-viz other firms (local firms), there
will be greater increase in production. The second variable is the location attractions
of countries to attract value addition activities of multinational companies. This
variable states that if the endowments required to be used in consonance with its
competitive advantages favor presence in foreign region, the greater FDI will be
attracted to that region. The third variable is the framework under which businesses
organize the creation and exploitation of their core competencies.
Production Cycle Theory of Vernon
FDI of U.S. companies doing business in Europe in the manufacturing industry is
described in the production cycle theory. Vernon elaborates this FDI through 4 phases
of production cycle: creativity, progress, stability and decline. The demand for
manufactured products (made in USA) increased after Second World War, leading to
American exports emanating from superior technology. At the stage of
standardization of products, local companies started copying the products. This
situation required American firms to invest through FDI and open facilities in Europe
to remain competitive. Besides the areas of technological advantage, American firms
also engaged in FDI in areas not having technological advantage (Denisia, 2010).
34
The Oligopolistic Reactions Hypothesis
Under this hypothesis, companies operate through actions and reactions of each other.
This competition of actions is an attempt to safeguard their market shares. FDI
operates as vital component to maintain share in international market. However, FDI
by one firm will lead to reaction from domestic firms to counter the FDI move
(Stapper, 2010).
Foreign Capital Flow Theory
The amount of return on capital fluctuates across countries. Owing to liberalization of
foreign exchange system, capital flows from low return countries to high return
country happens. This demonstrates that FDI acts as an important determinant of
global variations in return rate in capital investments.
Market Size Hypothesis
This hypothesis suggests that FDI increases in large economies and decreases in low
GDP countries. The market size is usually substituted by the GDP of the host country.
Theories Based on Political Risk and Country Risk
FDI decisions are centered on political, regulatory and economic environment of the
home country e.g. a sudden restriction on transfer of profit to host country can have
adverse impact on cash flow for investing companies. Rising rates of inflation and
depreciating currency are examples of country risk. Negative economic pointers affect
the flow of cash adversely leading to declining FDI (Cleeve, 2008). This investment
theory elucidates the concept of making foreign investment from the profit secured by
a subsidiary company for further FDI in the area where it is situated. A portion of
resources is allocated by the multinational companies for initial investment. In such
scenario, profits earned are reinvested to increase presence in that country. It leads to
35
a connection between domestic income and investment spending. This connection
offers lesser cost as compared to foreign financing (Parys and Klemm, 2009).
Hypothesis of Currency and Exchange Rate
It describes that firms having strong currency invests more overseas, while firms in a
country having weak currency invest less overseas. This hypothesis explains that
country of a more stable currency attracts FDI while country with weak currency
becomes recipient of FDI (Mijiyawa, 2012).
Hypothesis of Diversification and Capital Flow barriers
This hypothesis entails two necessities essential for a company to carry out
international expansion. These necessities are, (i) barriers or costs for FDI flow should
be lesser than those present for portfolio investment flow and (ii) the investing
companies recognize that multinational companies provide more expansion chances.
The Kojima Hypothesis
This hypothesis suggests that FDI is instrumental in technological, physical and
human capital transferring from recipient country to the investing country (Kojima,
1975). It clarifies that trade and FDI complement each other. The two categories of
FDI are, (i) FDI is constantly trade oriented where excess demand leads to increased
FDI and industrial restructuring in countries and (ii) FDI also sometimes acts as anti-
trade by generating adverse effect on trade.
2.3 Investment Policy
Economists have come up with different theories and policies on FDI. Availability of
extensive material on the topic has rendered the topic to be one having varied ideas as
well as having varied results. Pakistan has been an agro-based economy since its
inception with minimal industrialization. Agriculture has been major contributors of
GDP but then in 60s industry started to pick up as governments focused on
36
establishing domestic industry and small industrial units came up in good number.
Services sector took over the major chunk of the GDP since 1990s. Pakistan’s
economic planners have been making great plans to generate more resource for
domestic investment but poor implementation of such policies led to narrow resource
base. In such scenario, only foreign investment could help to boost economic growth
in view of small and dormant industrial base. Pakistan government started its focus of
its fiscal policies to attract FDI. A separate division has been established under the
office of the Prime Minister to prepare and implement investment policies and
strategies. Investment policies have not been properly made and implemented due to
political instability and lack of consistency in policies. Moreover, investment policy
cannot succeed in isolation but has to be part of overall government economic agenda
including fiscal policy and specially tax policies. Probably poor performance in
investment profile has been due to this disjointed policy formulation and implantation
in the past.
The present government prioritized investment, and mainly FDI on its economic
agenda, in view of the peculiar geo-political situation of the country. Board of
Investment (BOI) has been mandated with the goal of investment promotion. It
operates on the basis of public-private representation. BOI appreciates the concept of
competitiveness which can attract investment. Board of Investment has prepared and
announced foreign direct investment Strategy 2013-17 for Pakistan. This policy is the
latest in the series of policies initiated in 1997. Since 1997, these policies have
contributed a lot towards opening up of the economy and its integration with global
markets. This policy is aimed at trade liberalization with new investment avenues.
The earlier policies had the concept of special zones at the center to attract investment
and manufacturing activities in the economy.
37
BOI under the current strategy has adopted a comprehensive campaign to transform
the image of Pakistan form a high risk proposition to an investment friendly high
return country. BOI employs the concept of “Investment Generation Cycle” to
achieve its goals. The characteristics of investment generation cycle are given as
under:
i. Identify and develop “Focal Sectors” having favorable fundamentals
ii. Identify and develop competitive projects in identified focal sectors
iii. Competitive enhancement through identification and advocacy of policy
measures required to
Increase profitability of investment
decrease risks of foreign investments
iv. International promotion of competitive projects through
Target Investors (i.e., investors likely to be attracted by competitive
projects)
Target Regions (i.e., countries/regions having target investors)
v. Investment facilitation by providing services to potential foreign investors (to
convert their Interest into actual investment).
BOI’s strategy has main focus on FDI by advocating and struggling for equal
opportunity for domestic and foreign investors through identified targets of FDI. This
strategy acknowledges the fact that BOI alone cannot accomplish the targets and
implement the investment programs but close collaboration of all concerned and
stakeholders is required in order to achieve the desired result. It provides roadmap for
FDI attraction in the country through the Operational Windows where the requisite
catalyst actions are undertaken by the BOI. These actions include providing the
enabling policy, rules and regulations, introduction of promotion campaigns,
conferences, focusing on targeted areas, and improvement in image of the country,
promoting business friendly environment in the country and undertaking of special
economic zones which should be provided various incentives including tax
38
concessions and incentives.
2.4 Fiscal Policy
Fiscal policy and monetary policy are two important policy options to manipulate
economy with a view to improving the health of the economy. Fiscal policies include
the tools of manipulation of public expenditure, taxation structure and public debt.
Ideally, these policies should be implemented to fight inflationary or deflationary
tendencies of the economy. If implemented in such manner, these policies lead to
improvement and enhanced efficiency of the economic system. It not only brings about
increase in GDP but also provides equal distribution of resources and opportunities in
the economy. It can also decrease unemployment in the economy and bring stability.
These policies differ in implementation during periods of depression and also inflation.
It is a very powerful tool in the hands of the government. In Pakistan, the taxation
policies have been the focus of governments to attract investment and for promotion of
economic activity. Taxation policy becomes even more important in context of scarcity
of resources.
2.4.1 Tax Policy
Tax policy is an administrative apparatus, used by states, to collect and levy tax by
applying various tariffs and basis taxation. Reforms in tax policy are critical for
economic growth. These are usually considered as improvements or amendments in
current tax regime to make it strong revenue driver for country. Reforms may include
but not limited to; broadening the tax base, overhanging the public debt, broadening
the tax base, tax holiday to different emerging industries, bringing informal economy
into tax net, abolishing tax exemptions and concessions. The recent approach
emphasizes upon minimizing distortion by reducing marginal rates for both direct and
indirect taxes. Most plausible and practical modus operandi is broadening the tax base
39
and bringing informal economy in tax net. This reduction in tax rates may not only
mitigate disincentives on work, saving and investment but also help become
instrumental for tax compliance. Taxes should be equitably and uniformly covering
all sectors of economy and segments of population. The paradigm shift from vertical
equity to the horizontal equity is a key to success for economic reforms. Role of the
state is to provide incentive to businesses, create a positive business climate, provide
strategic leadership and render quality service and amenities to stakeholders. Major
pillars of economic growth are; investments, productivity and sustainability.
Investments include external investments and domestic investments. Productivity
includes land, labor employment, capital inflow and buildings.
Taxation policies of a government include decisions as to which tax and in what
manner is to be levied. These decisions have micro-economic and macro-
economic implications. Micro-economic impact occurs in shape of decision about
whom to tax (fairness principle) and how much to tax (efficiency principle). Macro-
economic impact occurs in shape of total collection of taxes. Taxes usually distort
decisions which can have impact on the economic activity, therefore, any such policy
has to keep in view all such consequences. Furthermore, taxes can be implemented in
progressive or regressive manner which leads to the issue of tax incidence. An ideal or
efficient tax system can be one which has zero or minimal distortionary effect.
Another classification of taxes is that of direct taxation and indirect taxation. Direct
taxes are the ones which are paid directly by the individual taxpayers (e.g. personal
tax, property tax, wealth tax and corporate profit tax) and its liability cannot be passed
on. Indirect taxes are ones in which the burden of tax can be passed on. Direct taxes
are usually relaxed when country’s policy is to attract investment (e.g. tax holidays, tax
credits, tax rates reduction, tax exemptions and exemptions from import duty for new
40
investment and on related imports). Investment in any country is directly related to the
taxation (tax rates, burden of taxes, level of depreciation etc.) in the country as it
affects the expected rate of returns which is the prime motive behind investment
decisions. Investment decisions are usually directed towards the areas of higher returns
and lower taxes.
Taxation policy creates distinction between marginal and average rate of taxes. Direct
taxes in the country are mix of marginal and average rates of taxes. Marginal rates are
the ones which are chargeable on the total income whereas average tax is the total
calculated by dividing total taxes over total income. Moreover, a county’s taxes are
also a mixture of progressive and regressive taxes. Progressive taxes are a mechanism
where a higher average tax rate is applicable as income increases (personal income
tax). Regressive taxes are where lower average tax rate is levied on income increases
(Sales tax can be one example). Proportional taxes on the other hand provide a
constant rate irrespective of the level of income.
Tax system in Pakistan is heavily dominated by the federal taxes. This tax system has
undergone many reforms during the last two decades which has resulted in increase in
tax revenues in absolute terms but the tax to GDP ratio continued to remain
unchanged. In Pakistan taxes are classified in two types as direct and indirect taxes.
Taxation system in Pakistan is largely dependent upon indirect taxes which account
around 60 % of total tax collection. There is thus a need to comprehend positive and
negative correlation of different types of taxes- in two broad categories- with pillars
of economic growth. By teasing out marginal rates- on direct and indirect taxes- the
impact on economic growth would be gauged through job creation, investment and
per capita income.
41
According to Shahid Hussain Report (2001) the compliance level in the country was
very low with less than 1% of the population (0.3% approximately) paying income tax
and filing their income tax returns. This can be easily considered to be one of the
lowest percentages in the region and around the globe. This issue has a lot to do with
the problems of vertical equity i.e. not everyone is in the tax net, owing to weak
enforcement and broadening efforts of FBR, and horizontal equity i.e. same level of
income is also taxed differently in the country due to source of earnings. This disparity
is also present in the sectoral share in tax revenues. Industry is the largest contributor
in tax revenues and agriculture is the lowest contributor. Service sector contributes
more than 50% to GDP but its share in taxes is far lower than the industrial sector
which largely contributes to national revenues. In services sector, major share is from
telecommunication services and financial services. More than 50% of revenues are
collected through indirect taxes, and within direct taxes bulk share is generated through
withholding mode. There is a consensus amongst policy makers that taxes need to be
used as instruments for socio-economic development. Taxes are thought of as social
good because they contribute to economic balance in a society. According to FBR
reports it is revealed that Pakistan’s tax to GDP ratio is not at par with other regional
countries. Tax to GDP ratio of India is 17.7 %, Maldives’ 20.5 % and Sri Lanka’s
15.3%. Pakistan’s tax to GDP ratio has been hovering for many years around 9%; one
of the lowest in the region.
In order to correct the tax system in the country, government has started some new
initiatives. These initiatives include efforts for broadening of tax base, rationalization
of concessionary regimes and eliminating tax exemptions and strengthening of audit
functions of FBR.
42
2.4.2 Government Expenditures
Government can intervene in the economy through fiscal policy by using the
instruments of taxes and government expenditure. Government expenditure is the
aggregate of all government spending in form of current expenditures (salaries,
pensions, running expenses of public sector etc.) and capital expenditures (public
sector development programs). Government expenditure can have a bearing on
economic growth but there is a continuous debate over the desirable size of
government expenditure in any economy. The economic impact of government
expenditure is that whenever government spends money, the resources of land, labor
and capital utilized by the government are no longer available for the private sector.
This concept is called “resource displacement”. Another impact of government
expenditure is that government financing is done through taxes. These taxes reduce the
capital available with the private sector for expenditure and they reduce the incentives
in the economy too. Government expenditures are often considered to be less efficient.
2.5 Tax Policy and Investment Relationship
According to Imad (2000) the tax regulations disturb multinational company’s
investment decision. i) Tax on global income and profit will affect inflow of foreign
investment. ii) tax on profits gained in recipient country effects domestic return rate
by disturbing fund distribution for investment abroad. iii) tax management affects the
capital accumulation quantum for investing and recipient countries of FDI. (Imad,
2000) explored in depth the difficulties being faced in this regard. First, inter-sectoral
tax rate and regional tax system are interlinked with a lot of tangible and intangible
factors varying from country to country. Secondly, tax rate differentials do not
adequately show the impact of taxation. Thirdly, possibly, tax policies do not have
any impact on investments (Fahmi, 2012).
43
Pakistan, with a huge tract of land and over 190 million of population, is by no means
a small country. It has a robust and young work force, abundant and unexplored
natural resources and has ample commitment towards gaining political maturity and
reasonable economic growth. All this make Pakistan a business friendly country even
in absence of a comprehensive investment friendly policy and regulatory environment,
Successive governments have identified the need for friendly investment policy and
putting in place an effective and transparent regulatory framework which may provide
conducive business environment to attract foreign investors. There have been very
serious efforts by various governments to achieve these objectives but due to lack of
consistency in policies and frequent changes in governments, substantial success could
not be achieved in this regard. Ideally tax policy in Pakistan should be aimed at
providing investment friendly environment coupled with the objective of revenue
maximization.
Governments encourage FDI to fill the gap between savings and investment and also
try to boost domestic investments and foreign direct investment to accomplish this
objective. The influence expected from this scheme on the host country’s economy is
usually examined and assessed but the investors have entirely different and divergent
expectations and motives which are generally profit maximization. One of the primary
and consistent policies of each government has been a continuous effort to create
investor friendly atmosphere in the country to attract investment.
One consistent policy of each government has been an effort to create business
friendly environment in the country to attract investment. While Foreign Direct
Investment is a long term and difficult exercise therefore each government in one way
or the other has given priority to attract domestic investment. Needless to mention that
domestic investment is directly dependent on the economic indicators of the country,
44
law and order situation, availability of skilled labor at reasonable cost, availability of
energy, hassle free taxation laws and certainty of market response. In Pakistan the
resource base available for public spending is highly scanty. Pakistan spends only
20% of its GDP on public sector, which is far less than International standards.
Further gravity of the situation is that private sector in Pakistan is not thoroughly
developed to bridge social and infrastructural gap in investment spending.
One of the major and comparatively easier ways of attracting domestic investor is
through introducing tax incentives. Such incentives have direct bearing on domestic
investments which is vital for economic growth and prosperity of the country.
Therefore, various governments from time to time announced various tax incentives
for the domestic investors. But due to inconsistency, lack of transparency in polices,
lack of credibility and political will it could not produce the desired results. The tax
incentives in Pakistan have largely been targeting large businesses and corporations,
while ignoring the SMEs or Startups. The increased inflation in the country due to
macroeconomic instabilities in the economy usually has eroded the benefit that
businesses might get out of tax incentives.
FDI is a significant source of development financing, providing new avenues of
investments, innovations and better technology coupled with state of the art
management skills leading to access to global markets. Thus, all countries, mostly
developing countries take extra measures to attract FDI because of its benefits to
country’s economy. India and China have achieved rapid growth and better
macroeconomic indicators, higher investments, captured the export markets and
increased employment during 1990s and 2000s by attracting large-scale FDI.
Since 1980s Pakistan has been pursuing economic liberalization policies that included
many reforms e.g. privatization and foreign investment specific reforms. But the
45
track record of foreign private investment in Pakistan is not encouraging, whether it is
seen as a percentage of GNP or as a percentage of global FDI. This shows that these
policies, although a necessary condition, are not sufficient for attracting FDI. In order
to be effective, they have to be naturally integrated in the whole system, which in
totality should provide the enabling environment for FDI. Pakistan has important
strategic positioning in the region and has got the potential to quickly transform its
economy.
The economic data of Pakistan shows that, like other developing countries, tax
incentives have small or average impact on investments. Major reason for such low
impact has been the absence of overall conducive environment for FDI in Pakistan
which can be gauged on the basis of poor infrastructure, poor law and order situation,
weak political, economic and judicial system. In such a situation, successive
governments in Pakistan have tried to overcome these adverse factors through tax
incentives. It can be concluded that in some sectors, FDI is attracted even in absence
of tax incentives, showing that tax incentives can even become redundant if that
particular sector has its own strengths overweighing the weaknesses of the overall
economy. Another important factor in global economy is that investment decisions are
based on the tax laws in both the countries i.e. the home country of the investor and
the foreign country where investment is made. If ample tax incentives are available in
the foreign country but no corresponding tax incentives are available to the investor in
home country, then the investor will take a decision to make investment abroad.
Effective double tax treaties have become more important in case of FDI.
2.6 Investment Profile of Pakistan and other countrieis
According to Economic Survey of Pakistan (various Issues) economy of Pakistan has
been facing many upheavals since its creation in 1947. It was doing well till late 60s
46
but in 70s, conditions were deteriorating and again it started doing better in 80s. The
political revival era could not bring any economic stability to the country. During the
Musharraf era, some policy and regulatory reforms were introduced which gave some
oxygen to the economy. In this period, industrial and services sector grew at a good
pace. Especially the service sectors of telecom, banking, and transport recorded great
growth. Exports also grew during 2003-2007. During that period, average GDP was
around 6%. One major policy issue in Pakistan is inconsistent and irrational tax
policy, major tax collection from withholding regime, narrow tax base and lower tax-
GDP ratio resulting in scanty resources for any developmental expenditure and
poverty reduction. In 2012 Tax to GDP ratio dropped to 8.7 % from 9.1%. Out of
population of 180 million, only 3.6 million are NTN holders and around 1% file
income tax returns. For development and growth, the consistent inflow of FDI is to be
ensured. Unfortunately, the FDI in Pakistan has been declining continuously for last
many years.
According to economic survey of Pakistan (2014-15) the macroeconomic
environment in Pakistan is conducive for growth having ample investment
opportunities. The revival of economy started in 2013-14 and most important features
in FY 2014-15 have been low inflation rate of 2.1%, reduction of unemployment rate
from 6.2% to 6%, issuance of Sakuk bonds, successful reviews of IMF, improvement
in external account owing to many reasons especially favorable oil prices in
international markets, narrowing of current account deficit, stable exchange rate and
improvement in total investment to GDP ratio of previous years’ 13.9% to 15.1%.
Investment growth was recorded at 10.21% which is sign of fast track investment
activities and confidence on government policies. Saving rates also increased to
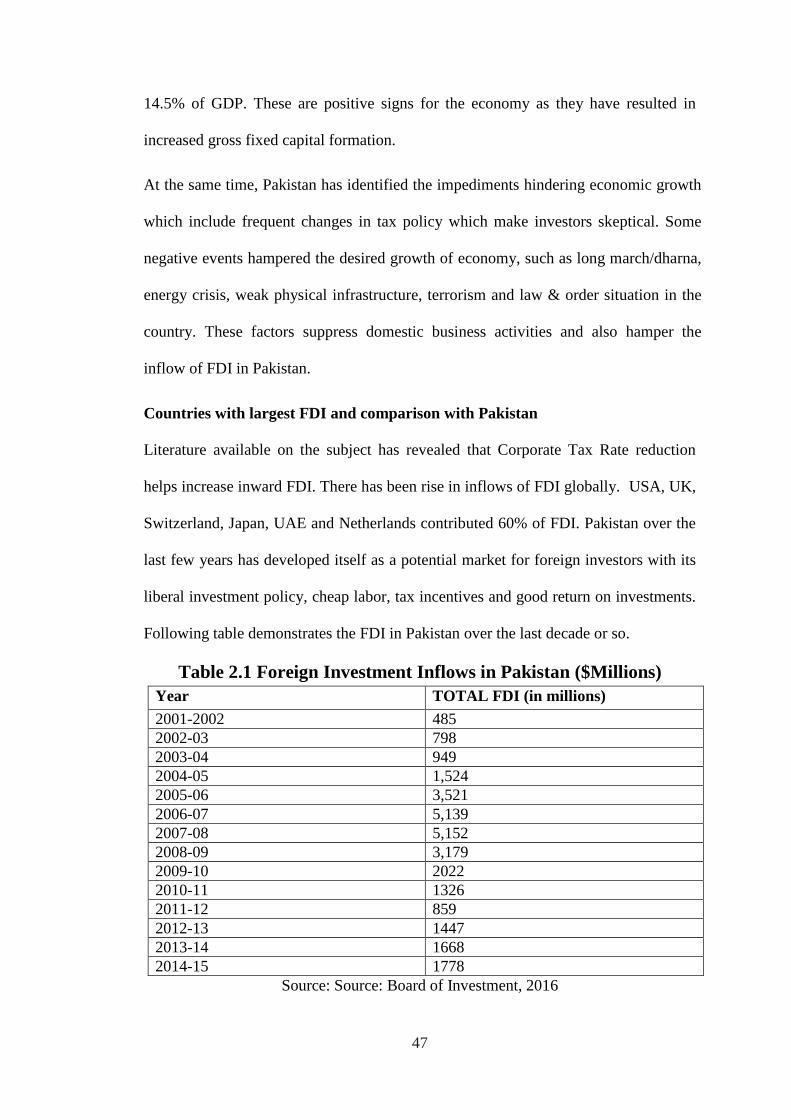
47
14.5% of GDP. These are positive signs for the economy as they have resulted in
increased gross fixed capital formation.
At the same time, Pakistan has identified the impediments hindering economic growth
which include frequent changes in tax policy which make investors skeptical. Some
negative events hampered the desired growth of economy, such as long march/dharna,
energy crisis, weak physical infrastructure, terrorism and law & order situation in the
country. These factors suppress domestic business activities and also hamper the
inflow of FDI in Pakistan.
Countries with largest FDI and comparison with Pakistan
Literature available on the subject has revealed that Corporate Tax Rate reduction
helps increase inward FDI. There has been rise in inflows of FDI globally. USA, UK,
Switzerland, Japan, UAE and Netherlands contributed 60% of FDI. Pakistan over the
last few years has developed itself as a potential market for foreign investors with its
liberal investment policy, cheap labor, tax incentives and good return on investments.
Following table demonstrates the FDI in Pakistan over the last decade or so.
Table 2.1 Foreign Investment Inflows in Pakistan ($Millions)
Source: Source: Board of Investment, 2016
Year TOTAL FDI (in millions)
2001-2002 485
2002-03 798
2003-04 949
2004-05 1,524
2005-06 3,521
2006-07 5,139
2007-08 5,152
2008-09 3,179
2009-10 2022
2010-11 1326
2011-12 859
2012-13 1447
2013-14 1668
2014-15 1778
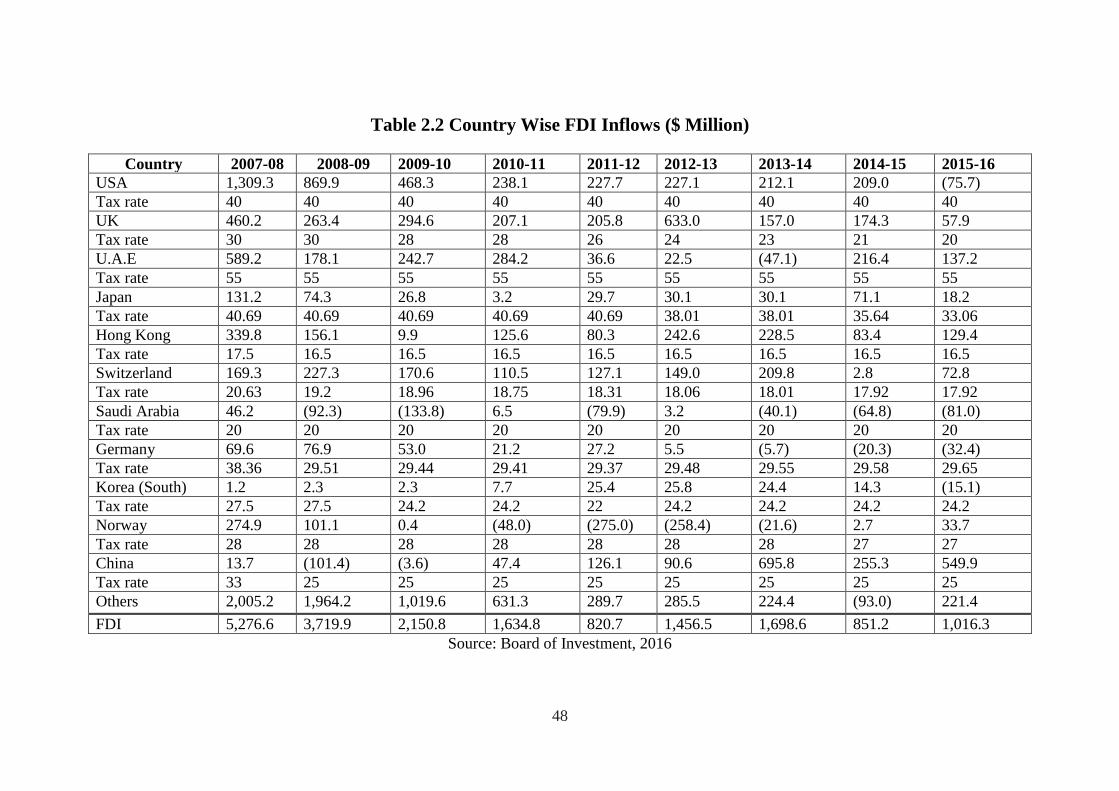
48
Table 2.2 Country Wise FDI Inflows ($ Million)
Country 2007-08 2008-09 2009-10 2010-11 2011-12 2012-13 2013-14 2014-15 2015-16
USA 1,309.3 869.9 468.3 238.1 227.7 227.1 212.1 209.0 (75.7)
Tax rate 40 40 40 40 40 40 40 40 40
UK 460.2 263.4 294.6 207.1 205.8 633.0 157.0 174.3 57.9
Tax rate 30 30 28 28 26 24 23 21 20
U.A.E 589.2 178.1 242.7 284.2 36.6 22.5 (47.1) 216.4 137.2
Tax rate 55 55 55 55 55 55 55 55 55
Japan 131.2 74.3 26.8 3.2 29.7 30.1 30.1 71.1 18.2
Tax rate 40.69 40.69 40.69 40.69 40.69 38.01 38.01 35.64 33.06
Hong Kong 339.8 156.1 9.9 125.6 80.3 242.6 228.5 83.4 129.4
Tax rate 17.5 16.5 16.5 16.5 16.5 16.5 16.5 16.5 16.5
Switzerland 169.3 227.3 170.6 110.5 127.1 149.0 209.8 2.8 72.8
Tax rate 20.63 19.2 18.96 18.75 18.31 18.06 18.01 17.92 17.92
Saudi Arabia 46.2 (92.3) (133.8) 6.5 (79.9) 3.2 (40.1) (64.8) (81.0)
Tax rate 20 20 20 20 20 20 20 20 20
Germany 69.6 76.9 53.0 21.2 27.2 5.5 (5.7) (20.3) (32.4)
Tax rate 38.36 29.51 29.44 29.41 29.37 29.48 29.55 29.58 29.65
Korea (South) 1.2 2.3 2.3 7.7 25.4 25.8 24.4 14.3 (15.1)
Tax rate 27.5 27.5 24.2 24.2 22 24.2 24.2 24.2 24.2
Norway 274.9 101.1 0.4 (48.0) (275.0) (258.4) (21.6) 2.7 33.7
Tax rate 28 28 28 28 28 28 28 27 27
China 13.7 (101.4) (3.6) 47.4 126.1 90.6 695.8 255.3 549.9
Tax rate 33 25 25 25 25 25 25 25 25
Others 2,005.2 1,964.2 1,019.6 631.3 289.7 285.5 224.4 (93.0) 221.4
FDI 5,276.6 3,719.9 2,150.8 1,634.8 820.7 1,456.5 1,698.6 851.2 1,016.3
Source: Board of Investment, 2016
49
The above table shows the profile of the countries with highest inflows of foreign
direct investments. Corporate tax rates have also been given in the above table. The
data for last decade has been scouted and a comparison has been made to see
significance of tax rates with FDI and later on Pakistan’s CTR and FDI has also been
separately analyzed. The trend shows that the countries with higher FDI have
comparatively lower tax rates which are designed to attract foreign direct investment,
nevertheless, the non-tax factors do play their role in increase and decrease of
investment but tax policy incentives have always cast positive impact of FDI flow
worldwide which is proved by the literature reviewed as well.
This trend has also been witnessed in Pakistan but has not been very consistent. FDI
flow has shown erratic trends in recent past. The data given below indicates that the
relationship between both has not been very significant in the recent past few years
which may have been due to factors other than tax policy. The countries with high
FDI are mostly developed nations which have developed infrastructure, modern
technology, skilled human resource, political stability, good law and order situation
and overall high economic indicators. In such economies, the tax rates and tariffs play
even greater role in attracting FDI than the developing countries where other factors
also play their role. The bad situation of FDI has been observed in mostly developing
countries form Latin America, Africa and Asia which have poor situation in respect of
factors given above, hence they get lower FDI due to these factors and tax policy is
also one major determinant in affecting FDI. Pakistan case has been analyzed in the
perspective of developing countries and not the advanced countries. Thus this study
has not taken into account the non-tax factors which also have significance in this
regard.
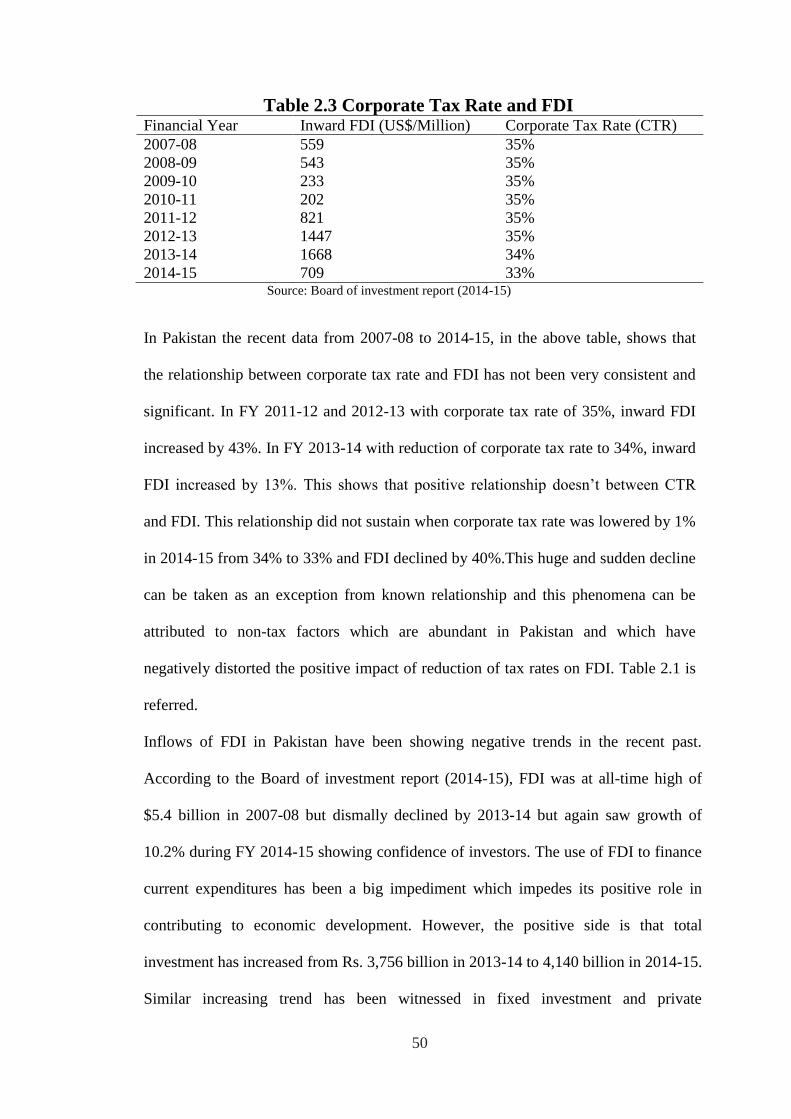
50
Table 2.3 Corporate Tax Rate and FDI Financial Year Inward FDI (US$/Million) Corporate Tax Rate (CTR)
2007-08 559 35%
2008-09 543 35%
2009-10 233 35%
2010-11 202 35%
2011-12 821 35%
2012-13 1447 35%
2013-14 1668 34%
2014-15 709 33% Source: Board of investment report (2014-15)
In Pakistan the recent data from 2007-08 to 2014-15, in the above table, shows that
the relationship between corporate tax rate and FDI has not been very consistent and
significant. In FY 2011-12 and 2012-13 with corporate tax rate of 35%, inward FDI
increased by 43%. In FY 2013-14 with reduction of corporate tax rate to 34%, inward
FDI increased by 13%. This shows that positive relationship doesn’t between CTR
and FDI. This relationship did not sustain when corporate tax rate was lowered by 1%
in 2014-15 from 34% to 33% and FDI declined by 40%.This huge and sudden decline
can be taken as an exception from known relationship and this phenomena can be
attributed to non-tax factors which are abundant in Pakistan and which have
negatively distorted the positive impact of reduction of tax rates on FDI. Table 2.1 is
referred.
Inflows of FDI in Pakistan have been showing negative trends in the recent past.
According to the Board of investment report (2014-15), FDI was at all-time high of
$5.4 billion in 2007-08 but dismally declined by 2013-14 but again saw growth of
10.2% during FY 2014-15 showing confidence of investors. The use of FDI to finance
current expenditures has been a big impediment which impedes its positive role in
contributing to economic development. However, the positive side is that total
investment has increased from Rs. 3,756 billion in 2013-14 to 4,140 billion in 2014-15.
Similar increasing trend has been witnessed in fixed investment and private
51
investment. FDI inflow in the year 2004-05 were US$ 1524 million as the highest if
compared with FDI during 2003-04 in Pakistan. Hence total FDI inflows into Pakistan
from 1991-92 to 2004-05 stood at US$ 9089 million, which came to US$ 649.27
million per year. Few sectors were responsible for attracting foreign direct investment
during 2004-09. The total inflows of FDI into textile sector in the corresponding years
were US$ 138.4 million, and that sector attracted US$ 39.3 million during 2004-05,
and it was US$ 35.4 million during 2003-04. Though less increase occurred in the
inflow of FDI into the oil exploration sector but the inflow highly increased in the
power sector as it was in US$ 14.3 million in 2003-04 and in 2004-05 it was US$ 73.3
million but during 2004-09 those sectors were able to have enhanced amount of FDI
inflow of US$ 1007.9 million. Communication (IT and Telecom) also could attract
FDI with the inflow of US$ 221.9 during 2003-04 and in 2004-05 US$ 517.6 million.
The inflows also increased into the financial business sector to US$ 269.4 million in
2004-05 from US$ 242.1 million during 2003-04 and the total FDI inflow became US$
840.1 million during 2004-09 as well. About 70 percent of FDI came into oil and gas,
telecom sector; chemicals, textile, power sector and banking and finance.
This is a clear indicator that economic policy initiatives of the government are having
positive impact on investment activities. Public investment recorded an astounding
growth of 25.26% during FY 2014-15 as compared to 6.82% during the previous
financial year. Public sector investment increased from Rs.842 billion (3.36% of GDP)
in 2013-14 to Rs. 1,057 billion (3.86% of GDP) in 2014-15. This has in turn
encouraged private sector to invest more which is vital for economic development.
Public sector investment and expenditures create spillover effect on private sector
investment. Private investment, following the lead of public investment increased from
Rs. 2.513 (FY 2013-14) to Rs. 2,645 billion (FY 2014-15). Furthermore, the increase
52
in credit space for private sector generates increased private sector investment in the
country.
There was a reduction in total investment from 14.57 percent to 13.99 percent of GDP
as compared to the previous years. Fixed investment increased from 12.97 percent in
2012 to 12.39 percent of GDP during 2014. Decrease was also witnessed in private
investment from 9.64 percent in 2012 to 8.94 percent in 2014. An increase of Rs.3554
billion in 2013-14 from Rs. 3276 billion of the previous year was recorded in total
which shows an annual increase from 8.4 percent to 8.5 percent. There has been a
marked improvement in Public Investment with a growth rate increasing from -0.35
percent to 17.12 percent annually owing to a successful government expenditure
strategy encouraging further private investment. Private sector investment usually
follows the Public sector expenditure programs of the government. Public sector
development fuels private investment and economic development especially in
infrastructure. Public Sector investment has jumped from Rs.748 billion in 2012-13 to
Rs.877 billion in 2013-14 showing an increase in public investment as a percent of
GDP from 3.33 to 3.45 percent from the previous year. Government has taken
initiatives to improve economic situation by reducing energy shortage, improving law
and order and license auction for 4G and 3G recording big inflows of investment. The
matter of low investment is a concern for the government and all hurdles in its way
need to be removed to promote an investment friendly environment. FDI is a vital
area of economy and immensely helps to promote economic growth and development
of any country. Pakistan has always given due importance to its policies to attract
FDI.
National savings are crucial to maintain high levels of investment required for
economic uplift of the country. The savings by households are usually the largest
53
component of national savings. National savings and foreign savings together meet
this investment demand. In case of failure of national savings, foreign savings are
helpful to fill this saving-investment gap. According to the economic survey of
Pakistan (2014-15) the figures of national savings stood at 14.5 % of GDP in FY
2014-15 while it was at 13.7 % of GDP during FY 2013-14. Out of this, domestic
savings stood at 8.4 % of GDP in 2014-15, demonstrating an increase of 0.4 % from
previous financial year.
The data of saving and investment (as % of GDP) has been extracted out of different
issues of Pakistan Economic Survey as given in Table 2.4 below:
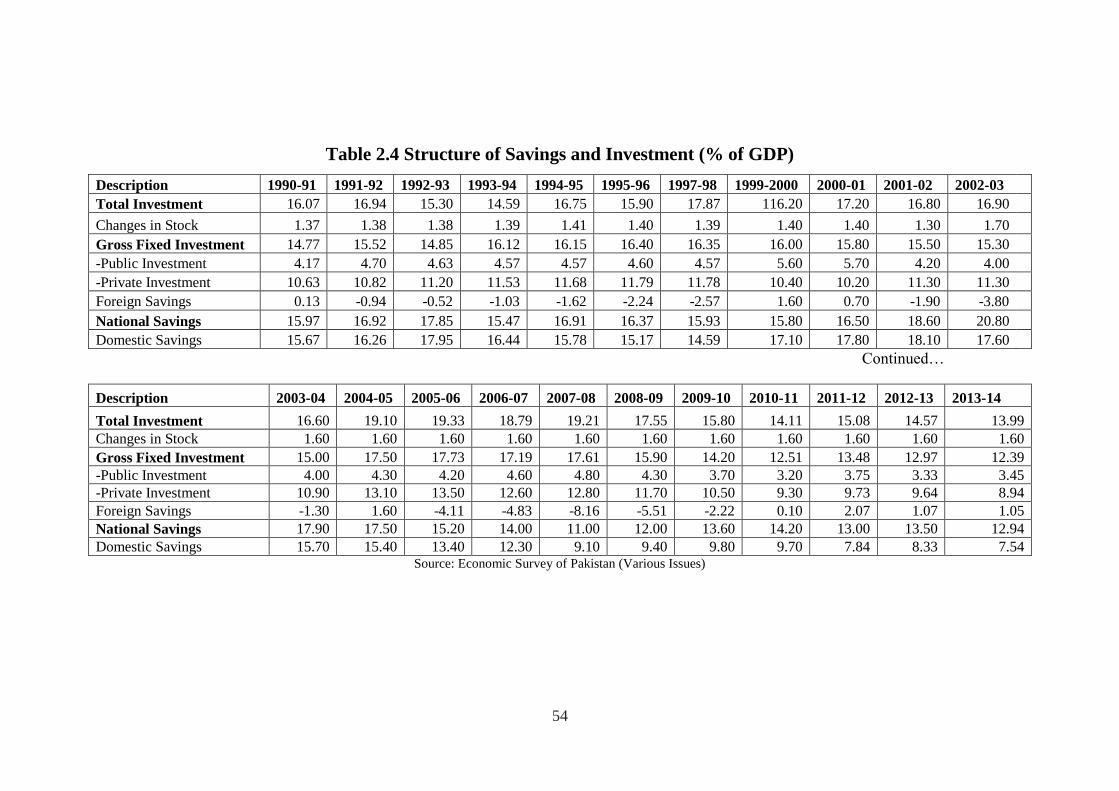
54
Table 2.4 Structure of Savings and Investment (% of GDP)
Continued…
Description 2003-04 2004-05 2005-06 2006-07 2007-08 2008-09 2009-10 2010-11 2011-12 2012-13 2013-14
Total Investment 16.60 19.10 19.33 18.79 19.21 17.55 15.80 14.11 15.08 14.57 13.99 Changes in Stock 1.60 1.60 1.60 1.60 1.60 1.60 1.60 1.60 1.60 1.60 1.60
Gross Fixed Investment 15.00 17.50 17.73 17.19 17.61 15.90 14.20 12.51 13.48 12.97 12.39 -Public Investment 4.00 4.30 4.20 4.60 4.80 4.30 3.70 3.20 3.75 3.33 3.45 -Private Investment 10.90 13.10 13.50 12.60 12.80 11.70 10.50 9.30 9.73 9.64 8.94 Foreign Savings -1.30 1.60 -4.11 -4.83 -8.16 -5.51 -2.22 0.10 2.07 1.07 1.05
National Savings 17.90 17.50 15.20 14.00 11.00 12.00 13.60 14.20 13.00 13.50 12.94 Domestic Savings 15.70 15.40 13.40 12.30 9.10 9.40 9.80 9.70 7.84 8.33 7.54
Source: Economic Survey of Pakistan (Various Issues)
Description 1990-91 1991-92 1992-93 1993-94 1994-95 1995-96 1997-98 1999-2000 2000-01 2001-02 2002-03
Total Investment 16.07 16.94 15.30 14.59 16.75 15.90 17.87 116.20 17.20 16.80 16.90
Changes in Stock 1.37 1.38 1.38 1.39 1.41 1.40 1.39 1.40 1.40 1.30 1.70
Gross Fixed Investment 14.77 15.52 14.85 16.12 16.15 16.40 16.35 16.00 15.80 15.50 15.30
-Public Investment 4.17 4.70 4.63 4.57 4.57 4.60 4.57 5.60 5.70 4.20 4.00
-Private Investment 10.63 10.82 11.20 11.53 11.68 11.79 11.78 10.40 10.20 11.30 11.30
Foreign Savings 0.13 -0.94 -0.52 -1.03 -1.62 -2.24 -2.57 1.60 0.70 -1.90 -3.80
National Savings 15.97 16.92 17.85 15.47 16.91 16.37 15.93 15.80 16.50 18.60 20.80
Domestic Savings 15.67 16.26 17.95 16.44 15.78 15.17 14.59 17.10 17.80 18.10 17.60
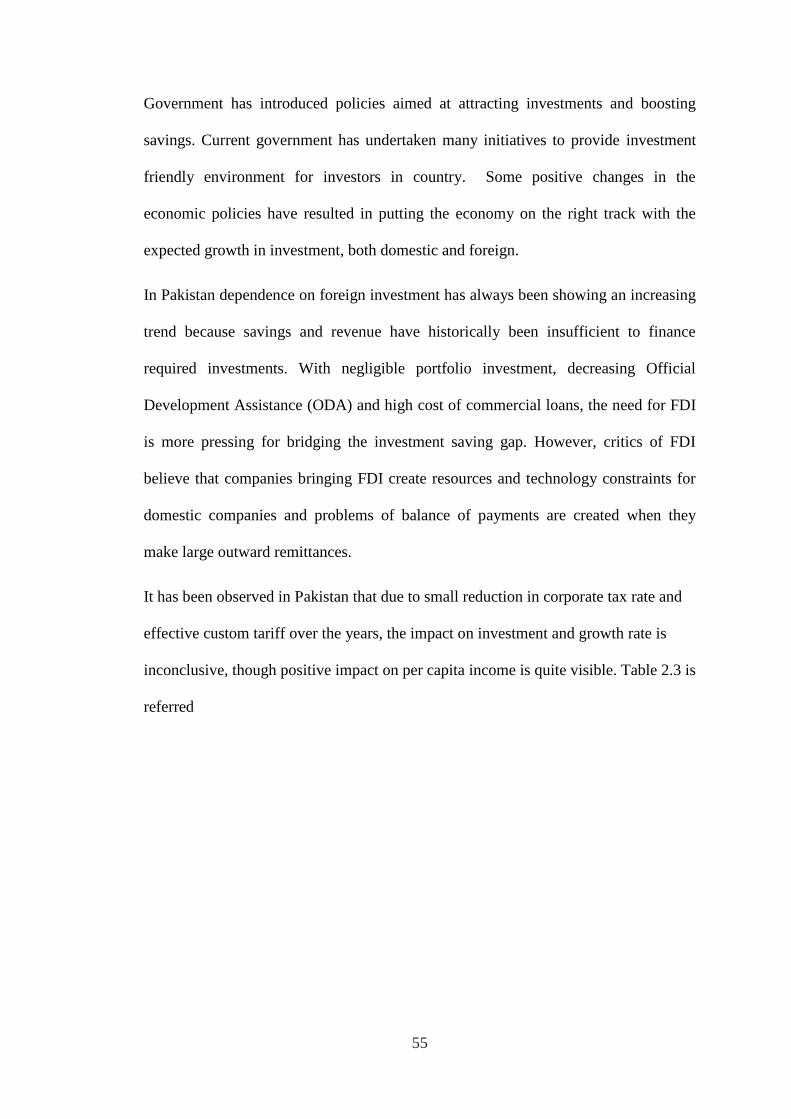
55
Government has introduced policies aimed at attracting investments and boosting
savings. Current government has undertaken many initiatives to provide investment
friendly environment for investors in country. Some positive changes in the
economic policies have resulted in putting the economy on the right track with the
expected growth in investment, both domestic and foreign.
In Pakistan dependence on foreign investment has always been showing an increasing
trend because savings and revenue have historically been insufficient to finance
required investments. With negligible portfolio investment, decreasing Official
Development Assistance (ODA) and high cost of commercial loans, the need for FDI
is more pressing for bridging the investment saving gap. However, critics of FDI
believe that companies bringing FDI create resources and technology constraints for
domestic companies and problems of balance of payments are created when they
make large outward remittances.
It has been observed in Pakistan that due to small reduction in corporate tax rate and
effective custom tariff over the years, the impact on investment and growth rate is
inconclusive, though positive impact on per capita income is quite visible. Table 2.3 is
referred
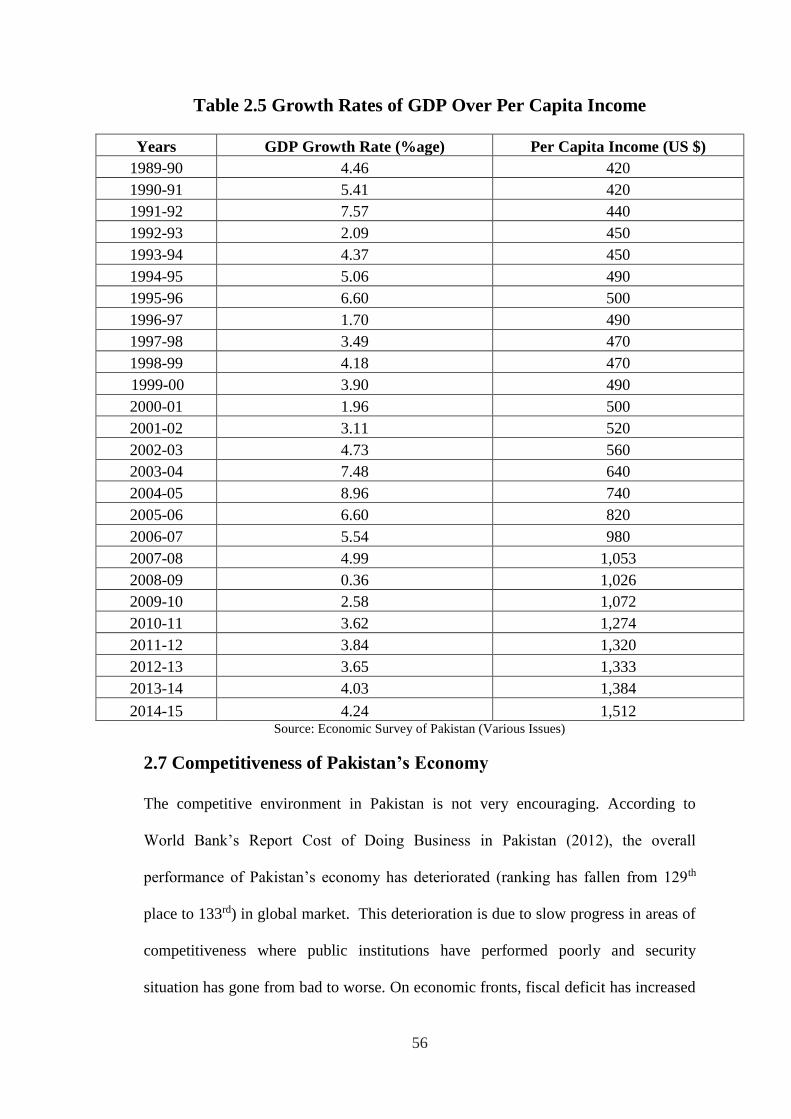
56
Table 2.5 Growth Rates of GDP Over Per Capita Income
Years GDP Growth Rate (%age) Per Capita Income (US $)
1989-90 4.46 420
1990-91 5.41 420
1991-92 7.57 440
1992-93 2.09 450
1993-94 4.37 450
1994-95 5.06 490
1995-96 6.60 500
1996-97 1.70 490
1997-98 3.49 470
1998-99 4.18 470
1999-00 3.90 490
2000-01 1.96 500
2001-02 3.11 520
2002-03 4.73 560
2003-04 7.48 640
2004-05 8.96 740
2005-06 6.60 820
2006-07 5.54 980
2007-08 4.99 1,053
2008-09 0.36 1,026
2009-10 2.58 1,072
2010-11 3.62 1,274
2011-12 3.84 1,320
2012-13 3.65 1,333
2013-14 4.03 1,384
2014-15 4.24 1,512 Source: Economic Survey of Pakistan (Various Issues)
2.7 Competitiveness of Pakistan’s Economy
The competitive environment in Pakistan is not very encouraging. According to
World Bank’s Report Cost of Doing Business in Pakistan (2012), the overall
performance of Pakistan’s economy has deteriorated (ranking has fallen from 129th
place to 133rd) in global market. This deterioration is due to slow progress in areas of
competitiveness where public institutions have performed poorly and security
situation has gone from bad to worse. On economic fronts, fiscal deficit has increased
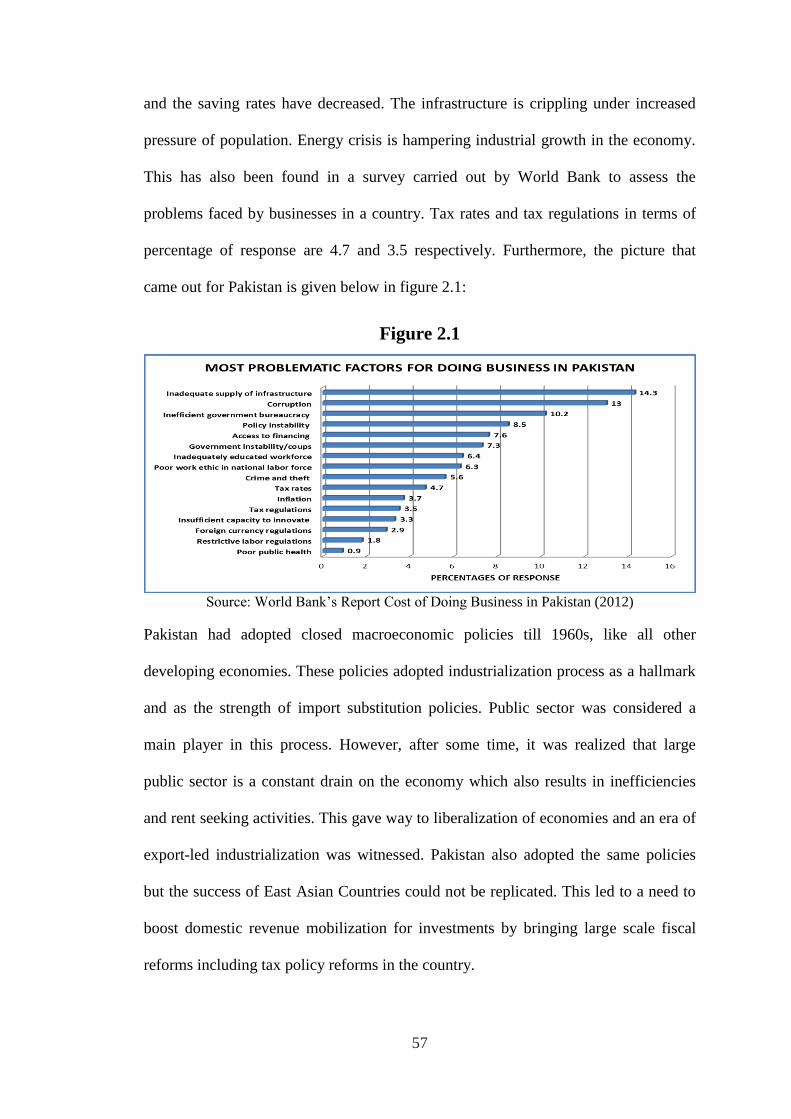
57
and the saving rates have decreased. The infrastructure is crippling under increased
pressure of population. Energy crisis is hampering industrial growth in the economy.
This has also been found in a survey carried out by World Bank to assess the
problems faced by businesses in a country. Tax rates and tax regulations in terms of
percentage of response are 4.7 and 3.5 respectively. Furthermore, the picture that
came out for Pakistan is given below in figure 2.1:
Figure 2.1
Source: World Bank’s Report Cost of Doing Business in Pakistan (2012)
Pakistan had adopted closed macroeconomic policies till 1960s, like all other
developing economies. These policies adopted industrialization process as a hallmark
and as the strength of import substitution policies. Public sector was considered a
main player in this process. However, after some time, it was realized that large
public sector is a constant drain on the economy which also results in inefficiencies
and rent seeking activities. This gave way to liberalization of economies and an era of
export-led industrialization was witnessed. Pakistan also adopted the same policies
but the success of East Asian Countries could not be replicated. This led to a need to
boost domestic revenue mobilization for investments by bringing large scale fiscal
reforms including tax policy reforms in the country.
58
2.8 Tax Reforms in Pakistan
Pakistan’s tax system had to pass through strict scrutiny because of lower than
potential revenues, wide range of concessions and exemptions, rampant tax evasion
and inefficient and corrupt tax machinery. People paying taxes were also getting
disarrayed and no focus was made on identifying new taxpayers, documentation of
economy and broadening of tax base.
Owing to stagnant growth in tax collection, there were serious reservations regarding
performance of tax collection machinery. It was generally believed that the revenue
collected by the FBR is well below the true potential of the economy and this is due to
many factors i.e. complexity of the tax laws and procedures and frequent changes
therein, narrow tax base, high rates of taxation, excessive reliance on indirect taxes,
non-professionalism and lack of motivation of the workforce, confrontational
relationship between tax collectors and taxpayers due to excessive discretionary
powers of tax collectors and rampant corruption and tax evasion in the tax system.
In order to improve upon the performance of tax machinery, first major tax reform in
the country was introduced in 1985 when National Tax Reform Commission was
setup. This commission presented its report in December, 1986 where
recommendations on direct taxes and indirect Taxes were presented. In general, this
report recommended many policy measures for documentation of economy to plug
the leakages and tax evasion. On direct taxes side, it recommended not to change the
structure of personal income tax but suggested reduction of corporate rates from 55%
to 45%. It suggested removal of anomalies from wealth tax system and also that
person or entity specific tax incentives should be removed. It also suggested
introduction of annual tax for small retailers and a Self-Assessment System for
persons maintaining accounts. It also suggested allowing tax collection by authorized
59
branches of all nationalized banks. It also recommended that target system should be
changed from net target to gross targets. On the indirect taxes side it gave
recommendations for Customs Duty, Sales Tax and Federal Excise Duty. On
Customs side its recommendations included broadening of custom tariff and not to
consider Customs Duty as source of revenue, decrease rates of Customs Duty,
introduction of Ad-valorem rates instead of specific rates and revamping of rebate
system. On Sales Tax side its recommendations included re-examination of standard
rates of rebate and end to issuing notifications in individual cases, sales tax to be
considered major revenue source, introduction of sales tax on all imported goods and
domestic production. It however, did not support complete introduction of VAT
mode in the Sales Tax. On Central Excise side, its recommendations included
introduction of system of self-clearance instead of supervisory clearances and use of
outside independent accountants/auditors/industrial experts in determining
presumptive production. On administrative side, it suggested creation of
Departmental Ombudsman and Judicial Tribunals, creation of Revenue Division and
creation of a more effective reward system for tax officials.
The changes proposed by the National Tax Reform Commission were neither fully
implemented nor were able to bring any considerable improvement in the tax
structure in the country. Consequently, a high powered task force headed by an
eminent economist Shahid Hussain reviewed the system in place and made
recommendations for its improvement in his Report (2001). Tax and Policy reforms
started on its basis with a view to implementation of recommendations of the report.
Subsequently, on the recommendation of the said report, a comprehensive Tax
Administration Reforms Project was conceptualized and implemented with the
support of World Bank. The project was initiated in January 2005 and was completed
60
in December 2011. Total cost of the project was US$ 149 million, out of which US$
102.9 million was the loan component from the World Bank. Major policy shift was
introduction of functional model, under which FBR divided various functions to
specialized members at central level and then this functional division trickled down
to the field formations level.
This project did bring in automation and computerization of the processes and
systems. Customs introduced a web based system of Goods Declaration (GD) filling
and processing under the name of PaCCS. All Sales Tax processes became further
automated and mandatory computerized sales tax return filing was introduced.
Similar automation was witnessed on Direct Taxes side as well. However, on the tax
policy side, the rate of corporate tax remained same but was envisaged to decrease by
1% annually and major emphasis of direct tax collection was still on withholding tax
regime. Business process re-engineering was done massively. New Income Tax
Ordinance was promulgated in 2001 wherein laws were redrafted and procedures
were simplified. Automation of tax filing was introduced and implemented with the
help of IT subsidiary PRAL to create a data base of taxpayers, a major leap towards
documentation of economy. Great focus of reforms in Income Tax department was
on taxpayers’ education and facilitation and to minimize the contact between tax
collector and taxpayer. On Sales tax side, the rate of sales tax was increased from
15% to 17% and special rates of 19.5% and 21.5% were also introduced for a large
number of goods. The exemption and concessions regime thrived under the project
and the scheme of introducing sector specific or person’s specific exemptions and
concessions continued. One major step undertaken by the project was merger of Sales
Tax, Income Tax and Federal Excise Duty to become one service under the name of
Inland Revenue Service (IRS). However, this merger has so far not brought about
61
major dividends which were expected from this measure, although the tax collection
has been increasing over years but tax base has remained narrow and tax to GDP
ratio stagnant.
These steps taken under the earlier reforms were not enough to uplift the economy
and bring in sustainable investment, therefore, a desire for another reforms process
came up. No significant effort or research was conducted to evaluate the impact of
the previous tax and policy reforms. These new reform initiatives is aimed at making
an elaborate analysis of the ills in the tax system and bring out a realistic and
objective diagnosis of the tax structure and tax system in the country. Some of the
major problems with the existing tax structure in the country are, increasing poor/rich
gap, tax incentives through different schemes, lack of research in tax policy and
limited use of technology. This diagnosis was undertaken with a view to increase Tax
GDP ratio and rationalization and simplification of procedures in country tax system.
A new Strategy Plan – 2013-14 onwards has been put in place to revamp FBR and
tax system. The focus of this strategy paper is on increasing tax filers’ base,
providing tax incentives, increase tax compliance, eliminate tax exemptions and
remove structural flaws in the tax system.
The need for tax reforms becomes even more important in the wake of the fact that
structure of taxes in the country is regressive. The principle of taxation has been
“easy-to-tax” where industry contributes over 60% of taxes while its share in GDP is
just around 20%. This principle of taxation can be witnessed in case of individuals as
well. Tax reforms are aimed at increasing tax revenues with ultimate aim of reducing
fiscal deficit of the country required for sustainable growth of the economy and also
making the tax system more fair, equitable, facilitating, less cumbersome and
encouraging voluntary tax compliance which would be helpful for the overall good
62
health of the economy where savings, investment and industrialization leads to higher
GDP and per capita income and creation of business friendly environment in the
country. This new tax policy reform strategy and its implementation is still on going
and hence is beyond the scope of this study. However, after its completion, some
study should be conducted to evaluate its success rate of achieving desired objectives.
Macro-Economic Reforms/Incentives
Pakistan initiated structural adjustment programs and related reforms in the decade of
1990s. Economic Reforms Program (IMF Poverty Reduction and Growth Facility
(PRGF) took off in 2001 when Pakistan entered into a 3 year agreement with IMF.
This program was undertaken successfully. Since then, Pakistan has consistently
followed reform policies with emphasis on market economy and global integration.
Despite these economic reforms, economic growth rate remained around 3 to 4% per
annum during this decade. The key contributors to low GDP have been poor law and
order situation, political turmoil and unfriendly business environment. Major macro-
economic indicators like domestic savings and capital formation have also not been
suitably improved as projected.
2.9 Tax Policy Incentives for Investment
FDI is one of the most vital areas of economy and immensely helps to promote
economic growth and development of any country. Pakistan has always given due
importance to its policies to attract FDIs. Foreign Private Investment (Promotion and
Protection) Act, 1976 and the Furtherance and Protection of Economic Reforms Act,
1992 provides legal cover for protection of foreign investors/investment in Pakistan.
Remittance of royalty, technology and franchise fee is allowed to projects in social
service, agriculture, international chains food franchise and infrastructure. FBR will
not probe the source of such foreign remittance and investment made out of this fund.
63
Full transfer of capital gains and profit earnings can be repatriated by foreign
investors to home countries. In some selected sectors, it is allowed that foreign
investing companies can contract foreign loans. Customs tariff on import of PME for
agro-based, petro-chemicals, engineering, and chemical industry has been reduced to
10% only.
Successive governments in Pakistan have realized the need of tax incentives to
promote investment and growth in the economy. These incentives have been intended
to introduce attractive rate of returns for the investors and reduce financial risks so as
to control flight of capital. Tax incentives are introduced in Pakistan in a wide range
of economic spectrum. Some of these are discussed below:-
Preferential Treatment: Exemptions and Concessions
Governments in Pakistan have historically granted various tax exemptions and
concessions. These preferential treatments have mainly been provided in the tax laws
through SROs. Multiple SROs have been issued by FBR in this regard (1,920 SROs
identified by FBR). These SROs have resulted in loss of around 3 to 4% of GDP in
terms of unrealized revenues or revenue leakages. Another aspect of these SROs has
been the issuance of SROs without parliamentary approval in line with the provisions
of the Constitution of the country.
These SROs have been sector specific as well as general in nature but the underlying
spirit of all SROs have been to allow tax exemptions or concessions with a view to
promote industrial investment in the country. Various tax exemptions and concessions
granted in period 2013-2014 are given in table 2.6.
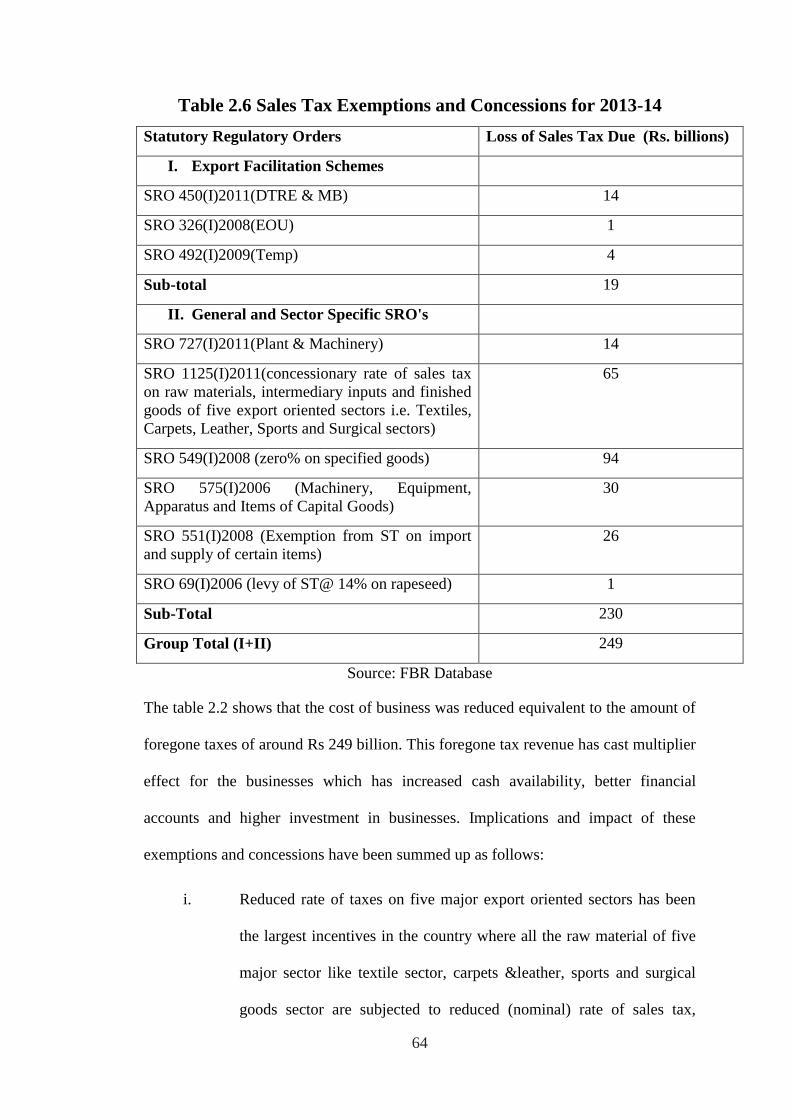
64
Table 2.6 Sales Tax Exemptions and Concessions for 2013-14
Statutory Regulatory Orders Loss of Sales Tax Due (Rs. billions)
I. Export Facilitation Schemes
SRO 450(I)2011(DTRE & MB) 14
SRO 326(I)2008(EOU) 1
SRO 492(I)2009(Temp) 4
Sub-total 19
II. General and Sector Specific SRO's
SRO 727(I)2011(Plant & Machinery) 14
SRO 1125(I)2011(concessionary rate of sales tax
on raw materials, intermediary inputs and finished
goods of five export oriented sectors i.e. Textiles,
Carpets, Leather, Sports and Surgical sectors)
65
SRO 549(I)2008 (zero% on specified goods) 94
SRO 575(I)2006 (Machinery, Equipment,
Apparatus and Items of Capital Goods)
30
SRO 551(I)2008 (Exemption from ST on import
and supply of certain items)
26
SRO 69(I)2006 (levy of ST@ 14% on rapeseed) 1
Sub-Total 230
Group Total (I+II) 249
Source: FBR Database
The table 2.2 shows that the cost of business was reduced equivalent to the amount of
foregone taxes of around Rs 249 billion. This foregone tax revenue has cast multiplier
effect for the businesses which has increased cash availability, better financial
accounts and higher investment in businesses. Implications and impact of these
exemptions and concessions have been summed up as follows:
i. Reduced rate of taxes on five major export oriented sectors has been
the largest incentives in the country where all the raw material of five
major sector like textile sector, carpets &leather, sports and surgical
goods sector are subjected to reduced (nominal) rate of sales tax,
65
custom duty and income tax at import stage. Their electricity and gas
connections are exempt from sales tax and they get rebates on exports.
Their interest rates are lower than other sectors when they get loan
from any bank.
ii. Waiver of import duty on plant, machinery and equipment has been
beneficial to the industrial businesses.
iii. GST exemption provided to domestic and foreign manufactured plant
and machinery has been useful for non-manufacturing sector.
Decreased Rate of Income Tax
The most important tax for businesses is the corporate income tax and any incentive
policy on a direct tax has a clear important and significant relationship with increased
investment and businesses. Pakistan, following the international trends, has also been
decreasing the direct tax rates for businesses. Downward revision in corporate rate
structure for banking, public and private companies over the years (1993-2015) is
shown at figure 2.2.
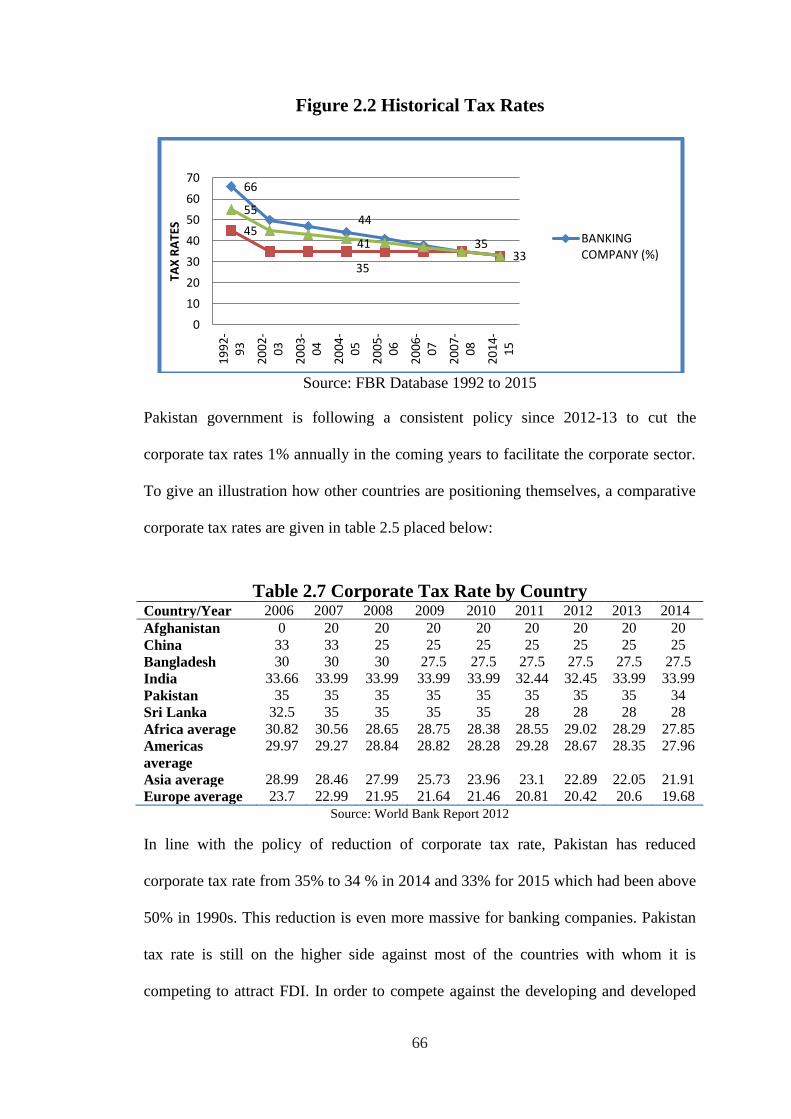
66
Figure 2.2 Historical Tax Rates
Source: FBR Database 1992 to 2015
Pakistan government is following a consistent policy since 2012-13 to cut the
corporate tax rates 1% annually in the coming years to facilitate the corporate sector.
To give an illustration how other countries are positioning themselves, a comparative
corporate tax rates are given in table 2.5 placed below:
Table 2.7 Corporate Tax Rate by Country Country/Year 2006 2007 2008 2009 2010 2011 2012 2013 2014
Afghanistan 0 20 20 20 20 20 20 20 20
China 33 33 25 25 25 25 25 25 25
Bangladesh 30 30 30 27.5 27.5 27.5 27.5 27.5 27.5
India 33.66 33.99 33.99 33.99 33.99 32.44 32.45 33.99 33.99
Pakistan 35 35 35 35 35 35 35 35 34
Sri Lanka 32.5 35 35 35 35 28 28 28 28
Africa average 30.82 30.56 28.65 28.75 28.38 28.55 29.02 28.29 27.85
Americas
average
29.97 29.27 28.84 28.82 28.28 29.28 28.67 28.35 27.96
Asia average 28.99 28.46 27.99 25.73 23.96 23.1 22.89 22.05 21.91
Europe average 23.7 22.99 21.95 21.64 21.46 20.81 20.42 20.6 19.68
Source: World Bank Report 2012
In line with the policy of reduction of corporate tax rate, Pakistan has reduced
corporate tax rate from 35% to 34 % in 2014 and 33% for 2015 which had been above
50% in 1990s. This reduction is even more massive for banking companies. Pakistan
tax rate is still on the higher side against most of the countries with whom it is
competing to attract FDI. In order to compete against the developing and developed
66
4445
35
55
41 3533
0
10
20
30
40
50
60
70
19
92
-9
3
20
02
-0
3
20
03
-0
4
20
04
-0
5
20
05
-0
6
20
06
-0
7
20
07
-0
8
20
14
-1
5
TAX
RA
TES
BANKINGCOMPANY (%)
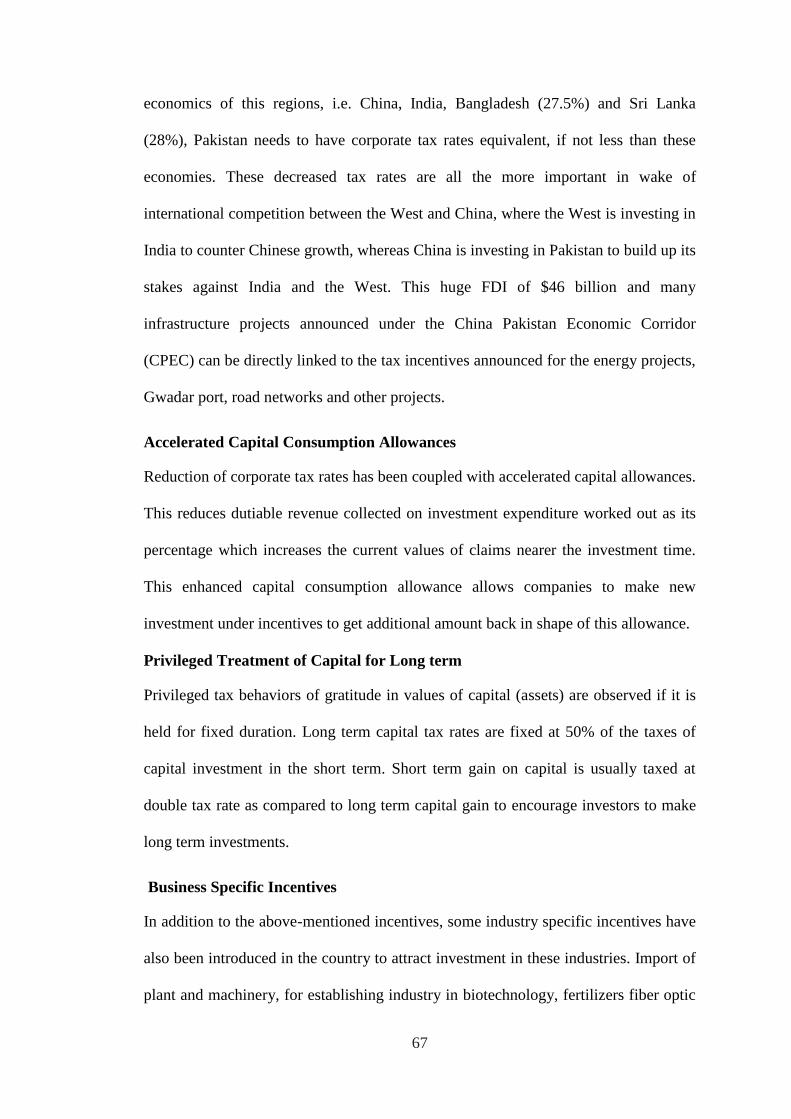
67
economics of this regions, i.e. China, India, Bangladesh (27.5%) and Sri Lanka
(28%), Pakistan needs to have corporate tax rates equivalent, if not less than these
economies. These decreased tax rates are all the more important in wake of
international competition between the West and China, where the West is investing in
India to counter Chinese growth, whereas China is investing in Pakistan to build up its
stakes against India and the West. This huge FDI of $46 billion and many
infrastructure projects announced under the China Pakistan Economic Corridor
(CPEC) can be directly linked to the tax incentives announced for the energy projects,
Gwadar port, road networks and other projects.
Accelerated Capital Consumption Allowances
Reduction of corporate tax rates has been coupled with accelerated capital allowances.
This reduces dutiable revenue collected on investment expenditure worked out as its
percentage which increases the current values of claims nearer the investment time.
This enhanced capital consumption allowance allows companies to make new
investment under incentives to get additional amount back in shape of this allowance.
Privileged Treatment of Capital for Long term
Privileged tax behaviors of gratitude in values of capital (assets) are observed if it is
held for fixed duration. Long term capital tax rates are fixed at 50% of the taxes of
capital investment in the short term. Short term gain on capital is usually taxed at
double tax rate as compared to long term capital gain to encourage investors to make
long term investments.
Business Specific Incentives
In addition to the above-mentioned incentives, some industry specific incentives have
also been introduced in the country to attract investment in these industries. Import of
plant and machinery, for establishing industry in biotechnology, fertilizers fiber optic
68
and solar energy have been granted full exemption for import duty. Tax holidays are
provided for four years in these industries as well. Duty exemption has been provided
to raw material used in manufacturing of plant and machinery in these industries. Full
customs duty exemption is granted to raw material used in manufacturing of plan and
machinery for BMR projects.
Package for Agriculture Sector
Following are the available incentives for agriculture sector:
i. 3 year Income Tax holiday has been introduced for new industries involved in
establishing and operationalizing cold chain facilities and warehouses for agri
produce.
ii. Tax exemption has been granted on supply of fish along with other agri
produce
iii. Import of machinery was subject to duties and taxes ranging from 28 to 43
percent in aggregate which has now been brought down to 9%
iv. One million interest free loans have been introduced to facilitate small
growers.
In agriculture sector, this impact is analyzed through index of agricultural
production and land irrigated in relation with the changes in the tax rates.
These two variables act as proxy for the overall agriculture sector. If the index
of agricultural production significantly increases in relation with the reduction
of duty and taxes and introduction of tax incentives, then the impact of tax
changes and incentives can be attributed to such growth. If, on the other hand
such an increase is not visible, then tax incentives have failed to bring about
any significant changes in the agricultural sector. The better performance of
agricultural sector can take place through two main initiatives: i)
modernization of techniques through use of modern machinery and
technology, and ii) increased investment in form of better agri-inputs as well
as investment on modernization. In case of Pakistan, it is visible that the tax
changes or incentives for imported and locally produced agriculture machinery
and implements have failed to bring affect the agricultural sector significantly
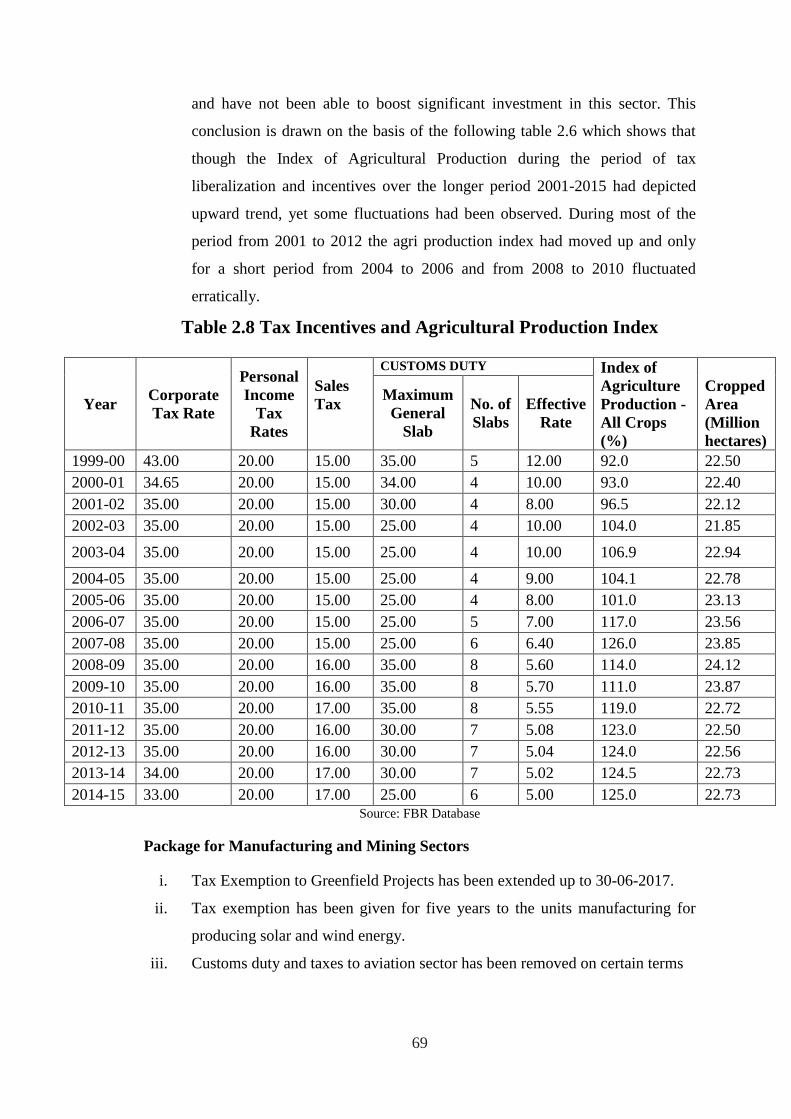
69
and have not been able to boost significant investment in this sector. This
conclusion is drawn on the basis of the following table 2.6 which shows that
though the Index of Agricultural Production during the period of tax
liberalization and incentives over the longer period 2001-2015 had depicted
upward trend, yet some fluctuations had been observed. During most of the
period from 2001 to 2012 the agri production index had moved up and only
for a short period from 2004 to 2006 and from 2008 to 2010 fluctuated
erratically.
Table 2.8 Tax Incentives and Agricultural Production Index
Year Corporate
Tax Rate
Personal
Income
Tax
Rates
Sales
Tax
CUSTOMS DUTY Index of
Agriculture
Production -
All Crops
(%)
Cropped
Area
(Million
hectares)
Maximum
General
Slab
No. of
Slabs
Effective
Rate
1999-00 43.00 20.00 15.00 35.00 5 12.00 92.0 22.50
2000-01 34.65 20.00 15.00 34.00 4 10.00 93.0 22.40
2001-02 35.00 20.00 15.00 30.00 4 8.00 96.5 22.12
2002-03 35.00 20.00 15.00 25.00 4 10.00 104.0 21.85
2003-04 35.00 20.00 15.00 25.00 4 10.00 106.9 22.94
2004-05 35.00 20.00 15.00 25.00 4 9.00 104.1 22.78
2005-06 35.00 20.00 15.00 25.00 4 8.00 101.0 23.13
2006-07 35.00 20.00 15.00 25.00 5 7.00 117.0 23.56
2007-08 35.00 20.00 15.00 25.00 6 6.40 126.0 23.85
2008-09 35.00 20.00 16.00 35.00 8 5.60 114.0 24.12
2009-10 35.00 20.00 16.00 35.00 8 5.70 111.0 23.87
2010-11 35.00 20.00 17.00 35.00 8 5.55 119.0 22.72
2011-12 35.00 20.00 16.00 30.00 7 5.08 123.0 22.50
2012-13 35.00 20.00 16.00 30.00 7 5.04 124.0 22.56
2013-14 34.00 20.00 17.00 30.00 7 5.02 124.5 22.73
2014-15 33.00 20.00 17.00 25.00 6 5.00 125.0 22.73 Source: FBR Database
Package for Manufacturing and Mining Sectors
i. Tax Exemption to Greenfield Projects has been extended up to 30-06-2017.
ii. Tax exemption has been given for five years to the units manufacturing for
producing solar and wind energy.
iii. Customs duty and taxes to aviation sector has been removed on certain terms
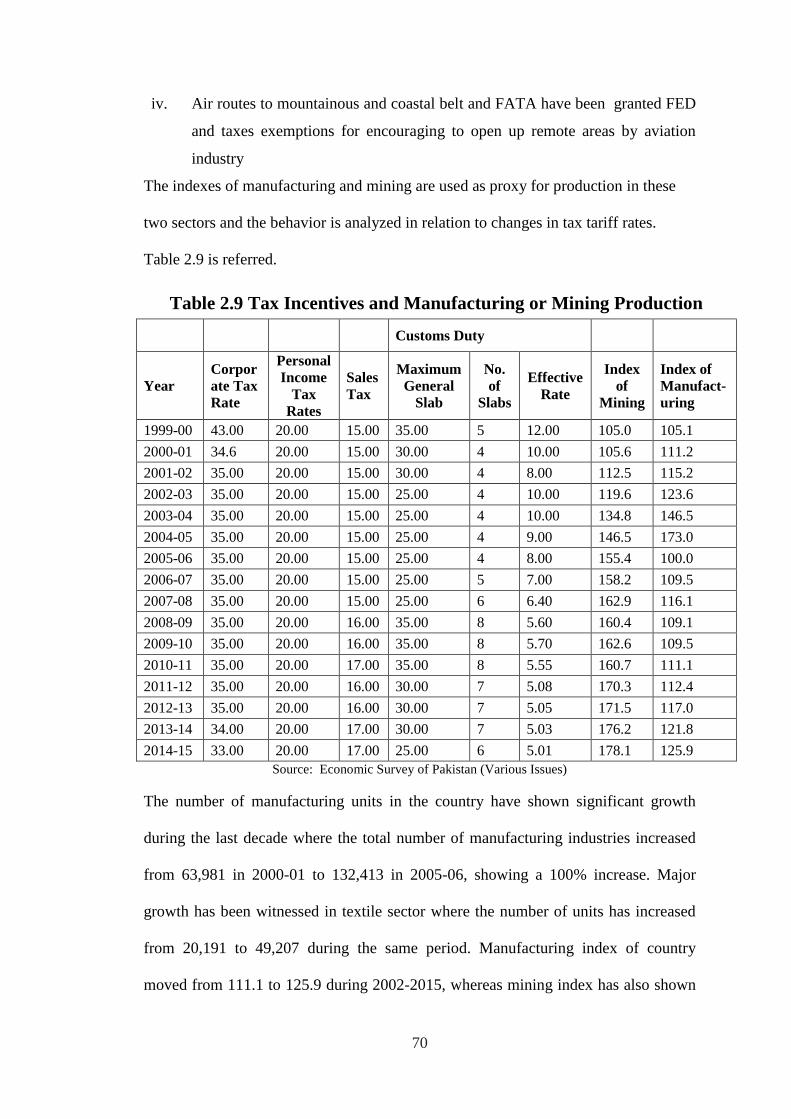
70
iv. Air routes to mountainous and coastal belt and FATA have been granted FED
and taxes exemptions for encouraging to open up remote areas by aviation
industry
The indexes of manufacturing and mining are used as proxy for production in these
two sectors and the behavior is analyzed in relation to changes in tax tariff rates.
Table 2.9 is referred.
Table 2.9 Tax Incentives and Manufacturing or Mining Production
Customs Duty
Year Corpor
ate Tax
Rate
Personal
Income
Tax
Rates
Sales
Tax
Maximum
General
Slab
No.
of
Slabs
Effective
Rate
Index
of
Mining
Index of
Manufact-
uring
1999-00 43.00 20.00 15.00 35.00 5 12.00 105.0 105.1
2000-01 34.6 20.00 15.00 30.00 4 10.00 105.6 111.2
2001-02 35.00 20.00 15.00 30.00 4 8.00 112.5 115.2
2002-03 35.00 20.00 15.00 25.00 4 10.00 119.6 123.6
2003-04 35.00 20.00 15.00 25.00 4 10.00 134.8 146.5
2004-05 35.00 20.00 15.00 25.00 4 9.00 146.5 173.0
2005-06 35.00 20.00 15.00 25.00 4 8.00 155.4 100.0
2006-07 35.00 20.00 15.00 25.00 5 7.00 158.2 109.5
2007-08 35.00 20.00 15.00 25.00 6 6.40 162.9 116.1
2008-09 35.00 20.00 16.00 35.00 8 5.60 160.4 109.1
2009-10 35.00 20.00 16.00 35.00 8 5.70 162.6 109.5
2010-11 35.00 20.00 17.00 35.00 8 5.55 160.7 111.1
2011-12 35.00 20.00 16.00 30.00 7 5.08 170.3 112.4
2012-13 35.00 20.00 16.00 30.00 7 5.05 171.5 117.0
2013-14 34.00 20.00 17.00 30.00 7 5.03 176.2 121.8
2014-15 33.00 20.00 17.00 25.00 6 5.01 178.1 125.9
Source: Economic Survey of Pakistan (Various Issues)
The number of manufacturing units in the country have shown significant growth
during the last decade where the total number of manufacturing industries increased
from 63,981 in 2000-01 to 132,413 in 2005-06, showing a 100% increase. Major
growth has been witnessed in textile sector where the number of units has increased
from 20,191 to 49,207 during the same period. Manufacturing index of country
moved from 111.1 to 125.9 during 2002-2015, whereas mining index has also shown
71
increasing trend with small decrease in 2008-2009 and 2010-2011. A significant
relationship has been observed between tax/tariff structure and increase in production
of manufacturing and mining.
If we take a look at neighboring India, the tax incentives are designed to attract
investment with special focus on industries. These incentives are offered on a very
large scale and include incentives for new industries with special attention towards
industries in areas of power, port, highways and IT development etc. The policies
have also focused on giving additional incentives in the less developed areas of the
country, establishment of Special Economic Zones and accelerated tax deductions are
allowed for R&D expenses. Concessional loans facilities for agricultural and
industrial development are a permanent feature of Indian tax incentives. These
incentives are available at both the Central and State level in India in order to attract
foreign investments, Avoidance of double taxation treaties network has been put in
place (over 94 Treaties). In order to regulate transfer pricing mechanism, India has put
up guidelines on the model of OECD. The hallmark of these policies in India is the
consistency and certainty of incentives.
On the same pattern, UK has also offered tax incentives for businesses such as tax
incentives for R&D for businesses through enhanced deductions, additional incentives
for SME, special tax regimes related to patents and innovations, annual investment
allowance schemes, creative industries tax incentives (film tax relief, animated
productions tax relief, video game development tax relief etc.). Special entrepreneur
zones have been developed. Avoidance of double tax treaties (125 double tax
treaties) have also been contracted.
72
Scheme for Construction/Housing Sectors
A scheme for Construction/Housing sector has been introduced in Pakistan. This
industry creates a ripple effect by influencing over 16 other related manufacturing
sectors and services sectors. Therefore, its significance is crucial for overall uplift of
economy and to bring in new investment in the economy. Following are the tax
incentives in this sector like: minimum tax for builders has been suspended for three
years, capital gain tax is exempted upto 2018 in case of development of housing
sector, supply of bricks income tax has been reduced to half and sales tax on this has
been lifted till 2018.
Tariff rate concessions
Tariff rates are readjusted at time of annual budget which is presented and approved
by the Legislature. The number of tariff slabs is 5 now. In addition to the above, at the
time of import, Sales Tax along with withholding taxes is also to be paid. Thus, on
average duty/tax rate paid by the importer is around 30% which is quite higher in
comparison to the countries in the region.
The current tariff incentives for attracting FDI as a “Package” are as follows:
i. Duty exemptions on import of plant and equipment for agri farming.
ii. Removal of customs duty on import of raw materials for use in export
oriented industries.
iii. Import of plant, machinery and equipment charged only 5% duty for
export industries whereas only 5 to 10 percent import duty on plant and
equipment for industrial sector whereas for non-manufacturing
industries, 10% customs is levied on import of plant, machinery.
These tariff incentives have a direct bearing on the overall imports of the country
which is directly linked with the economic activity in the country. It has been
73
witnessed that the value of imports increases when the import tariff decreases and
imports of goods goes down on which tariff is increased. This consistent policy of
governments to reduce tariff slabs as well as rates has boosted businesses growth in
Pakistan, in the shape of easy accessibility and affordability of raw materials and
intermediate goods which are direct inputs of industry.
Tax Holidays
Temporary reduction of tax, elimination of a tax, tax subsidy or tax reduction which
acts as incentives for business investment is known as a tax holiday. Tax holidays can
be provided at every level of government i.e. local, provincial and federal.
Governments of developing countries sometimes reduce or even slash the taxation for
companies for inflow of FDI in selected industries. .
In Federal Budget 2015-16 tax holidays have been given. If a new industrial unit is
established in Khyber Pakhtunkhwa, it has been provided with 5 year tax holiday
(exemption from payment of turnover tax). On the same pattern, a three year income
tax holiday for Baluchistan has also been announced. This generous tax holiday was
given to both regions because businesses in these two provinces have suffered
immensely due to terrorism. Due to budgetary constraints Government couldn’t invest
huge amounts in the energy sector, so an incentives package for dilapidated power
sector has been provided. The government has introduced a 10-year tax holiday to
companies investing in setting up electricity transmission lines before 30-06-2018.
Another major tax holiday has been given to China Overseas Port Holding Company
that took over the Gwadar port from the Singapore Port Authority in February 2013.
They have been given tax holiday for a period of 23 years. In early 2000’s,
Government of Pakistan also provided exemption/tax holiday for 10 years to promote
investment in Information Technology (IT) sector.

74
Currently, tax holidays introduced in the tax system include 3 year tax holiday for
fresh industrial activities set up for cold chains, warehouses of agri produce and for
running warehouses for agri produce. Exemption of deduction at source has been
provided for supply of fish as well. Under a scheme, 100% waiver of customs duty for
selected industries in least developed areas in Sindh, Balochistan and Punjab has been
provided. Similarly, Industrial Estates in Gujranwala, Islamabad, Sialkot, Rawalpindi,
Lahore, Faisalabad, Multan, Kotri and Hyderabad have been granted 50% exemption
from liable custom duty. Industrial undertakings established in Sindh except Karachi
have been granted 75% exemption of the liable custom duties. The income tax
rebates on value added goods and export proceeds are enjoyed by all of the industrial
estates. All these tax holidays have increased the confidence of investors and projects
are coming up with huge investments.
Rural Industrialization
The consecutive governments have shown great importance to establish industrial
zones in rural areas in the country through attractive incentive packages in such areas.
Following are some of main incentives provided for the rural development through
industrialization which include: exemption of duties and taxes on import of
machinery, tax holiday provided for eight years, energy/power generation
undertakings exempted from all duties and taxes and permission granted to produce
power in rural areas for local distribution and surplus would be guaranteed to be
purchased by the government.
Avoidance of Double Taxation Treaties
Pakistan has signed over sixty-seven full blown avoidance of double taxation treaties
and five segmental treaties. These treaties cater for preferential tax treatment, reduced
business operation costs and safeguards against each other’s investments etc. Review
75
of these treaties is done frequently so that tax and trade developing scenarios are
catered for. Thus, the main aim is to facilitate the investors from both sides.
Special Economic Zones (SEZs)
The center piece of Investment Policy 2013 is Special Economic Zones (SEZs) Act
2012 which encourages industrial clusterization, provision of incentives for foreign
investors and ensuring developed physical infrastructure in the country to attract
foreign investors. The incentives for investment have been provided legal cover.
Board of Investment (BOI) provides secretarial services to different approval forums
for establishment of SEZ clusters in the country. Within the Zones, BOI offers one
window facilitation services to investors. The SEZs will assist lower business cost and
help in reducing poverty by promoting economic development in the less developed
areas.
With the purpose to goad investment in an area/region (normally a remote/less
developed area) government has introduced various tax free zones in the country.
Some of the major tax free zones include Gadoon Amazai, Sunder industrial estate
and Hub industrial area etc. Similarly in order to promote exports, all major needs of
the industry are catered by establishing industrial estates / export processing zones.
Some of the major export processing zones are set up at Karachi EPZ, Lahore EPZ,
SITE area Karachi, North Karachi industrial area, Site Kotri and Sialkot industrial
area etc.
EPZ in Karachi was set up under EPZA Ordinance, 1980. Total area of the EPZ was
500 acres with attractive package for overseas investment in the industrial units
producing export related products. Many incentives have been offered in EPZs like
duty free import and export, exemption in income tax upto 75% after tax holiday
period, tax holidays for all industrial establishments, development of physical
76
infrastructure, warehouses provided for goods in transit and allowance of non-resident
Pakistanis to invest in the EPZs too.
Incentives in Real Estate Industry
Sixty industrial estates are set up in Pakistan with all infrastructural facilities and
many incentives by successive governments. Given below are the special incentives
provided to these estates:
i. 100% duty waiver for selected industrial estates
ii. Estates in Gujranwala, Rawalpindi, Sialkot, Islamabad, Faisalabad, Lahore,
Multan, Kotri and Hyderabad have been exempted from 50% custom duty.
iii. Establishment of Industrial estates in Sindh except Karachi and have been
granted 75% exemption from custom duties.
iv. Export earnings and value added items have been accorded income tax
rebates.
Tax Amnesty Schemes in Pakistan (1958-2015)
Pakistan has a history of introducing tax amnesty schemes as an incentive to introduce
documentation in the economy and bring the informal economy in the tax net.
First Tax Amnesty Scheme in the country was introduced under Martial Law
Regulation 48 of the 1958. This scheme allowed taxpayers to revise their returns and
declare the undeclared income as a separate unit of income to be taxed at a rebate. A
total of 71,289 declarations of excess income were filed under this scheme with
addition of 20,000 new taxpayers to the total of 266,183 existing taxpayers. The total
collection under this scheme was Rs. 223 million.
Second Tax Amnesty in the series of such schemes was introduced through
Correction of Returns and False Declarations Regulation Order No. 32 in 1969. Under
this scheme taxpayers were allowed to correct their declarations under immunity from
77
penal proceedings. The result of this amnesty was poorer as compared to the earlier
scheme as only 19,600 returns of excess income were revised/filed. Third Tax
Amnesty was introduced in Pakistan through Finance Act, 1976. No concrete data is
available on this scheme but the available record reveals that this scheme also met
same fate as the previous one without achieving desired goal of expanding tax net.
Tax amnesty Scheme 1997 was primarily a Wealth Tax Amnesty Scheme with
incentive to disclose and declare undisclosed assets. Only Rs. 147 million could be
collected under this scheme.
Tax Amnesty Scheme 2000 is considered as the most successful of all Tax Amnesty
Schemes introduced in the country so far. This scheme fetched a total collection
which was higher than what was collected through all earlier schemes. All previous
schemes put together were only able to collect less than Rs. 1 billion. The collection
under this scheme exceeded Rs. 10.5 billion with declared assets to the tune of more
than Rs. 103 billion. 88,000 people/entities availed this scheme and paid tax. This Tax
Amnesty succeeded because it was coupled with start of strict business, property and
assets survey conducted by the tax officials escorted by military personnel. The
extension of this scheme under the name New Tax Amnesty Scheme of 2002 did not
bring equal response despite the fact that the payment of tax was allowed in monthly
installments.
Investment Tax Scheme, 2008 was introduced under section 120A of the Income Tax
Ordinance, 2001 in 2008. It allowed anyone to declare undisclosed assets by paying
2% tax on the value of assets. Rs 2.5 billion tax @ 2% of assets value was collected
under this scheme.
Besides the aforesaid Amnesty Schemes, governments in Pakistan have announced
other tax specific amnesties. Some of these are:-
78
i. April 2012: amnesty for funds invested in stock exchange.
ii. Prime Minister’s Tax amnesty and Investment Incentive Scheme 2013:
Under this scheme, amnesty was provided from taxation and penal
procedures on investment of undisclosed income/assets in industrial
undertakings and amnesty from audit for five previous and as many
successive tax years in case of individuals filing tax returns for last
three years with minimum tax of Rs 20,000 per annum in case of NTN
holders and Rs, 25,000 in case of non NTN holders.
iii. Tax amnesty schemes have also been issued by FBR in different forms
like tax holidays for investment in certain industrial sectors or in
certain areas or industrial estates e.g. Tax holiday for five years under
clause 125B of Part I of the Second Schedule to the Income Tax
Ordinance, 2001 is in currency.
iv. Government announced tax holidays that any industry established in
that area is given time period normally 5-10 years during which that
industry will be exempt from paying any taxes.
v. Incentives like Aghaz-e-Haqooq Baluchistan Package, NWFP, FATA
& PATA Package have been introduced over the years in which
industry established in these areas has been exempted from payment of
taxes for a certain time period.
vi. A scheme under Income Tax Ordinance, 2001 is a permanent feature
of Pakistan’s tax system where no questions are asked on Foreign
Inward Remittance. This scheme allows Tax Credit for foreign hard
currency. This scheme is provided to attract Pakistani expatriates to
return and invest in the country by bringing capital in foreign
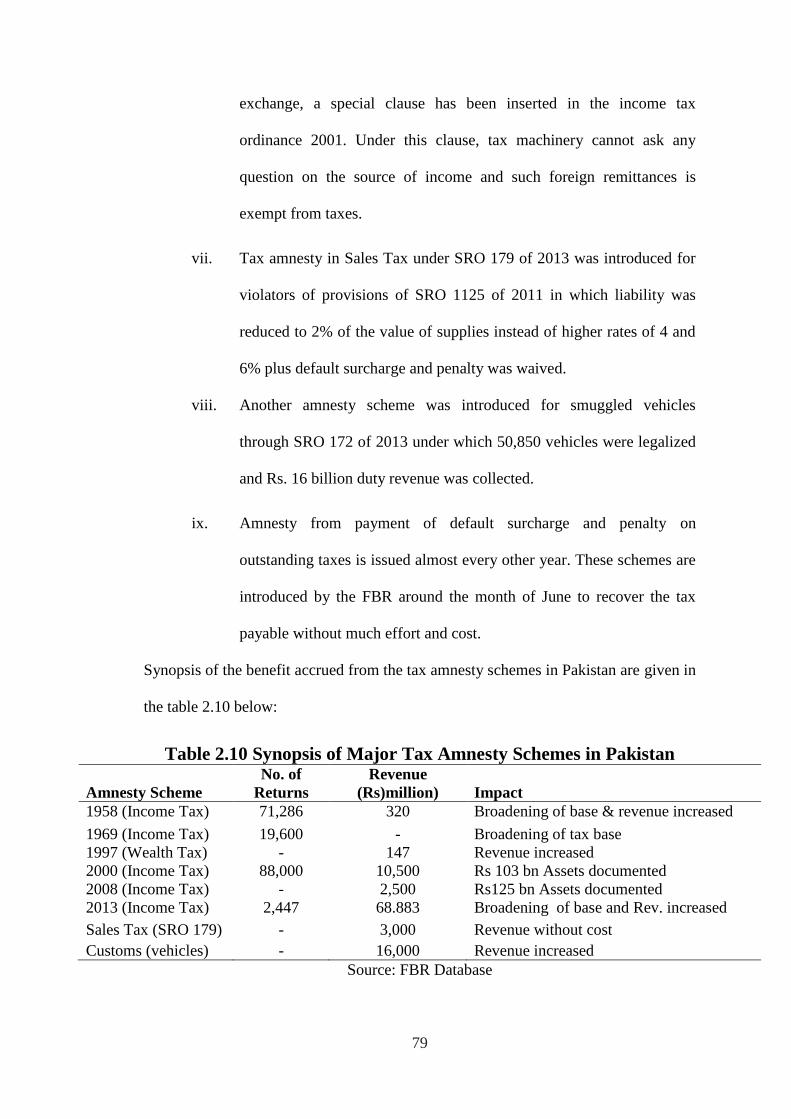
79
exchange, a special clause has been inserted in the income tax
ordinance 2001. Under this clause, tax machinery cannot ask any
question on the source of income and such foreign remittances is
exempt from taxes.
vii. Tax amnesty in Sales Tax under SRO 179 of 2013 was introduced for
violators of provisions of SRO 1125 of 2011 in which liability was
reduced to 2% of the value of supplies instead of higher rates of 4 and
6% plus default surcharge and penalty was waived.
viii. Another amnesty scheme was introduced for smuggled vehicles
through SRO 172 of 2013 under which 50,850 vehicles were legalized
and Rs. 16 billion duty revenue was collected.
ix. Amnesty from payment of default surcharge and penalty on
outstanding taxes is issued almost every other year. These schemes are
introduced by the FBR around the month of June to recover the tax
payable without much effort and cost.
Synopsis of the benefit accrued from the tax amnesty schemes in Pakistan are given in
the table 2.10 below:
Table 2.10 Synopsis of Major Tax Amnesty Schemes in Pakistan
Amnesty Scheme
No. of
Returns
Revenue
(Rs)million) Impact
1958 (Income Tax) 71,286 320 Broadening of base & revenue increased
1969 (Income Tax) 19,600 - Broadening of tax base
1997 (Wealth Tax) - 147 Revenue increased
2000 (Income Tax) 88,000 10,500 Rs 103 bn Assets documented
2008 (Income Tax) - 2,500 Rs125 bn Assets documented
2013 (Income Tax) 2,447 68.883 Broadening of base and Rev. increased
Sales Tax (SRO 179) - 3,000 Revenue without cost
Customs (vehicles) - 16,000 Revenue increased
Source: FBR Database
80
Global Perspective of Tax Amnesties
In 1961, IRS (USA) installed new data processing equipment that would hamper tax
evasion. So at that time, tax amnesty was launched for the taxes under paid by people
in the earlier periods.
US treasury loses as much as $100 billion annually to offshore tax non-compliance.
Hence the US government enacted Foreign Accounts Tax Compliance Act of 2009.
The cost of implementation, both for the IRS and the foreign banks, far outweighed
the revenue generated through this scheme, because there was no cost benefit analysis
of the law. Therefore the IRS started an Offshore Voluntary Disclosure Program
(OVDP) in 2009 which was extended by OVDP 2012 and is still in place.
There is another Streamlined Foreign Offshore Filing and Compliance Procedure
which offers opportunity to those taxpayers who have failed to disclose their offshore
assets out of ignorance of law. They are required to submit an affidavit that the default
on their part was not willful. Taxpayers under civil or criminal investigation are
ineligible to qualify for this scheme. Already assessed penalties are not abated in case
of opting of a taxpayer for this scheme. Unlike the amnesty scheme offered in
Pakistan, there is no such facility of closing agreement between the IRS and the
taxpayer. The returns so filed are not automatically selected for audit, but can come
under scrutiny and, in that case, wrong declaration leads to penalty and prosecution.
Similarly, there is an ongoing amnesty for a person who has failed to report properly
on his foreign bank accounts regarding waiver of penalty.
A tax amnesty scheme of India, by the name Voluntary Disclosure of Income and
Wealth Scheme, 1997 (VDIS) has been considered a very successful amnesty as it
discovered Rs.330 bn of undisclosed income/wealth and collected Rs. 110 billion in
revenue. This amnesty scheme was challenged in the court of law and the Indian

81
Supreme Court in the case of All India Federation of Tax Practitioners Versus UOI
not only upheld the scheme, it also rejected the plea that the scheme was arbitrary and
violated Article 14 of the constitution of India which provides equality before law.
India has very intrusive, stringent and confiscatory tax laws, yet, many tax amnesty
schemes have been offered, from time to time, to achieve fiscal objectives. Another
scheme by the name of Voluntary Compliance Encouragement Scheme, 2013 was
launched where Rs.77 billion was collected.
82
CHAPTER 3
LITERATURE REVIEW
This chapter undertakes to find out the relationship of tax incentives with investment.
This chapter gives a detailed account of empirical evidences by the researcher that
provides a foundation and background for this study. Furthermore, the chapter
consists of tax policy incentives and investment, empirical evidence regarding the
impact of tax incentives on investment, efficacy of offering tax incentives in
promoting FDI, tax incentives and non- tax factors affecting FDI and domestic
investment.
There is a voluminous literature available on the subject around the globe. The
economists have given importance to various fiscal problems with varied degree.
Some believe that it is basically the poor governance which is responsible for all
economic and social problems and some believe that it is the deficiency of resources
and lower tax revenues which lead to economic distortions.
Amongst various capital streams in the 1990s, FDI was the major stream to affect
nations. FDI was less unpredictable and did not demonstrate an expert patterned
conduct (Ozturk, Ilhan, 2007). FDI and monetary development’s relationship has
motivated observational writings on both created and creating nations. Few gave a
positive connection but others did not do so. The work related to less developed
countries (LDC's) gave positive relationship but information relating to developed
countries (DC's) have not found any development advantage. Both Neo-classical
83
models of development give the basis to the experimental work on the FDI-
development relationship. The relationship clarifies and concentrates on four
fundamentals: (i) factors of development, (ii) factors of FDI, (iii) role of MNCs’ host
nations, and (iv) determination of causal relationship between two variables
(Chowdhury & Mavrotas 2005). The study pays attention to the significance of FDI
and development. It also appreciates the importance of monetary development as a
vital ingredient to pull FDI streams. The principle of monetary development as a
pulling factor for FDI is a critical segment of contributing firms' vital choice. FDI
helps in expanding development by offering new innovations, for instance, new
generation forms and procedures, administrative abilities, thoughts, and new
assortments of capital merchandise. Innovative change has been suggested for
financial development (Grossman & Helpman, 1991; Barro & Martin, 1995).
The end goal was kept in mind to make a decision for the effect of investment
remittances on corporate investments of Slovenian firms that was fiscally compelled.
The researchers exhibited the effect of duty in micro econometric and micro
simulation setting by applying two different transmission channels, one being crucial
for monetarily unconstrained firms while the second being pivotal for monetarily
obliged firms (Bond & Reenen, 2007). The dynamic element request models—basic
and diminished structure models are responsible for the expansion of assessment and
testing of corporate investment, and also the impact of monetary requirements on
corporate investments (Modigliani &Miller, 1958). The desirable assets in a perfect
capital market can be raised and reliance is on budgetary elements in a defective
capital market.
Myers (1984) in the pecking-order theory suggests personality as a main priority and
there would be expense advantage to a firm having accessible inside assets and also
84
have choice to contribute at a lower rate of return. Investment is discouraged by
uncertainty of policy and the speculation is increased by vulnerability. Hartman
(1972) and Bel (1985) compare between loan cost and the negligible rate of
quantifiable profit which is based upon the neoclassical theory of investment (NTI).
Suspicion was part of NTI before Keynes, (1936) because it was sure as what was to
come, in which financing cost was at the danger free rate. Keynes contended at
incredible length that instability and hazard revulsions seriously are confined to the
observational pertinence of the hypothesis. Keynes’ hypothesis on business and
sparing was joined with the neoclassical theory of investment under the Hicks
combination. ‘Market excellences’ could keep the loan fee from moving quickly to
keep venture at the full occupation level (Mankiw, 1988). Keynes' inquiries on
investment would not have been troubled with the said combination. The neoclassical
hypothesis of money allured the scientists with a defense for abstracting from the
complexities which were affected by budgetary contemplations" (Gertler, 1988).
The Abel and Blanchard (1986) model and the Euler-mathematical statement
determination are the basic models that incorporate the Q display which have not been
effective in exhibiting the change process. The capital of a company cannot be
balanced speedily and without saving cost. Moreover, it is difficult to fall back on
static models, therefore, the econometricians have suggested dependence upon a
dynamic detail which is not inferred as an ideal alteration conduct for some specific
structure of modification expenses. Bond and Reenen (2007) asserted a good
exposition of the decreased structure models. For instance, the quickening agent
model and the mistake adjustment model, as they give a complex basic process that
creates the duties through client expense of capital that influences the corporate
investments. The investment charge rewards reduce the client expense of capital and
85
the obstacle rate used to assess the benefit of the investments. The lower rate of return
is inferred for increased and more beneficial investments. Additional expense incurs
through income because the capital business sector is not perfect and a firm cannot
generate business funds as desired. The income is increased by investment charge
remittances and also becomes accessible to the inner assets. The worldwide two-fold
tax assessment is due to arrival of external direct investment. In the host country, the
external auxiliary is subject to corporate salary taxes. In home country these benefits
are burdened under the corporate pay charge. The global business action is dismayed
by this twofold tax assessment.
A strategic distance is maintained from it by most nations by taking into account the
Model Tax Convention of OECD or, in the EU, the Parent-Subsidiary Directive. To
eliminate this worldwide twofold tax assessment, nations receive a tax credit
framework as in US, Japan, Greece, Ireland, Spain, UK, or an exception framework
like in other EU nations. Outside wage is saddled in the country of origin under the
exclusion framework (or regional tax assessment) and is remitted from tax assessment
in the country of origin of the guardian. Later on, the benefits are exhausted in the
country where the auxiliary is located. Expenses incurred in the country of origin are
charged as liabilities in the host nation of the auxiliary under a credit framework (or
overall tax assessment). If the outside expense installments exceed the assessment risk
in the host nation of the guardian organization, firms are allowed to guarantee credit
to meet local duty obligation (i.e. the firm is, as a result, absolved from tax
assessment). Nations that hold distant duty credits to keep a strategic distance from
global twofold tax assessment, allow charge deferral. Specifically, benefits of distant
members which are reinvested in that organization are accepted until they are returned
to the guardian organization through profit installments.
86
To tap FDI, varied motivating forces are applied by host nation to charge more under
credit frameworks, than under exclusion frameworks. It becomes less attractive if
there are higher duty rates in the host nation because there is low rate of profitability.
Therefore, to get a plant in that nation (and the measure of investment in plant and
hardware), cost is likely to be lower. If the multinational does not have excessive
credit, a higher distant expense rate is repaid by a lower folks' duty responsibility in
the nation of origin. Later on, the high expense rate in the host nation would not have
any suggestions for FDI. The distant proprietors are protected from the host nation’s
higher charge rate by the credit framework, so that the neighboring proprietors would
prefer to offer their stakes to outside multinationals. Hines (1996) and others used the
qualification between exception and credit frameworks to appraise the expense rate
flexibility of FDI. Tanzi and Bovenberg (1990) are of the view that overabundance of
distant credit and access makes the refinement between expense credit frameworks
and charge exception frameworks.
Altshuler and Newlon (1993) are of the view that most US multinationals deal with
their salary repatriations so they do not confront duty of any nation of origin. Cheng
and Ma (2007), like Buckleyet al. conducted research for the period spanning through
2003 and 2006 and observed that GDP and social holding affect Chinese outward FDI.
Cheung and Qian's (2009) researched the Chinese outward FDIs in 31 host nations
during the period 1991-2005. They are of the view that common assets and a nation's
GDP are noteworthy elements for FDI and GDP per capita had cast the inverse impact.
Bano and Tabbada (2015) have indicated that in Pakistan overall overseas investment
showed a 133.3 percent annual increase from $1277 million to $2979 million in 2014,
while the FDI had increased to $750 million. US, Switzerland, Hong Kong, UAE and
UK were main contributors to the FDI and the main beneficiaries of FDI were the
87
sectors like financial services, power, oil & gas exploration, chemicals and
communications.
3.1 Tax Policy Incentives and Investment
Bovenberg et al (2000) expanded the model by taking into account the effectiveness
of wage and it partly done by Shapiro and Stiglitz (1984) and assessed the impact of
variations in social benefits and taxes in corporate sector of Estonia. Romer and
Romer (2007) observed that there are little yield costs of administered tax which has
been intended to diminish a spending plan shorter than the other tax increments.
Likewise, there can be a negative impact of expanded taxes on the ventures provoking
low benefits which compels the financial specialists to draw their speculations which
incite the bends in the business sector and results in poor GDP development.
Dunstan et al, (2007) are of the view that there are different impacts of tax changes.
Tax slices help to increase reserve funds and can contract the economy whereas the
organizational tax slices are expansionary. If a tax incentive diminishes the client
expense of capital, it results into increasing investment. Hasset and Hubbard (2002),
Hines (1999), Mooij and Ederveen(2003), Amjad and Kemal (1997) are of the view
that approaches intended under the Structural Adjustment Program are inclined to
build impoverishment due to aberrant taxes. Shapiro and Stiglitz (1984) analyzed
Ralph Review's presumption that the taxation consistency costs would be balanced by
unfavorable impact of tax changes on small businesses. The study conducted by
Smith Institute in May 2010 has proved that income is declined by increase in capital
gains tax (CGT) over an extremely unobtrusive level and the same is increased by
decline in CGT.
Poterba (1989) was of the view that the engaging quality of business visionary to
salaried workers was expanded due to reductions in capital additions tax. Saxton
88
(1997) revealed in the US Congress joint board of trustees study that decrease in CGT
would have positive effect on economic and work development. It is acknowledged in
the financial matters that experimental work on corporate taxation for creation and
speculation choices of international firms should rely on arrangement of tax segments
as opposed to legal corporate tax rates. In this stratum, an essential strip of the writing
suggests to levy forward looking (negligible and normal) tax rates being a suitable
measure of the corporate tax trouble (Devereux & Griffith, 2003). The enormous part
of work done in the past on corporate taxation and FDI makes use of legal corporate
tax rates or of reverse looking normal successful tax rates as enclosed in firm-level
monetary record information (Hines, 1997, 1999). The statutory corporate tax rates
overlook an influence of the tax base on FDI (e.g., through devaluation recompenses
or first year speculation motivating forces) whereas the normal successful tax rates
represent the forward-looking nature of a firm's investment choices (Devereux &
Griffith 2002). It has been revealed by certain studies that the level of host nation
development is responsible for difference in flexibilities in the middle of FDI and its
determinants, including corporate taxation (Mutti & Grubert, 2004; Azemar & Delios;
2008; Blonigen & Wang 2004). This theory has been propounded by splitting tests or
utilizing communication coefficients. Tax impulsions are broad in creating nations as
they constitute a corporate tax strategy (Keen & Mansour 2009). Accordingly, it is
captivating to look at the effect of particular tax impetus variables. Diverse tax
motivators bear distinguishing effects on the client expense of capital.
Mintz (1995) puts focus on the effects of tax occasions on the expense of capital and
also on fixing reliance on the duration of the investment, the development of the
incomes and the degree to which the contributed capital is deductible.
89
The small work has been done on the issue of investment conduct and tax strategy
instability (Jack & Viard, 1996). The tax approach is unverifiable. There is a
contention that speculation tax credits might arbitrarily switch on and off (Lucas,
1976). Auerbach and Hines (1988) researched on the issue by using discrete-time
model in which there is a probability every year that tax arrangement (a speculation
tax credit or deterioration remittances) will change. They acquired a well brought-up
arrangement by making straight approximations around unfaltering state estimations
of the capital stock and ended up at basic extrication which implied that the data in the
second fragment of the dispersion of tax strategies had wiped out.
Bizer and Judd (1989) invented a numerical general harmony display that
incorporated arbitrary taxation. In this shut economy model, venture parallels sparing
and the sparing takes after from utility amplification. Engen and Skinner (1999) speak
about the monetary development affected by taxes under five instruments: 1). Taxes
being corporate and individual wage can restrain investment rate. 2). Taxes by
twisting work relaxation decision for leisure can back off development in labor
supply. 3). Taxes through its discouraging impact on innovative workforce can
damage profitability. 4). In a Herzberger structure, flow of assets can be actuated by
taxes to other (lower taxed) parts having lower profitability. 5). The efficient
utilization of human capital can be twisted by high taxes on work supply by upsetting
specialists from occupations that convey high tax troubles despite the fact that they
have high social profitability.
Solow (1956) took the neoclassical development models and concluded that tax
arrangements do not affect the consistent state of development. Three principal
drivers of changes in tax structures are: 1). The ideal taxation writing is responsible
for making tax framework 'better', efficient and value are vital parts in ideal taxation
90
hypothesis. 2). Tax offers are changed by financial advancement and monetary
development affecting different tax bases and changing the tax offers. 3). Activities
and attempts of policy makers in a political economy in order to fulfill a political
target capacity. Sobel and Holcombe (1996) provided two examples for the salary
versatility examinations. Auerbach and Hines (1987) considered the significance of
powerful tax rates and were of the view that changes in taxes rates were crucial
determinants of venture conduct and firm valuation.
Alm (1988) maintained that vulnerability of tax base and tax rate was due to tax
instability as the undefined tax strategy could be balanced for an income augmenting
government. In circumstances where tax base danger expands to the extent of the
normal tax base, expected tax income increases despite no real increase in the tax rate
or the tax base. Auerbach and Hines (1988) gave a model of powerful tax rates with
time-subordinate statutory tax rates and venture tax credits and demonstrated
estimation of deteriorating remittances to examine the effect of expected tax changes.
The rebate element was utilized in spite of changing tax rates which influenced the
after-tax markdown component. Skinner (1988) conducted research on extra
abundance weight of uncertain and certain tax approach. He was of the view that if all
the vulnerability is uprooted about the approach of future taxes, it could motivate
welfare addition yearly @ 0.4% of national wage. Bizer and Judd (1989) employed a
general harmony approach but did not report results relating to proficiency expenses
of irregular tax arrangement.
Watson (1992) without presuming the appropriation of tax parameters, has examined
frugal and conjecture choices in a dynamic portfolio model and states that tax rate
vulnerability tends to lower risk taking. Alvarez et al. (1998) finds investment impacts
of expected tax changes with doubtful timing and is of the view that reducing of the
91
tax rate incites speedy investment and a normal reduction of tax base has the inverse
impact. Such investigations remain dubious that the open door expense of speculation
remains unaffected by taxation and the rebate rate is kept consistent. Pointon (1998)
focuses on attribution tax rates after carrying out Poisson process. Hassett and Metcalf
(1999) made use of a model with a yield cost after taking into account Brownian
movement and an indeterminate investment tax credit to work out the effects of tax
strategy instability on total speculation. They are of the view that tax arrangement
vulnerability is prone to put back venture under a constant irregular walk and builds
the capital stock under a Poisson hop process.
Bohm and Funke (2000) are of the view that there are little effects of tax strategy
vulnerability. Agliardi (2001) takes into consideration a bounce dissemination process
and works for venture impacts of questionable speculation tax credits and observes
that delays in investment is due to tax approach instability. Panteghini (2001a) uses a
Poisson process for the tax rate and works on unbiased tax frameworks under deviated
taxation with tax rate instability and reveals that the tax strategy instability keeps the
basic investment limit unaffected which implies that an impartial tax framework with
a random variable does exist. Devereux et al. (1994) by using a board of UK
organizations observe the impacts of limitations on inter temporal misfortune
counterbalancing. They observe that the results of tax law asymmetries do not
increase the discerning force of a model to clarify investment choices. Panteghini and
Scarpa (2003) observe that administrative danger can influence investment choices.
Pawlina and Kort (2005) are of the view that effect of an arrangement change depends
on speculation conduct under inadequate data. They use numerical techniques and
explore that arrangement changes can have a non-dreary impact on the basic
speculation edge. Majd and Myers (1987) and Donnelly and Young (2002) are of the
92
view that investment obstruction impacts tax misfortune discount administrations.
Cooper and Knittel (2006, 2010) explain that the punishment from fractional
misfortune discounts administrations which are due to a significant decrease in the
genuine estimation of tax misfortunes of US firms. The clear expectations in a full
misfortune balance situation were observed in the early studies. In those
circumstances, the corporate tax may either keep investment decisions unaltered or
urged investors into dangerous undertakings (Mint 1981).
Ahmad and Stern (1991) stated that central issues in the theory of taxation had been
equity, efficiency, and revenue. Newbery, David and Stern (1987) quoted both Adam
Smith and John Stuart Mill by saying that taxes should be imposed according to the
ability of the taxpayer to pay. According to Anyanfo (1996) the principles of taxation
mean the appropriate criteria to be applied in the development and evaluation of the
tax structure. Such principles are essentially an application of some concepts derived
from welfare economists. For smooth running of a society as per the norms of justice,
the tax system of a country should be based on sound principles like principle of
equity and fair play.
Economists have proved a direct correlation between tax policies, reforms and
investments. According to Azubike (2009) tax is the major player in every society of
the world. Ogobonna and Ebimobowei (2012) concluded in their study that tax
reforms are used to enhance revenue generating machinery of governments to manage
socially desirable expenditures which would eventually translate into real output on
per capita basis. Rabushka (1987) pointed out that economic growth and taxes had a
direct relationship. Alternatively, World Bank states that level of taxation is positively
correlated with economic development in developing countries. It has been found that
lower tax rates, both direct and indirect has significant role to boost higher economic
93
development. Bartrik (1994) stated that 10 percent lower tax rates will increase
employment, investments or new firms by 1 to 10 %. Michael Wasylenko (1997)
wrote about interest of policy makers in economic activity elasticity and tax rates.
MacDougall (1960) observed that economic condition of host countries could be
improved through improvement in the tax revenue generated from large capital stocks
and foreign investment profits. Kemp (1962) opined that countries could tweak the
tax rate on foreign investment to increase welfare from FDI rather than offering
subsidies to attract FDI. Streeten (1969) stated that foreign investment generated
revenue and helped in reducing saving and foreign exchange gaps. De Mooij and
Ederveen (2003; 2008) have calculated that the total FDI inflows can be increased by
3.3 percent by reducing 1 percent rate of tax on capital giving a mean value tax
elasticity of -3.3.
Caves (1971) observed that corporate tax collection on FDI has significant
relationship with welfare. It generates welfare in a country in a scenario where taxes
are relaxed for foreign investors or transfer pricing to home countries. FDI increases
general welfare through increase in tax revenues. The welfare decreases when a
country offers relaxation in the tax for foreign investment or if there has been a
transfer pricing from foreign firms to their mother countries. (Kopits (1976).
Markusen (1984) claimed that FDI’s impact on welfare has been quite significant.
External investment affects positively the people’s welfare due to expanding
competitive business and tax revenue while it can reduce the welfare if earned profits
are transferred overseas by the foreign investors. Raff and Srinivasan (1998) claimed
that governments forgo tax revenue to attract FDI which would ensure larger
employment, labor, better technology and better management. Bond and Samuelson
(1986) stated that tax holidays given to attract FDI results in loss of tax revenues to
94
the host countries in short run. Brander and Spencer (1987) stated that home countries
can attract FDI in case of lowering import tariffs and lower taxes on domestic
manufacturing. Since the early 80’s, foreign direct investment has grown at an
increased rate and markets have become more competitive.
Shah (2003), Alfaro (2006) discussed in detail the linkage between FDI and economic
development. Engen and Skinner (1996) concluded that changes in tax policy affect
economic growth. Gabriela1 & Mihai (2010) found the effect of the deduction of
taxes in the US on the long term increase in tax, in order to identify relationship
between tax reduction and economic growth. Finding is visible that with the decrease
in marginal tax rates with 0.5 percentage points, there might be some increase of
economic growth rate of approximately 0.2-0.3 percentage points. They considered
that the states having the possibility to mobilize incomes by means of efficiently
managed tax structures might reach higher growth rates in comparison to the states
where there is a frail tax collection system and structural design of tax system is
modest.
The analysis by Hakro and Ghumro(2011) finds that short term variables like
cumulative risk factors, trade openness and macroeconomic factors are important for
FDI. There is vice versa relationship between short term determinant variables and
those exhibiting long run dynamics. It is required from a country to maintain its
openness of policies, reform processes of the last 20 years besides controlling the
level of prices to maintain cost advantage, and by ensuring investment friendly
business environment with reduced costs of factors of production. This indicates the
sustainability and continuity of macroeconomic policies and improvement in
country’s risk profile. Causality determines the strength of relationships among the
95
variables and the consistency is exhibited by the results when compared with the
previous results.
The work done by Shah (2003) envisages the impact of fiscal provisions on the
investment environment, specifically in the case of environment for foreign investors
in Pakistan. The study’s results reveal the impact of the cost of capital on FDI
inflows. The work also explored the effect of tax concessions and the response of
investors. The paper suggests that tax incentives like tax holidays and depreciation
allowances attract FDI without having a direct drain on public resources whereas the
cost of capital has strong implications for investment firms and public institutions.
The Jorgenson’s (1963) model is used to compute per unit cost of capital and this
reflects strong considerations for its effectiveness for FDI inflows. It gives the real
price paid on per unit capital, therefore it is used preferably over discount rate and
long-term bond yields. The computed results prove the hypothesis to provide an
opportunity in preparing a policy that is a valuable consideration for the policy
makers and researchers.
Another study by Economist Intelligence Unit, (2012) is based on two themes. The
first, FDI into China was focused on the services sector, rather than on manufacturing.
Only in 2008 there was more investment in the tertiary than in the secondary sector.
On contrary to this, in 2004 the secondary sector’s share of FDI was 71% and for the
tertiary sector it was 23%. The second, FDI will continue to flow into the land where
there is cheaper labor and faster-growing markets. The coastal provinces will attract
FDI if there is developed infrastructure. That is why the investment was attracted to
China’s interior provinces where the cheap labor and markets were available. It
predicted that the urbanization rate in those provinces would leap from around 44% in
2010 to nearly 55% in 2020, drawing in large inflows of FDI. The fact of urbanization
96
and FDI inflow is evidenced by the municipality of Chongqing, in western China,
which was ranked 22nd of China’s 31 provinces in terms of overall FDI in 2007 and
in 2011 it attracted an estimated US$10.8bn inward investment, which is ever more
than that of Beijing. It may become shortly the fourth-largest FDI destination in
China, ahead of Shanghai and Tianjin. Within five years, one-half of FDI may go to
areas outside of the eastern seaboard, compared with less than 20% in 2000. Foreign
investors want to invest in sectors like retailing, logistics and financial services but
they face difficulties such as high taxes, land acquisition issues and new regulatory
barriers and restrictions. However, since 2007 China issued first revision in 2011 and
signaled its keenness to afford opportunities in areas like alternative energy,
biotechnology, information technology and high-end equipment manufacturing as part
of its Five-Year Plan (2011-16).
According to Gastanaga, Nugent and Bistrapashamova (1998), the policies of host
country bear an impact on the FDI inflows and they can be used to direct the inflows
to a particular location. The different types of variables e.g. corporate tax rates,
tariff rates, the degree of openness to international capital flows, exchange rate
distortions, contract enforcement, nationalization risk, bureaucratic delay and
corruption in 49 least developed countries(LDCs) were examined for the period
1970-95 through Pooled cross-section and time-series data. Also a multivariate
effect of different policies on FDI inflows with and without controls for other relevant
determinants was analyzed. Although there are methodological/co-linearity problems
in estimation, and constraints for availability of measures, the results from panel
methods are different from those obtained from cross-section analysis.
Mahmood and Chaudhary (2013) state that there is a significant relationship between
FDI and tax revenue. FDI has positive impact on GDP growth which in turn enhances
97
the individuals’ revenues and this ultimately has positive impact on tax revenues by
stimulating spending and more tax revenues. Zakaria (n.d)’s study reveals that FDI in
many countries is considered as a key source of capital, foreign advanced technology,
and managerial skills. Pakistan has realized this important aspect and taken many
steps to liberalize its inward investment regime and has been successful in attracting a
sizable amount of foreign investment. However, there are certain serious problems
with Pakistan in implementation of investment policies, although it has offered
significant deregulation and various incentives/concessions to foreign investors. The
foreign investors perceive that the pro-business policies and inducement used to
attract them are weak. Many of the investment approvals have been removed but
some administrative approvals are still required and many permits and clearances
from various government agencies at national, regional and local levels are also
required from investors which are cumbersome process. Policies are required to be
formulated for FDI for foreign exchange earning sectors.
According to Tariq (2015) FDI needs an enabling environment and safeguards to the
investors are the essential part of it. Although, there is a decent FDI policy in
Pakistan’s case but this policy is weaker regarding certain preconditions such as
sustainable and consistent policies, political stability, internal security and
macroeconomic stability. Cost of doing business is increased by issues like weak
governance, bureaucratic hurdles, corruption, security situation and the shattered
image of the country due to which investors lose trust. Pakistan’s tax laws do not
allow companies’ claim of accelerated depreciation or claim of deferred accelerated
depreciation. Moreover, general depreciation allowance usually is allowed at end of
tax holiday period. The companies located in developed locations are simultaneously
allowed 25 % accelerated depreciation and 10% normal depreciation allowances
98
annually. Import tariff is offered to firms in less developed areas. Usually such tax
and duty incentives affect capital and investment cost in different ways. The above
referred study also explores the impact of these measures by measuring the capital
cost in the firms working in developed and under developed areas. It helped to
explore the effectiveness of tax incentive like tax holidays and concessions like
depreciation allowance in impacting the capital formation and investment.
Khan (2007) states that congenial and sustainable environment for economic growth
is created by applying relevant knowledge and market-driven skills. South Asian
countries are lagging behind in socio-economic progress due to inadequate, irrelevant
and obsolete knowledge, skills and technology. Countries with skilled labor and
developed human resource attract large FDI inflows. There is dire need to develop
corporate knowledge and multiple skills sets to benefit from the FDI inflows through
investment in vocational training and industrial R&D. Blomstr and Kokko (2003)
state that investment incentives to foreign investors are not an efficient way of raising
national welfare. The financial subsidies to inward FDI and spillovers of foreign
technology and skills to local industry is not a result of foreign investment. The local
firms are benefited only if they can absorb foreign technologies and skills. It is also
necessary that the local firms should be supported for learning in designing efficient
incentive programs for attracting FDI. Rules of the game should be set in the same
way as GATT/WTO/EU has formulated the rules for international trade regime. Good
governance as a policy to attract FDI should be considered and incentives should be
offered to all foreign and local investors. These incentives should help in creating
linkages between foreign and local firms in the areas of education, training, and R&D.
If the local human capital and modern infrastructure are provided besides improving
99
other fundamentals for economic growth, more multinational companies likely to be
attracted to such country and the local private sector will also benefit from it.
Blonigen and Davies (2000) state that there is no negative impact of treaties on FDI
which the US contracted in the 1970s and 1980s. Theses treaties would have driven
out firms which were undertaking investment for tax reasons because the drop in FDI
occurred at the same time whenever a new treaty was signed; hence this hypothesis
seems more appropriate. Babatunde Shakirat, Adepeju (2012) stated that in Nigeria’s
oil and gas sector, the tax incentives, availability of natural resources and openness to
trade had a major impact on FDI but the same did not affect the market size, macro-
economic stability, infrastructural development and political risk. This supports a new
trend that attention should be focused for regulations to encourage FDI for needed
economic objectives to attract FDI and economic growth in Nigeria. This study
provides an insight into Nigeria’s determinants of FDI in oil and gas, which are tax
incentives followed by openness to trade and availability of natural resources.
3.2 Tax Incentives’ impact on FDI
Parys and Lemm (2011) conducted a cross country analysis, Empirical evidence on
the effects of tax incentives, working on a data set of tax incentives over 40 countries
for the period 1985–2004 in Latin American, Caribbean and African countries by
using spatial econometrics techniques for panel data. The study explored the
incentives used to answer tools of tax competitions and to discover how effective the
tax incentives had been in attracting investment. Tax holidays had some strategic
interaction in addition to the corporate income tax (CIT) but they found no evidence
for investment allowances and tax credits. It was found that in Latin American and
Caribbean countries, lower CIT rates and longer tax holidays were quite effective to
attract FDI but they showed not impact in African countries. It was also observed that
100
none of the tax incentives was effective in boosting gross private fixed capital
formation.
Abbas et. Al, (2012) analyzed in a study, A Partial Race to the Bottom: Corporate Tax
Developments in Emerging and Developing Economies, by gathering dataset on
corporate income tax regimes for 50 emerging and developing economies over the
period 1996-2007 and explored its impact on corporate tax revenues and domestic
and foreign investment. They found an evidence of race amongst countries of Africa
to lower tax rates to attract and increase investment. They also found that higher tax
rates affect domestic and foreign investment in long run, but at the same time raise
revenues in the short-run.
Demirhan and Masca (2008) found, in a study conducted by sampling cross-sectional
data on 38 developing countries and preparing a cross-sectional econometric, the
factors of setting foreign direct investment inflows in developing countries over the
period of 2000 -2004. They found positive impact of per capita growth rate,
telephone main lines labor cost and degree of openness on FDI inflow whereas it was
found that the inflation rate, risk and tax rate bore a negative effect on it.
Shah (2003) observed through his study: Fiscal Incentives, The cost of capital and
Foreign Direct Investment in Pakistan: A Neo-Classical approach, that FDI in
Pakistan is attracted depending upon cost of capital element which affects the rate of
return and the internal cash flow for investment of the investing firms. Cost of capital
is calculated by using Jorgenson’s Neo-classical Investment Model after considering
the taxation policy and the treatment of invested capital which showed a its consistent
impact on FDI inflows. It was also found that the fiscal incentives like the tax
holidays and depreciation allowances have quite significant impact on FDI without
having any drain on the public revenues.
101
Effiok et.al., (2013) conducted a study: Impact of Tax Policy and Incentives on
Foreign Direct Investment and Economic Growth: Evident from Export Processing
Zones (EPZs) in Nigeria, and analyzed relationship of tax rates with FDI by using
ordinary least square techniques. It was found that tax rates have a significant
relationship with FDI and economic growth. Ha and Zenjari(2012) studied a
relationship between investment decision and taxation through a study: Impacts of
Taxation on Investment Decisions: The Case of Morocco, and found that taxation has
a major impact on competitiveness and net profitability of investment.
Fahmi, (2012) observed in a study, the impact of tax holidays on foreign direct
investment in the case of Indonesia" for the period 1981-2010. Ordinary Least Square
regression technique was used by employing foreign direct investment inflow as
dependent variable with tax holiday being the independent variable and gross
domestic product growth, gross fixed capital formation, inflation, openness, tax rate
as controlled variables. It was observed that gross fixed capital formation, inflation,
openness and tax rate had a significant role in attracting the FDI but the tax holidays
cannot even mitigate the negative effect created by inadequate infrastructure, political
and economic instability, and poor policies. Stapper (2010) used Pearson Correlation
Coefficient, while conducting a study in Sub Saharan African countries; Botswana,
Zambia, Tanzania, Uganda, Mozambique, Kenya, Nigeria and Ghana for the period
1998-2010. He found that foreign investor’s investment decision was not affected by
high corporate tax rates. Parys and James (2010) conducted a joint study for 12 CFA
Franc Zone countries over the period 1994–2006 , the effectiveness of tax incentives
in attracting investment: panel data evidence from the CFA Franc zone, and analyzed
policy changes in tax incentives and other investment climate variables. On the basis
of the neo-classical investment theory prediction, they evaluated the extent of tax
102
incentives to attract investment in the said countries and found that offering tax
incentives by lowering the user cost of capital, does raise investment but there is no
significant relationship between tax holidays and investment in these countries.
However, if the number of legal guarantees for foreign investors is increased and the
complexity of the tax system is reduced, it surely would help attracting foreign direct
investment. Mosioma (2009) worked on research paper, Tax Competition: The role of
Tax incentives in encouraging harmful tax competition in the East African Flower
industry and found that sustainable jobs cannot be acquired by tax incentives used to
attract or retain mobile capital nor help in gaining any tangible economic
development. The multinationals are the beneficiaries of these policies overshadow
the other companies and an unhealthy competition starts among states. An imbalance
is created between domestic enterprises and MNCs in which, later gets the leverage
and advantage. Tjn (2012) observed that Kenyan government offered many tax
incentives to draw FDI into the country but these incentives resulted into very large
revenue losses. It was estimated that Kenya has been losing over KShs 100 billion
(US$ 1.1 billion) per annum due to these tax schemes and exemptions. Only the trade
related tax incentives out of this total ushered in revenue loss worth KShs 12 billion
(US$ 133 million) in 2007-08 which were estimated to as high as US$ 566.9 million
in coming years. The country lost its treasured revenue to be spent on poverty
alleviation and for enhancing the general welfare of the population. The period of
2010-11 observed more than double spending by the government in providing tax
incentives (using the figure of KShs. 100 billion) which was more than the amount
spent on health. This is a serious situation when 46% of Kenya’s 40 million people
live in poverty (less than US$ 1.25 a day). Together, Kenya, Uganda, Tanzania, and
Rwanda are losing up to USD 2.8 billion a year due to tax incentives and exemptions.
103
Action Aid (2014) in the study, Investment incentives in Ghana: The Cost of Social
Development, discovered that tax incentives are given to attract Foreign Direct
Investment and to increase export earnings in the country. It revealed that lower tax
rates increased Ghana's competitiveness in the region but at the same time weakened
the synchronization of trade and investment regimes across the sub-region through
initiatives such as the ECOWAS Common External Tariffs (CET). It estimated that
an amount of US$1.2 billion i.e. half of government’s education budget, is lost due to
tax incentives in Ghana. Parliamentary approval is required to grant tax incentives but
sometimes it is by-passed, which results in excessive and unregulated granting of tax
incentives. Tjn (2012) revealed that Tanzanian government offered a long list of tax
incentives to attract FDI. These incentives afforded opportunity to the companies in
mining sector to escape taxation resulting into huge revenue losses amounting to
Tanzanian Shilling of 1.7trn/- during the 2013/14 fiscal year due to tax breaks (The
Guardian, 2014).
Blomstrom and Kokko (2003) in the work, Economics of Incentives, observed that
national welfare is not raised by offering investment incentives to foreign firms. The
benefits can only be realized if the local firms are capable to absorb the foreign
technologies and skills. The joint study conducted by Tobin and Walsh (2013), What
Makes a Country a Tax Haven, observed Why Ireland Is Not a Tax Haven? The
answer revealed by the study is that Ireland’s low corporation tax rate cannot alone
make it a tax haven. Policymakers also consider other important factors such as
transparency, exchange of information and economic substance. Further, Ireland does
not meet OECD criteria for being a tax haven. This is because of its 12.5 per cent
corporate tax rate and the open nature of the Irish economy that sometimes Ireland has
been wrongly considered as a tax haven. Haiyambo (2013) in a study, Tax Incentives
104
and Foreign Direct Investment: The Namibian Experience pointed a question,
whether or not foreign direct investment inflows have come to Namibia because of
the tax incentives offered to foreign investors; and thus whether or not offering such
incentives has been beneficial to the country? It evaluated the benefits and costs
through indicators and inferences from FDI inflows in Namibia. The primary and
secondary source data by surveying of foreign investors and reviewing literature
respectively was administered which transpired that it was the abundance of natural
resources in Namibia which attracted FDI. Tax incentives and factors such as
investors’ trust in the country’s economy, the functioning of government and
availability of good infrastructure and the prevailing investment environment of a
country played a complimentary role but they did play an important role while
selecting a location for investors’ investment.
Massoud (2005) studied the assessment of FDI incentives and the open door policy in
1974 by Egypt and observed that it had no major impact on FDI inflows in Egypt
rather it put budgetary burdens on the Egyptian tax-payers. The study gave a
quantitative estimate of the incentives offered to foreign investors by Egypt in Law
8/1997, the incremental increase in FDI inflows to Egypt and the cost borne in budget
because of these incentives. The study suggested that rather than attracting FDI, Egypt
should have focused on deriving macroeconomic benefits. Dharmapala and Hines
(2009) made an analysis of the factors influencing countries to become tax havens.
About 15% of countries are tax havens, the study found, and these were mostly small
and affluent countries. Governance quality was significantly good. The study also
envisaged that a smaller country having population within the range of one million,
have 26% to 61% chances of becoming a tax haven. Low tax rates induce foreign
investment more in well-governed countries than otherwise. The study concluded that
105
poorly-governed countries seldom become tax havens, and that a rational tax policy is
jeopardized by the poor governance.
Simret (2013) conducted a study by using panel data econometric model and
evaluated the inflow of FDI in Ethiopia due to tax incentives offered. It analyzed the
differential impacts of tax incentives on different sectors. To indicate the presence and
absence of tax incentives, tax holidays and customs duty exemptions were used as
dummy variables. During the analysis for the period 1992-2012, a Panel data on 10
sectors and an econometric model including tax holiday, custom duty exemption and
control variables such as market size, political stability and trade openness were used.
The results showed that amongst tax incentives, tax holiday was found to have
significant impact on FDI while custom duty exemption had insignificant effect
whereas out of the control variables, openness of the economy was significant.
3.3 Tax Incentives
Shams Uddin (1994) used a single equation econometric model to study the
contributing factor of private foreign direct investment. He used this model to study
36 less developed countries for the year 1983. His study found that the size of the
economy (measured according to per capita GDP) has been the most important factor
in attracting FDI. Besides per capita GDP, cost of inputs, overall investment climate
of a country, public aid, economic instability and price unpredictability also influence
FDI. Large size of economy and greater inflow of public aid attracts FDI while
increased cost of inputs, insecure investment climate results in restricting FDI
inflows.
Majeed and Ahmad (2009) studied factors contributing towards FDI in developing
106
endogeneity in the model. It was found that GDP, per capita GDP, remittance inflows
and growth of economy have positive effects on FDI while military expenditure,
inflation, real exchange rate and balance of payments’ deficit have adverse effects on
FDI. These results are consistent with the policies of MNCs which usually invest in
the countries which are following liberal trade policies.
De Mello (1997) through his survey article reviewed the significantly relevant
developments focusing on factors of FDI and the impact of inward FDI on growth in
developing countries. It was observed that policy regime is more imperative than
individual factors in attracting FDI. They established that recent literature on this
topic provided tools and yardsticks for policy evaluation and cross-country
comparisons. Foreign investors are usually motivated by goals of profit maximization.
The most important policy tools in attracting FDI have been foreign acquisitions in
countries through privatization, globalized production and increased economic and
financial integration.
Asiedu (2002) studied Sub-Saharan African (SSA) countries to analyze why these
economies failed to attract FDI despite policy reforms. Policy changes, infrastructure
developments and higher return on investment cast a positive impact on FDI in non-
SSA countries, while same factors become insignificant in SSA countries. However,
trade liberalization casts positive impact on FDI in SSA and non-SSA countries but
the extent of impact still varied and differed. This study was based on OLS estimation
which faces the problem of endogeneity.
Kok and Ersoy (2009) studied the factors contributing towards attracting FDI for 24
developing countries. The study used OLS technique for analysis of data for the
period from 1938 to 2005 and cross-sectional unrelated regression (SUR) econometric
technique analysis of data for the period from 1976 to 2005. The study concluded that
107
debt –to-GDP ratio and inflation affect FDI negatively while per capita GDP and
capital formation affect FDI positively.
Onyeiwu and Shrestha (2004) employed fixed and random effects models for analysis
of data of 29 African Countries for the period 1975 to 1999 to study the factors
responsible for attracting FDI. This study concluded that economic growth,
liberalization, inflation and natural recourses have significant impact on attracting
FDI.
Demirhanand Masca (2008) used econometric model for analyzing data for the period
from 2000 to 2004 to study the factors responsible for attracting FDI in 38 developing
countries. This study concluded that economic growth, liberalization, physical
infrastructure cast positive impact in boosting FDI, whereas inflation positively
affects inflow of FDI while tax rates have negative impact on attracting FDI.
Ahmad and Malik (2009) have studied the factors responsible for economic growth,
attracting FDI and domestic investment. The study is based on panel data of 35
developing countries for the period spanning over 1970 to 2003. The research
indicated that economic growth is not much affected by FDI. FDI has little impact on
economic growth but it is positively affected by domestic investment which casts a
positive impact on FDI. Domestic investment is considered as an indication of
profitable opportunities in the economy and populations’ willingness in making
investment. The domestic investment creates industries which complement long-term
FDI e.g., vendors’ industries for automobile industries. The study specifies the
following determinants of FDI:
i. income
ii. Internal investment,
iii. Trade openness,
108
iv. Rate of currency exchange
v. Literacy levels
GDP tends to have insignificant impact while openness casts a positive influence on
FDI. The study concludes that small but open economy attracts more FDI as
compared to large but closed economy. The study found significantly negative
coefficient for real exchange rate which means that depreciation of currency attracts
FDI.
Khan (1996) analyzed the dynamics of FDI in developing countries and examined the
effects of FDI on economic growth. This study also explored other variables such as
population rate, human development, trade liberalization, per capita growth and
macroeconomic instability etc. This study used data of 95 developing countries for 20
years (1970–90). The study brought about the following findings/conclusions:
i. Private sector investment has much larger impact on growth as compared
to public sector. This phenomenon was quite significant during the 1980s.
This conclusion even holds true in varying situations where other factors
are accounted for as well or where alternative techniques for analysis have
been used.
ii. Effect of public and private investment on growth has significant regional
variations. This difference is quite significant for Latin America and Asia,
whereas it is very insignificant in case of Africa and the Middle East.
iii. Effect of private investment and public investment is significantly
different for different income groups.
iv. The relative shares of public and private investment not only alter the
steady-state growth pattern which affects the pace of growth in per capita
109
incomes of developing countries. Speed of convergence increases with
higher share of private investment in total investment.
v. Studies of economic growth and FDI need to make distinction between
roles of public and private investment due to strong empirical evidence
supporting the suggestion that public investment is not as important as the
private investment.
This research conforms to the modern paradigm that private sector is very critical for
sustained economic growth. Public investment should only be focused in the areas
where it is complementary to the private sector.
Khan (1996) has analyzed how capital inflow and development of financial sector has
affected the overall economic situation in the country and what could be the future
prospects in respect of Pakistan. Pakistan has always witnessed private capital inflows
in terms of workers’ remittances, private short-term and medium-term capital inflows.
During the 1990s, private capital inflows considerably increased peaking in 1994-95
at $ 4.5 billion. This resulted in a surplus in overall balance of payments in 1993-94
and 1994-95. The “inflow phenomenon” reached Pakistan much later than many
developing countries in Latin America and Asia but it is expected to remain steady
due to policy reforms undertaken in the country. The case of developing countries
shows that initially inflows result in capital formation and easing the external
financial constraints. As the size of capital inflow increases further, it leads to
macroeconomic instability through widening of the external current account deficit,
higher consumption, weak monetary control, inflation, exchange rate appreciation and
reversal of inflows etc.
Population growth and need of development lead to increased need of inflows.
Governments also require inflows to decrease fiscal deficits. However, it
110
simultaneously leads to inflationary pressures and crowding out of private sector
activity. In Pakistan, fiscal deficit was 5.5 % of GDP in 1994-95 which showed rigid
expenditure behavior and slow revenue growth. Government focused more on
privatization to broaden its financial resource base.
Ahmed and Ahsan (1997) have studied 35 cases to see how concessions through
allowing capital depreciation and providing tax holidays influence the NPV of a
business enterprise. Out of 35, 24 cases show that depreciation allowances are more
effective than tax holidays in increasing NPV of a particular project. Out of 24 cases,
the results of 11 were on the contrary. Depreciation allowances are more important
for capital intensive sectors while tax holidays are more important for labor intensive
sectors. These results were similar even in case of underdeveloped areas.
In the study, no conclusive basis could be established for 12 cases that changes in tax
concessions result in higher net present value. NPP of a particular project is impacted
by the positive or negative leverage of cost of doing business in a less developed area.
The study concludes that projects have higher NPP for developed area. This reveals
that the cost leverage overweigh the other advantages due to which projects cannot be
diverted from the developed areas to the less developed areas unless tax incentives are
provided to compensate.
The study also finds that the NPP of projects in developed areas has to be compared
with the NPP of projects in underdeveloped areas by including the effects of tax
incentives, tax holidays and depreciation allowances. The study found out that in
Gadoon Amazai industrial zone in Pakistan, tax holidays failed to generate any new
investment. The study analyzed 35 units showing that 11 (32%) were diverted units
while 24 were poor investment decisions. In absence of tax holidays, this 32 %
111
investment would have been located elsewhere. It also revealed that this constituted
tax expenditure of Rs. 46.5 million on tax holidays.
The study also found that import duty concessions, coupled with tax holiday,
increased the number of diverted units from 11 to 15. It concluded that only
depreciation allowance provided to only 6 units in developed areas appeared more
incentivized to the business enterprises than the whole incentive package in the less
developed areas. The study showed that tax holidays fail in attracting investment at
micro level. The study found out that the incentives were only able to divert
investment from one set of areas to another instead of generating more investment,.
The results of the study provide policy guideline for government to enhance
investment level in the less developed areas through providing more appropriate tax
incentives in such areas for boosting economic development.
Ahmed (2003) calculated the cost of capital under different circumstances such as:-
i. without considering any fiscal concession,
ii. when only a tax holiday is offered,
iii. when both tax holidays and depreciation allowances are offered in
backward areas,
iv. when depreciation allowances (accelerated and normal) are allowed in the
non-tax holiday region,
v. when depreciation allowances can be deferred in tax holiday areas
(hypothetical)
He analyzes that without any concessions, capital is dependent on the capital goods’
prices, tax rates, banking markup rates and other incentives and concessions. Greater
the tax reduction or longer the tax holiday, the lower is the cost of capital.
Depreciation allowance also decreases capital cost and the extent depends on interest
112
rate. Lower the interest rate, higher is the depreciation rate and lower is the cost of
capital. This study also concludes that cost of capital is lowest where depreciation
allowances are provided to be deferred in tax holidays regions.
Pasha and Ismail (1988) analyzed why the fiscal incentive packages failed in
motivating industrialization in backward areas. The study concluded by deriving
policy implications on the basis of variable factors such as location, size and design of
industrial estates with a view to creating conducive environment for investment.
Mintz (1990) has evaluated concessions in terms of timing of depreciation
allowances. He also concluded that tax holidays deprive accelerated depreciation for
long lived assets; therefore, it ends up penalizing investments. This study also
concluded that if depreciation can be deferred, the concession package becomes more
attractive.
Azhar and Sharif (1974) carried out a study with a sample size of 40 firms out of total
of 561 receiving the tax exemption. After taking in to account the imperfections in the
data, it was observed that the effect of the tax holiday in stimulating overall
investment and influencing the location of industry in interior areas was minimal. Tax
holidays have an appreciable effect on industrial dispersion and it has to be
incorporated within the framework of a regional development plan. There are many
elements that enter into the investor’s decisions to invest. Therefore, emphasis ought
not to be given to fiscal devices in isolation but a host of other important economic
and non-economic factors have also to be considered. Some of these are roads, power,
water, drainage, banking, social, political and administrative considerations. There is
little point in granting a tax holiday in areas without such infrastructural and other
amenities. The tax holiday should, therefore, go hand in hand with a regional
development plan that caters for such amenities.
113
Akkina and Celebi (2002) analyzed the concessions in Turkey during 1970 to 1996
using reformulated neoclassical investment model and a reformulated flexible
accelerator investment model. The focus of the study was to study the factors
impacting private fixed investment during the times of financial repression and
financial liberalization. The study concluded that public investment substitutes private
sector investments with varying volumes. The study remained inconclusive on the so-
called McKinnon-Shaw hypothesis of insignificantly negative impact of medium term
interest rate on private fixed investment. It also concluded that the financial and
liberalization programs did not have any positive impact on investment.
Edwards (1993) surveyed how the trade liberalization affects the economy of the
developing countries. It was found that effective protection mechanism coming forth
during 1960s helped to align accordingly the trade policies globally over a long run.
Bond and Guisinger (1985) built up a model to study the incentives offered by Ireland
to its investors at the time of joining EEC. This study showed that the user cost of
capital, the effective rate of protection and the ratio of the financial to the economic
rate of return are inter-related.
Baldwin (1992) studied trade, capital and growth and found that capital formation,
both at domestic and international level significantly affects the outcome of
liberalization of trade. Papageorgiou et al. (1990) analyzed liberalizing countries’
macroeconomic policies and found that trade reforms have been reversed due to
wrong use of fiscal and monetary policies. Expansionary fiscal and monetary policies
result in worsening of balance of payments and put inflationary pressures on the
economy, whereas the requirement was the application of restrictive monetary and
fiscal policy.
114
Guisinger (1997) observed that it was required to relax quantitative restrictions before
reducing tariffs. The study found that failure to relax these quantitative restrictions
resulted in failure of liberalization policies in 90 % cases, and vice versa, there is 90
% success in cases where such quantitative restrictions have been relaxed. The study
confirmed the results of Papageorgiou et al. (1990) that “expansionary fiscal and
monetary policies are the single most important cause of a reversal of trade reforms”.
Research also explored the effect of fiscal policy on reforms in trade regime and
concluded that expansionary fiscal policy creates hurdles in wake of trade reforms. It
also found that it is necessary to have trade liberalization before capital market
liberalization due to the following three reasons:-
a. The instability generated by capital market reforms can result in delays in
reforms in trade regimes
b. Capital might move to the less efficient sections of industry, in case
reforms are introduced in capital markets.
c. If capital reforms are implemented first, then reforms in trade regime may
be jeopardized. In case capital reforms are not carried out first, a major
inflow of foreign capital will occur in the situation and this influx will
result in appreciation of exchange rate leading to decreased exports and
increased imports.
Shabbir and Naveed (2010) have studied trade openness with regard to outward-
oriented policies in developing countries. The exports play essential part in promotion
of growth and international trade. They analyzed the relationship among FDI, GDP
and exports. The findings suggested that this relationship exists between growth and
exports but doesn’t exist in case of FDI. It was found out that FDI is not an important
factor for growth over a long period of time. They also analyzed that there exists

115
causality in the above variables during the short term. The findings are that growth is
not affected by FDI and exports but rather it is the vice versa. Moreover, exports and
FDI do not also affect each other significantly in the long run.
James R. Hines, JR. (1996) has undertaken a comparative study regarding the
dynamics of tax credits and tax rates. It has been found that if investors cannot set off
foreign tax credits with local tax liabilities, the incentive of foreign investors is
minimized which they prefer to utilize to avoid high-tax in other countries. One
percent variation of corporate tax rate creates a variation range of 9-11 percent
between the investors using foreign tax credit and other investment as whole. This
suggests that corporate taxes significantly affect the FDI in the US.
Hartman (1984) in his study analyzed FDI in context of domestic tax policy in USA.
The study analyzed impact of tax policy changes on FDI. It was found that foreign
investment is affected by changes in tax policy. The results of this study were quite
different from previous studies and found that saving incentives domestically cause
reduction in foreign investment. Such a decline in foreign investment results in
economic loss. The reduction in personal and corporate tax rates are great catalyst and
incentives for savings. Corporate tax rate incentive has been offered in the US through
accelerated depreciation allowances.
Morisset and Pirnia (2000) reviewed the literature on this topic and found that fiscal
incentives have been a major tool for the governments to attract foreign investment
through multinational companies in the 1990s. Third world countries usually employ
tax holidays and tariff concessions while the first world countries employ investment
and depreciation allowances. The former set of incentives are beneficial in the sense
that neither they create a distortion in the investment climate of the country nor incur
any externalities. They found that it was very important that tax holidays or tariff
116
concessions are offered to attract investment in infrastructure development, human
and physical resource improvement. However, when these conditions (infrastructure,
economic environment, transport etc.) are same, then tax policies play an important
role in investment decisions. The study also found that tax incentives have also
resulted in externalities in shape of illicit behavior by tax machinery as well as
investors.
Root and Ahmed (1978) used data from 41 developing countries for the period from
1966 to 1970 to study the factors that impact FDI in these countries. They used an
econometric model for their study and divided the countries into three categories i.e.
unattractive for investment, moderately attractive for investment and highly attractive
for investment. These categories were classified in the light of the annual per capita
inflow of FDI into these countries. The econometric model had forty-four (44)
variables as the factors that contribute towards inflow of FDI into these countries. Out
of these 44 variables, 3 variables were related to taxation i.e. corporate tax rate, tax
laws and progressiveness of tax system. The study found that corporate tax rates are
significant determinants of FDI while the other two were found to be insignificant
determinants of FDI.
Forsyth (1972) undertook a study to find support to the idea as to whether tax
incentives influence decisions of foreign investment or not? He found that investment
decisions are not based on incentives but once such a decision to invest has been
made, then the incentives play a role in deciding the quantum and timing of
investment. Rolfe et al. (1993) surveyed the managers of firms in US with a view to
explore that factor which affect the decisions of investments. They found that it is
very important for startups to reduce the initial costs of production and tax incentives
are not a major factor for startups. For existing firms, tax incentives become important
117
as they result in increased profit for these firms. Similarly, depreciation allowance
becomes major factor for industries having more fixed assets.
Coyne (1994) undertook a study in which it was found that small investors respond
more to tax incentives than large investors because cost of doing business is more
critical for small businesses as compared to large ones. Large businesses have the
capacity to avoid taxation, so tax incentives really do not find much significance in
decision making. The study also found that large multinational companies always get
special treatment, no matter what is the prevalent tax law.
Mintz (1990) has concluded that tax holidays for underdeveloped areas in presence of
accelerated depreciation allowances instead of increasing capital formation ends up in
restricting capital formation. His concludes that in systems where accelerated
depreciation allowances can be claimed but not deferred, the long life of assets end up
penalizing investment due to tax holidays during which no depreciation allowance can
be claimed. If, in the same system, depreciation allowance can be deferred and could
be reclaimed after the duration of period of tax holidays, it can act as a major
incentive for investment.
Bond and Samuelson (1986) have found that governments easily introduce tax
incentives with a single aim to lure foreign investments. This approach, though
discriminatory by targeting specific investments, reduces the tax expenditure in shape
of foregone revenues. Such a targeted approach is useful in bringing in FDI only in
the sectors where it is required or where the priority of the government is directed to.
Slemrod (1998) explored the pattern of Japanese investments and found that Japanese
invest more in the countries where Japan has agreement Hines (1996) made a
comparison between the FDI of investors who have to pay taxes at home and those
claiming foreign tax credits paid to overseas governments. It was found that more
118
investment is made by the investors who avoid payment of home country taxes.
Hartman (1982) studied how domestic tax policy affects FDI in USA. This study
found that foreign investment increases in presence of tax incentives equally
applicable on domestic and foreign investors. Domestic saving incentives do not
directly impact FDI but indirectly result in decrease in FDI.
Slemrod (1990) analyzed the impact of US and investing country’s tax system on FDI
in US. This study employed standard empirical model to find the link between FDI
and taxation. This model gave results that tax rates in US have a negative relationship
with FDI. The study also suggests an alternative explanation to the FDI in US. This
alternative explanation is that lower FDI inflows in US are due to stagnation in the
foreign countries. The study also used a second approach using time series data of
FDI in US against seven major investing countries. The results of this approach also
corroborate the results of the first approach.
Hartman (1984) was amongst the first economists to undertake empirical study on
impact of taxes in USA on FDI. He collected the data from 1965 to 1979 to find out
relationship of FDI with:-
i. Return rate by foreign investors.
ii. overall return rate on capital
iii. Taxes rates on US capital captured by foreign investors in relation to tax rate
on US investors having ownership of the capital
Two variables acted as a proxy for return on FDI of businesses considering expansion
and return on FDI to existing assets, respectively. He found out the significant impact
of taxes on FDI as well as that of return rate.
Boskin and Gale (1987) undertook a study to estimate the elasticity’s of FDI in
relation to rates of return. They found that the elasticity’s are quite low. They used
119
different set of data and studied different set of variables as determinants of FDI.
Their study found that the results drastically changed from period to period and also
changed with the model specifications.
Mooij and Edervee (2001) undertook a study of empirical literature on the topic of
company taxation and FDI. They studied the results of 25 studies and compared the
tax rate elasticity. They found that the mean value of tax elasticity in the literature
under study is around -3.3, i.e. this means that with 1% decrease in the host country’s
tax rate results in 3.3.% increase in FDI in that country. The variation across countries
and studies has been explained by them as the underlying characteristics of data e.g.
studies using effective tax rates yield large elasticity’s than studies using statutory tax
rates. It concluded with the finding that tax rates have negative relationship with FDI.
Scholes and Wolfson (1990) found that higher taxes on capital in investing country
leads to increase of FDI in that country due to the tax credits that act as a shield for
the investors against high taxes. They also found that tax credits increase in the areas
where the higher tax rates is a major attraction for FDI. The study found that when US
tax rates increased, the FDI in US under worldwide systems increased. This idea is
against the usual notion that tax decreases FDI. The increase in FDI is due to tax
credits which will save the FDI from higher taxes while the domestic businesses will
have to bear the full burden of taxes. Swenson (1994) explored the tax determinants
of FDI for period 1979-1991 in US. U.S. taxes influence investment in capital assets.
Swenson found that in US, the FDI in industries was affected where after tax cost of
capital became higher.
Grubert and Mutti (2000) used micro level data of over 500 US tax returns and 60
locations of US multinationals to aggregate a data-set of effective tax rates and
investment on plant and equipment. They used variety of specifications of average tax
120
rate and found significantly negative elasticity’s. Altshuler et al. (2001) also used the
data of Grubert and Mutti under similar specifications. He found that capital became
more responsive to taxes in the decade of 1980s.
Devereux and Freeman (1995) built a model on the data of FDI inflow regarding 7
countries for the period of 1984 to 1989. They analyzed the effect of taxes on FDI
inflows. They found that the taxes do not significantly affect decision variation of
domestic investment in comparison to outward FDI. However, they found that taxes
do influence the size and location of FDI.
David W. Loree and Stephen E. Guisinger (1995) analyzed the effect of tax policy on
investment. They found that tax policies bring in changes in FDI behavior within 2 to
3 years of the change in tax policy. They also found that increasing incentives is not
usually a very easy path to attract FDI. Incentives offered by one country may lead
other similarly placed countries to offer same incentives and create a situation of
prisoner's dilemma trap. In such a situation, incentives are increased in all the
countries but the share of investment for all countries remains the same. They also
found that infrastructure plays a significant role in attracting FDI.
Quan Li (2006) has analyzed the tax incentives to foreign investors by using cross-
sectional data of 52 developing countries. He found that the political system of the
country also affects FDI. He found that better governed countries offer low tax
incentives. In democratic countries, FDI inflows are negatively impacted by tax
incentives. The study found that tax incentives result in distorting the market in
market economies.
Desai, James and Hines (2004) found that tax incentives (other than income tax) have
a significant impact on returns of MNCs. Such a high degree of positive relationship
exists between taxes on earnings and taxes on income which has revealed that income
121
taxes obscure the role of non- income taxes. It also gains strength from the fact that
US investors can avail income tax credits from overseas whereas these credits are
denied in case of indirect taxes paid to foreign governments.
Benassy, Fontagne and Lahreche (2005) used a panel of mutual FDI inflows in case
of 11 OECD countries for differentials during the period of 1984–2000. It was found
that agglomeration-related factors exert stronger influence as determinants of FDI
whereas taxes are important for investment location decisions.
Slemrod (1990) had inferred results that showed mixed trends. It revealed that a small
tax response in case of retained earnings FDI or a negative reaction has been observed
in the case of this FDI. This research has created doubts on the Hartman model but
still there has to be some more research and study to estimate it again with more
reliable data, larger sample size and better analysis approaches and techniques in
order to negate the findings of the Hartman model.
3.4 Tax and Tariff
Reister et al. (2008) suggested that as it is vital for approach investigation that the
measures of potential changes should be recreated at some point of interest, the
philosophy of modifying benefits determined under the corporate salary charge law is
worthwhile for expense purposes. This makes the duty procurements unequivocal by
characterizing the corporate pay charge base. New mechanism has customarily been
installed in the assessment arrangement of numerous states. By conceding plentiful
duty credits or repaying earlier paid charges for endured misfortunes, the state applies
a protection capacity policy. Pay tax assessment can work along these lines as a
programmed stabilizer (Devereux & Fuest 2009; Buettner &Fuest 2010). The duty
approach entails both positive and negative impact on the GDP in varying scenarios.
122
Inam and Khan (2008) correspondingly explored the dynamic ideas that identify with
the capacity to produce satisfactory and unsurprising assets, in accordance with
developing use of prerequisites. As raising income is essential, expenses ought not to
impact the conduct of the individuals who pay them unduly. In picking charges, a
typical objective is to minimize the obstruction of assessments in the monetary
choices of people and firms. Another goal is to appropriate the weight of tax
collection in a way that meets with general publics’ idea of reasonableness. Such
"value" is ordinarily characterized as "capacity to pay", which denotes that individuals
with more capacity to pay ought to pay more prominent duties, and those with
equivalent capacity ought to pay measure up to charges. At long last, citizens ought to
show consistency with the expense framework. This implies the assessment
framework ought to make it simple to follow charge laws and should be easy to
regulate. When capital is versatile, the affectability of cash-flow to the taxation rate
drives nations to undermine one another's expense rate to draw in capital (Wilson
1999; Zodrow & Mieszkowski 1986).
Devereux et al (2008) observed that the global assessment rivalry estimation has been
tried on key duty response capacities, which revealed that a cost in one area relies on
the normal cost the areas of other competitive local investors. Altshuler & Good
Speed (2002) report that there is sufficient correlation between corporate tax rates of a
country and the investments. Charge segment/structure changes has due focus on the
relationship between expense structure and the monetary structure as identified with
the level of financial advancement (Abizadeh, 1979)
Dunstan et al (2007) contented that cost variations can have different effects of tax
reductions on investment funds which would be slightly contractionary in nature
whereas the company tax reductions will show expansionary tendency. Amjad and
123
Kemal (1997) state that the arrangements pursued under the Structural Adjustment
Program have tended to expand the destitution levels predominantly due to aberrant
assessments.
Ahmad and Stern (1991) state that in the hypothesis of tax collection, main issues are
identified as value, productivity and income. Barro's et al. (1979) regarding tax-
smoothing speculation says that if the peripheral expense of raising tax income is
expanding, the ideal tax rate is a martingale, which is fairly shocking as this has great
significance and recurrence of late tax changes which have prompted an adjustment in
the tax blend in created nations. In the meantime, with greater enthusiasm for
development hypothesis and monetary arrangements for financial development,
several analysts have focused their consideration on the effect of tax strategy changes
on monetary development (Volkerink & Haan, 1999).
Mason (1990) made an emphasis on the benefits of nonlinear components in the tax
framework. Eeckhoudt et al (1997) gives an estimate of assumed hindering
perspectives. There is a difference amongst countries for treatment of tax misfortunes.
The fiscal misfortunes are transferred to the following fiscal years with only an
exception of a couple of nations. Domar and Musgrave (1944) are of the view that
misfortune balances procurement in a broad manner. Barlev and Levy (1975)
discussed the forward and backward transfer of procurement. They are of the view
that the failure of transfer of a misfortune forward basically depends on the span of
the misfortune suffered.
Bekaert and Harvey (2000) discussed that FDI inflow was critical in advancing
monetary development as result of two reasons: i) direct investment empowers to
deliver positive externalities for association as far as dispersing progressed innovative
and administrative practices into the nation accepting outside investment, and ii) that
124
the foreign direct investment is more resistant to outside worldwide changes than
different sorts of inflows into the nation. Mishkin (2009) specified that outside direct
investment prompts mechanical progression in the host nation and also prompts
administrative headway which helps to make the structures of the host nation strong
and robust.
Krueger (1978) examined center east nations and found that the development in the
invented tariffs in a nation lead to the advancement which further prompts an
expansion in the absorptive limit for further investment. Consequently an expansion
in the exchange would prompt change in the economy if the absorptive limit of the
nation is sufficiently capable to do so over the long term.
Haufler and Wooton (1998) analyzed as to what broke down the tax structures of two
creating nations of various sizes and found that outside direct investment was more
dragged towards the bigger nations, though the tax structures in the bigger nation
were relatively higher. The purpose behind such attraction was the self-rule of costs
to be charged by the financial specialist. Fundamentally, less estimated nations
offering smaller levy rates, were essentially like paying s remuneration for their
unstable and ugly markets (Raff & Srinivasan, 1997).
Hines (2005) proposed that smaller and open economies should completely move the
taxation of wage earned on outside investment to best incentivize the stream of
investment into the nation. The study concluded that a nation can reap more
significant economic benefits through expanded foreign investment than what it can
acquire through taxing the speculators’ wage. Desai et al. (2004) noticed that
multinational associations really change their challenging obligations through the
mechanism of corporate tax rates. It supports the notion that the conduct of the
multinational associations is clearly dictated by tax rates being confronted with.

125
Devereux and Griffith (1998) expressed that there was an absence of exact
confirmation with regard to this issue for the creating nations on the ground that there
was a trouble in ascertaining the proper tax measures for creating nations. Such
studies have verifiably accepted that the tax flexibilities for outside direct investment
are indistinguishable for both types of nations which was not in line with the findings
inferred by Blonigen and Wang (2005)
According to Mehta (2007) the basic requirements predict the FDI inflow
significantly and weaker infrastructure is the major impediment in its way. By
enhancing competitiveness through improving basic requirements and infrastructure,
the South Asian countries can attract more FDI which ultimately should improve their
growth, exports and investment.
Shakya (2003) is also of the opinion that infrastructure, trade, exports, GDP, domestic
capital formation and growth of any country strides positively with its FDI inflow.
This ultimately proves the argument that FDI is instrumental in promoting investment
in export led economies. FDI does not impact domestic investment in the short term
but it does impact it significantly in the long run. In Nepal, the enhanced FDI is
mandatory for improvement in its infrastructure, domestic investment and exports
along with enhancing its economic growth and creation of more job opportunities.
Kemal et al. 2002) has found that initially tariff rates were very high but gradually
they were rationalized. The average tariff rate was reduced to 25 % which was further
diminished to 14.7% in Pakistan. Government, through policy changes, has set a road
map for tariff reduction and customs duty will be no more a source of revenue
collection. Tariff rates would be adjusted as part of the trade incentives regime and a
fiscal policy measure. Since 1992, the democratic governments in the country has
made conducive policies to improve FDI and develop industrial sector and economy

126
and there is improvement in FDI inflows but not at desired pace because the
prerequisites like strong and stable political system along with sound economic
policies which are mandatory for sustainable FDI inflows are still lacking.
In the study conducted by Gondor and Paula (2012), it is observed that the policy
makers and researchers pay significant attention to the inflow or outflow of the capital
of a particular country and the fiscal policy is the major determining factor for FDI.
This study has also explored that competition amongst governments for attracting FDI
is determined by tax rates but this is mainly due to business environment and the
fiscal policy of a country. This research also reveals the relationship between FDI and
fiscal policy and makes this relationship a conjecture. The results show that the
business environment is the determinant for FDI rather than the corporate tax rate and
this relationship is the directly linked to the fiscal policy of the country. FDI is not
attracted by a country even with low corporate tax rates only. FDI is boosted by a
country’s good fiscal policy aimed at generating a favorable business environment
ensuring policy consistency, transparency, and fiscal clarity and by bridging tax gaps
and curbing corruption and tax frauds. Higher corporate tax rate can promote growth
in inflows of FDI, if the resources mobilized are also invested in creating business
infrastructure and generating business friendly environment to provide incentives to
goad foreign investors.
Khan and Kim (1999) are of the opinion that there are negative fall outs of
concentration of FDI on the power sector resulting into large costs of foreign
exchange and remittances and creating major implications for balance of payments.
There are lessons to be learnt from Pakistan’s experience that short term priority
should be attached to the foreign exchange earnings to attract FDI in other sectors as
well. Multilateral development partners like Asian Development Bank can be
127
approached to get their assistance to develop economic infrastructure in the country
which could be on BOT model and this will attract foreign investors.
Yusuf (2013) found that the economic potential is not said to be exploited fully if a
virtuous growth spiral has not been catalyzed through policy actions which attract FDI
into industry and infrastructure and ultimately contribute for diversification and up-
gradation of technology, so that Pakistani firms are integrated globally. A modest FDI
inflow from China has been maintained so far. If China starts off shoring its labor-
intensive manufacturing activities, Pakistan’s textile, leather, white goods and auto
industries can reap its benefits. China is also helping Pakistan’s industry in the
medium term by helping to remove its transport and energy constraints. However, if
the mandated policies are implemented properly, Chinese FDI in light manufacturing
can be attracted. The analysis made by Khan and Nawaz (2010) has identified that
growing GDP, robust exports, human development, rationalized tariffs and controlled
inflation are some of the pre-requisites of FDI inflows into Pakistan.
The study suggests that the government should make export oriented policies for FDI
rather specific policies to attract FDI for domestic consumption. This study helps in
exploring ways to formulate such policy framework. Increase in GDP growth rate
bears appositive impact on FDI inflow in Pakistan proven by regression results.
Therefore the authorities are required to focus on policies which can improve GDP.
The study also shows that export demand also improves FDI which mandates
government to focus on an export-oriented trade policy by making export processing
zones and adjusting fiscal policies. Import tariff plays major role in boosting FDI in a
country. Government ought to encourage positive import policies to win the
confidence of investors.
128
Tyler (1981) examined center east nations and found that the development in the
invented tariffs in a nation lead to the advancement further prompting an expansion in
the absorptive limit for further investment. Consequently an expansion in the
exchange would prompt change in the economy if the absorptive limit of the nation is
sufficiently capable to do over the long term (Krueger, 1978). Hansen and Rand
(2005) contended that FDI and gross capital development are related over the long
period and that FDI has influence on gross domestic product through usage of
innovation and exchange of mindfulness.
Lim (2007) expressed that rebuilding of the levy rates was really one of the routes
through which nations try to pull in outside direct investment into the nation. In this
respects there are various ways through which FDI can be drawn into an economy. In
this connection the monetary determinants including the approach structures and the
level of business assistance was of critical significance in supporting to increment
direct investment in the nation.
Varsakelis et al. (2010) expressed that there was little uncertainty about the fact that
the quickened development of the direct investment in the recent past was a
consequence of the tax differences that have been utilized by the strategy makers to
pull in FDI everywhere.
Desai et al. (2004) noticed that multinational associations really change their
obligation levels as per the corporate tax rates that they are faced with. Henceforth it
supports that the conduct of the multinational associations was clearly dictated by
level of tax rates. Desai et al. (2003) found that despite the fact that the majority of the
current writings on direct investment concentrates on corporate salary taxes to
investigate this and found that the level of FDI, non-wage taxes or the indirect
taxation were critical determinants of FDI in a nation.
129
Devereux and Griffith (1998) expressed that there was an absence of exact
confirmation in to this issue for the creating nations on the ground that regularly, there
was a trouble in ascertaining the proper tax measures for creating nations. Such
studies have verifiably accepted that the tax flexibilities for outside direct investment
are indistinguishable for both types of nations which as a general rule, was not the
situation as has been plainly brought up by (Blonigen and Wang, 2005). Thus these
methodical contrasts between the high wage and low salary nations, to the extent that
tax flexibilities were concerned suggest that the information from the two sets can't be
pooled together for a study. In this manner the creating nations have to be
concentrated independently (Mutti and Grubert, 2004).
The impact of tax structure on FDI has been infrequently examined in Pakistan.
Exchange arrangement of Pakistan has been fluctuating in 1950s. Protective
arrangements were made to safeguard the growth of the newly established business
enterprises. During 1960s imports started growing and fares were fixed through
agreed arrangement helping through critical substitution strategies and lowering of the
exchange rates in 1980s. Further imports were rationalized by diminishing the duty
rate from 17 % to 10 % in 1987 (Hussain, 2003). The ideal tariff rate was constrained
to 25 % which was further diminished to 14.7% (Kemal et al. 2002).
As a result of these tariff adjustments, imports had grown further. In Pakistan
hugeness of FDI inflow is highlighted as size and rate of gross capital arrangement.
Shah and Ahmad (2003) built up that adjustment in GDP and levy rate express
significant effect on FDI in long run. While duty rate additionally boost FDI in short
run. Aqeel and Nishat (2004) recognized that FDI is pulled in through government
approaches. The variables like corporate tax and custom obligations are critical. Awan
and Zaman (2010) expressed that FDI and growth rate were basically positive to
130
convince outside financial specialists. In any case, it has been found regarding the
relationship of foreign direct investment and tax structure that it prompts long term
advantages for the host nations. (Shahbaz, 2012).
3.5 Non Tax Factors Affecting FDI
Various researchers have tried to find the factors affecting FDI other than tax
incentives, so that country’s scarce resources may be employed economic
development properly. Moosa and Cardak (2003) applied extreme bounds analysis to
a cross-sectional sample on data of 140 countries for the period 1998-2000 to study,
the Determinants of Foreign Direct Investment: An Extreme Bounds Analysis. The
UNCTAD’s inward FDI index was used as dependent variable. They found that free
variables like GDP, exports and telecom coverage per 1000 persons had a greater
impact on FDI.
Gentvilaitė (2010) conducted a research on, Determinants of FDI and its Motives in
Central and Eastern European Countries, by using panel regression analysis. He
analyzed FDI determinants and inflow of FDI in 10 Central and Eastern European
countries. The researcher reached the conclusion that private sector, openness, R&D
expenditures and infrastructure are significant determinants of FDI. Hasen and
Gianluigi (2010) conducted a joint study on the determinants of FDI, focusing on
determinants of inflow of FDI to countries of AMU. The study used simultaneous-
equation regressions for panel data. It analyzed the effects of factors like growth in
market size, openness to trade, exchange rate, inflation and government expenditure
to GDP and found that these significantly influenced FDI inflows into the Maghreb
region for the period 1990-2006. The study found that Maghreb countries have shown
different dynamics of investments and factors affecting FDI as compared to other
developing countries. The study revealed that market growth does not have any
131
significant impact on FDI flows to these countries contrary to previous studies.
Adegbite et.al, (2012) conducted a joint study by using the time series data from
1970-2009 and by applying generalized method of moments (GMM) technique. It
examined the influence of foreign exchange rate on the inflow of foreign direct
investment in Nigeria and it was observed that exchange rate had a significant
influence in Nigeria. Etim et.al (2014) conducted a research in Nigeria on the
determinants of FDI and their impacts on the Nigerian economy. The study examined
the determinants of foreign direct investment for the period 1975-2010. They
examined how exchange rate, market size (GDP), investment in infrastructure,
openness and political risks had impact on the inflow of FDI in Nigeria during the
aforementioned period. They used Ordinary Least Square (OLS) and co-integration
Error Correction Method (ECM) and found out that market size (GDP), openness, and
exchange rate had significant impact on FDI inflow while political risk was not
favorable to it.
Mijiyawa (2012) analyzed factors affecting Foreign Direct Investments in Africa by
using five-year panel data with the system-GMM technique for the period 1970-2009
including 53 African countries and observed that (a) larger countries attract more FDI.
(b) open countries, politically stable countries and countries offering higher return to
investment also attract FDI. (c) FDI inflows are persistent in Africa.
Anyanwu (2012) conducted research by using cross-country analysis based on
regressions for the period 1996-2008 and found out that positive relationship existed
among market size, trade openness, better law and order, availability of national
resources and the FDI inflows. Berthault (2009) observed that FDI in African
countries was more leveraged by their natural resources or by the local market.
Hussain and Kabibi (2012) analyzed the FDI flow in developing countries in a study
132
based on macro panel data of 57 low income economies for a period spanning over
ten years (2000-2009). The study on, Determinants of Foreign Direct Investment
Flows to Developing Countries found that market size, good macroeconomic
indicators, regional integration, availability of factors of production and a reasonably
stable financial sector are among the important factors which attract FDI in
developing countries.
Abdul and Kalirajanb (2010) used panel data from 68 low-income and lower-middle
income developing countries and conducted a study on the Determinants of Foreign
Direct Investment in Developing Countries: A Comparative Analysis and found that
high GDP economies have usually bigger share in global trade and have better
business environment to attract FDI.
Cevis and Burak, (2007) employed a panel data set comprising of seven explanatory
variables of 17 developing economies for a period spanning over 1989-2006. They
found that major factors of FDI inflows are inflation, bank markup, GDP growth and
trade worthiness. Dupasquier and Dosakwe (2005) suggested through their research
that there should be as frequent trade between Africa and Asia as possible because
there are certain common factors affecting FDI in developing countries. These factors
include poor macroeconomic indicators, unstable governments, poor infrastructure,
unfavorable regulatory framework and badly conceived and implanted investment
strategies. Sichei and Bertha (2012) used panel data evidence on a 45 countries to
analyze the factors which determine FDI over a period of 1980 to 2009. Findings
showed that big enterprise economies, abundance of natural resources, higher growth
rates, and robust internal and international investment policies are key determinants to
impact regional cooperation and interaction on FDI in in East African countries. It
133
was found by them that political risk and financial stability had very significant effect
on FDI inflow whereas regional integration did not have any effect.
Getinet and Hirut (2005) researched for the period 1974-2001 in Ethiopia on a study,
Determinants of Foreign Direct Investment in Ethiopia: A time-series Analysis. It was
observed by them that GDP growth, export maximization, trade liberalization have
significantly positive effects on FDI. It was also observed that poor macroeconomic
indicators and weak, underdeveloped physical infrastructure will have negative
influence on FDI. Therefore, it was implied through this research that trade
liberalization and strong regulatory framework, strong macroeconomic scenario,
stable governments and robust and reasonably developed physical infrastructure are
the factors which would ensure higher FDI inflows.
It has revealed that besides tax incentives, some non-tax factors have direct bearing on
the investment in the country as well as on the efficiency of the tax system in the
country. These factors include:-
i. political stability
ii. macro-economic stability
iii. access to raw materials e.g. natural resources, energy supply
iv. law and order
v. financing costs and market size
vi. skilled labor available at affordable cost
vii. developed physical infrastructure
viii. reliable and cost effective means of communication like transport, telecom
etc
ix. Accessibility and reach to consumer markets where demand is high and
export costs are lower
134
Summary of Review
The literature reviewed has brought out some general observations. The proponents of
tax incentives put the argument that as returns on investment are increased, there are
positive externalities of investment which are easy to target and fine tune. The tax
incentives, in their opinion signal openness to private investment and are also useful
to mobilize the world capital. Tax incentives respond to tax competition from other
countries. They generate and increase revenue by generating investments, which in
turn increase tax earnings and better employment, thus creating a good economic
environment. Tax incentives also provide other advantages due to direct spending on
development projects which further grows the investment by a snowball effect. Tax
incentives have achieved great success on stimulating investment and economic
development in countries like Malaysia, Ireland, and Mauritius (Bolnick, 2004).
Hind side of offering tax incentives are revenue loss. There are indirect revenue costs
by undercutting the profitability of other business enterprises which pay full pay
taxes. The tax incentives promote revenue leakage through tax avoidance and tax
evasion. The tax incentives encumber tax administration in several ways. They have
to apply different rules to different taxpayers which inherently complicate the system.
To plug the loopholes, the highly skilled administrative resources are consumed. The
senior tax administration participates in preparing packages of tax incentives,
implementation of the policies and monitoring progress. Fiscal realignments are
required to adjust the economic costs of these revenue losses and to cover the
concomitant budget gap. The efficiency and productivity is reduced in two ways: Tax
incentive programs generate investments but with a low return rate. Tax incentives if
badly drafted or casually implemented can lead to creating inequitable business
environment and also trust gap between incentivized and non-incentivized businesses
135
and between business enterprises and policy makers. This will result in providing
unfair advantage to concessionary businesses over businesses paying full taxes. In
such a scenario the tax compliance is affected. There is likely to be more fiscal cost of
tax incentives as compared to resultant investment proportion advantage. In view of
vague data on exact proportionate advantage of investment vs. fiscal cost of
incentives, it is difficult to carry out a cost benefit analysis. Consequently, the
companies and business groups put pressure on the governments to gain tax incentives
by propagating the expected economic benefits out of desired concessions for the
economy. Bolnick (2004) is of the view that the politicians representing other
industries and regions influence and pressurize the governments to broaden the
incentives programs and make them more liberal if such tax incentives are provided to
the people relating to selected industries or regions and businesses. Tax incentive
regimes have not been successful in many countries due to many external factors.
Pakistan’s economic policy makers have been making efforts to correct distortions in
the taxation systems and improve the efficiency and robustness in taxation
framework. The key issues in Pakistan’s tax system during pre-reform period 2001 in
Pakistan were: discretionary forces with tax authorities, debasement, restricted tax
base, high tax rates, SRO culture, and low share of direct taxes, substantial
dependence on indirect and withholding taxes, deferred discount installments and a
non-accommodating environment in tax workplaces (World Bank Report 2009).
Government of Pakistan undertook business process reengineering for attracting
foreign investment and provided investment friendly environment in the country
under the tax reforms program during period 2004-2012. It is necessary to measure
impact of tax reforms foreign investment inflows as a huge amount has been ploughed
with the help of donors which entailed other invisible costs. Unfortunately, the tax-
136
GDP ratio has not been increased through reforms despite taxpayers’ facilitation,
simplification of procedures and minimization of contacts between taxpayers and tax
collector. This aspect of reforms along with tax rates rationalization is a core subject
for attraction of investment which is to be taken into account. Many important tax
policy changes have been undertaken to facilitate the foreign investors in Pakistan and
tariff structure has also been rationalized accordingly. Pakistan’s tax policy has
undergone massive reforms during the period from 2004 to 2012. The latest tax
reforms were initiated in the year 2004 and no appraisal has so far been carried out to
explore the effects on investments of different tax measures undertaken and incentives
provided in Pakistan. It is there very critical to investigate and explore what has been
the impact of these tax reforms and tax measures adopted on the overall economy of
Pakistan and on investments in particular. Hence this study is an attempt to analyze
the situation and find out the level of success of these tax measures and also find
whether any further measures should be undertaken to achieve the desired objectives.
The literature has revealed that tax policy changes affect inflow of FDI and growth of
domestic investment, either positively or negatively. It suggests that a significant
relationship exists between tax incentives and tariff incentives and FDI and domestic
investments. Various tax and tariff incentives have also been provided in Pakistan to
the local and foreign investors during the last two and half decades. There is no
empirical evidence available to prove whether, any such relationship exists between
tax and tariff incentives and FDI and domestic investment in case of Pakistan and if
yes, whether this relationship is positive or negative. There has been no significant
research or study whether tax incentives have any impact on investments (FDI and
domestic) in Pakistan. There is no empirical evidence as to what relationship exists
between CTR/Tariffs with FDI and domestic investment in Pakistan. It also aims to
137
explore, what are the non-tax factors which may have been affecting FDI and
domestic investment. Moreover, the study also suggests measures to be adopted to
enhance investments in Pakistan. The existing literature about other countries has
revealed that tax policy changes affect inflow of FDI and growth of domestic
investment, either positively or negatively. It suggests that a significant relationship
exists between tax incentives and tariff incentives and FDI and domestic investments.
Various tax and tariff incentives have also been provided in Pakistan to the local and
foreign investors during the last two and half decades. There is no empirical evidence
available about Pakistan to prove whether, any such relationship exists between tax
and tariff incentives and FDI and domestic investment in case of Pakistan and if yes,
whether this relationship is positive or negative. There has been no significant
research or study whether tax incentives have any impact on investments (FDI and
domestic) in Pakistan. There is no empirical evidence as to what relationship exists
between CTR/Tariffs with FDI and domestic investment in Pakistan. There is also no
evidence available whether any non-tax factors affect investments in Pakistan and
they need to be identified to explore their impact on investments. This study aims to
grasps the missing links in this regard about situation in Pakistan so as to suggest
future policy guidelines for economists and policy makers for taking into account the
findings of this study for policy formulation and implementation.
After review of literature on the subject, there is a need to analyze the
findings/conclusions of the reviewed literature, in respect of Pakistan to prove or
reject the hypotheses of this research. This study shall be focused on the following:
i. Study different pre-reform tax policy measures and their impact on FDI and
domestic investments
138
ii. Study the various tax policy reforms implemented in last decade and impact
of this incentivized tax policy on investment (FDI and domestic investment)
iii. Study the relationship between tax incentives and FDI and domestic
investments in Pakistan perspective. Study various tax policy mechanisms
which are responsible for producing these impacts
iv. Finally to explore the distortions in the existing tax policy hindering growth
and inflow of investments and suggest way forward.
v. Study aims to explore the non-tax factors, if any, which affect the investments
flow and growth and how to address the challenges in Pakistan.
3.6 Research Gap
The literature has revealed that tax policy changes affect inflow of FDI and growth of
domestic investment while having significant relationship between tax and tariff
incentives and FDI and domestic investment. The major focus of all tax policies in
Pakistan has been on revenue maximization for public expenditure to ensure
economic development rather than incentivization to promote investments, leading to
economic growth. Various determinants of investment in Pakistan have been studied
but no focused study has been made to investigate the tax policy as specific
determinant of investment and evaluate its relationship and impact thereon.
To my knowledge, there is no empirical evidence available as to what is the nature of
relationship and quantum of impact of changes of corporate tax and tariffs on
investment in the context of Pakistan. Hence this study, attempts to explore this aspect
of tax policy as determinant of investment.
3.7 Theoretical Foundation
Keynes (1930) argued that by changing tax rates and expenditure, as main instruments
of fiscal policy, the governments can bring about economic development.
139
Macroeconomic objectives of employment, investment and growth can be achieved
through combined measure of imposing taxes and government expenditures.
(Dégh, 1997) in Conduit theory states that corporate taxes should not be imposed on
an investment company in the same manner and same tax burden as done in case of
other regular firms because the investment firm further distributes its capital gains,
interest and profits to its customers/shareholders, unlike the regular firms with a
different business strategy.
3.8 Hypothesis Statement
In view of the foregoing review of literature and need and justification of this study
discussed above, the following hypothesis statement has been brought out which
comprises of four hypotheses for testing in the succeeding chapters.
Hypothesis 1: There is significant long term relationship between corporate tax rate
and foreign direct investment in Pakistan
Hypothesis 2: There is significant short term relationship between corporate tax rate
and foreign direct investment in Pakistan
Hypothesis 3: There is significant long term relationship between tariff rate and
foreign direct investment in Pakistan
Hypothesis 4: There is significant short term relationship between tariff rate and
foreign direct investment in Pakistan
Hypothesis 5: Corporate tax rate has significant negative relationship with domestic
investment in Pakistan
Hypothesis 6: Tariff rate has significant impact on domestic investment in Pakistan

140
CHAPTER 4
RESEARCH METHODOLOGY AND MODEL ESTIMATION
This chapter comprises of data description, data collection methodology, data analysis
tools, research design, definition of variables, measurement of variables and model
estimation.
4.1 Data Description
This research study is based on secondary data. The study period spans over 25 years
from 1990 to 2014 to analyze the tax policy incentives and its impact on investment in
Pakistan. The research methodology revolves around two distinct components. The
first component includes information collection from key sources, tabulation and
analysis. The second component scouts the correlation between investment and
corporate tax and tariff rates.
4.2 Research Design
In order to explore overall tax incentives’ impact on domestic and foreign investment
in aggregate in Pakistan, this study has employed quantitative method to have a better
insight, gain a richer understanding and find accurate answers to the research
questions delineated earlier in chapter 1.
4.3 Data Collection Methods
Data of the study variables has been collected for 25 years from FY 1990 to 2014.
This study period has been selected because tax reforms were undertaken from 1985
141
onwards offering tax incentives and in second phase further tax reforms were
introduced in 2004. The study period corresponds to the periods of impact of tax
reforms, from 1990 to 2014 (25 years). Moreover similar type of study has been
conducted in Ethiopia for the period of 22 years by Kassahun (2015). Considerable
amount of secondary data has been gathered from State Bank of Pakistan, Federal
Board of Revenue yearly books, Pakistan Bureau of Statistics and Economic Surveys
of Pakistan. Information has also been collected from various documents, reports and
data of FBR, PBS, State Bank of Pakistan, research papers, studies, various
government reports, documents, publications and Income Tax Ordinance 2001,
Pakistan Customs Act, PIDE Inflation Expectations Surveys, Annual Reports of
Board of Investment, Human Growth Reports, Pakistan Tax Policy and Global
Competitiveness Reports and other reports of World Bank.
4.4 Methods of Data Analysis
Descriptive and inferential statistics are used to analyze the data obtained from the
financial and economic reports comprehensively. Understanding and analyzing the
overall effect of tax incentives in attracting FDI in developing countries is critical to
this study, therefore, the validating procedures are based on statistical analysis.
4.5 Statistical Method
In the descriptive analysis, the simple ratio, percentages, tables, charts and graphs are
employed to analyze the data. Inferential statistics are used and the study utilizes time
series data analysis technique involving multiple regressions for analyzing the impact
of corporate tax rate on FDI (in aggregate) and looks into the impact of customs tariff
rates and other tax incentives (tax holidays and exemptions) on FDI and domestic
investment on aggregate level.
142
4.6 Definitions of Variables
4.6.1 Domestic Investment
Domestic investment is an investment by local companies in the domestic market.
Gross private domestic investment is the physical investment in an economy.
4.6.2 Foreign Direct Investment
FDI is defined as the total inflow of investment in a country from investors from
overseas. As per relevant measurement of the literature, Dependent variable used in
this study is calculated as the log of total foreign investment (net FDI log).
4.6.3 Corporate Tax Rates Concessions/Reductions
Statutory income tax rate based on Income Tax Ordinance 2001in Pakistan are used in
this study. Statutory income tax is used because of several reasons than the others.
First, it is the easiest measure of tax burden level compared to other methods.
Second, multinational companies use it to select a country to invest because
companies are more likely to choose a country where lower tax rates are levied.
Corporate tax rates have been used as independent variable to evaluate the impact on
domestic and foreign investments. So, this study hypothesizes that higher tax rates
negatively impact FDI. Oniyewu and Shareshta (2005) argue that high levels of
taxation would discourage FDI whilst low levels of taxes would encourage foreign
investors; hence tax rates have a negative relationship with FDI. In order to attract
foreign investment, host countries offer a lower tax environment to the foreign
investors. However, Dunning (2000) suggests that location specific advantages may
have a much greater effect than the tax rates.
4.6.4 Custom Duty Tariff Concessions/Reductions
Customs duties tariffs on import of goods are used as independent variable to measure
impact on domestic and foreign investment. This is also fiscal tool, as the
143
governments impose higher import tariffs to discourage imports and reduce tariffs to
promote import of such items like plan and machinery to encourage investments, both
domestic and foreign. Most of the sectors are exempted from custom duty on
importation of capital goods and exporting their product (EIA, 2013). Generally, tariff
rates have negative relationship with FDI as revealed in literature. This relationship
has to be tested here in case of Pakistan as well.
4.6.5 Tax Holidays
Tax holiday has been used as a tool to attract FDI by many developing and transition
economies. The purpose of this incentive is mainly to encourage investors to establish
new firms rather than currently investing in existing companies. This exemption is
fixed for a specified period of time and usually this period can be extended for a
subsequent period at a lower tax rate. This study exploits tax holiday in each sector to
estimate its impact on investment in Pakistan during several of tax holidays
announced during the period of 1990 to 2015.
4.7 Model Estimation
This study uses a model comprising of two variables of incentivized tax policy like
custom tariffs and corporate tax rates to find its impact on domestic investment and
foreign direct investment in Pakistan in aggregate. For testing of time series data, two
dependent variables have been taken. To check the impact of corporate tax rate and
tariff rate on domestic investment and FDI, the time series data requires regression
analysis. To avoid spurious results, data should be stationary at same level. For
domestic investment and subsequent independent variables, data was stationary at
same level, so we employed regression analysis. For foreign direct investment, the
condition of stationariness was violated, so as per suggestion of Ouattara (2004), we
employed ARDL approach. The study uses both ARDL and regression analysis
144
approaches to examine the relationship between corporate tax rate, tariff rate and
domestic investment in following model (equations 4.1 and 4.2) have been tested. For
equation 4.1, the relationship between corporate tax rate, tariff rate and domestic
investment has been tested, for which regression analysis has been made.
ΔDI t = β0 + β1ΔCTR t + β2 ΔTR t + ε t……………………4.1
And, to examine the relationship between corporate tax rate, tariff rate and foreign
direct investment, following model has been tested and for this analysis ARDL
technique has been used as discussed in later paragraphs.
FDI t = β0 + β1CTR t + β2 TR t + ε t……………………………………4.2
Whereas, DIt = Net Direct Investment at time t
FDI t: Net Foreign Direct Investment Inflow in Rupees at country level (in
aggregate) at time t
β0: is an intercept of the model
CTRt: Corporate Tax Rate according to law at time t
TR: Tariff Rates at time t.
There are several approaches to test the existence of the long-run equilibrium
relationship among time-series variables. The most widely used methods include
Engle and Granger (1987) test, fully modified OLS procedure of Phillips and
Hansen's (1990), maximum likelihood based Johansen (1988 &1991) and Johansen-
Juselius (1990) tests. These techniques require that the variables in the system are
integrated at order one I (1). Furthermore, these methods do not have the properties to
explain the small size. To overcome these problems, autoregressive distributed lag
(ARDL) approach, a newly developed method, used to co-integration has become
popular in recent years. This study used autoregressive distributed lag approach
(ARDL) to co-integration following the methodology proposed by Pesaran and Shin
145
(1999). This methodology has several advantages over other co-integration
procedures. First, it can be applied without matching the stationary properties of the
variables in a given sample. Secondly, it can estimate long-run properties which are
not available in alternative co-integration procedures. Finally, ARDL Model has the
capacity to accommodate large number of variables than other Vector Autoregressive
(VAR) models.
Firstly, data has been tested for unit root. This testing is a pre-condition to avoid the
possibility of spurious regression. Ouattara (2004) reports that bounds test is based on
the assumption that the variables are I (0) or I(1), so in the presence of I (2) variables,
the computed F-statistics provided by Pesaran et al. (2001) becomes invalid.
Similarly other diagnostic tests are applied to detect serial correlation,
heterosidisticity and conflict to normality.
If data is found I(0) or I(1) the ARDL method to co integration is used which consists
of three stages. First, the existence of a long-run relationship between the variables is
established by testing for the significance of lagged variables in an error correction
mechanism regression; then the first lag of the levels of each variable is added to the
equation to create the error correction mechanism equation and finally a variable
addition test is performed by computing an F-test on the significance of all the lagged
variables.
The second stage is to estimate the ARDL form of equation where the optimal lag
length is chosen as per Schwarz Bayesian. Then the restricted version of the equation
is solved for the long-run solution. An ARDL representation of above equation 4.2 is
given below:
LnFDI = β0 + LnCTR t + Ln TR t + ε t ……………………………4.3
Where I range from 1 to p
146
The third stage deals with the estimation of error correction equation using the
differences of the variables and the lagged long-run solution, and determines the
speed of adjustment of returns to equilibrium. A general error correction
representation of equation is given below:
∆ FDIt = β0+ Σ βi∆ CTRt-1 + Σ λi ∆ TRt-1 +ECMt +µt……………….4.4
In this stage, stability of the long-run and short-run coefficients is observed by
employing cumulative sum of squares (CUSUMSQ) and cumulative sum (CUSUM)
tests. The CUSUMSQ and CUSUM statistics are updated recursively and plotted
against the break points. If the plots of CUSUM and CUSUMSQ statistics stay within
the critical bonds of 5% level of significance, the null hypothesis of all coefficients in
the given regression are stable and cannot be rejected.
147
CHAPTER 5
DATA ANALYSIS, EMPIRICAL RESULTS AND DISCUSSION
This chapter comprises the empirical results and discussion on the findings. This
chapter provides details such as descriptive analysis, Granger causality, correlation
analysis, and regression analysis, unit root analysis of foreign direct investment,
corporate tax rate and tariff rate and discussion on findings of this study.
This analysis provides the real meat of the study. The information from the desk
review provides a firm background and paves the path for the field work. It helps
further in developing primary research tools to get information from key informants
of different sectors; businessman, relevant government officials, tax experts, large,
medium and small tax payers. This exercise helps in developing understanding
regarding impact of tax policy on DI and FDI. Eventually this data complements and
guides the secondary data and explores the trend of direct and indirect taxes in overall
revenue generation. This is the quantitative aspect of analysis. Data has been gathered
through secondary sources, and also through interviews with various stakeholders and
focus group discussion and feedback, consultation with Government officials and key
stakeholders. The feedback from these sources is tabulated and analyzed to answer the
problem statement, regarding positive and negative impact of tax policy on
investments.
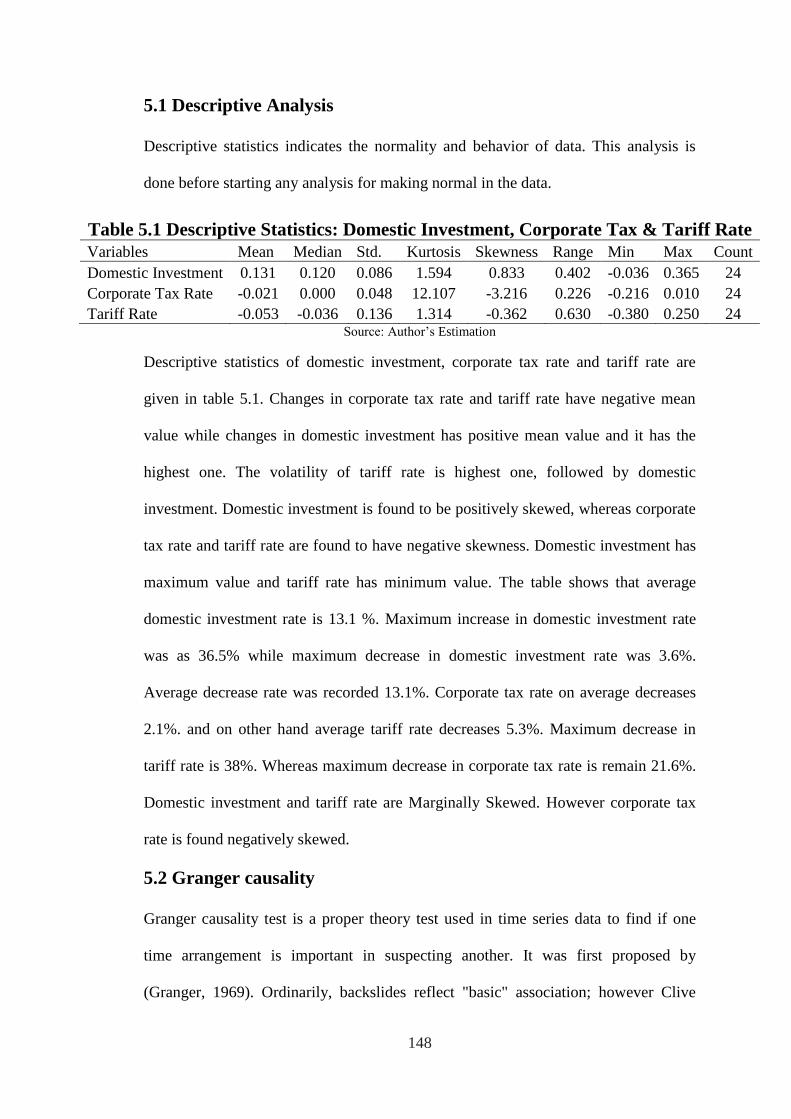
148
5.1 Descriptive Analysis
Descriptive statistics indicates the normality and behavior of data. This analysis is
done before starting any analysis for making normal in the data.
Table 5.1 Descriptive Statistics: Domestic Investment, Corporate Tax & Tariff Rate
Variables Mean Median Std. Kurtosis Skewness Range Min Max Count
Domestic Investment 0.131 0.120 0.086 1.594 0.833 0.402 -0.036 0.365 24
Corporate Tax Rate -0.021 0.000 0.048 12.107 -3.216 0.226 -0.216 0.010 24
Tariff Rate -0.053 -0.036 0.136 1.314 -0.362 0.630 -0.380 0.250 24 Source: Author’s Estimation
Descriptive statistics of domestic investment, corporate tax rate and tariff rate are
given in table 5.1. Changes in corporate tax rate and tariff rate have negative mean
value while changes in domestic investment has positive mean value and it has the
highest one. The volatility of tariff rate is highest one, followed by domestic
investment. Domestic investment is found to be positively skewed, whereas corporate
tax rate and tariff rate are found to have negative skewness. Domestic investment has
maximum value and tariff rate has minimum value. The table shows that average
domestic investment rate is 13.1 %. Maximum increase in domestic investment rate
was as 36.5% while maximum decrease in domestic investment rate was 3.6%.
Average decrease rate was recorded 13.1%. Corporate tax rate on average decreases
2.1%. and on other hand average tariff rate decreases 5.3%. Maximum decrease in
tariff rate is 38%. Whereas maximum decrease in corporate tax rate is remain 21.6%.
Domestic investment and tariff rate are Marginally Skewed. However corporate tax
rate is found negatively skewed.
5.2 Granger causality
Granger causality test is a proper theory test used in time series data to find if one
time arrangement is important in suspecting another. It was first proposed by
(Granger, 1969). Ordinarily, backslides reflect "basic" association; however Clive
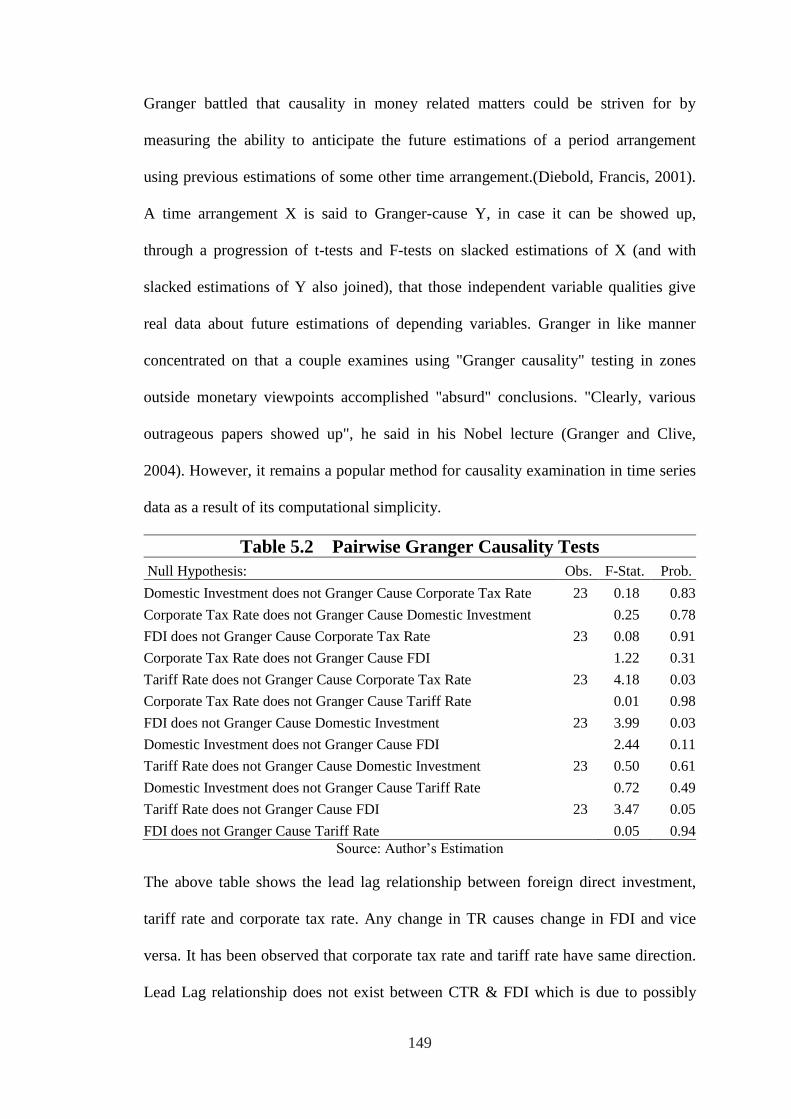
149
Granger battled that causality in money related matters could be striven for by
measuring the ability to anticipate the future estimations of a period arrangement
using previous estimations of some other time arrangement.(Diebold, Francis, 2001).
A time arrangement X is said to Granger-cause Y, in case it can be showed up,
through a progression of t-tests and F-tests on slacked estimations of X (and with
slacked estimations of Y also joined), that those independent variable qualities give
real data about future estimations of depending variables. Granger in like manner
concentrated on that a couple examines using "Granger causality" testing in zones
outside monetary viewpoints accomplished "absurd" conclusions. "Clearly, various
outrageous papers showed up", he said in his Nobel lecture (Granger and Clive,
2004). However, it remains a popular method for causality examination in time series
data as a result of its computational simplicity.
Table 5.2 Pairwise Granger Causality Tests
Null Hypothesis: Obs. F-Stat. Prob.
Domestic Investment does not Granger Cause Corporate Tax Rate 23 0.18 0.83
Corporate Tax Rate does not Granger Cause Domestic Investment 0.25 0.78
FDI does not Granger Cause Corporate Tax Rate 23 0.08 0.91
Corporate Tax Rate does not Granger Cause FDI 1.22 0.31
Tariff Rate does not Granger Cause Corporate Tax Rate 23 4.18 0.03
Corporate Tax Rate does not Granger Cause Tariff Rate 0.01 0.98
FDI does not Granger Cause Domestic Investment 23 3.99 0.03
Domestic Investment does not Granger Cause FDI 2.44 0.11
Tariff Rate does not Granger Cause Domestic Investment 23 0.50 0.61
Domestic Investment does not Granger Cause Tariff Rate 0.72 0.49
Tariff Rate does not Granger Cause FDI 23 3.47 0.05
FDI does not Granger Cause Tariff Rate 0.05 0.94 Source: Author’s Estimation
The above table shows the lead lag relationship between foreign direct investment,
tariff rate and corporate tax rate. Any change in TR causes change in FDI and vice
versa. It has been observed that corporate tax rate and tariff rate have same direction.
Lead Lag relationship does not exist between CTR & FDI which is due to possibly
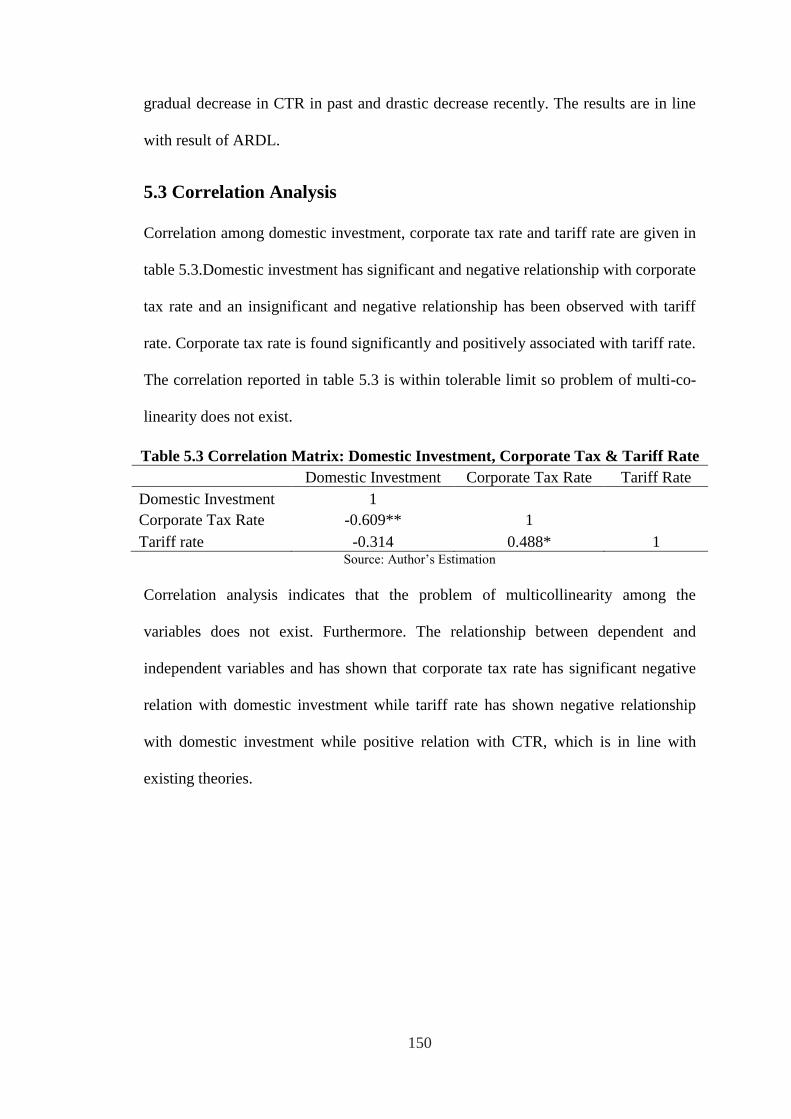
150
gradual decrease in CTR in past and drastic decrease recently. The results are in line
with result of ARDL.
5.3 Correlation Analysis
Correlation among domestic investment, corporate tax rate and tariff rate are given in
table 5.3.Domestic investment has significant and negative relationship with corporate
tax rate and an insignificant and negative relationship has been observed with tariff
rate. Corporate tax rate is found significantly and positively associated with tariff rate.
The correlation reported in table 5.3 is within tolerable limit so problem of multi-co-
linearity does not exist.
Table 5.3 Correlation Matrix: Domestic Investment, Corporate Tax & Tariff Rate
Domestic Investment Corporate Tax Rate Tariff Rate
Domestic Investment 1
Corporate Tax Rate -0.609** 1
Tariff rate -0.314 0.488* 1 Source: Author’s Estimation
Correlation analysis indicates that the problem of multicollinearity among the
variables does not exist. Furthermore. The relationship between dependent and
independent variables and has shown that corporate tax rate has significant negative
relation with domestic investment while tariff rate has shown negative relationship
with domestic investment while positive relation with CTR, which is in line with
existing theories.
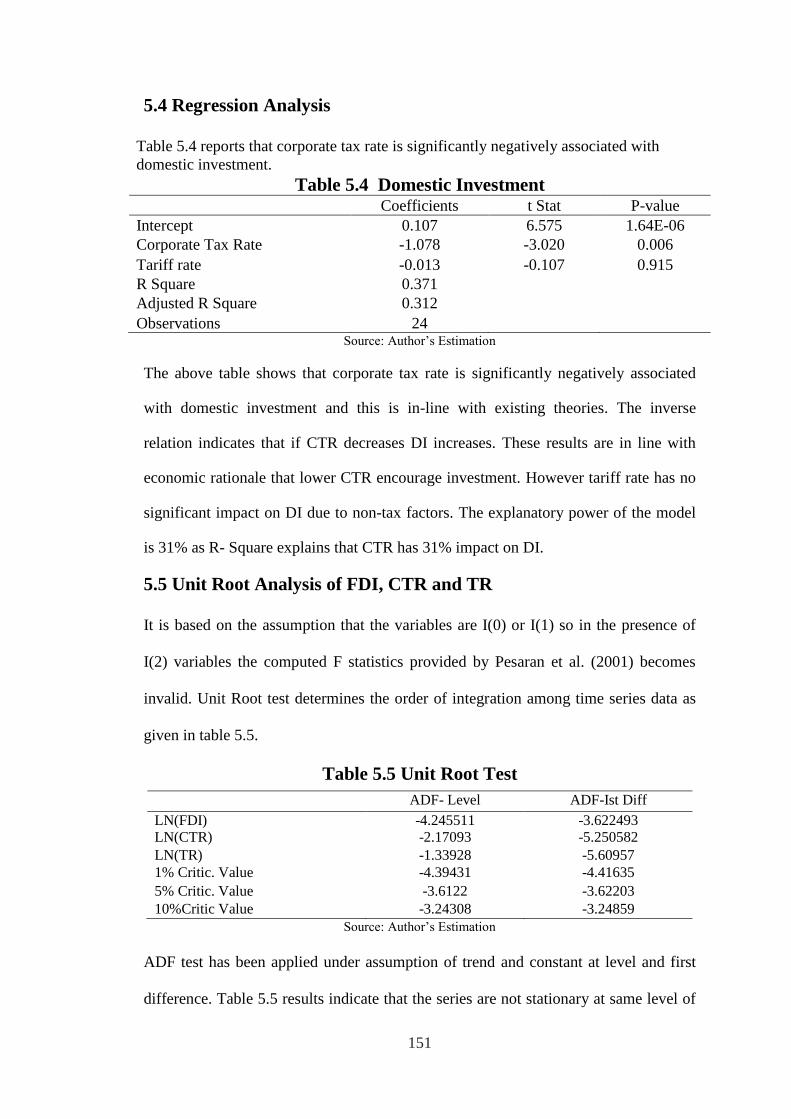
151
5.4 Regression Analysis
Table 5.4 reports that corporate tax rate is significantly negatively associated with
domestic investment.
Table 5.4 Domestic Investment Coefficients t Stat P-value
Intercept 0.107 6.575 1.64E-06
Corporate Tax Rate -1.078 -3.020 0.006
Tariff rate -0.013 -0.107 0.915
R Square 0.371
Adjusted R Square 0.312
Observations 24
Source: Author’s Estimation
The above table shows that corporate tax rate is significantly negatively associated
with domestic investment and this is in-line with existing theories. The inverse
relation indicates that if CTR decreases DI increases. These results are in line with
economic rationale that lower CTR encourage investment. However tariff rate has no
significant impact on DI due to non-tax factors. The explanatory power of the model
is 31% as R- Square explains that CTR has 31% impact on DI.
5.5 Unit Root Analysis of FDI, CTR and TR
It is based on the assumption that the variables are I(0) or I(1) so in the presence of
I(2) variables the computed F statistics provided by Pesaran et al. (2001) becomes
invalid. Unit Root test determines the order of integration among time series data as
given in table 5.5.
Table 5.5 Unit Root Test
ADF- Level ADF-Ist Diff
LN(FDI) -4.245511 -3.622493
LN(CTR) -2.17093 -5.250582
LN(TR) -1.33928 -5.60957
1% Critic. Value -4.39431 -4.41635
5% Critic. Value -3.6122 -3.62203
10%Critic Value -3.24308 -3.24859
Source: Author’s Estimation
ADF test has been applied under assumption of trend and constant at level and first
difference. Table 5.5 results indicate that the series are not stationary at same level of
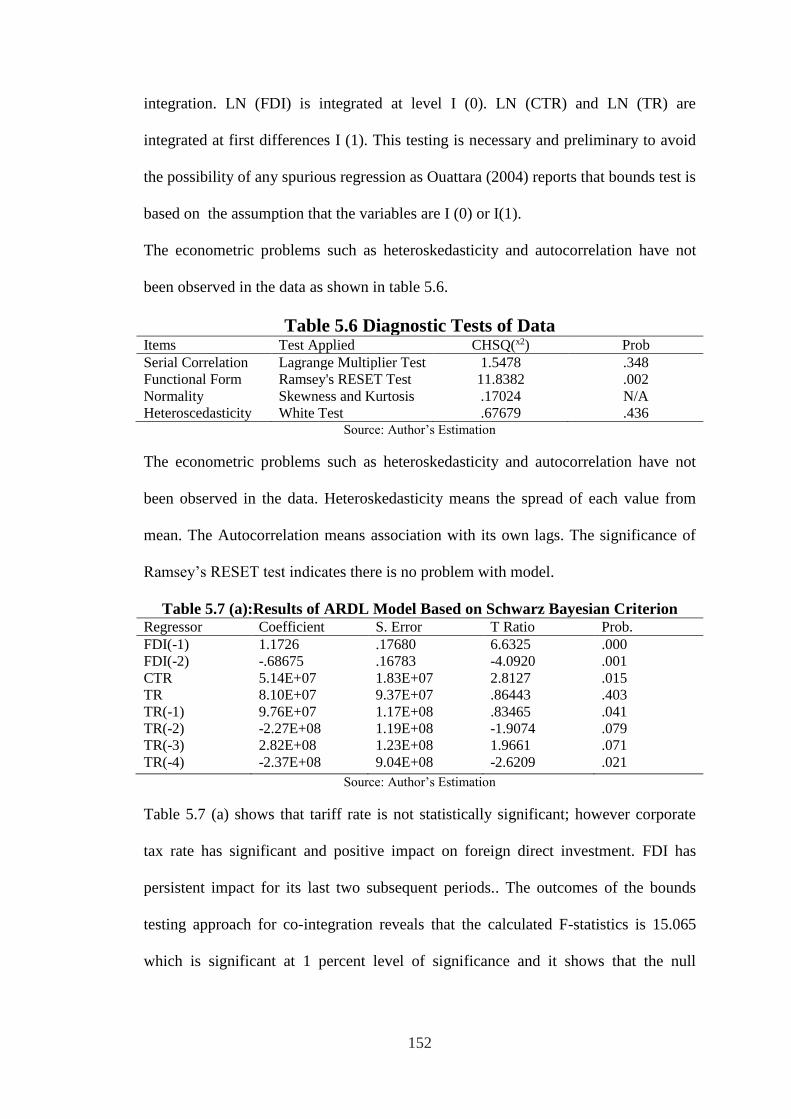
152
integration. LN (FDI) is integrated at level I (0). LN (CTR) and LN (TR) are
integrated at first differences I (1). This testing is necessary and preliminary to avoid
the possibility of any spurious regression as Ouattara (2004) reports that bounds test is
based on the assumption that the variables are I (0) or I(1).
The econometric problems such as heteroskedasticity and autocorrelation have not
been observed in the data as shown in table 5.6.
Table 5.6 Diagnostic Tests of Data Items Test Applied CHSQ(x2) Prob
Serial Correlation Lagrange Multiplier Test 1.5478 .348
Functional Form Ramsey's RESET Test 11.8382 .002
Normality Skewness and Kurtosis .17024 N/A
Heteroscedasticity White Test .67679 .436 Source: Author’s Estimation
The econometric problems such as heteroskedasticity and autocorrelation have not
been observed in the data. Heteroskedasticity means the spread of each value from
mean. The Autocorrelation means association with its own lags. The significance of
Ramsey’s RESET test indicates there is no problem with model.
Table 5.7 (a):Results of ARDL Model Based on Schwarz Bayesian Criterion Regressor Coefficient S. Error T Ratio Prob.
FDI(-1) 1.1726 .17680 6.6325 .000
FDI(-2) -.68675 .16783 -4.0920 .001
CTR 5.14E+07 1.83E+07 2.8127 .015
TR 8.10E+07 9.37E+07 .86443 .403
TR(-1) 9.76E+07 1.17E+08 .83465 .041
TR(-2) -2.27E+08 1.19E+08 -1.9074 .079
TR(-3) 2.82E+08 1.23E+08 1.9661 .071
TR(-4) -2.37E+08 9.04E+08 -2.6209 .021
Source: Author’s Estimation
Table 5.7 (a) shows that tariff rate is not statistically significant; however corporate
tax rate has significant and positive impact on foreign direct investment. FDI has
persistent impact for its last two subsequent periods.. The outcomes of the bounds
testing approach for co-integration reveals that the calculated F-statistics is 15.065
which is significant at 1 percent level of significance and it shows that the null
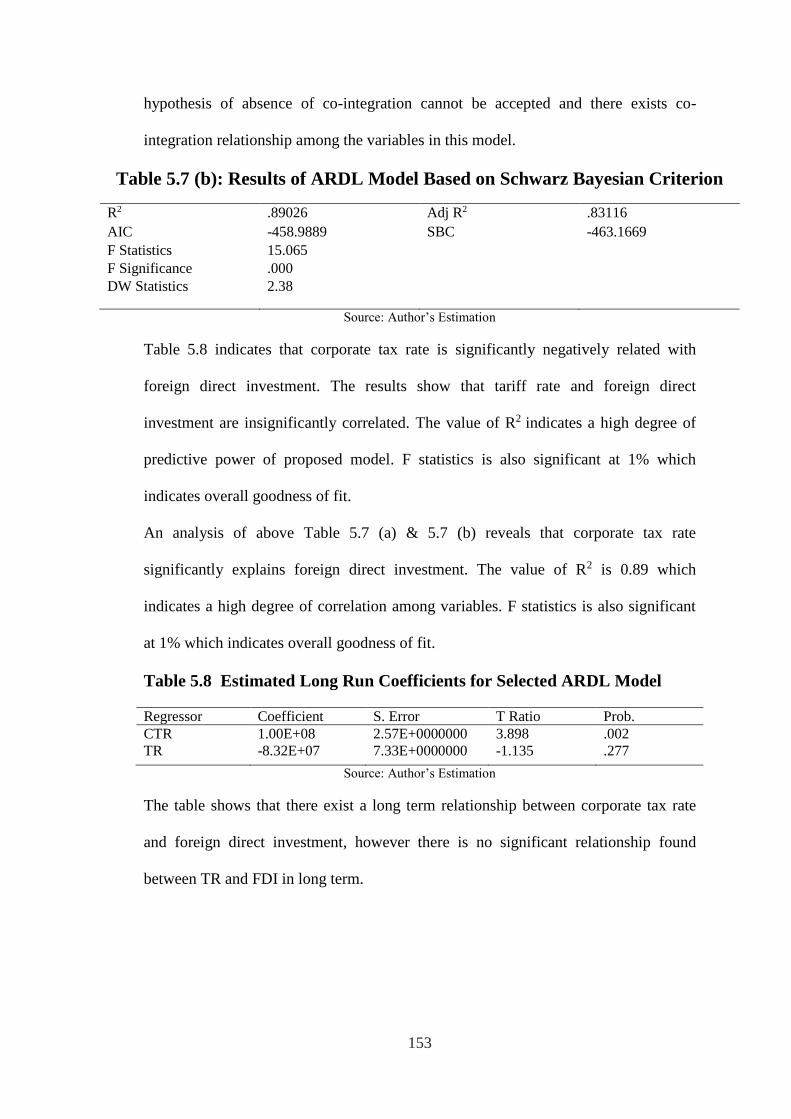
153
hypothesis of absence of co-integration cannot be accepted and there exists co-
integration relationship among the variables in this model.
Table 5.7 (b): Results of ARDL Model Based on Schwarz Bayesian Criterion
R2 .89026 Adj R2 .83116
AIC -458.9889 SBC -463.1669
F Statistics 15.065
F Significance .000
DW Statistics 2.38
Source: Author’s Estimation
Table 5.8 indicates that corporate tax rate is significantly negatively related with
foreign direct investment. The results show that tariff rate and foreign direct
investment are insignificantly correlated. The value of R2 indicates a high degree of
predictive power of proposed model. F statistics is also significant at 1% which
indicates overall goodness of fit.
An analysis of above Table 5.7 (a) & 5.7 (b) reveals that corporate tax rate
significantly explains foreign direct investment. The value of R2 is 0.89 which
indicates a high degree of correlation among variables. F statistics is also significant
at 1% which indicates overall goodness of fit.
Table 5.8 Estimated Long Run Coefficients for Selected ARDL Model
Regressor Coefficient S. Error T Ratio Prob.
CTR 1.00E+08 2.57E+0000000 3.898 .002
TR -8.32E+07 7.33E+0000000 -1.135 .277
Source: Author’s Estimation
The table shows that there exist a long term relationship between corporate tax rate
and foreign direct investment, however there is no significant relationship found
between TR and FDI in long term.
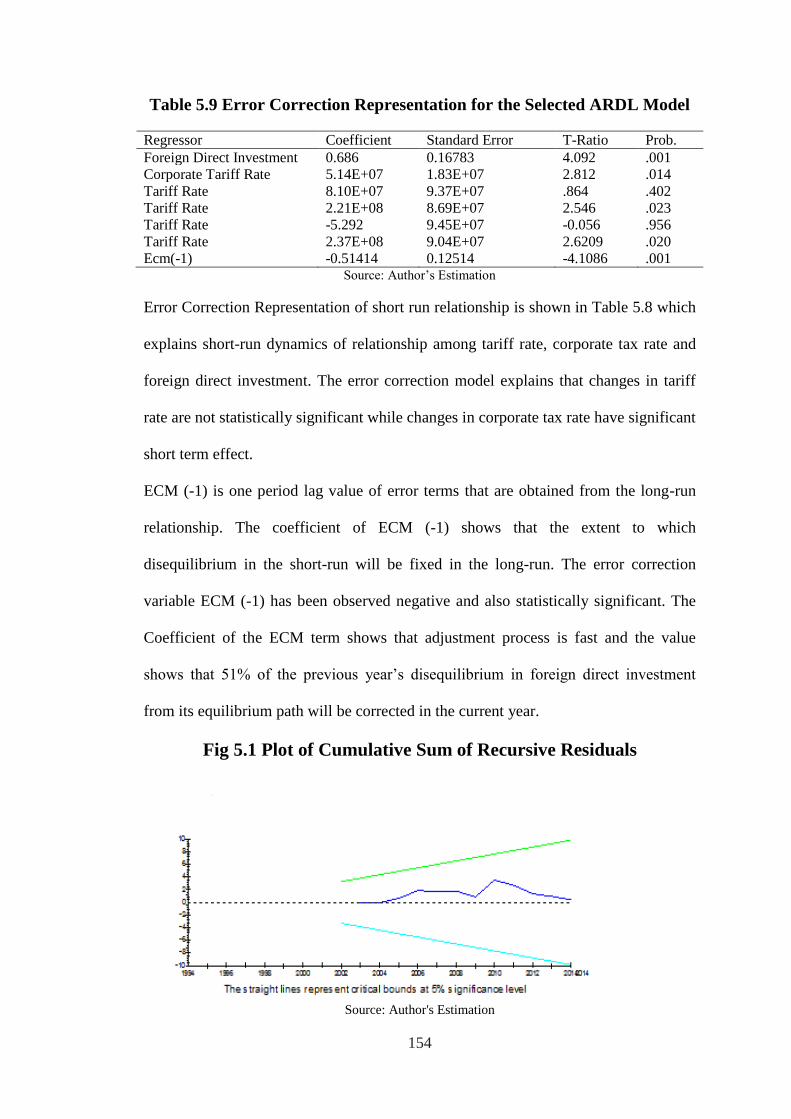
154
Table 5.9 Error Correction Representation for the Selected ARDL Model
Regressor Coefficient Standard Error T-Ratio Prob.
Foreign Direct Investment 0.686 0.16783 4.092 .001
Corporate Tariff Rate 5.14E+07 1.83E+07 2.812 .014
Tariff Rate 8.10E+07 9.37E+07 .864 .402
Tariff Rate 2.21E+08 8.69E+07 2.546 .023
Tariff Rate -5.292 9.45E+07 -0.056 .956
Tariff Rate 2.37E+08 9.04E+07 2.6209 .020
Ecm(-1) -0.51414 0.12514 -4.1086 .001 Source: Author’s Estimation
Error Correction Representation of short run relationship is shown in Table 5.8 which
explains short-run dynamics of relationship among tariff rate, corporate tax rate and
foreign direct investment. The error correction model explains that changes in tariff
rate are not statistically significant while changes in corporate tax rate have significant
short term effect.
ECM (-1) is one period lag value of error terms that are obtained from the long-run
relationship. The coefficient of ECM (-1) shows that the extent to which
disequilibrium in the short-run will be fixed in the long-run. The error correction
variable ECM (-1) has been observed negative and also statistically significant. The
Coefficient of the ECM term shows that adjustment process is fast and the value
shows that 51% of the previous year’s disequilibrium in foreign direct investment
from its equilibrium path will be corrected in the current year.
Fig 5.1 Plot of Cumulative Sum of Recursive Residuals
Source: Author's Estimation
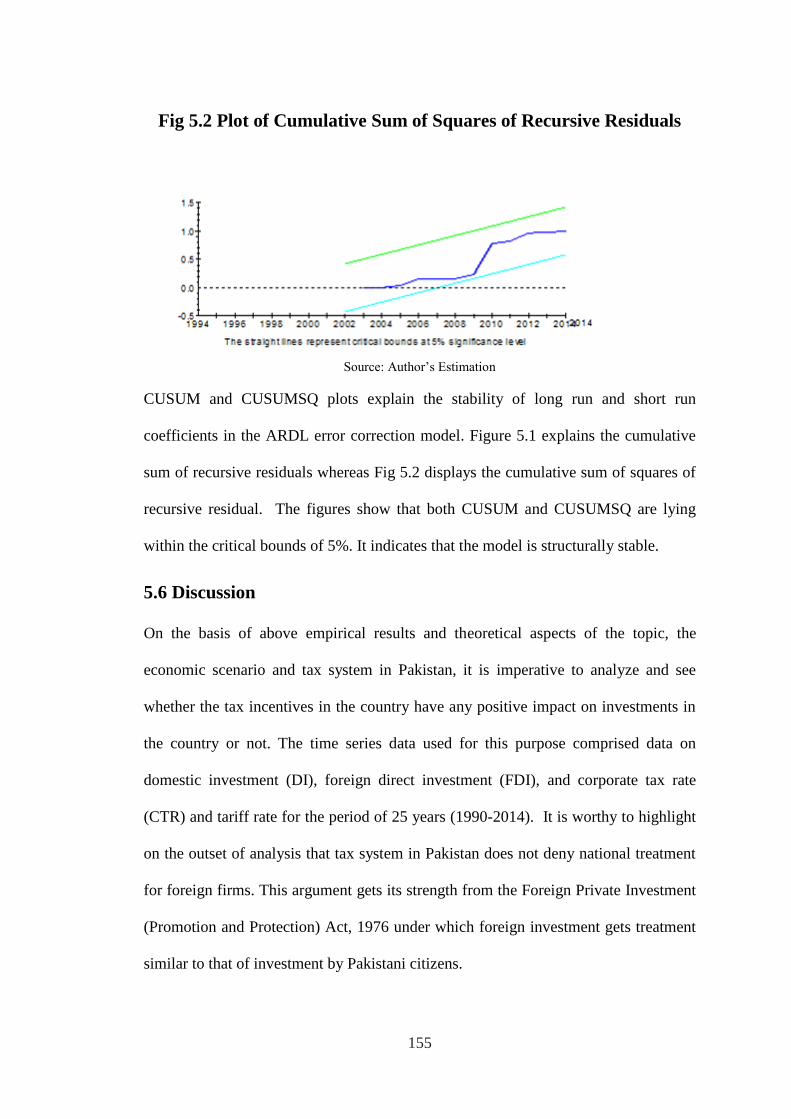
155
Fig 5.2 Plot of Cumulative Sum of Squares of Recursive Residuals
Source: Author’s Estimation
CUSUM and CUSUMSQ plots explain the stability of long run and short run
coefficients in the ARDL error correction model. Figure 5.1 explains the cumulative
sum of recursive residuals whereas Fig 5.2 displays the cumulative sum of squares of
recursive residual. The figures show that both CUSUM and CUSUMSQ are lying
within the critical bounds of 5%. It indicates that the model is structurally stable.
5.6 Discussion
On the basis of above empirical results and theoretical aspects of the topic, the
economic scenario and tax system in Pakistan, it is imperative to analyze and see
whether the tax incentives in the country have any positive impact on investments in
the country or not. The time series data used for this purpose comprised data on
domestic investment (DI), foreign direct investment (FDI), and corporate tax rate
(CTR) and tariff rate for the period of 25 years (1990-2014). It is worthy to highlight
on the outset of analysis that tax system in Pakistan does not deny national treatment
for foreign firms. This argument gets its strength from the Foreign Private Investment
(Promotion and Protection) Act, 1976 under which foreign investment gets treatment
similar to that of investment by Pakistani citizens.
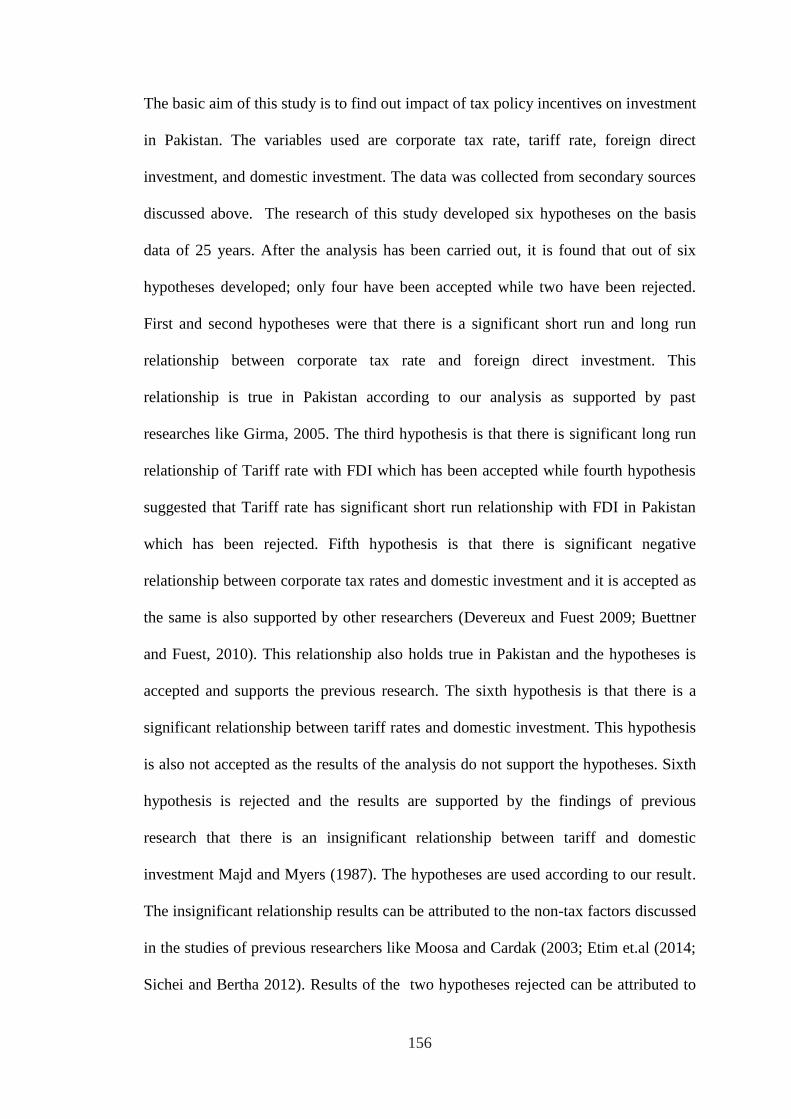
156
The basic aim of this study is to find out impact of tax policy incentives on investment
in Pakistan. The variables used are corporate tax rate, tariff rate, foreign direct
investment, and domestic investment. The data was collected from secondary sources
discussed above. The research of this study developed six hypotheses on the basis
data of 25 years. After the analysis has been carried out, it is found that out of six
hypotheses developed; only four have been accepted while two have been rejected.
First and second hypotheses were that there is a significant short run and long run
relationship between corporate tax rate and foreign direct investment. This
relationship is true in Pakistan according to our analysis as supported by past
researches like Girma, 2005. The third hypothesis is that there is significant long run
relationship of Tariff rate with FDI which has been accepted while fourth hypothesis
suggested that Tariff rate has significant short run relationship with FDI in Pakistan
which has been rejected. Fifth hypothesis is that there is significant negative
relationship between corporate tax rates and domestic investment and it is accepted as
the same is also supported by other researchers (Devereux and Fuest 2009; Buettner
and Fuest, 2010). This relationship also holds true in Pakistan and the hypotheses is
accepted and supports the previous research. The sixth hypothesis is that there is a
significant relationship between tariff rates and domestic investment. This hypothesis
is also not accepted as the results of the analysis do not support the hypotheses. Sixth
hypothesis is rejected and the results are supported by the findings of previous
research that there is an insignificant relationship between tariff and domestic
investment Majd and Myers (1987). The hypotheses are used according to our result.
The insignificant relationship results can be attributed to the non-tax factors discussed
in the studies of previous researchers like Moosa and Cardak (2003; Etim et.al (2014;
Sichei and Bertha 2012). Results of the two hypotheses rejected can be attributed to
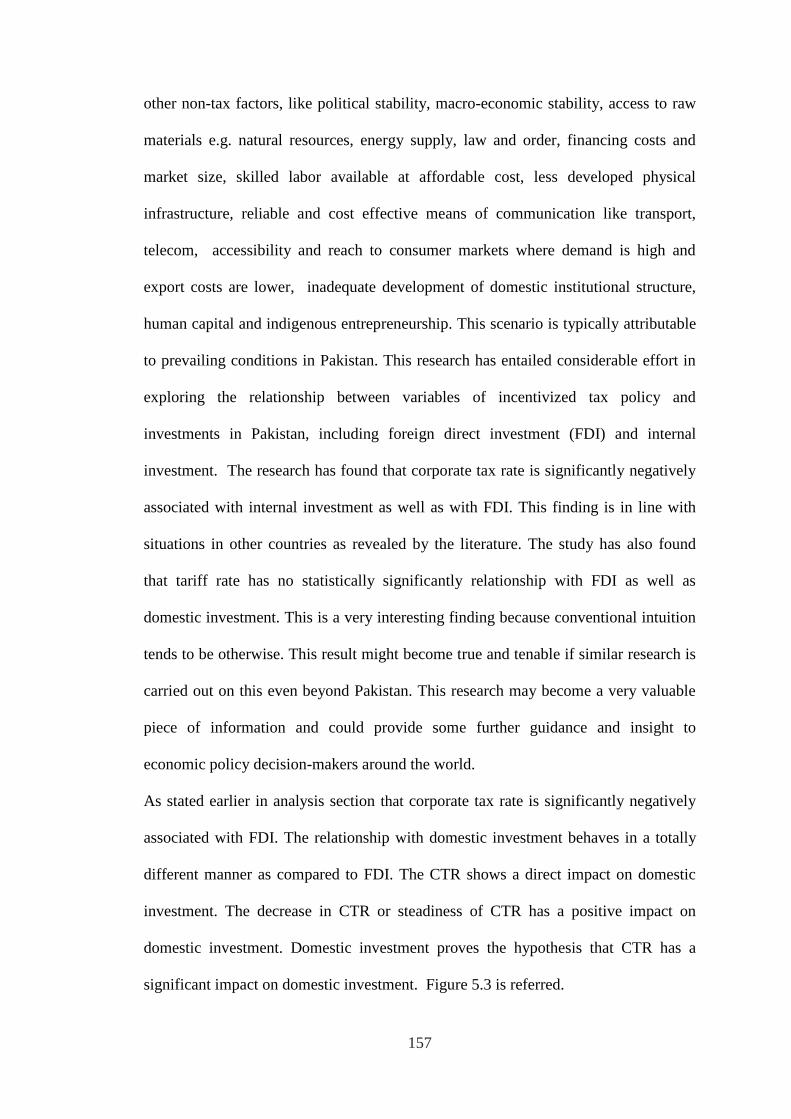
157
other non-tax factors, like political stability, macro-economic stability, access to raw
materials e.g. natural resources, energy supply, law and order, financing costs and
market size, skilled labor available at affordable cost, less developed physical
infrastructure, reliable and cost effective means of communication like transport,
telecom, accessibility and reach to consumer markets where demand is high and
export costs are lower, inadequate development of domestic institutional structure,
human capital and indigenous entrepreneurship. This scenario is typically attributable
to prevailing conditions in Pakistan. This research has entailed considerable effort in
exploring the relationship between variables of incentivized tax policy and
investments in Pakistan, including foreign direct investment (FDI) and internal
investment. The research has found that corporate tax rate is significantly negatively
associated with internal investment as well as with FDI. This finding is in line with
situations in other countries as revealed by the literature. The study has also found
that tariff rate has no statistically significantly relationship with FDI as well as
domestic investment. This is a very interesting finding because conventional intuition
tends to be otherwise. This result might become true and tenable if similar research is
carried out on this even beyond Pakistan. This research may become a very valuable
piece of information and could provide some further guidance and insight to
economic policy decision-makers around the world.
As stated earlier in analysis section that corporate tax rate is significantly negatively
associated with FDI. The relationship with domestic investment behaves in a totally
different manner as compared to FDI. The CTR shows a direct impact on domestic
investment. The decrease in CTR or steadiness of CTR has a positive impact on
domestic investment. Domestic investment proves the hypothesis that CTR has a
significant impact on domestic investment. Figure 5.3 is referred.
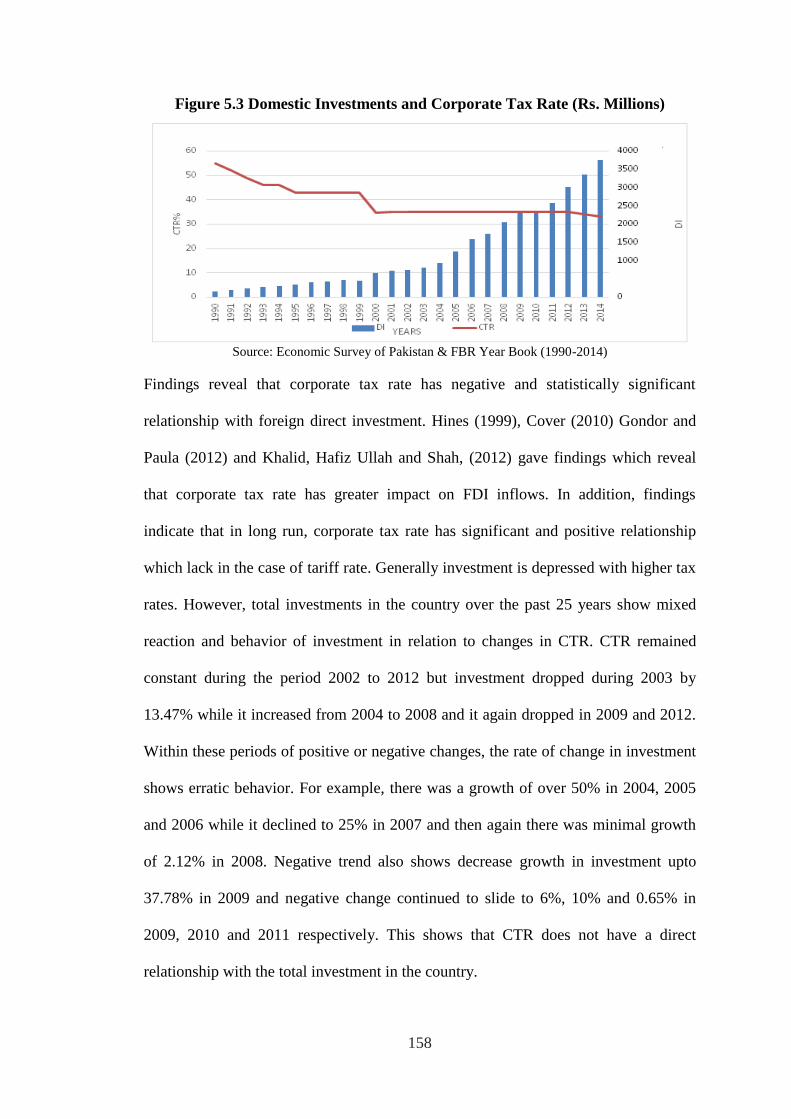
158
Figure 5.3 Domestic Investments and Corporate Tax Rate (Rs. Millions)
Source: Economic Survey of Pakistan & FBR Year Book (1990-2014)
Findings reveal that corporate tax rate has negative and statistically significant
relationship with foreign direct investment. Hines (1999), Cover (2010) Gondor and
Paula (2012) and Khalid, Hafiz Ullah and Shah, (2012) gave findings which reveal
that corporate tax rate has greater impact on FDI inflows. In addition, findings
indicate that in long run, corporate tax rate has significant and positive relationship
which lack in the case of tariff rate. Generally investment is depressed with higher tax
rates. However, total investments in the country over the past 25 years show mixed
reaction and behavior of investment in relation to changes in CTR. CTR remained
constant during the period 2002 to 2012 but investment dropped during 2003 by
13.47% while it increased from 2004 to 2008 and it again dropped in 2009 and 2012.
Within these periods of positive or negative changes, the rate of change in investment
shows erratic behavior. For example, there was a growth of over 50% in 2004, 2005
and 2006 while it declined to 25% in 2007 and then again there was minimal growth
of 2.12% in 2008. Negative trend also shows decrease growth in investment upto
37.78% in 2009 and negative change continued to slide to 6%, 10% and 0.65% in
2009, 2010 and 2011 respectively. This shows that CTR does not have a direct
relationship with the total investment in the country.
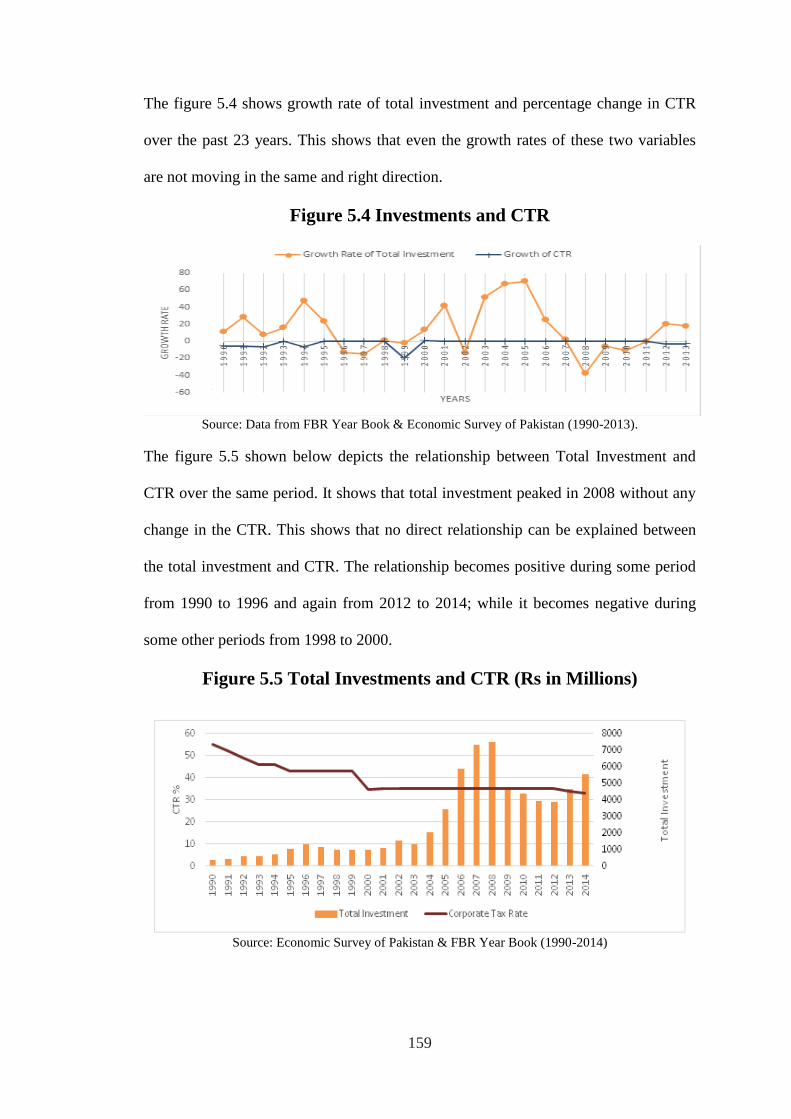
159
The figure 5.4 shows growth rate of total investment and percentage change in CTR
over the past 23 years. This shows that even the growth rates of these two variables
are not moving in the same and right direction.
Figure 5.4 Investments and CTR
Source: Data from FBR Year Book & Economic Survey of Pakistan (1990-2013).
The figure 5.5 shown below depicts the relationship between Total Investment and
CTR over the same period. It shows that total investment peaked in 2008 without any
change in the CTR. This shows that no direct relationship can be explained between
the total investment and CTR. The relationship becomes positive during some period
from 1990 to 1996 and again from 2012 to 2014; while it becomes negative during
some other periods from 1998 to 2000.
Figure 5.5 Total Investments and CTR (Rs in Millions)
Source: Economic Survey of Pakistan & FBR Year Book (1990-2014)
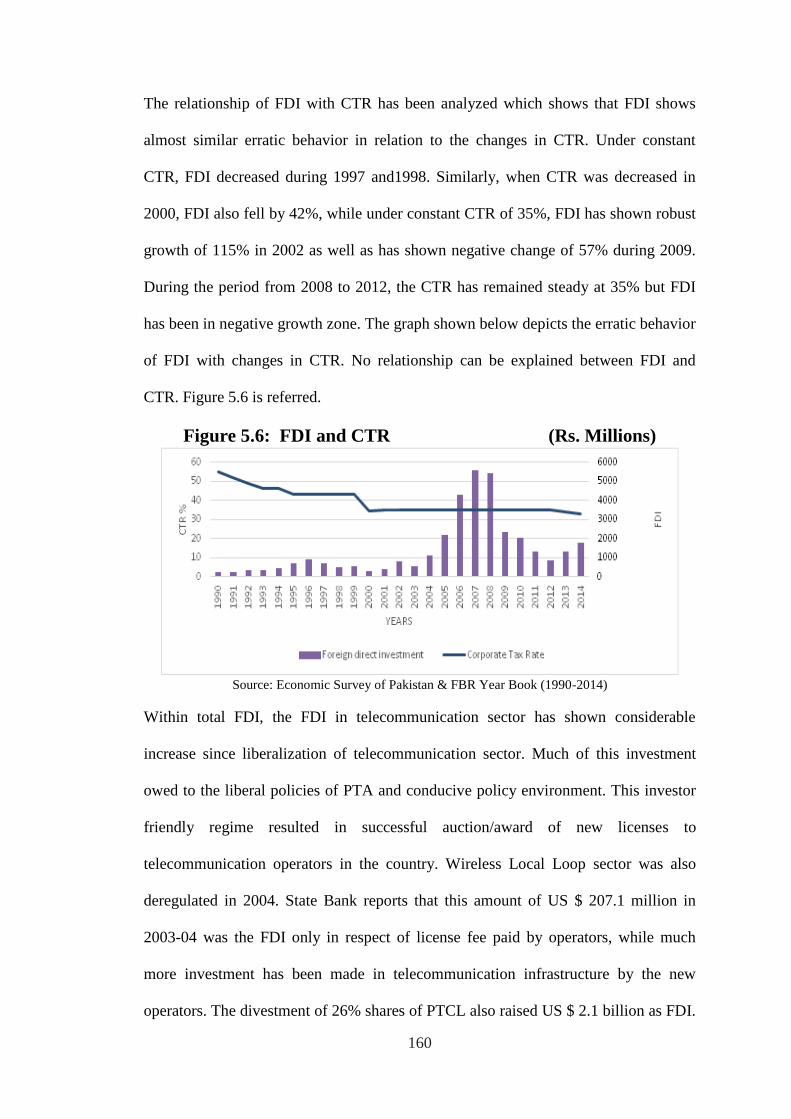
160
The relationship of FDI with CTR has been analyzed which shows that FDI shows
almost similar erratic behavior in relation to the changes in CTR. Under constant
CTR, FDI decreased during 1997 and1998. Similarly, when CTR was decreased in
2000, FDI also fell by 42%, while under constant CTR of 35%, FDI has shown robust
growth of 115% in 2002 as well as has shown negative change of 57% during 2009.
During the period from 2008 to 2012, the CTR has remained steady at 35% but FDI
has been in negative growth zone. The graph shown below depicts the erratic behavior
of FDI with changes in CTR. No relationship can be explained between FDI and
CTR. Figure 5.6 is referred.
Figure 5.6: FDI and CTR (Rs. Millions)
Source: Economic Survey of Pakistan & FBR Year Book (1990-2014)
Within total FDI, the FDI in telecommunication sector has shown considerable
increase since liberalization of telecommunication sector. Much of this investment
owed to the liberal policies of PTA and conducive policy environment. This investor
friendly regime resulted in successful auction/award of new licenses to
telecommunication operators in the country. Wireless Local Loop sector was also
deregulated in 2004. State Bank reports that this amount of US $ 207.1 million in
2003-04 was the FDI only in respect of license fee paid by operators, while much
more investment has been made in telecommunication infrastructure by the new
operators. The divestment of 26% shares of PTCL also raised US $ 2.1 billion as FDI.

161
All these steps resulted in growth in telecommunication sector from US $6.1 million
to US $1905.1 from 2002 to 2006, which dropped to US $374 million in 2010. FDI in
this sector remained high during 2006 to 2008. The overall slowdown in the economy
also had an impact on this sector, but despite that this sector witnessed growth in FDI.
Table 5.10 is referred.
Table 5.10 FDI in Telecommunication Sector Period FDI in Telecom (US
$ million)
Total FDI (US $
million)
Telecom Share (%)
2001-02 6.1 484.7 1.26
2002-03 13.5 798 1.69
2003-04 207.1 949.4 21.8
2004-05 494.4 1,524 32.4
2005-06 1,905 3,521 54.1
2006-07 1,824 5,140 35.5
2007-08 1,438 5,410 26.6
2008-09 815 3,720 21.9
2009-10 374 2,199 17 Source: Pakistan Telecommunication Authority (2001-2010)
This robust growth and investment in the telecommunication sector took place even in
the presence of heavy indirect taxation for this sector. Regional comparison of this
sector shows that telecom sector pays taxes upto 3.2% of total tax collection and 1.8%
to GDP in India whereas this ratio in Pakistan is 2.7% to GDP and taxes share is.
6.5% of total tax collection. It transpires that this sector is bearing greater tax burden
than in neighboring countries except in Bangladesh where taxation in this sector is
about 9.7%. of total tax revenues. FDI has generally resulted in improved efficiency
of domestic players. This scenario has been witnessed in the telecommunication
sector of Pakistan where entry of International Players like Mobilink, Telenor, Warid,
and Chinese Company Zong led to improved service delivery and expansion of the
network and coverage.
The growth rates of total investment do not have any significantly positive impact due
to change in tariff rates. It shows that decrease in tariff rate initially had a minor
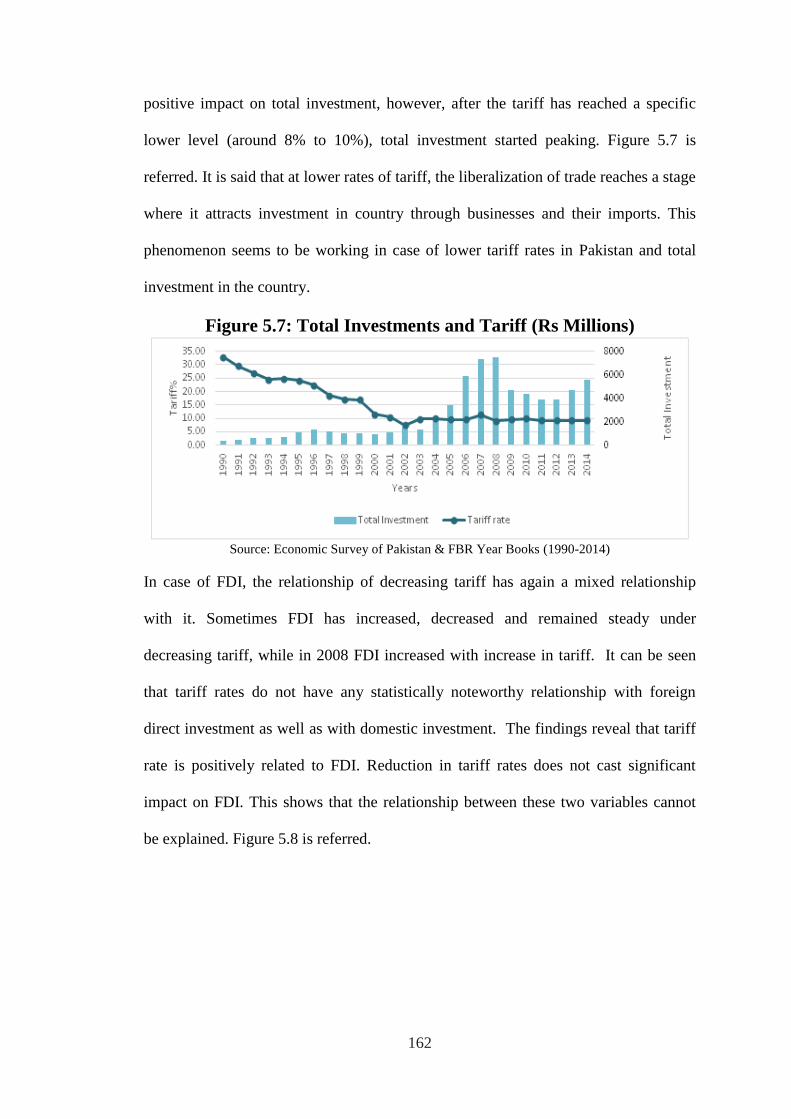
162
positive impact on total investment, however, after the tariff has reached a specific
lower level (around 8% to 10%), total investment started peaking. Figure 5.7 is
referred. It is said that at lower rates of tariff, the liberalization of trade reaches a stage
where it attracts investment in country through businesses and their imports. This
phenomenon seems to be working in case of lower tariff rates in Pakistan and total
investment in the country.
Figure 5.7: Total Investments and Tariff (Rs Millions)
Source: Economic Survey of Pakistan & FBR Year Books (1990-2014)
In case of FDI, the relationship of decreasing tariff has again a mixed relationship
with it. Sometimes FDI has increased, decreased and remained steady under
decreasing tariff, while in 2008 FDI increased with increase in tariff. It can be seen
that tariff rates do not have any statistically noteworthy relationship with foreign
direct investment as well as with domestic investment. The findings reveal that tariff
rate is positively related to FDI. Reduction in tariff rates does not cast significant
impact on FDI. This shows that the relationship between these two variables cannot
be explained. Figure 5.8 is referred.
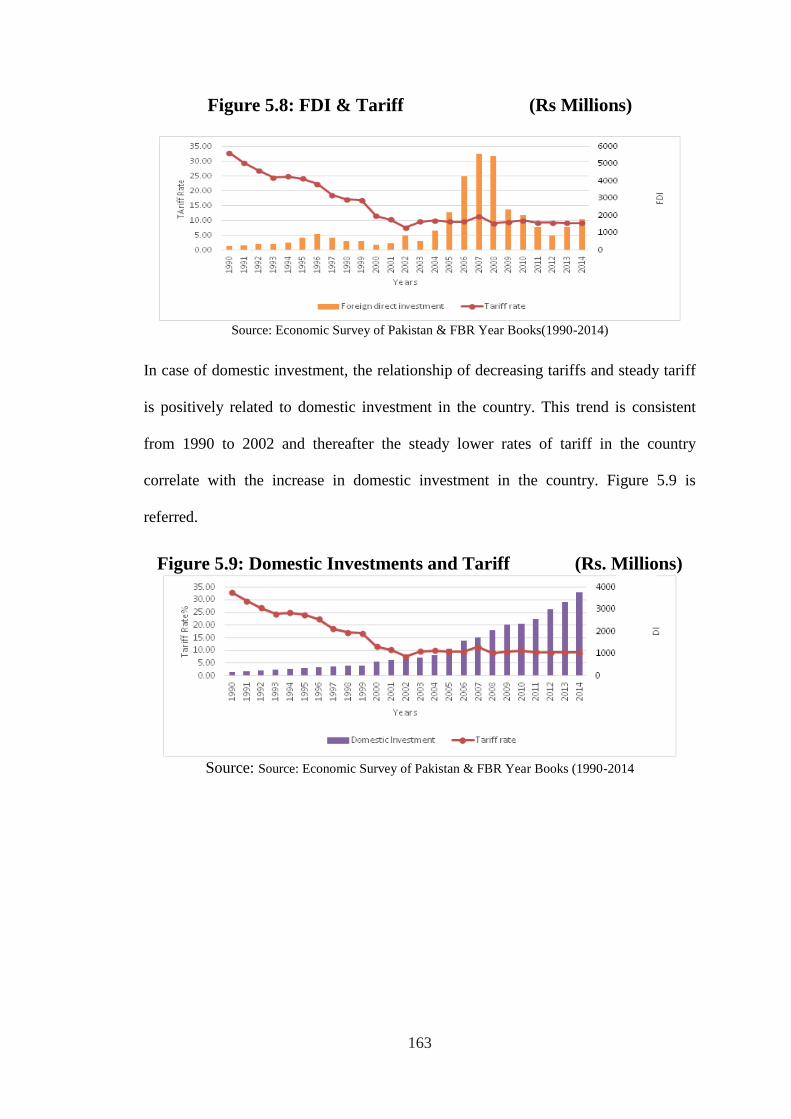
163
Figure 5.8: FDI & Tariff (Rs Millions)
Source: Economic Survey of Pakistan & FBR Year Books(1990-2014)
In case of domestic investment, the relationship of decreasing tariffs and steady tariff
is positively related to domestic investment in the country. This trend is consistent
from 1990 to 2002 and thereafter the steady lower rates of tariff in the country
correlate with the increase in domestic investment in the country. Figure 5.9 is
referred.
Figure 5.9: Domestic Investments and Tariff (Rs. Millions)
Source: Source: Economic Survey of Pakistan & FBR Year Books (1990-2014
164
CHAPTER 6
CONCLUSION AND RECOMMENDATIONS
The purpose of this chapter is to present the conclusion and recommendations arising
out of study. Accordingly section one consists of conclusion and section two contains
recommendations made by the researcher on the basis of findings of the study
conducted to measure the impact of tax incentives on FDI inflow and growth of
domestic investments in Pakistan.
6.1 Conclusion
Economists have been fascinated by the continuing trends during the last three
decades regarding inflow of foreign direct investment and its central place and
importance as major source of financing and resource mobilization. Economists have
been astounded by this phenomenon and have become curious to discover possible
causes of increasing trend and increasing inequality in FDI distribution worldwide.
Some of the attempts have been made to probe the governments’ policies and
economic environment in global entities in order to find the answers to the problems
of inequality in global distribution of FDI. The findings of such studies reveal that
there has been unequal and uneven distribution of FDI between developed and
economically developing countries. The most glaring and wider disparities of FDI
distribution among the developing countries has struck and disturbed the economists
and policy makers even more than the global inequality of FDI distribution. These
trends have been profoundly prominent and striking in some African, Caribbean,

165
Latin American and Asian countries. The economic development of a country is a
process where various factors act in cohesion towards achieving the desired goal.
These factors include investment in the human and physical capital and effective
governance. Different sets of incentives affect the cost of capital and hence affect
investment differently. One of the most significant factors hampering economic
growth and development in Pakistan is the low level of investment.
Tax policy of governments has always been to introduce steps to attract and increase
investment (both domestic and foreign) in the country. Many tax incentives have been
announced by the successive governments to influence domestic investors’
investment decisions like simplification tax procedures, self-assessment schemes,
lower taxes, focused subsidies, tax and customs exemptions, tax incentives, tax
holidays, tax amnesties and mutual consultations for changes in tax policies annually.
In addition, governments have been trying to provide better law and order
environment in the country. Consistent efforts have been going on to overcome
energy crisis in Pakistan. In addition, huge expenditure is being made to improve
physical infrastructure of roads, ports, airports, electrify distribution network,
communication channels, and special economic zones, banking networks and many
investment friendly amenities in order to attract local and foreign investors. CPEC is
the latest major initiative being implemented with help of friendly country of China
which is turning out to be a game changer for Pakistan, China and the whole region
for future huge potential of investments leading to economic development in the
whole region.
This study has been conducted by using secondary data for the period of 25 years
from 1990 to 2014. Attempt has been made for scouting the correlation between
investment and tax policy and reforms. The study has utilized time series data analysis
166
technique involving multiple regressions for analyzing the impacts of corporate tax
rate on FDI (in aggregate) and see the impacts of tax exemptions (tax rates and
customs tariffs) on FDI and domestic investment (in aggregate). The researcher
adopted a model comprising variables of incentivized tax policy like corporate tax
rates and custom tariffs to analyze its impact on FDI and domestic investment in
Pakistan in aggregate. The undertaken study uses both regression analysis and ARDL
approach. Impact of Tax policy incentives on Investment in Pakistan was analyzed
by using e variables like corporate tax rate, tariff rate, foreign direct investment, and
domestic investment. The data was collected from secondary sources. Four
hypotheses on the basis data of 25 years were developed and tested. The
quantitative/empirical analysis have shown that out of four hypotheses developed;
first two have been accepted while the latter two have not been accepted. First
hypothesis was developed that there is a significant relationship between corporate tax
rate and foreign direct investment. This relationship is true in Pakistan according to
our analysis as supported by past researches. The second hypothesis is that there is
significant relationship between corporate tax rates and domestic investment which is
also supported by other researchers. This relationship also holds true in Pakistan and
the hypotheses is accepted and supports the previous research. The third hypothesis is
that there is a significant relationship between tariff rates and foreign direct
investment but third hypothesis has been rejected. The fourth hypothesis is that there a
significant relationship between tariff rates and domestic investment. This hypothesis
is also not accepted as the results of the analysis do not support the hypotheses and the
fourth hypothesis has also been rejected. The insignificant relationship of tariff rates
with domestic investment and FDI can be attributed to the non-tax factors discussed
in the studies of previous researchers. Results of the last two hypotheses can be

167
attributed to other non-tax factors, like political stability, macro-economic stability,
access to raw materials e.g. natural resources, energy supply, law and order, financing
costs and market size, skilled labor available at affordable cost, less developed
physical infrastructure, reliable and cost effective means of communication like
transport, telecom, accessibility and reach to consumer markets where demand is
high and export costs are lower, inadequate development of domestic institutional
structure, human capital and indigenous entrepreneurship. This scenario is typically
attributable to prevailing conditions in Pakistan. This research has entailed
considerable effort in exploring the relationship between variables of incentivized tax
policy and investments in Pakistan, including foreign direct investment (FDI) and
internal investment. The research has found that corporate tax rate is significantly
negatively associated with internal investment as well as with FDI. This finding is in
line with situations in other countries as revealed by the literature. The study has also
found that tariff rate has no statistically significantly relationship with FDI as well as
domestic investment. This is a very interesting finding because conventional intuition
tends to be otherwise. This result might become true and tenable if similar research is
carried out on this even beyond Pakistan. This research may become a very valuable
piece of information and could provide some further guidance and insight to
economic policy decision-makers around the world.
Major Findings of the research
The findings of this study reveal that corporate tax rate has a significantly negative
relationship with domestic investment. The CTR shows a direct impact on domestic
investment. The reduction in CTR casts a positive impact on domestic investment.
The hypothesis is proved that CTR has a significant and negative relationship with
168
domestic investment. In addition, it is found out that tariff rate has no significant
relationship with domestic investment as well as with FDI.
Moreover, it has been found that corporate tax rate has negative and statistically
significant relationship with foreign direct investment. Corporate tax rate has greater
impact on FDI inflows. Investment is negatively affected by higher tax rates. No
significant relationship of FDI has been found with tariff rates. The research has also
revealed that tariff rates do not have any statistically noteworthy relationship with
foreign direct investment as well as with domestic investment. Decrease in tariff rates
has cast no significant impact on FDI as well as domestic investment.
To sum up the findings, it has been empirically proved that corporate tax rate is
significantly negatively associated with domestic investment as well as with FDI. This
finding is in line with situation in other countries. It is also found that tariff rate has no
statistically significantly relationship with FDI as well as domestic investment. This is
a very unusual finding because conventional intuition points to the contrary. It can
also be expected to true in other countries if some study is also carried out to explore
it. This piece of research can be a very useful addition to existing body of knowledge
and could provide some further insight to the economic policy decision-makers
around the globe.
This study has established that inflow of FDI in a particular country, inter alia,
promotes and accelerates economic growth by new employment opportunities and
technology transfers. For that reason, governments embark upon fiscal policies in
order to attract capital from foreign investors. Therefore, many developing countries
have reformed their fiscal policies to increase foreign investment. In the fiscal policy
reform initiatives, special focus is placed on tax policy reform. Reduction of
Corporate Tax Rates (CTR) is a tax policy measure and instrument which has been
169
found to be of greater significance to attract FDI. CTR has been found to cast greater
influence in attracting FDI. Lower CTRs have generally been found to positively
impact the investment and encourage the foreign investors, especially Multi-National
Companies, to make investment and location decisions in such countries.
Governments expect to attract more and more foreign investments in these countries
after they have rationalized and reduced significantly the corporate Income Tax rates.
Moreover, CTR is an important variable to influence MNEs’ investment and location
decisions which also encourage governments to reduce, review and revise their fiscal
policies. It is incumbent upon the policy makers of such countries to create investment
friendly business environment through competitiveness and rationalized tax policies
to encourage more inflows of FDI. FDI has a positive impact on economic growth and
income levels and also helps government to generate employment opportunities and
additional indirect taxes. To sum up the conclusion, the following has been the main
findings of the study:
Corporate tax rate has significant short run and long run relationship with
foreign direct investment. Corporate tax rate has greater impact on FDI
inflows. This relationship is true in Pakistan according to our analysis as
supported by past researches like Girma (2005). Investment is negatively
affected by higher tax rates and vice versa.
Tariff rates do not have any statistically significant long term relationship with
foreign direct investment but has short term relationship with FDI which is
partially in line with research studies like Majeed, & Ahmad (2009).
The findings of this study reveal that corporate tax rate has a significantly
negative relationship with domestic investment in Pakistan context. The
reduction in CTR casts a positive impact on domestic investment which is in
170
line with the previous research studies of (Devereux and Fuest 2009; Buettner
and Fuest, (2010).
Tariff rate has no significant relationship with domestic investment in
Pakistan which can be attributed to nontax factors.
6.2 Recommendations
Encouraging foreign direct investment and domestic investment through infrastructure
development or giving security of return is very difficult. The best option is to offer
substantial tax incentives to the foreign investors. It should be thoroughly deliberated
upon and should be transparent and competitive and implemented in letter and spirit
without any political or policy interference/disruptions.
The way forward is broadening of narrow tax base. Tax to GDP ratio needs to be
enhanced to bring it at par with international or at least to the regional countries. Writ
of the Government is to be established and economy should be documented and
informal economy is to be brought into formal economy. Tax policies need to be fair
and transparent without any influence of the interested lobbies. This can happen
through efficient and strong leadership with stern political will. The trust deficit
existing amongst domestic investors regarding persistent governmental policies
should be removed.
The consistency of tax incentives needs to be ensured along with professional training
and integrity development of tax machinery. Inequitable exemptions should be
removed. This will not only increase the revenue, which in turn can be used for
infrastructural development for domestic investor, but also shall remove uncertainty
and discrimination amongst investors. Tax procedures should be simplified for
domestic investor as well as foreign investors. Tax auditing system may also be made
credible, effective and transparent to ensure tax compliance and equity to promote
171
fearless and conducive business environment. The comprehensive documentation of
economy may be made with the creation of comprehensive database for sharing
between different organizations.
The consistency and credibility in government policies is very important for attracting
foreign investment and domestic investment. In Bangladesh, textile industry is
prospering only through the persistent and credible tax incentives that have been
ensured consistently by the government. It had made best use of GSP plus status for
their exports to European Union but Pakistani textile investors, though very
competitive and competent, have not been able to bring the desired benefits to the
country due to poor tax policies measures, lack of desired infrastructure support and
other obstacles, like increased cost of doing business with energy crisis leading to less
competitiveness in international market. Governmental support through tax incentives
could have been a major encouragement to remain competitive in the world leading to
more domestic investment and increased exports brining in foreign exchange.
Government should support by establishing infrastructure for promoting investments.
After launching and implementation of CPEC, the prospects are very bright for
investment in the shape of economic processing zones and special economic zones.
There should be an integrated and comprehensive strategic policy in this regard and
tax incentives like tax holidays etc. should be offered to domestic investors.
Tax incentives in the form of tax holidays, EPZs, double taxation treaties and lower
tax and tariff rates should be continued and more industry specific incentives should
be offered. FDI needs to be focused more in the list of national priorities because of
its positive correlation with economic growth and other beneficial effects.
Comparative position of cost of inputs of the regional countries may be kept in view
while deciding the price structure e.g. cost of electricity vis-à-vis Bangladesh, Sri
172
Lanka etc. The image of Pakistan can be promoted by our commercial counselors in
foreign missions as an investment friendly country.
It has to be ensured that there are no sudden and surprise shifts in policies and
consistency and continuity of such policies should be ensured in the long term. Core
competencies and comparative advantage of the business environment in the country
needs to be highlighted and incentives may be ensured for domestic and foreign
investors.
In the foregoing pares, it has been attempted to discuss recommendations to promote
investment in Pakistan in general covering almost all the areas affecting investment,
in addition to tax incentives to bring out a broad and holistic scenario. There are some
concrete and focused recommendations given below for promoting domestic
investment and FDI in Pakistan which have arisen out of the research analysis and
findings:
i. Tax incentives need to be viewed as a component of larger picture of
Pakistan’s vision and policy for the economy which aims at creating a fair and
competitive economy. There is need to bear the short term disadvantages
arising out of tax incentives in shape of complicated systems, inequities and
foregone revenue. In market segments, tax policy needs to be implemented
with a view to eradicate inefficiencies and inequities.
ii. Pakistan has never undertaken any study to analyze cost-benefit assessment of
tax policy and incentives. This becomes even more important when the social
costs and benefits of any such tax policy and incentive has to be evaluated.
Pakistan should undertake an economic cost-benefit analysis as well as a
social cost-benefit analysis of its tax incentives. Economic cost-benefit
analysis will help to see whether the tax incentives have been successful in
173
achieving the stated objectives of economic growth with special focus on
investment, domestic and foreign. Social cost-benefit analysis is required to
see whether these incentives have resulted in overall socio-economic
development and improvement in living conditions of the people.
iii. The tax incentives should not be channeled in such a manner that it becomes
profitable and easier for domestic investors to route their investments through
foreign entities in shape of joint ventures to benefit from tax incentives. This
will result in undesirable loss for the economy in shape of loss of revenue and
repatriation of profits.
iv. The tax expenditure analysis undertaken by the FBR over the past few years
has only been a general estimate of the revenue foregone against the
concessional and exemption related SROs. This estimate needs to be replaced
with an accurate calculation of revenue foregone as well as other economic
costs in the whole economy. This tax expenditure then needs to be pictured in
terms of “marginal cost of public funds” to see how a marginal rupee spent by
the government on tax incentive to attract FDI competes with other uses of
funds such as increase in expenditure on health and education.
v. Tax incentives need to be shifted from profit-based approach to expenditure-
based approach as it results in greater economic activity and benefits.
Incentives should be used to promote business and industry by focusing on
expenditure on research and development to bring in innovation and
technological development.
vi. Decrease in corporate tax rate results in an insignificant domestic investment
but lower corporate tax rate has significant relationship with FDI. Therefore,
government should take steps to further rationalize the tax rates, so that
174
economic activities can be accelerated in the country by attracting greater
inflows of FDI.
vii. Agreements with foreign investors should also safeguard interest of this
country, such as:-
a) FDI contributes to saving and investment and it helps in
overcoming balance of payments problem of the country.
b) Investors are not remitting excessive profits to their home
country.
c) There should be a deletion program in place and transfer of
technology to Pakistan is also required being a related
benefit of FDI.
d) FDI should not result in crowding out of local businesses.
e) Foreign investors should promote use of local inputs
through their backward and forward linkages and lead to
exposure of local management to international markets.
viii. While devising the incentive structure for investment it has to be ensured that
it is not done as an isolated measure but it should be well integrated into the
whole system and other government policies and reforms to avoid duplication
and to reap the maximum benefits for the country.
ix. Extremism needs to be eliminated simultaneously and people of deprived
areas should be rehabilitated and brought into the mainstream education and
health systems so that they may also benefit from the national development.
Improvement in law and order situation and safety/security of investment
should remain number one priority of the Government.
x. The infrastructure development may be focused by the government in the
country, especially the target areas of investment. Infrastructure programs
175
including road network, provision of affordable and uninterrupted utilities of
gas, electricity and water and communication networks will equally support
and attract the foreign and domestic investors for making their investment and
locations decisions, inter-alia, the tax policy incentives, leading to growth in
domestic and foreign investment in Pakistan.
xi. Regulatory framework in Pakistan has been very weak which doesn’t provide
confidence to the investors, both domestic and foreign. There is a dire need to
reform the existing regulatory regime which should be directed in such a
manner that it helps to provide ease of doing business and ensure consistency
of policies to provide a business friendly environment in Pakistan.
6.3 Practical Implication
This study has tried to provide a clear cut direction for future tax policy and reforms
needed in a well- focused and result-oriented manner. Thus, this study undertakes to
measure the effect of tax policies on investments in Pakistan during the last 25 years.
The analysis period of the study is from fiscal year 1990 to fiscal year 2014. It is
regarded as breakthrough effort in the area and is useful for the government,
academia, and donor agencies policy formulation and implementation. There have
been research on various other aspects of tax policy but no specific study has been
carried out to prove the relationship and influence of tax incentives, as part of tax
policy measure, on investment in Pakistan, so we may say that this study has
significant practical implications as the focus has been on concrete and practical
empirical foundations. Simultaneously, many determinants of investment have been
studied but this study has exclusively studied how tax policy affects investment in
Pakistan which may provide empirical evidence for further policy changes in the
country. It would provide insight to the government that tax policy should only be
focused on revenue collection but it should be holistically planned and implemented
176
with a view to promote investment for improvement of overall economic indicators
of the country.
6.4 Future Research Directions
Future research should focus more on sectoral and country specific foreign direct
investment and on domestic investment growth in Pakistan. More empirical studies
may also be conducted on tax policy reforms and their impact on FDI and DI.
Hitherto, major research has been undertaken on the topic has focused on Asian and
Latin American countries and there are not many studies regarding South Asia, and
particularly Pakistan. A future empirical study may be conducted by taking other
variables like tax holidays, tax exemptions, and impact of non-tax factors on
investments. Moreover, another empirical research should be conducted to further
explore the causes of the outcome of this study, like customs tariff rates have no
significant relationship with DI and FDI in Pakistan and this can further be explored
in some other developing or developed county. A comparative study of Pakistan in a
panel of some regional counties can be undertaken to study the impact of fiscal
policies on investment and also on GDP growth in Pakistan vis-à-vis other regional
countries.
6.4 Limitations of the Study
Although the research has achieved the desired objectives but still there are some
limitations. Lack of sufficient and access to relevant data has been a major challenge for
those venturing an empirical research on tax incentives and FDI/DI in Pakistan. Lack of
and access to data limits the scope, range, analytical strength and concrete results out
of the analysis of study. Sample size can create hindrances to establish a true
relationship between various variables. In this study, the sample size has been smaller
than it could have been if verifiable and quantifiable data was available on other
177
variables of tax incentives like exemptions, tax holidays and double tax treaties. This
is one the main limitation of this study. Another limitation has been to find most
relevant prior studies in the area which also limits the proper exploration of the
research problem. Another major limitation faced by the researcher has been the lack
of earlier empirical studies in Pakistan in this area which could have provided basis
for literature review in Pakistan context as most literature reviewed in this study has
been produced in the context of other countries.
178
REFERENCES
Abdul F M Shamsuddin (1994). Economic Determents of Foreign Direct Investment in less
developed countries. The Pakistan Development Review, 33(1), spring (1994), pp41-
51
Abel, A. B., & Blanchard, O. J. (1986). Investment and sales: Some empirical evidence.
Abizadeh, S. (1979). Tax ratio and the degree of economic development. Malayan Economic
Review, 24(1), 21-34.
Adegbite, E. (2012). Corporate governance regulation in Nigeria. Corporate Governance: The
international journal of business in society, 12(2), 257-276.
Agarwal, J. P. (1980). Determinants of foreign direct investment: A survey.
Weltwirtschaftliches Archive, 116(4), 739-773.
Agliardi, F., Crosta, G., & Zanchi, A. (2001). Structural constraints on deep-seated slope
deformation kinematics. Engineering Geology, 59(1), 83-102.
Ahmad, E., & Stern, N. H. (1991). The theory and practice of tax reform in developing
countries. Cambridge University Press.
Ahmad, E., and Malik, A. (2009). Financial Sector Development and Economic Growth: An
Empirical Analysis of Developing Countries. Journal of Economic Cooperation and
Development, 30(1), 17-40.
Akkina, K. R., &Celebi, M. A. (2002). The determinants of private fixed investment and the
relationship between public and private capital accumulation in Turkey. The Pakistan
Development Review, 243-254.
Alfaro, L., Chanda, A., Kalemli-Ozcan, S., &Sayek, S. (2006). How does foreign direct
investment promote economic growth? Exploring the effects of financial markets on
linkages (No. w12522). National Bureau of Economic Research.
Alm, J., McClelland, G. H., & Schulze, W. D. (1992). Why do people pay taxes? Journal of
public Economics, 48(1), 21-38.
Altshuler, R., &Goodspeed, T. (2002). Follow the leader. Evidence on European and US tax.
Altshuler, R., Newlon, T. S., &Slemrod, J. (1993). The effects of US tax policy on the
income repatriation patterns of US multinational corporations. In Studies in
international taxation (pp. 77-116). University of Chicago Press.
179
Alvarez, R., Terrados, N., Ortolano, R., Iglesias-Cubero, G., Reguero, J. R., Batalla, A. &
Alvarez, V. (1998). Genetic variation in the renin-angiotensin system and athletic
performance. European journal of applied physiology, 82(1-2), 117-120.
Amjad, R., & Kemal, A. R. (1997). Macroeconomic policies and their impact on poverty
alleviation in Pakistan. The Pakistan Development Review, 39-68.
Anis, M. I., Khan, M. Z., Inam, J., &Azmatullah, R. (2008, January). Comparison between
the IEEE 802.11 x Standards of VoIP Using the CBR and VBR Voice Schemes. In
Radio and Wireless Symposium, 2008 IEEE (pp. 207-210). IEEE.
Anyanfo, A.M.O., (1996). Public Finance in a Developing Economy: The Nigerian Case.
Department of Banking and Finance, University of Nigeria, Enugu Campus. Enugu.
Anyanwu, J. C. (2012). Why does foreign direct investment go where it goes? new evidence
from African countries. Annals of Economics and Finance, 13(2), 425-462.
Asiedu, E. (2002). On the determinants of foreign direct investment to developing countries:
is Africa different? World development, 30(1), 107-119.
Auerbach, A. J., & Hines Jr, J. R. (1987). Anticipated tax changes and the timing of
investment. In The effects of taxation on capital accumulation (pp. 163-200).
University of Chicago Press.
Auerbach, A. J., & Hines, J. R. (1986). Investment tax incentives and frequent tax reforms.
Auerbach, A. J., & Hines, J. R. (1988). Investment tax incentives and frequent tax reforms.
Azémar, C., & Delios, A. (2008). Tax competition and FDI: The special case of developing
countries. Journal of the Japanese and International Economies, 22(1), 85-108.
Azhar, B. A., and S. M. Sharif (1974) The Effects of Tax Holiday on Investment Decision:
An Empirical Analysis. The Pakistan Development Review 13:4 409–432.
Azubike, J. U. B. "Challenges of Tax Authorities." Tax payers in the management of Tax
Reform process (2009).
Babatunde, S. A., & Dandago, K. I. (2014). Internal control system deficiency and capital
project mis-management in the Nigerian public sector. Procedia-Social and
Behavioral Sciences, 164, 208-221.
Baldwin, Robert (1992) Measurable Dynamic Gains from Trade. Journal of Political
Economy 100 (1) 62–174.
Ball, L., Mankiw, N. G., Romer, D., Akerlof, G. A., Rose, A., Yellen, J., & Sims, C. A.
(1988). The new Keynesian economics and the output-inflation trade-off. Brookings
papers on economic activity, 1988(1), 1-82.
Bano, Sayeeda, and Jose Tabbada. "Foreign Direct Investment Outflows: Asian Developing
Countries." Journal of Economic Integration (2015): 359-398.
180
Barlev, B., & Levy, H. (1975). Loss carryback and carryover provision: effectiveness and
economic implications. National Tax Journal, 173-184.
Barro, R. J. (1979). A capital market in an equilibrium business cycle model.
Barro, R., & Martin, S. I. (1995). X., 1995. Economic growth. Boston, MA.
Bartik, Timothy J., 1994. "Jobs, Productivity, and Local Economic Development: What
Implications Does Economic Research Have for the Role of Government?" National
Tax Journal, National Tax Association, vol. 47(4), pages 847-61, December
Bénassy-Quéré, A., Fontagné, L., &Lahrèche-Révil, A. (2005). How does FDI react to
corporate taxation? International Tax and Public Finance, 12(5), 583-603.
Bizer, D. S., & Judd, K. L. (1989). Taxation and uncertainty. The American Economic
Review, 79(2), 331-336.
Blomström, M., Kokko, A., &Mucchielli, J. L. (2003). The economics of foreign direct
investment incentives (pp. 37-60). Springer Berlin Heidelberg.
Blonigen, B. A. (2005). A review of the empirical literature on FDI determinants. Atlantic
Economic Journal, 33(4), 383-403.
Blonigen, B. A., & Davies, R. B. (2004). The effects of bilateral tax treaties on US FDI
activity. International Tax and Public Finance, 11(5), 601-622.
Blonigen, B. A., & Davies, R. B. (2004). The effects of bilateral tax treaties on US FDI
activity. International Tax and Public Finance, 11(5), 601-622.
Bloom, N., Bond, S., & Van Reenen, J. (2007). Uncertainty and investment dynamics. The
review of economic studies, 74(2), 391-415.
Böhm, H., Funke, M., & Siegfried, N. A. (2000, August). Discovering the link between
uncertainty and investment-microeconometric evidence from Germany. In
Econometric Society World Congress 2000 Contributed Papers (No. 0112).
Econometric Society.
Bolnick, D. I. (2004). Can intraspecific competition drive disruptive selection? An
experimental test in natural populations of sticklebacks. Evolution, 58(3), 608-618.
Bond E. and L. Samuelson (1986). Tax Holidays as Signals, The American Economic Review.
76(4), 820-26.
Bond, Eric, and Stephen Guisinger (1985) Investment Incentives as Tariff Substitutes: A
Comprehensive Measure of Protection. Review of Economics and Statistics February.
Bordignon, M., Giannini, S., &Panteghini, P. (2001). Reforming business taxation: lessons
from Italy? International Tax and Public Finance, 8(2), 191-210.
Boskin, Michael J., and William G. Gale. 1987. New results on the effects of tax policy on
the international location of investment. In The effects of taxation on capital
accumulation, ed. Martin Feldstein. Chicago: University of Chicago Press.
181
Botric, V., and Skuflic, L. (2006).Main Determinants of Foreign Direct Investment in the
Southeast European Countries. Transition Studies Review, 13(2), 359-377.
Bovenberg, A. L., Graafland, J. J., & De Mooij, R. A. (2000). Tax reform and the Dutch
labor market: an applied general equilibrium approach. Journal of Public
Economics, 78(1), 193-214.
Brander, J. and Spencer, B. (1987). Foreign Direct Investment with Unemployment and
Endogenous Taxes and Tariffs. Journal of International Economics, 22, 257-279.
Buettner, T., &Fuest, C. (2010). The role of the corporate income tax as an automatic
stabilizer. International Tax and Public Finance, 17(6), 686-698.
Caves, R.E. (1971). International Corporations: The Industrial Economics of Foreign Direct
Investment.
Çeviş, İ., & Çamurdan, B. (2007). The economic determinants of foreign direct investment in
developing countries and transition economies. The Pakistan Development Review,
285-299.
Cheung, Y. W., & Qian, X. (2009). Empirics of China's outward direct investment. Pacific
Economic Review, 14(3), 312-341.
Chowdhury, A., & Mavrotas, G. (2005). FDI and growth: a causal relationship (No.
2005/25). Research Paper, UNU-WIDER, United Nations University (UNU).
Cleeve, E. (2008). How effective are fiscal incentives to attract FDI to Sub-Saharan Africa?.
The Journal of Developing Areas, 42(1), 135-153.
Commission of the European Communities (CEC), 1992, Report of the Committee of
independent experts on company taxation, (Ruding report), Brussels, March.
Cooper, M. G., & Knittel, M. J. (2010). The implications of tax asymmetry for US
corporations. National Tax Journal, 63(1), 33-62.
Countries. Economic Record, 38, 108-110. Reprinted in: J. H. Dunning (ed.). 1972.
Coyne E.J. (1994)"An Articulated Analysis Model for FDI Attraction into developing
Countries",
David C. Hartman (1982).Tax Policy and Foreign Direct Investment in the United States.
NBER National Bureau of Economic Research, Working Paper Series No. 967.
David G. Hartman (1984). Tax Policy and Foreign Direct Investment in the United States.
National Tax Journal, 37(4), 475-487
David W. Loree and Stephen E. Guisinger (1995).Policy and Non-Policy Determinants of
U.S. Equity Foreign Direct Investment. Journal of International Business Studies, 26
(2),281-299.
De Mello, L.R. (1997). FDI in Developing Countries and Growth: A Selective Survey. The
Journal of Development Studies, 34(1), 1-34.
182
De Mooij, R. A., &Ederveen, S. (2003). Taxation and foreign direct investment: a synthesis
of empirical research. International tax and public finance, 10(6), 673-693.
Demirhan, E., &Masca, M. (2008). Determinants of foreign direct investment flows to
developing countries: a cross-sectional analysis. Prague economic papers, 4(2008),
356-369.
DeMooij, Ruud A &Ederveen, Sjef (2001) : Taxation and Foreign DirectInvestment: A
Synthesis of Empirical Research, CESifo Working Paper, No. 588
Denisia, V. (2010). Foreign direct investment theories: An overview of the main FDI
theories. European Journal of Interdisciplinary Studies, (3).
Desai, Mihir A. & Foley, C. Fritz & Hines, James Jr., (2004) "Foreign direct investment in a
world of multiple taxes," Journal of Public Economics, Elsevier, vol. 88(12), pages
2727-2744
Devereux, M. B., & Smith, G. W. (1994). International risk sharing and economic
growth. International Economic Review, 535-550.
Devereux, M. P., & Griffith, R. (1998). Taxes and the Location of Production: Evidence from
a Panel of US Multinationals. Journal of public Economics. 68(3), 335-367.
Devereux, M. P., & Griffith, R. (2003). Evaluating tax policy for location
decisions. International Tax and Public Finance, 10(2), 107-126.
Devereux, M. P., &Fuest, C. (2009). Is the corporation tax an effective automatic
stabilizer? National Tax Journal, 429-437.
Devereux, M. P., Griffith, R., & Klemm, A. (2002). Corporate income tax reforms and
international tax competition. Economic policy, 17(35), 449-495.
Dharmapala, D., & Hines, J. R. (2009). Which countries become tax havens? Journal of
Public Economics, 93(9), 1058-1068.
Djankov, Simeon, Tim Ganser, Caralee McLiesh, Rita Ramalho, & Andrei Schleifer
(2010).The effect of corporate taxes on investment and entrepreneurship. American
Economic Journal: Macroeconomics 2(3): 31-64.
Domar, E. D., & Musgrave, R. A. (1944). Proportional income taxation and risk-taking. The
Quarterly Journal of Economics, 388-422.
Donnelly, M., & Young, A. (2002). Policy options for tax loss treatment: how does Canada
compare? Canadian Tax Journal, 50(2), 429-488.
Economic Survey of Pakistan, 2013-14. Ministry of Finance.
Economic Survey of Pakistan, 2014-15. Ministry of Finance.
Edwards, Sebastian (1993) Openness, Trade Liberalization, and Growth in Developing
Countries. Journal of Economic Literature 31, 1358-1393.
183
Eeckhoudt, L., Gollier, C., & Schlesinger, H. (1997). The no-loss offset provision and the
attitude towards risk of a risk-neutral firm. Journal of Public Economics, 65(2), 207-
217.
Effiok, S. O., & Eton, O. E. (2013). Ensuring quality control of forensic accounting for
efficient and effective corporate management. Global Journal of Social
Sciences, 12(1), 27.
Engen, E. M., Gale, W. G., Uccello, C. E., Carroll, C. D., &Laibson, D. I. (1999). The
adequacy of household saving. Brookings Papers on Economic Activity, 1999(2), 65-
187.
Fahmi, M. R. (2012). Analyzing the Relationship between Tax Holiday and Foreign Direct
Investment In Indonesia (Doctoral Dissertation, Pacific University).
Fama, Eugene F. (1970). Efficient capital markets: A review of theory and empirical
work, Journal of Finance, 25 (2), 383-417
Forsyth D. (1972) "US Investment in Scotland", New York: Praeger.
Gastanaga, V. M., Nugent, J. B., &Pashamova, B. (1998). Host country reforms and FDI
inflows: How much difference do they make? World development, 26(7), 1299-1314.
Gentvilaite, R. (2010). FDI determinants and its motives in Central and Eastern European
Countries.
Gertler, M. (1988). Financial structure and aggregate economic activity: an overview.
Göndör, M., &Nistor, P. (2012). Fiscal policy and foreign direct investment: evidence from
some emerging EU economies. Procedia-Social and Behavioral Sciences, 58, 1256-
1266.
Gordon H. Hanson (2001). Should Countries Promote Foreign Direct Investment? United
Nations Conference on Trade and Development G-24 Discussion Paper No. 9
Government of Pakistan Ministry of Finance (2012-13). Economic Survey of Pakistan.
Grossman, G. M., &Helpman, E. (1991). Quality ladders in the theory of growth. The Review
of Economic Studies, 58(1), 43-61
Grubert Harry and John Mutti, (2000). Do taxes influence where US corporations invest?
National Tax Journal 53, 825-839.
Haiyambo, E. (2013). Harold Pupkewitz Graduate School of Business (Doctoral dissertation,
Polytechnic of Namibia).
Hakro, A. N., &Ghumro, I. A. (2011). Determinants of foreign direct investment flows to
Pakistan. The Journal of Developing Areas, 44(2), 217-242.
Hartman, David G., 1981a, "Tax Policy and Foreign Direct Investment," National Bureau of
Economic Research Working Paper No. 689, June.
184
Hartman, R. (1972). The effects of price and cost uncertainty on investment. Journal of
economic theory, 5(2), 258-266.
Hassett, K. A., & Metcalf, G. E. (1999). Investment with uncertain tax policy: Does random
tax policy discourage investment. The Economic Journal, 109(457), 372-393.
Hines, James .R., Jr., 1997, Tax policy and the activities of multinational corporations, in:A.J.
Auerbach (ed.), Fiscal policy: lessons from economic research, MIT Press, Cambridge
MA.
Hines, James R., Jr. B (1996). Forbidden Payment: Foreign Bribery and American Business
After, NBER Working Paper No. 5266.
Hines, James R., Jr., 1999, Lessons from behavioral responses to international taxation,
National Tax Journal 54, pp. 305-23.
Hussain, F., & Kimuli, C. K. (2012). Determinants of foreign direct investment flows to
developing countries. SBP Research Bulletin, 8(1), 13-31.
Imad A Moosa (2000). Foreign Direct Investment Theory, Evidence and Practice. Retrieved
from https://aadepsethi.files.wordpress.com/2013/06/fdi_theory-evidence-and-
practice_kapituj-te-zgjedhur.pdf
Jack, W., &Viard, A. D. (1996). Production efficiency and the design of temporary
investment incentives. Journal of Public Economics, 61(1), 87-106.
James R. Hines, JR. (1996). Taxes and the Location of Foreign Direct Investment in
America. The American Economic Review, Vol. 86, No. 5 (Dec.,), pp. 1076-1094
Keynes John Maynard (1930), Towards the Managed Economy: Keynes, the Treasury and
the fiscal policy debate of the 1930s. Taylor & Francis
Jorgenson, D. W. (1963). Capital theory and investment behavior. The American Economic
Review, 53(2), 247-259.
Kalirajanb, K. A. M. K. (2010). Determinants of Foreign Direct Investment in Developing
Countries: A Comparative Analysis. The Journal of Applied Economic Research.
Kassahun S (2015). The Impacts of Tax Incentives In Attracting Foreign Direct Investment In
Ethiopia. Available [Online].
etd.aau.edu.et/bitstream/123456789/7801/1/Samuel%20kassahun.pdf.
Kemp, M.C. (1962). The Benefits and Costs of Private Investment from Abroad
Khan, A. H., & Kim, Y. H. (1999). Foreign direct investment in Pakistan: policy issues and
operational implications.
Khan, M. A. (2007). Role of human capital in attracting foreign direct investment: A South
Asian perspective. SAARC Journal HRD, 3(1), 5.
Khan, R. E. A., & Nawaz, M. A. (2010). Economic Determinants of Foreign Direct
Investment in Pakistan. Journal of Economics, 1(2), 99-104.
185
Kojima, K. (1975). International trade and foreign investment: substitutes or
complements. Hitotsubashi. Journal of Economics, 16(1), 1-12
Kok, R., and Ersoy, B.A. (2009).Analyses of FDI Determinants in Developing Countries.
International Journal of Social Economics, 36 (1/2), 105-123
Kolstad, I., &Wiig, A. (2012). What determines Chinese outward FDI? Journal of World
Business, 47(1), 26-34.
Kopits, G.F. (1976). Intra-Firm Royalties Crossing Frontiers and Transfer-Pricing
Krueger, A. O. (1978). Liberalization attempts and consequences. NBER Books.
Kumar, G., & Dhingra, N. (2009). Growth and Forecasts of FDI Inflows to North and West
Africa-An Empirical Analysis. OF THE UNIVERSITY OF PETROŞANI∼
ECONOMICS∼, 83.
Lim, M. E. G. (2001). Determinants of, and the relation between, foreign direct investment
and growth: a summary of the recent literature (No. 1-175). International Monetary
Fund.
Lucas, R. E. (1976, December). Econometric policy evaluation: A critique. In Carnegie-
Rochester conference series on public policy (Vol. 1, pp. 19-46). North-Holland.
MacDougall, G.D.A. (1960). The Benefits and Costs of Private Investment from Abroad.
MacKIE‐MASON, J. K. (1990). Do taxes affect corporate financing decisions? The journal
of finance, 45(5), 1471-1493.
Mahmood, H., &Chaudary, A. R. (2013). Impact of FDI on tax revenue in Pakistan. Pakistan
Journal of Commerce and Social Science, 7(1), 59-69.
Majd, S., & Myers, S. C. (1987). Tax asymmetries and corporate tax reform. In The effects of
taxation on capital accumulation (pp. 343-376). University of Chicago Press.
Mansour, M., & Keen, M. (2009). Revenue mobilization in sub-saharan Africa: challenges
from Globalization. IMF Working Papers, 1-47.
Markusen, J.R. (1984). Multinationals, Multi-Plant Economies, and the Gains. Journal of
International Economics, 16(3-4), 205-226.
Massoud, N. (2005, March). Assessing the Employment Effect of FDI Inflows to Egypt:
Does the Mode of Entry Matter? In International Conference on the Unemployment
Crisis in the Arab Countries (pp. 17-18).
Michael Masylenko. Taxation and Economic Growth: The state of the Economic Literature
Mijiyawa, A. G. (2012). What Drives Foreign Direct Investment in Africa? An Empirical
Investigation with Panel Data. African Development Review, 27(4), 392-402.
Mintz, Jack M. (1990) Corporate Tax Holiday and Investment. World Bank Economic
186
Mishkin, F. S. (2009). Is monetary policy effective during financial crises? (No. w14678).
National Bureau of Economic Research.
Modigliani, F., & Miller, M. H. (1958). The cost of capital, corporation finance and the
theory of investment. The American economic review, 48(3), 261-297.
Mohammad Zubair Khan (1996). Pakistan: Prospects for Private Capital Flows and Financial
Sector Development. The Pakistan Development Review, 35(4), 853-883
Mohsin S. Khan (1996). Government Investment and Economic Growth in the Developing
World. 35 (4), 419-439
Mooij, Ruud A. de, and SjefEderveen. "Corporate tax elasticities: a reader's guide to
empirical findings." Oxford Review of Economic Policy 24.4 (2008): 680-697.
Moosa, I. A., &Cardak, B. A. (2003). The determinants of foreign direct investment: An
extreme bounds analysis. Journal of Multinational Financial Management, 16(2),
199-211.
Morisset, J., &Pirnia, N. (2000). How tax policy and incentives affect foreign direct
investment: a review (Vol. 2509). World Bank Publications.
Mosioma, A. (2007). Tax Competition: The role of Tax incentives in encouraging harmful
tax competition in the East African Flower industry. Tax Justice Network for Africa.
Muhammad Tariq Majeedand Eatzaz Ahmad (2009) An Analysis of Host Country
Characteristics that Determine FDI in Developing Countries: Recent Panel Data
Evidence. The Lahore Journal of Economics 14 (2), 71-96
Muhammad Zakaria (2014). Investment in Pakistan: A Critical Review. Journal of
Managerial Sciences. Volume (4) 2.
Mutti, J., &Grubert, H. (2004). Empirical asymmetries in foreign direct investment and
taxation. Journal of International Economics, 62(2), 337-358.
Myers, S. C. (1984). The capital structure puzzle. The journal of finance, 39(3), 574-592.
Myers, S. C., &Majluf, N. S. (1984). Corporate financing and investment decisions when
firms have information that investors do not have. Journal of financial
economics, 13(2), 187-221.
Ogbonna, G. N., &Ebimobowei, A. (2012). Impact of tax reforms and economic growth of
Nigeria: A time series analysis. Current Research Journal of Social Sciences, 4(1),
62-68.
Onyeiwu, S., and Shrestha, H. (2004).Determinants of Foreign Direct Investment in Africa.
Journal of Developing Societies, 20(1-2), 89-106.
Otieno, B. A., Krause, C. E., Latus, A., Chikkaveeraiah, B. V., Faria, R. C., &Rusling, J. F.
(2014). On-line protein capture on magnetic beads for ultrasensitive microfluidic
immunoassays of cancer biomarkers. Biosensors and Bioelectronics, 53, 268-274.
187
Ozturk, I. (2007). Foreign direct investment-growth nexus: a review of the recent literature.
International Journal of Applied Econometrics and Quantitative Studies, 4(2).
Panteghini, P. M., &Scarpa, C. (2003). Irreversible investments and regulatory risk.
Papageorgiou, Demetrious, ArmeaneChoksi, and Michael Michaely (1990) Liberalising
Foreign Trade in Developing Countries: The Lessons of Experience. Washington,
D.C.: World Bank.
Pasha, H. A., & Ismail, Z. H.. (1988). determinants of success of industrial estates in
Pakistan. Pakistan Economic and Social Review, 26(1), 1-19. Retrieved from
http://www.jstor.org/stable/25825013
Pawlina, G., &Kort, P. M. (2005). Investment under uncertainty and policy change. Journal
of Economic Dynamics and Control, 29(7), 1193-1209.
Pointon, M. (1998). Money and nationalism. Imagining nations, 229-254.
Poterba, J. M. (1989). Capital gains tax policy toward entrepreneurship. National Tax
Journal, 42(3), 375-389.
Poulson, B. W., & Kaplan, J. G. (2008). State income taxes and economic growth. Cato J.,
28, 53.
QaziMasood Ahmed and S.MoquetAhsan (1997).Tax Concessions and Investment Behavior.
The Pakistan Development Review, 36 (4), 537-562.
Quan Li (2006) Democracy, Autocracy, and Tax Incentives to Foreign Direct Investors: A
Cross-National Analysis. The Journal of Politics, 68 (1), 62–74
Rabushka, Alvin (1987). "Taxation, economic growth, and liberty." Cato J. 7 121.
Raff, Horst, and Krishna Srinivasan (1998). "Tax incentives for import-substituting foreign
investment:: Does signaling play a role?." Journal of Public Economics 67(2) 167-
193.
Reister-Gottfried, E., Sengupta, K., Lorz, B., Sackmann, E., Seifert, U., & Smith, A. S.
(2008). Dynamics of specific vesicle-substrate adhesion: from local events to global
dynamics. Physical review letters, 101(20), 208103.
Root F. and Ahmed A. (1978) "The Influence of Policy Instruments on Manufacturing
DirectForeign Investment in developing Countries", Journal of International Business
Studies,9(3).
Saxton, T. (1997). The effects of partner and relationship characteristics on alliance
outcomes. Academy of management journal, 40(2), 443-461.
Scholes Myron S. and Mark A. Wolfson, (1990). The effects of changes in tax law on
corporate reorganization activity, Journal of Business 63, S141-S164.
Sekkat, K., and Veganzones-Varoudakis, M.A. (2007).Openness, Investment Climate, and
FDI in Developing Countries. Review of Development Economics, 11(4), 607-620.
188
Shah, Z., Ahmed, Q. M., & Siddiqui, R. (2003). The Determinants of Foreign Direct
Investment in Pakistan: an Empirical Investigation [with Comments]. The Pakistan
Development Review, 697-714.
Shakya, K. (2004). Relationship between Human Resource Development & Per Capita
Income in the SAARC Countries. SAARC HUMAN RESOURCE DEVELOPMENT
CENTRE (SHRDC), 73.
Shapiro, C., & Stiglitz, J. E. (1984). Equilibrium unemployment as a worker discipline
device. The American Economic Review, 74(3), 433-444.
Skinner, Q. (1988). A reply to my critics.
Slemrod J. (1990). Tax Effects on Foreign Direct Investment in the United States: Evidence
from a Cross Country Comparison, In Taxation in the Global Economy. Chicago:
University Press 79-117.
Sobel, R. S., & Holcombe, R. G. (1996). The impact of state rainy day funds in easing state
fiscal crises during the 1990–1991 recession. Public Budgeting & Finance, 16(3), 28-
48.
Solow, R. M. (1956). A contribution to the theory of economic growth. The quarterly journal
of economics, 65-94.
Stapper, M. (2010). Tax regimes in emerging Africa: Can corporate tax rates boost FDI in
sub-Sahara Africa? African Studies Centre.
Stern, Nicholas. "Public policy and the economics of development." European Economic
Review 35.2 (1991): 241-271.
Swenson, Deborah L., (1994). The impact of US tax reform on foreign direct investment in
the United States, Journal of Public Economics 54, 243-266.
Tanzi, V., &Bovenberg, L. (1990). Is there a need for harmonizing capital income within EC
countries? Working paper 90/17, IMF, Washington DC.
Tax Reforms in Pakistan (2013) Brief Prepared for Policy Symposium on Tax Reforms in
Pakistan, SDPI.
Tobin, G., & Walsh, K. (2013). What makes a country a tax haven? An Assessment of
international standards shows why Ireland is not a tax haven. The Economic and
Social Review, 44(3), 401-424.
UNCTAD (1995).Incentives and Foreign Direct Investment; Background Report.
Van Parys, S., & James, S. (2010). The effectiveness of tax incentives in attracting FDI:
Evidence from the tourism sector in the Caribbean. Gent, Universiteit Gent.
Volkerink, B. S. I., & Haan, J. (1999). Political and institutional determinants of the tax mix:
an empirical investigation for OECD countries. Groningen: University of Groningen.
189
Wang, Z.Q., and Swain, N.J. (1995). The Determinants of Foreign Direct Investment in
Transforming Economies: Evidence from Hungary and China. Weltwirtschaftliches
Archive, 131, 359-382.
Watson, D., & Clark, L. A. (1992). On traits and temperament: General and specific factors
of emotional experience and their relation to the five‐factor model. Journal of
personality, 60(2), 441-476.
Young, Kan H. (1988). The effects of taxes and rates of return on foreign direct investment in
the United States. National Tax Journal 41 (1): 109-21.
Yusuf, S. (2013). Can Chinese FDI Accelerate Pakistan's Growth? International Growth
Centre, 4.
Zakaria, M., Naqvi, H. A., &Fida, B. A. (2014). Openness and FDI in Pakistan: What does
the data tell us? Middle-East Journal of Scientific Research, 19(12), 1587-1597.
Zenjari, A., Wahabi, R., El Haj, H. A., &Drissi, H. (2012). Public Hospital Performance
Assessment: Case of Morocco. Journal of US-China Public Administration, 9(5),
494-506.