Embed Size (px)
Citation preview
NORTH SEA STUDY OCCASIONAL PAPER
No. 111
Incentivising Investment in the UKCS:
a Response to Supporting Investment:
a Consultation on the North Sea Fiscal Regime
Professor Alexander G. Kemp and
Linda Stephen
February, 2009 Price £25.00
DEPARTMENT OF ECONOMICS
i
ISSN 0143-022X
NORTH SEA ECONOMICS
Research in North Sea Economics has been conducted in the Economics Department since
1973. The present and likely future effects of oil and gas developments on the Scottish
economy formed the subject of a long term study undertaken for the Scottish Office. The
final report of this study, The Economic Impact of North Sea Oil on Scotland, was published
by HMSO in 1978. In more recent years further work has been done on the impact of oil on
local economies and on the barriers to entry and characteristics of the supply companies in
the offshore oil industry.
The second and longer lasting theme of research has been an analysis of licensing and fiscal
regimes applied to petroleum exploitation. Work in this field was initially financed by a
major firm of accountants, by British Petroleum, and subsequently by the Shell Grants
Committee. Much of this work has involved analysis of fiscal systems in other oil producing
countries including Australia, Canada, the United States, Indonesia, Egypt, Nigeria and
Malaysia. Because of the continuing interest in the UK fiscal system many papers have been
produced on the effects of this regime.
From 1985 to 1987 the Economic and Social Science Research Council financed research on
the relationship between oil companies and Governments in the UK, Norway, Denmark and
The Netherlands. A main part of this work involved the construction of Monte Carlo
simulation models which have been employed to measure the extents to which fiscal systems
share in exploration and development risks.
Over the last few years the research has examined the many evolving economic issues
generally relating to petroleum investment and related fiscal and regulatory matters. Subjects
researched include the economics of incremental investments in mature oil fields, economic
aspects of the CRINE initiative, economics of gas developments and contracts in the new
market situation, economic and tax aspects of tariffing, economics of infrastructure cost
sharing, the effects of comparative petroleum fiscal systems on incentives to develop fields
and undertake new exploration, the oil price responsiveness of the UK petroleum tax system,
and the economics of decommissioning, mothballing and re-use of facilities. This work has
been financed by a group of oil companies and Scottish Enterprise, Energy. The work on
CO2 Capture, EOR and storage is also financed by a grant from the Natural Environmental
Research Council (NERC).
For 2009 the programme examines the following subjects:
a) Effects of Requirements on Investors in UKCS to purchase CO2 allowances
relating to emissions from 2013 under the EU ETS
b) Least-Cost Transportation Network for CO2 in UK/UKCS
c) Comparative study of Petroleum Taxation in North West Europe/ North Atlantic
(UK, Norway, Denmark, Netherlands, Ireland, Faroe Islands, Iceland and
Greenland)
d) Economics of Decommissioning in the UKCS: Further Analysis
e) Economics of Gas Exploitation from West of Shetland
ii
f) Prospective Activity levels in the UKCS to 2035
g) EOR from CO2 Injection
h) General Financial Incentives for CCS in UK
The authors are solely responsible for the work undertaken and views expressed. The
sponsors are not committed to any of the opinions emanating from the studies.
Papers are available from:
The Secretary (NSO Papers)
University of Aberdeen Business School
Edward Wright Building
Dunbar Street
Aberdeen A24 3QY
Tel No: (01224) 273427
Fax No: (01224) 272181
Email: [email protected]
Recent papers published are:
OP 98 Prospects for Activity Levels in the UKCS to 2030: the 2005
Perspective
By A G Kemp and Linda Stephen (May 2005), pp. 52
£20.00
OP 99 A Longitudinal Study of Fallow Dynamics in the UKCS
By A G Kemp and Sola Kasim, (September 2005), pp. 42
£20.00
OP 100 Options for Exploiting Gas from West of Scotland
By A G Kemp and Linda Stephen, (December 2005), pp. 70
£20.00
OP 101 Prospects for Activity Levels in the UKCS to 2035 after the
2006 Budget
By A G Kemp and Linda Stephen, (April 2006) pp. 61
£30.00
OP 102 Developing a Supply Curve for CO2 Capture, Sequestration and
EOR in the UKCS: an Optimised Least-Cost Analytical
Framework
By A G Kemp and Sola Kasim, (May 2006) pp. 39
£20.00
OP 103 Financial Liability for Decommissioning in the UKCS: the
Comparative Effects of LOCs, Surety Bonds and Trust Funds
By A G Kemp and Linda Stephen, (October 2006) pp. 150
£25.00
OP 104 Prospects for UK Oil and Gas Import Dependence
By A G Kemp and Linda Stephen, (November 2006) pp. 38
£25.00
OP 105 Long-term Option Contracts for Carbon Emissions
By A G Kemp and J Swierzbinski, (April 2007) pp. 24
£25.00
iii
OP 106 The Prospects for Activity in the UKCS to 2035: the 2007
Perspective
By A G Kemp and Linda Stephen (July 2007) pp.56
£25.00
OP 107 A Least-cost Optimisation Model for CO2 capture
By A G Kemp and Sola Kasim (August 2007) pp.65
£25.00
OP 108 The Long Term Structure of the Taxation System for the UK
Continental Shelf
By A G Kemp and Linda Stephen (October 2007) pp.116
£25.00
OP 109 The Prospects for Activity in the UKCS to 2035: the 2008
Perspective
By A G Kemp and Linda Stephen (October 2008) pp.67
£25.00
OP 110 The Economics of PRT Redetermination for Incremental
Projects in the UKCS
By A G Kemp and Linda Stephen (November 2008) pp. 56
£25.00
OP 111 Incentivising Investment in the UKCS: a Response to
Supporting Investment: a Consultation on the North Sea Fiscal
Regime
By A G Kemp and Linda Stephen (February 2009) pp.93
£25.00
1
Incentivising Investment in the UKCS: a Response to Supporting
Investment: a Consultation on the North Sea Fiscal Regime
Professor Alexander G. Kemp and
Linda Stephen
Contents Page
1. Introduction ................................................................................................. 2
2. Methodology and Assumptions .................................................................. 2
3. Results ....................................................................................................... 10
A. Value Allowance Applied to All New Fields in UKCS ....................... 10
i. Number of Field Developments Triggered ........................................ 10
ii. Detailed Effects of Allowance of £12.5 million ................................ 12
iii. Detailed Effects of Allowance of £50 million ............................... 22
iv. Detailed Effects of Allowance at £100 million .............................. 33
v. Effects of Value Allowance of £250 million ..................................... 43
B. Value Allowance Applied to Small Fields (≤ 20 mmboe) .................... 44
i. Numbers of Field Developments Triggered ...................................... 44
ii. Detailed Effects of £12.5 million Value Allowance ......................... 45
iii. Detailed Effects of Value Allowance of £50 million ..................... 55
iv. Detailed Effects of Value Allowance of £100 million ................... 64
C. Value Allowance Applied to West of Shetlands Fields ........................ 73
i. Number of Field Developments Triggered ........................................ 73
4. Interpretation of Results ........................................................................... 81
5. Incremental Projects ................................................................................. 87
6. Exploration Incentives .............................................................................. 89
7. Conclusions ............................................................................................... 90
2
Incentivising Investment in the UKCS: a Response to Supporting
Investment: a Consultation on the North Sea Fiscal Regime
Professor Alexander G Kemp and Linda Stephen
1. Introduction
The publication of the Treasury consultation document Supporting Investment:
a Consultation on the North Sea Fiscal Regime in November 2008 signalled the
UK Government’s desire to enhance the pace of activity in the UK Continental
Shelf (UKCS). It is well known that oil and gas production has been falling at a
brisk pace since the peak reached in 1999. The consultation covers several
subjects, the most important of which relates to incentives for new field
development. The document refers in particular to small fields, heavy oil fields,
HP/HT fields, and fields located West of Shetlands. Other topics raised relate
to capital gains tax, where specific proposals are made with respect to licence
swaps and reinvestment relief, and change of use where the Government has out
set its conclusions from discussions held with the industry over the last two
years. The document also refers to the question of the whole future of PRT the
abolition of which, particularly through a buyout arrangement, has been
discussed over the last two years.
This paper discusses the case for incentives for new field developments in detail
and makes observations on other related topics including in particular the
continuing need to incentivise investment in incremental projects in PRT-
paying fields and further exploration.
2. Methodology and Assumptions
3
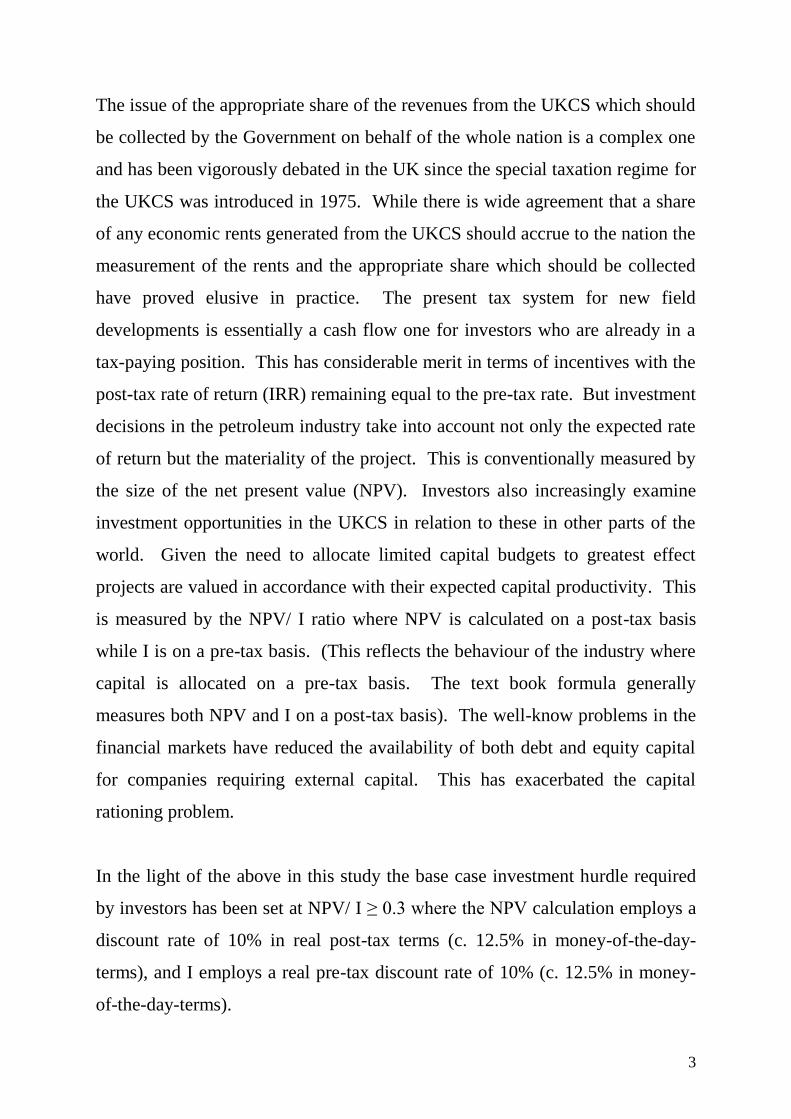
The issue of the appropriate share of the revenues from the UKCS which should
be collected by the Government on behalf of the whole nation is a complex one
and has been vigorously debated in the UK since the special taxation regime for
the UKCS was introduced in 1975. While there is wide agreement that a share
of any economic rents generated from the UKCS should accrue to the nation the
measurement of the rents and the appropriate share which should be collected
have proved elusive in practice. The present tax system for new field
developments is essentially a cash flow one for investors who are already in a
tax-paying position. This has considerable merit in terms of incentives with the
post-tax rate of return (IRR) remaining equal to the pre-tax rate. But investment
decisions in the petroleum industry take into account not only the expected rate
of return but the materiality of the project. This is conventionally measured by
the size of the net present value (NPV). Investors also increasingly examine
investment opportunities in the UKCS in relation to these in other parts of the
world. Given the need to allocate limited capital budgets to greatest effect
projects are valued in accordance with their expected capital productivity. This
is measured by the NPV/ I ratio where NPV is calculated on a post-tax basis
while I is on a pre-tax basis. (This reflects the behaviour of the industry where
capital is allocated on a pre-tax basis. The text book formula generally
measures both NPV and I on a post-tax basis). The well-know problems in the
financial markets have reduced the availability of both debt and equity capital
for companies requiring external capital. This has exacerbated the capital
rationing problem.
In the light of the above in this study the base case investment hurdle required
by investors has been set at NPV/ I ≥ 0.3 where the NPV calculation employs a
discount rate of 10% in real post-tax terms (c. 12.5% in money-of-the-day-
terms), and I employs a real pre-tax discount rate of 10% (c. 12.5% in money-
of-the-day-terms).
4
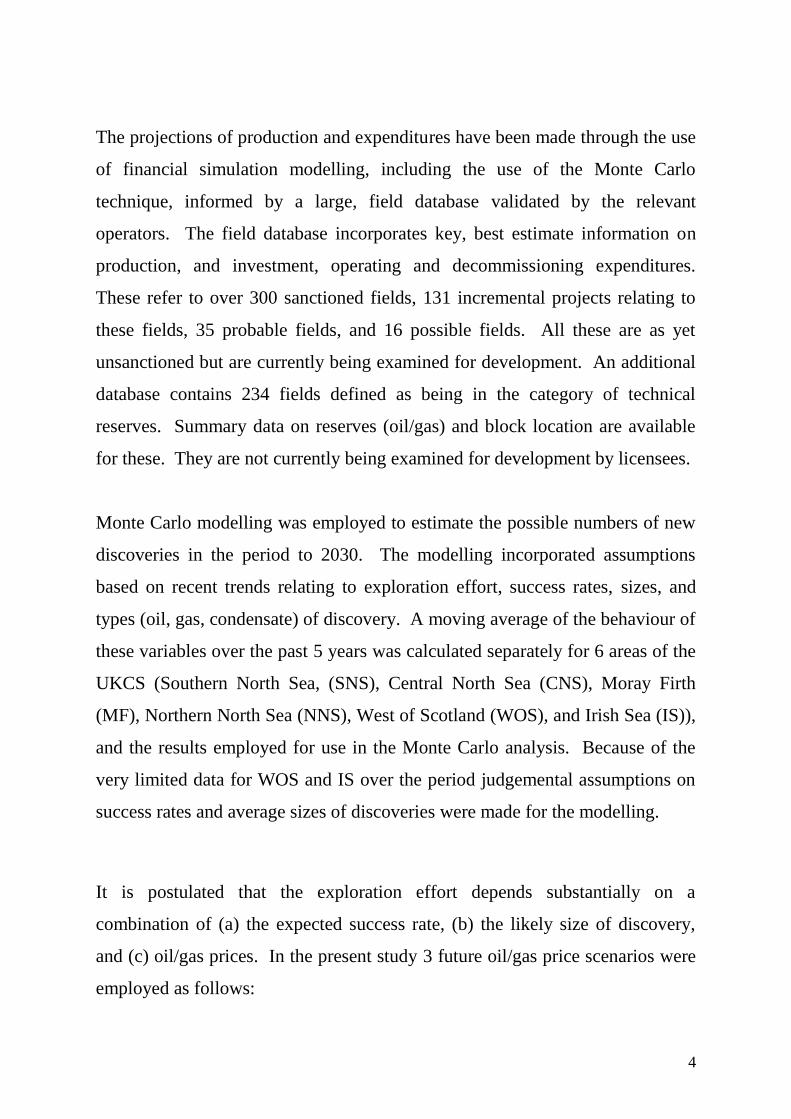
The projections of production and expenditures have been made through the use
of financial simulation modelling, including the use of the Monte Carlo
technique, informed by a large, field database validated by the relevant
operators. The field database incorporates key, best estimate information on
production, and investment, operating and decommissioning expenditures.
These refer to over 300 sanctioned fields, 131 incremental projects relating to
these fields, 35 probable fields, and 16 possible fields. All these are as yet
unsanctioned but are currently being examined for development. An additional
database contains 234 fields defined as being in the category of technical
reserves. Summary data on reserves (oil/gas) and block location are available
for these. They are not currently being examined for development by licensees.
Monte Carlo modelling was employed to estimate the possible numbers of new
discoveries in the period to 2030. The modelling incorporated assumptions
based on recent trends relating to exploration effort, success rates, sizes, and
types (oil, gas, condensate) of discovery. A moving average of the behaviour of
these variables over the past 5 years was calculated separately for 6 areas of the
UKCS (Southern North Sea, (SNS), Central North Sea (CNS), Moray Firth
(MF), Northern North Sea (NNS), West of Scotland (WOS), and Irish Sea (IS)),
and the results employed for use in the Monte Carlo analysis. Because of the
very limited data for WOS and IS over the period judgemental assumptions on
success rates and average sizes of discoveries were made for the modelling.
It is postulated that the exploration effort depends substantially on a
combination of (a) the expected success rate, (b) the likely size of discovery,
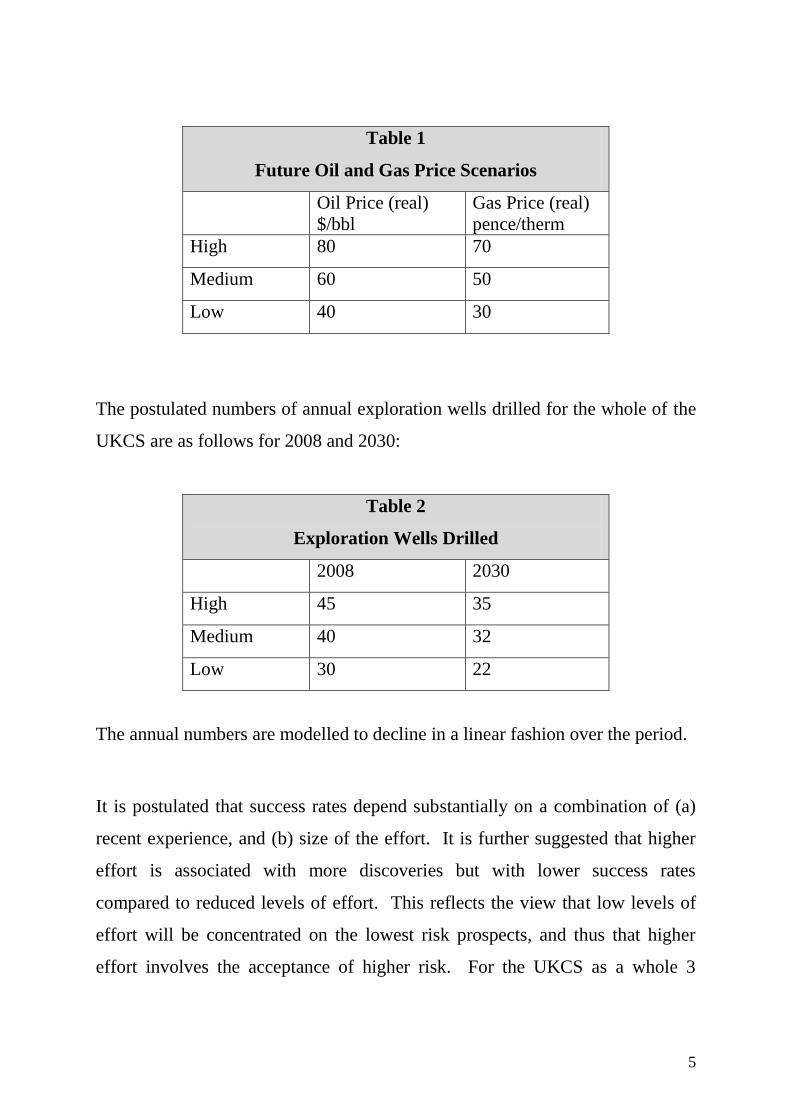
and (c) oil/gas prices. In the present study 3 future oil/gas price scenarios were
employed as follows:
5
Table 1
Future Oil and Gas Price Scenarios
Oil Price (real)
$/bbl
Gas Price (real)
pence/therm
High 80 70
Medium 60 50
Low 40 30
The postulated numbers of annual exploration wells drilled for the whole of the
UKCS are as follows for 2008 and 2030:
Table 2
Exploration Wells Drilled
2008 2030
High 45 35
Medium 40 32
Low 30 22
The annual numbers are modelled to decline in a linear fashion over the period.
It is postulated that success rates depend substantially on a combination of (a)
recent experience, and (b) size of the effort. It is further suggested that higher
effort is associated with more discoveries but with lower success rates
compared to reduced levels of effort. This reflects the view that low levels of
effort will be concentrated on the lowest risk prospects, and thus that higher
effort involves the acceptance of higher risk. For the UKCS as a whole 3

6
success rates were postulated as follows with the medium one reflecting the
average over the past 5 years.
Table 3
Success Rates for UKCS
Medium effort/Medium success rate = 25.5%
High effort/Low success rate = 24%
Low effort/High success rate = 27%
It should be noted that success rates have varied considerably across sectors of
the UKCS. Thus in the CNS and SNS the averages have exceeded 30% while in
the other sectors success rates have been well below the average for the whole
province.
It is assumed that technological progress will maintain these success rates over
the time period.
The mean sizes of discoveries made in the historic period for each of the 6
regions were calculated. They are shown in Table 4. It was then assumed that
the mean size of discovery would decrease in line with recent historic
experience. Such decline rates are quite modest.
Table 4
Mean Discovery Size MMboe
SNS 9
CNS 25
NNS 25
MF 20
WoS 81
IS 5
7
For purposes of the Monte Carlo modelling of new discoveries the SD was set
at 50% of the mean value. In line with historic experience the size distribution
of discoveries was taken to be lognormal.
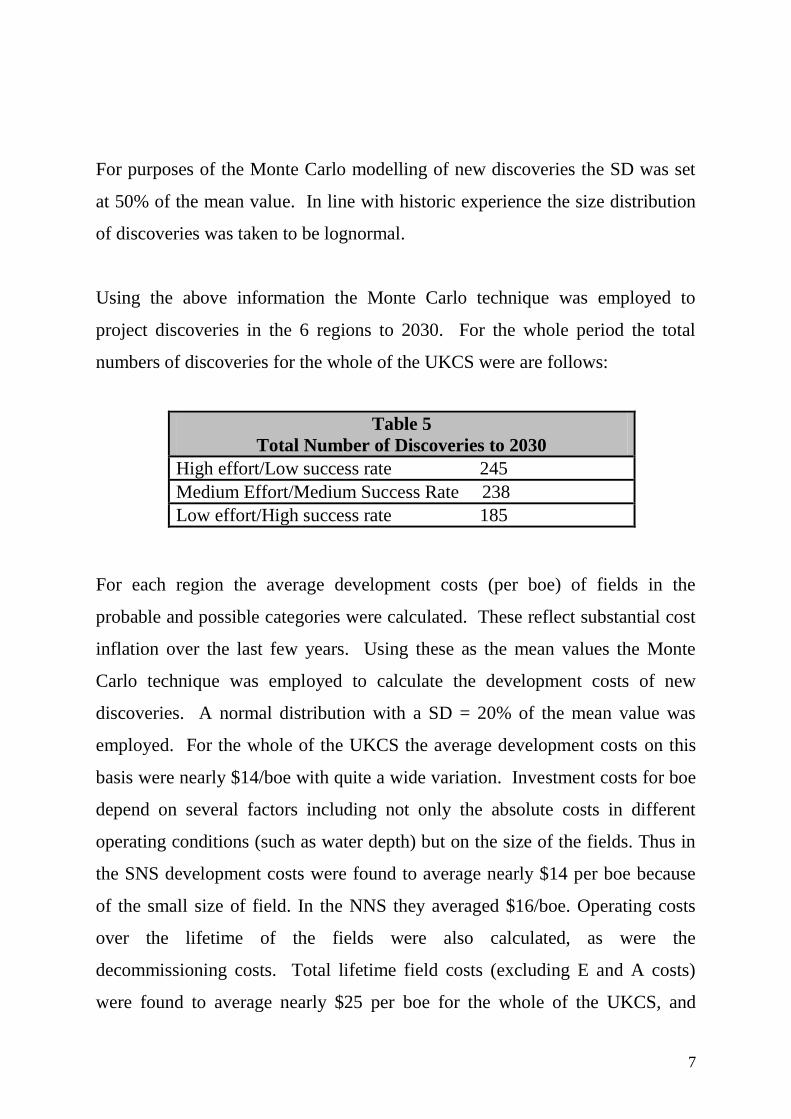
Using the above information the Monte Carlo technique was employed to
project discoveries in the 6 regions to 2030. For the whole period the total
numbers of discoveries for the whole of the UKCS were are follows:
Table 5
Total Number of Discoveries to 2030
High effort/Low success rate 245
Medium Effort/Medium Success Rate 238
Low effort/High success rate 185
For each region the average development costs (per boe) of fields in the
probable and possible categories were calculated. These reflect substantial cost
inflation over the last few years. Using these as the mean values the Monte
Carlo technique was employed to calculate the development costs of new
discoveries. A normal distribution with a SD = 20% of the mean value was
employed. For the whole of the UKCS the average development costs on this
basis were nearly $14/boe with quite a wide variation. Investment costs for boe
depend on several factors including not only the absolute costs in different
operating conditions (such as water depth) but on the size of the fields. Thus in
the SNS development costs were found to average nearly $14 per boe because
of the small size of field. In the NNS they averaged $16/boe. Operating costs
over the lifetime of the fields were also calculated, as were the
decommissioning costs. Total lifetime field costs (excluding E and A costs)
were found to average nearly $25 per boe for the whole of the UKCS, and
8
averaged over $21 per boe in the SNS, nearly $25 per boe in the CNS, and $29
per boe in the NNS.
For new discoveries annual operating costs were modelled as a percentage of
accumulated development costs. This percentage varied according to field size.
It was taken to increase as the size of the field was reduced reflecting the
presence of economies of scale in the exploitation costs. Thus the field lifetime
costs in small fields could become very high on a per boe basis.
With respect to fields in the category of technical reserves it was recognised that
many have remained undeveloped for a long time, so the mean development
costs in each of the basins was set at $5/boe higher than the mean for the new
discoveries in that basin. Thus for the CNS the mean development costs are
$17/boe and in NNS $21/boe. For purposes of Monte Carlo modelling a normal
distribution of the recoverable reserves for each field with a SD = 50% of the
mean was assumed. With respect to development costs the distribution was
assumed to be normal with a SD = 20% of the mean value.
The annual numbers of new field developments were assumed to be constrained
by the physical and financial capacity of the industry. This subject is currently
very pertinent in the UKCS. The ceilings were assumed to be linked to the
oil/gas scenarios with maxima of 20, 17, and 13 respectively under the High,
Medium, and Low Price Cases. These constraints do not apply to incremental
projects which are additional to new field developments.
A noteworthy feature of the 131 incremental projects in the database validated
by operators is the expectation that the great majority will be executed over the
next 3 or 4 years. It is virtually certain that in the medium and longer-term
many further incremental projects will be designed and executed. They are just
9
not yet at the serious planning stage. Such projects can be expected not only
linked to currently sanctioned fields, but also to those presently classified as in
the categories of probable, possible, technical reserves, and future discoveries.
Accordingly, estimates were made of the potential extra incremental projects
from all these sources. Examination of the numbers of such projects and their
key characteristics (reserves and costs) being examined by operators over the
past 5 years indicated a decline rate in the volumes. On the basis of this, and
from a base of the information of the key characteristics of the projects in the
database, it was felt that, with a decline rate reflecting historic experience,
further portfolios of incremental projects could reasonably be expected. As
noted above such future projects would be spread over all categories of host
fields. Their sizes and costs reflect recent trends.
The above modelling was conducted under the current tax system. The outputs
of the modelling showed expected production, field investment, operating and
decommissioning costs1. Tax revenues were also calculated.
2 It should be
stressed that from a national viewpoint the effects of the incentive should not be
assessed in terms of tax revenues. The key effects which attention should be
concentrated are on economic production and investment. This is consistent
with the various PILOT objectives which are stated in terms of production and
investment. The effects of various sizes of value allowances for the
Supplementary Charge (SC) were then calculated with the results highlighting
the changes to oil and gas production, investment and operating expenditures
and tax revenues. The acceptable field investments are thus on a post-
1 For full details see parts of the more comprehensive study by A.G. Kemp and L. Stephen, North Sea Study
Occasional Paper No.109, The Prospects for Activity in the UKCS to 2035: the 2008 Perspective, October 2008,
University of Aberdeen Department of Economics pp. 67. 2 The tax revenues refer only to CT and SC in the UKCS. There will be substantial additional taxes paid by the
supply chain, including corporation tax, income tax and National Insurance contribution from increased activity
triggered by the value allowance.
10
corporation tax basis. Clearly more would be viable on a pre-tax basis. The
value allowances were all modelled on a per field basis. The values employed
were (1) £2.5 million per year for 5 years, (2) £10 million per year for 5 years,
(3) £20 million per year for 5 years, and (4) £50 million per year for 5 years. In
some cases the relevant income for SC purposes was insufficient to absorb all
the value allowance. The results are shown for all categories of new fields
(probable, possible, technical reserves, and new discoveries). Given the
concern expressed in the consultation document with small fields the results are
shown separately for fields with recoverable reserves of ≤ 20 mmboe under the
$60,50 pence price case. The results of the very high value allowance are
shown separately for fields located West of Shetland given the particularly high
costs of developing (including transporting) oil and gas in that area.
Given the clear need to obtain maximum economic recovery from the UKCS
the situation with respect to incremental projects in mature fields is also
discussed. The tax position in relation to projects subject to PRT as well as
corporation tax and SC has recently been examined in detail by the present
authors and the lessons for the present position of the industry are highlighted.
3. Results
A. Value Allowance Applied to All New Fields in UKCS
i. Number of Field Developments Triggered
The effects of the value allowance in triggering new field developments across
the UKCS in the period from 2009 to 2035 inclusive are shown in summary
form in Table 6.
11
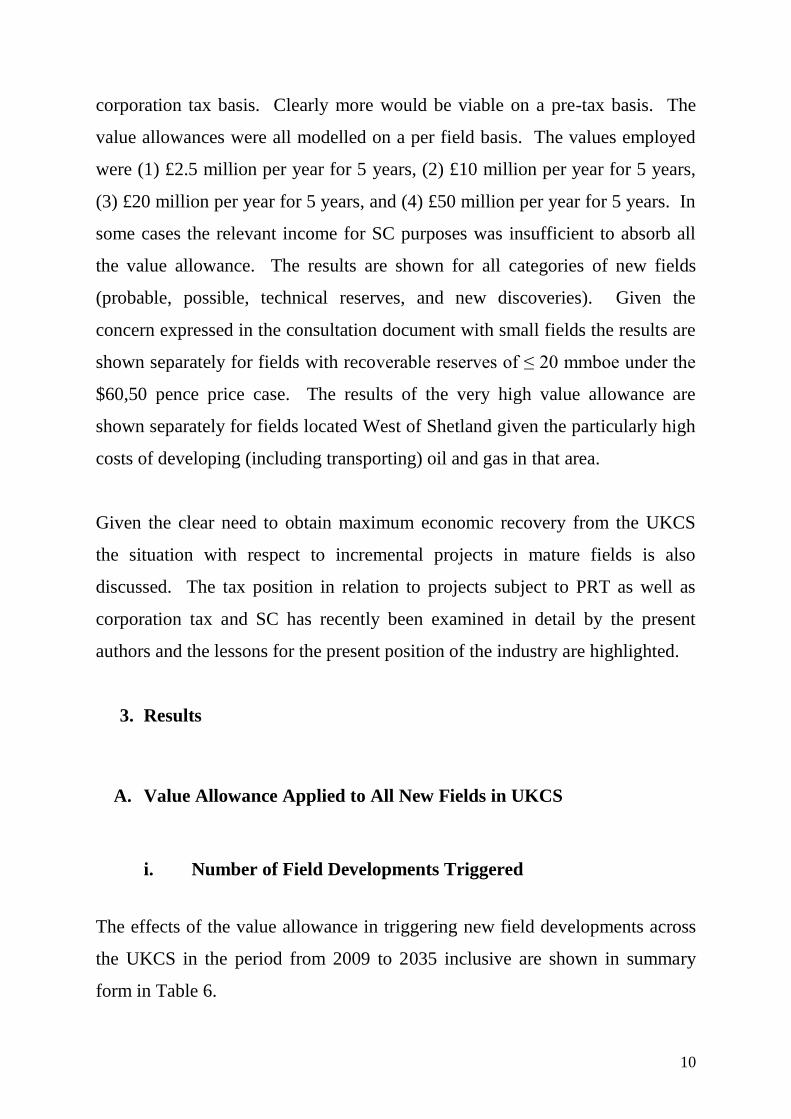
Table 6
Number of Fields Triggered by value allowance in period to 2035
Probable Possible Technical Reserves New Exploration Total
$40,30p SCT Allowance £2.5m x 5 3 1 4 8 16
$40,30p SCT Allowance £10m x 5 6 3 9 27 45
$40,30p SCT Allowance £20m x 5 8 3 13 34 58
$60,50p SCT Allowance £2.5m x 5 4 1 14 13 32
$60,50p SCT Allowance £10m x 5 4 2 29 21 56
$60,50p SCT Allowance £20m x 5 5 2 31 23 61
$80,70p SCT Allowance £2.5m x 5 1 0 6 0 7
$80,70p SCT Allowance £10m x 5 1 0 17 1 19
$80,70p SCT Allowance £20m x 5 1 0 18 1 20
It is seen that under the $40,30p price case the total numbers of incentivised
fields are 16 with the £12.5 million allowance, 45 with the £50 million
allowance, and 58 with the £100 million case. The majority of the incentivised
developments are in the category of new discoveries. The policy conclusion is
that the allowance could provide a worthwhile incentive for further exploration.
It is also clear that the £12.5 million allowance is inadequate to provide a
worthwhile difference to new field developments.
Under the $60,50p price case the numbers of incentivised developments are
substantially greater, being 32, 56, and 61 under the 3 sizes of allowance. In
this scenario it is seen that large numbers of fields in the technical reserves
category as well as substantial numbers of new discoveries are incentivised.
Worthwhile numbers of fields in the probable/possible field categories are also
incentivised. These are currently being assessed by the industry, and the fact
12
that they do not meet the investment hurdle under the current tax system is
clearly of concern. Again it is clear that the higher levels of allowance produce
substantially more new developments than the £12.5 million one.
Under the $80,70p price case significant numbers of fields in the category of
technical reserves are incentivised under the £50 million and £100 million
allowances.
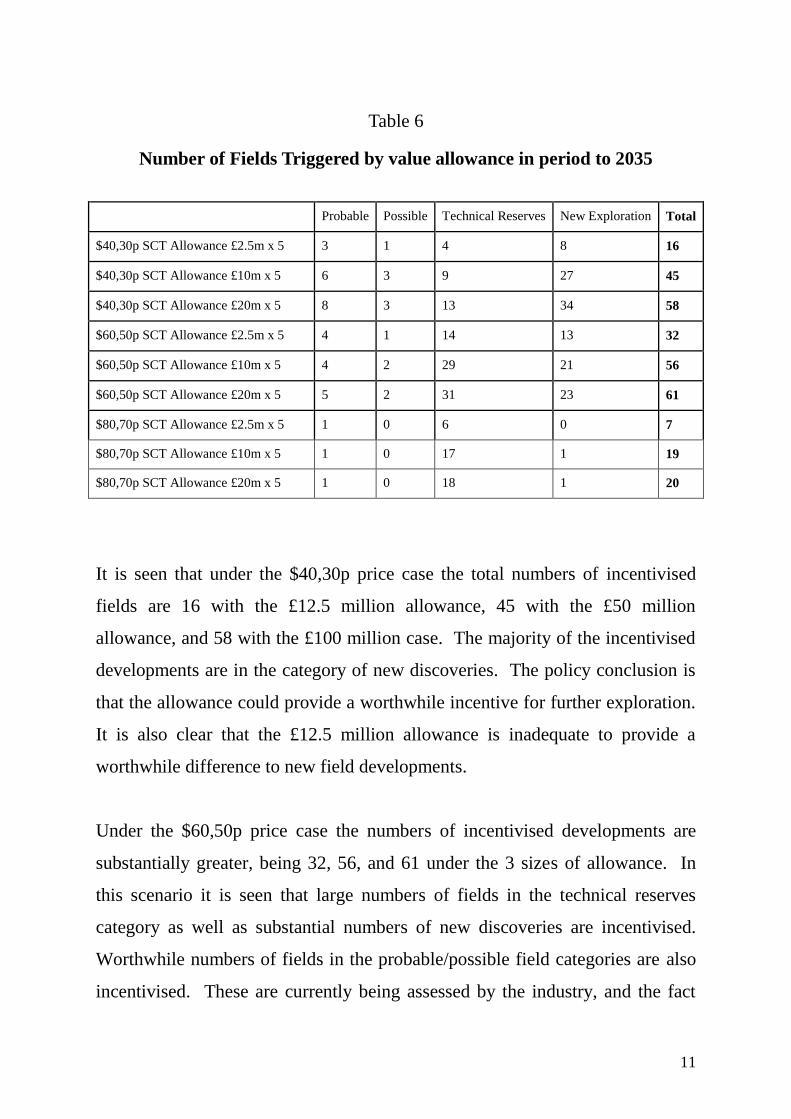
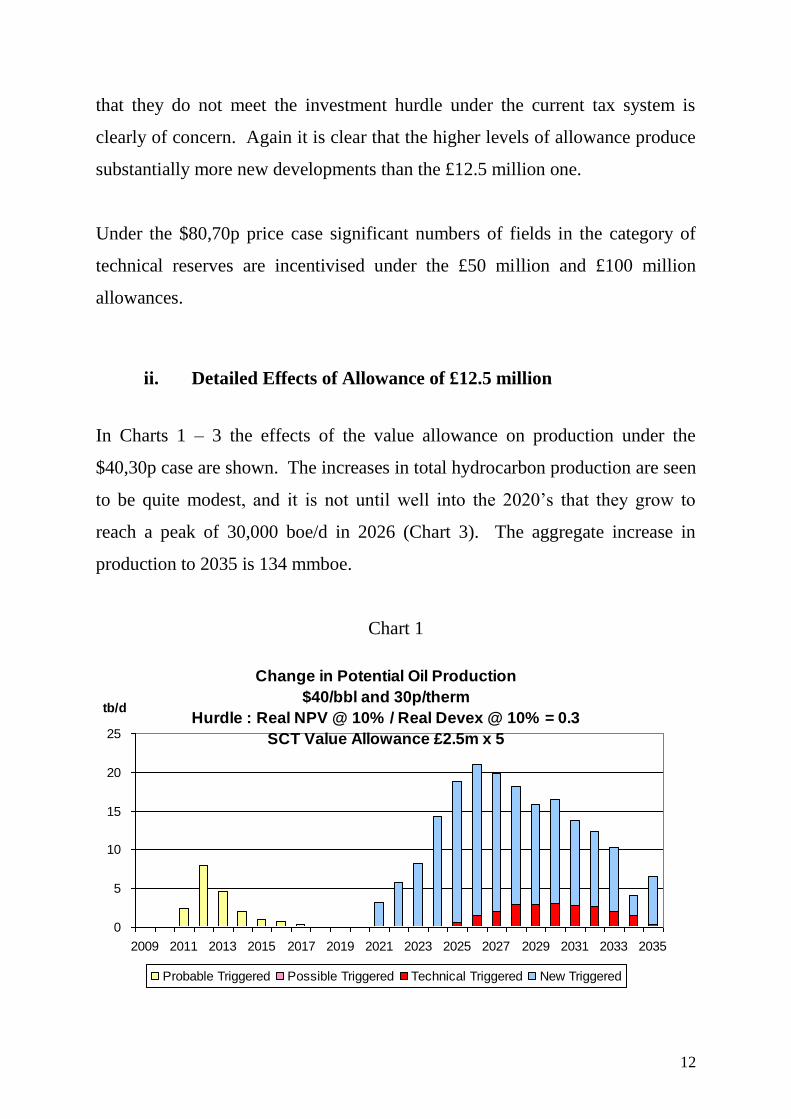
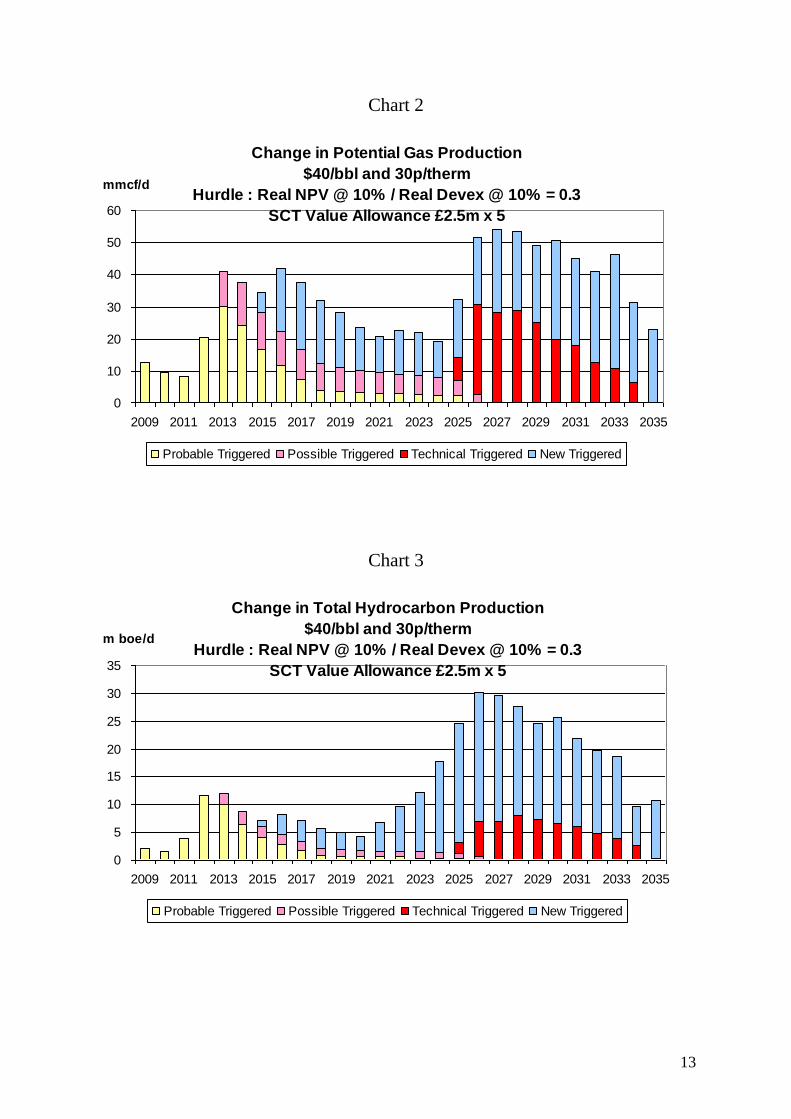
ii. Detailed Effects of Allowance of £12.5 million
In Charts 1 – 3 the effects of the value allowance on production under the
$40,30p case are shown. The increases in total hydrocarbon production are seen
to be quite modest, and it is not until well into the 2020’s that they grow to
reach a peak of 30,000 boe/d in 2026 (Chart 3). The aggregate increase in
production to 2035 is 134 mmboe.
Chart 1
Change in Potential Oil Production
$40/bbl and 30p/therm
Hurdle : Real NPV @ 10% / Real Devex @ 10% = 0.3
SCT Value Allowance £2.5m x 5
0
5
10
15
20
25
2009 2011 2013 2015 2017 2019 2021 2023 2025 2027 2029 2031 2033 2035
tb/d
Probable Triggered Possible Triggered Technical Triggered New Triggered
13
Chart 2
Change in Potential Gas Production
$40/bbl and 30p/therm
Hurdle : Real NPV @ 10% / Real Devex @ 10% = 0.3
SCT Value Allowance £2.5m x 5
0
10
20
30
40
50
60
2009 2011 2013 2015 2017 2019 2021 2023 2025 2027 2029 2031 2033 2035
mmcf/d
Probable Triggered Possible Triggered Technical Triggered New Triggered
Chart 3
Change in Total Hydrocarbon Production
$40/bbl and 30p/therm
Hurdle : Real NPV @ 10% / Real Devex @ 10% = 0.3
SCT Value Allowance £2.5m x 5
0
5
10
15
20
25
30
35
2009 2011 2013 2015 2017 2019 2021 2023 2025 2027 2029 2031 2033 2035
m boe/d
Probable Triggered Possible Triggered Technical Triggered New Triggered
14
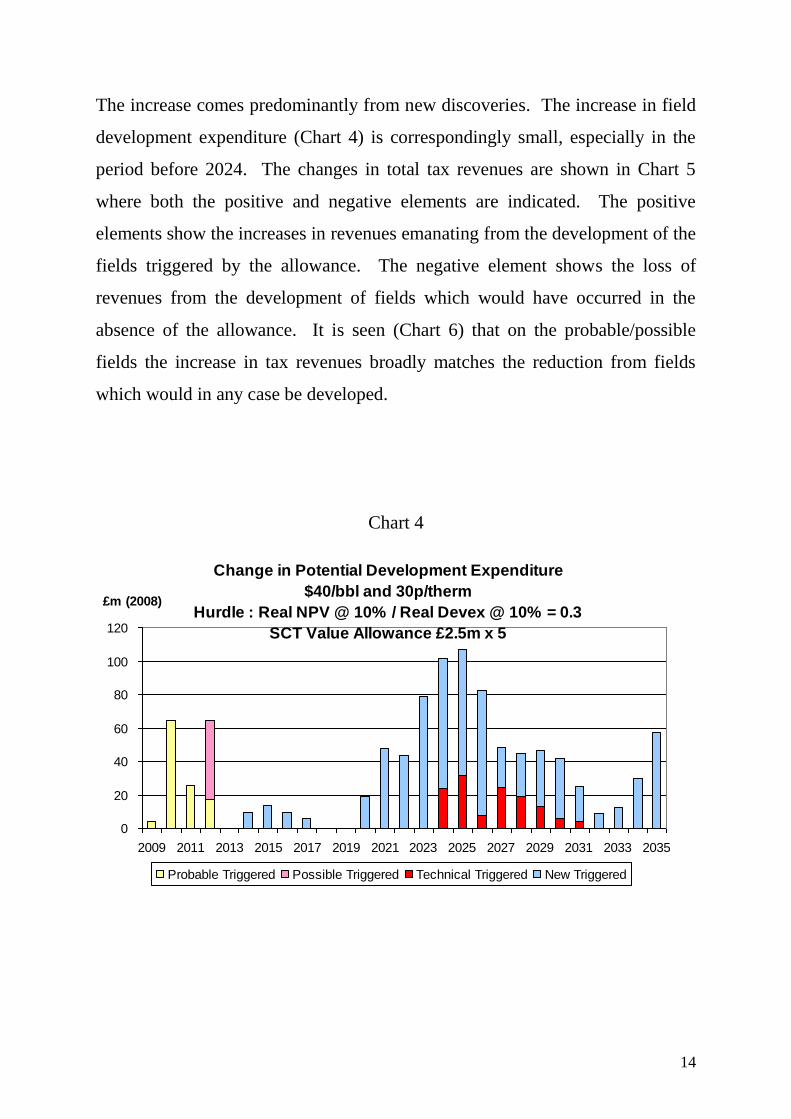
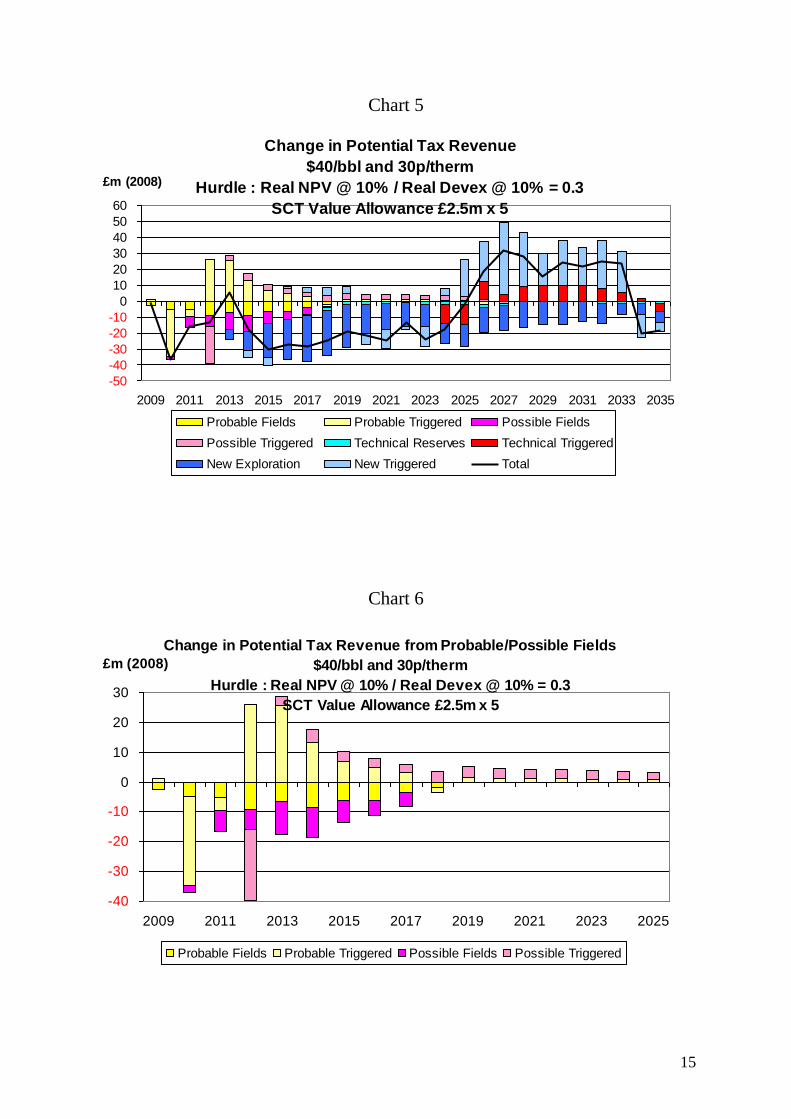
The increase comes predominantly from new discoveries. The increase in field
development expenditure (Chart 4) is correspondingly small, especially in the
period before 2024. The changes in total tax revenues are shown in Chart 5
where both the positive and negative elements are indicated. The positive
elements show the increases in revenues emanating from the development of the
fields triggered by the allowance. The negative element shows the loss of
revenues from the development of fields which would have occurred in the
absence of the allowance. It is seen (Chart 6) that on the probable/possible
fields the increase in tax revenues broadly matches the reduction from fields
which would in any case be developed.
Chart 4
Change in Potential Development Expenditure
$40/bbl and 30p/therm
Hurdle : Real NPV @ 10% / Real Devex @ 10% = 0.3
SCT Value Allowance £2.5m x 5
0
20
40
60
80
100
120
2009 2011 2013 2015 2017 2019 2021 2023 2025 2027 2029 2031 2033 2035
£m (2008)
Probable Triggered Possible Triggered Technical Triggered New Triggered
15
Chart 5
Change in Potential Tax Revenue
$40/bbl and 30p/therm
Hurdle : Real NPV @ 10% / Real Devex @ 10% = 0.3
SCT Value Allowance £2.5m x 5
-50
-40
-30
-20
-10
0
10
20
30
40
50
60
2009 2011 2013 2015 2017 2019 2021 2023 2025 2027 2029 2031 2033 2035
£m (2008)
Probable Fields Probable Triggered Possible Fields
Possible Triggered Technical Reserves Technical Triggered
New Exploration New Triggered Total
Chart 6
Change in Potential Tax Revenue from Probable/Possible Fields
$40/bbl and 30p/therm
Hurdle : Real NPV @ 10% / Real Devex @ 10% = 0.3
SCT Value Allowance £2.5m x 5
-40
-30
-20
-10
0
10
20
30
2009 2011 2013 2015 2017 2019 2021 2023 2025
£m (2008)
Probable Fields Probable Triggered Possible Fields Possible Triggered
16
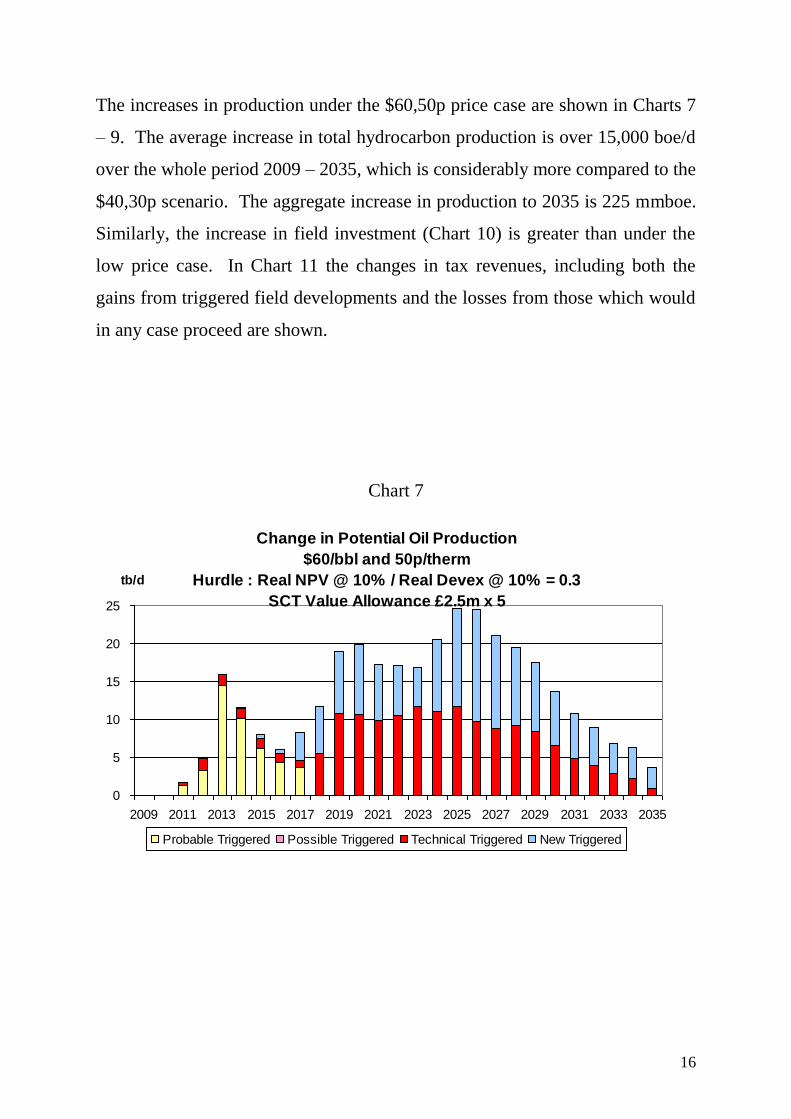
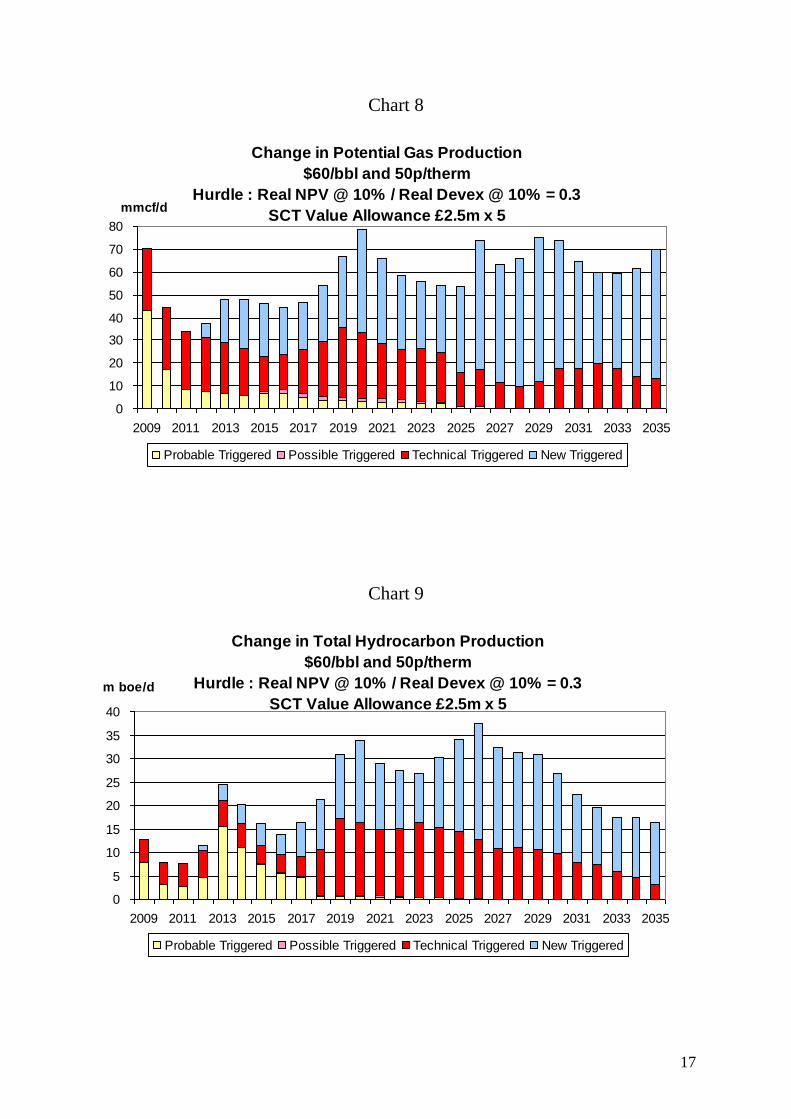
The increases in production under the $60,50p price case are shown in Charts 7
– 9. The average increase in total hydrocarbon production is over 15,000 boe/d
over the whole period 2009 – 2035, which is considerably more compared to the
$40,30p scenario. The aggregate increase in production to 2035 is 225 mmboe.
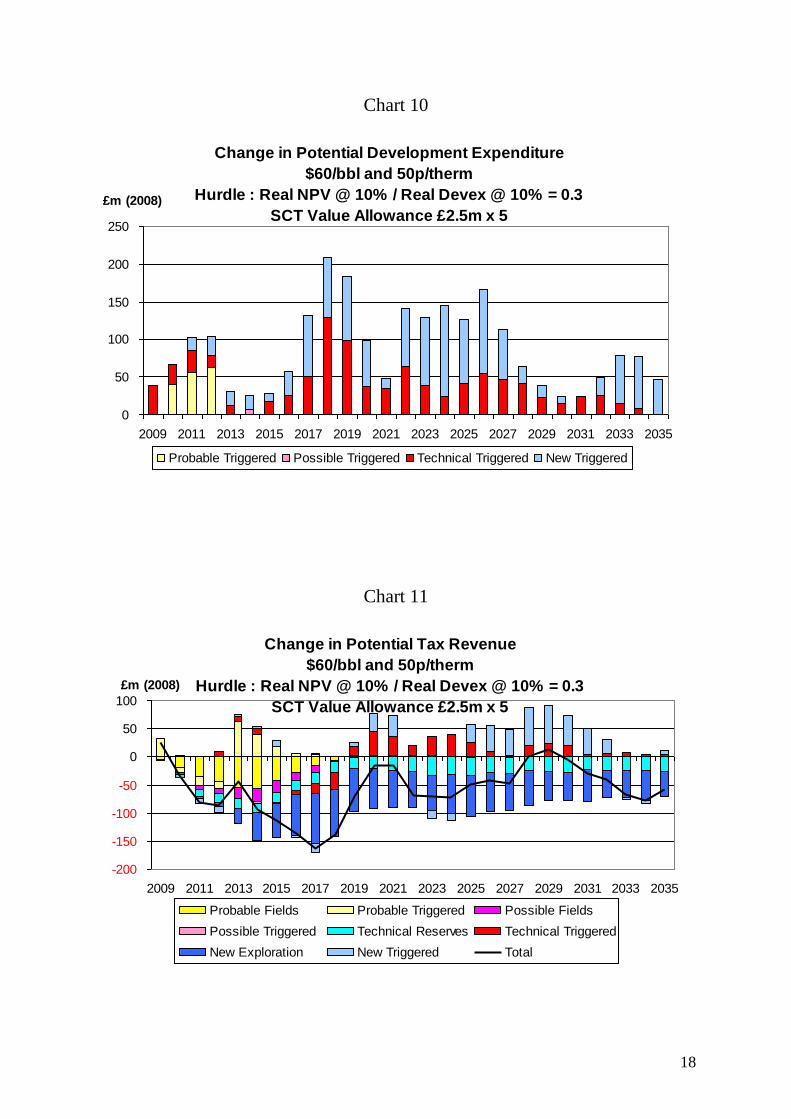
Similarly, the increase in field investment (Chart 10) is greater than under the
low price case. In Chart 11 the changes in tax revenues, including both the
gains from triggered field developments and the losses from those which would
in any case proceed are shown.
Chart 7
Change in Potential Oil Production
$60/bbl and 50p/therm
Hurdle : Real NPV @ 10% / Real Devex @ 10% = 0.3
SCT Value Allowance £2.5m x 5
0
5
10
15
20
25
2009 2011 2013 2015 2017 2019 2021 2023 2025 2027 2029 2031 2033 2035
tb/d
Probable Triggered Possible Triggered Technical Triggered New Triggered
17
Chart 8
Change in Potential Gas Production
$60/bbl and 50p/therm
Hurdle : Real NPV @ 10% / Real Devex @ 10% = 0.3
SCT Value Allowance £2.5m x 5
0
10
20
30
40
50
60
70
80
2009 2011 2013 2015 2017 2019 2021 2023 2025 2027 2029 2031 2033 2035
mmcf/d
Probable Triggered Possible Triggered Technical Triggered New Triggered
Chart 9
Change in Total Hydrocarbon Production
$60/bbl and 50p/therm
Hurdle : Real NPV @ 10% / Real Devex @ 10% = 0.3
SCT Value Allowance £2.5m x 5
0
5
10
15
20
25
30
35
40
2009 2011 2013 2015 2017 2019 2021 2023 2025 2027 2029 2031 2033 2035
m boe/d
Probable Triggered Possible Triggered Technical Triggered New Triggered
18
Chart 10
Change in Potential Development Expenditure
$60/bbl and 50p/therm
Hurdle : Real NPV @ 10% / Real Devex @ 10% = 0.3
SCT Value Allowance £2.5m x 5
0
50
100
150
200
250
2009 2011 2013 2015 2017 2019 2021 2023 2025 2027 2029 2031 2033 2035
£m (2008)
Probable Triggered Possible Triggered Technical Triggered New Triggered
Chart 11
Change in Potential Tax Revenue
$60/bbl and 50p/therm
Hurdle : Real NPV @ 10% / Real Devex @ 10% = 0.3
SCT Value Allowance £2.5m x 5
-200
-150
-100
-50
0
50
100
2009 2011 2013 2015 2017 2019 2021 2023 2025 2027 2029 2031 2033 2035
£m (2008)
Probable Fields Probable Triggered Possible Fields
Possible Triggered Technical Reserves Technical Triggered
New Exploration New Triggered Total

19
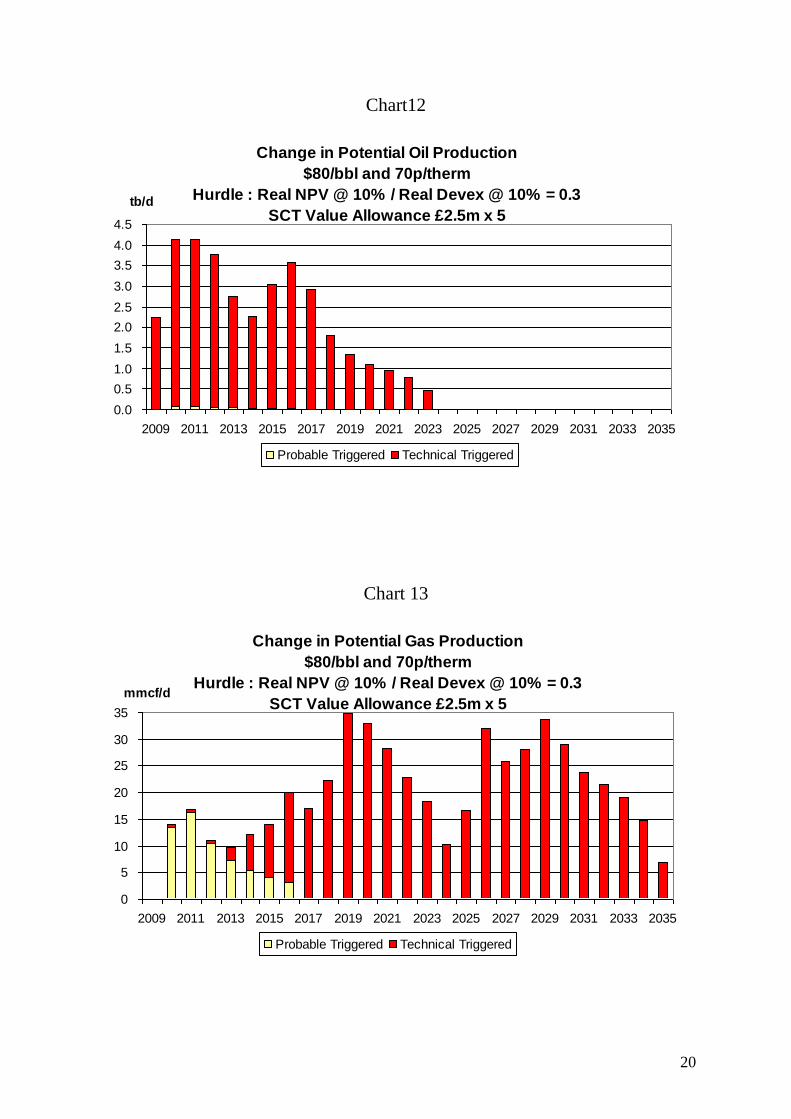
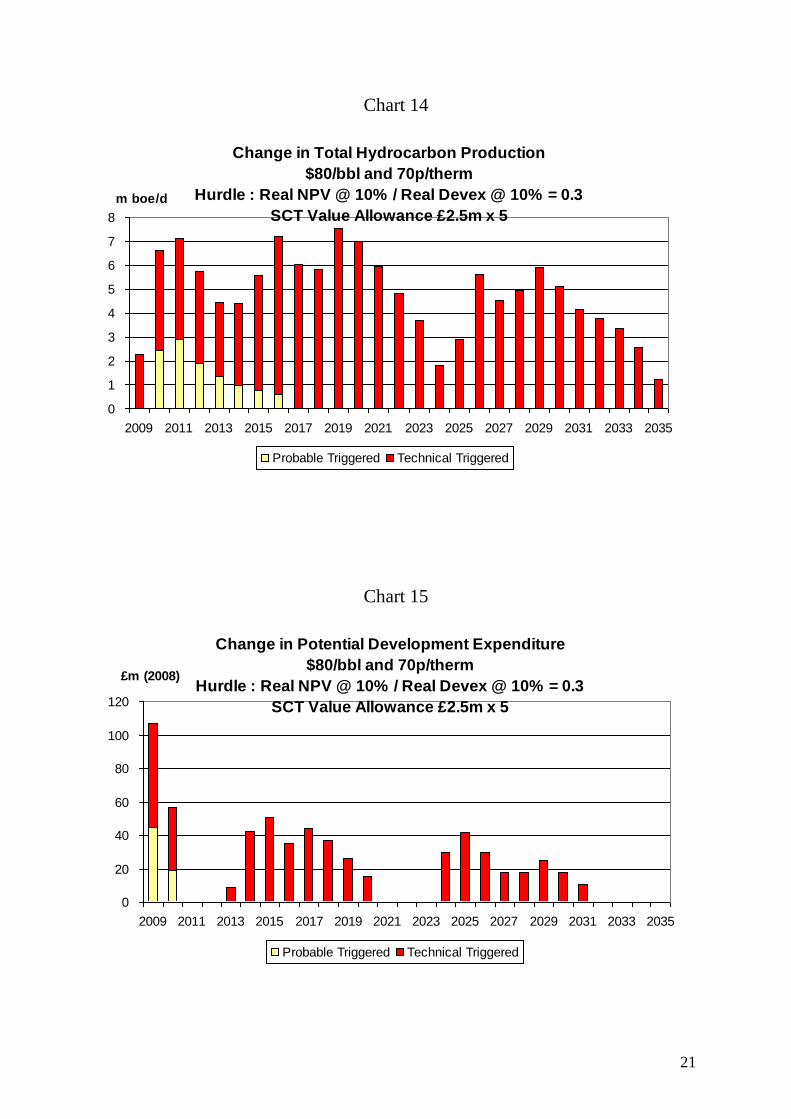
The increases in production under the $80,70p case are shown in Charts 12 – 14.
They are seen to be very small, reflecting the fact that very few developments
are triggered. The aggregate increase to 2035 is 48 mmboe. It should be
stressed that this is not because all fields are in any case economic in this
scenario. Large number of fields in the category of technical reserves remain
non-commercial with the small value allowance. Many become viable with the
larger allowances (see below). The overall increase in field development
expenditure (Chart 15) is modest, but the extra in 2009 is seen to be worthwhile.
20
Chart12
Change in Potential Oil Production
$80/bbl and 70p/therm
Hurdle : Real NPV @ 10% / Real Devex @ 10% = 0.3
SCT Value Allowance £2.5m x 5
0.0
0.5
1.0
1.5
2.0
2.5
3.0
3.5
4.0
4.5
2009 2011 2013 2015 2017 2019 2021 2023 2025 2027 2029 2031 2033 2035
tb/d
Probable Triggered Technical Triggered
Chart 13
Change in Potential Gas Production
$80/bbl and 70p/therm
Hurdle : Real NPV @ 10% / Real Devex @ 10% = 0.3
SCT Value Allowance £2.5m x 5
0
5
10
15
20
25
30
35
2009 2011 2013 2015 2017 2019 2021 2023 2025 2027 2029 2031 2033 2035
mmcf/d
Probable Triggered Technical Triggered
21
Chart 14
Change in Total Hydrocarbon Production
$80/bbl and 70p/therm
Hurdle : Real NPV @ 10% / Real Devex @ 10% = 0.3
SCT Value Allowance £2.5m x 5
0
1
2
3
4
5
6
7
8
2009 2011 2013 2015 2017 2019 2021 2023 2025 2027 2029 2031 2033 2035
m boe/d
Probable Triggered Technical Triggered
Chart 15
Change in Potential Development Expenditure
$80/bbl and 70p/therm
Hurdle : Real NPV @ 10% / Real Devex @ 10% = 0.3
SCT Value Allowance £2.5m x 5
0
20
40
60
80
100
120
2009 2011 2013 2015 2017 2019 2021 2023 2025 2027 2029 2031 2033 2035
£m (2008)
Probable Triggered Technical Triggered
22
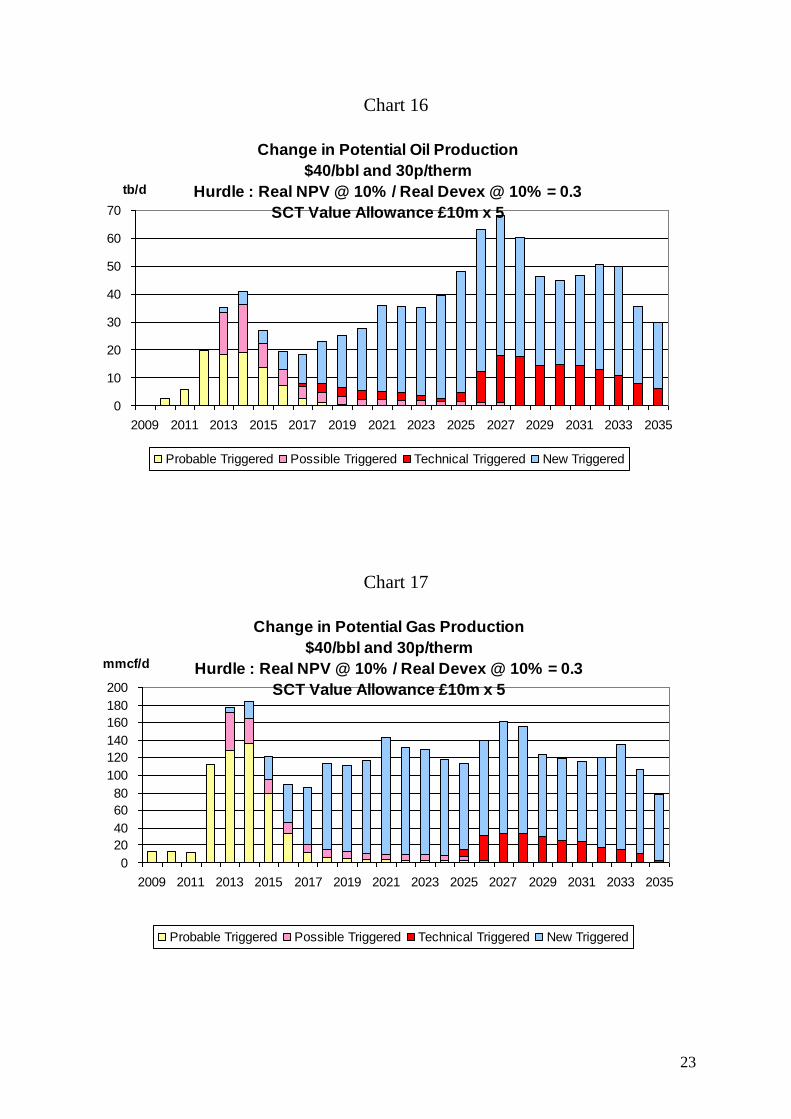
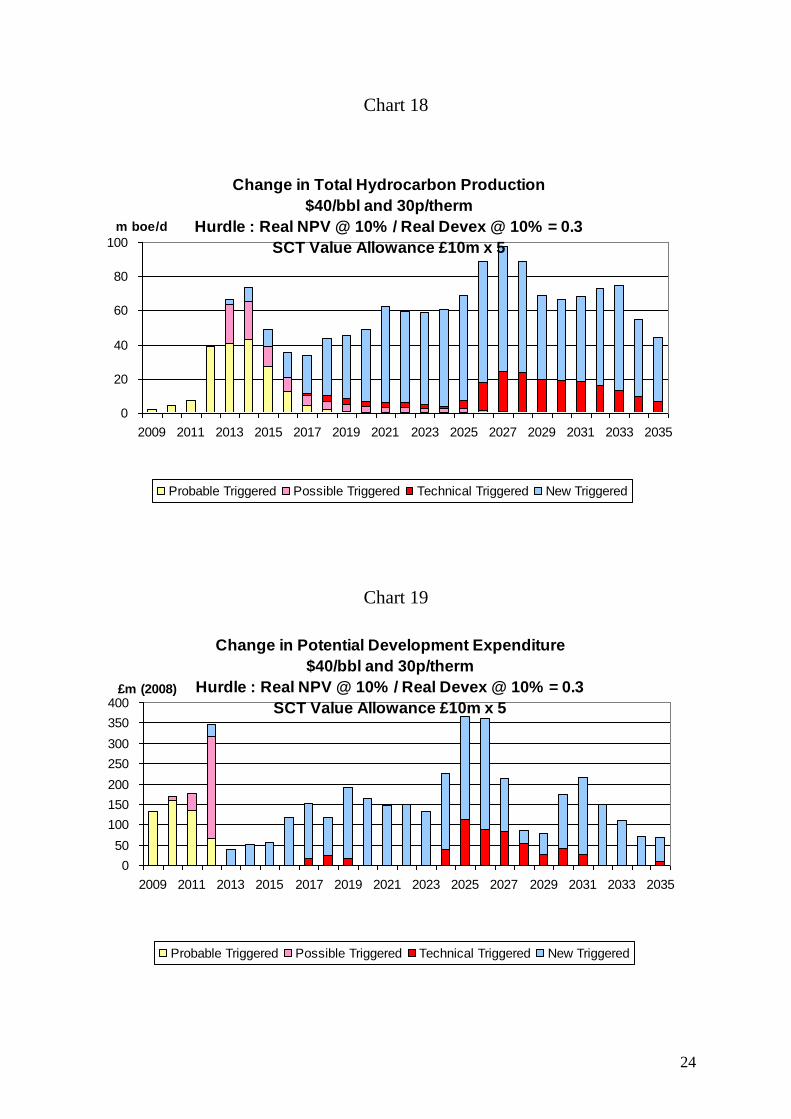
iii. Detailed Effects of Allowance of £50 million
The effects of the value allowance of £50 million on production are shown in
Charts 16 – 18 under the $40,30 pence case. The increase may be described as
substantial with the extra total hydrocarbon output from fields in the
probable/possible category averaging over 40,000 boe/d for 4 years in the
period 2012 – 2025. The aggregate increase to 2035 is 544 mmboe. Further, in
the period 2021 – 2033 inclusive the average increase in production is well in
excess of 60,000 boe/d. The corresponding increase in development investment
is also substantial (Chart 19). In the 4-year period 2009 – 2012 inclusive the
increase is around £840 million at 2008 prices. This would come at a very
welcome time period for the contracting sector. The changes in tax revenues
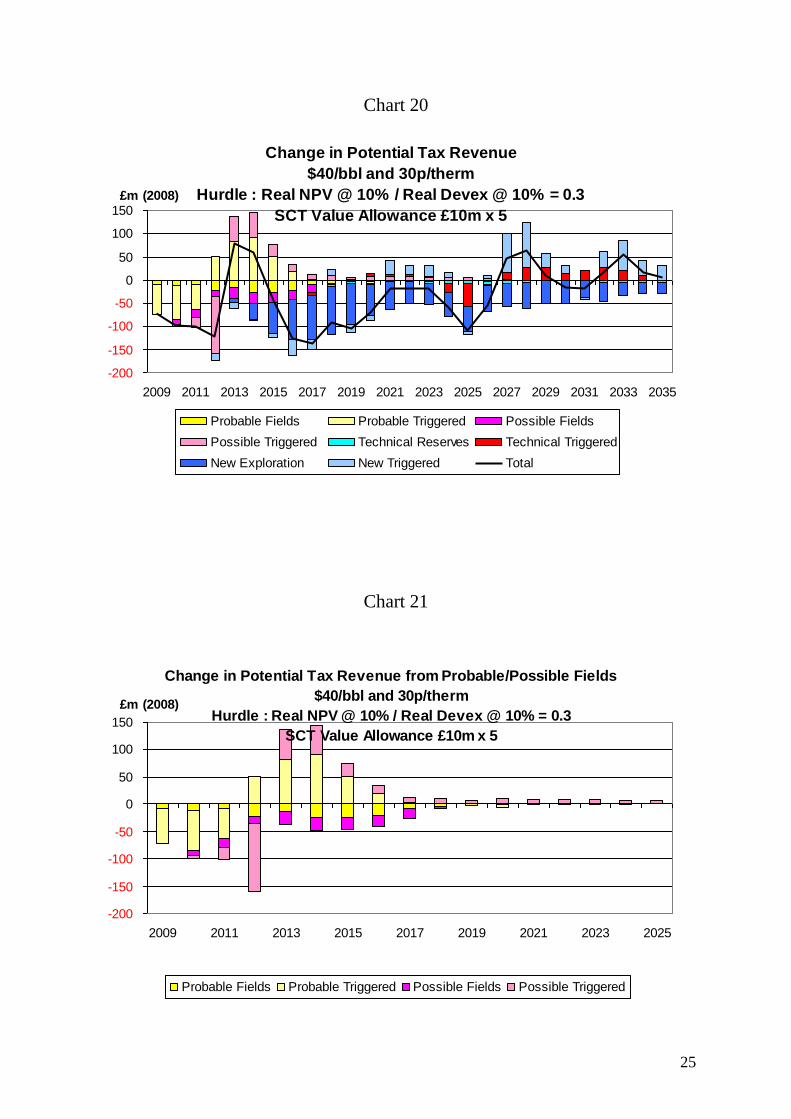
from all categories of fields are shown in Chart 20. The net effect is negative.
It is noteworthy that this outcome results from the loss of revenues from future
discoveries. When the fields in the probable/possible categories are considered
(Chart 21) it is seen that there is little net loss in tax revenues over the period.
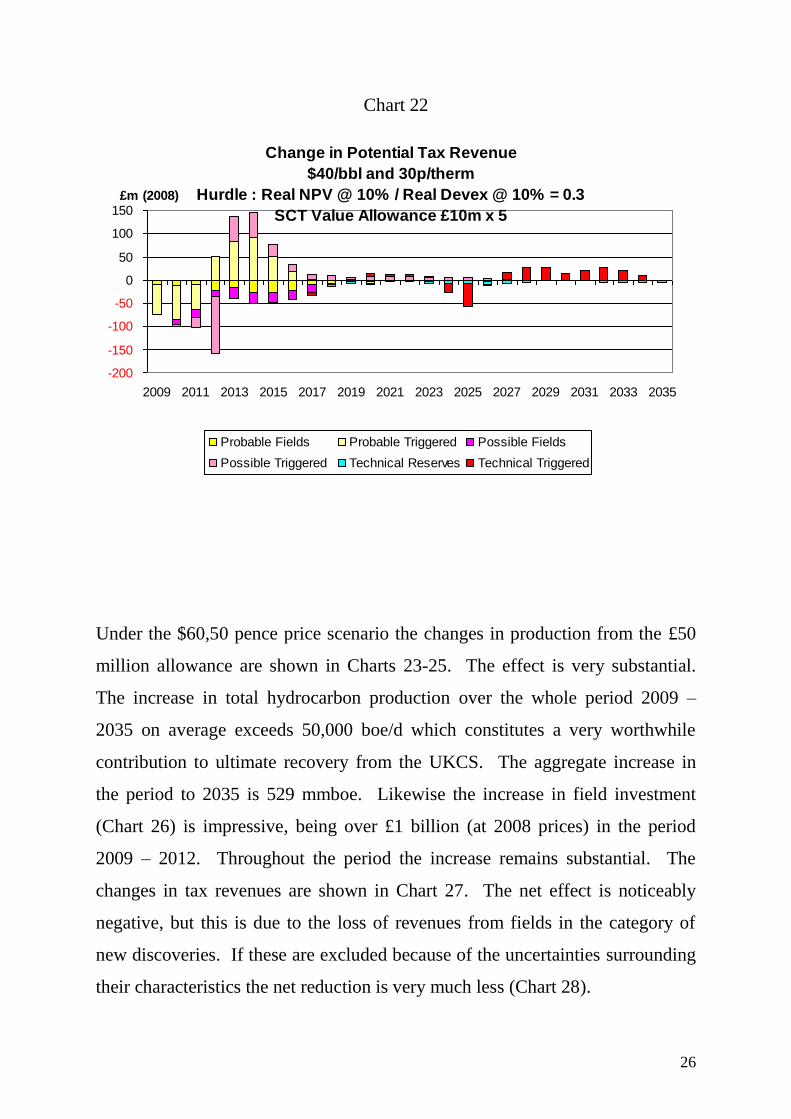
Similarly, when fields in all categories except new discoveries are considered
(Chart 22), the increase in tax revenues broadly equals the loss from fields
which would otherwise proceed.
23
Chart 16
Change in Potential Oil Production
$40/bbl and 30p/therm
Hurdle : Real NPV @ 10% / Real Devex @ 10% = 0.3
SCT Value Allowance £10m x 5
0
10
20
30
40
50
60
70
2009 2011 2013 2015 2017 2019 2021 2023 2025 2027 2029 2031 2033 2035
tb/d
Probable Triggered Possible Triggered Technical Triggered New Triggered
Chart 17
Change in Potential Gas Production
$40/bbl and 30p/therm
Hurdle : Real NPV @ 10% / Real Devex @ 10% = 0.3
SCT Value Allowance £10m x 5
0
20
40
60
80
100
120
140
160
180
200
2009 2011 2013 2015 2017 2019 2021 2023 2025 2027 2029 2031 2033 2035
mmcf/d
Probable Triggered Possible Triggered Technical Triggered New Triggered
24
Chart 18
Change in Total Hydrocarbon Production
$40/bbl and 30p/therm
Hurdle : Real NPV @ 10% / Real Devex @ 10% = 0.3
SCT Value Allowance £10m x 5
0
20
40
60
80
100
2009 2011 2013 2015 2017 2019 2021 2023 2025 2027 2029 2031 2033 2035
m boe/d
Probable Triggered Possible Triggered Technical Triggered New Triggered
Chart 19
Change in Potential Development Expenditure
$40/bbl and 30p/therm
Hurdle : Real NPV @ 10% / Real Devex @ 10% = 0.3
SCT Value Allowance £10m x 5
0
50
100
150
200
250
300
350
400
2009 2011 2013 2015 2017 2019 2021 2023 2025 2027 2029 2031 2033 2035
£m (2008)
Probable Triggered Possible Triggered Technical Triggered New Triggered
25
Chart 20
Change in Potential Tax Revenue
$40/bbl and 30p/therm
Hurdle : Real NPV @ 10% / Real Devex @ 10% = 0.3
SCT Value Allowance £10m x 5
-200
-150
-100
-50
0
50
100
150
2009 2011 2013 2015 2017 2019 2021 2023 2025 2027 2029 2031 2033 2035
£m (2008)
Probable Fields Probable Triggered Possible Fields
Possible Triggered Technical Reserves Technical Triggered
New Exploration New Triggered Total
Chart 21
Change in Potential Tax Revenue from Probable/Possible Fields
$40/bbl and 30p/therm
Hurdle : Real NPV @ 10% / Real Devex @ 10% = 0.3
SCT Value Allowance £10m x 5
-200
-150
-100
-50
0
50
100
150
2009 2011 2013 2015 2017 2019 2021 2023 2025
£m (2008)
Probable Fields Probable Triggered Possible Fields Possible Triggered
26
Chart 22
Change in Potential Tax Revenue
$40/bbl and 30p/therm
Hurdle : Real NPV @ 10% / Real Devex @ 10% = 0.3
SCT Value Allowance £10m x 5
-200
-150
-100
-50
0
50
100
150
2009 2011 2013 2015 2017 2019 2021 2023 2025 2027 2029 2031 2033 2035
£m (2008)
Probable Fields Probable Triggered Possible Fields
Possible Triggered Technical Reserves Technical Triggered
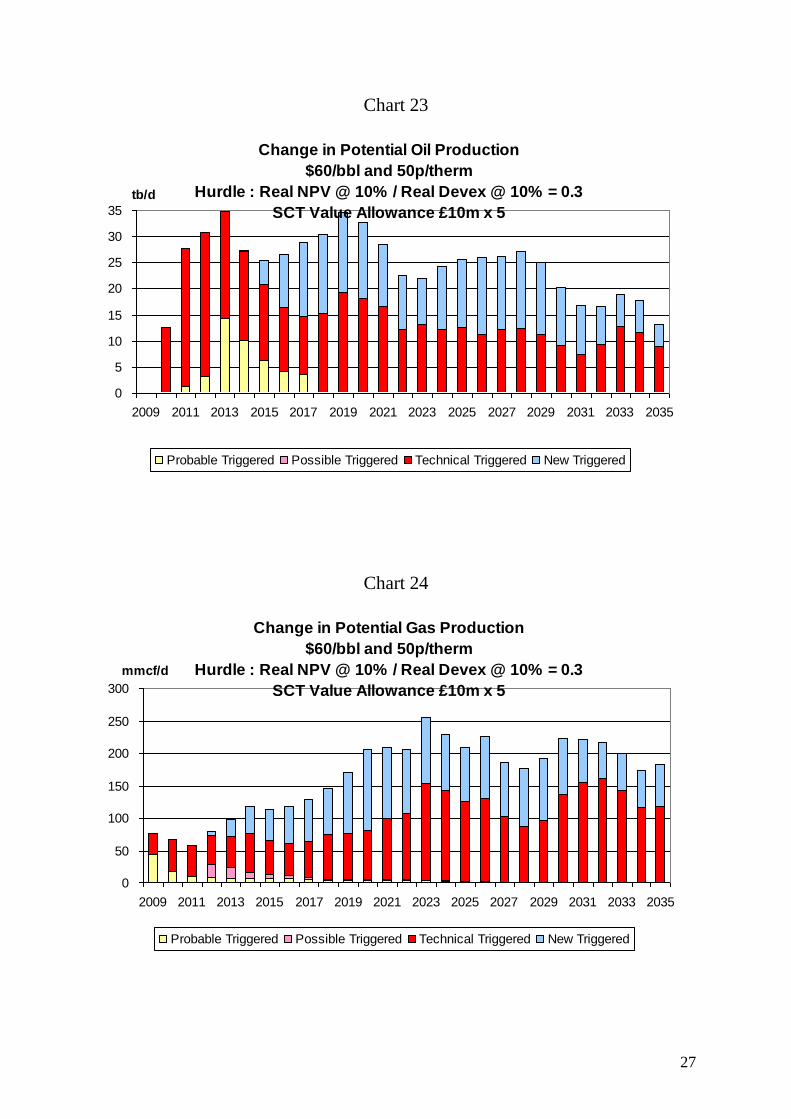
Under the $60,50 pence price scenario the changes in production from the £50
million allowance are shown in Charts 23-25. The effect is very substantial.
The increase in total hydrocarbon production over the whole period 2009 –
2035 on average exceeds 50,000 boe/d which constitutes a very worthwhile
contribution to ultimate recovery from the UKCS. The aggregate increase in
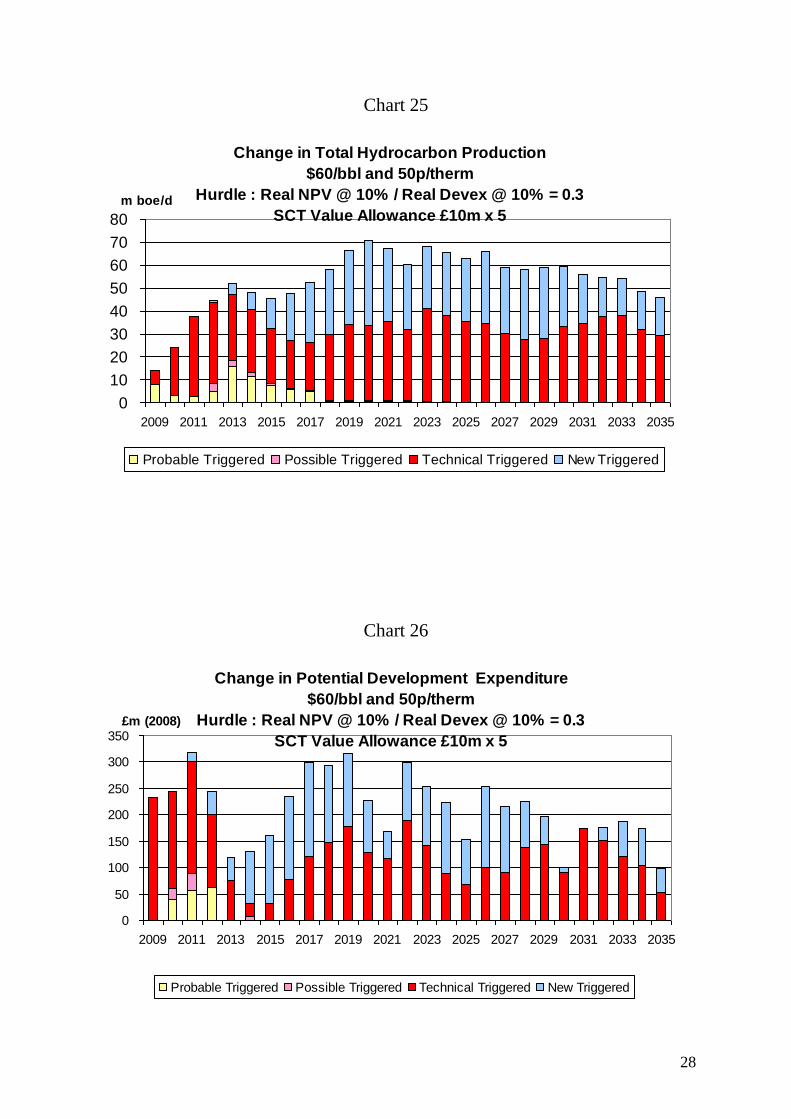
the period to 2035 is 529 mmboe. Likewise the increase in field investment
(Chart 26) is impressive, being over £1 billion (at 2008 prices) in the period
2009 – 2012. Throughout the period the increase remains substantial. The
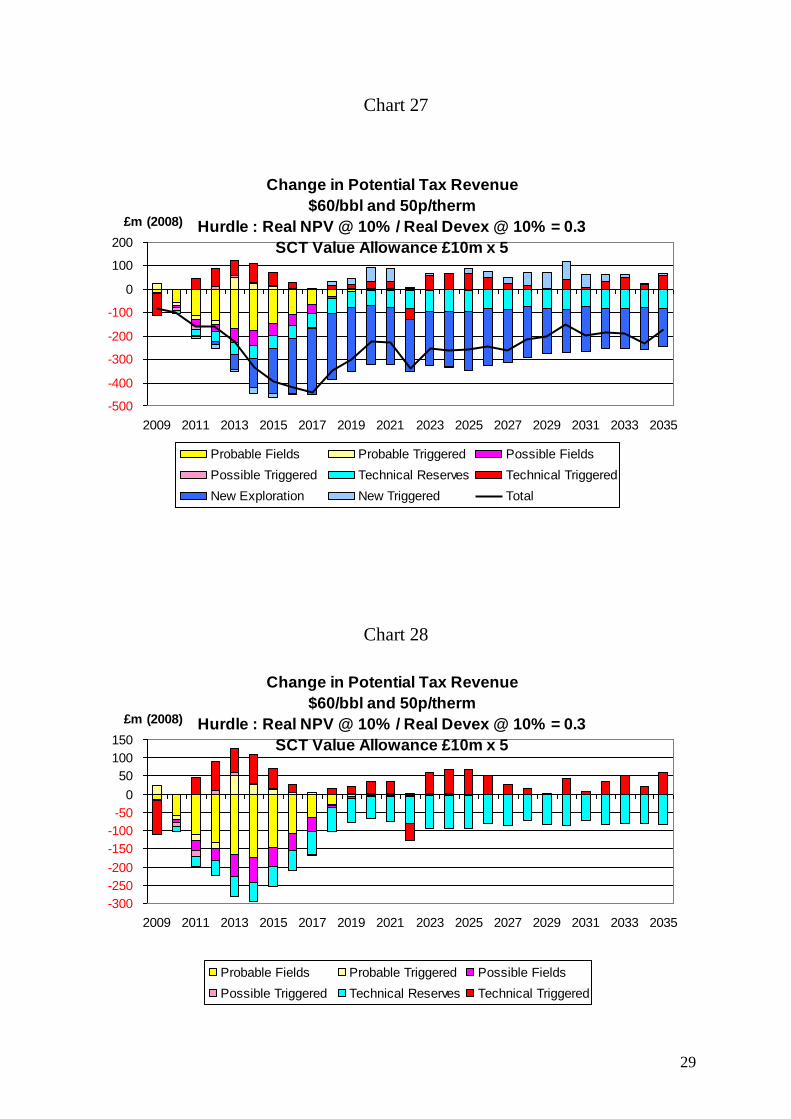
changes in tax revenues are shown in Chart 27. The net effect is noticeably
negative, but this is due to the loss of revenues from fields in the category of
new discoveries. If these are excluded because of the uncertainties surrounding
their characteristics the net reduction is very much less (Chart 28).
27
Chart 23
Change in Potential Oil Production
$60/bbl and 50p/therm
Hurdle : Real NPV @ 10% / Real Devex @ 10% = 0.3
SCT Value Allowance £10m x 5
0
5
10
15
20
25
30
35
2009 2011 2013 2015 2017 2019 2021 2023 2025 2027 2029 2031 2033 2035
tb/d
Probable Triggered Possible Triggered Technical Triggered New Triggered
Chart 24
Change in Potential Gas Production
$60/bbl and 50p/therm
Hurdle : Real NPV @ 10% / Real Devex @ 10% = 0.3
SCT Value Allowance £10m x 5
0
50
100
150
200
250
300
2009 2011 2013 2015 2017 2019 2021 2023 2025 2027 2029 2031 2033 2035
mmcf/d
Probable Triggered Possible Triggered Technical Triggered New Triggered
28
Chart 25
Change in Total Hydrocarbon Production
$60/bbl and 50p/therm
Hurdle : Real NPV @ 10% / Real Devex @ 10% = 0.3
SCT Value Allowance £10m x 5
0
10
20
30
40
50
60
70
80
2009 2011 2013 2015 2017 2019 2021 2023 2025 2027 2029 2031 2033 2035
m boe/d
Probable Triggered Possible Triggered Technical Triggered New Triggered
Chart 26
Change in Potential Development Expenditure
$60/bbl and 50p/therm
Hurdle : Real NPV @ 10% / Real Devex @ 10% = 0.3
SCT Value Allowance £10m x 5
0
50
100
150
200
250
300
350
2009 2011 2013 2015 2017 2019 2021 2023 2025 2027 2029 2031 2033 2035
£m (2008)
Probable Triggered Possible Triggered Technical Triggered New Triggered
29
Chart 27
Change in Potential Tax Revenue
$60/bbl and 50p/therm
Hurdle : Real NPV @ 10% / Real Devex @ 10% = 0.3
SCT Value Allowance £10m x 5
-500
-400
-300
-200
-100
0
100
200
2009 2011 2013 2015 2017 2019 2021 2023 2025 2027 2029 2031 2033 2035
£m (2008)
Probable Fields Probable Triggered Possible Fields
Possible Triggered Technical Reserves Technical Triggered
New Exploration New Triggered Total
Chart 28
Change in Potential Tax Revenue
$60/bbl and 50p/therm
Hurdle : Real NPV @ 10% / Real Devex @ 10% = 0.3
SCT Value Allowance £10m x 5
-300
-250
-200
-150
-100
-50
0
50
100
150
2009 2011 2013 2015 2017 2019 2021 2023 2025 2027 2029 2031 2033 2035
£m (2008)
Probable Fields Probable Triggered Possible Fields
Possible Triggered Technical Reserves Technical Triggered
30
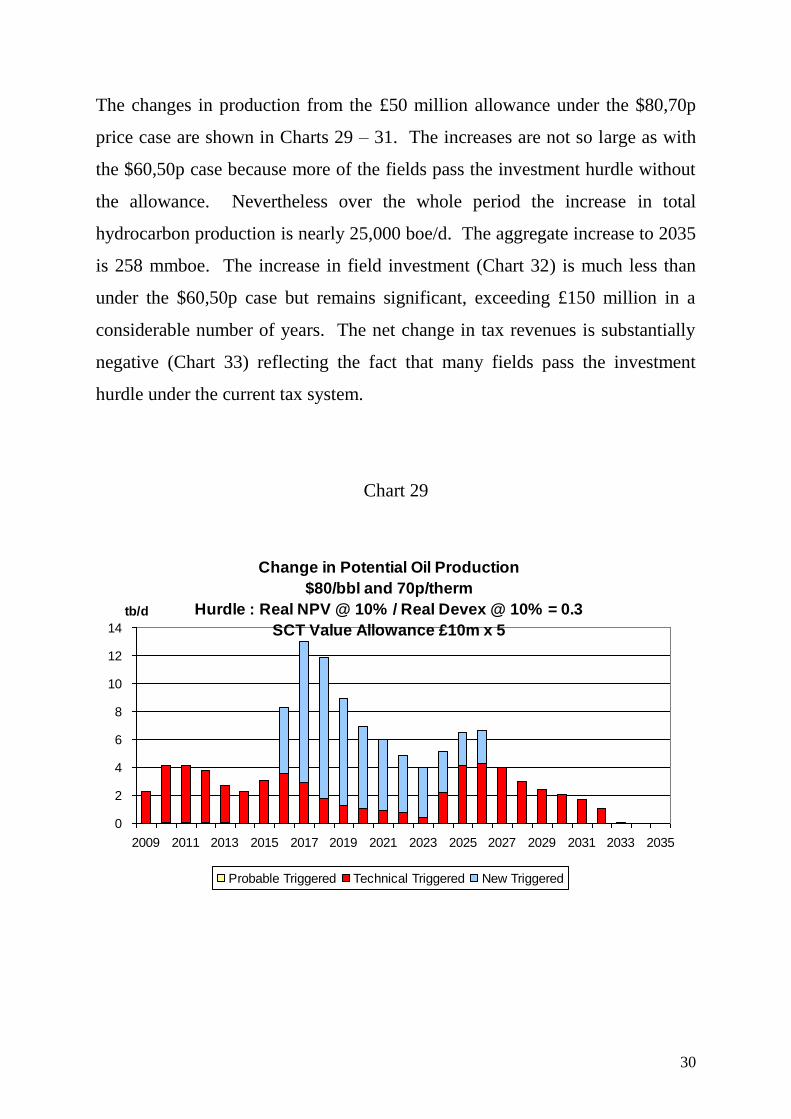
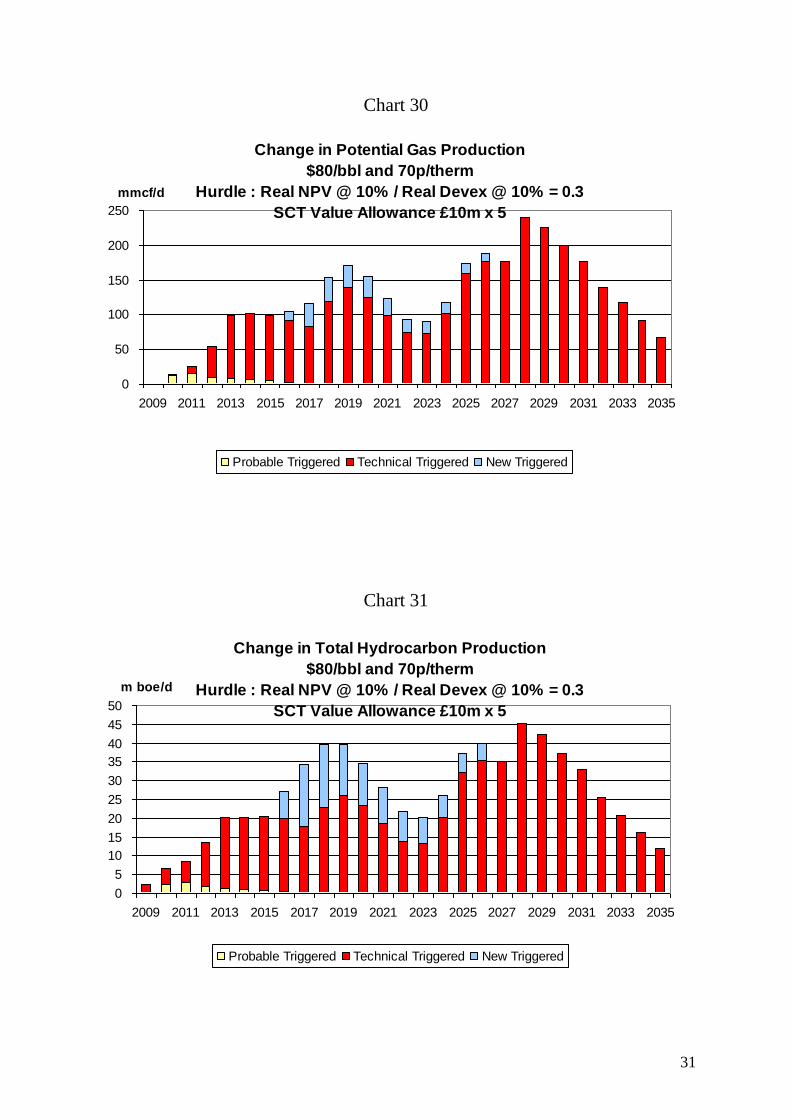
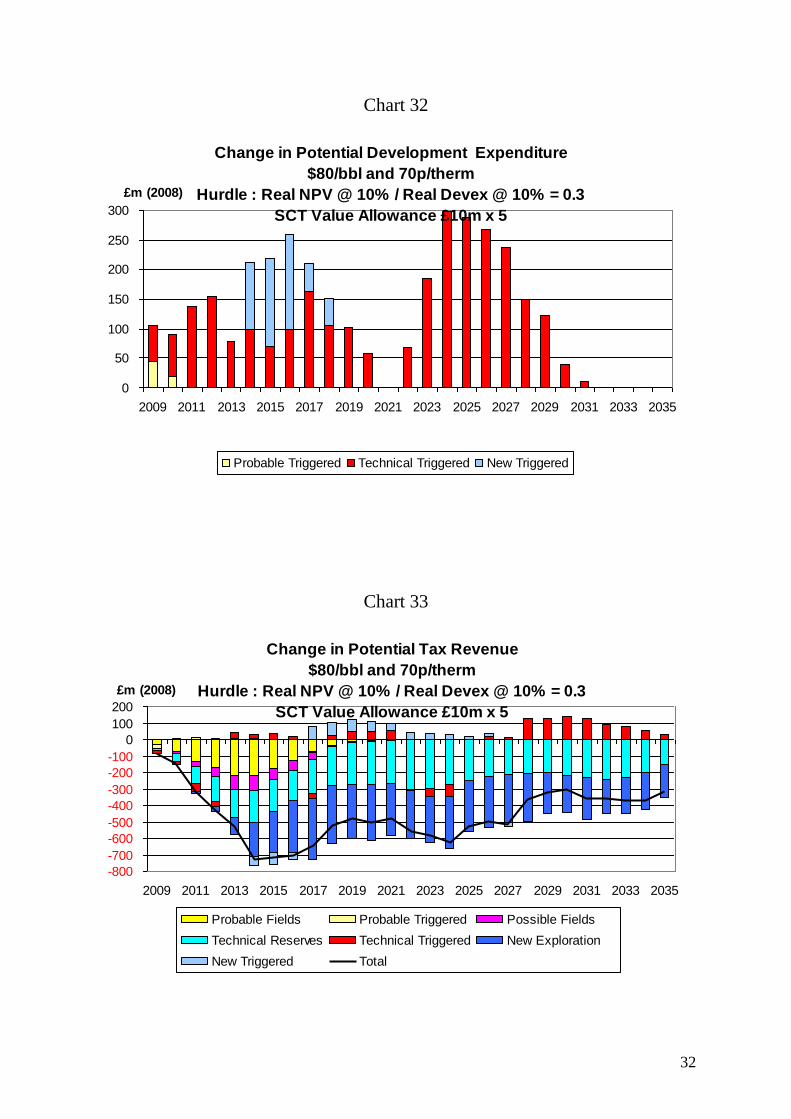
The changes in production from the £50 million allowance under the $80,70p
price case are shown in Charts 29 – 31. The increases are not so large as with
the $60,50p case because more of the fields pass the investment hurdle without
the allowance. Nevertheless over the whole period the increase in total
hydrocarbon production is nearly 25,000 boe/d. The aggregate increase to 2035
is 258 mmboe. The increase in field investment (Chart 32) is much less than
under the $60,50p case but remains significant, exceeding £150 million in a
considerable number of years. The net change in tax revenues is substantially
negative (Chart 33) reflecting the fact that many fields pass the investment
hurdle under the current tax system.
Chart 29
Change in Potential Oil Production
$80/bbl and 70p/therm
Hurdle : Real NPV @ 10% / Real Devex @ 10% = 0.3
SCT Value Allowance £10m x 5
0
2
4
6
8
10
12
14
2009 2011 2013 2015 2017 2019 2021 2023 2025 2027 2029 2031 2033 2035
tb/d
Probable Triggered Technical Triggered New Triggered
31
Chart 30
Change in Potential Gas Production
$80/bbl and 70p/therm
Hurdle : Real NPV @ 10% / Real Devex @ 10% = 0.3
SCT Value Allowance £10m x 5
0
50
100
150
200
250
2009 2011 2013 2015 2017 2019 2021 2023 2025 2027 2029 2031 2033 2035
mmcf/d
Probable Triggered Technical Triggered New Triggered
Chart 31
Change in Total Hydrocarbon Production
$80/bbl and 70p/therm
Hurdle : Real NPV @ 10% / Real Devex @ 10% = 0.3
SCT Value Allowance £10m x 5
0
5
10
15
20
25
30
35
40
45
50
2009 2011 2013 2015 2017 2019 2021 2023 2025 2027 2029 2031 2033 2035
m boe/d
Probable Triggered Technical Triggered New Triggered
32
Chart 32
Change in Potential Development Expenditure
$80/bbl and 70p/therm
Hurdle : Real NPV @ 10% / Real Devex @ 10% = 0.3
SCT Value Allowance £10m x 5
0
50
100
150
200
250
300
2009 2011 2013 2015 2017 2019 2021 2023 2025 2027 2029 2031 2033 2035
£m (2008)
Probable Triggered Technical Triggered New Triggered
Chart 33
Change in Potential Tax Revenue
$80/bbl and 70p/therm
Hurdle : Real NPV @ 10% / Real Devex @ 10% = 0.3
SCT Value Allowance £10m x 5
-800
-700
-600
-500
-400
-300
-200
-100
0
100
200
2009 2011 2013 2015 2017 2019 2021 2023 2025 2027 2029 2031 2033 2035
£m (2008)
Probable Fields Probable Triggered Possible Fields
Technical Reserves Technical Triggered New Exploration
New Triggered Total
33
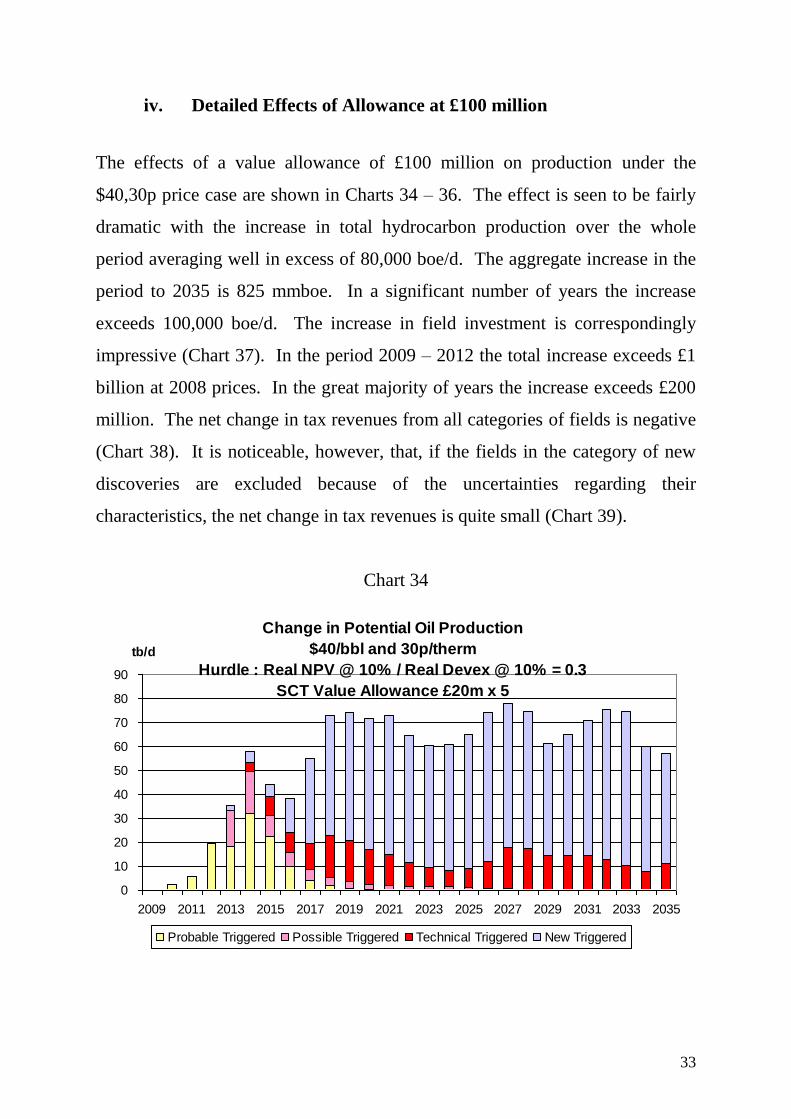
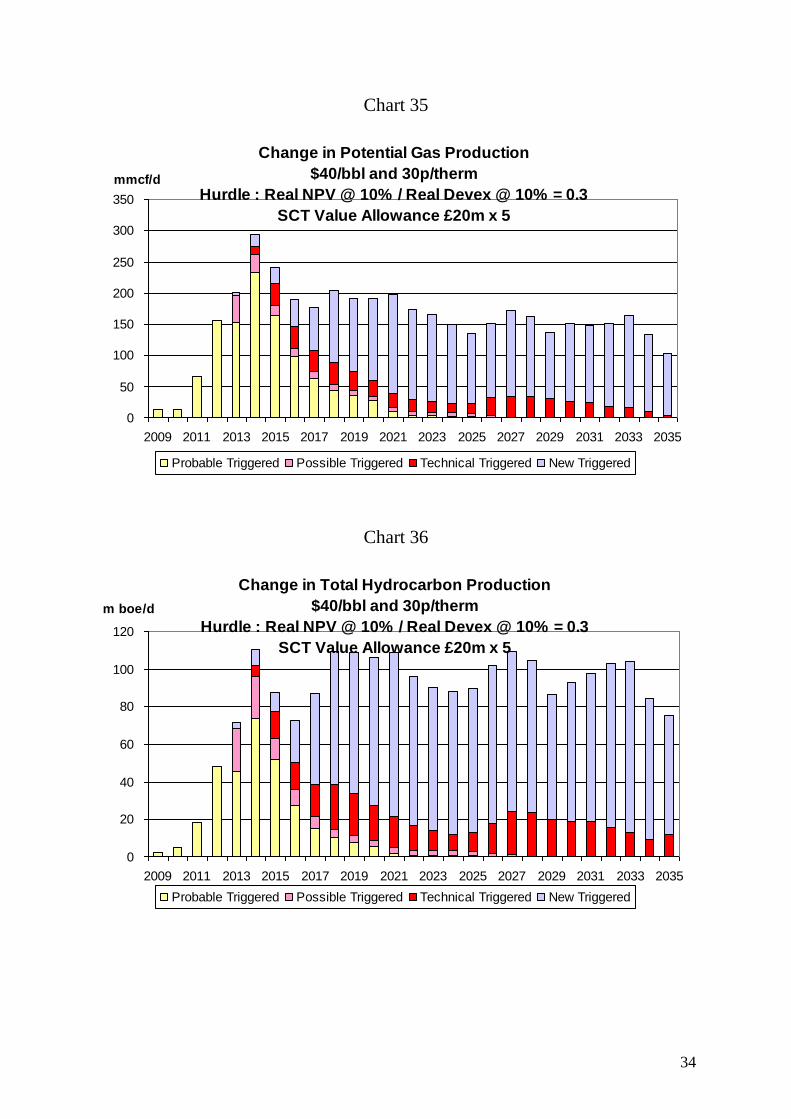
iv. Detailed Effects of Allowance at £100 million
The effects of a value allowance of £100 million on production under the
$40,30p price case are shown in Charts 34 – 36. The effect is seen to be fairly
dramatic with the increase in total hydrocarbon production over the whole
period averaging well in excess of 80,000 boe/d. The aggregate increase in the
period to 2035 is 825 mmboe. In a significant number of years the increase
exceeds 100,000 boe/d. The increase in field investment is correspondingly
impressive (Chart 37). In the period 2009 – 2012 the total increase exceeds £1
billion at 2008 prices. In the great majority of years the increase exceeds £200
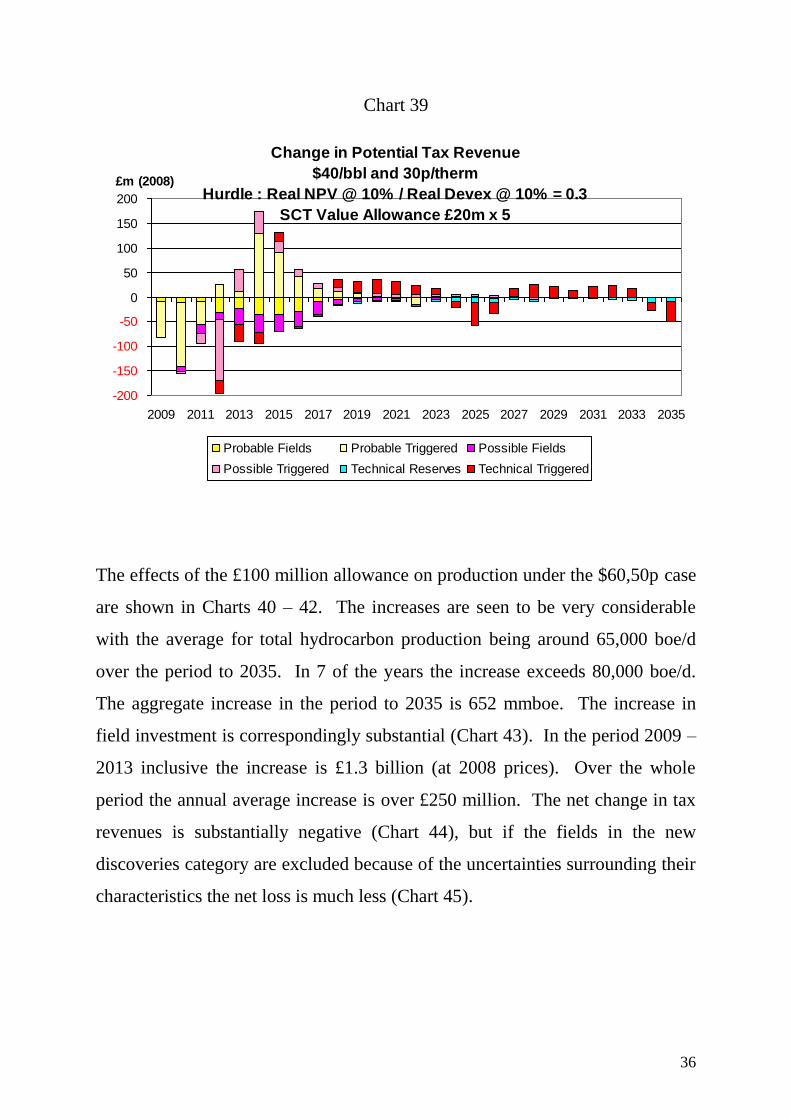
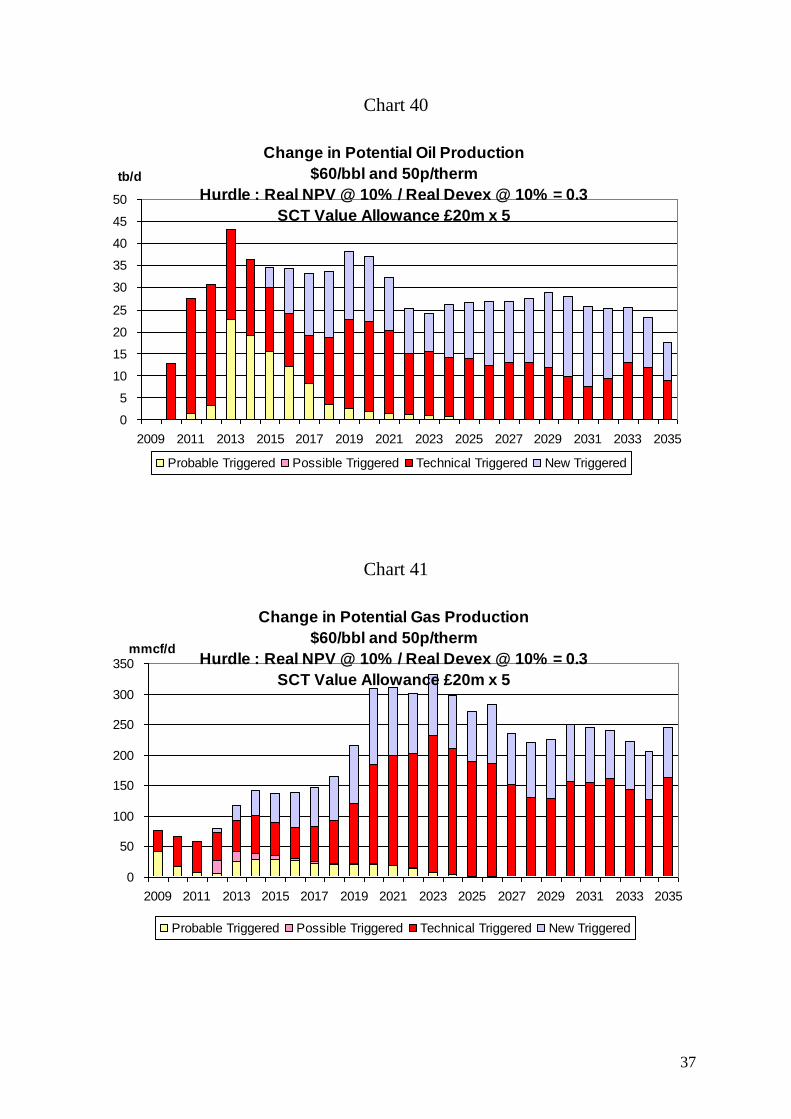
million. The net change in tax revenues from all categories of fields is negative
(Chart 38). It is noticeable, however, that, if the fields in the category of new
discoveries are excluded because of the uncertainties regarding their
characteristics, the net change in tax revenues is quite small (Chart 39).
Chart 34
Change in Potential Oil Production
$40/bbl and 30p/therm
Hurdle : Real NPV @ 10% / Real Devex @ 10% = 0.3
SCT Value Allowance £20m x 5
0
10
20
30
40
50
60
70
80
90
2009 2011 2013 2015 2017 2019 2021 2023 2025 2027 2029 2031 2033 2035
tb/d
Probable Triggered Possible Triggered Technical Triggered New Triggered
34
Chart 35
Change in Potential Gas Production
$40/bbl and 30p/therm
Hurdle : Real NPV @ 10% / Real Devex @ 10% = 0.3
SCT Value Allowance £20m x 5
0
50
100
150
200
250
300
350
2009 2011 2013 2015 2017 2019 2021 2023 2025 2027 2029 2031 2033 2035
mmcf/d
Probable Triggered Possible Triggered Technical Triggered New Triggered
Chart 36
Change in Total Hydrocarbon Production
$40/bbl and 30p/therm
Hurdle : Real NPV @ 10% / Real Devex @ 10% = 0.3
SCT Value Allowance £20m x 5
0
20
40
60
80
100
120
2009 2011 2013 2015 2017 2019 2021 2023 2025 2027 2029 2031 2033 2035
m boe/d
Probable Triggered Possible Triggered Technical Triggered New Triggered
35
Chart 37
Change in Potential Development Expenditure
$40/bbl and 30p/therm
Hurdle : Real NPV @ 10% / Real Devex @ 10% = 0.3
SCT Value Allowance £20m x 5
0
50
100
150
200
250
300
350
400
450
500
2009 2011 2013 2015 2017 2019 2021 2023 2025 2027 2029 2031 2033 2035
£m (2008)
Probable Triggered Possible Triggered Technical Triggered New Triggered
Chart 38
Change in Potential Tax Revenue
$40/bbl and 30p/therm
Hurdle : Real NPV @ 10% / Real Devex @ 10% = 0.3
SCT Value Allowance £20m x 5
-300
-250
-200
-150
-100
-50
0
50
100
150
200
2009 2011 2013 2015 2017 2019 2021 2023 2025 2027 2029 2031 2033 2035
£m (2008)
Probable Fields Probable Triggered Possible Fields
Possible Triggered Technical Reserves Technical Triggered
New Exploration New Triggered Total
36
Chart 39
Change in Potential Tax Revenue
$40/bbl and 30p/therm
Hurdle : Real NPV @ 10% / Real Devex @ 10% = 0.3
SCT Value Allowance £20m x 5
-200
-150
-100
-50
0
50
100
150
200
2009 2011 2013 2015 2017 2019 2021 2023 2025 2027 2029 2031 2033 2035
£m (2008)
Probable Fields Probable Triggered Possible Fields
Possible Triggered Technical Reserves Technical Triggered
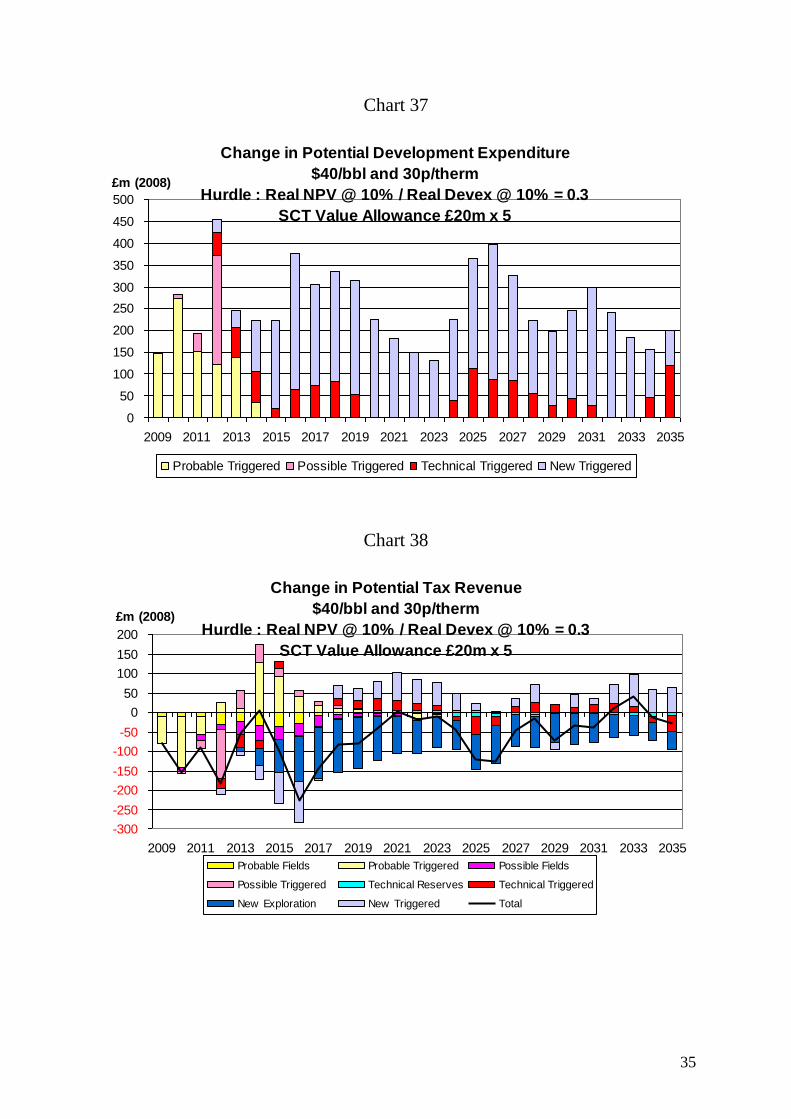
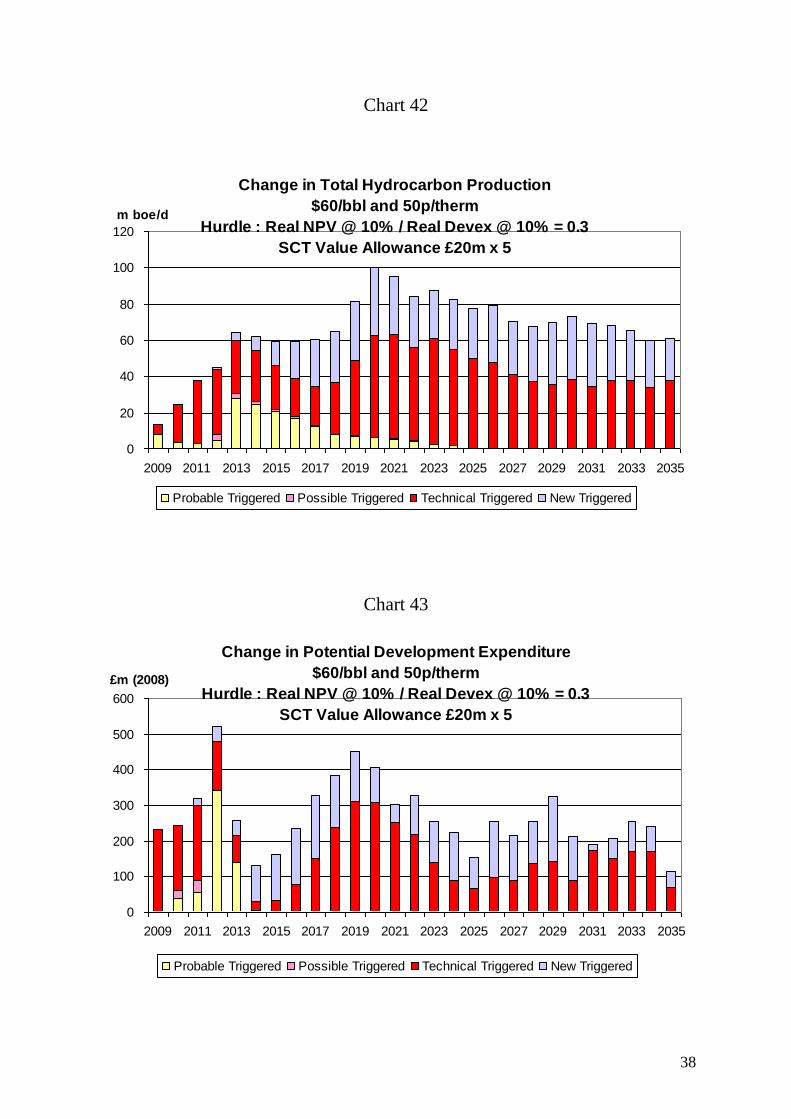
The effects of the £100 million allowance on production under the $60,50p case
are shown in Charts 40 – 42. The increases are seen to be very considerable
with the average for total hydrocarbon production being around 65,000 boe/d
over the period to 2035. In 7 of the years the increase exceeds 80,000 boe/d.
The aggregate increase in the period to 2035 is 652 mmboe. The increase in
field investment is correspondingly substantial (Chart 43). In the period 2009 –
2013 inclusive the increase is £1.3 billion (at 2008 prices). Over the whole
period the annual average increase is over £250 million. The net change in tax
revenues is substantially negative (Chart 44), but if the fields in the new
discoveries category are excluded because of the uncertainties surrounding their
characteristics the net loss is much less (Chart 45).
37
Chart 40
Change in Potential Oil Production
$60/bbl and 50p/therm
Hurdle : Real NPV @ 10% / Real Devex @ 10% = 0.3
SCT Value Allowance £20m x 5
0
5
10
15
20
25
30
35
40
45
50
2009 2011 2013 2015 2017 2019 2021 2023 2025 2027 2029 2031 2033 2035
tb/d
Probable Triggered Possible Triggered Technical Triggered New Triggered
Chart 41
Change in Potential Gas Production
$60/bbl and 50p/therm
Hurdle : Real NPV @ 10% / Real Devex @ 10% = 0.3
SCT Value Allowance £20m x 5
0
50
100
150
200
250
300
350
2009 2011 2013 2015 2017 2019 2021 2023 2025 2027 2029 2031 2033 2035
mmcf/d
Probable Triggered Possible Triggered Technical Triggered New Triggered
38
Chart 42
Change in Total Hydrocarbon Production
$60/bbl and 50p/therm
Hurdle : Real NPV @ 10% / Real Devex @ 10% = 0.3
SCT Value Allowance £20m x 5
0
20
40
60
80
100
120
2009 2011 2013 2015 2017 2019 2021 2023 2025 2027 2029 2031 2033 2035
m boe/d
Probable Triggered Possible Triggered Technical Triggered New Triggered
Chart 43
Change in Potential Development Expenditure
$60/bbl and 50p/therm
Hurdle : Real NPV @ 10% / Real Devex @ 10% = 0.3
SCT Value Allowance £20m x 5
0
100
200
300
400
500
600
2009 2011 2013 2015 2017 2019 2021 2023 2025 2027 2029 2031 2033 2035
£m (2008)
Probable Triggered Possible Triggered Technical Triggered New Triggered
39
Chart 44
Change in Potential Tax Revenue
$60/bbl and 50p/therm
Hurdle : Real NPV @ 10% / Real Devex @ 10% = 0.3
SCT Value Allowance £20m x 5
-700
-600
-500
-400
-300
-200
-100
0
100
200
2009 2011 2013 2015 2017 2019 2021 2023 2025 2027 2029 2031 2033 2035
£m (2008)
Probable Fields Probable Triggered Possible Fields
Possible Triggered Technical Reserves Technical Triggered
New Exploration New Triggered Total
Chart 45
Change in Potential Tax Revenue
$60/bbl and 50p/therm
Hurdle : Real NPV @ 10% / Real Devex @ 10% = 0.3
SCT Value Allowance £20m x 5
-500
-400
-300
-200
-100
0
100
200
2009 2011 2013 2015 2017 2019 2021 2023 2025 2027 2029 2031 2033 2035
£m (2008)
Probable Fields Probable Triggered Possible Fields
Possible Triggered Technical Reserves Technical Triggered
40
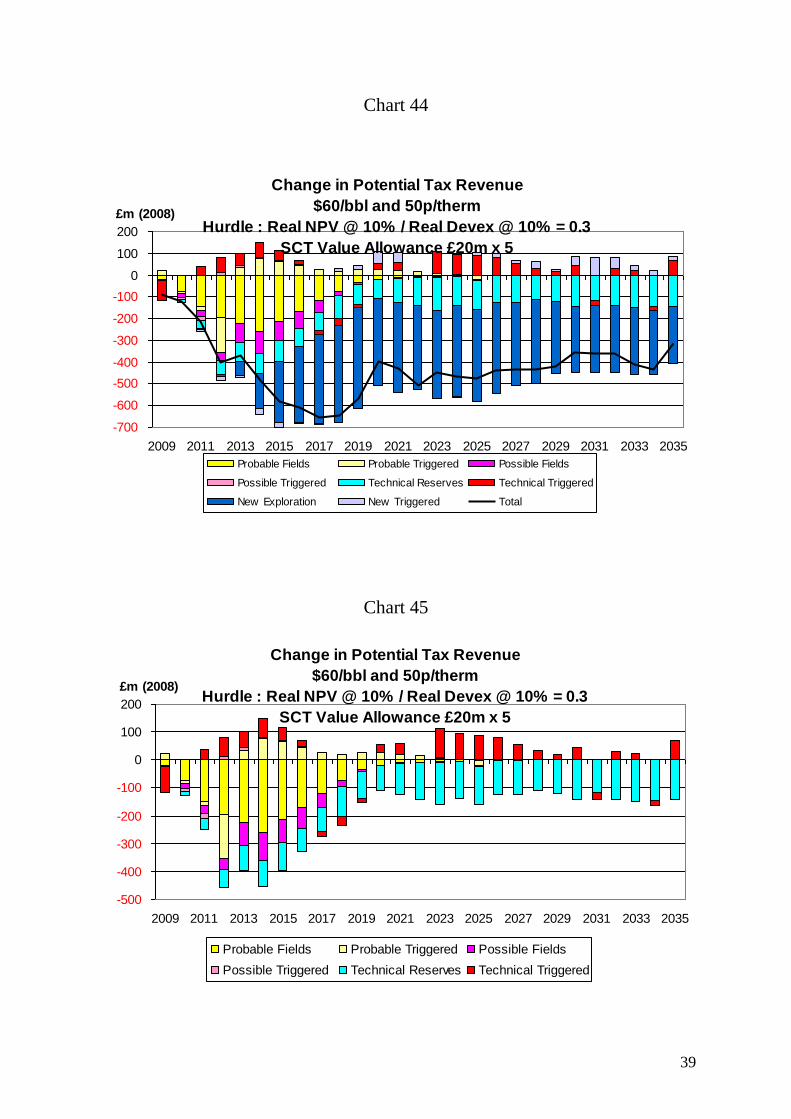
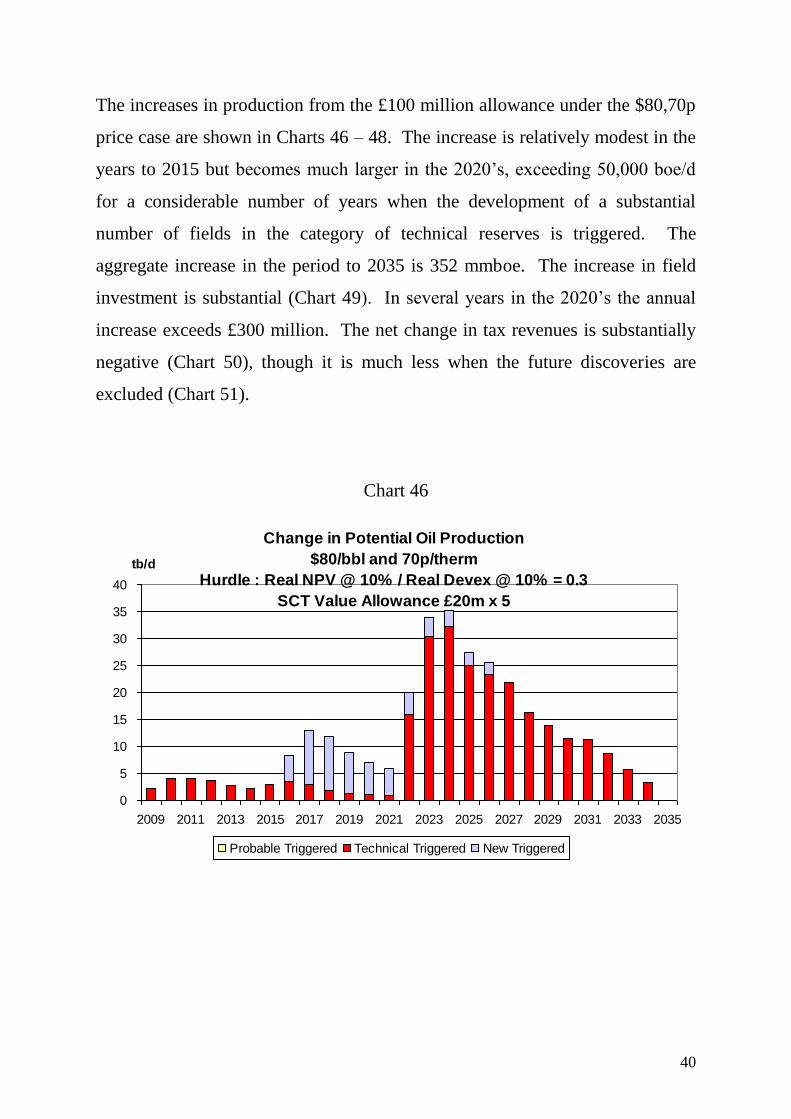
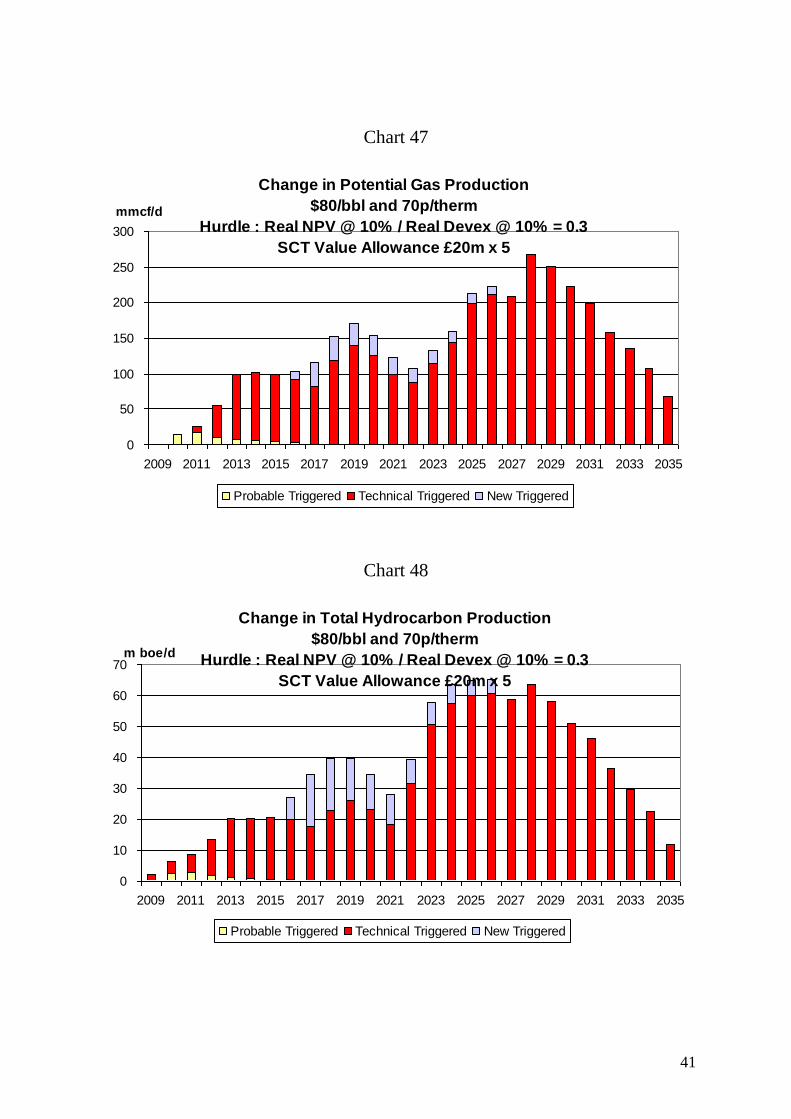
The increases in production from the £100 million allowance under the $80,70p
price case are shown in Charts 46 – 48. The increase is relatively modest in the
years to 2015 but becomes much larger in the 2020’s, exceeding 50,000 boe/d
for a considerable number of years when the development of a substantial
number of fields in the category of technical reserves is triggered. The
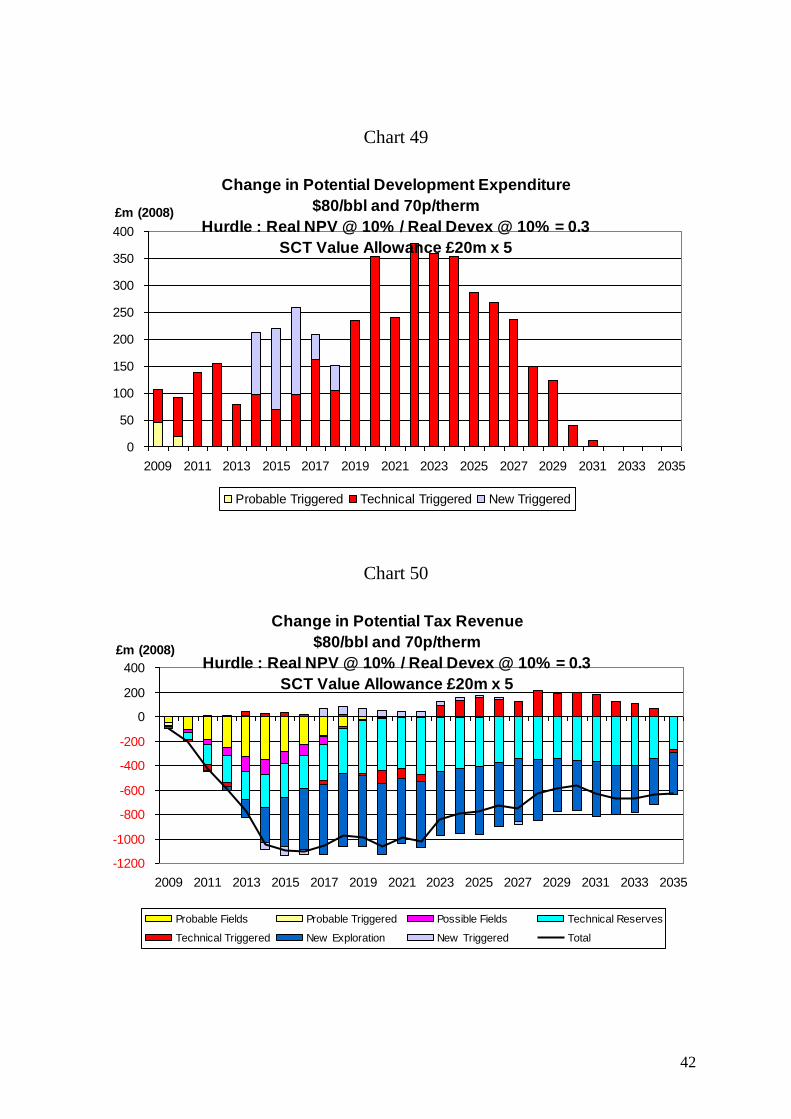
aggregate increase in the period to 2035 is 352 mmboe. The increase in field
investment is substantial (Chart 49). In several years in the 2020’s the annual
increase exceeds £300 million. The net change in tax revenues is substantially
negative (Chart 50), though it is much less when the future discoveries are
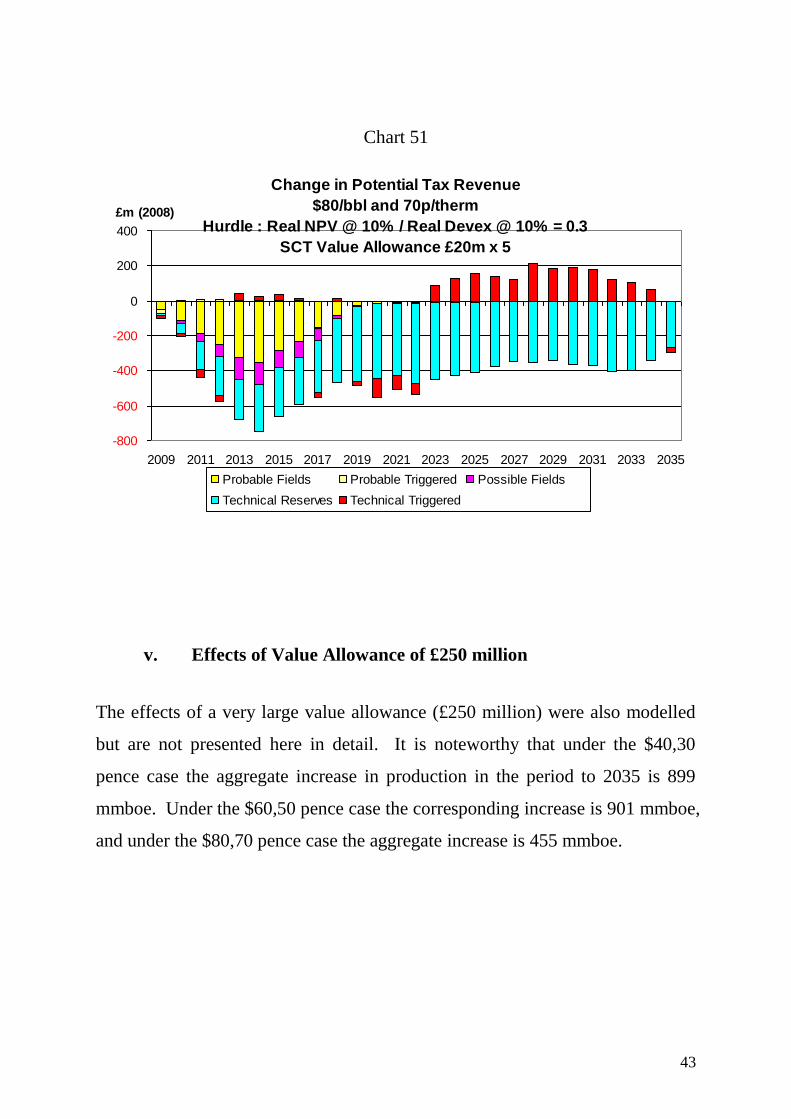
excluded (Chart 51).
Chart 46
Change in Potential Oil Production
$80/bbl and 70p/therm
Hurdle : Real NPV @ 10% / Real Devex @ 10% = 0.3
SCT Value Allowance £20m x 5
0
5
10
15
20
25
30
35
40
2009 2011 2013 2015 2017 2019 2021 2023 2025 2027 2029 2031 2033 2035
tb/d
Probable Triggered Technical Triggered New Triggered
41
Chart 47
Change in Potential Gas Production
$80/bbl and 70p/therm
Hurdle : Real NPV @ 10% / Real Devex @ 10% = 0.3
SCT Value Allowance £20m x 5
0
50
100
150
200
250
300
2009 2011 2013 2015 2017 2019 2021 2023 2025 2027 2029 2031 2033 2035
mmcf/d
Probable Triggered Technical Triggered New Triggered
Chart 48
Change in Total Hydrocarbon Production
$80/bbl and 70p/therm
Hurdle : Real NPV @ 10% / Real Devex @ 10% = 0.3
SCT Value Allowance £20m x 5
0
10
20
30
40
50
60
70
2009 2011 2013 2015 2017 2019 2021 2023 2025 2027 2029 2031 2033 2035
m boe/d
Probable Triggered Technical Triggered New Triggered
42
Chart 49
Change in Potential Development Expenditure
$80/bbl and 70p/therm
Hurdle : Real NPV @ 10% / Real Devex @ 10% = 0.3
SCT Value Allowance £20m x 5
0
50
100
150
200
250
300
350
400
2009 2011 2013 2015 2017 2019 2021 2023 2025 2027 2029 2031 2033 2035
£m (2008)
Probable Triggered Technical Triggered New Triggered
Chart 50
Change in Potential Tax Revenue
$80/bbl and 70p/therm
Hurdle : Real NPV @ 10% / Real Devex @ 10% = 0.3
SCT Value Allowance £20m x 5
-1200
-1000
-800
-600
-400
-200
0
200
400
2009 2011 2013 2015 2017 2019 2021 2023 2025 2027 2029 2031 2033 2035
£m (2008)
Probable Fields Probable Triggered Possible Fields Technical Reserves
Technical Triggered New Exploration New Triggered Total
43
Chart 51
Change in Potential Tax Revenue
$80/bbl and 70p/therm
Hurdle : Real NPV @ 10% / Real Devex @ 10% = 0.3
SCT Value Allowance £20m x 5
-800
-600
-400
-200
0
200
400
2009 2011 2013 2015 2017 2019 2021 2023 2025 2027 2029 2031 2033 2035
£m (2008)
Probable Fields Probable Triggered Possible Fields
Technical Reserves Technical Triggered
v. Effects of Value Allowance of £250 million
The effects of a very large value allowance (£250 million) were also modelled
but are not presented here in detail. It is noteworthy that under the $40,30
pence case the aggregate increase in production in the period to 2035 is 899
mmboe. Under the $60,50 pence case the corresponding increase is 901 mmboe,
and under the $80,70 pence case the aggregate increase is 455 mmboe.
44
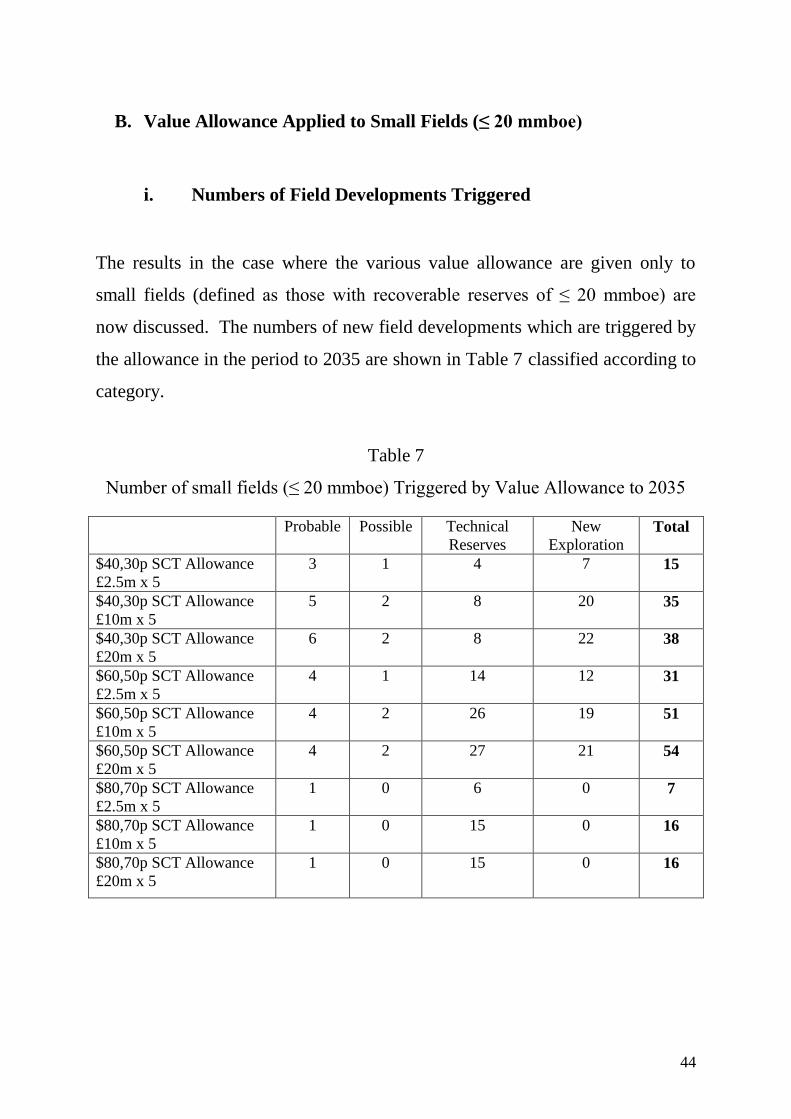
B. Value Allowance Applied to Small Fields (≤ 20 mmboe)
i. Numbers of Field Developments Triggered
The results in the case where the various value allowance are given only to
small fields (defined as those with recoverable reserves of ≤ 20 mmboe) are
now discussed. The numbers of new field developments which are triggered by
the allowance in the period to 2035 are shown in Table 7 classified according to
category.
Table 7
Number of small fields (≤ 20 mmboe) Triggered by Value Allowance to 2035
Probable Possible Technical
Reserves
New
Exploration Total
$40,30p SCT Allowance
£2.5m x 5
3 1 4 7 15
$40,30p SCT Allowance
£10m x 5
5 2 8 20 35
$40,30p SCT Allowance
£20m x 5
6 2 8 22 38
$60,50p SCT Allowance
£2.5m x 5
4 1 14 12 31
$60,50p SCT Allowance
£10m x 5
4 2 26 19 51
$60,50p SCT Allowance
£20m x 5
4 2 27 21 54
$80,70p SCT Allowance
£2.5m x 5
1 0 6 0 7
$80,70p SCT Allowance
£10m x 5
1 0 15 0 16
$80,70p SCT Allowance
£20m x 5
1 0 15 0 16
45
Under the $40,30p case it is seen that the £12.5 million allowance triggers 15
developments over the period. The £50 allowance triggers 35 new
developments, and the £100 million one triggers 38. In both cases the majority
of the developments are in the category of new discoveries. Under the $60,50
pence case the £12.5 million allowance triggers 31 new developments, while the
£50 million allowance triggers 51, and the £100 million one triggers 54
developments. It is seen that very substantial numbers of developments in the
categories of technical reserves and new discoveries are triggered with the
higher levels of allowance. Under the $80,70p case it is seen that the £12.5
million allowance triggers very few developments, while the larger ones each
trigger 16 new fields, the great majority being in the technical reserves category.
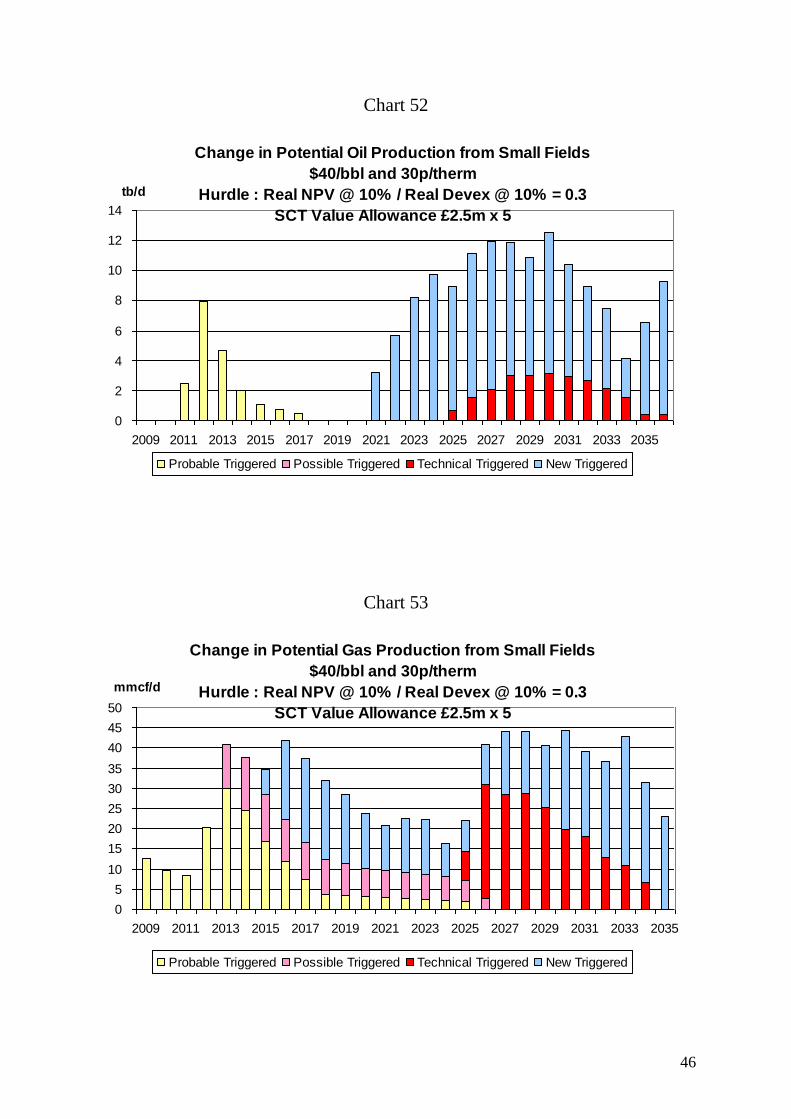
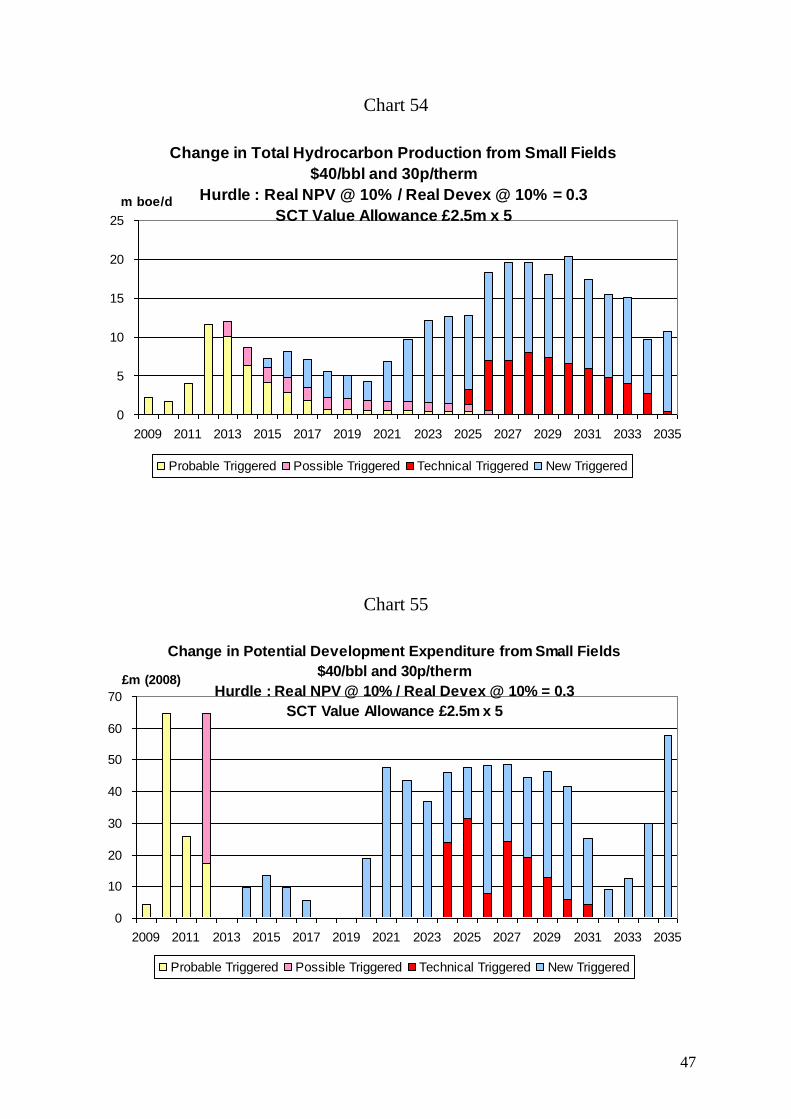
ii. Detailed Effects of £12.5 million Value Allowance
The effects of the small value allowance of £12.5 million in procuring extra
production are shown in Charts 52 -54. The general effect is quite modest, with
the extra total hydrocarbon production averaging around 12,000 boe/d over the
whole period. The aggregate increase in the period to 2035 is 108 mmboe. In
the later part of the period for some years it is in the range 15,000 – 20,000
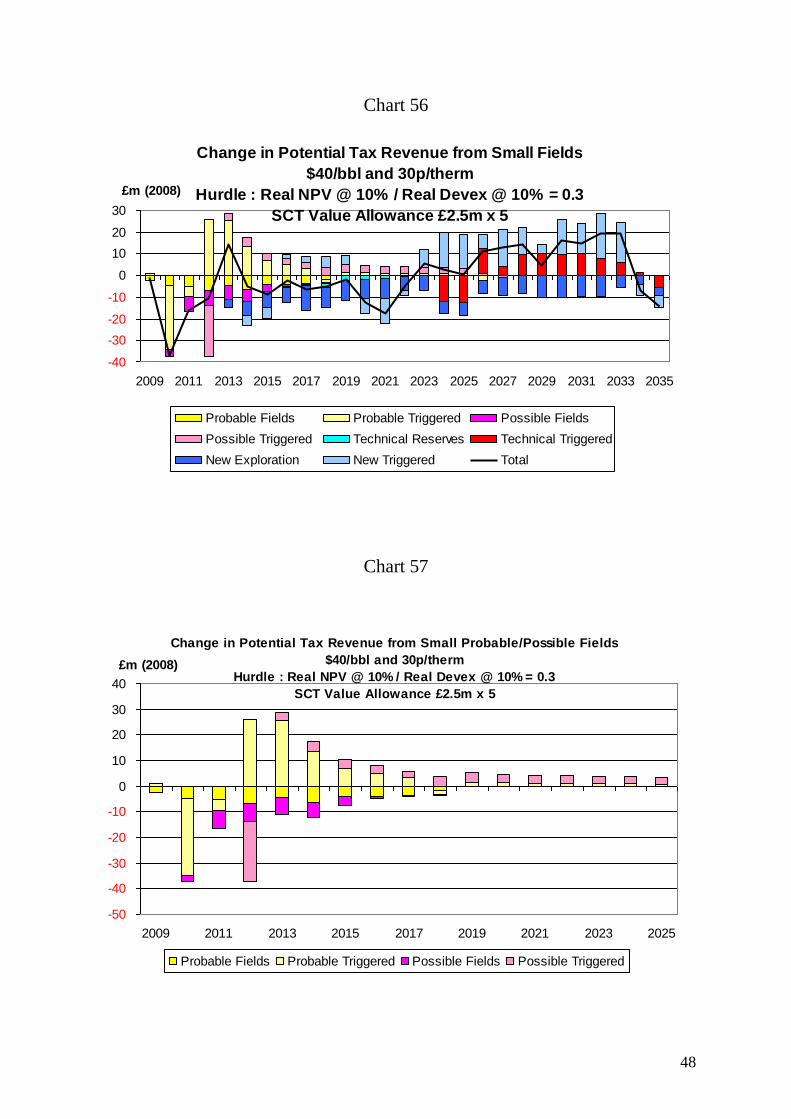
boe/d. The increase in new field investment (Chart 55) is correspondingly small.
The changes in tax revenues across all categories of fields are shown in Chart
56. Reflecting the changes in activity they are very small throughout the period.
The net effect on fields in the probable/possible categories is positive (Chart 57).
46
Chart 52
Change in Potential Oil Production from Small Fields
$40/bbl and 30p/therm
Hurdle : Real NPV @ 10% / Real Devex @ 10% = 0.3
SCT Value Allowance £2.5m x 5
0
2
4
6
8
10
12
14
2009 2011 2013 2015 2017 2019 2021 2023 2025 2027 2029 2031 2033 2035
tb/d
Probable Triggered Possible Triggered Technical Triggered New Triggered
Chart 53
Change in Potential Gas Production from Small Fields
$40/bbl and 30p/therm
Hurdle : Real NPV @ 10% / Real Devex @ 10% = 0.3
SCT Value Allowance £2.5m x 5
0
5
10
15
20
25
30
35
40
45
50
2009 2011 2013 2015 2017 2019 2021 2023 2025 2027 2029 2031 2033 2035
mmcf/d
Probable Triggered Possible Triggered Technical Triggered New Triggered
47
Chart 54
Change in Total Hydrocarbon Production from Small Fields
$40/bbl and 30p/therm
Hurdle : Real NPV @ 10% / Real Devex @ 10% = 0.3
SCT Value Allowance £2.5m x 5
0
5
10
15
20
25
2009 2011 2013 2015 2017 2019 2021 2023 2025 2027 2029 2031 2033 2035
m boe/d
Probable Triggered Possible Triggered Technical Triggered New Triggered
Chart 55
Change in Potential Development Expenditure from Small Fields
$40/bbl and 30p/therm
Hurdle : Real NPV @ 10% / Real Devex @ 10% = 0.3
SCT Value Allowance £2.5m x 5
0
10
20
30
40
50
60
70
2009 2011 2013 2015 2017 2019 2021 2023 2025 2027 2029 2031 2033 2035
£m (2008)
Probable Triggered Possible Triggered Technical Triggered New Triggered
48
Chart 56
Change in Potential Tax Revenue from Small Fields
$40/bbl and 30p/therm
Hurdle : Real NPV @ 10% / Real Devex @ 10% = 0.3
SCT Value Allowance £2.5m x 5
-40
-30
-20
-10
0
10
20
30
2009 2011 2013 2015 2017 2019 2021 2023 2025 2027 2029 2031 2033 2035
£m (2008)
Probable Fields Probable Triggered Possible Fields
Possible Triggered Technical Reserves Technical Triggered
New Exploration New Triggered Total
Chart 57
Change in Potential Tax Revenue from Small Probable/Possible Fields
$40/bbl and 30p/therm
Hurdle : Real NPV @ 10% / Real Devex @ 10% = 0.3
SCT Value Allowance £2.5m x 5
-50
-40
-30
-20
-10
0
10
20
30
40
2009 2011 2013 2015 2017 2019 2021 2023 2025
£m (2008)
Probable Fields Probable Triggered Possible Fields Possible Triggered
49
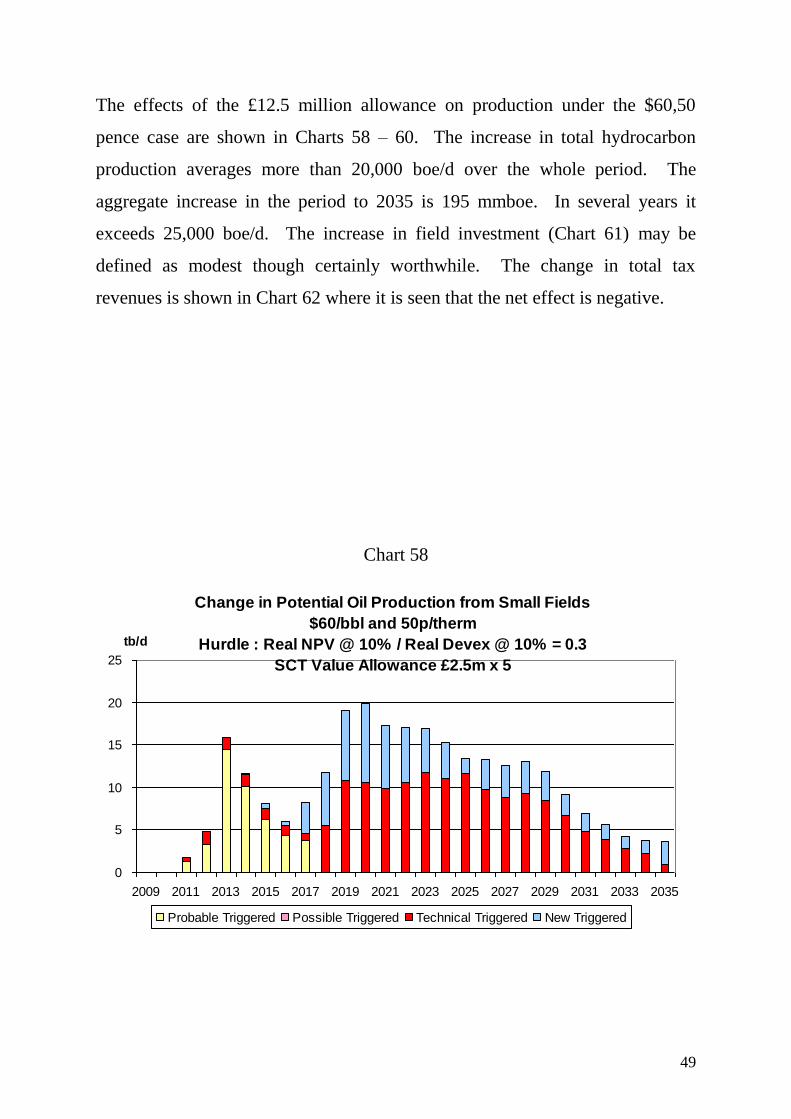
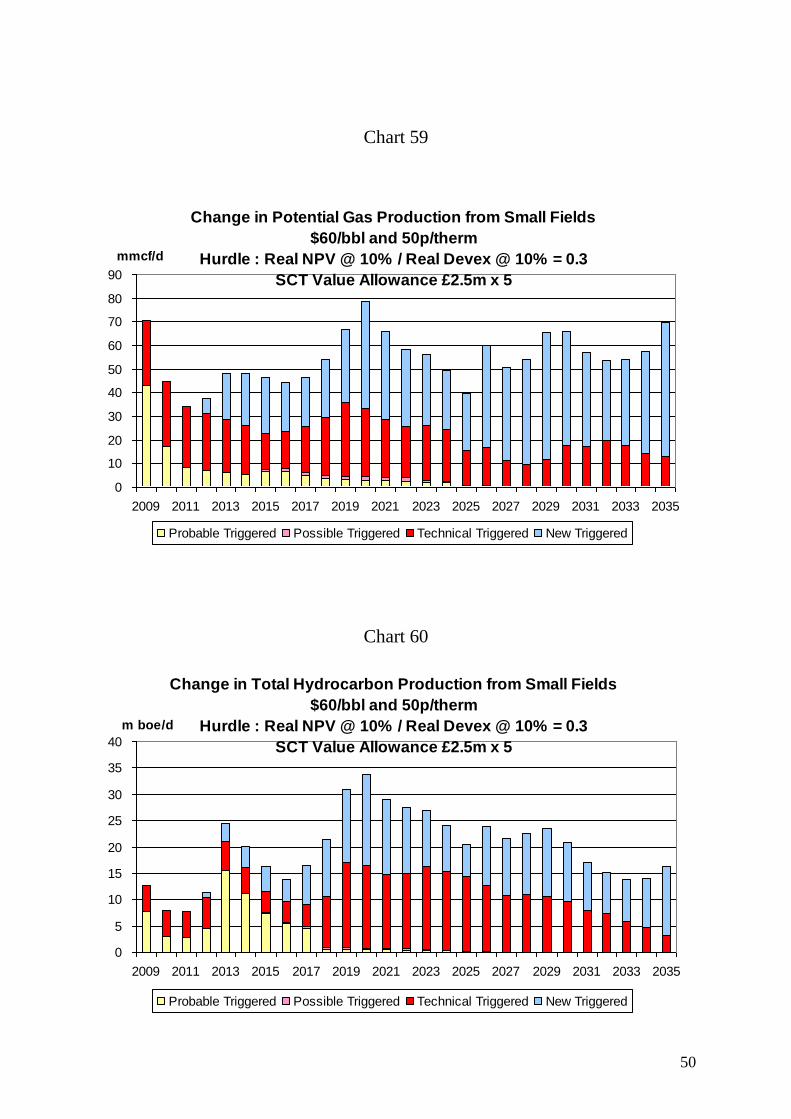
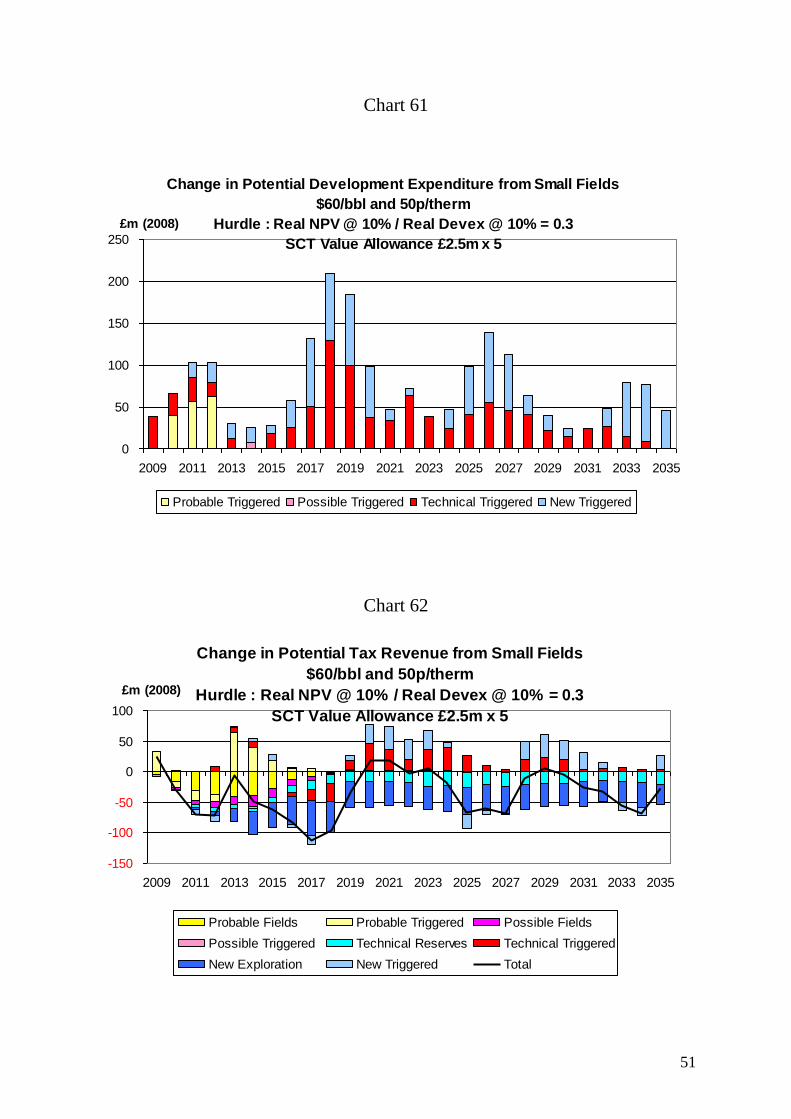
The effects of the £12.5 million allowance on production under the $60,50
pence case are shown in Charts 58 – 60. The increase in total hydrocarbon
production averages more than 20,000 boe/d over the whole period. The
aggregate increase in the period to 2035 is 195 mmboe. In several years it
exceeds 25,000 boe/d. The increase in field investment (Chart 61) may be
defined as modest though certainly worthwhile. The change in total tax
revenues is shown in Chart 62 where it is seen that the net effect is negative.
Chart 58
Change in Potential Oil Production from Small Fields
$60/bbl and 50p/therm
Hurdle : Real NPV @ 10% / Real Devex @ 10% = 0.3
SCT Value Allowance £2.5m x 5
0
5
10
15
20
25
2009 2011 2013 2015 2017 2019 2021 2023 2025 2027 2029 2031 2033 2035
tb/d
Probable Triggered Possible Triggered Technical Triggered New Triggered
50
Chart 59
Change in Potential Gas Production from Small Fields
$60/bbl and 50p/therm
Hurdle : Real NPV @ 10% / Real Devex @ 10% = 0.3
SCT Value Allowance £2.5m x 5
0
10
20
30
40
50
60
70
80
90
2009 2011 2013 2015 2017 2019 2021 2023 2025 2027 2029 2031 2033 2035
mmcf/d
Probable Triggered Possible Triggered Technical Triggered New Triggered
Chart 60
Change in Total Hydrocarbon Production from Small Fields
$60/bbl and 50p/therm
Hurdle : Real NPV @ 10% / Real Devex @ 10% = 0.3
SCT Value Allowance £2.5m x 5
0
5
10
15
20
25
30
35
40
2009 2011 2013 2015 2017 2019 2021 2023 2025 2027 2029 2031 2033 2035
m boe/d
Probable Triggered Possible Triggered Technical Triggered New Triggered
51
Chart 61
Change in Potential Development Expenditure from Small Fields
$60/bbl and 50p/therm
Hurdle : Real NPV @ 10% / Real Devex @ 10% = 0.3
SCT Value Allowance £2.5m x 5
0
50
100
150
200
250
2009 2011 2013 2015 2017 2019 2021 2023 2025 2027 2029 2031 2033 2035
£m (2008)
Probable Triggered Possible Triggered Technical Triggered New Triggered
Chart 62
Change in Potential Tax Revenue from Small Fields
$60/bbl and 50p/therm
Hurdle : Real NPV @ 10% / Real Devex @ 10% = 0.3
SCT Value Allowance £2.5m x 5
-150
-100
-50
0
50
100
2009 2011 2013 2015 2017 2019 2021 2023 2025 2027 2029 2031 2033 2035
£m (2008)
Probable Fields Probable Triggered Possible Fields
Possible Triggered Technical Reserves Technical Triggered
New Exploration New Triggered Total
52
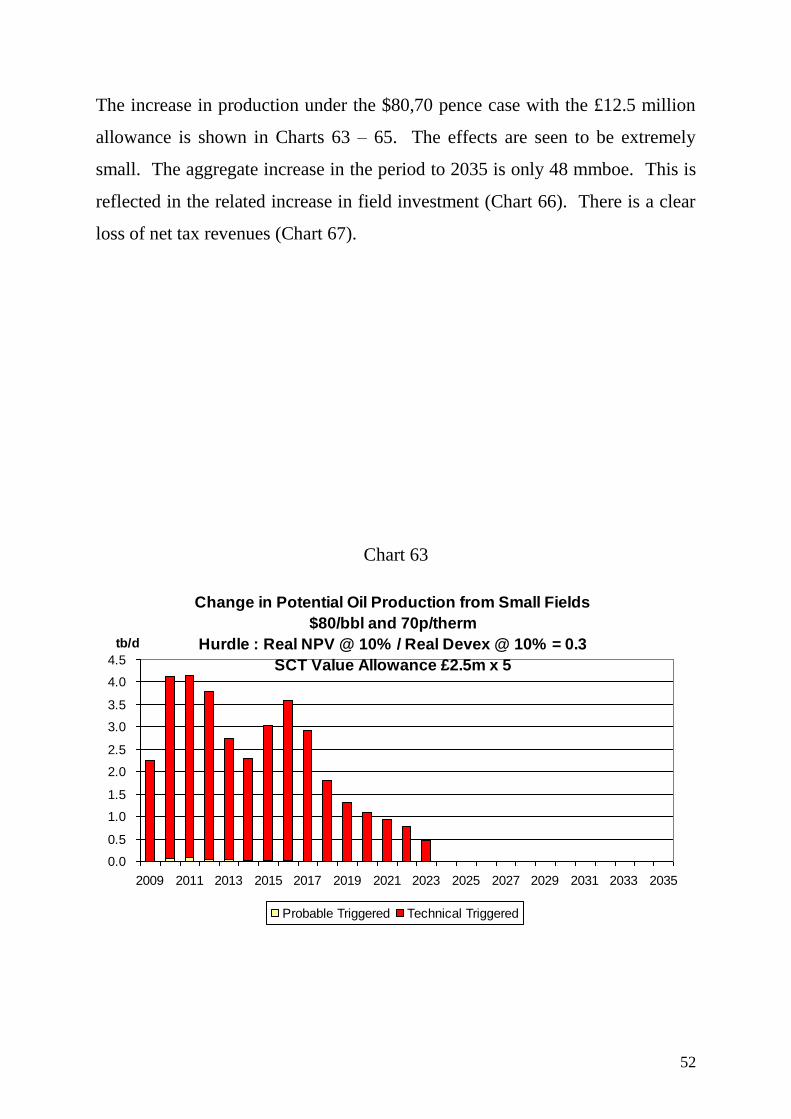
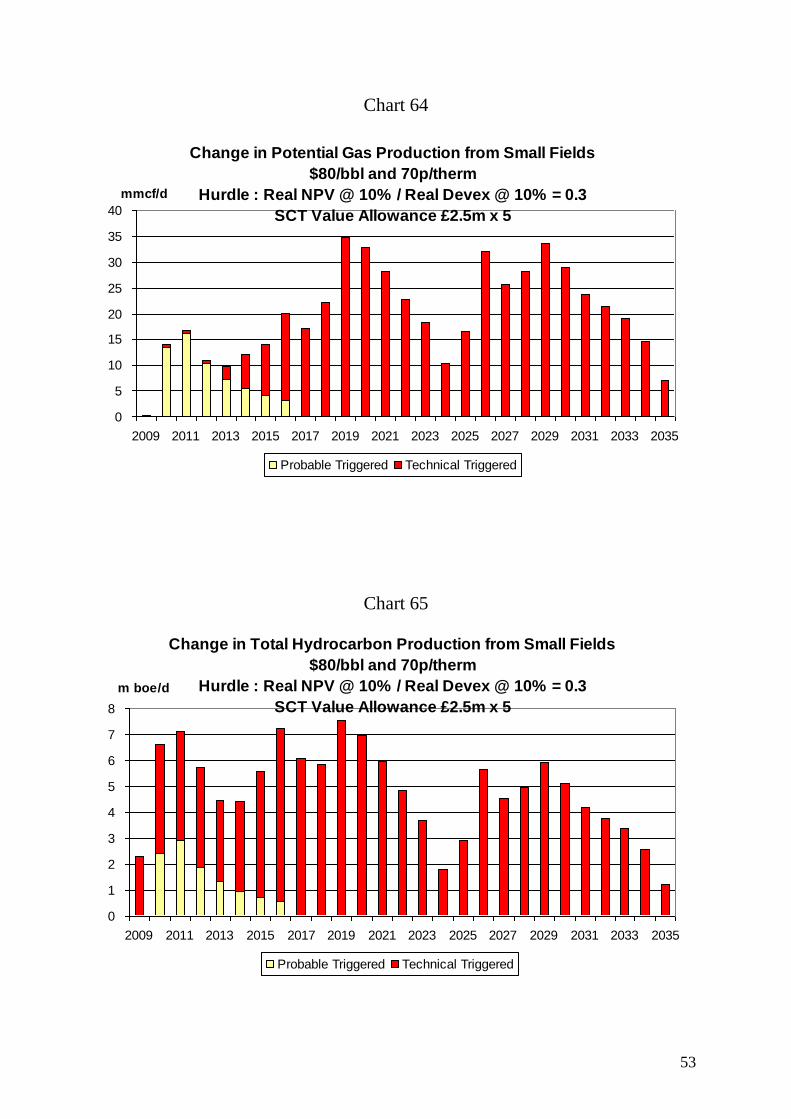
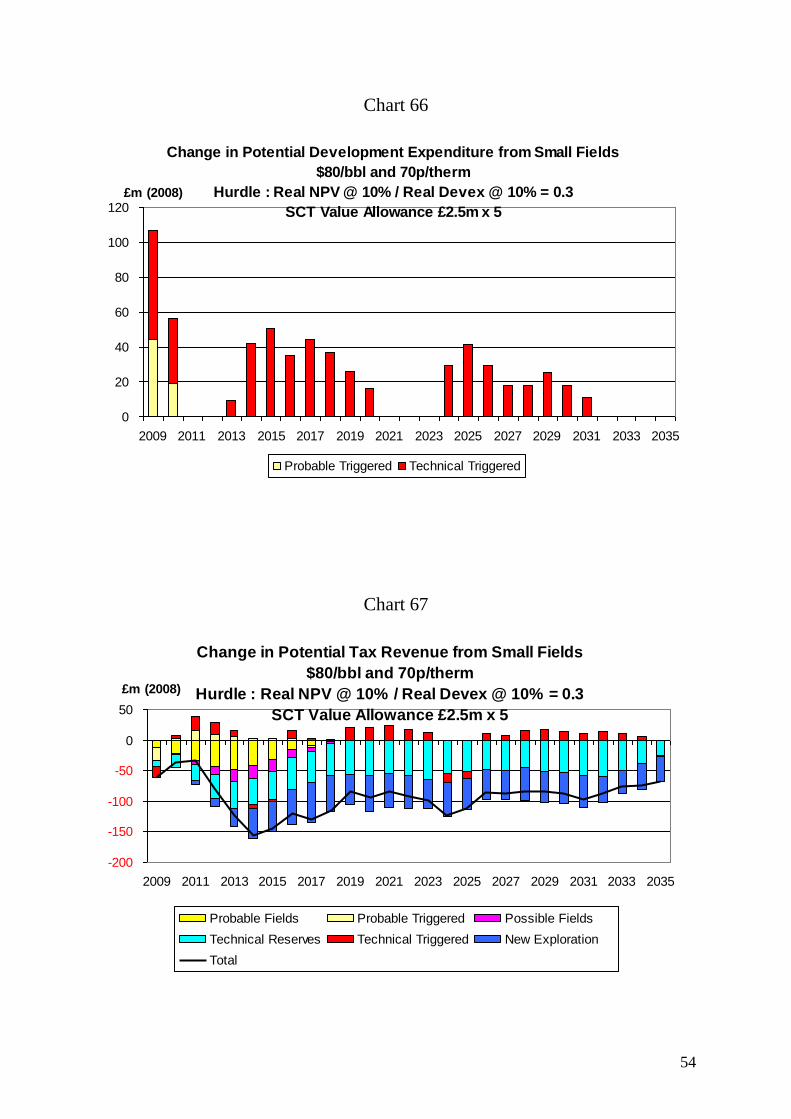
The increase in production under the $80,70 pence case with the £12.5 million
allowance is shown in Charts 63 – 65. The effects are seen to be extremely
small. The aggregate increase in the period to 2035 is only 48 mmboe. This is
reflected in the related increase in field investment (Chart 66). There is a clear
loss of net tax revenues (Chart 67).
Chart 63
Change in Potential Oil Production from Small Fields
$80/bbl and 70p/therm
Hurdle : Real NPV @ 10% / Real Devex @ 10% = 0.3
SCT Value Allowance £2.5m x 5
0.0
0.5
1.0
1.5
2.0
2.5
3.0
3.5
4.0
4.5
2009 2011 2013 2015 2017 2019 2021 2023 2025 2027 2029 2031 2033 2035
tb/d
Probable Triggered Technical Triggered
53
Chart 64
Change in Potential Gas Production from Small Fields
$80/bbl and 70p/therm
Hurdle : Real NPV @ 10% / Real Devex @ 10% = 0.3
SCT Value Allowance £2.5m x 5
0
5
10
15
20
25
30
35
40
2009 2011 2013 2015 2017 2019 2021 2023 2025 2027 2029 2031 2033 2035
mmcf/d
Probable Triggered Technical Triggered
Chart 65
Change in Total Hydrocarbon Production from Small Fields
$80/bbl and 70p/therm
Hurdle : Real NPV @ 10% / Real Devex @ 10% = 0.3
SCT Value Allowance £2.5m x 5
0
1
2
3
4
5
6
7
8
2009 2011 2013 2015 2017 2019 2021 2023 2025 2027 2029 2031 2033 2035
m boe/d
Probable Triggered Technical Triggered
54
Chart 66
Change in Potential Development Expenditure from Small Fields
$80/bbl and 70p/therm
Hurdle : Real NPV @ 10% / Real Devex @ 10% = 0.3
SCT Value Allowance £2.5m x 5
0
20
40
60
80
100
120
2009 2011 2013 2015 2017 2019 2021 2023 2025 2027 2029 2031 2033 2035
£m (2008)
Probable Triggered Technical Triggered
Chart 67
Change in Potential Tax Revenue from Small Fields
$80/bbl and 70p/therm
Hurdle : Real NPV @ 10% / Real Devex @ 10% = 0.3
SCT Value Allowance £2.5m x 5
-200
-150
-100
-50
0
50
2009 2011 2013 2015 2017 2019 2021 2023 2025 2027 2029 2031 2033 2035
£m (2008)
Probable Fields Probable Triggered Possible Fields
Technical Reserves Technical Triggered New Exploration
Total
55
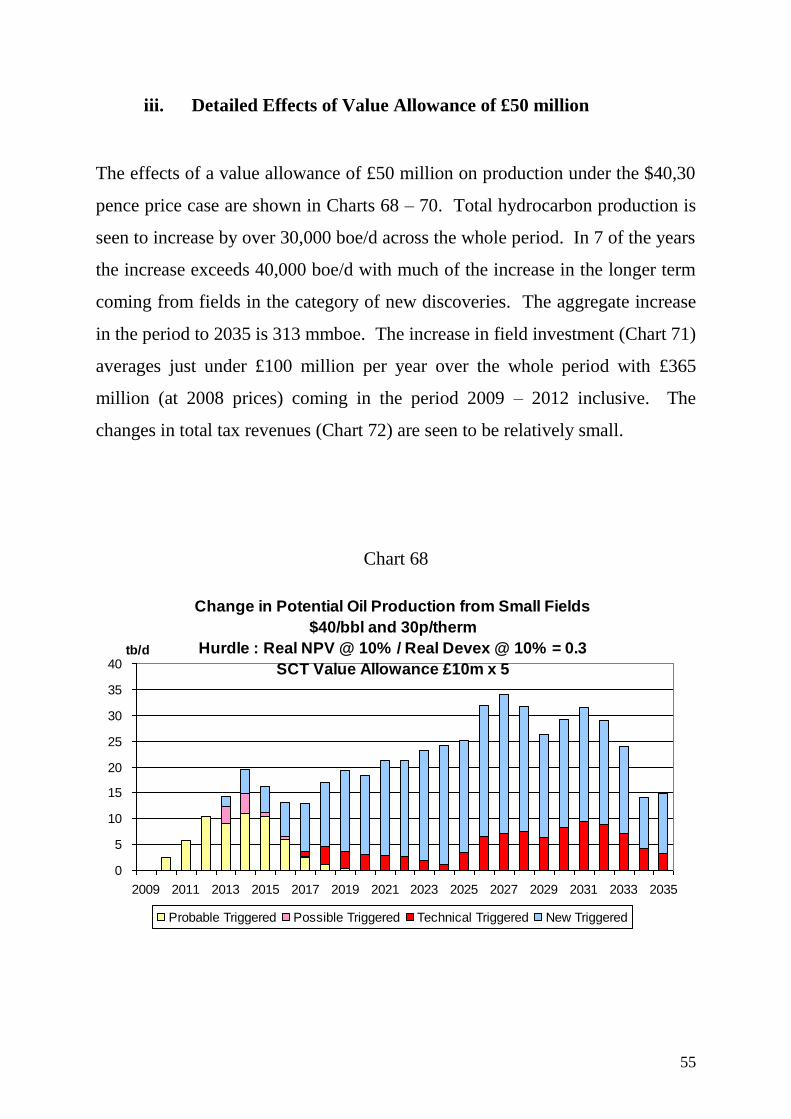
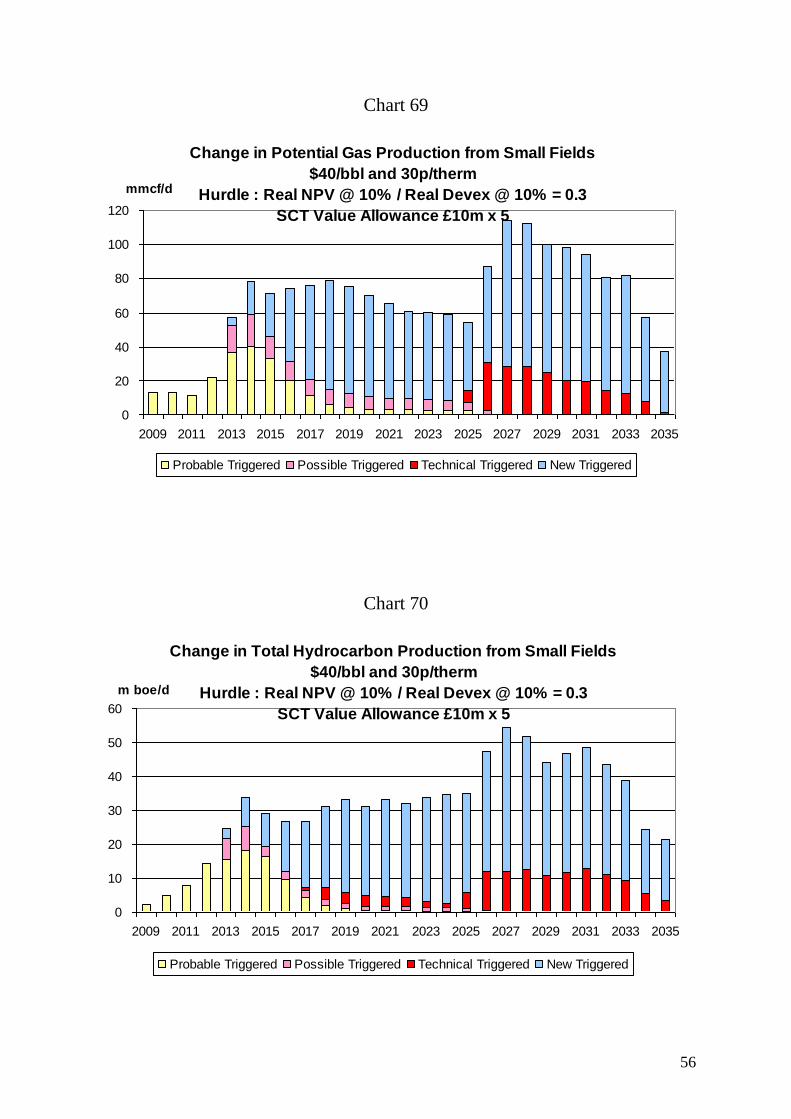
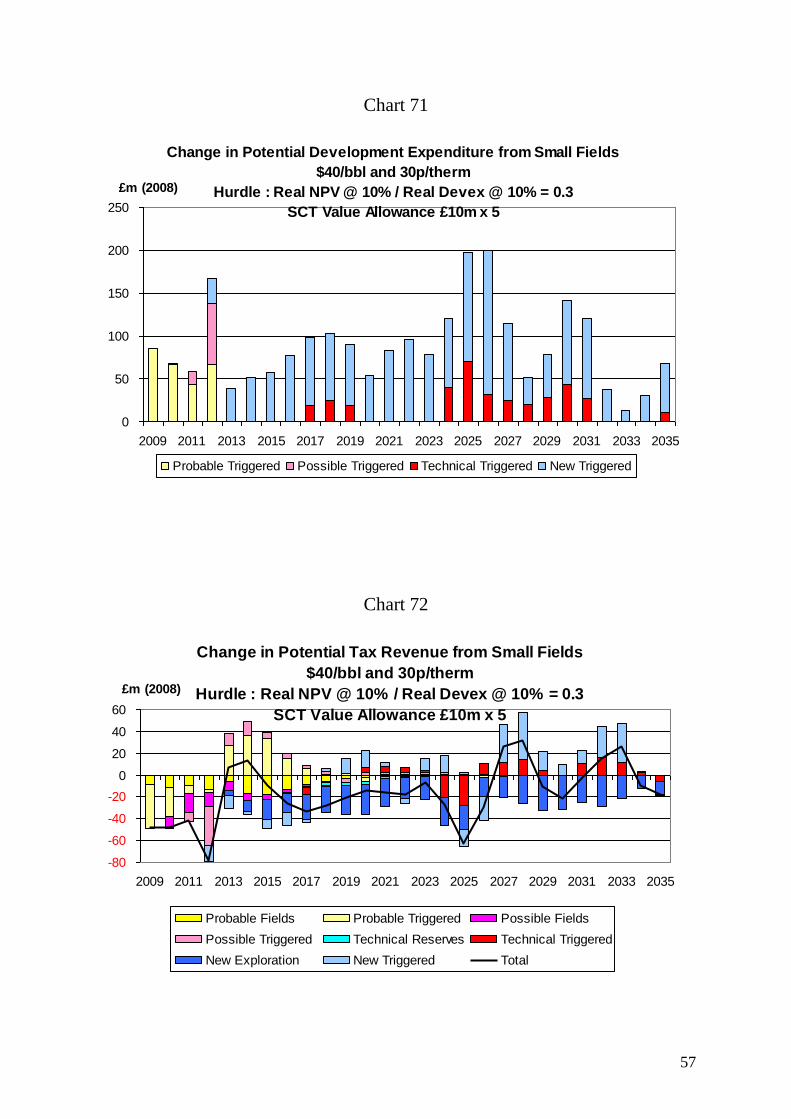
iii. Detailed Effects of Value Allowance of £50 million
The effects of a value allowance of £50 million on production under the $40,30
pence price case are shown in Charts 68 – 70. Total hydrocarbon production is
seen to increase by over 30,000 boe/d across the whole period. In 7 of the years
the increase exceeds 40,000 boe/d with much of the increase in the longer term
coming from fields in the category of new discoveries. The aggregate increase
in the period to 2035 is 313 mmboe. The increase in field investment (Chart 71)
averages just under £100 million per year over the whole period with £365
million (at 2008 prices) coming in the period 2009 – 2012 inclusive. The
changes in total tax revenues (Chart 72) are seen to be relatively small.
Chart 68
Change in Potential Oil Production from Small Fields
$40/bbl and 30p/therm
Hurdle : Real NPV @ 10% / Real Devex @ 10% = 0.3
SCT Value Allowance £10m x 5
0
5
10
15
20
25
30
35
40
2009 2011 2013 2015 2017 2019 2021 2023 2025 2027 2029 2031 2033 2035
tb/d
Probable Triggered Possible Triggered Technical Triggered New Triggered
56
Chart 69
Change in Potential Gas Production from Small Fields
$40/bbl and 30p/therm
Hurdle : Real NPV @ 10% / Real Devex @ 10% = 0.3
SCT Value Allowance £10m x 5
0
20
40
60
80
100
120
2009 2011 2013 2015 2017 2019 2021 2023 2025 2027 2029 2031 2033 2035
mmcf/d
Probable Triggered Possible Triggered Technical Triggered New Triggered
Chart 70
Change in Total Hydrocarbon Production from Small Fields
$40/bbl and 30p/therm
Hurdle : Real NPV @ 10% / Real Devex @ 10% = 0.3
SCT Value Allowance £10m x 5
0
10
20
30
40
50
60
2009 2011 2013 2015 2017 2019 2021 2023 2025 2027 2029 2031 2033 2035
m boe/d
Probable Triggered Possible Triggered Technical Triggered New Triggered
57
Chart 71
Change in Potential Development Expenditure from Small Fields
$40/bbl and 30p/therm
Hurdle : Real NPV @ 10% / Real Devex @ 10% = 0.3
SCT Value Allowance £10m x 5
0
50
100
150
200
250
2009 2011 2013 2015 2017 2019 2021 2023 2025 2027 2029 2031 2033 2035
£m (2008)
Probable Triggered Possible Triggered Technical Triggered New Triggered
Chart 72
Change in Potential Tax Revenue from Small Fields
$40/bbl and 30p/therm
Hurdle : Real NPV @ 10% / Real Devex @ 10% = 0.3
SCT Value Allowance £10m x 5
-80
-60
-40
-20
0
20
40
60
2009 2011 2013 2015 2017 2019 2021 2023 2025 2027 2029 2031 2033 2035
£m (2008)
Probable Fields Probable Triggered Possible Fields
Possible Triggered Technical Reserves Technical Triggered
New Exploration New Triggered Total
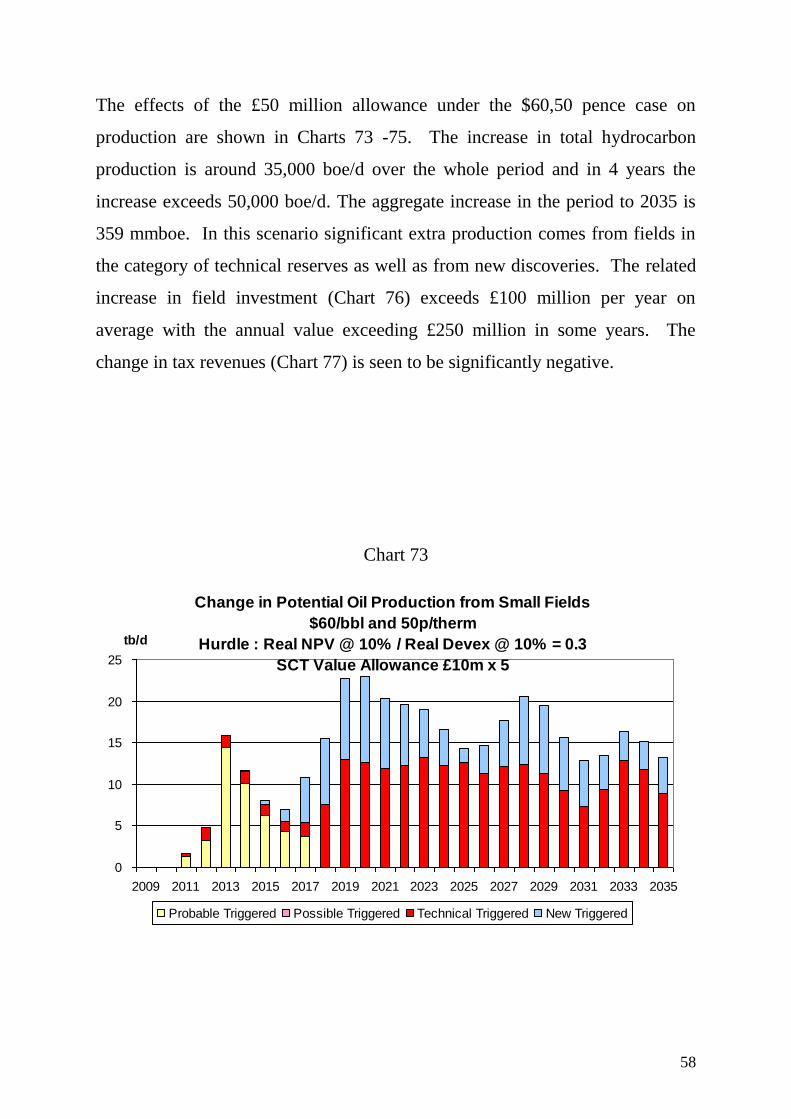
58
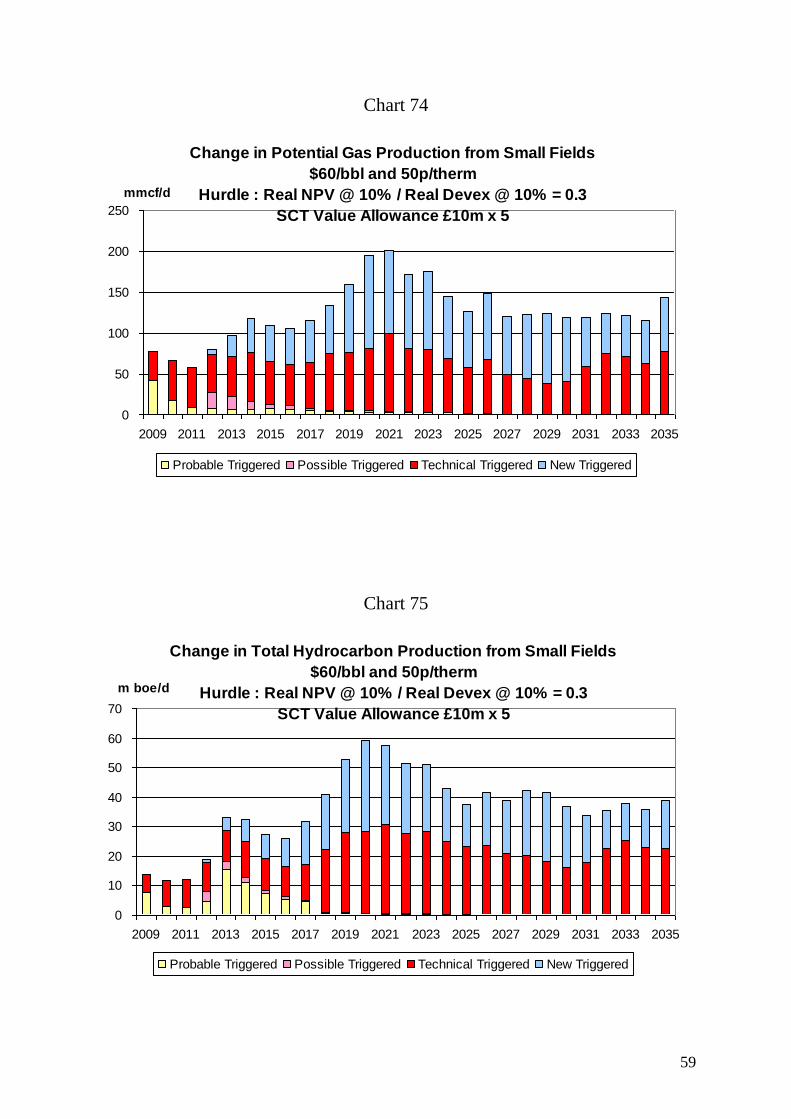
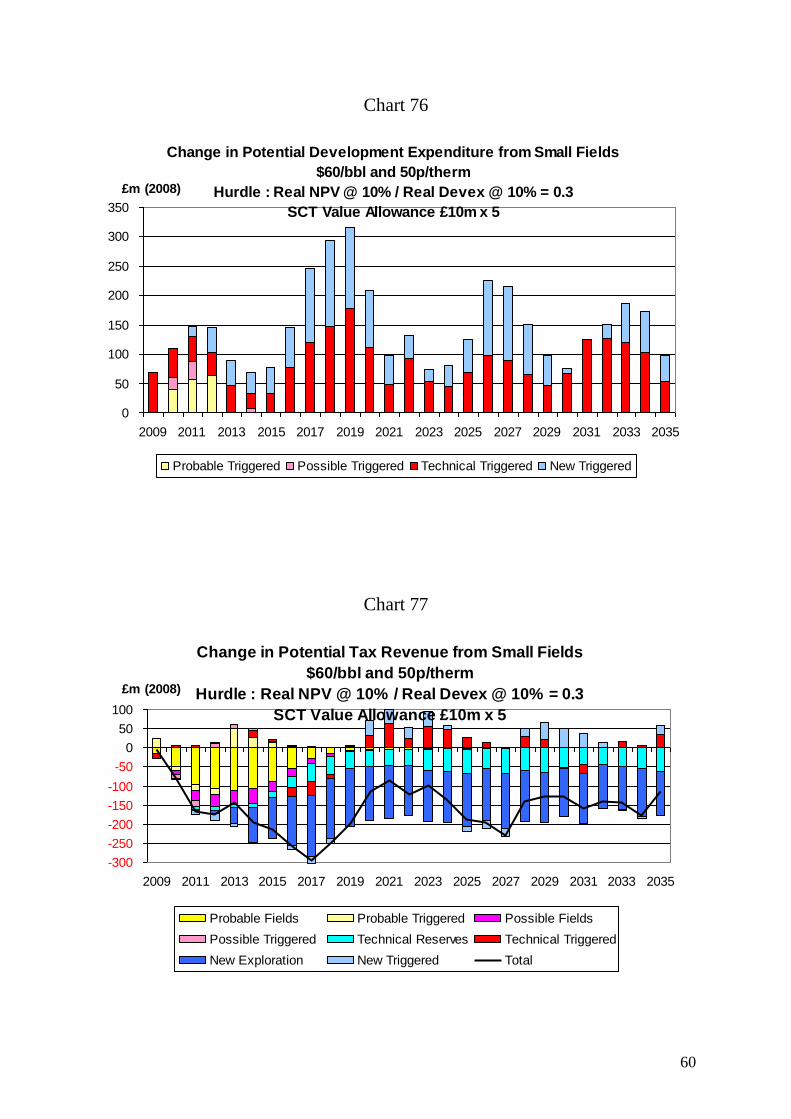
The effects of the £50 million allowance under the $60,50 pence case on
production are shown in Charts 73 -75. The increase in total hydrocarbon
production is around 35,000 boe/d over the whole period and in 4 years the
increase exceeds 50,000 boe/d. The aggregate increase in the period to 2035 is
359 mmboe. In this scenario significant extra production comes from fields in
the category of technical reserves as well as from new discoveries. The related
increase in field investment (Chart 76) exceeds £100 million per year on
average with the annual value exceeding £250 million in some years. The
change in tax revenues (Chart 77) is seen to be significantly negative.
Chart 73
Change in Potential Oil Production from Small Fields
$60/bbl and 50p/therm
Hurdle : Real NPV @ 10% / Real Devex @ 10% = 0.3
SCT Value Allowance £10m x 5
0
5
10
15
20
25
2009 2011 2013 2015 2017 2019 2021 2023 2025 2027 2029 2031 2033 2035
tb/d
Probable Triggered Possible Triggered Technical Triggered New Triggered
59
Chart 74
Change in Potential Gas Production from Small Fields
$60/bbl and 50p/therm
Hurdle : Real NPV @ 10% / Real Devex @ 10% = 0.3
SCT Value Allowance £10m x 5
0
50
100
150
200
250
2009 2011 2013 2015 2017 2019 2021 2023 2025 2027 2029 2031 2033 2035
mmcf/d
Probable Triggered Possible Triggered Technical Triggered New Triggered
Chart 75
Change in Total Hydrocarbon Production from Small Fields
$60/bbl and 50p/therm
Hurdle : Real NPV @ 10% / Real Devex @ 10% = 0.3
SCT Value Allowance £10m x 5
0
10
20
30
40
50
60
70
2009 2011 2013 2015 2017 2019 2021 2023 2025 2027 2029 2031 2033 2035
m boe/d
Probable Triggered Possible Triggered Technical Triggered New Triggered
60
Chart 76
Change in Potential Development Expenditure from Small Fields
$60/bbl and 50p/therm
Hurdle : Real NPV @ 10% / Real Devex @ 10% = 0.3
SCT Value Allowance £10m x 5
0
50
100
150
200
250
300
350
2009 2011 2013 2015 2017 2019 2021 2023 2025 2027 2029 2031 2033 2035
£m (2008)
Probable Triggered Possible Triggered Technical Triggered New Triggered
Chart 77
Change in Potential Tax Revenue from Small Fields
$60/bbl and 50p/therm
Hurdle : Real NPV @ 10% / Real Devex @ 10% = 0.3
SCT Value Allowance £10m x 5
-300
-250
-200
-150
-100
-50
0
50
100
2009 2011 2013 2015 2017 2019 2021 2023 2025 2027 2029 2031 2033 2035
£m (2008)
Probable Fields Probable Triggered Possible Fields
Possible Triggered Technical Reserves Technical Triggered
New Exploration New Triggered Total
61
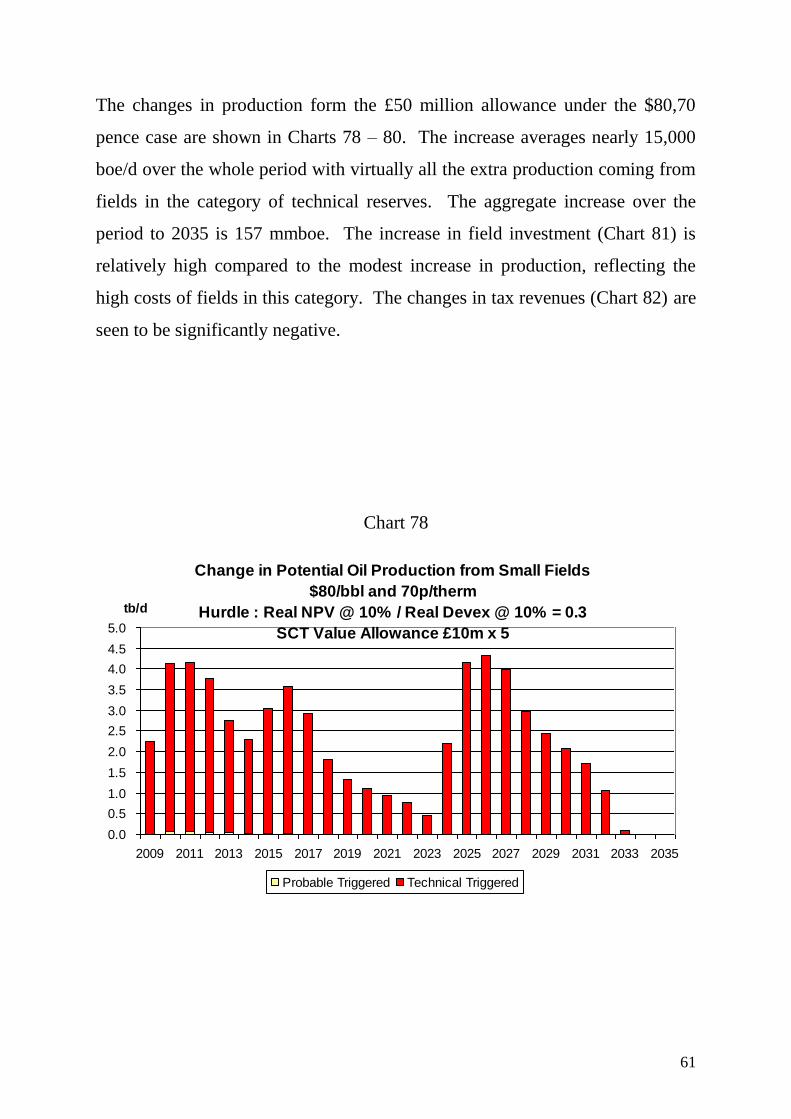
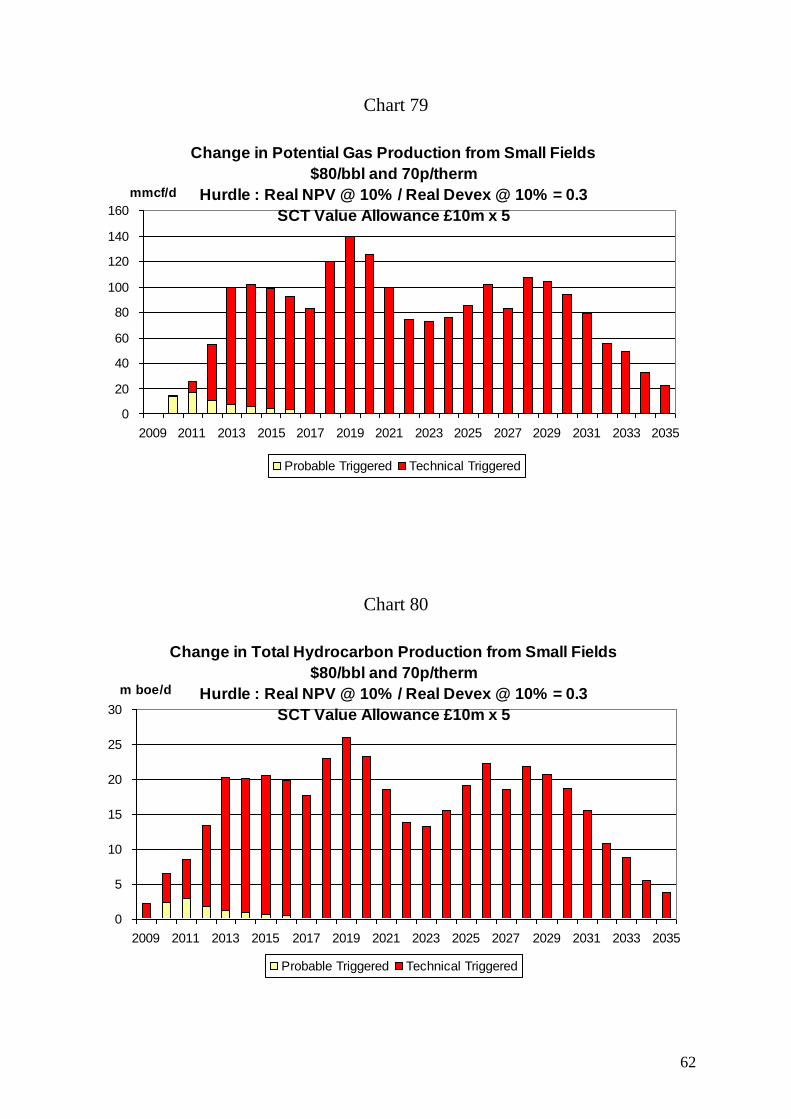
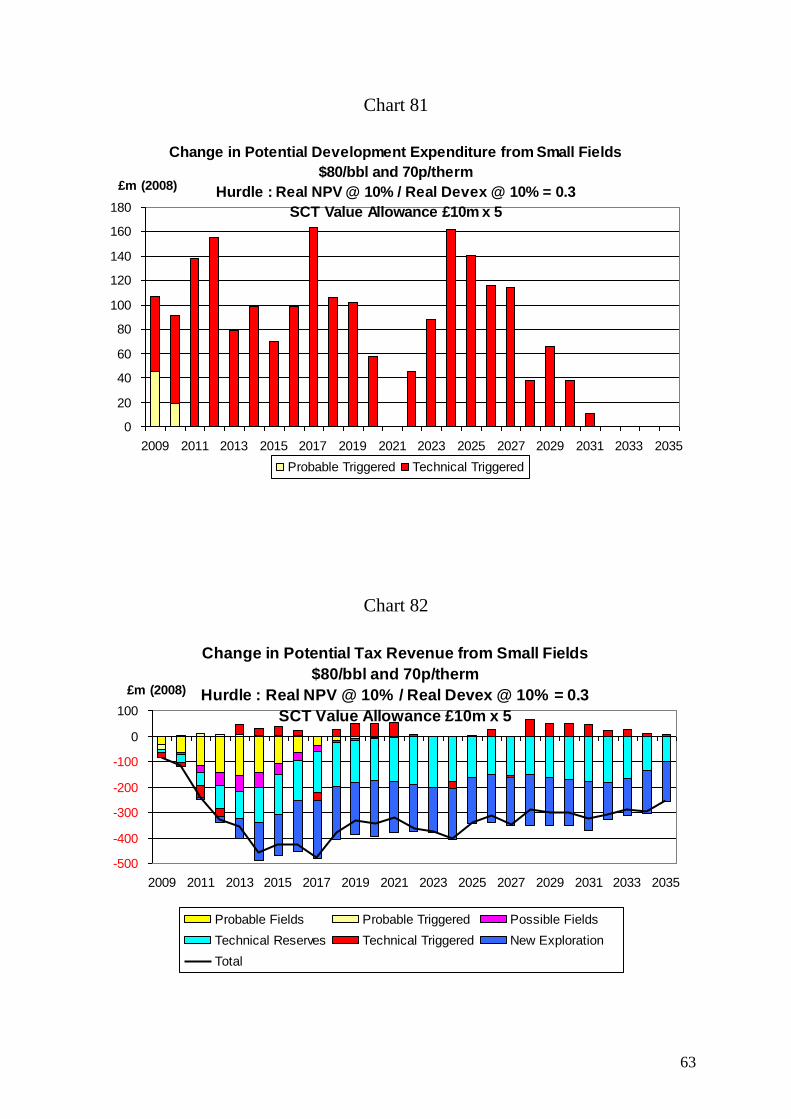
The changes in production form the £50 million allowance under the $80,70
pence case are shown in Charts 78 – 80. The increase averages nearly 15,000
boe/d over the whole period with virtually all the extra production coming from
fields in the category of technical reserves. The aggregate increase over the
period to 2035 is 157 mmboe. The increase in field investment (Chart 81) is
relatively high compared to the modest increase in production, reflecting the
high costs of fields in this category. The changes in tax revenues (Chart 82) are
seen to be significantly negative.
Chart 78
Change in Potential Oil Production from Small Fields
$80/bbl and 70p/therm
Hurdle : Real NPV @ 10% / Real Devex @ 10% = 0.3
SCT Value Allowance £10m x 5
0.0
0.5
1.0
1.5
2.0
2.5
3.0
3.5
4.0
4.5
5.0
2009 2011 2013 2015 2017 2019 2021 2023 2025 2027 2029 2031 2033 2035
tb/d
Probable Triggered Technical Triggered
62
Chart 79
Change in Potential Gas Production from Small Fields
$80/bbl and 70p/therm
Hurdle : Real NPV @ 10% / Real Devex @ 10% = 0.3
SCT Value Allowance £10m x 5
0
20
40
60
80
100
120
140
160
2009 2011 2013 2015 2017 2019 2021 2023 2025 2027 2029 2031 2033 2035
mmcf/d
Probable Triggered Technical Triggered
Chart 80
Change in Total Hydrocarbon Production from Small Fields
$80/bbl and 70p/therm
Hurdle : Real NPV @ 10% / Real Devex @ 10% = 0.3
SCT Value Allowance £10m x 5
0
5
10
15
20
25
30
2009 2011 2013 2015 2017 2019 2021 2023 2025 2027 2029 2031 2033 2035
m boe/d
Probable Triggered Technical Triggered
63
Chart 81
Change in Potential Development Expenditure from Small Fields
$80/bbl and 70p/therm
Hurdle : Real NPV @ 10% / Real Devex @ 10% = 0.3
SCT Value Allowance £10m x 5
0
20
40
60
80
100
120
140
160
180
2009 2011 2013 2015 2017 2019 2021 2023 2025 2027 2029 2031 2033 2035
£m (2008)
Probable Triggered Technical Triggered
Chart 82
Change in Potential Tax Revenue from Small Fields
$80/bbl and 70p/therm
Hurdle : Real NPV @ 10% / Real Devex @ 10% = 0.3
SCT Value Allowance £10m x 5
-500
-400
-300
-200
-100
0
100
2009 2011 2013 2015 2017 2019 2021 2023 2025 2027 2029 2031 2033 2035
£m (2008)
Probable Fields Probable Triggered Possible Fields
Technical Reserves Technical Triggered New Exploration
Total
64
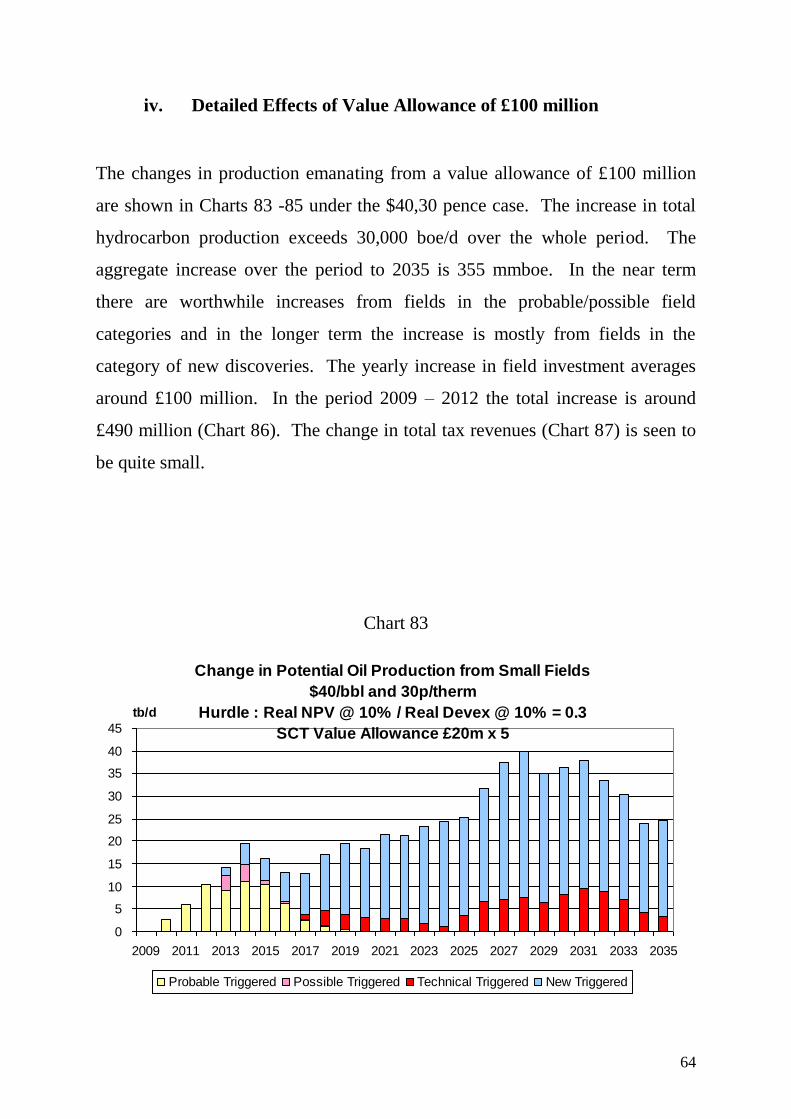
iv. Detailed Effects of Value Allowance of £100 million
The changes in production emanating from a value allowance of £100 million
are shown in Charts 83 -85 under the $40,30 pence case. The increase in total
hydrocarbon production exceeds 30,000 boe/d over the whole period. The
aggregate increase over the period to 2035 is 355 mmboe. In the near term
there are worthwhile increases from fields in the probable/possible field
categories and in the longer term the increase is mostly from fields in the
category of new discoveries. The yearly increase in field investment averages
around £100 million. In the period 2009 – 2012 the total increase is around
£490 million (Chart 86). The change in total tax revenues (Chart 87) is seen to
be quite small.
Chart 83
Change in Potential Oil Production from Small Fields
$40/bbl and 30p/therm
Hurdle : Real NPV @ 10% / Real Devex @ 10% = 0.3
SCT Value Allowance £20m x 5
0
5
10
15
20
25
30
35
40
45
2009 2011 2013 2015 2017 2019 2021 2023 2025 2027 2029 2031 2033 2035
tb/d
Probable Triggered Possible Triggered Technical Triggered New Triggered
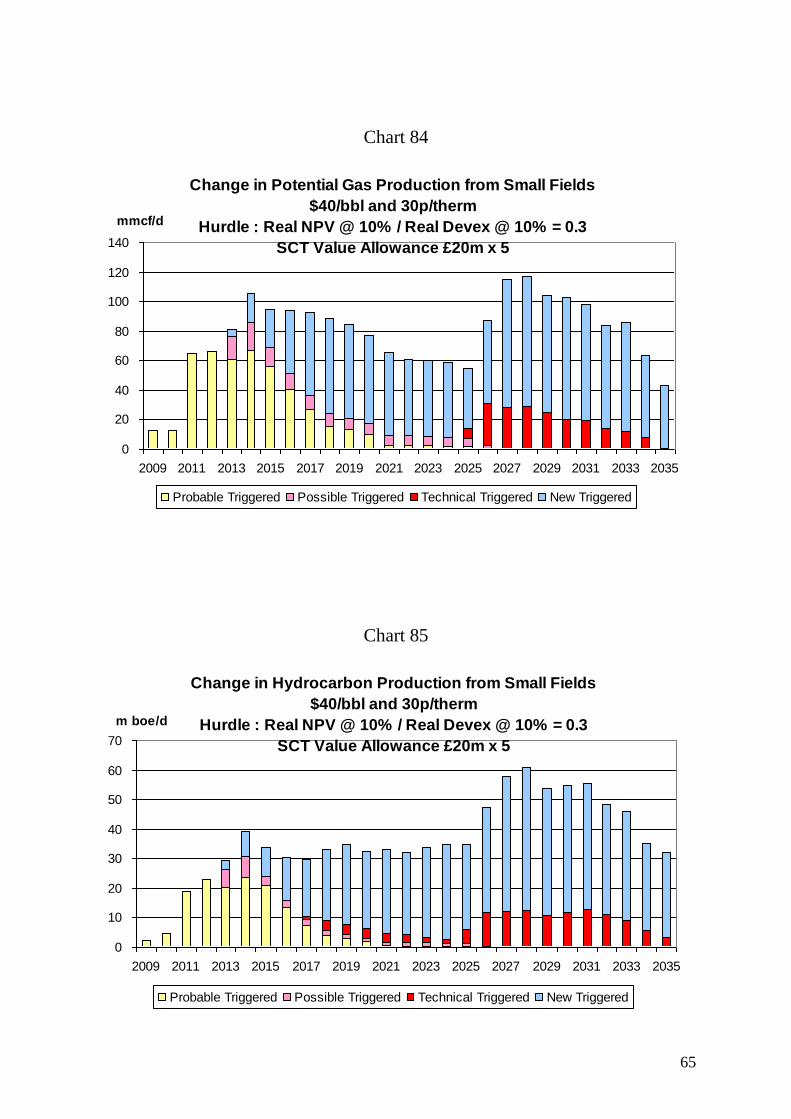
65
Chart 84
Change in Potential Gas Production from Small Fields
$40/bbl and 30p/therm
Hurdle : Real NPV @ 10% / Real Devex @ 10% = 0.3
SCT Value Allowance £20m x 5
0
20
40
60
80
100
120
140
2009 2011 2013 2015 2017 2019 2021 2023 2025 2027 2029 2031 2033 2035
mmcf/d
Probable Triggered Possible Triggered Technical Triggered New Triggered
Chart 85
Change in Hydrocarbon Production from Small Fields
$40/bbl and 30p/therm
Hurdle : Real NPV @ 10% / Real Devex @ 10% = 0.3
SCT Value Allowance £20m x 5
0
10
20
30
40
50
60
70
2009 2011 2013 2015 2017 2019 2021 2023 2025 2027 2029 2031 2033 2035
m boe/d
Probable Triggered Possible Triggered Technical Triggered New Triggered
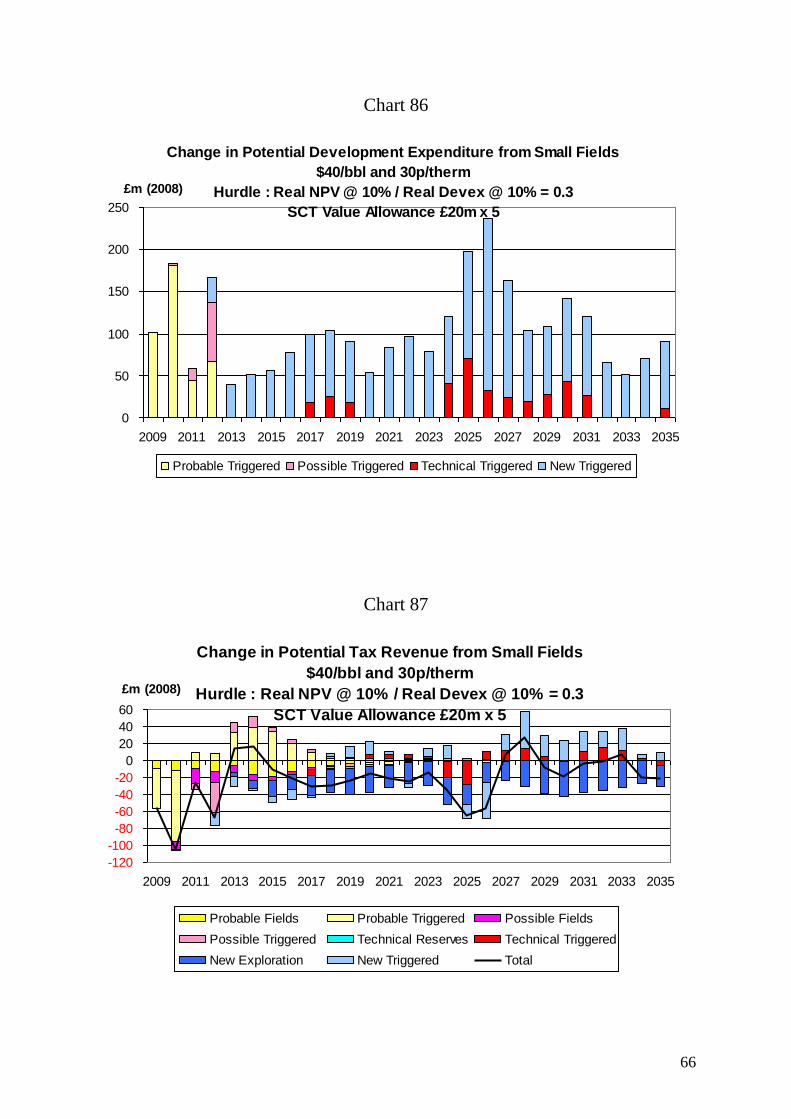
66
Chart 86
Change in Potential Development Expenditure from Small Fields
$40/bbl and 30p/therm
Hurdle : Real NPV @ 10% / Real Devex @ 10% = 0.3
SCT Value Allowance £20m x 5
0
50
100
150
200
250
2009 2011 2013 2015 2017 2019 2021 2023 2025 2027 2029 2031 2033 2035
£m (2008)
Probable Triggered Possible Triggered Technical Triggered New Triggered
Chart 87
Change in Potential Tax Revenue from Small Fields
$40/bbl and 30p/therm
Hurdle : Real NPV @ 10% / Real Devex @ 10% = 0.3
SCT Value Allowance £20m x 5
-120
-100
-80
-60
-40
-20
0
20
40
60
2009 2011 2013 2015 2017 2019 2021 2023 2025 2027 2029 2031 2033 2035
£m (2008)
Probable Fields Probable Triggered Possible Fields
Possible Triggered Technical Reserves Technical Triggered
New Exploration New Triggered Total
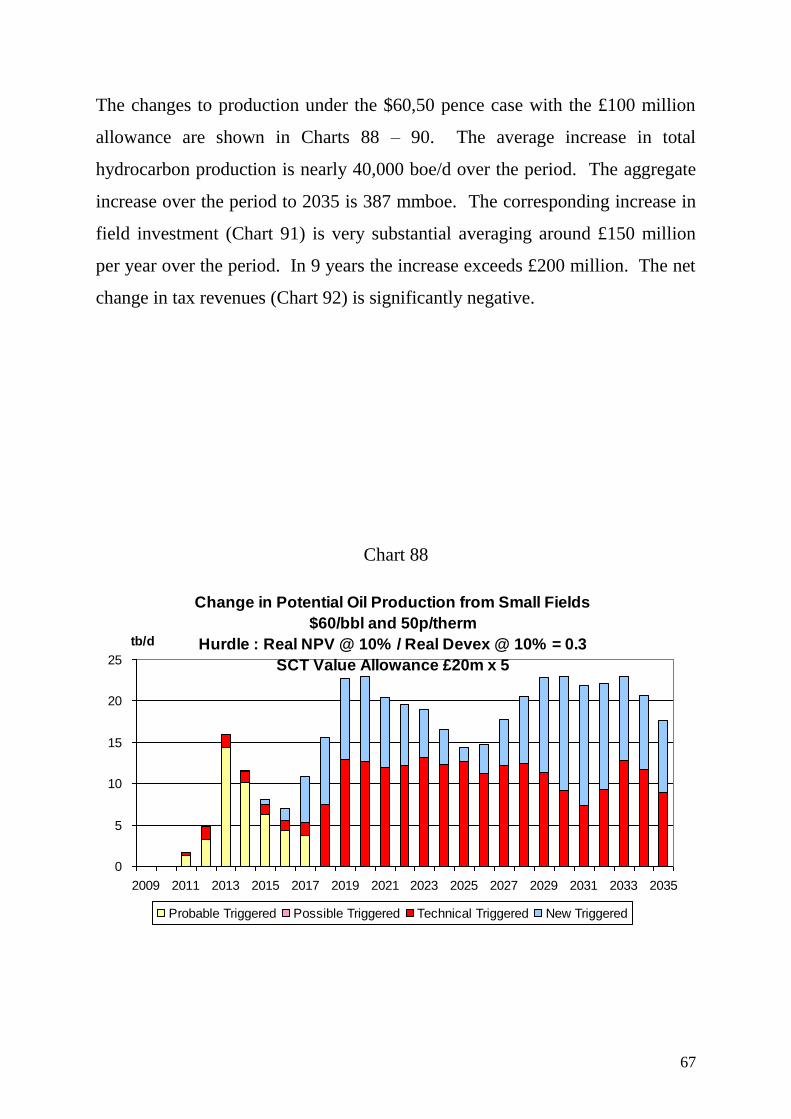
67
The changes to production under the $60,50 pence case with the £100 million
allowance are shown in Charts 88 – 90. The average increase in total
hydrocarbon production is nearly 40,000 boe/d over the period. The aggregate
increase over the period to 2035 is 387 mmboe. The corresponding increase in
field investment (Chart 91) is very substantial averaging around £150 million
per year over the period. In 9 years the increase exceeds £200 million. The net
change in tax revenues (Chart 92) is significantly negative.
Chart 88
Change in Potential Oil Production from Small Fields
$60/bbl and 50p/therm
Hurdle : Real NPV @ 10% / Real Devex @ 10% = 0.3
SCT Value Allowance £20m x 5
0
5
10
15
20
25
2009 2011 2013 2015 2017 2019 2021 2023 2025 2027 2029 2031 2033 2035
tb/d
Probable Triggered Possible Triggered Technical Triggered New Triggered
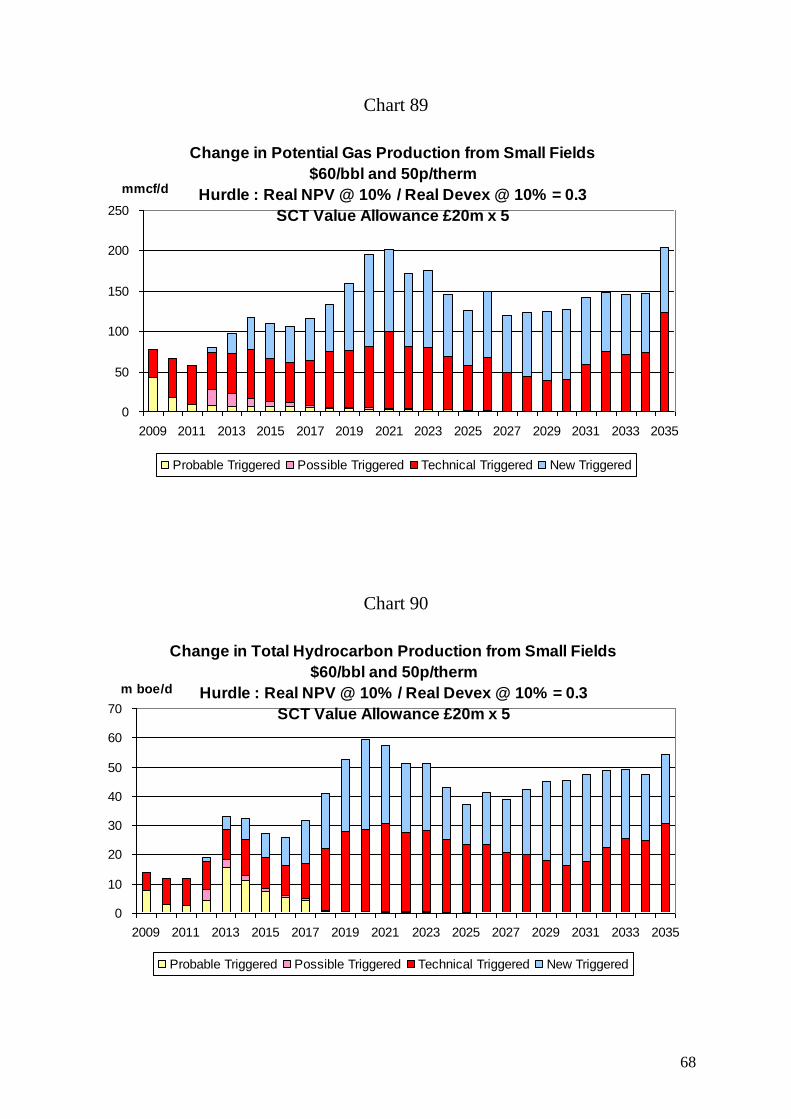
68
Chart 89
Change in Potential Gas Production from Small Fields
$60/bbl and 50p/therm
Hurdle : Real NPV @ 10% / Real Devex @ 10% = 0.3
SCT Value Allowance £20m x 5
0
50
100
150
200
250
2009 2011 2013 2015 2017 2019 2021 2023 2025 2027 2029 2031 2033 2035
mmcf/d
Probable Triggered Possible Triggered Technical Triggered New Triggered
Chart 90
Change in Total Hydrocarbon Production from Small Fields
$60/bbl and 50p/therm
Hurdle : Real NPV @ 10% / Real Devex @ 10% = 0.3
SCT Value Allowance £20m x 5
0
10
20
30
40
50
60
70
2009 2011 2013 2015 2017 2019 2021 2023 2025 2027 2029 2031 2033 2035
m boe/d
Probable Triggered Possible Triggered Technical Triggered New Triggered
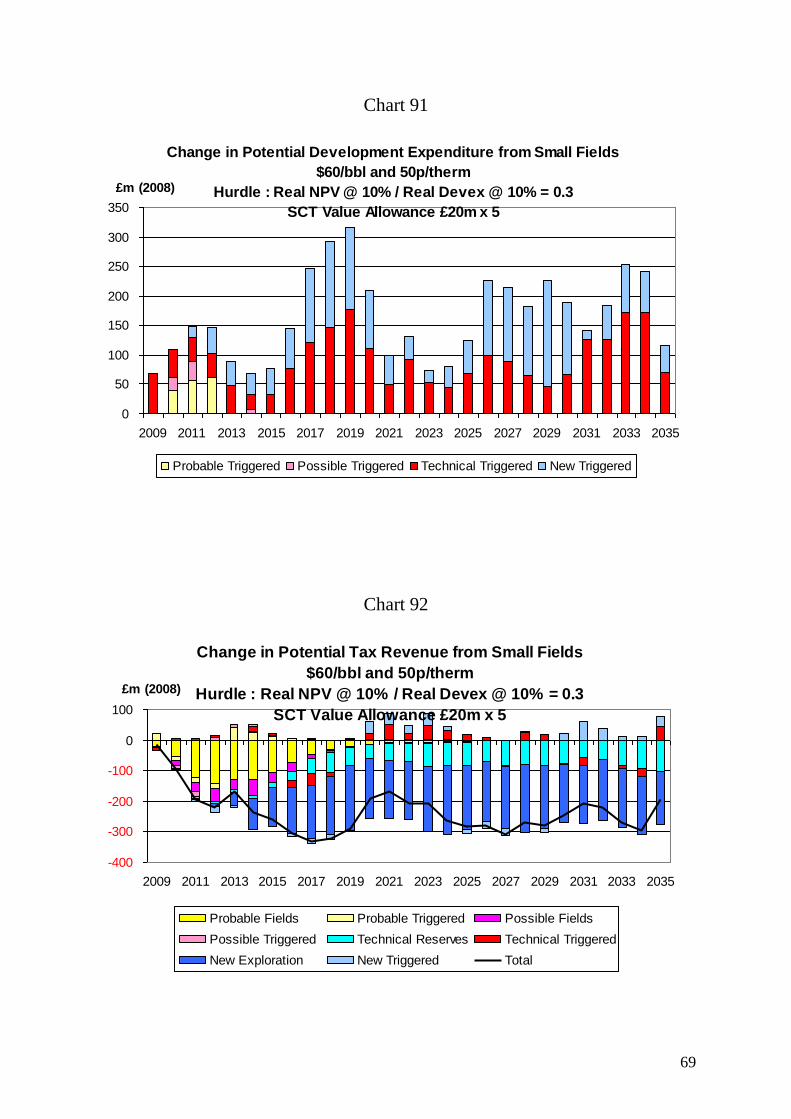
69
Chart 91
Change in Potential Development Expenditure from Small Fields
$60/bbl and 50p/therm
Hurdle : Real NPV @ 10% / Real Devex @ 10% = 0.3
SCT Value Allowance £20m x 5
0
50
100
150
200
250
300
350
2009 2011 2013 2015 2017 2019 2021 2023 2025 2027 2029 2031 2033 2035
£m (2008)
Probable Triggered Possible Triggered Technical Triggered New Triggered
Chart 92
Change in Potential Tax Revenue from Small Fields
$60/bbl and 50p/therm
Hurdle : Real NPV @ 10% / Real Devex @ 10% = 0.3
SCT Value Allowance £20m x 5
-400
-300
-200
-100
0
100
2009 2011 2013 2015 2017 2019 2021 2023 2025 2027 2029 2031 2033 2035
£m (2008)
Probable Fields Probable Triggered Possible Fields
Possible Triggered Technical Reserves Technical Triggered
New Exploration New Triggered Total
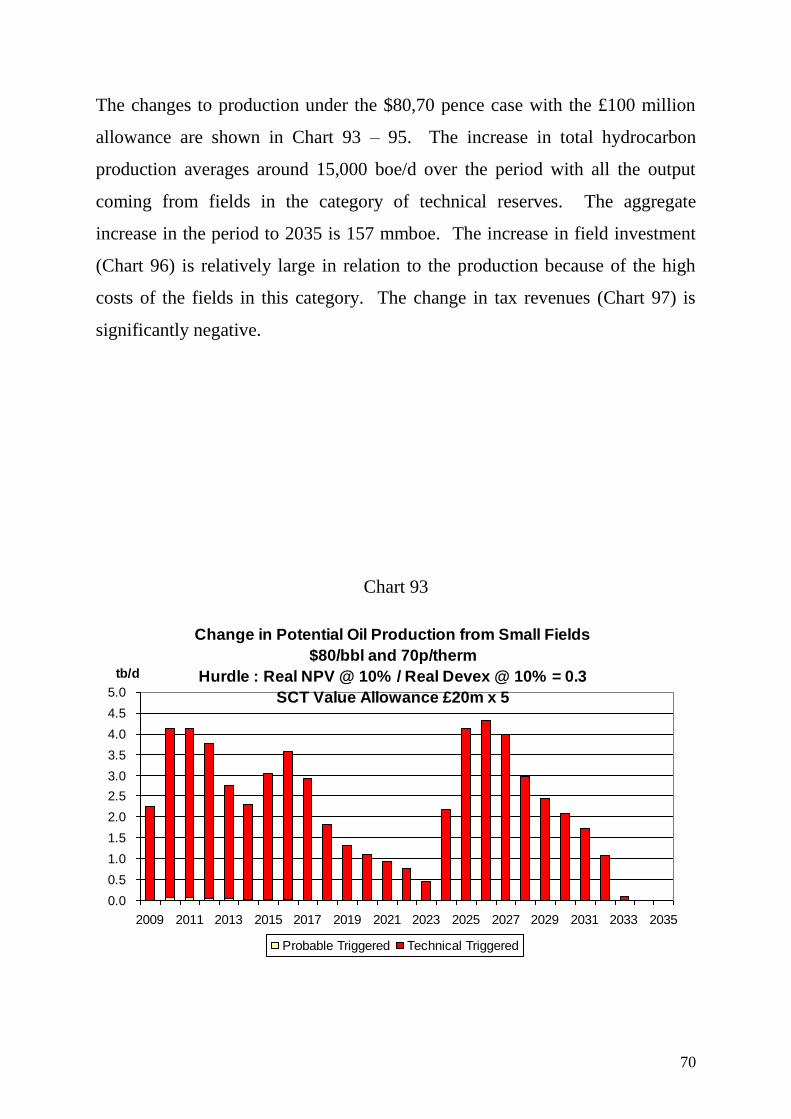
70
The changes to production under the $80,70 pence case with the £100 million
allowance are shown in Chart 93 – 95. The increase in total hydrocarbon
production averages around 15,000 boe/d over the period with all the output
coming from fields in the category of technical reserves. The aggregate
increase in the period to 2035 is 157 mmboe. The increase in field investment
(Chart 96) is relatively large in relation to the production because of the high
costs of the fields in this category. The change in tax revenues (Chart 97) is
significantly negative.
Chart 93
Change in Potential Oil Production from Small Fields
$80/bbl and 70p/therm
Hurdle : Real NPV @ 10% / Real Devex @ 10% = 0.3
SCT Value Allowance £20m x 5
0.0
0.5
1.0
1.5
2.0
2.5
3.0
3.5
4.0
4.5
5.0
2009 2011 2013 2015 2017 2019 2021 2023 2025 2027 2029 2031 2033 2035
tb/d
Probable Triggered Technical Triggered
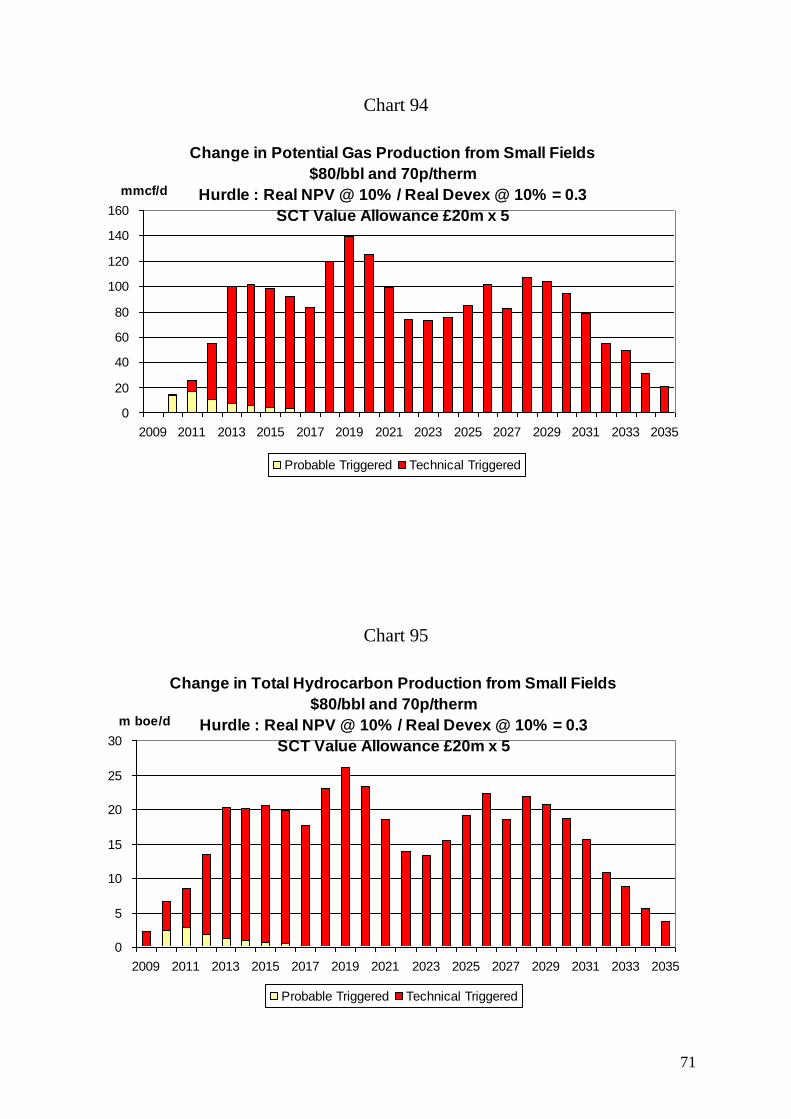
71
Chart 94
Change in Potential Gas Production from Small Fields
$80/bbl and 70p/therm
Hurdle : Real NPV @ 10% / Real Devex @ 10% = 0.3
SCT Value Allowance £20m x 5
0
20
40
60
80
100
120
140
160
2009 2011 2013 2015 2017 2019 2021 2023 2025 2027 2029 2031 2033 2035
mmcf/d
Probable Triggered Technical Triggered
Chart 95
Change in Total Hydrocarbon Production from Small Fields
$80/bbl and 70p/therm
Hurdle : Real NPV @ 10% / Real Devex @ 10% = 0.3
SCT Value Allowance £20m x 5
0
5
10
15
20
25
30
2009 2011 2013 2015 2017 2019 2021 2023 2025 2027 2029 2031 2033 2035
m boe/d
Probable Triggered Technical Triggered
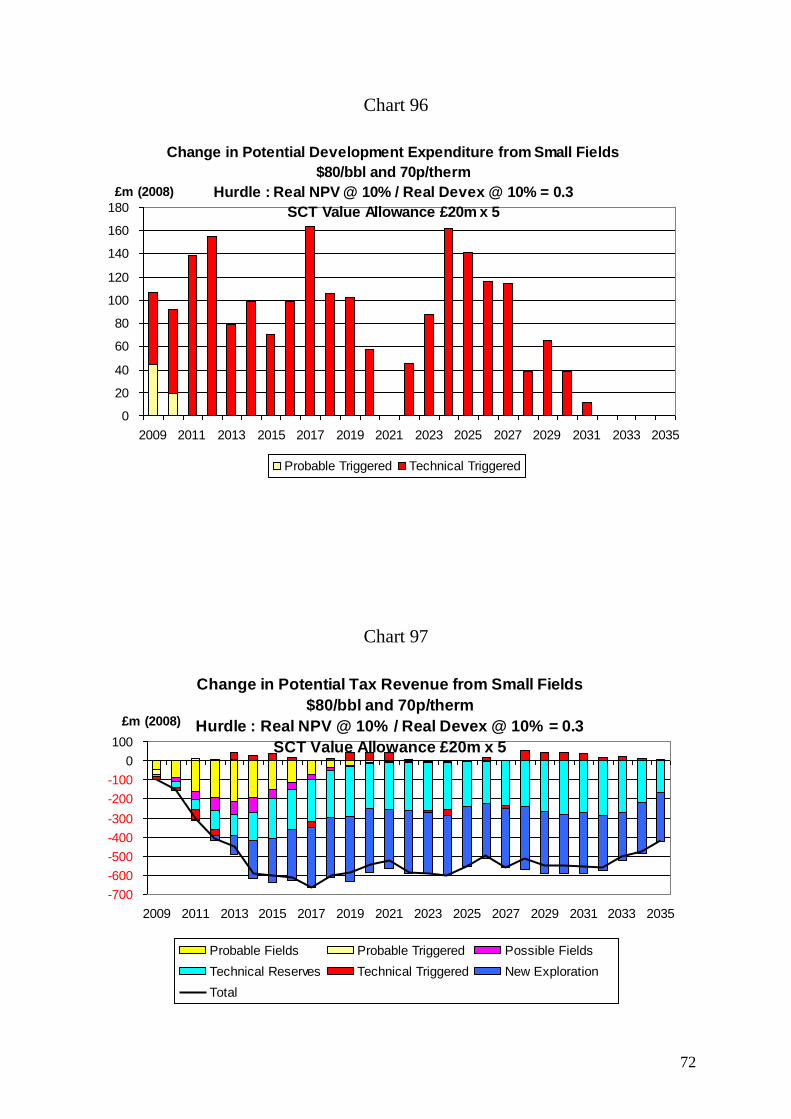
72
Chart 96
Change in Potential Development Expenditure from Small Fields
$80/bbl and 70p/therm
Hurdle : Real NPV @ 10% / Real Devex @ 10% = 0.3
SCT Value Allowance £20m x 5
0
20
40
60
80
100
120
140
160
180
2009 2011 2013 2015 2017 2019 2021 2023 2025 2027 2029 2031 2033 2035
£m (2008)
Probable Triggered Technical Triggered
Chart 97
Change in Potential Tax Revenue from Small Fields
$80/bbl and 70p/therm
Hurdle : Real NPV @ 10% / Real Devex @ 10% = 0.3
SCT Value Allowance £20m x 5
-700
-600
-500
-400
-300
-200
-100
0
100
2009 2011 2013 2015 2017 2019 2021 2023 2025 2027 2029 2031 2033 2035
£m (2008)
Probable Fields Probable Triggered Possible Fields
Technical Reserves Technical Triggered New Exploration
Total
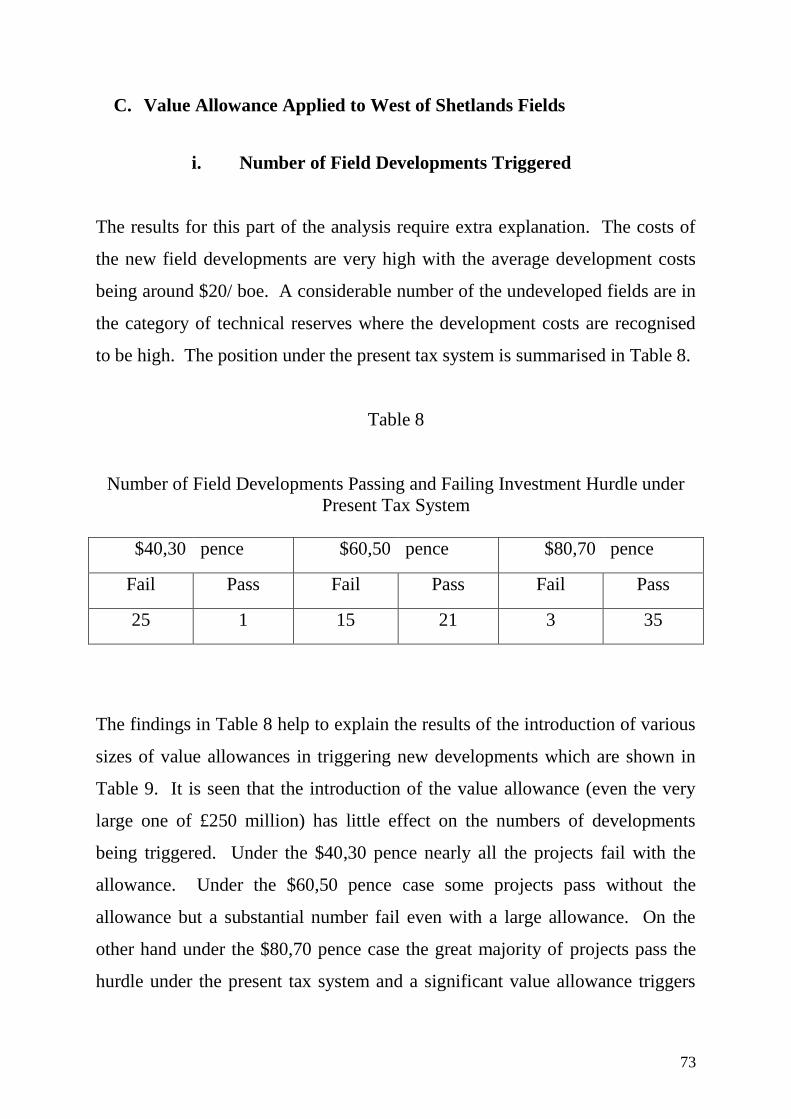
73
C. Value Allowance Applied to West of Shetlands Fields
i. Number of Field Developments Triggered
The results for this part of the analysis require extra explanation. The costs of
the new field developments are very high with the average development costs
being around $20/ boe. A considerable number of the undeveloped fields are in
the category of technical reserves where the development costs are recognised
to be high. The position under the present tax system is summarised in Table 8.
Table 8
Number of Field Developments Passing and Failing Investment Hurdle under
Present Tax System
$40,30 pence $60,50 pence $80,70 pence
Fail Pass Fail Pass Fail Pass
25 1 15 21 3 35
The findings in Table 8 help to explain the results of the introduction of various
sizes of value allowances in triggering new developments which are shown in
Table 9. It is seen that the introduction of the value allowance (even the very
large one of £250 million) has little effect on the numbers of developments
being triggered. Under the $40,30 pence nearly all the projects fail with the
allowance. Under the $60,50 pence case some projects pass without the
allowance but a substantial number fail even with a large allowance. On the
other hand under the $80,70 pence case the great majority of projects pass the
hurdle under the present tax system and a significant value allowance triggers
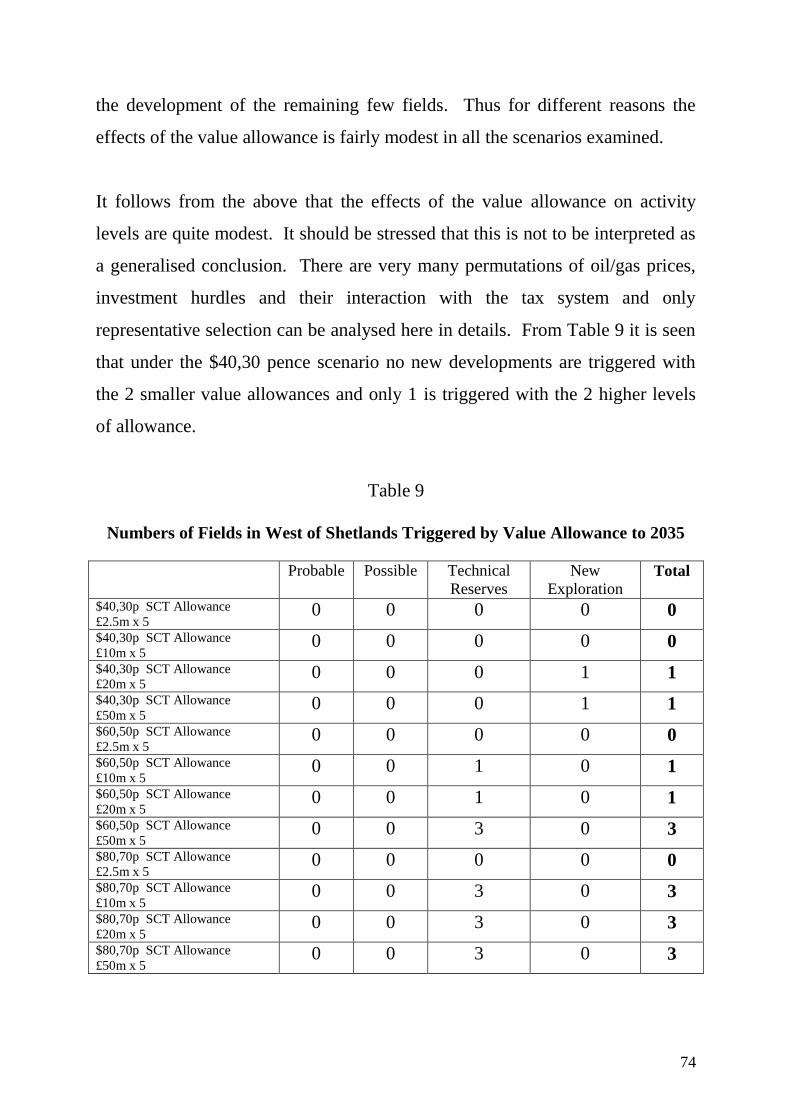
74
the development of the remaining few fields. Thus for different reasons the
effects of the value allowance is fairly modest in all the scenarios examined.
It follows from the above that the effects of the value allowance on activity
levels are quite modest. It should be stressed that this is not to be interpreted as
a generalised conclusion. There are very many permutations of oil/gas prices,
investment hurdles and their interaction with the tax system and only
representative selection can be analysed here in details. From Table 9 it is seen
that under the $40,30 pence scenario no new developments are triggered with
the 2 smaller value allowances and only 1 is triggered with the 2 higher levels
of allowance.
Table 9
Numbers of Fields in West of Shetlands Triggered by Value Allowance to 2035
Probable Possible Technical
Reserves
New
Exploration Total
$40,30p SCT Allowance
£2.5m x 5 0 0 0 0 0
$40,30p SCT Allowance
£10m x 5 0 0 0 0 0
$40,30p SCT Allowance
£20m x 5 0 0 0 1 1
$40,30p SCT Allowance
£50m x 5 0 0 0 1 1
$60,50p SCT Allowance
£2.5m x 5 0 0 0 0 0
$60,50p SCT Allowance
£10m x 5 0 0 1 0 1
$60,50p SCT Allowance
£20m x 5 0 0 1 0 1
$60,50p SCT Allowance
£50m x 5 0 0 3 0 3
$80,70p SCT Allowance
£2.5m x 5 0 0 0 0 0
$80,70p SCT Allowance
£10m x 5 0 0 3 0 3
$80,70p SCT Allowance
£20m x 5 0 0 3 0 3
$80,70p SCT Allowance
£50m x 5 0 0 3 0 3
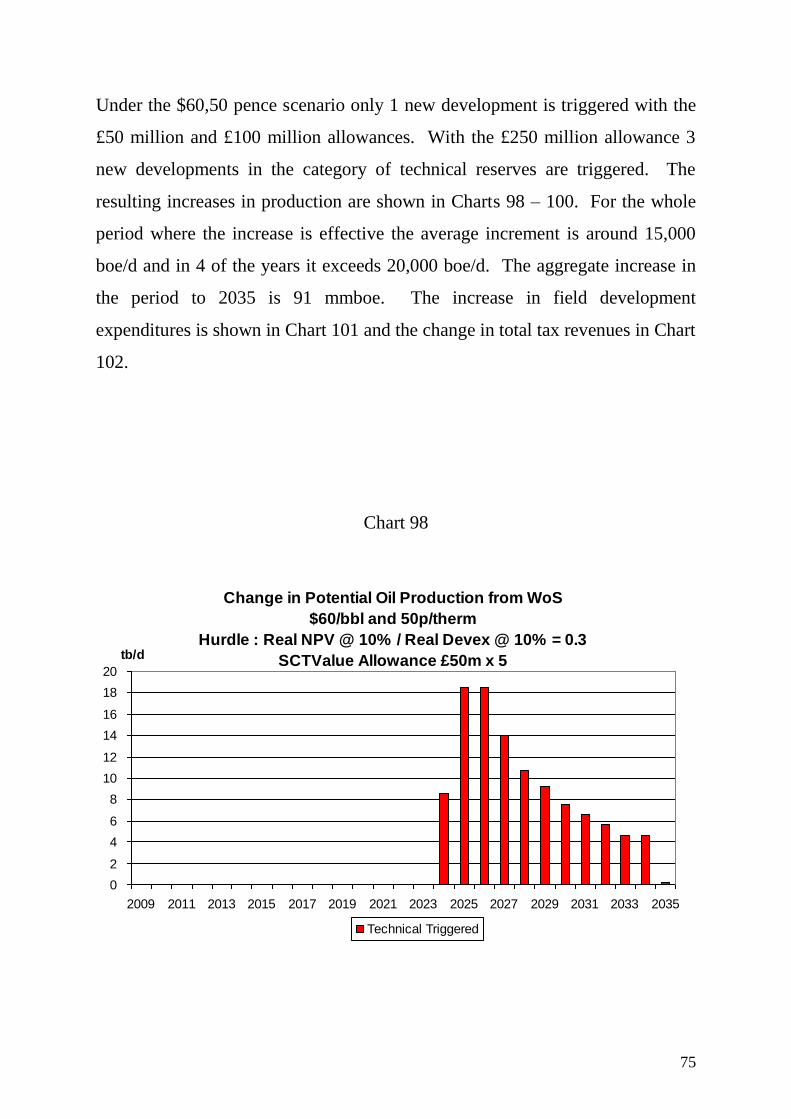
75
Under the $60,50 pence scenario only 1 new development is triggered with the
£50 million and £100 million allowances. With the £250 million allowance 3
new developments in the category of technical reserves are triggered. The
resulting increases in production are shown in Charts 98 – 100. For the whole
period where the increase is effective the average increment is around 15,000
boe/d and in 4 of the years it exceeds 20,000 boe/d. The aggregate increase in
the period to 2035 is 91 mmboe. The increase in field development
expenditures is shown in Chart 101 and the change in total tax revenues in Chart
102.
Chart 98
Change in Potential Oil Production from WoS
$60/bbl and 50p/therm
Hurdle : Real NPV @ 10% / Real Devex @ 10% = 0.3
SCTValue Allowance £50m x 5
0
2
4
6
8
10
12
14
16
18
20
2009 2011 2013 2015 2017 2019 2021 2023 2025 2027 2029 2031 2033 2035
tb/d
Technical Triggered
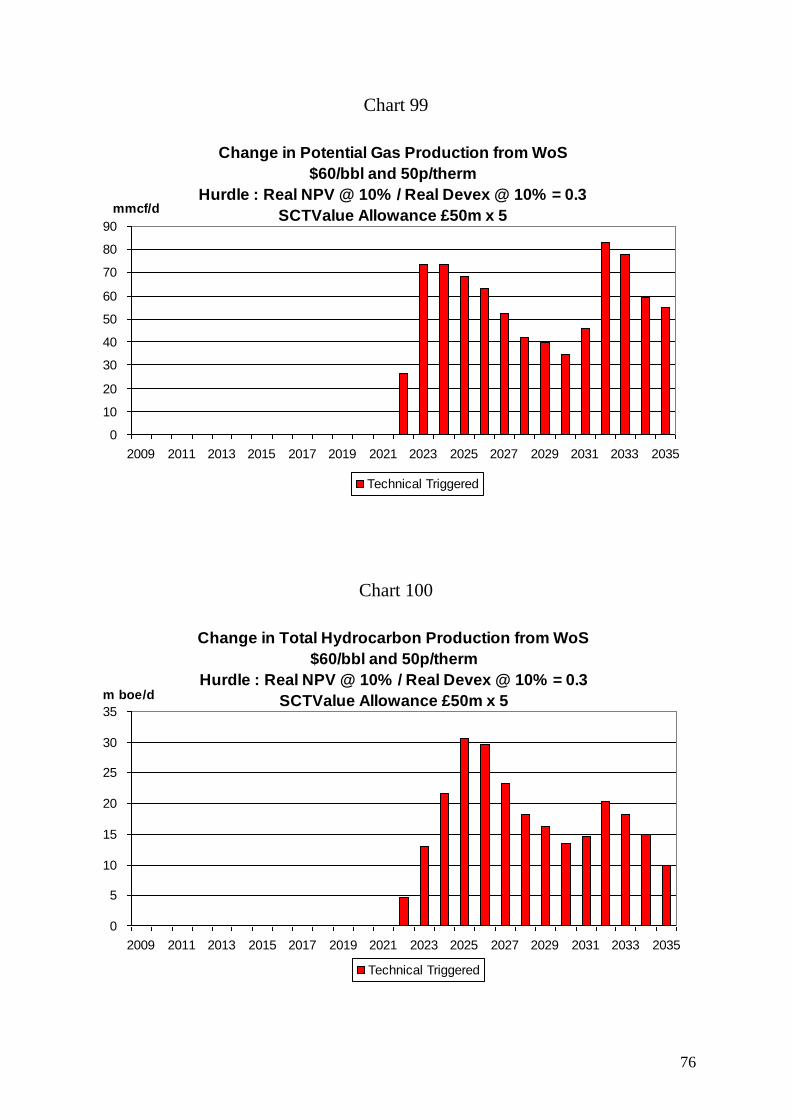
76
Chart 99
Change in Potential Gas Production from WoS
$60/bbl and 50p/therm
Hurdle : Real NPV @ 10% / Real Devex @ 10% = 0.3
SCTValue Allowance £50m x 5
0
10
20
30
40
50
60
70
80
90
2009 2011 2013 2015 2017 2019 2021 2023 2025 2027 2029 2031 2033 2035
mmcf/d
Technical Triggered
Chart 100
Change in Total Hydrocarbon Production from WoS
$60/bbl and 50p/therm
Hurdle : Real NPV @ 10% / Real Devex @ 10% = 0.3
SCTValue Allowance £50m x 5
0
5
10
15
20
25
30
35
2009 2011 2013 2015 2017 2019 2021 2023 2025 2027 2029 2031 2033 2035
m boe/d
Technical Triggered
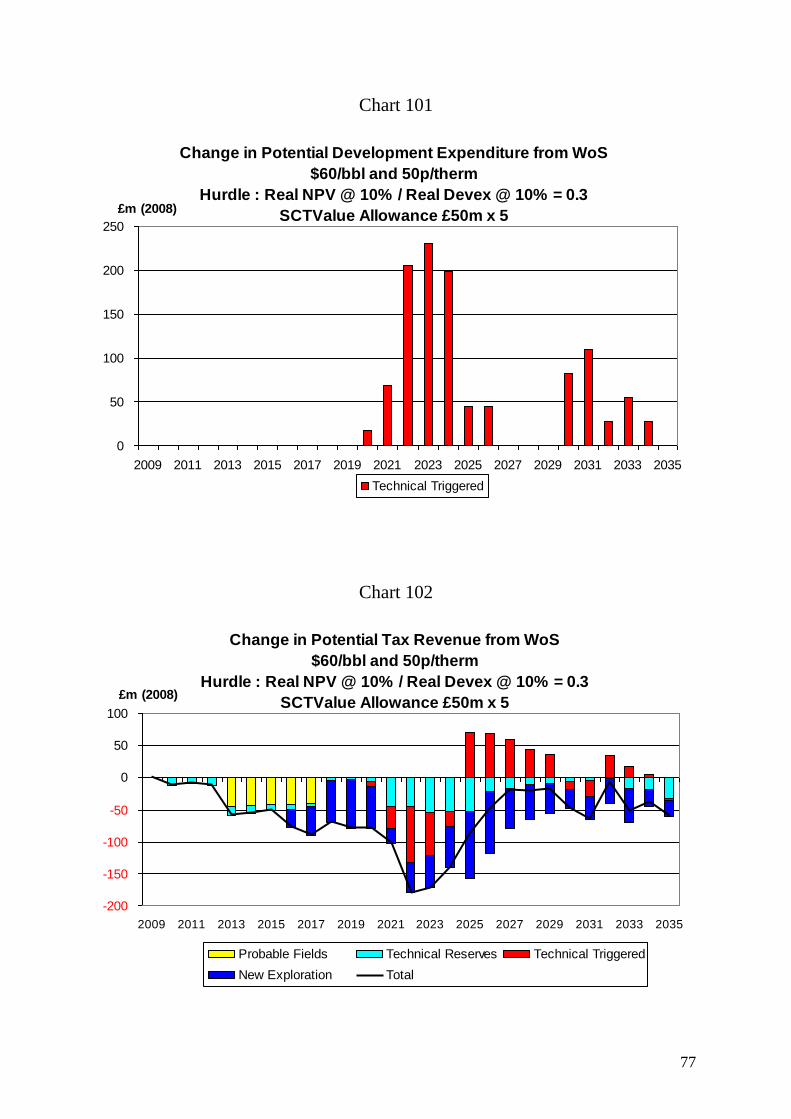
77
Chart 101
Change in Potential Development Expenditure from WoS
$60/bbl and 50p/therm
Hurdle : Real NPV @ 10% / Real Devex @ 10% = 0.3
SCTValue Allowance £50m x 5
0
50
100
150
200
250
2009 2011 2013 2015 2017 2019 2021 2023 2025 2027 2029 2031 2033 2035
£m (2008)
Technical Triggered
Chart 102
Change in Potential Tax Revenue from WoS
$60/bbl and 50p/therm
Hurdle : Real NPV @ 10% / Real Devex @ 10% = 0.3
SCTValue Allowance £50m x 5
-200
-150
-100
-50
0
50
100
2009 2011 2013 2015 2017 2019 2021 2023 2025 2027 2029 2031 2033 2035
£m (2008)
Probable Fields Technical Reserves Technical Triggered
New Exploration Total
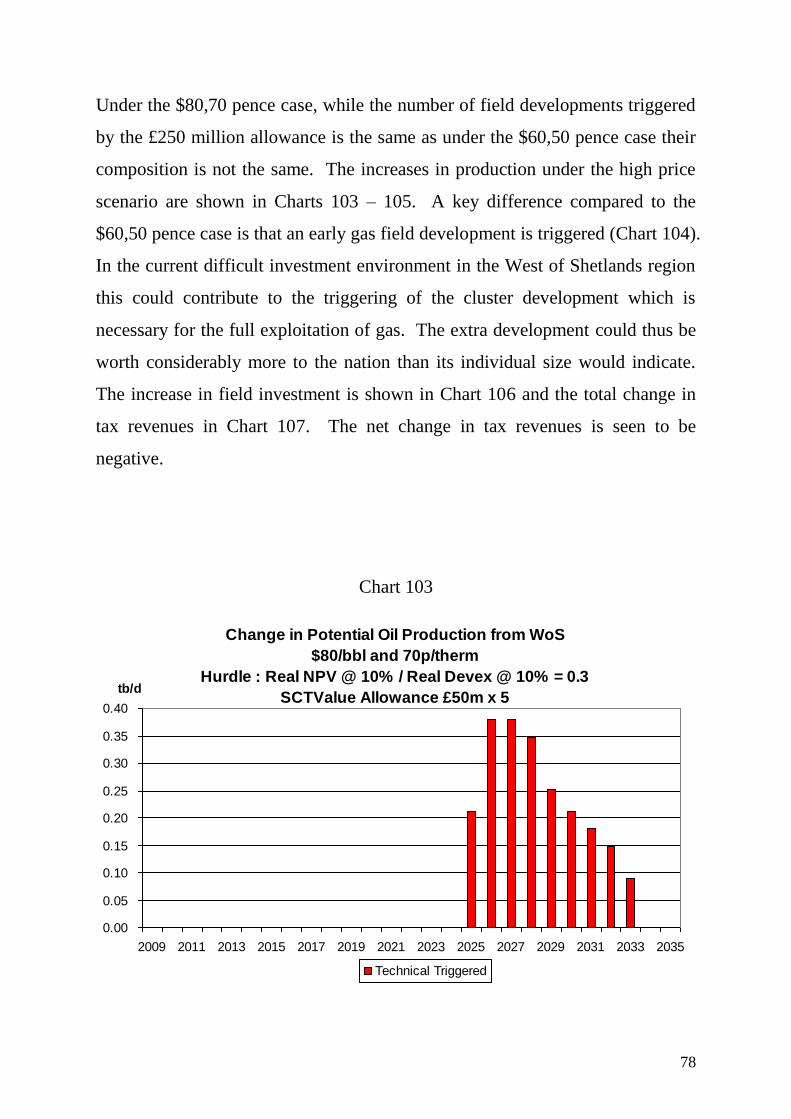
78
Under the $80,70 pence case, while the number of field developments triggered
by the £250 million allowance is the same as under the $60,50 pence case their
composition is not the same. The increases in production under the high price
scenario are shown in Charts 103 – 105. A key difference compared to the
$60,50 pence case is that an early gas field development is triggered (Chart 104).
In the current difficult investment environment in the West of Shetlands region
this could contribute to the triggering of the cluster development which is
necessary for the full exploitation of gas. The extra development could thus be
worth considerably more to the nation than its individual size would indicate.
The increase in field investment is shown in Chart 106 and the total change in
tax revenues in Chart 107. The net change in tax revenues is seen to be
negative.
Chart 103
Change in Potential Oil Production from WoS
$80/bbl and 70p/therm
Hurdle : Real NPV @ 10% / Real Devex @ 10% = 0.3
SCTValue Allowance £50m x 5
0.00
0.05
0.10
0.15
0.20
0.25
0.30
0.35
0.40
2009 2011 2013 2015 2017 2019 2021 2023 2025 2027 2029 2031 2033 2035
tb/d
Technical Triggered
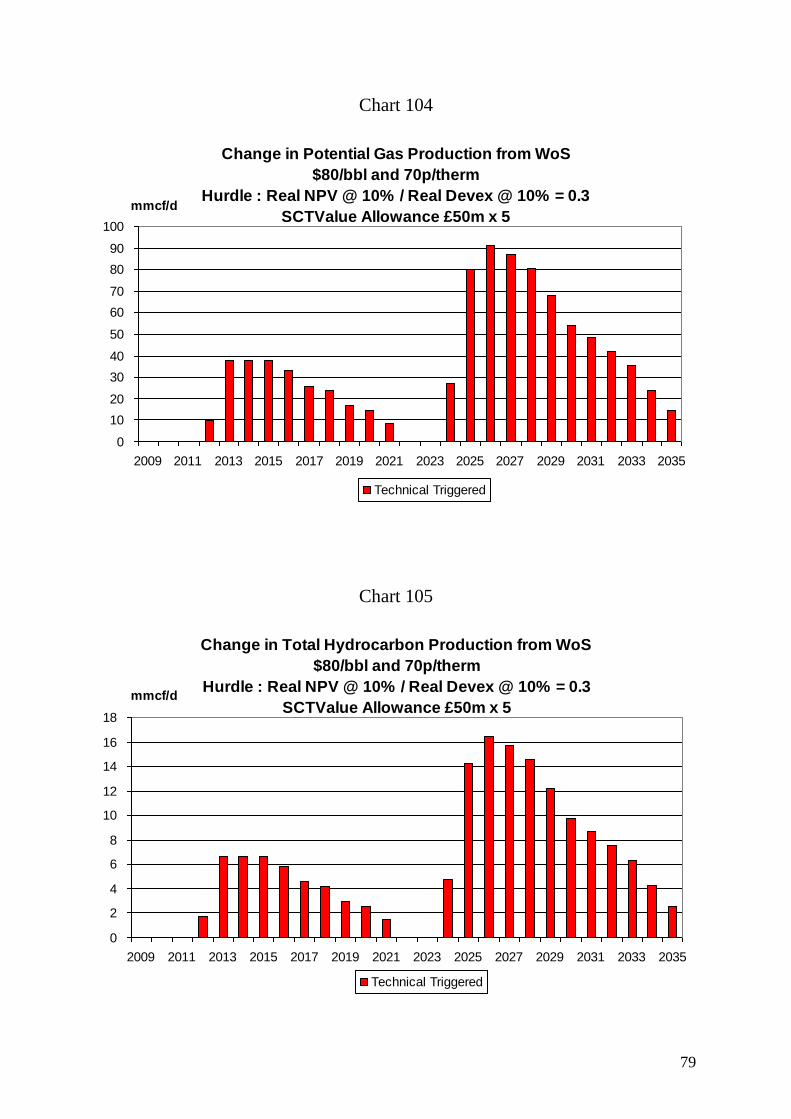
79
Chart 104
Change in Potential Gas Production from WoS
$80/bbl and 70p/therm
Hurdle : Real NPV @ 10% / Real Devex @ 10% = 0.3
SCTValue Allowance £50m x 5
0
10
20
30
40
50
60
70
80
90
100
2009 2011 2013 2015 2017 2019 2021 2023 2025 2027 2029 2031 2033 2035
mmcf/d
Technical Triggered
Chart 105
Change in Total Hydrocarbon Production from WoS
$80/bbl and 70p/therm
Hurdle : Real NPV @ 10% / Real Devex @ 10% = 0.3
SCTValue Allowance £50m x 5
0
2
4
6
8
10
12
14
16
18
2009 2011 2013 2015 2017 2019 2021 2023 2025 2027 2029 2031 2033 2035
mmcf/d
Technical Triggered
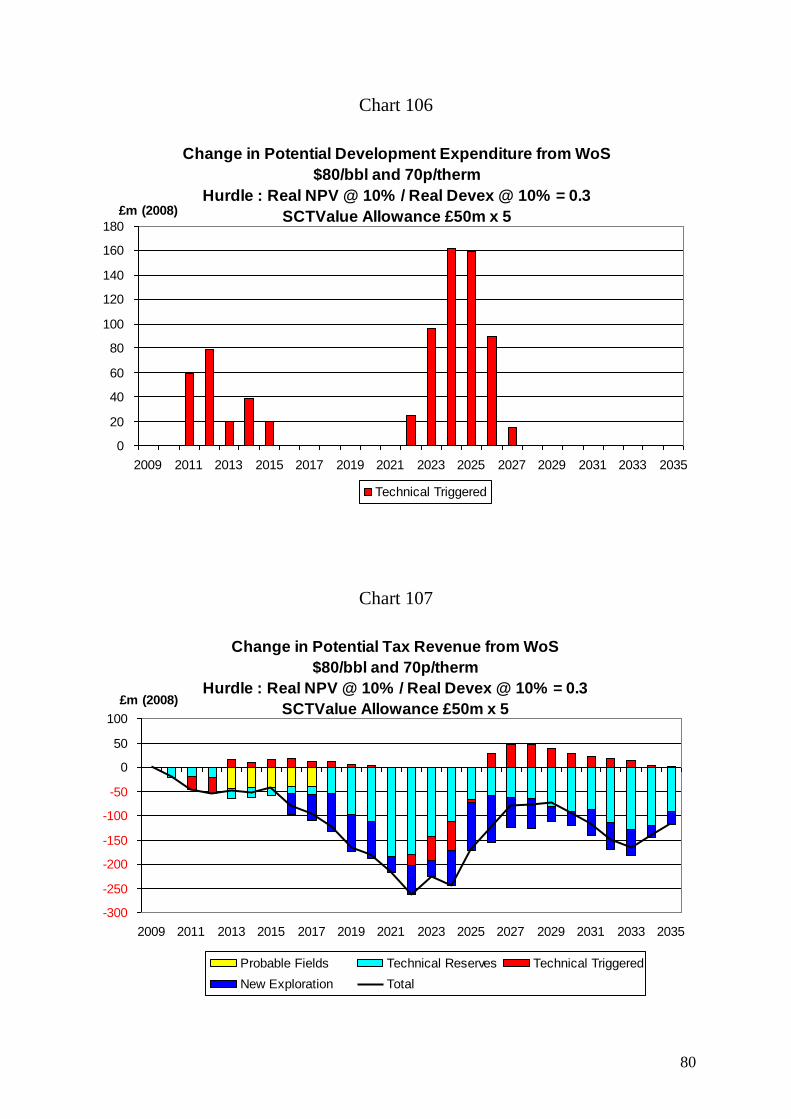
80
Chart 106
Change in Potential Development Expenditure from WoS
$80/bbl and 70p/therm
Hurdle : Real NPV @ 10% / Real Devex @ 10% = 0.3
SCTValue Allowance £50m x 5
0
20
40
60
80
100
120
140
160
180
2009 2011 2013 2015 2017 2019 2021 2023 2025 2027 2029 2031 2033 2035
£m (2008)
Technical Triggered
Chart 107
Change in Potential Tax Revenue from WoS
$80/bbl and 70p/therm
Hurdle : Real NPV @ 10% / Real Devex @ 10% = 0.3
SCTValue Allowance £50m x 5
-300
-250
-200
-150
-100
-50
0
50
100
2009 2011 2013 2015 2017 2019 2021 2023 2025 2027 2029 2031 2033 2035
£m (2008)
Probable Fields Technical Reserves Technical Triggered
New Exploration Total
81
4. Interpretation of Results
The results of the detailed modelling in Section 3 clearly indicate that the
introduction of the value allowance for the SC can enhance activity levels as
measured by economic production and field investment. It is also clear that the
magnitude of the increased activity depends on the size of the value allowance
and the oil/ gas price scenario chosen to evaluate the effect. Of the 3 price
scenarios examined the effect is found to be greatest under the $60,50 pence
case. While worthwhile production is incentivised under the $40,30 pence case
less fields are viable under this price scenario. Relief from the SC is
insufficient to make many more projects viable. With the $80,70 pence price
scenario more projects are in any case viable without the benefit of the value
allowance and thus less are incentivised on account of it. It is clear from the
results that the higher the allowance the greater the number of field
developments incentivised. Thus the £12.5 million allowance has a much
smaller effect than the £50 million one which in turn has a smaller effect than
the £100 million one. It should be emphasised that the incentivised fields
generally still pay tax at the 30% rate on the working assumption employed that
the allowance is restricted to the field in question. A relevant consideration in
determining how big the allowance should be is the need to incentivise fields in
the category of technical reserves. Many of these are relatively high cost (per
boe) because they are located far from existing infrastructure or are relatively
small or have technical problems (such as HP/ HT characteristics). It was thus
found that under the $80,70 pence price case substantial numbers in this
category were non-viable under the present tax system and needed a large value
allowance to render them acceptable (Table 6).
The consultation document makes specific reference to small fields. These now
(numerically) dominate the remaining potential in the UKCS. Adopting a
82
definition of ≤ 20 mmboe and undertaking the modelling on the same basis as
for the totality of new fields revealed a consistent pattern of results. Thus the
numbers of fields incentivised increased with the size of the allowance and
more developments were triggered under the $60,50 pence price scenarios than
under the other two. Under the $80,70 pence case many fields in the category
of technical reserves required a substantial allowance to render them viable.
In the case of the fields located West of Shetlands the modelling of the
scenarios indicated that substantial allowances were required to make a
worthwhile impact on the number of viable new developments given the
relatively high costs per boe of the undeveloped fields. The modelling
underestimated the potential potency of triggering new developments because
under the $60,50 pence case even the very large (£250 million) allowance left
many fields non-viable while under the $80,70 pence case most fields were
found to pass the investment hurdle without the allowance. Thus at price
scenarios between $60,50 pence and $80,70 pence the value allowance would
have been much more potent.
It should be stressed that the detailed modelling has been undertaken using
discount rates of 10% in real terms and minimum acceptable NPV/ I ratios of
0.3. Given the current problems in the financial markets, the resulting capital
scarcity could well mean that these assumptions do not fully reflect the tough
conditions facing some investors. The effects of raising the discount rates and
the minimum capital productivity index (NPV/ I) have been modelled under the
current tax system. The results for discount rates of 12.5% and 15% and
minimum NPV/ I ratios of 0.5 in terms of numbers of viable new fields (and
incremental projects) are shown in Table 10 (excluding any value allowance).
The numbers of viable fields/ projects are seen to be particularly sensitive to an
increase in the minimum NPV/ I ratio from 0.3 to 0.5. The effects on total

83
production in the period 2008 – 2035 from raising the discount rate from 10% to
12.5% and the minimum NPV/ I ration from 0.3 to 0.5 are shown in Tables 11 –
14. It is seen that the decrease in cumulative production from an increase in the
capital productivity index is very substantial.
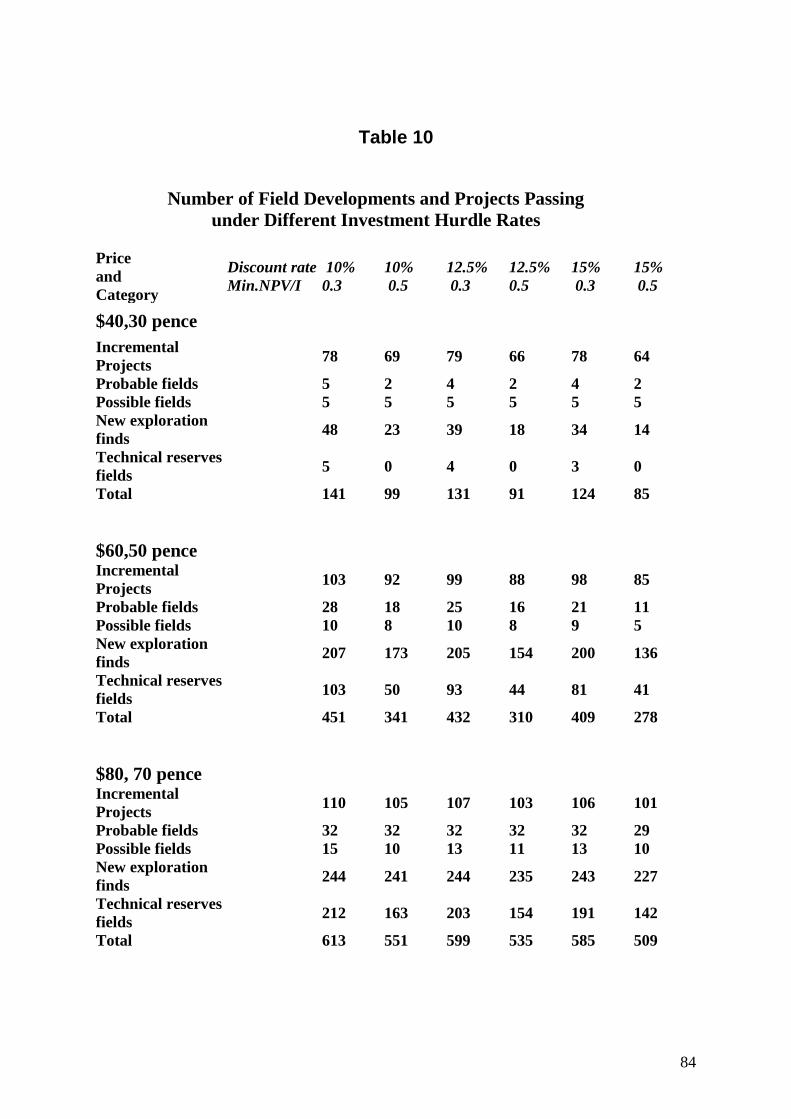
84
Table 10
Number of Field Developments and Projects Passing
under Different Investment Hurdle Rates
Price
and
Category
Discount rate
Min.NPV/I
10%
0.3
10%
0.5
12.5%
0.3
12.5%
0.5
15%
0.3
15%
0.5
$40,30 pence
Incremental
Projects 78 69 79 66 78 64
Probable fields 5 2 4 2 4 2
Possible fields 5 5 5 5 5 5
New exploration
finds 48 23 39 18 34 14
Technical reserves
fields 5 0 4 0 3 0
Total 141 99 131 91 124 85
$60,50 pence
Incremental
Projects 103 92 99 88 98 85
Probable fields 28 18 25 16 21 11
Possible fields 10 8 10 8 9 5
New exploration
finds 207 173 205 154 200 136
Technical reserves
fields 103 50 93 44 81 41
Total 451 341 432 310 409 278
$80, 70 pence
Incremental
Projects 110 105 107 103 106 101
Probable fields 32 32 32 32 32 29
Possible fields 15 10 13 11 13 10
New exploration
finds 244 241 244 235 243 227
Technical reserves
fields 212 163 203 154 191 142
Total 613 551 599 535 585 509
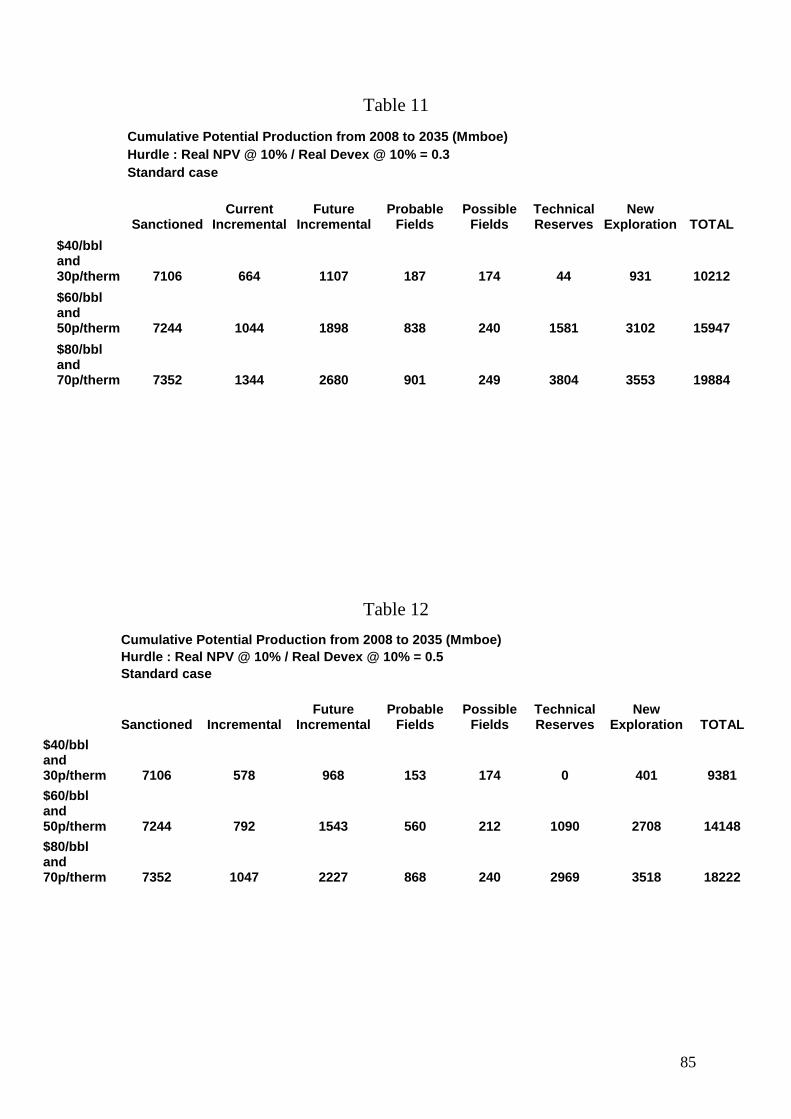
85
Table 11
Cumulative Potential Production from 2008 to 2035 (Mmboe)
Hurdle : Real NPV @ 10% / Real Devex @ 10% = 0.3
Standard case
Sanctioned Current
Incremental Future
Incremental Probable
Fields Possible
Fields Technical Reserves
New Exploration TOTAL
$40/bbl and 30p/therm 7106 664 1107 187 174 44 931 10212
$60/bbl and 50p/therm 7244 1044 1898 838 240 1581 3102 15947
$80/bbl and 70p/therm 7352 1344 2680 901 249 3804 3553 19884
Table 12
Cumulative Potential Production from 2008 to 2035 (Mmboe)
Hurdle : Real NPV @ 10% / Real Devex @ 10% = 0.5
Standard case
Sanctioned Incremental Future
Incremental Probable
Fields Possible
Fields Technical Reserves
New Exploration TOTAL
$40/bbl and 30p/therm 7106 578 968 153 174 0 401 9381
$60/bbl and 50p/therm 7244 792 1543 560 212 1090 2708 14148
$80/bbl and 70p/therm 7352 1047 2227 868 240 2969 3518 18222
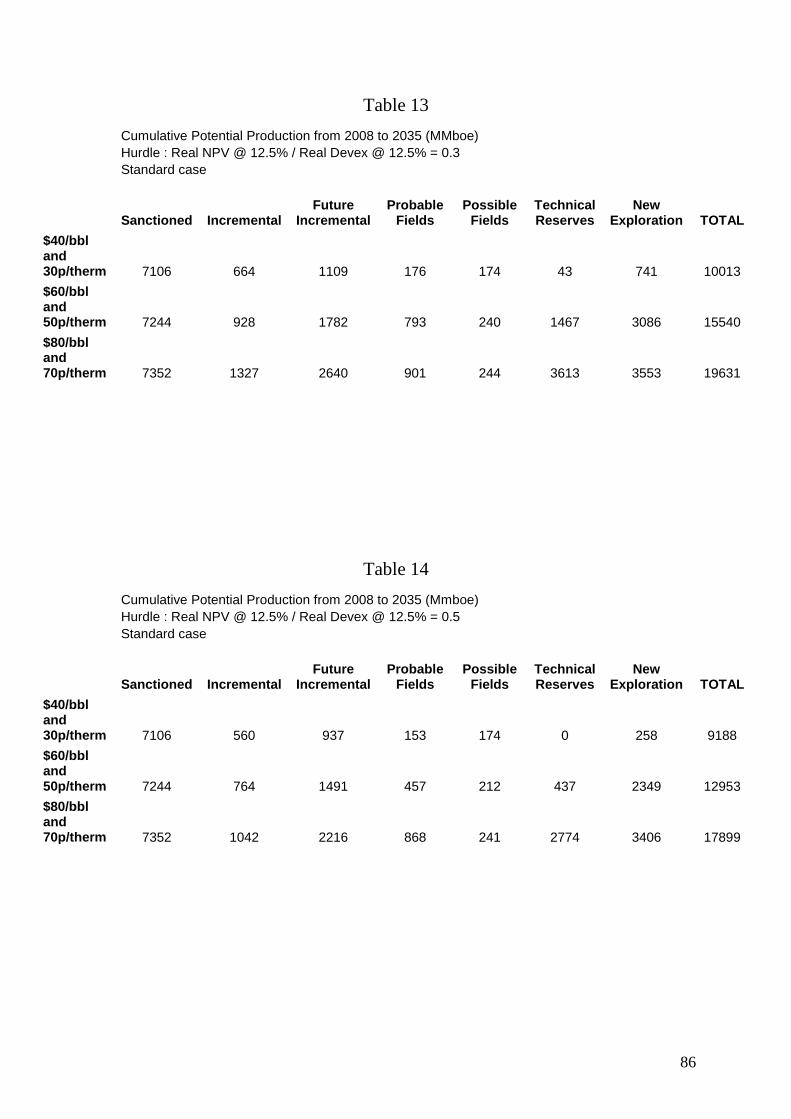
86
Table 13
Cumulative Potential Production from 2008 to 2035 (MMboe)
Hurdle : Real NPV @ 12.5% / Real Devex @ 12.5% = 0.3
Standard case
Sanctioned Incremental Future
Incremental Probable
Fields Possible
Fields Technical Reserves
New Exploration TOTAL
$40/bbl and 30p/therm 7106 664 1109 176 174 43 741 10013
$60/bbl and 50p/therm 7244 928 1782 793 240 1467 3086 15540
$80/bbl and 70p/therm 7352 1327 2640 901 244 3613 3553 19631
Table 14
Cumulative Potential Production from 2008 to 2035 (Mmboe)
Hurdle : Real NPV @ 12.5% / Real Devex @ 12.5% = 0.5
Standard case
Sanctioned Incremental Future
Incremental Probable
Fields Possible
Fields Technical Reserves
New Exploration TOTAL
$40/bbl and 30p/therm 7106 560 937 153 174 0 258 9188
$60/bbl and 50p/therm 7244 764 1491 457 212 437 2349 12953
$80/bbl and 70p/therm 7352 1042 2216 868 241 2774 3406 17899
87
It follows from the above that under these more stringent assumptions about
capital market conditions there are further prospects for the value allowance
making a positive contribution to incentivising new field developments. There
will clearly be more fields which are submarginal under the present tax system
and which could be rendered acceptable by the relief. The overall conclusion is
thus that the number of field developments which could be incentivised by a
worthwhile size of value allowance is likely to be understated by the use of 10%
discount rates and NPV/ I > 0.3 in the modelling.
5. Incremental Projects
The present consultation document deals principally with new fields. In the
current stage of the exploitation of the UKCS and the present investment
environment it is also important to incentivise the development of incremental
projects in existing fields. It is clear from Tables 10 – 14 that incremental
projects can play a major role in the full economic exploitation of the UKCS. In
PRT-paying fields the overall tax rate is 75% (PRT at 50%, CT at 30% and SC
at 20% with PRT being a deduction for CT and SC). The present authors have
very recently undertaken a detailed study of the effects of PRT on investment in
new projects.3 Cases were found where, using the same price scenarios,
discount rates and minimum NPV/ I ratios as in the main part of this study,
incremental projects were being deterred. It was suggested that a formula
should be designed and published which would clearly indicate the conditions
under which PRT would be removed from the incremental project. The
Government had suggested that PRT could be removed on a discretionary basis
from incremental projects which the investor had demonstrated were being
inhibited by PRT and which would proceed in its absence. The potential relief
3 See A G Kemp and L Stephen, North Sea Study Occasional Paper No. 110, The Economics of PRT
Redetermination for Incremental Projects in the UKCS, University of Aberdeen Department of Economics,
November 2008, pp. 56.
88
is also restricted to projects which could be clearly distinguished as separate
from the main field. The modelling by the present authors found that this
definition was unduly restrictive and could result in investment being deterred
in incremental projects which were not detached from the main field. The
potential relief should apply to all incremental projects.
An earlier Government consultation document discussed the possibility of
schemes which would abolish PRT altogether, with a buy-out scheme being a
preferred specific option for implementing the concept. This scheme has much
merit, and it is unfortunate that agreement on the idea was not reached between
the Government and the industry. Implementation of the scheme would have
significantly enhanced the attractions of investment in incremental projects at a
time when low oil prices are inhibiting them. The materiality of a project and
its capital productivity are greatly reduced when PRT is levied. The scheme
would also deal effectively with the vexed problem of PRT relief for
decommissioning costs. It is thus suggested that the scheme deserves
reconsideration.
A high proportion of incremental projects relate to non-PRT-paying fields.
While the tax burden on these is clearly less than on PRT-paying projects it can
still substantially affect the materiality of returns. Some of the projects are
known to be relatively high cost. While the effects of the current tax system on
these projects does not form part of the present consultation it is felt that
consideration should be given to this issue in the current investment climate of
relatively low oil/ gas prices, higher unit costs, and difficulties of raising debt
and equity capital.
89
6. Exploration Incentives
The current capital market difficulties combined with the low oil/ gas prices are
impacting greatly on the (mostly smaller) companies which rely on external
funds for financing their investment activities. Much of the exploration in the
UKCS is undertaken by medium and small companies and their exploration
budgets are currently very likely to be reduced. It is expected that the volume
of exploration activity in 2009 will be very much below that experienced in
recent years. In that context the impact of the tax system on investment in
exploration deserves further examination. Currently companies which are
already in a tax-paying position receive full relief for their exploration costs
whether these result in a discovery or not. Investors not in a tax-paying position
can carry forward their allowances for exploration, appraisal and development
at 6% compound interest for up to 6 years. This was designed to reflect a
riskless rate of interest (3.5% real plus 2.5% inflation). It does not reflect the
cost of capital for the risky exploration activity. Further, relief is only given
when the investor obtains income against which the allowance can be set. For
existing investors the Government shares in all the exploration risks but not
with new investors who have no production income. Arguably this
discrimination against new entrants is reducing the exploration effect by a class
of investor which is showing much interest in the activity. This problem is
exacerbated in current circumstances by the reduced cash flows from the price
collapse and the capital market difficulties.
Given the above there is a case for enhancing the current tax relief for investors
not in a tax-paying position. In Norway this issue is dealt with by the provision
of cash rebates to the extent of the marginal tax rate of the investor for approved
exploration activities. Conceptually, the introduction of this in the UKCS
would be to provide equality of treatment between existing taxpayers and non-
90
taxpayers. It would also incentivise exploration by companies which are keen
to undertake the activity but which are inhibited by the current combination of
low cash flows and difficulties of raising external capital. A less potent device
could be to raise the interest rate on allowances carried forward from 6%to a
rate which reflected the current cost of capital for the activity. This device
might not be very effective in current circumstances. Capital providers could
well be inhibited by the exploration risk involved. If, however, the preferred
scheme, akin to that now in use in Norway, were employed, explorers would be
more likely to obtain finance from capital providers who would be reassured by
the guarantied availability of refunds relating to approved expenditures.
7. Conclusions
It is clear that the top priority with respect to the UKCS is to procure maximum
economic recovery. This requires investment in (1) new field developments, (2)
incremental projects, and (3) exploration to translate the remaining potential
into discoveries. The tax system should not inhibit these activities. For new
field developments the modelling undertaken in this study provided conclusive
evidence that a value allowance against the SC could trigger further new
developments. The extent of the extra production and investment depends on
the size of the allowance and the oil/ gas price scenario employed. Of the 3
scenarios modelled in detail ((1) $40,30 pence, (2) $60,50 pence, and (3) $80,70
pence) it was found that the strongest effect on activity was found with the
$60,50 pence case. This might well be a central scenario currently employed by
investors. A key finding was that a substantial allowance was needed to trigger
a substantial number of developments. Thus many more were triggered with an
allowance of £100 million per field compared to £12.5 million. While there is
clearly room for debate on the appropriate size of allowance the modelling
91
found that a value allowance in the £50 million - £100 million range could have
very substantial effects under the $60,50 pence price scenario.
It should be stressed that all the incentivised developments are economic ones
and continue to pay North Sea corporation tax. It is arguable that all
developments which remained viable in a pre-tax basis but not on a post-tax
basis should be incentivised by the tax system, given the clear need to
encourage investment and moderate the productive decline rate. The proposals
for a value allowance are in this sense modest in their extent as they apply only
to the SC. The detailed modelling showed the positive effects of the
introduction of the value allowance on North Sea tax revenues. It also showed
the negative effect on these revenues from projects which would in any case
have proceeded. The positive effect from increased activity on taxes paid in the
whole supply chain (such as non-North Sea corporation tax, personal income
tax and NI contributions) was not modelled. It is argued that policy-making
should be prioritised by the need to maximise economic production from the
UKCS and not by the consequential effects on tax revenues which are best
regarded as a residual item from activities in the UKCS.
The modelling undertaken initially applied to all new fields. When it was
restricted to small fields (recoverable reserves ≤ 20 mmboe) it was found that
large numbers were incentivised for development by the allowance, especially
with the larger values. Thus, given the lack of materiality in these small fields
generally it is felt that the allowance should apply to all of them.
The modelling of fields located West of Shetland clearly brought out the
marginal nature of a high proportion of the uncommitted fields in the category
of technical reserves. Four value allowances were modelled, including a large
one of £250 million. The modelling brought out clearly that a substantial
92
number of fields (25) failed the investment hurdle under the present tax system
at prices in the $40,30 pence case, and 15 failed under the $60,50 pence case.
In the latter case the large value allowance (£250 million) incentivised the
development of 3 of these. The remaining 12 continued to fail the hurdle. It is
clear that a large allowance is required to have a worthwhile effect on
investment in this region.
Limitation on appropriate data did not permit systematic economic modelling of
HP/ HT and heavy oil fields. However, it is clear from the work undertaken for
all of the UKCS that fields with particularly high costs and/ or significantly
lower prices require larger value allowances to have a worthwhile effect on
investment.
While the consultation document did not specifically deal with incremental
projects it is felt that these should be considered in the light of the major fall in
oil prices. The PRT relief scheme for identifiable incremental projects already
in place should be extended to all types of incremental projects in these fields.
More fundamentally, the earlier proposal to consider PRT buy-out schemes
should be discussed again. The merits of the early abolition of PRT through a
buy-out scheme are greater than ever given the existing investment climate. A
reduction in the overall rate of tax from 75% to 50% would greatly enhance
investment incentives in these fields. Time is of the essence here if full
advantage is to be made of the opportunities prior to decommissioning.
Exploration in the UKCS will suffer as a result of the combination of oil price
fall and capital rationing following from the problems in the financial markets.
There is a clear need to incentivise exploration activity. New players without
tax cover are disadvantaged under the present tax system and, as they are
generally small/medium in size, access to external capital is particularly

93
difficult. The Norwegian scheme whereby investors not in a taxpaying position
receive refunds for approved exploration at their marginal tax rate would
equalise their position with full tax-paying investors. It would also make it
easier for them to raise external funds given the guarantee of the Government
refund.
******************************