Embed Size (px)
Citation preview
WorldatWork and Deloitte Consulting LLP
February 2014
Incentive Pay Practices Survey: Publicly
Traded Companies
rese
arch
©2014 WorldatWork Any laws, regulations or other legal requirements noted in this publication are, to the best of the publisher’s knowledge, accurate and current
as of this report’s publishing date. WorldatWork is providing this information with the understanding that WorldatWork is not engaged, directly or by implication, in
rendering legal, accounting or other related professional services. You are urged to consult with an attorney, accountant or other qualified professional concerning
your own specific situation and any questions that you may have related to that.
No portion of this publication may be reproduced in any form without express written permission from WorldatWork.
Contact:
WorldatWork Customer Relations
14040 N. Northsight Blvd.
Scottsdale, Arizona USA
85260-3601
Toll free: 877-951-9191
Fax: 480-483-8352
www.worldatwork.org
About Deloitte’s Human Capital PracticeDeloitte helps organizations effectively manage their human capital to drive business growth. It does this leveraging advanced analytics to develop talent management and business-driven HR strategies to deliver results. Deloitte is a leader in human capital consulting, bringing a unique combination of business, industry and HR knowledge, supported by the breadth of services and capabilities of a multidisciplinary professional services organization and global network. For more information, please visit www.deloitte.com/us/humancapital http://www.deloitte.com/us/humancapital.
As used in this document, “Deloitte” means Deloitte Consulting LLP, a subsidiary of Deloitte LLP. Please see http://www.deloitte.com/us/about for a detailed description of the legal structure of Deloitte LLP and its subsidiaries. Certain services may not be available to attest clients under the rules and regulations of public accounting. The statements in this report reflect our analysis of survey respondents and are not intended to reflect facts or opinions of any other entities. All survey data and statistics referenced and presented, as well as the representations made and opinions expressed, unless specifically described otherwise, pertain only to the participating organizations and their responses to the Deloitte/WorldatWork survey conducted in October, 2013.
Contact:
Deloitte Consulting LLP
Gregory A. Stoskopf, CCP
25 Broadway
New York, New York, 10004
Tel: 212-618-4627
Sheila C. Sever, CCP
1111 Bagby Street
Houston, Texas, 77002
Tel: 713-982-2627
WorldatWork and Deloitte Consulting Incentive Pay Practices Survey: Publicly Traded Companies
1
Table of Figures
Figure 1: Short-term incentive programs……………………………………………………………………………... 8
Figure 2: Number of short-term incentive programs………………………………………………………………… 9
Figure 3: Types of short-term incentive programs used………………………………………….………………… 10
Figure 4: Short-term incentive/bonus plan modification for the current performance year………...…………… 11
Figure 5: Short-term incentive/bonus plan modification for the upcoming performance year………………….. 11
Figure 6: Prompts for the plan modification for the current performance year…………………………………… 12
Figure 7: Prompts for the plan modification for the upcoming performance year………………...……………… 12
Figure 8: Types of short-term incentive/bonus plan changes implemented for the current year………………. 13
Figure 9: Types of short-term incentive/bonus plan changes expected for the upcoming year……………….. 14
Figure 10: Primary purposes of offering an annual incentive/bonus……….……………………………………… 15
Figure 11: Eligibility for annual incentive/bonus payments………………………………………….……………… 15
Figure 12: How awards are paid to employees……………………………………………………………………… 16
Figure 13: How incentive/bonus payout amounts to employees are determined...……………………………… 16
Figure 14: How incentives/bonuses are funded …………………………………………………………………….. 17
Figure 15: Number of different performance measures…………………………………………………………….. 17
Figure 16: How performance measures are used in determining payouts……….………………………………. 18
Figure 17: Which performance measures are used ……………...………………………………………………… 19
Figure 19: Basis for evaluation of financial objectives……………………………………………………………… 20
Figure 20: Percentage of payout awards based on corporate, business unit and individual performance…… 21
Figure 21: Specified target payout amounts for participants……………………………………….……………… 22
Figure 22: Performance gates or thresholds for the incentive/bonus plan…………………………………..…… 23
Figure 23: Maximum payout amounts for participants……………………………………………………………… 23
Figure 24: Maximum payout as a percent of target…………………………………………….…………………… 24
Figure 25: Average ratio of award payments………………………………………………………………………… 24
Figure 26: Eligibility for short-term incentives in the current fiscal year………...………………………………… 25
Figure 27: Project bonus awards awarded to teams involved in an M&A transaction…………...……………… 26
Figure 28: Circumstances where retention awards are typically used…………………………………….……… 26
Figure 29: Retention bonus payouts following an M&A transaction……………….……………………………… 27
Figure 30: Retention bonus payouts for a critical project or to ensure business continuity…..………………… 28
Figure 31: Retention bonus payouts for difficult-to-recruit positions……………………………………….……… 28
Figure 32: Long-term incentive programs……………………………………….…………………………………… 29
Figure 33: Number of long-term incentive programs…………………………………...…………………………… 29
Figure 34: Objectives of long-term incentive programs…………………………………………………..………… 30
Figure 35: Employee groups eligible for long-term incentive programs……...…………………………………… 31
Figure 36: Level of equity overhang for the last completed fiscal year…………………………………………… 32
Figure 37: Grant allocation to employee groups…………………………………………..………………………… 32
Figure 38: Plan design modifications excluding annual goal revisions…………………………………………… 33
Figure 39: Technology used to administer incentive/bonus plans………………………………………………… 34
Figure 40: Incentive/bonus communication to eligible employees………………………………………………… 35
Figure 41: Top three rewards tools and retaining top talent…………………………………..…………………… 36
Figure 42: Full-time equivalent (FTE) employees…………………………………………………………………… 37
Figure 43: Annual voluntary turnover…………………………………………………………………………………. 37
Figure 44: Industry……………………………………………………………………………………………………… 38
Figure 45: Annual revenue/budget……………………………………………………………………………………. 39
Figure 46: Primary exchange stock is traded on…………………………………………………………….………. 39
Figure 47: Recent fiscal-year-end market capitalization…………………………………………………….……… 40
WorldatWork and Deloitte Consulting Incentive Pay Practices Survey: Publicly Traded Companies
2
Introduction
As organizations compete for top talent, incentive and bonus plans can be a critical aspect of an
organization’s compensation and total rewards offerings. Incentive programs may target specific
employee groups and business goals. At the same time, they also may need to be structured to allow
organizations to be cost-effective and flexible, depending on their financial situation. In the recent
economic and regulatory climate, many organizations have been regularly evaluating their incentive
program design, for example bonus target setting and performance criteria. Understanding
competitive incentive pay practices can help shape decisions on effective design aspects.
In October 2013, WorldatWork and Deloitte Consulting invited WorldatWork members and Deloitte
Consulting LLP contacts to participate in the 2013 Incentive Pay Practices Survey: Publicly Traded
Companies. Respondents from more than 350 publicly traded companies participated in this survey,
which provides information about current trends in variable pay practices, including prevalence of
types of incentive programs, design features, and key performance measures of incentive plans. A
similar survey also was conducted by Vivient Consulting and WorldatWork to examine the incentive
pay practices at nonpublicly traded companies, resulting in 2 additional reports on non-
profits/government organizations and privately held, for-profit companies. All 3 reports are available
on the WorldatWork web site.
Industries represented among survey respondents included manufacturing; financial services and
insurance; business and professional services; retail and wholesale trade; utilities, oil and gas;
computers and electronics; health care and social assistance; and information services.
The revenue size of responding organizations ranges from more than $20 billion to less than $100
million. The corporate status of responding for-profit organizations included C corporations, L.L.C.
and subsidiaries, S corporations, and partnerships.
Methodology
Survey invitations with the online link were emailed to WorldatWork members on Oct. 16, 2013;
survey participation also was open to Deloitte Consulting LLP contacts. Survey participation closed
on Nov. 1, 2013. The survey was exclusive to publicly traded U.S. organizations. There were 377
responses in total, although sample size varies by survey question. The final data set was cleaned
and analyzed using statistical software. Questions receiving fewer than 30 responses are excluded
from the analysis and this report. Typical text responses are provided for any questions where “Other”
was provided as a response option and received 5% or more responses.
WorldatWork and Deloitte Consulting Incentive Pay Practices Survey: Publicly Traded Companies
3
Glossary
The survey identified the various types of short- and long-term incentive programs. Descriptions
provided were based on definitions from the online WorldatWork glossary or derived from common
characterizations of these programs. Below are the descriptions of the various types of incentives for
reference when reviewing results.
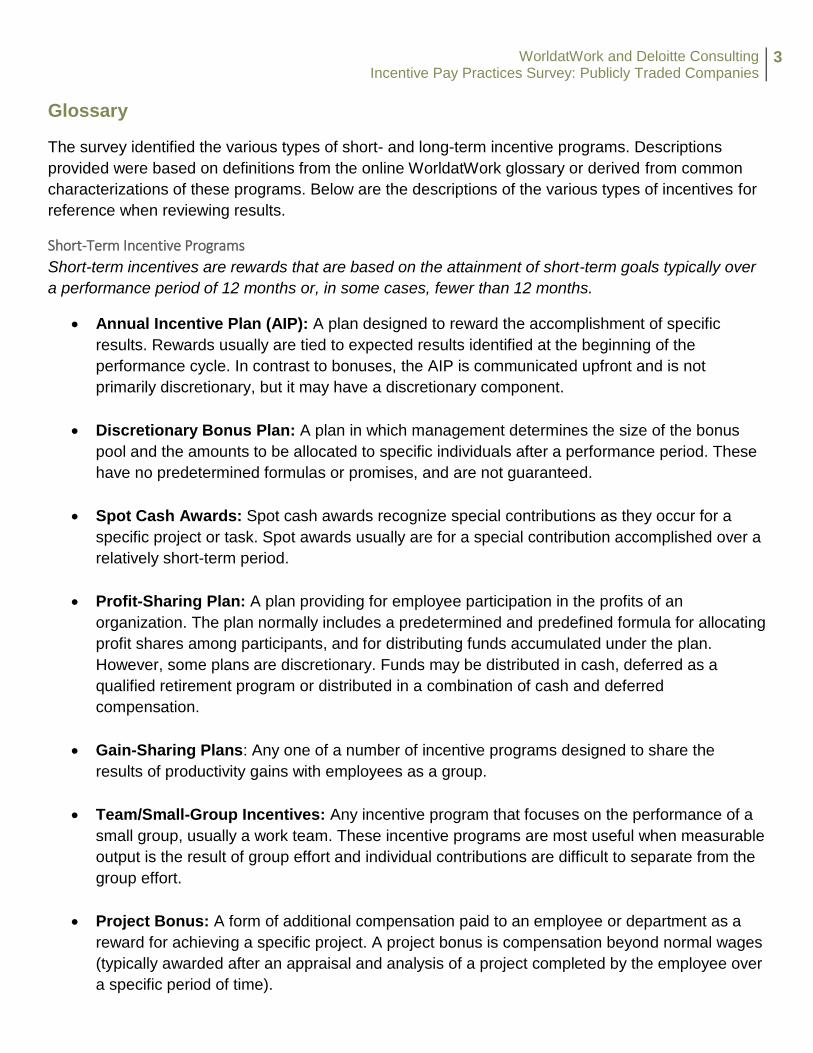
Short-Term Incentive Programs
Short-term incentives are rewards that are based on the attainment of short-term goals typically over
a performance period of 12 months or, in some cases, fewer than 12 months.
Annual Incentive Plan (AIP): A plan designed to reward the accomplishment of specific
results. Rewards usually are tied to expected results identified at the beginning of the
performance cycle. In contrast to bonuses, the AIP is communicated upfront and is not
primarily discretionary, but it may have a discretionary component.
Discretionary Bonus Plan: A plan in which management determines the size of the bonus
pool and the amounts to be allocated to specific individuals after a performance period. These
have no predetermined formulas or promises, and are not guaranteed.
Spot Cash Awards: Spot cash awards recognize special contributions as they occur for a
specific project or task. Spot awards usually are for a special contribution accomplished over a
relatively short-term period.
Profit-Sharing Plan: A plan providing for employee participation in the profits of an
organization. The plan normally includes a predetermined and predefined formula for allocating
profit shares among participants, and for distributing funds accumulated under the plan.
However, some plans are discretionary. Funds may be distributed in cash, deferred as a
qualified retirement program or distributed in a combination of cash and deferred
compensation.
Gain-Sharing Plans: Any one of a number of incentive programs designed to share the
results of productivity gains with employees as a group.
Team/Small-Group Incentives: Any incentive program that focuses on the performance of a
small group, usually a work team. These incentive programs are most useful when measurable
output is the result of group effort and individual contributions are difficult to separate from the
group effort.
Project Bonus: A form of additional compensation paid to an employee or department as a
reward for achieving a specific project. A project bonus is compensation beyond normal wages
(typically awarded after an appraisal and analysis of a project completed by the employee over
a specific period of time).
WorldatWork and Deloitte Consulting Incentive Pay Practices Survey: Publicly Traded Companies
4
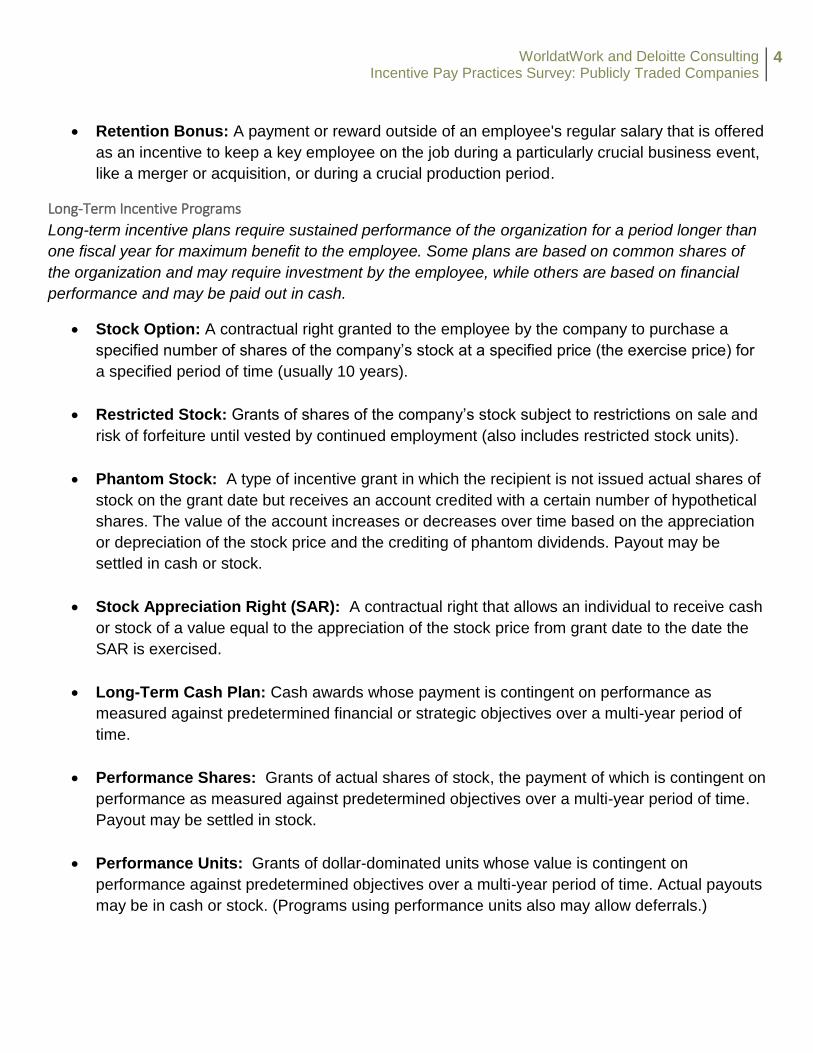
Retention Bonus: A payment or reward outside of an employee's regular salary that is offered
as an incentive to keep a key employee on the job during a particularly crucial business event,
like a merger or acquisition, or during a crucial production period.
Long-Term Incentive Programs
Long-term incentive plans require sustained performance of the organization for a period longer than
one fiscal year for maximum benefit to the employee. Some plans are based on common shares of
the organization and may require investment by the employee, while others are based on financial
performance and may be paid out in cash.
Stock Option: A contractual right granted to the employee by the company to purchase a
specified number of shares of the company’s stock at a specified price (the exercise price) for
a specified period of time (usually 10 years).
Restricted Stock: Grants of shares of the company’s stock subject to restrictions on sale and
risk of forfeiture until vested by continued employment (also includes restricted stock units).
Phantom Stock: A type of incentive grant in which the recipient is not issued actual shares of
stock on the grant date but receives an account credited with a certain number of hypothetical
shares. The value of the account increases or decreases over time based on the appreciation
or depreciation of the stock price and the crediting of phantom dividends. Payout may be
settled in cash or stock.
Stock Appreciation Right (SAR): A contractual right that allows an individual to receive cash
or stock of a value equal to the appreciation of the stock price from grant date to the date the
SAR is exercised.
Long-Term Cash Plan: Cash awards whose payment is contingent on performance as
measured against predetermined financial or strategic objectives over a multi-year period of
time.
Performance Shares: Grants of actual shares of stock, the payment of which is contingent on
performance as measured against predetermined objectives over a multi-year period of time.
Payout may be settled in stock.
Performance Units: Grants of dollar-dominated units whose value is contingent on
performance against predetermined objectives over a multi-year period of time. Actual payouts
may be in cash or stock. (Programs using performance units also may allow deferrals.)
WorldatWork and Deloitte Consulting Incentive Pay Practices Survey: Publicly Traded Companies
5
Other Definitions
Performance Gate/Threshold: Also referred to as “hurdle,” “safety trigger,” “qualifier,” or
“circuit breaker,” this is the minimum level of performance that must be achieved before any
incentive/bonus can be earned.
Equity Overhang: The sum of any new shares proposed to be reserved at the company’s
most recent annual shareholder meeting, plus shares disclosed as still available for grants
under continuing equity compensation plans, plus the shares subject to outstanding equity
instruments, divided by the total number of outstanding common shares.
WorldatWork and Deloitte Consulting Incentive Pay Practices Survey: Publicly Traded Companies
6
Executive Summary
This report summarizes the findings from the Incentive Pay Practices Survey: Publicly Traded
Companies. The results are organized by short-term incentives (STI) and long-term incentives (LTI),
with more detailed questions on plan design for short-term incentives.
With regard to STIs, this report discusses the prevalence of different types of plans, recent and/or
upcoming changes to plans, and plan budgeting. The survey includes a deep dive into the design
characteristics, such as eligibility by employee group, funding, performance measures, and
performance curve of AIP and discretionary bonus plans. It also addresses other types of STIs
(eligibility and targets), in particular the use of project and retention bonuses, as well as incentive plan
administration.
With regard to LTIs, this report discusses the number of plans used by organizations, prevalence of
different types of LTI vehicles by employee group, LTI objectives, and equity overhang.
Key Findings and Trends
The majority of survey participants (99%) have an STI plan. (See Figure 1 on page 8):
AIP was the most predominant type of STI plan offered by survey participants (90%). (See
Figure 3 on page 10.) o Spot cash awards (66%) and retention bonus plans (61%) were also popular among
participants. (See Figure 3 on page 10.)
Less than half of the participants (43%) reported modifying their company’s STI plan
design (which may include goals) in the current performance year. Fewer participants
(41%) reported plans to modify their company’s STI plan in the upcoming year. (See Figure 4
& Figure 5 on page 11.) o Added / adding one or more new performance measures was the most common
type of change in the current and upcoming year. (See Figure 8 and Figure 9 on pages
13 & 14.)
When asked about their organization’s most predominant AIP or bonus plan:
A majority of survey participants reported that their officers / executives and exempt salaried
employees were eligible for the AIP or bonus plan (96% and 97%, respectively). (See Figure
11 on page 15.)
o In comparison, half of participants offered the AIP or bonus plan to non-exempt salaried
and non-exempt hourly nonunion employees (55% and 53%, respectively). (See Figure
11 on page 15.)
Most of the participants surveyed reported that their organizations used 1-3 performance
measures in the determination of incentive / bonus payout amounts (56%). (See Figure 15 on
page 17.)
o Of the 18 different financial, operational, and individual performance measures included
as options in the survey, overall individual performance (e.g., performance evaluation
WorldatWork and Deloitte Consulting Incentive Pay Practices Survey: Publicly Traded Companies
7
or rating) was the most prevalent type of measure overall (used by 48% of participants).
Revenue was the second most prevalent type of measure used by survey participants
(used by 43% of participants). (See Figure 17 on page 19 & 20.)
o Overall, a majority of survey participants reported using at least one type of financial
measure in their AIP or bonus plan (97%). Of these participants, 67% indicated that
financial metrics are evaluated based on corporate performance and
division/business unit performance. (See Figure 17 & Figure 19 on pages 19 and 20.)
o 75% of participants specify a performance gate or threshold for their organizations’
annual incentive / bonus plans’ payout. (See Figure 22 on page 23.) 83% specified
maximum payout amounts for plan participants (most commonly 175.1-200% of
target). (See Figure 23 & Figure 24 on pages 23 & 24).
For surveyed organizations with other types of STI plans:
Spot cash awards, profit-sharing, gain-sharing, team/small-group incentives, project bonuses,
and retention bonuses were most often offered to exempt salaried employees over other
employee groups. (See Figure 26 on page 25.)
40% of surveyed organizations who experienced a merger or acquisition used a project
bonus to provide awards to teams involved in the transaction; 55% of these organizations
used a retention bonus in preparation for or following a merger or acquisition. (See Figure 27
and Figure 28 on page 26.)
A majority of survey participants (88%) indicated that they have an LTI program: (See Figure 32 on
page 29.)
The two most common LTI vehicles offered by surveyed organizations with a LTI plan were
restricted stock (offered by 88%) followed by stock options (64%). (See Figure 35 on page
31.)
Officers / executives were eligible for restricted stock and stock options in 84% and 63%
of surveyed organizations with a LTI plan, respectively; in contrast, 51% and 30% of surveyed
organizations offered restricted stock and stock options, respectively, to exempt salaried
employees. (See Figure 35 on page 31.)
WorldatWork and Deloitte Consulting Incentive Pay Practices Survey: Publicly Traded Companies
8
Results and Analysis
General Questions on Short-Term Incentive Programs
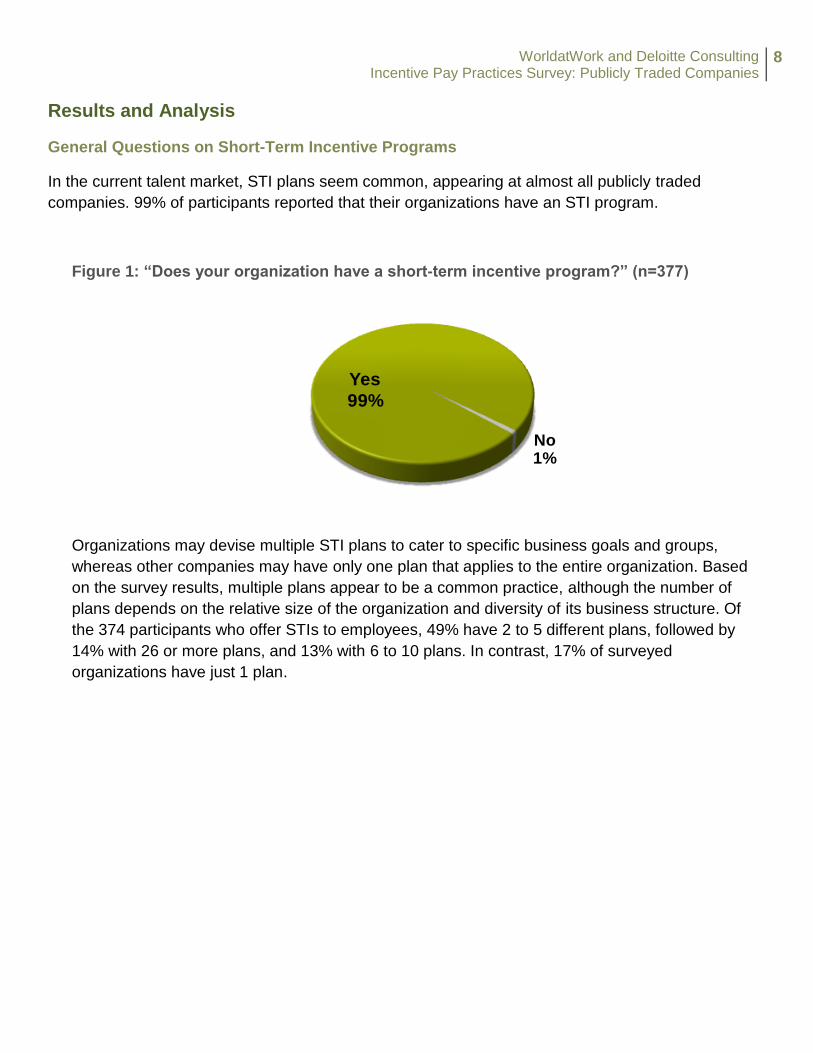
In the current talent market, STI plans seem common, appearing at almost all publicly traded
companies. 99% of participants reported that their organizations have an STI program.
Figure 1: “Does your organization have a short-term incentive program?” (n=377)
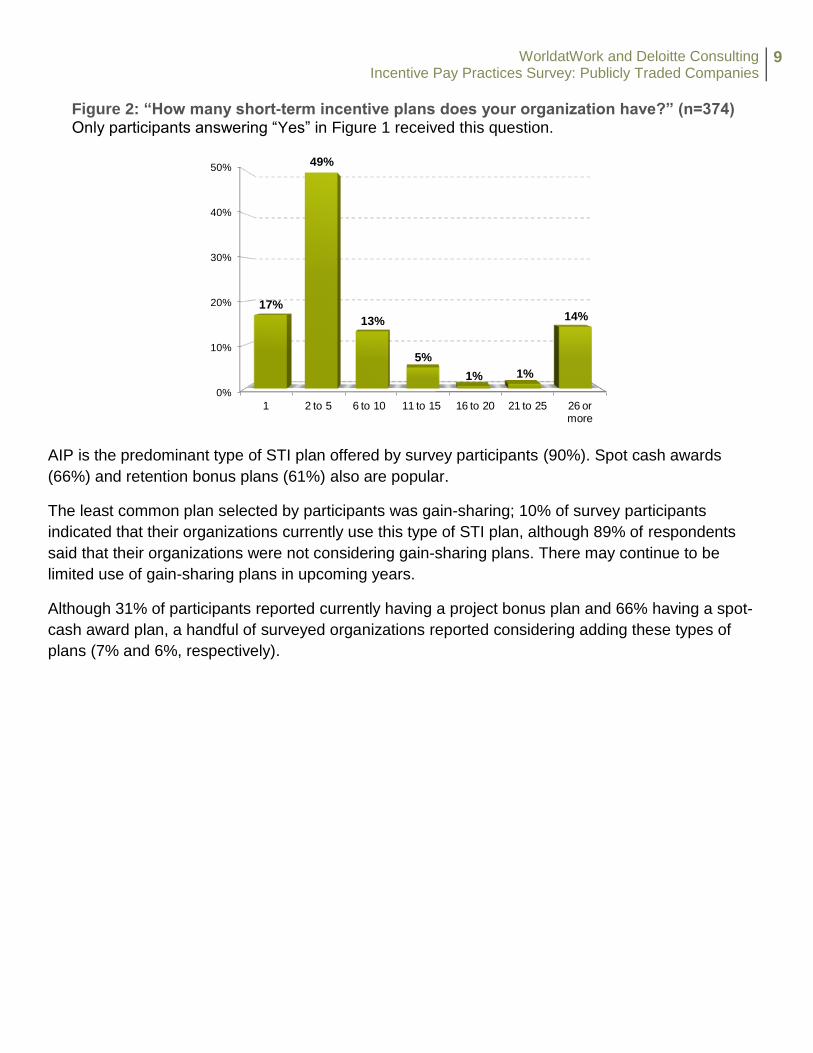
Organizations may devise multiple STI plans to cater to specific business goals and groups,
whereas other companies may have only one plan that applies to the entire organization. Based
on the survey results, multiple plans appear to be a common practice, although the number of
plans depends on the relative size of the organization and diversity of its business structure. Of
the 374 participants who offer STIs to employees, 49% have 2 to 5 different plans, followed by
14% with 26 or more plans, and 13% with 6 to 10 plans. In contrast, 17% of surveyed
organizations have just 1 plan.
Yes
99%
No1%
WorldatWork and Deloitte Consulting Incentive Pay Practices Survey: Publicly Traded Companies
9
Figure 2: “How many short-term incentive plans does your organization have?” (n=374) Only participants answering “Yes” in Figure 1 received this question.
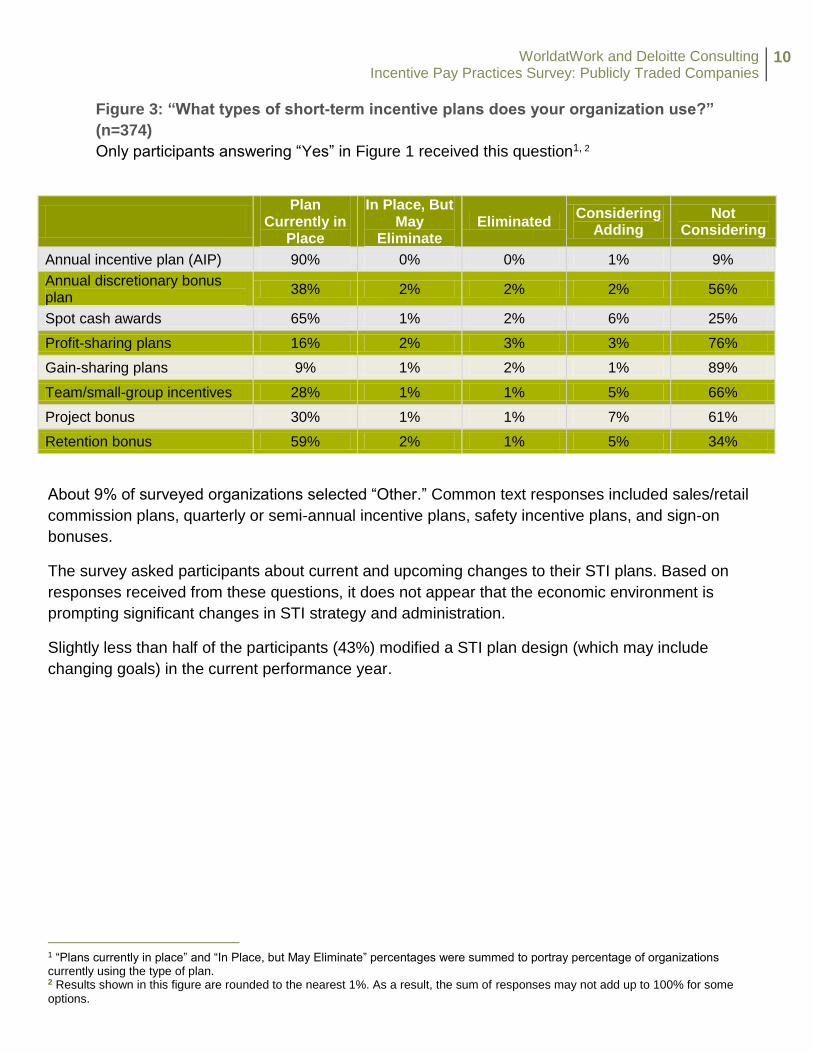
AIP is the predominant type of STI plan offered by survey participants (90%). Spot cash awards
(66%) and retention bonus plans (61%) also are popular.
The least common plan selected by participants was gain-sharing; 10% of survey participants
indicated that their organizations currently use this type of STI plan, although 89% of respondents
said that their organizations were not considering gain-sharing plans. There may continue to be
limited use of gain-sharing plans in upcoming years.
Although 31% of participants reported currently having a project bonus plan and 66% having a spot-
cash award plan, a handful of surveyed organizations reported considering adding these types of
plans (7% and 6%, respectively).
0%
10%
20%
30%
40%
50%
1 2 to 5 6 to 10 11 to 15 16 to 20 21 to 25 26 or more
17%
49%
13%
5%
1% 1%
14%
WorldatWork and Deloitte Consulting Incentive Pay Practices Survey: Publicly Traded Companies
10
Figure 3: “What types of short-term incentive plans does your organization use?”
(n=374)
Only participants answering “Yes” in Figure 1 received this question1, 2
Plan
Currently in Place
In Place, But May
Eliminate Eliminated
Considering Adding
Not Considering
Annual incentive plan (AIP) 90% 0% 0% 1% 9%
Annual discretionary bonus plan
38% 2% 2% 2% 56%
Spot cash awards 65% 1% 2% 6% 25%
Profit-sharing plans 16% 2% 3% 3% 76%
Gain-sharing plans 9% 1% 2% 1% 89%
Team/small-group incentives 28% 1% 1% 5% 66%
Project bonus 30% 1% 1% 7% 61%
Retention bonus 59% 2% 1% 5% 34%
About 9% of surveyed organizations selected “Other.” Common text responses included sales/retail
commission plans, quarterly or semi-annual incentive plans, safety incentive plans, and sign-on
bonuses.
The survey asked participants about current and upcoming changes to their STI plans. Based on
responses received from these questions, it does not appear that the economic environment is
prompting significant changes in STI strategy and administration.
Slightly less than half of the participants (43%) modified a STI plan design (which may include
changing goals) in the current performance year.
1 “Plans currently in place” and “In Place, but May Eliminate” percentages were summed to portray percentage of organizations currently using the type of plan. 2 Results shown in this figure are rounded to the nearest 1%. As a result, the sum of responses may not add up to 100% for some
options.
WorldatWork and Deloitte Consulting Incentive Pay Practices Survey: Publicly Traded Companies
11
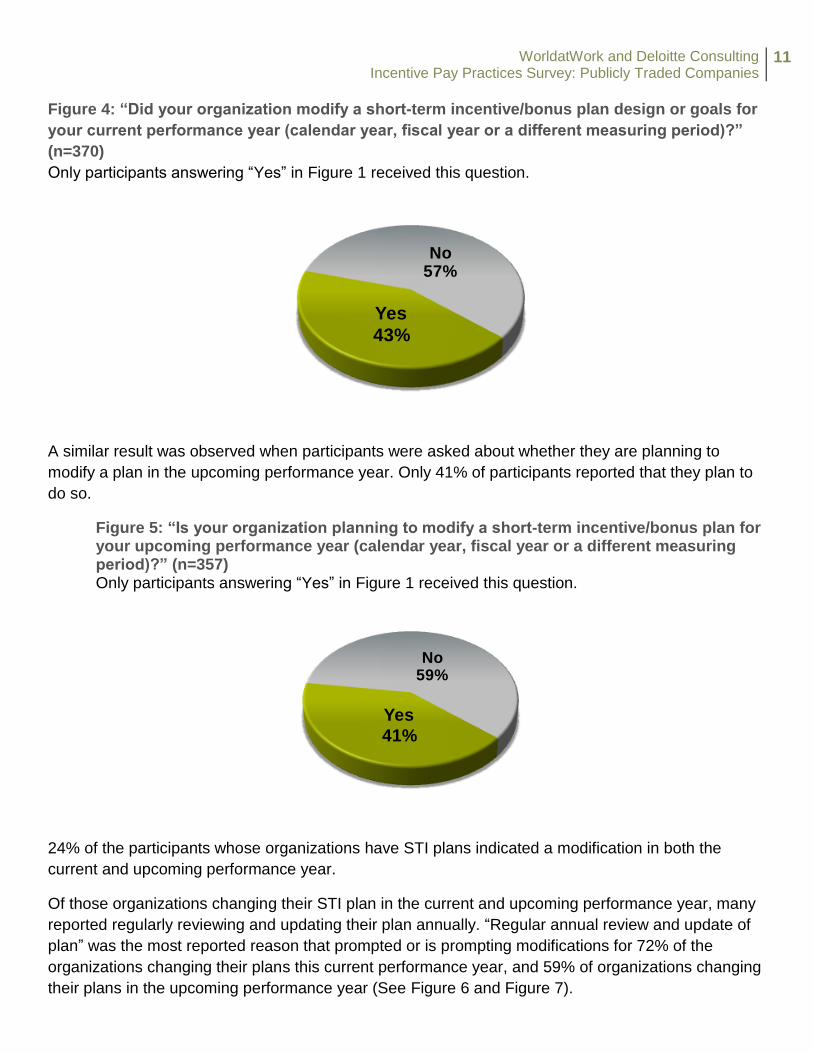
Figure 4: “Did your organization modify a short-term incentive/bonus plan design or goals for
your current performance year (calendar year, fiscal year or a different measuring period)?”
(n=370)
Only participants answering “Yes” in Figure 1 received this question.
A similar result was observed when participants were asked about whether they are planning to
modify a plan in the upcoming performance year. Only 41% of participants reported that they plan to
do so.
Figure 5: “Is your organization planning to modify a short-term incentive/bonus plan for your upcoming performance year (calendar year, fiscal year or a different measuring period)?” (n=357) Only participants answering “Yes” in Figure 1 received this question.
24% of the participants whose organizations have STI plans indicated a modification in both the
current and upcoming performance year.
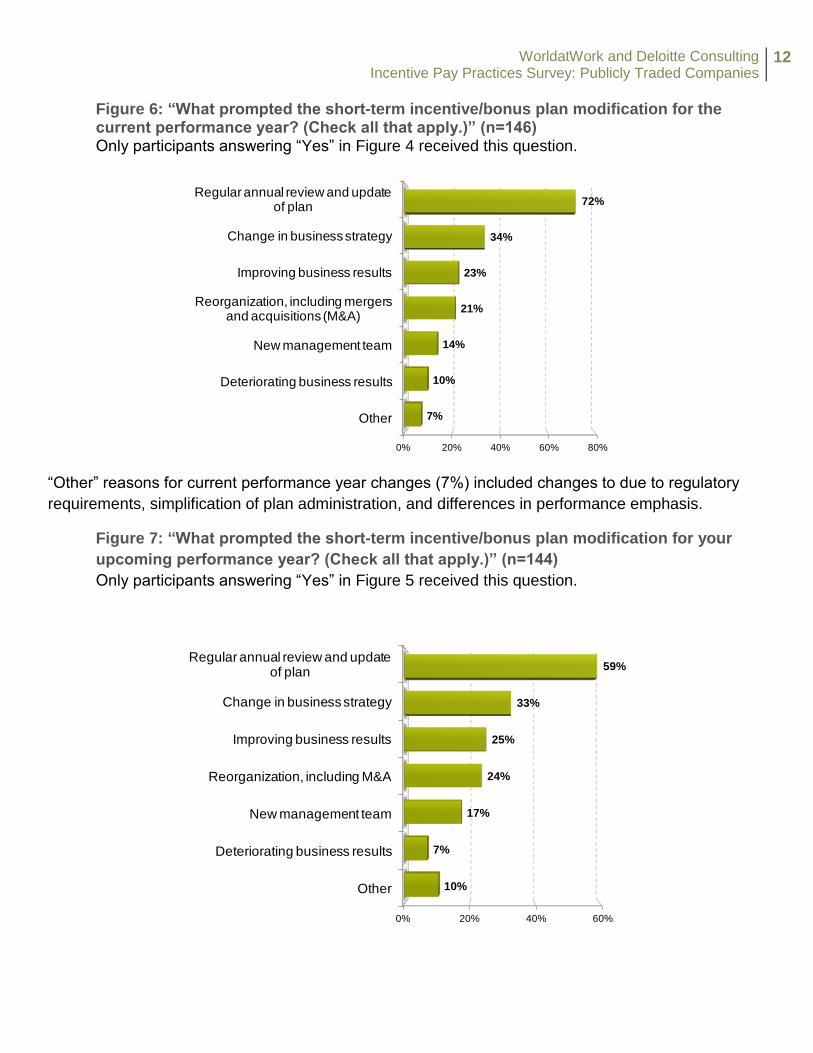
Of those organizations changing their STI plan in the current and upcoming performance year, many
reported regularly reviewing and updating their plan annually. “Regular annual review and update of
plan” was the most reported reason that prompted or is prompting modifications for 72% of the
organizations changing their plans this current performance year, and 59% of organizations changing
their plans in the upcoming performance year (See Figure 6 and Figure 7).
Yes
43%
No57%
Yes
41%
No59%
WorldatWork and Deloitte Consulting Incentive Pay Practices Survey: Publicly Traded Companies
12
Figure 6: “What prompted the short-term incentive/bonus plan modification for the current performance year? (Check all that apply.)” (n=146) Only participants answering “Yes” in Figure 4 received this question.
“Other” reasons for current performance year changes (7%) included changes to due to regulatory
requirements, simplification of plan administration, and differences in performance emphasis.
Figure 7: “What prompted the short-term incentive/bonus plan modification for your
upcoming performance year? (Check all that apply.)” (n=144)
Only participants answering “Yes” in Figure 5 received this question.
0% 20% 40% 60% 80%
Other
Deteriorating business results
New management team
Reorganization, including mergers and acquisitions (M&A)
Improving business results
Change in business strategy
Regular annual review and update of plan
7%
10%
14%
21%
23%
34%
72%
0% 20% 40% 60%
Other
Deteriorating business results
New management team
Reorganization, including M&A
Improving business results
Change in business strategy
Regular annual review and update of plan
10%
7%
17%
24%
25%
33%
59%
WorldatWork and Deloitte Consulting Incentive Pay Practices Survey: Publicly Traded Companies
13
“Other” reasons for the upcoming performance year changes (10%) included changes to due to
maintaining program competitiveness, alignment with pay for performance/performance management
(including performance differentiation).
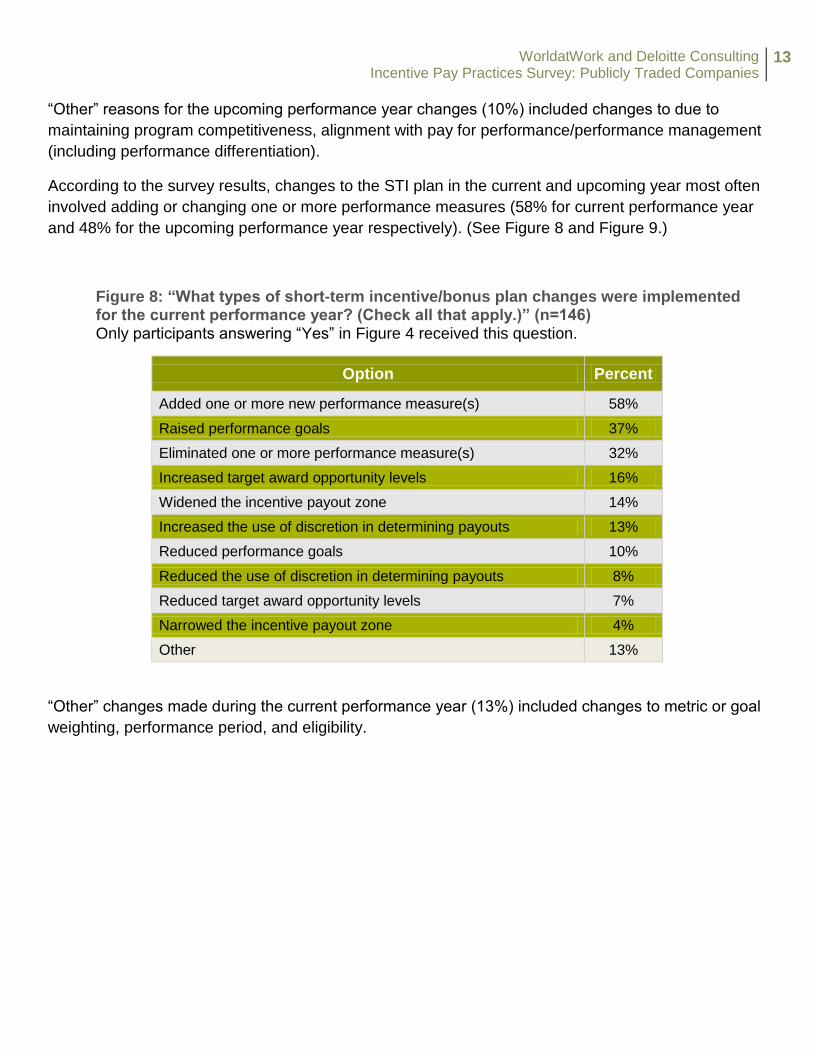
According to the survey results, changes to the STI plan in the current and upcoming year most often
involved adding or changing one or more performance measures (58% for current performance year
and 48% for the upcoming performance year respectively). (See Figure 8 and Figure 9.)
Figure 8: “What types of short-term incentive/bonus plan changes were implemented for the current performance year? (Check all that apply.)” (n=146) Only participants answering “Yes” in Figure 4 received this question.
Option Percent
Added one or more new performance measure(s) 58%
Raised performance goals 37%
Eliminated one or more performance measure(s) 32%
Increased target award opportunity levels 16%
Widened the incentive payout zone 14%
Increased the use of discretion in determining payouts 13%
Reduced performance goals 10%
Reduced the use of discretion in determining payouts 8%
Reduced target award opportunity levels 7%
Narrowed the incentive payout zone 4%
Other 13%
“Other” changes made during the current performance year (13%) included changes to metric or goal
weighting, performance period, and eligibility.
WorldatWork and Deloitte Consulting Incentive Pay Practices Survey: Publicly Traded Companies
14
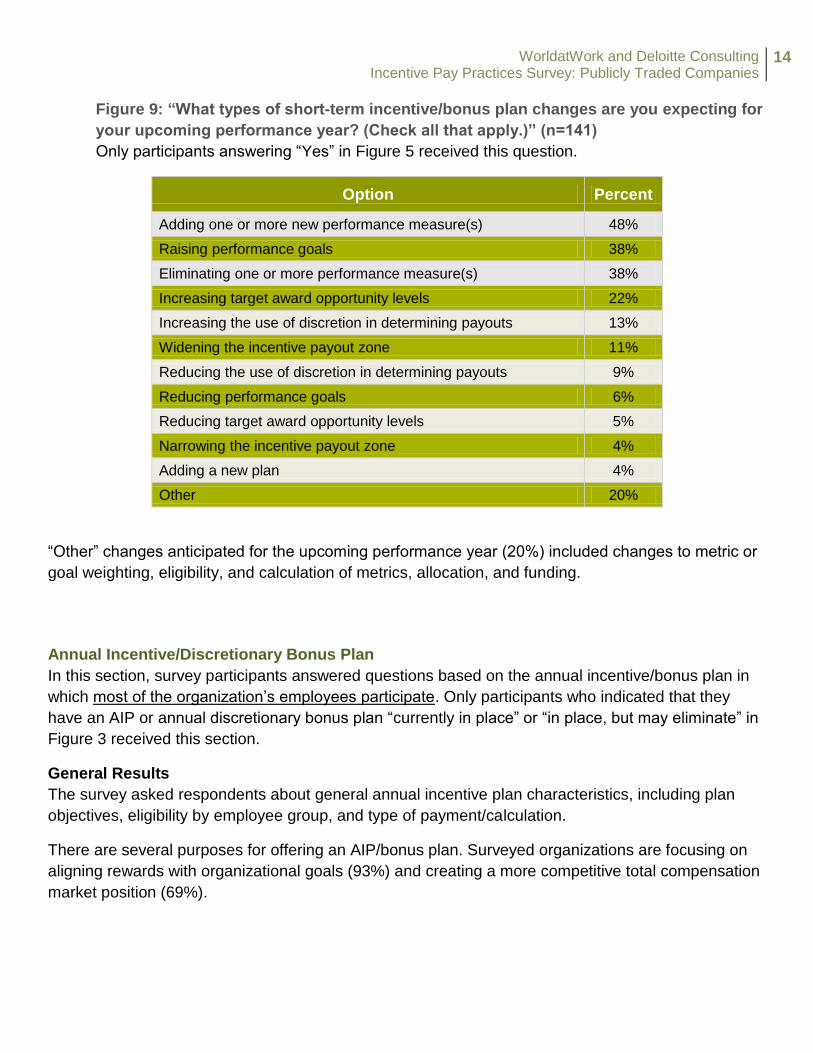
Figure 9: “What types of short-term incentive/bonus plan changes are you expecting for
your upcoming performance year? (Check all that apply.)” (n=141)
Only participants answering “Yes” in Figure 5 received this question.
Option Percent
Adding one or more new performance measure(s) 48%
Raising performance goals 38%
Eliminating one or more performance measure(s) 38%
Increasing target award opportunity levels 22%
Increasing the use of discretion in determining payouts 13%
Widening the incentive payout zone 11%
Reducing the use of discretion in determining payouts 9%
Reducing performance goals 6%
Reducing target award opportunity levels 5%
Narrowing the incentive payout zone 4%
Adding a new plan 4%
Other 20%
“Other” changes anticipated for the upcoming performance year (20%) included changes to metric or
goal weighting, eligibility, and calculation of metrics, allocation, and funding.
Annual Incentive/Discretionary Bonus Plan In this section, survey participants answered questions based on the annual incentive/bonus plan in
which most of the organization’s employees participate. Only participants who indicated that they
have an AIP or annual discretionary bonus plan “currently in place” or “in place, but may eliminate” in
Figure 3 received this section.
General Results
The survey asked respondents about general annual incentive plan characteristics, including plan
objectives, eligibility by employee group, and type of payment/calculation.
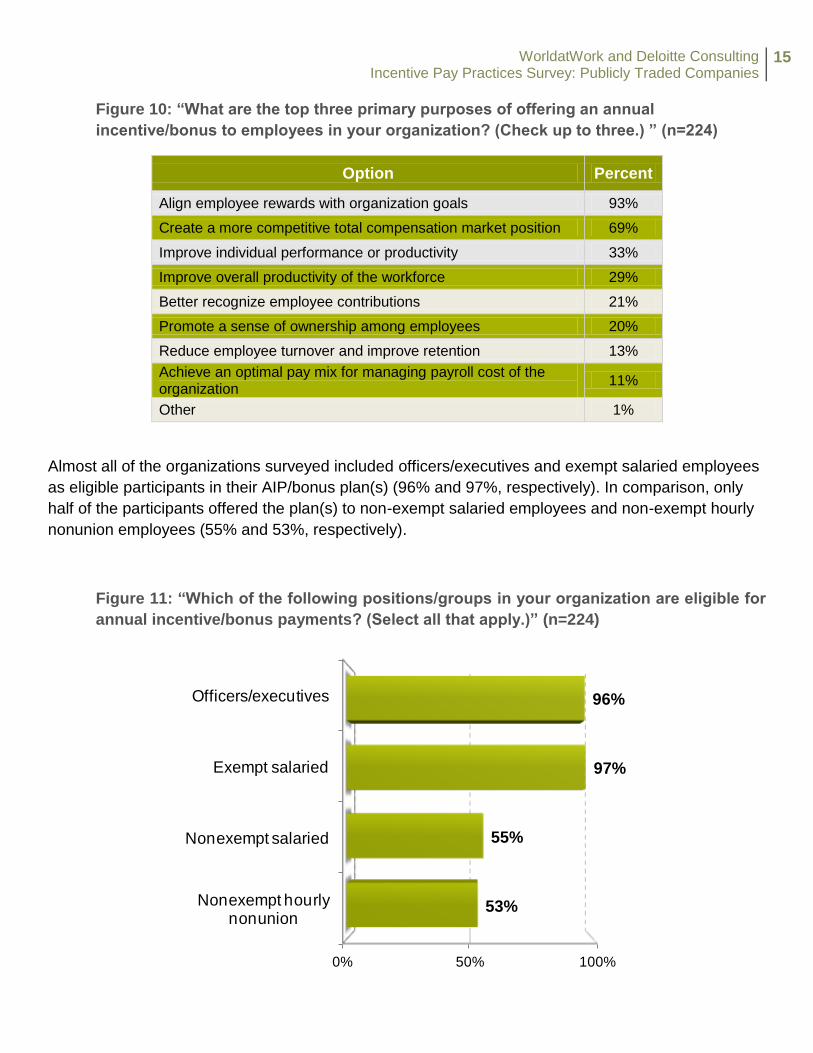
There are several purposes for offering an AIP/bonus plan. Surveyed organizations are focusing on
aligning rewards with organizational goals (93%) and creating a more competitive total compensation
market position (69%).
WorldatWork and Deloitte Consulting Incentive Pay Practices Survey: Publicly Traded Companies
15
Figure 10: “What are the top three primary purposes of offering an annual
incentive/bonus to employees in your organization? (Check up to three.) ” (n=224)
Option Percent
Align employee rewards with organization goals 93%
Create a more competitive total compensation market position 69%
Improve individual performance or productivity 33%
Improve overall productivity of the workforce 29%
Better recognize employee contributions 21%
Promote a sense of ownership among employees 20%
Reduce employee turnover and improve retention 13%
Achieve an optimal pay mix for managing payroll cost of the organization
11%
Other 1%
Almost all of the organizations surveyed included officers/executives and exempt salaried employees
as eligible participants in their AIP/bonus plan(s) (96% and 97%, respectively). In comparison, only
half of the participants offered the plan(s) to non-exempt salaried employees and non-exempt hourly
nonunion employees (55% and 53%, respectively).
Figure 11: “Which of the following positions/groups in your organization are eligible for
annual incentive/bonus payments? (Select all that apply.)” (n=224)
0% 50% 100%
Nonexempt hourly nonunion
Nonexempt salaried
Exempt salaried
Officers/executives
53%
55%
97%
96%
WorldatWork and Deloitte Consulting Incentive Pay Practices Survey: Publicly Traded Companies
16
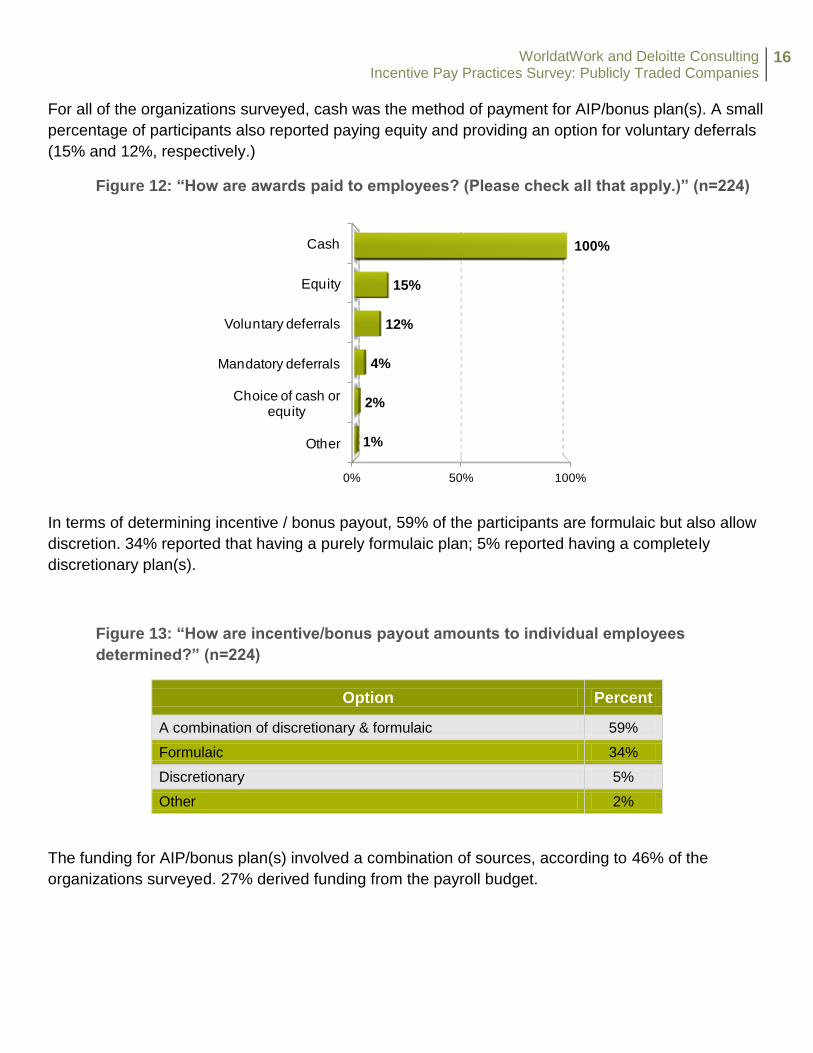
For all of the organizations surveyed, cash was the method of payment for AIP/bonus plan(s). A small
percentage of participants also reported paying equity and providing an option for voluntary deferrals
(15% and 12%, respectively.)
Figure 12: “How are awards paid to employees? (Please check all that apply.)” (n=224)
In terms of determining incentive / bonus payout, 59% of the participants are formulaic but also allow
discretion. 34% reported that having a purely formulaic plan; 5% reported having a completely
discretionary plan(s).
Figure 13: “How are incentive/bonus payout amounts to individual employees
determined?” (n=224)
Option Percent
A combination of discretionary & formulaic 59%
Formulaic 34%
Discretionary 5%
Other 2%
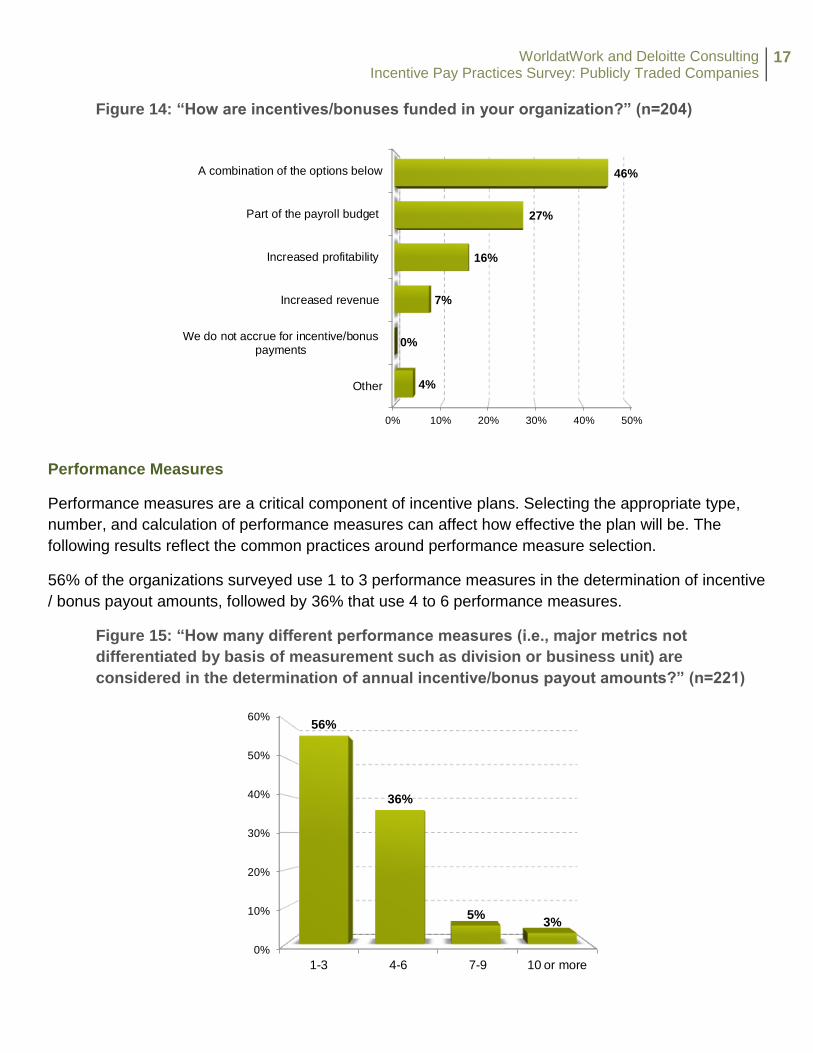
The funding for AIP/bonus plan(s) involved a combination of sources, according to 46% of the
organizations surveyed. 27% derived funding from the payroll budget.
0% 50% 100%
Other
Choice of cash or equity
Mandatory deferrals
Voluntary deferrals
Equity
Cash
1%
2%
4%
12%
15%
100%
WorldatWork and Deloitte Consulting Incentive Pay Practices Survey: Publicly Traded Companies
17
Figure 14: “How are incentives/bonuses funded in your organization?” (n=204)
0% 10% 20% 30% 40% 50%
Other
We do not accrue for incentive/bonuspayments
Increased revenue
Increased profitability
Part of the payroll budget
A combination of the options below
4%
0%
7%
16%
27%
46%
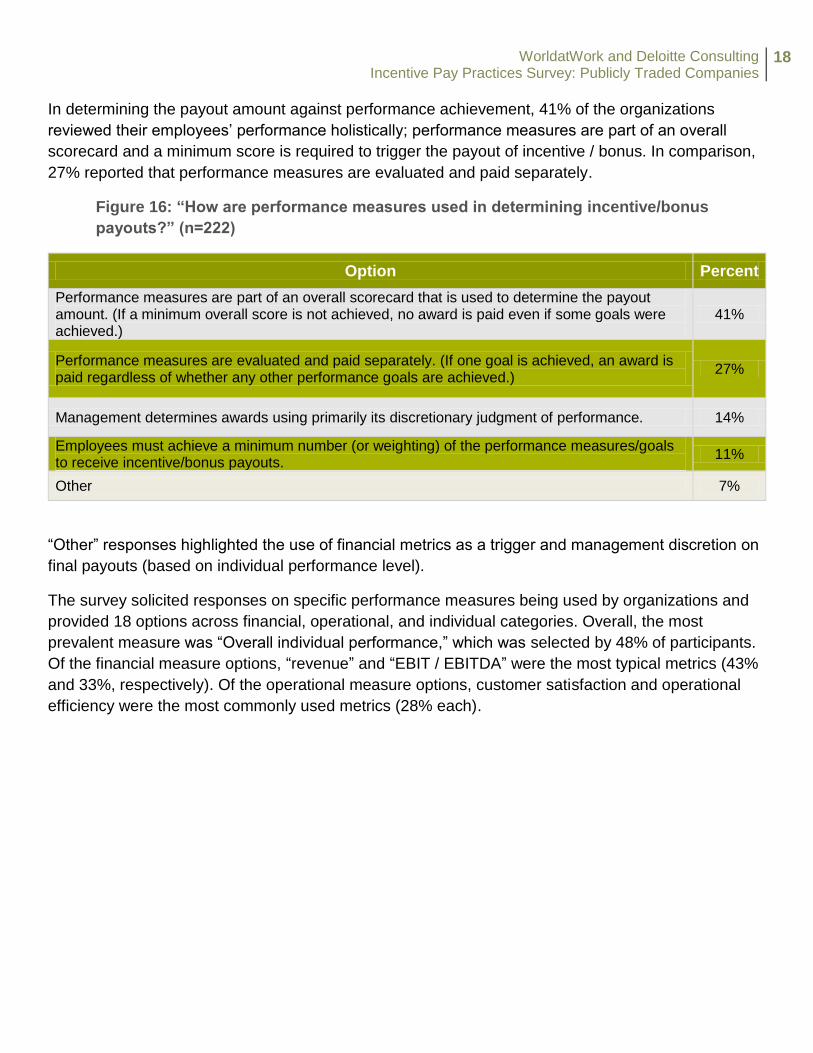
Performance Measures
Performance measures are a critical component of incentive plans. Selecting the appropriate type,
number, and calculation of performance measures can affect how effective the plan will be. The
following results reflect the common practices around performance measure selection.
56% of the organizations surveyed use 1 to 3 performance measures in the determination of incentive
/ bonus payout amounts, followed by 36% that use 4 to 6 performance measures.
Figure 15: “How many different performance measures (i.e., major metrics not
differentiated by basis of measurement such as division or business unit) are
considered in the determination of annual incentive/bonus payout amounts?” (n=221)
0%
10%
20%
30%
40%
50%
60%
1-3 4-6 7-9 10 or more
56%
36%
5%3%
WorldatWork and Deloitte Consulting Incentive Pay Practices Survey: Publicly Traded Companies
18
In determining the payout amount against performance achievement, 41% of the organizations
reviewed their employees’ performance holistically; performance measures are part of an overall
scorecard and a minimum score is required to trigger the payout of incentive / bonus. In comparison,
27% reported that performance measures are evaluated and paid separately.
Figure 16: “How are performance measures used in determining incentive/bonus
payouts?” (n=222)
Option Percent
Performance measures are part of an overall scorecard that is used to determine the payout amount. (If a minimum overall score is not achieved, no award is paid even if some goals were achieved.)
41%
Performance measures are evaluated and paid separately. (If one goal is achieved, an award is paid regardless of whether any other performance goals are achieved.)
27%
Management determines awards using primarily its discretionary judgment of performance. 14%
Employees must achieve a minimum number (or weighting) of the performance measures/goals to receive incentive/bonus payouts.
11%
Other 7%
“Other” responses highlighted the use of financial metrics as a trigger and management discretion on
final payouts (based on individual performance level).
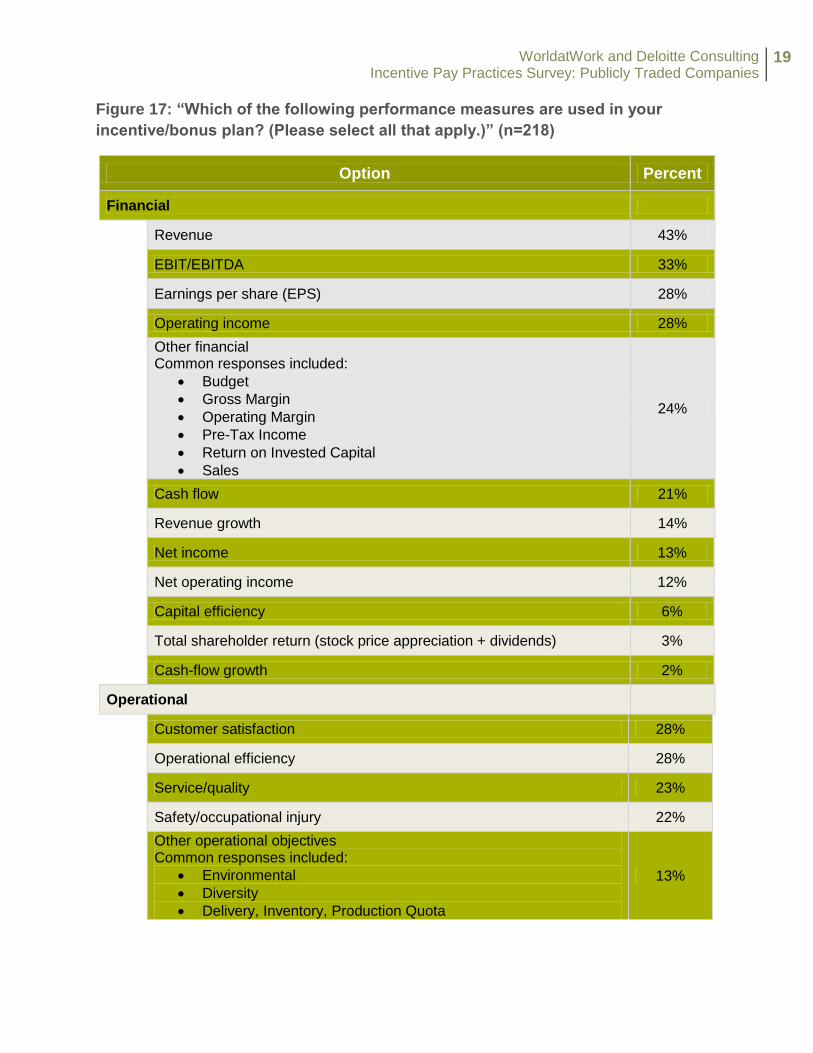
The survey solicited responses on specific performance measures being used by organizations and
provided 18 options across financial, operational, and individual categories. Overall, the most
prevalent measure was “Overall individual performance,” which was selected by 48% of participants.
Of the financial measure options, “revenue” and “EBIT / EBITDA” were the most typical metrics (43%
and 33%, respectively). Of the operational measure options, customer satisfaction and operational
efficiency were the most commonly used metrics (28% each).
WorldatWork and Deloitte Consulting Incentive Pay Practices Survey: Publicly Traded Companies
19
Figure 17: “Which of the following performance measures are used in your
incentive/bonus plan? (Please select all that apply.)” (n=218)
Option Percent
Financial
Revenue 43%
EBIT/EBITDA 33%
Earnings per share (EPS) 28%
Operating income 28%
Other financial Common responses included:
Budget
Gross Margin
Operating Margin
Pre-Tax Income
Return on Invested Capital
Sales
24%
Cash flow 21%
Revenue growth 14%
Net income 13%
Net operating income 12%
Capital efficiency 6%
Total shareholder return (stock price appreciation + dividends) 3%
Cash-flow growth 2%
Operational
Customer satisfaction 28%
Operational efficiency 28%
Service/quality 23%
Safety/occupational injury 22%
Other operational objectives Common responses included:
Environmental
Diversity
Delivery, Inventory, Production Quota
13%
WorldatWork and Deloitte Consulting Incentive Pay Practices Survey: Publicly Traded Companies
20
Figure 18 (continued): “Which of the following performance measures are used in your
incentive/bonus plan? (Please select all that apply.)” (n=218)
Individual
Overall individual performance, perhaps as expressed in a performance rating
48%
Achievement of specific individual goals 39%
Employee satisfaction/engagement scores 10%
Other individual objectives 3%
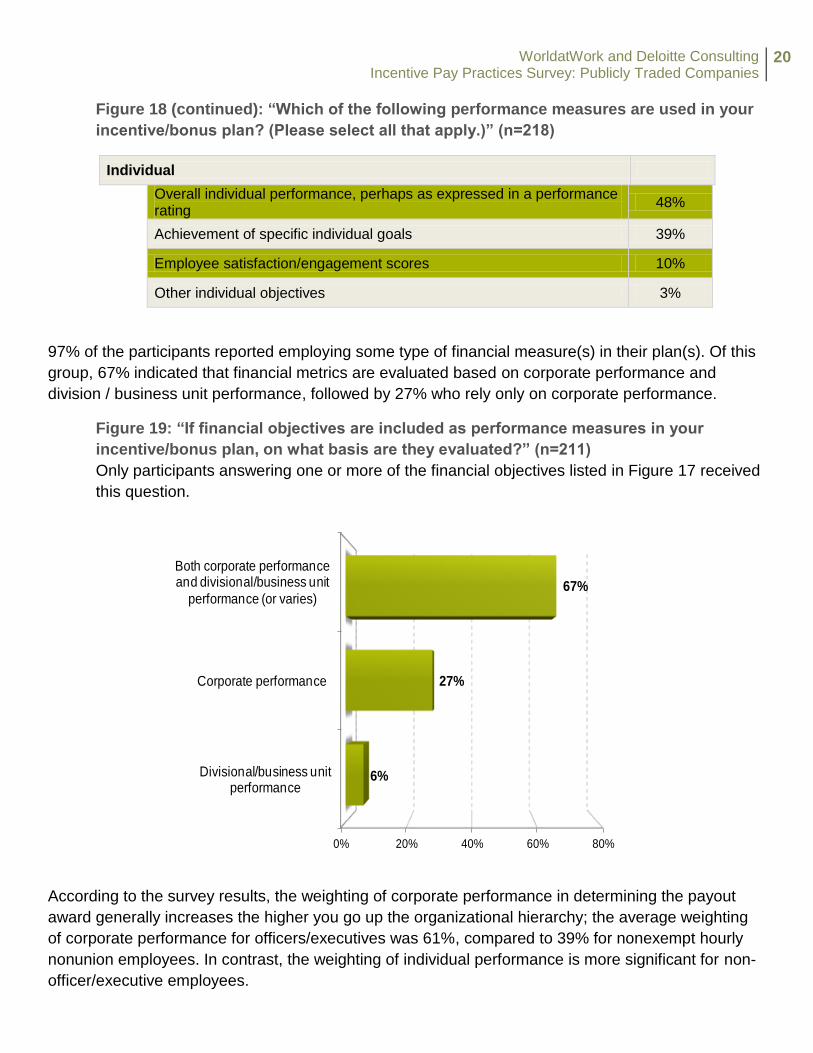
97% of the participants reported employing some type of financial measure(s) in their plan(s). Of this
group, 67% indicated that financial metrics are evaluated based on corporate performance and
division / business unit performance, followed by 27% who rely only on corporate performance.
Figure 19: “If financial objectives are included as performance measures in your
incentive/bonus plan, on what basis are they evaluated?” (n=211)
Only participants answering one or more of the financial objectives listed in Figure 17 received
this question.
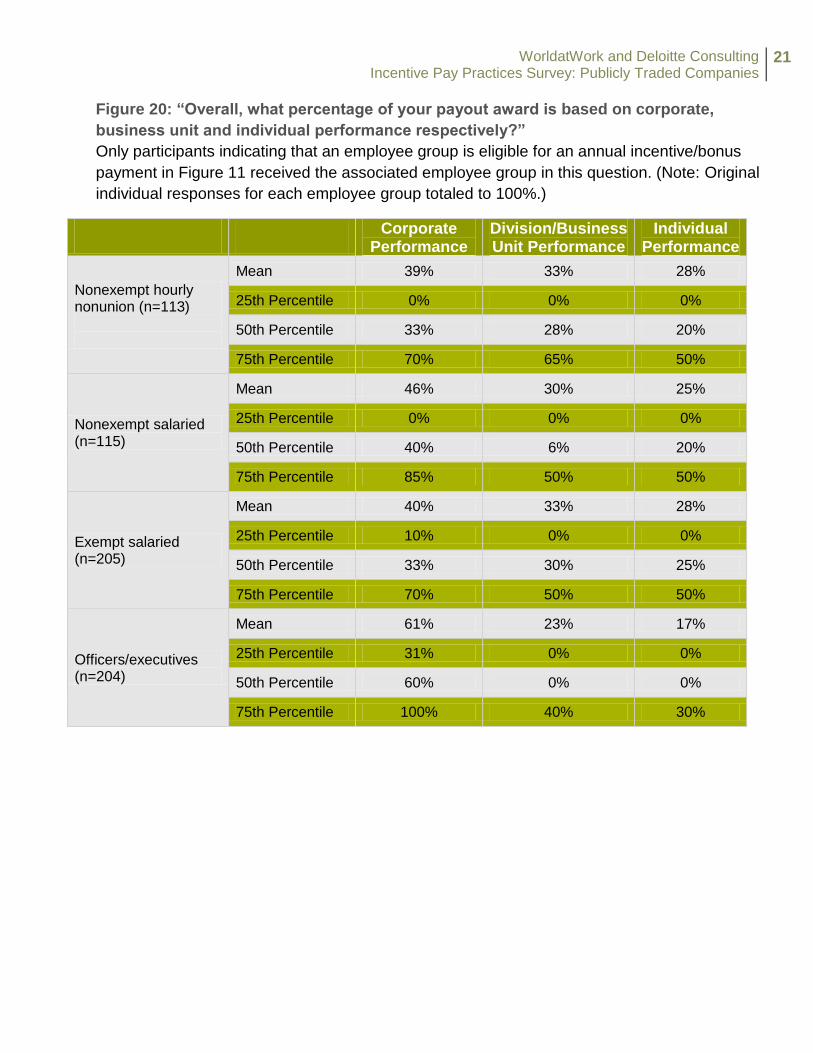
According to the survey results, the weighting of corporate performance in determining the payout
award generally increases the higher you go up the organizational hierarchy; the average weighting
of corporate performance for officers/executives was 61%, compared to 39% for nonexempt hourly
nonunion employees. In contrast, the weighting of individual performance is more significant for non-
officer/executive employees.
0% 20% 40% 60% 80%
Divisional/business unit performance
Corporate performance
Both corporate performance and divisional/business unit
performance (or varies)
6%
27%
67%
WorldatWork and Deloitte Consulting Incentive Pay Practices Survey: Publicly Traded Companies
21
Figure 20: “Overall, what percentage of your payout award is based on corporate,
business unit and individual performance respectively?”
Only participants indicating that an employee group is eligible for an annual incentive/bonus
payment in Figure 11 received the associated employee group in this question. (Note: Original
individual responses for each employee group totaled to 100%.)
Corporate Performance
Division/Business Unit Performance
Individual Performance
Nonexempt hourly nonunion (n=113)
Mean 39% 33% 28%
25th Percentile 0% 0% 0%
50th Percentile 33% 28% 20%
75th Percentile 70% 65% 50%
Nonexempt salaried (n=115)
Mean 46% 30% 25%
25th Percentile 0% 0% 0%
50th Percentile 40% 6% 20%
75th Percentile 85% 50% 50%
Exempt salaried (n=205)
Mean 40% 33% 28%
25th Percentile 10% 0% 0%
50th Percentile 33% 30% 25%
75th Percentile 70% 50% 50%
Officers/executives (n=204)
Mean 61% 23% 17%
25th Percentile 31% 0% 0%
50th Percentile 60% 0% 0%
75th Percentile 100% 40% 30%
WorldatWork and Deloitte Consulting Incentive Pay Practices Survey: Publicly Traded Companies
22
Performance Curve
A series of questions was asked to gauge the earning potential and leverage of the AIP/bonus plans
currently in place for high performers versus “meets expectations” performers.
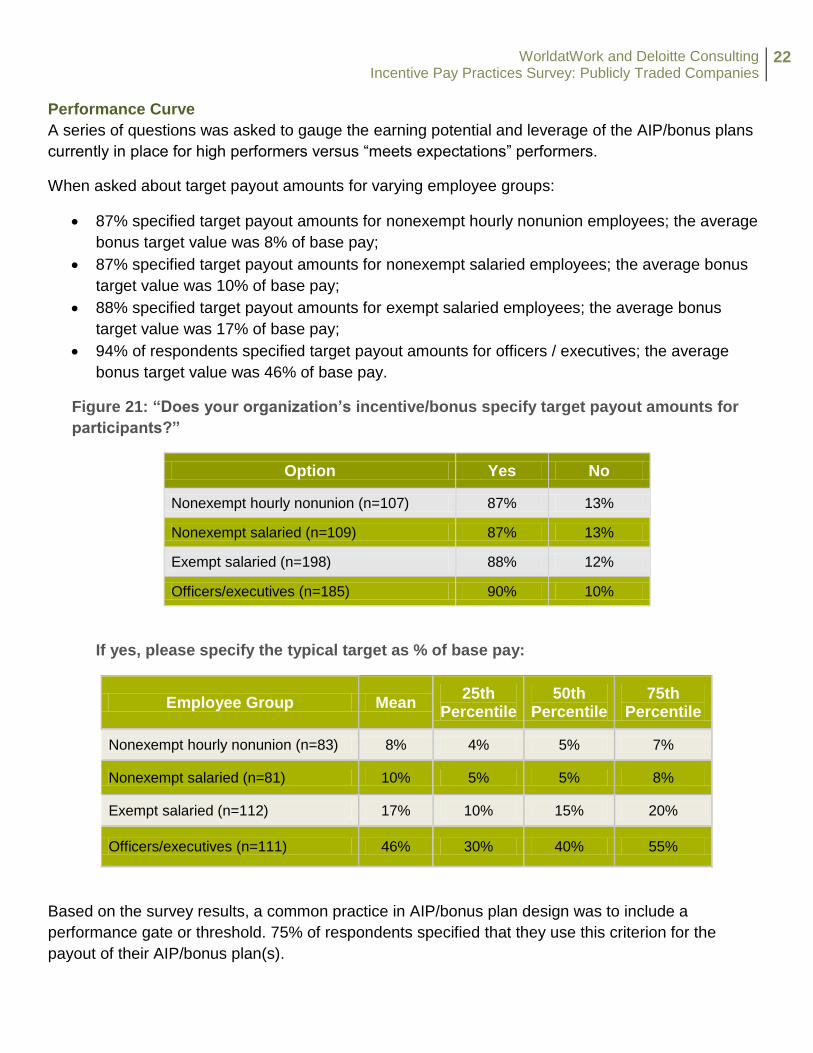
When asked about target payout amounts for varying employee groups:
87% specified target payout amounts for nonexempt hourly nonunion employees; the average
bonus target value was 8% of base pay;
87% specified target payout amounts for nonexempt salaried employees; the average bonus
target value was 10% of base pay;
88% specified target payout amounts for exempt salaried employees; the average bonus
target value was 17% of base pay;
94% of respondents specified target payout amounts for officers / executives; the average
bonus target value was 46% of base pay.
Figure 21: “Does your organization’s incentive/bonus specify target payout amounts for
participants?”
Option Yes No
Nonexempt hourly nonunion (n=107) 87% 13%
Nonexempt salaried (n=109) 87% 13%
Exempt salaried (n=198) 88% 12%
Officers/executives (n=185) 90% 10%
If yes, please specify the typical target as % of base pay:
Based on the survey results, a common practice in AIP/bonus plan design was to include a
performance gate or threshold. 75% of respondents specified that they use this criterion for the
payout of their AIP/bonus plan(s).
Employee Group Mean 25th
Percentile 50th
Percentile 75th
Percentile
Nonexempt hourly nonunion (n=83) 8% 4% 5% 7%
Nonexempt salaried (n=81) 10% 5% 5% 8%
Exempt salaried (n=112) 17% 10% 15% 20%
Officers/executives (n=111) 46% 30% 40% 55%
WorldatWork and Deloitte Consulting Incentive Pay Practices Survey: Publicly Traded Companies
23
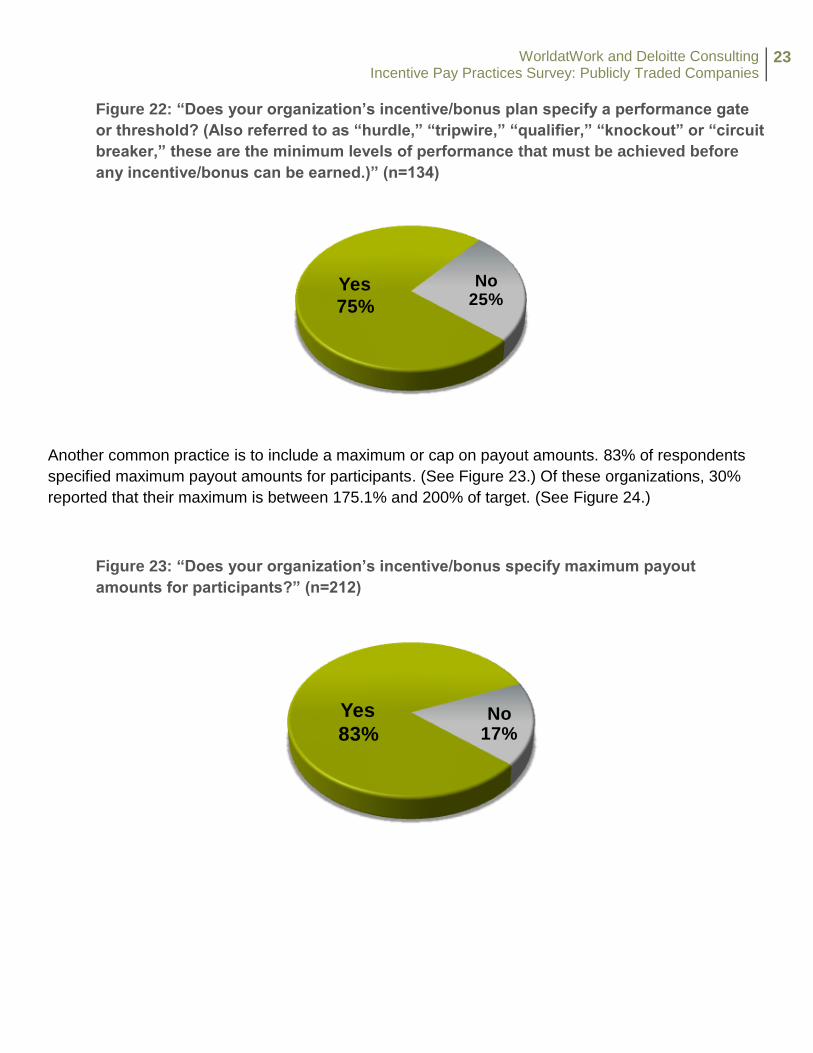
Figure 22: “Does your organization’s incentive/bonus plan specify a performance gate
or threshold? (Also referred to as “hurdle,” “tripwire,” “qualifier,” “knockout” or “circuit
breaker,” these are the minimum levels of performance that must be achieved before
any incentive/bonus can be earned.)” (n=134)
Another common practice is to include a maximum or cap on payout amounts. 83% of respondents
specified maximum payout amounts for participants. (See Figure 23.) Of these organizations, 30%
reported that their maximum is between 175.1% and 200% of target. (See Figure 24.)
Figure 23: “Does your organization’s incentive/bonus specify maximum payout
amounts for participants?” (n=212)
Yes
75%
No25%
Yes
83%No
17%
WorldatWork and Deloitte Consulting Incentive Pay Practices Survey: Publicly Traded Companies
24
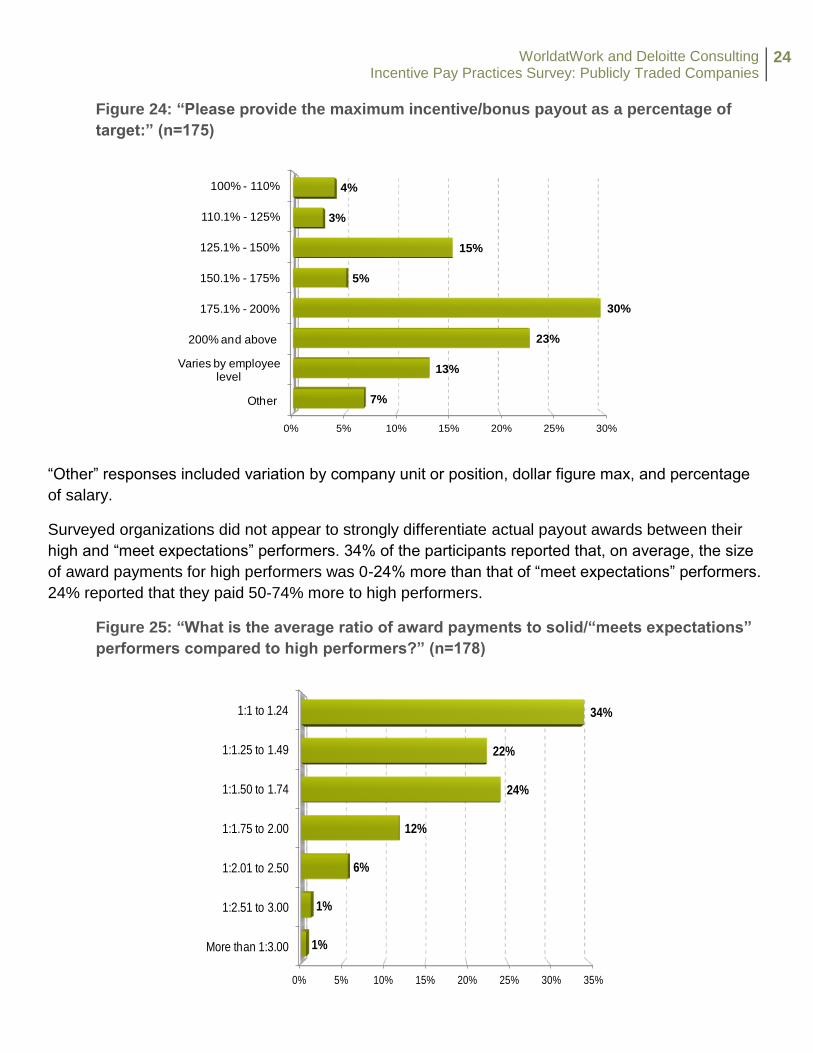
Figure 24: “Please provide the maximum incentive/bonus payout as a percentage of
target:” (n=175)
“Other” responses included variation by company unit or position, dollar figure max, and percentage
of salary.
Surveyed organizations did not appear to strongly differentiate actual payout awards between their
high and “meet expectations” performers. 34% of the participants reported that, on average, the size
of award payments for high performers was 0-24% more than that of “meet expectations” performers.
24% reported that they paid 50-74% more to high performers.
Figure 25: “What is the average ratio of award payments to solid/“meets expectations”
performers compared to high performers?” (n=178)
0% 5% 10% 15% 20% 25% 30%
Other
Varies by employee level
200% and above
175.1% - 200%
150.1% - 175%
125.1% - 150%
110.1% - 125%
100% - 110%
7%
13%
23%
30%
5%
15%
3%
4%
0% 5% 10% 15% 20% 25% 30% 35%
More than 1:3.00
1:2.51 to 3.00
1:2.01 to 2.50
1:1.75 to 2.00
1:1.50 to 1.74
1:1.25 to 1.49
1:1 to 1.24
1%
1%
6%
12%
24%
22%
34%
WorldatWork and Deloitte Consulting Incentive Pay Practices Survey: Publicly Traded Companies
25
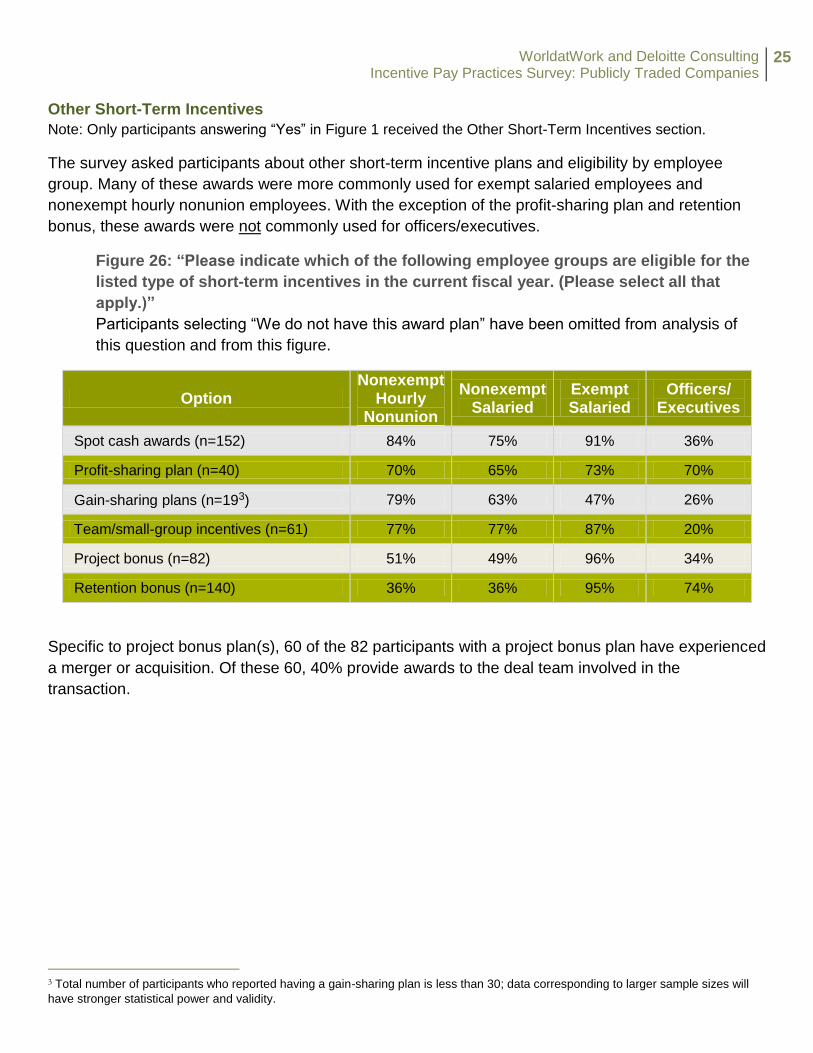
Other Short-Term Incentives Note: Only participants answering “Yes” in Figure 1 received the Other Short-Term Incentives section.
The survey asked participants about other short-term incentive plans and eligibility by employee
group. Many of these awards were more commonly used for exempt salaried employees and
nonexempt hourly nonunion employees. With the exception of the profit-sharing plan and retention
bonus, these awards were not commonly used for officers/executives.
Figure 26: “Please indicate which of the following employee groups are eligible for the
listed type of short-term incentives in the current fiscal year. (Please select all that
apply.)”
Participants selecting “We do not have this award plan” have been omitted from analysis of
this question and from this figure.
Option Nonexempt
Hourly Nonunion
Nonexempt Salaried
Exempt Salaried
Officers/ Executives
Spot cash awards (n=152) 84% 75% 91% 36%
Profit-sharing plan (n=40) 70% 65% 73% 70%
Gain-sharing plans (n=193) 79% 63% 47% 26%
Team/small-group incentives (n=61) 77% 77% 87% 20%
Project bonus (n=82) 51% 49% 96% 34%
Retention bonus (n=140) 36% 36% 95% 74%
Specific to project bonus plan(s), 60 of the 82 participants with a project bonus plan have experienced
a merger or acquisition. Of these 60, 40% provide awards to the deal team involved in the
transaction.
3 Total number of participants who reported having a gain-sharing plan is less than 30; data corresponding to larger sample sizes will
have stronger statistical power and validity.
WorldatWork and Deloitte Consulting Incentive Pay Practices Survey: Publicly Traded Companies
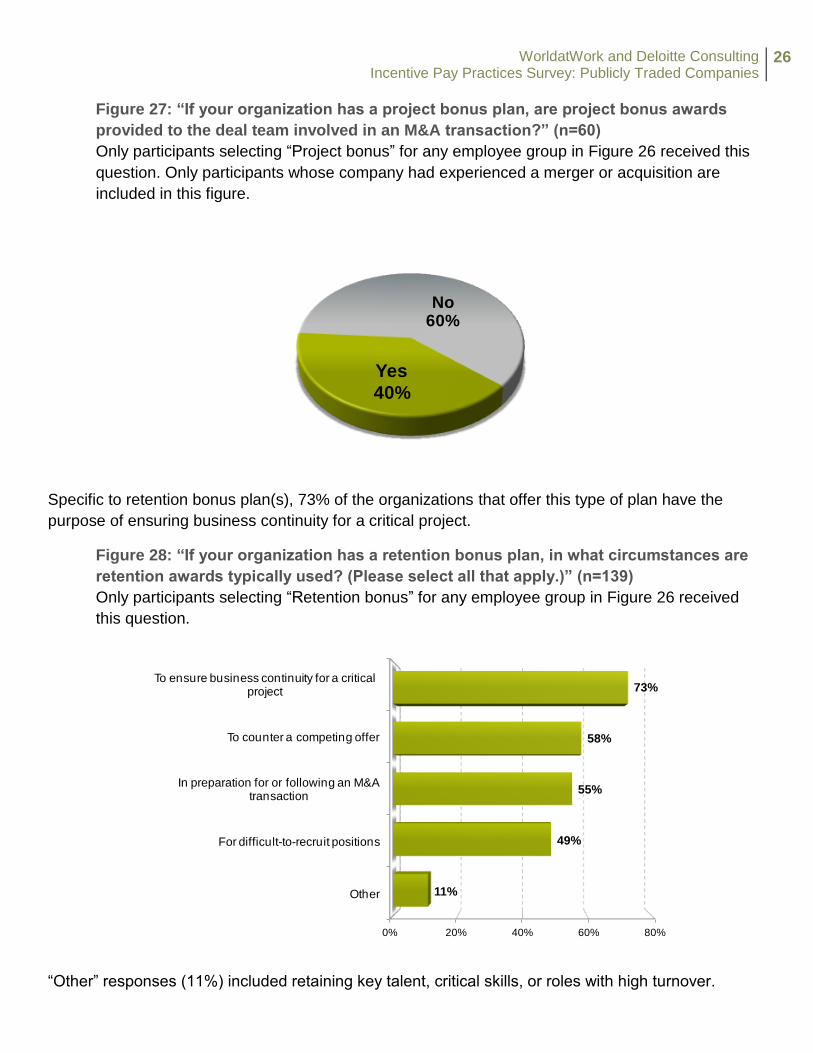
26
Figure 27: “If your organization has a project bonus plan, are project bonus awards
provided to the deal team involved in an M&A transaction?” (n=60)
Only participants selecting “Project bonus” for any employee group in Figure 26 received this
question. Only participants whose company had experienced a merger or acquisition are
included in this figure.
Specific to retention bonus plan(s), 73% of the organizations that offer this type of plan have the
purpose of ensuring business continuity for a critical project.
Figure 28: “If your organization has a retention bonus plan, in what circumstances are
retention awards typically used? (Please select all that apply.)” (n=139)
Only participants selecting “Retention bonus” for any employee group in Figure 26 received
this question.
“Other” responses (11%) included retaining key talent, critical skills, or roles with high turnover.
Yes
40%
No60%
0% 20% 40% 60% 80%
Other
For difficult-to-recruit positions
In preparation for or following an M&A transaction
To counter a competing offer
To ensure business continuity for a critical project
11%
49%
55%
58%
73%
WorldatWork and Deloitte Consulting Incentive Pay Practices Survey: Publicly Traded Companies
27
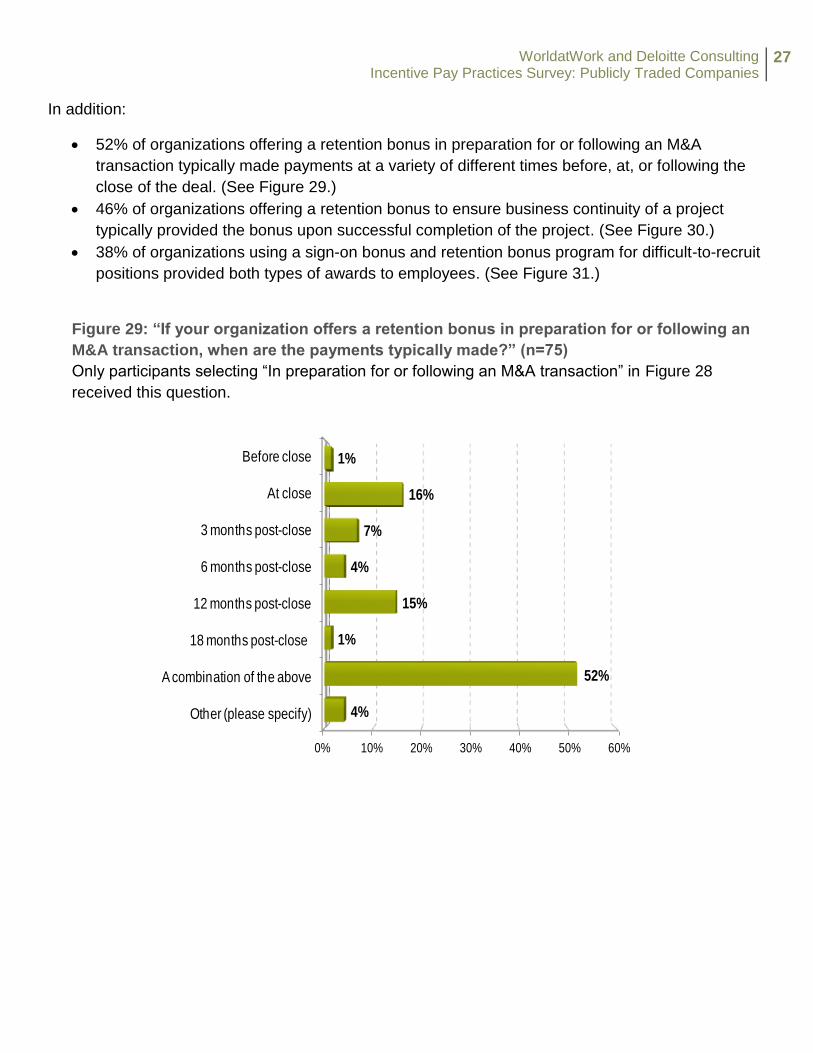
In addition:
52% of organizations offering a retention bonus in preparation for or following an M&A
transaction typically made payments at a variety of different times before, at, or following the
close of the deal. (See Figure 29.)
46% of organizations offering a retention bonus to ensure business continuity of a project
typically provided the bonus upon successful completion of the project. (See Figure 30.)
38% of organizations using a sign-on bonus and retention bonus program for difficult-to-recruit
positions provided both types of awards to employees. (See Figure 31.)
Figure 29: “If your organization offers a retention bonus in preparation for or following an
M&A transaction, when are the payments typically made?” (n=75)
Only participants selecting “In preparation for or following an M&A transaction” in Figure 28
received this question.
0% 10% 20% 30% 40% 50% 60%
Other (please specify)
A combination of the above
18 months post-close
12 months post-close
6 months post-close
3 months post-close
At close
Before close
4%
52%
1%
15%
4%
7%
16%
1%
WorldatWork and Deloitte Consulting Incentive Pay Practices Survey: Publicly Traded Companies
28
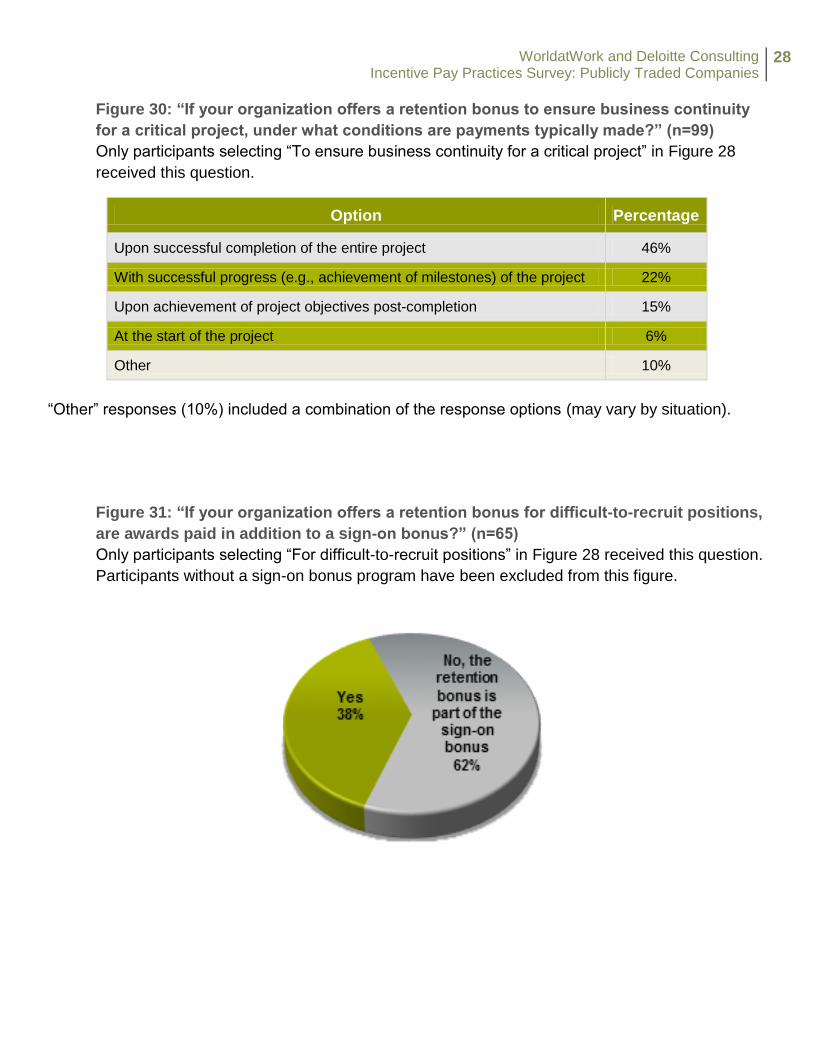
Figure 30: “If your organization offers a retention bonus to ensure business continuity
for a critical project, under what conditions are payments typically made?” (n=99)
Only participants selecting “To ensure business continuity for a critical project” in Figure 28
received this question.
Option Percentage
Upon successful completion of the entire project 46%
With successful progress (e.g., achievement of milestones) of the project 22%
Upon achievement of project objectives post-completion 15%
At the start of the project 6%
Other 10%
“Other” responses (10%) included a combination of the response options (may vary by situation).
Figure 31: “If your organization offers a retention bonus for difficult-to-recruit positions,
are awards paid in addition to a sign-on bonus?” (n=65)
Only participants selecting “For difficult-to-recruit positions” in Figure 28 received this question.
Participants without a sign-on bonus program have been excluded from this figure.
WorldatWork and Deloitte Consulting Incentive Pay Practices Survey: Publicly Traded Companies
29
Long-Term Incentive Programs
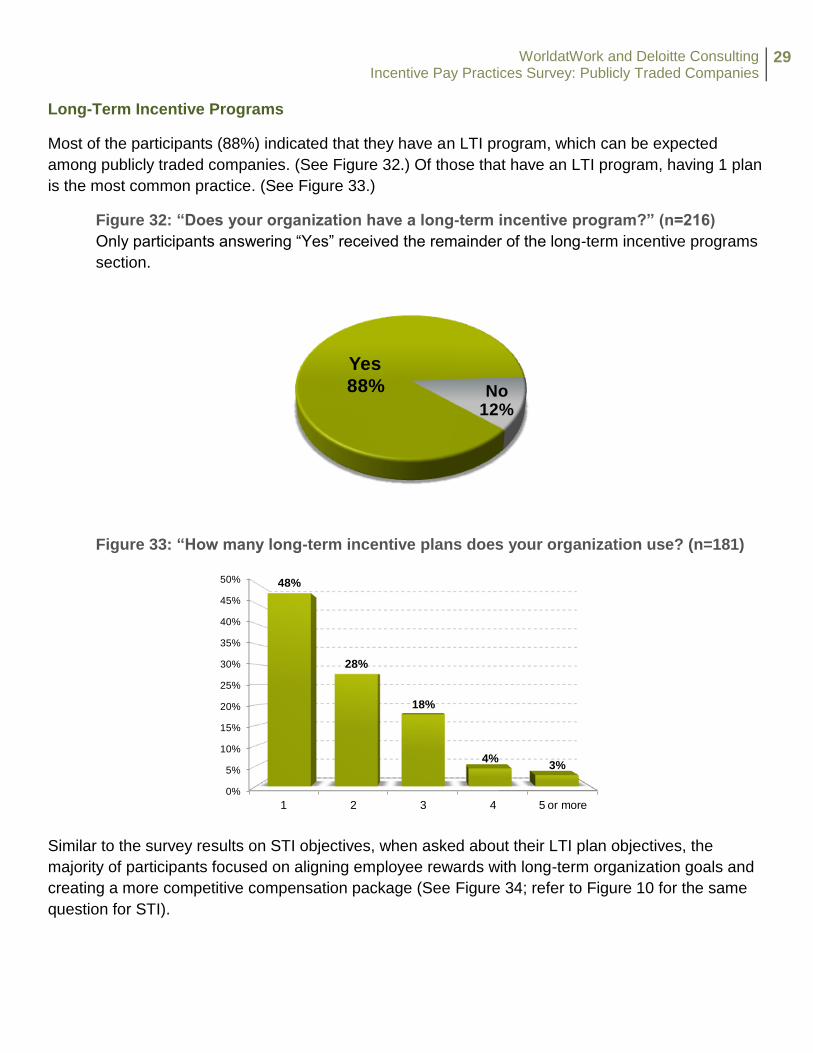
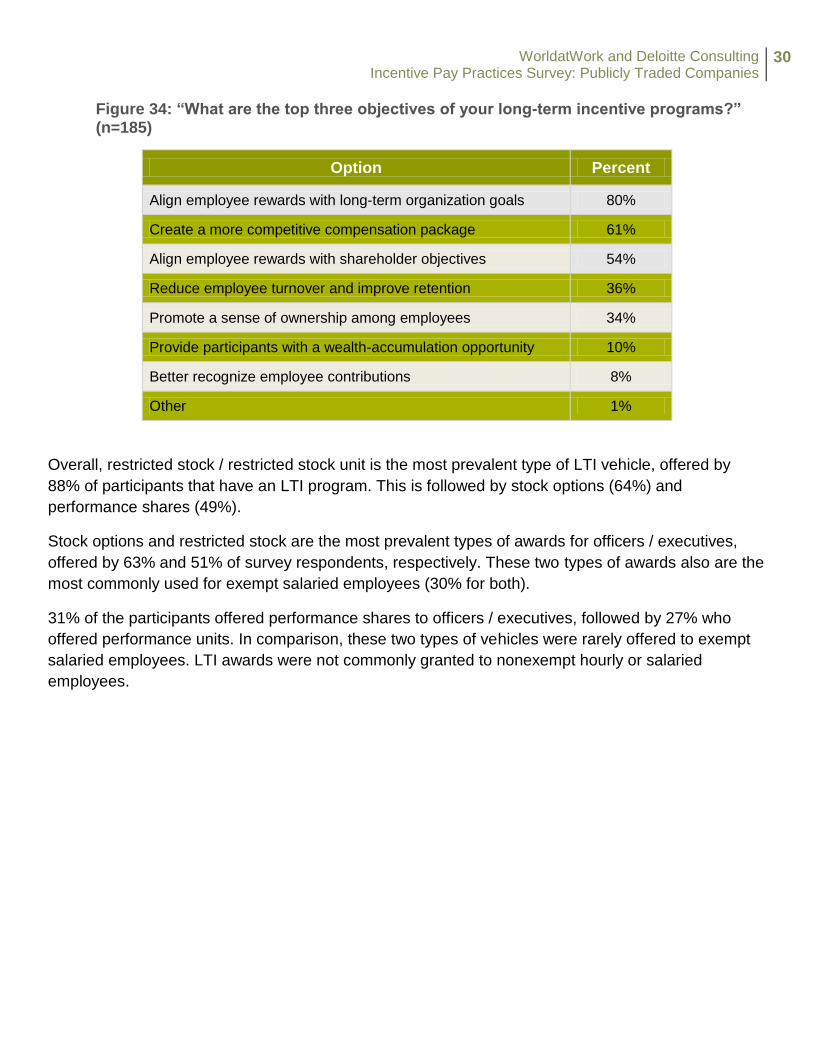
Most of the participants (88%) indicated that they have an LTI program, which can be expected
among publicly traded companies. (See Figure 32.) Of those that have an LTI program, having 1 plan
is the most common practice. (See Figure 33.)
Figure 32: “Does your organization have a long-term incentive program?” (n=216)
Only participants answering “Yes” received the remainder of the long-term incentive programs
section.
Figure 33: “How many long-term incentive plans does your organization use? (n=181)
Similar to the survey results on STI objectives, when asked about their LTI plan objectives, the
majority of participants focused on aligning employee rewards with long-term organization goals and
creating a more competitive compensation package (See Figure 34; refer to Figure 10 for the same
question for STI).
Yes
88% No12%
0%
5%
10%
15%
20%
25%
30%
35%
40%
45%
50%
1 2 3 4 5 or more
48%
28%
18%
4%3%
WorldatWork and Deloitte Consulting Incentive Pay Practices Survey: Publicly Traded Companies
30
Figure 34: “What are the top three objectives of your long-term incentive programs?” (n=185)
Option Percent
Align employee rewards with long-term organization goals 80%
Create a more competitive compensation package 61%
Align employee rewards with shareholder objectives 54%
Reduce employee turnover and improve retention 36%
Promote a sense of ownership among employees 34%
Provide participants with a wealth-accumulation opportunity 10%
Better recognize employee contributions 8%
Other 1%
Overall, restricted stock / restricted stock unit is the most prevalent type of LTI vehicle, offered by
88% of participants that have an LTI program. This is followed by stock options (64%) and
performance shares (49%).
Stock options and restricted stock are the most prevalent types of awards for officers / executives,
offered by 63% and 51% of survey respondents, respectively. These two types of awards also are the
most commonly used for exempt salaried employees (30% for both).
31% of the participants offered performance shares to officers / executives, followed by 27% who
offered performance units. In comparison, these two types of vehicles were rarely offered to exempt
salaried employees. LTI awards were not commonly granted to nonexempt hourly or salaried
employees.
WorldatWork and Deloitte Consulting Incentive Pay Practices Survey: Publicly Traded Companies
31
Figure 35: “Please indicate which of the following employee groups are eligible for the
listed type of long term incentives in the current fiscal year. (Please select all that
apply.)”
The figures below show the overall prevalence of each LTI vehicle as well as eligibility by
employee group.
Overall prevalence by LTI vehicle:
Option Percent
Restricted stock (n=180) (including Restricted Stock Units) 88%
Stock option (n=166) 64%
Performance shares (n=163) 49%
Performance units (n=165) 44%
Long-term cash plan (n=159) 31%
Stock appreciation right (SAR) (n=158) 10%
Phantom stock (n=157) 8%
Other (n=104) 3%
Eligibility of each LTI vehicle by employee group (multiple selections were possible):
Option Nonexempt
Hourly Nonunion
Nonexempt Salaried
Exempt Salaried
Officers/ Executives
We do not offer this plan
Restricted stock (n=180) (including restricted stock units)
6% 6% 51% 84% 16%
Stock option (n=166) 1% 2% 30% 63% 36%
Performance shares (n=163) 1% 1% 11% 49% 51%
Performance units (n=165) 1% 1% 15% 43% 56%
Long-term cash plan (n=159) 2% 3% 14% 28% 69%
Stock appreciation right (SAR) (n=158)
1% 1% 4% 9% 90%
Phantom stock (n=157) 1% 1% 5% 6% 92%
Other (n=104) 0% 0% 2% 3% 97%
WorldatWork and Deloitte Consulting Incentive Pay Practices Survey: Publicly Traded Companies
32
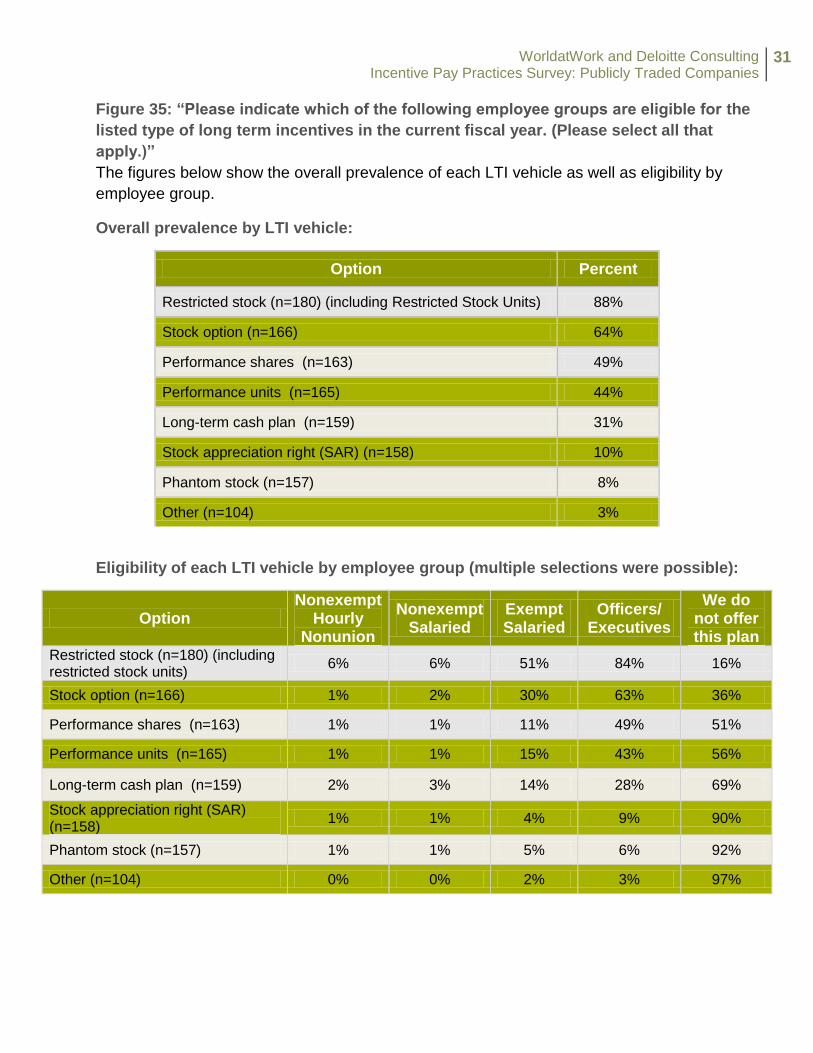
The level of equity overhang varied across survey respondents, although most fell between 0% and
14.99%. 27% of the organizations surveyed responded that their level of equity overhang in the last
completed fiscal year ranged from 5% to 9.99%, followed by 24% who responded that their level
ranged from 10% to 14.99%. 23% of the participants reported that their level of equity overhang
ranged from 0% to 5%.
Figure 36: “What is the level of equity overhang at your organization in the last completed fiscal year?” (n=135)
Based on responses from survey participants, on average, 55% of the organization’s grant is
allocated to officers / executives (excluding the CEO), with 29% and 14% to exempt salaried
employees and the CEO, respectively. Overall, few organizations allocated more than 1% of their
annual grant to nonexempt employees.
Figure 37: “Based on the most recent annual grant, what percentage of your organization’s grant is allocated to each of the following employee groups? (Include stock options, restricted stock and shares held.)”
Employee Group Mean 25th
Percentile 50th
Percentile 75th
Percentile
Nonexempt hourly nonunion (n=178) 1% 0% 0% 0%
Nonexempt salaried (n=178) 1% 0% 0% 0%
Exempt salaried (n=178) 29% 0% 25% 50%
Officers/executives (excluding CEO) (n=180) 55% 30% 50% 85%
CEO (n=179) 14% 5% 10% 20%
0% 10% 20% 30%
More than 25%
20% to 24.99%
15% to 19.99%
10% to 14.99%
5% to 9.99%
Less than 5% (but greater than 0%)
0%
0%
6%
14%
24%
27%
23%
6%
WorldatWork and Deloitte Consulting Incentive Pay Practices Survey: Publicly Traded Companies
33
Plan Administration
The following results discuss incentive plan administration of the annual incentive / discretionary
bonus plan, such as how frequently plans are reviewed, use of technology for plan maintenance and
calculations, and communication of plan participation, performance measures, targets, and
achievement. Only participants answering “Plan Currently in Place” or “In Place, but May Eliminate” to
the options, annual incentive plan (AIP) or annual discretionary bonus plan in Figure 3 received the
questions in Figure 38, Figure 39 and Figure 40.
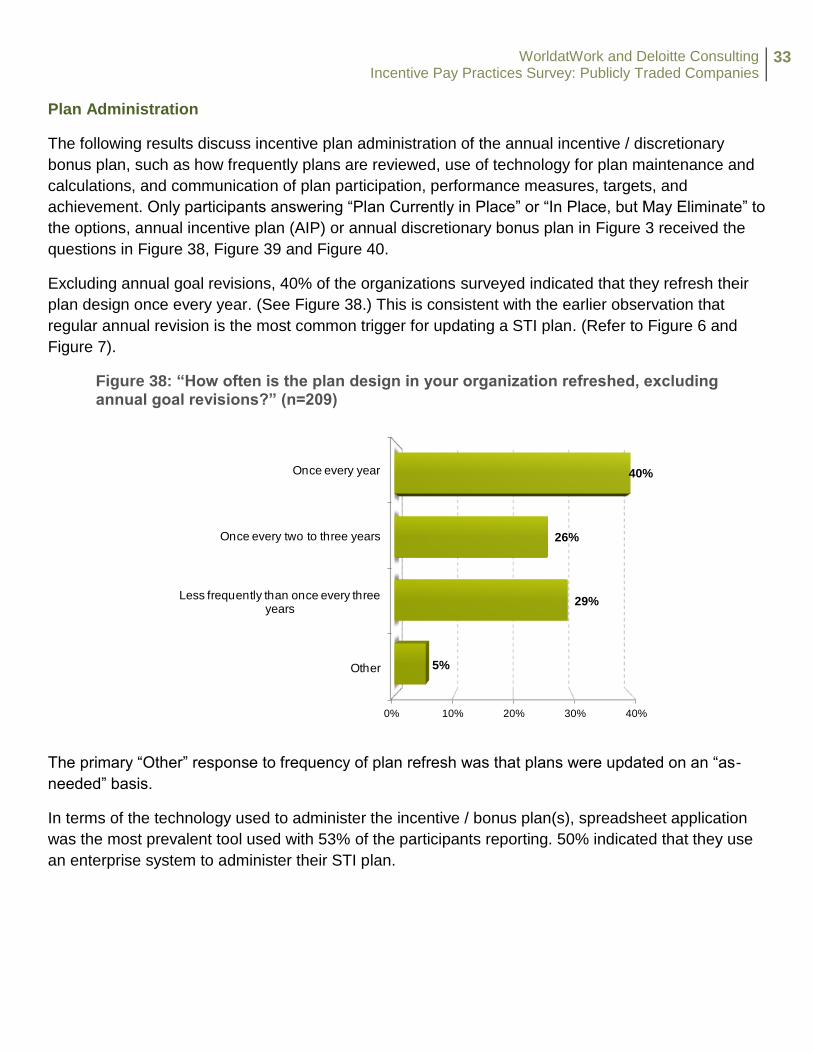
Excluding annual goal revisions, 40% of the organizations surveyed indicated that they refresh their
plan design once every year. (See Figure 38.) This is consistent with the earlier observation that
regular annual revision is the most common trigger for updating a STI plan. (Refer to Figure 6 and
Figure 7).
Figure 38: “How often is the plan design in your organization refreshed, excluding annual goal revisions?” (n=209)
The primary “Other” response to frequency of plan refresh was that plans were updated on an “as-
needed” basis.
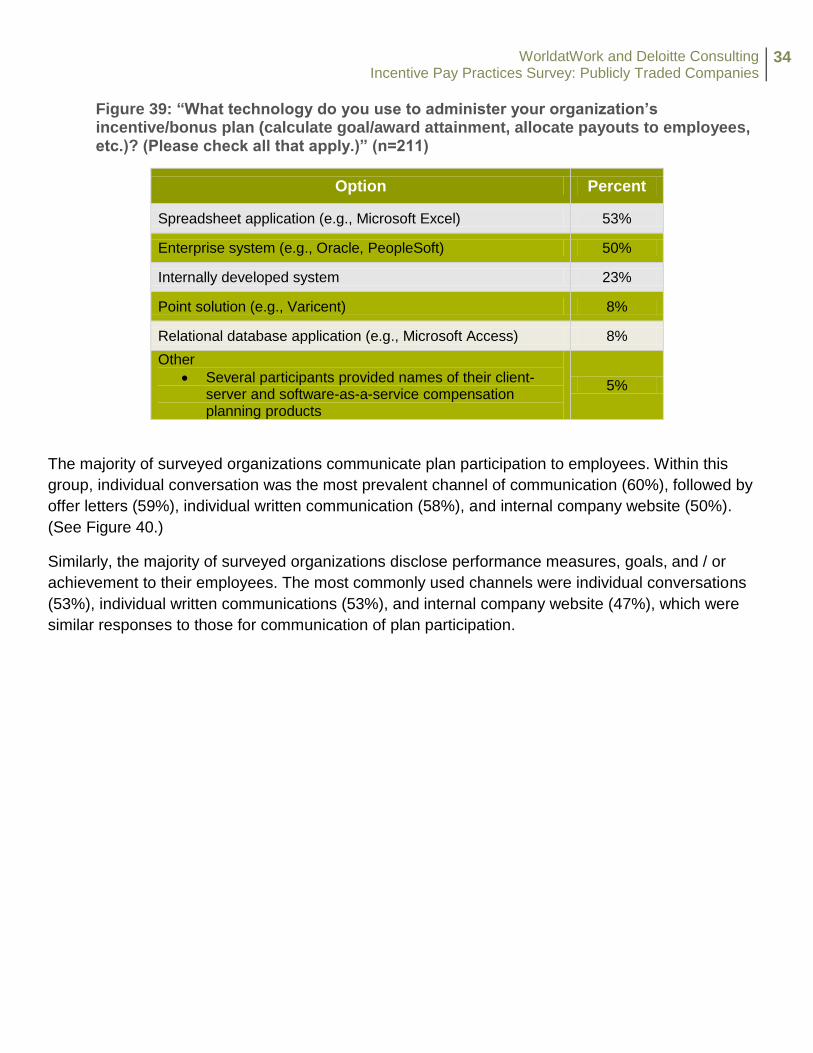
In terms of the technology used to administer the incentive / bonus plan(s), spreadsheet application
was the most prevalent tool used with 53% of the participants reporting. 50% indicated that they use
an enterprise system to administer their STI plan.
0% 10% 20% 30% 40%
Other
Less frequently than once every three years
Once every two to three years
Once every year
5%
29%
26%
40%
WorldatWork and Deloitte Consulting Incentive Pay Practices Survey: Publicly Traded Companies
34
Figure 39: “What technology do you use to administer your organization’s incentive/bonus plan (calculate goal/award attainment, allocate payouts to employees, etc.)? (Please check all that apply.)” (n=211)
Option Percent
Spreadsheet application (e.g., Microsoft Excel) 53%
Enterprise system (e.g., Oracle, PeopleSoft) 50%
Internally developed system 23%
Point solution (e.g., Varicent) 8%
Relational database application (e.g., Microsoft Access) 8%
Other
Several participants provided names of their client-server and software-as-a-service compensation planning products
5%
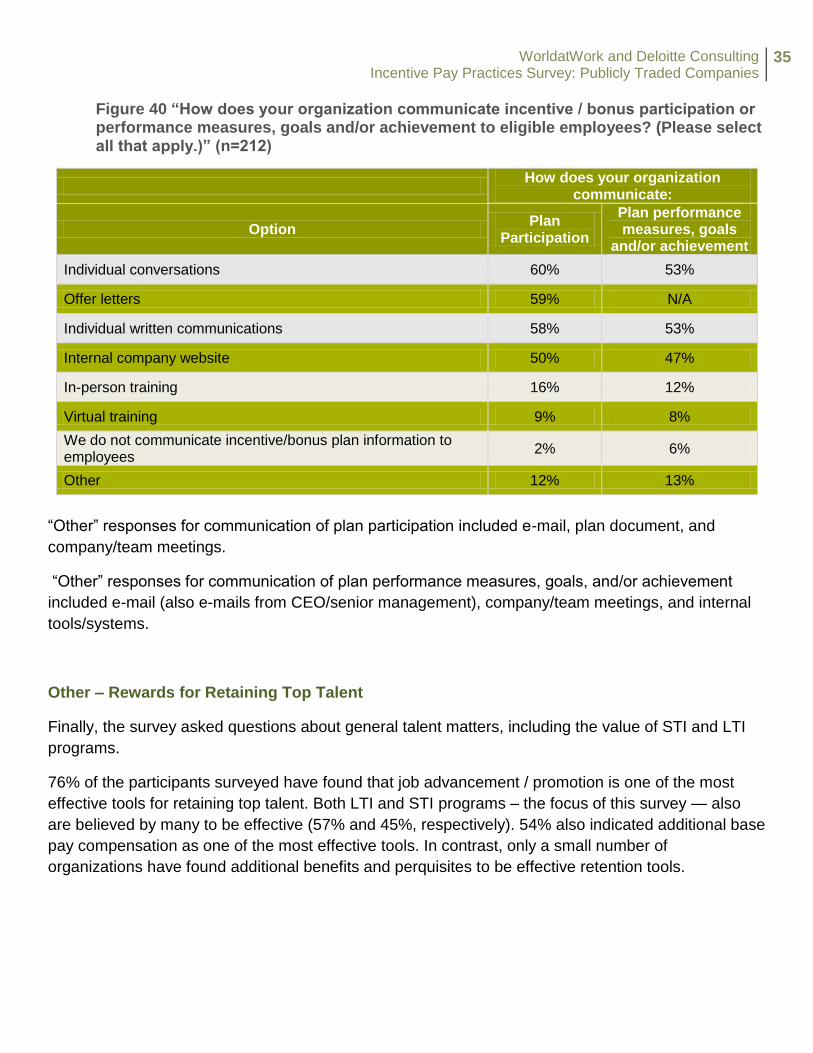
The majority of surveyed organizations communicate plan participation to employees. Within this
group, individual conversation was the most prevalent channel of communication (60%), followed by
offer letters (59%), individual written communication (58%), and internal company website (50%).
(See Figure 40.)
Similarly, the majority of surveyed organizations disclose performance measures, goals, and / or
achievement to their employees. The most commonly used channels were individual conversations
(53%), individual written communications (53%), and internal company website (47%), which were
similar responses to those for communication of plan participation.
WorldatWork and Deloitte Consulting Incentive Pay Practices Survey: Publicly Traded Companies
35
Figure 40 “How does your organization communicate incentive / bonus participation or performance measures, goals and/or achievement to eligible employees? (Please select all that apply.)” (n=212)
How does your organization
communicate:
Option Plan
Participation
Plan performance measures, goals
and/or achievement
Individual conversations 60% 53%
Offer letters 59% N/A
Individual written communications 58% 53%
Internal company website 50% 47%
In-person training 16% 12%
Virtual training 9% 8%
We do not communicate incentive/bonus plan information to employees
2% 6%
Other 12% 13%
“Other” responses for communication of plan participation included e-mail, plan document, and
company/team meetings.
“Other” responses for communication of plan performance measures, goals, and/or achievement
included e-mail (also e-mails from CEO/senior management), company/team meetings, and internal
tools/systems.
Other – Rewards for Retaining Top Talent
Finally, the survey asked questions about general talent matters, including the value of STI and LTI
programs.
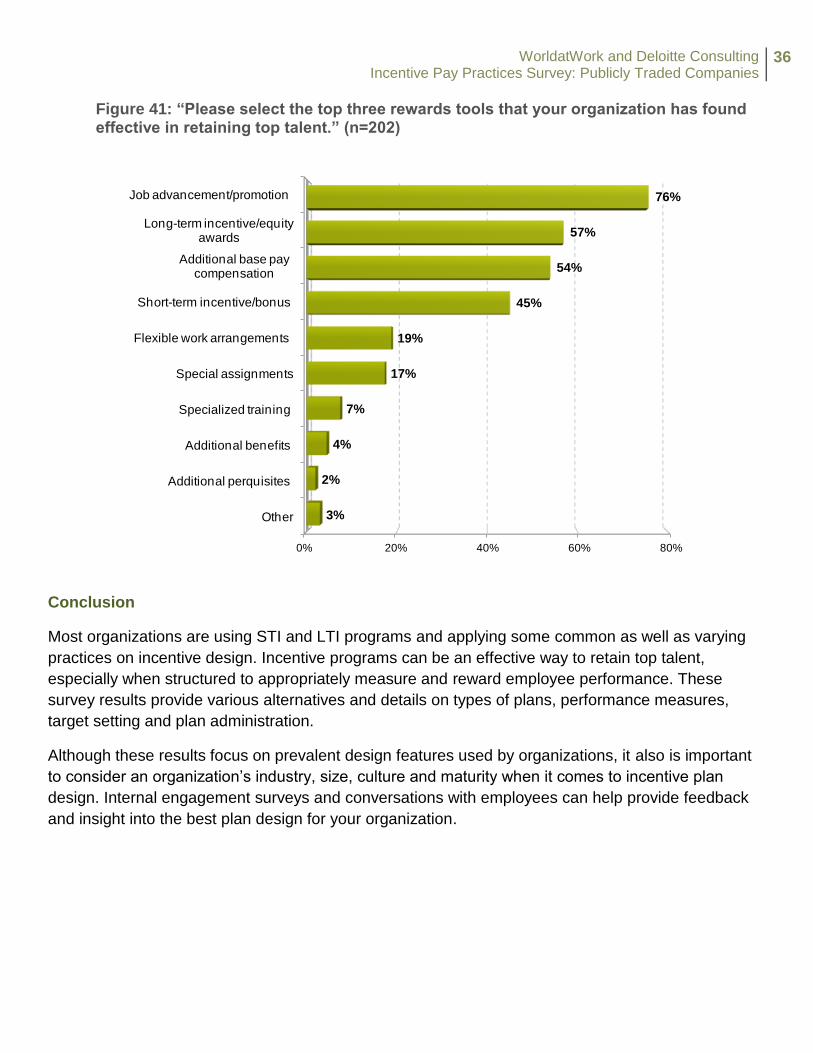
76% of the participants surveyed have found that job advancement / promotion is one of the most
effective tools for retaining top talent. Both LTI and STI programs – the focus of this survey — also
are believed by many to be effective (57% and 45%, respectively). 54% also indicated additional base
pay compensation as one of the most effective tools. In contrast, only a small number of
organizations have found additional benefits and perquisites to be effective retention tools.
WorldatWork and Deloitte Consulting Incentive Pay Practices Survey: Publicly Traded Companies
36
Figure 41: “Please select the top three rewards tools that your organization has found effective in retaining top talent.” (n=202)
Conclusion
Most organizations are using STI and LTI programs and applying some common as well as varying
practices on incentive design. Incentive programs can be an effective way to retain top talent,
especially when structured to appropriately measure and reward employee performance. These
survey results provide various alternatives and details on types of plans, performance measures,
target setting and plan administration.
Although these results focus on prevalent design features used by organizations, it also is important
to consider an organization’s industry, size, culture and maturity when it comes to incentive plan
design. Internal engagement surveys and conversations with employees can help provide feedback
and insight into the best plan design for your organization.
0% 20% 40% 60% 80%
Other
Additional perquisites
Additional benefits
Specialized training
Special assignments
Flexible work arrangements
Short-term incentive/bonus
Additional base pay compensation
Long-term incentive/equity awards
Job advancement/promotion
3%
2%
4%
7%
17%
19%
45%
54%
57%
76%
WorldatWork and Deloitte Consulting Incentive Pay Practices Survey: Publicly Traded Companies
37
Demographics
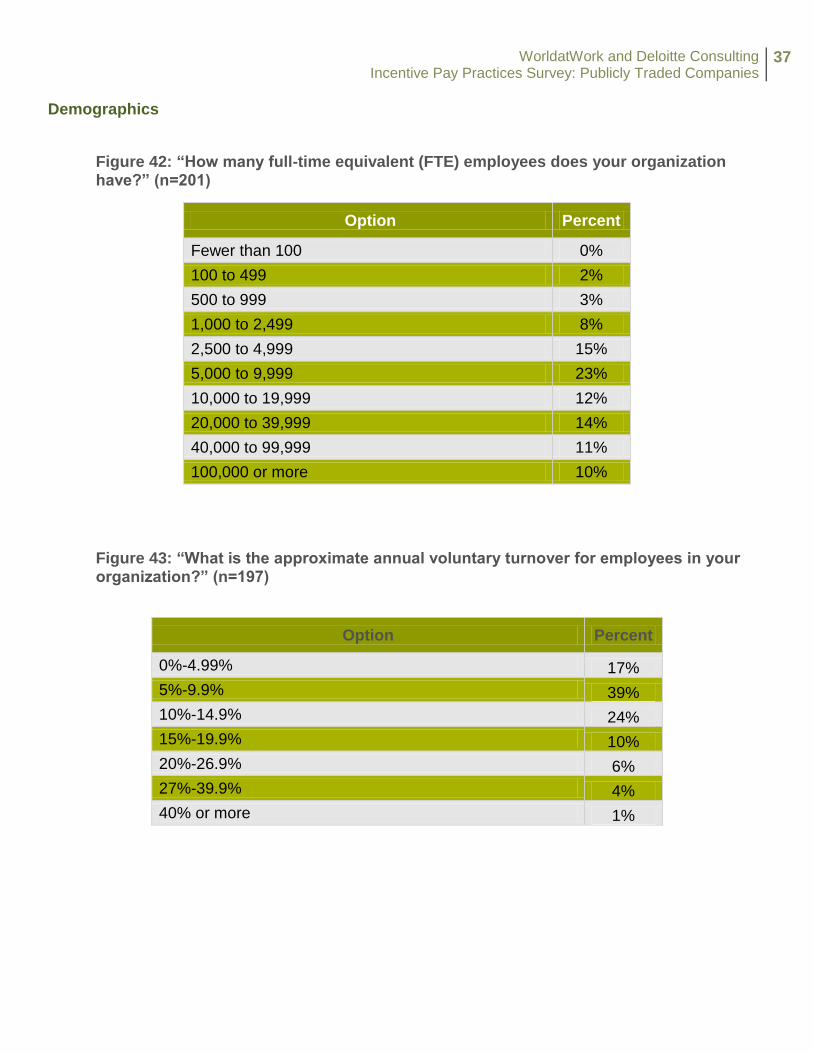
Figure 42: “How many full-time equivalent (FTE) employees does your organization have?” (n=201)
Option Percent
Fewer than 100 0%
100 to 499 2%
500 to 999 3%
1,000 to 2,499 8%
2,500 to 4,999 15%
5,000 to 9,999 23%
10,000 to 19,999 12%
20,000 to 39,999 14%
40,000 to 99,999 11%
100,000 or more 10%
Figure 43: “What is the approximate annual voluntary turnover for employees in your organization?” (n=197)
Option Percent
0%-4.99% 17%
5%-9.9% 39%
10%-14.9% 24%
15%-19.9% 10%
20%-26.9% 6%
27%-39.9% 4%
40% or more 1%
WorldatWork and Deloitte Consulting Incentive Pay Practices Survey: Publicly Traded Companies
38
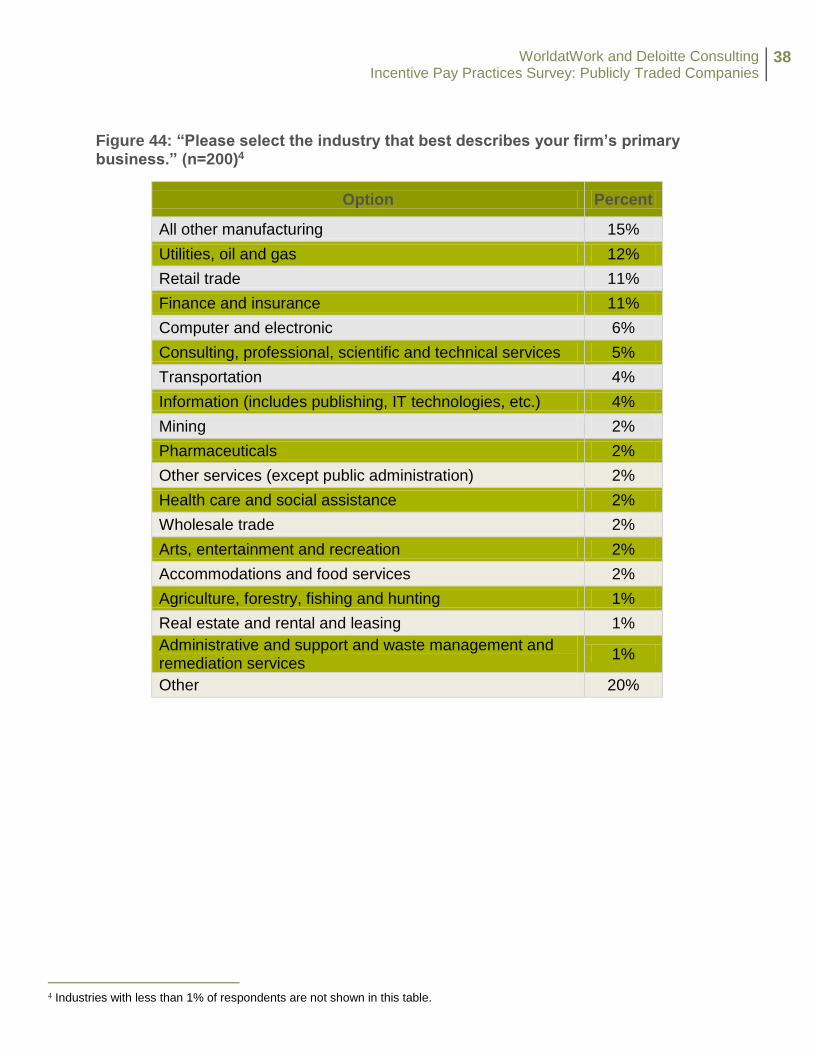
Figure 44: “Please select the industry that best describes your firm’s primary business.” (n=200)4
Option Percent
All other manufacturing 15%
Utilities, oil and gas 12%
Retail trade 11%
Finance and insurance 11%
Computer and electronic 6%
Consulting, professional, scientific and technical services 5%
Transportation 4%
Information (includes publishing, IT technologies, etc.) 4%
Mining 2%
Pharmaceuticals 2%
Other services (except public administration) 2%
Health care and social assistance 2%
Wholesale trade 2%
Arts, entertainment and recreation 2%
Accommodations and food services 2%
Agriculture, forestry, fishing and hunting 1%
Real estate and rental and leasing 1%
Administrative and support and waste management and remediation services
1%
Other 20%
4 Industries with less than 1% of respondents are not shown in this table.
WorldatWork and Deloitte Consulting Incentive Pay Practices Survey: Publicly Traded Companies
39
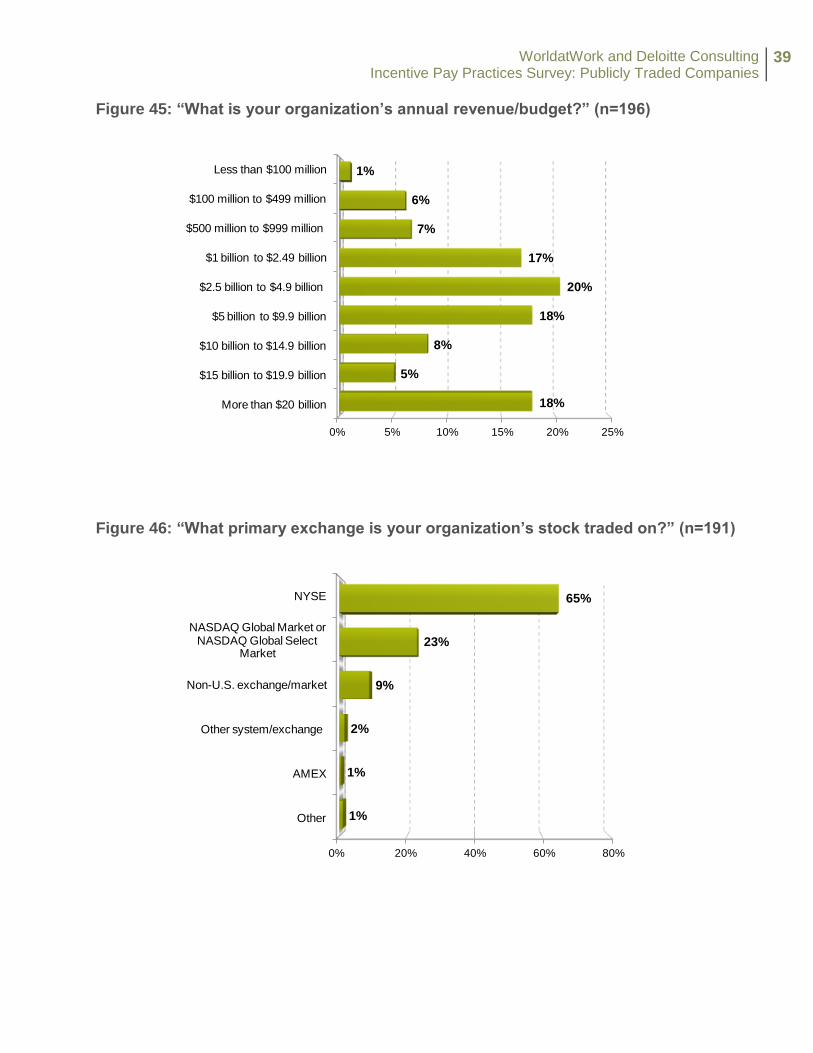
Figure 45: “What is your organization’s annual revenue/budget?” (n=196)
Figure 46: “What primary exchange is your organization’s stock traded on?” (n=191)
0% 5% 10% 15% 20% 25%
More than $20 billion
$15 billion to $19.9 billion
$10 billion to $14.9 billion
$5 billion to $9.9 billion
$2.5 billion to $4.9 billion
$1 billion to $2.49 billion
$500 million to $999 million
$100 million to $499 million
Less than $100 million
18%
5%
8%
18%
20%
17%
7%
6%
1%
0% 20% 40% 60% 80%
Other
AMEX
Other system/exchange
Non-U.S. exchange/market
NASDAQ Global Market or NASDAQ Global Select
Market
NYSE
1%
1%
2%
9%
23%
65%
WorldatWork and Deloitte Consulting Incentive Pay Practices Survey: Publicly Traded Companies
40
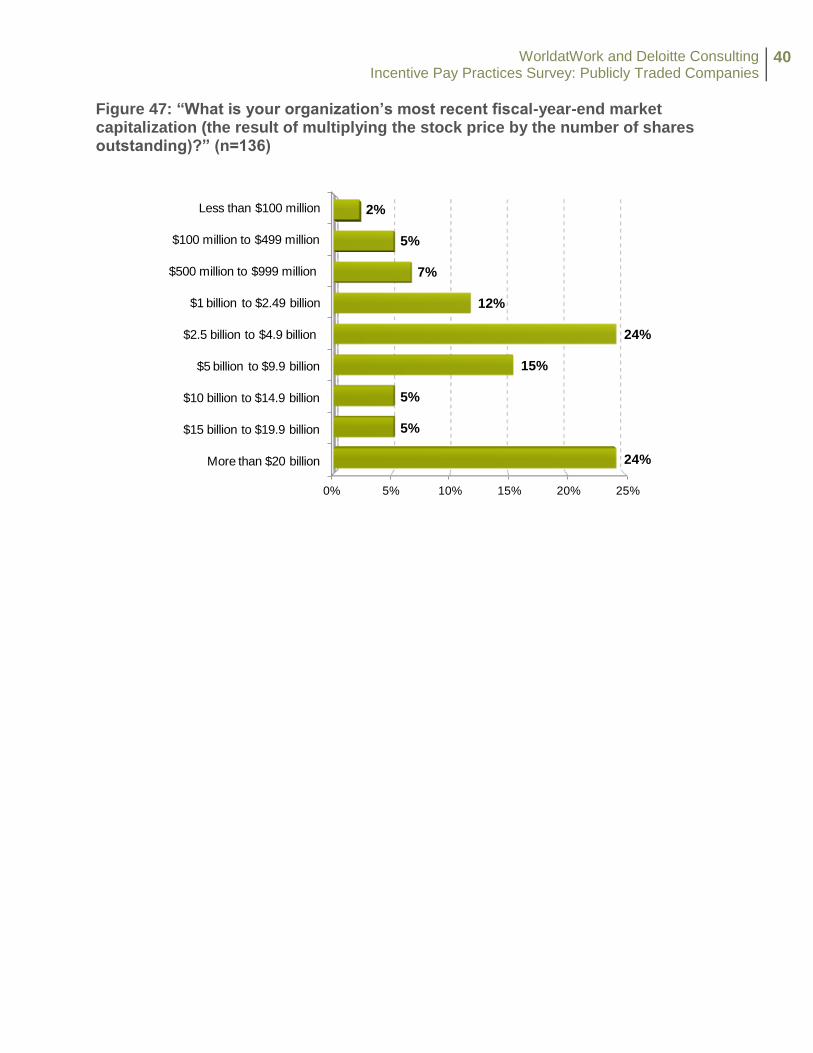
Figure 47: “What is your organization’s most recent fiscal-year-end market capitalization (the result of multiplying the stock price by the number of shares outstanding)?” (n=136)
0% 5% 10% 15% 20% 25%
More than $20 billion
$15 billion to $19.9 billion
$10 billion to $14.9 billion
$5 billion to $9.9 billion
$2.5 billion to $4.9 billion
$1 billion to $2.49 billion
$500 million to $999 million
$100 million to $499 million
Less than $100 million
24%
5%
5%
15%
24%
12%
7%
5%
2%
WorldatWork and Deloitte Consulting Incentive Pay Practices Survey: Publicly Traded Companies
41
Participating Organizations ABB Acquity Group ADP ADP Dealer Services Aetna AGL Resources AIG Air Liquide USA Air Products Allergan Ameren Corporation American Eagle Outfitters AON PLC Apogee Enterprises, Inc. Applied Materials Arbitron Arch Coal, Inc. Arizona Public Service Co. Associated Bank AT&T Atmos Energy AXA Technology Services Babcock & Wilcox Baxter International BBVA Compass Black Hills Corporation Blue Cross Blue Shield of Minnesota BNSF Railway Company Booz Allen Hamilton Brinker International Buck Consultants Buckeye Partners, L.P. Build-A-Bear Workshop Cabelas Calpine Corporation Capella Education Company Career Education Corp Carter's, Inc. CenterPoint Energy Chico's FAS Citrix Cliffs Natural Resources CNA Insurance Columbia Sportswear Compuware ConAgra Foods, Inc. Continental Automotive Systems, Inc Con-way Inc. CSC
CSL Behring D&B Daiichi Sankyo, Inc. Delhaize America DENSO International America Inc Detroit Medical Center Direct Energy Dollar General Donaldson Company, Inc DTE Energy DuPont Pioneer Energy Transfer Entergy Ericsson Inc. Esterline Technologies Corp. Express Scripts, Inc. Exterran FedEx SupplyChain Fifth & Pacific Companies, Inc. Financial Engines First Financial Bank FirstEnergy Flextronics Gate Gourmet, Inc. GDF SUEZ Energy North America General Motors Gentiva Graphic Packaging International Inc GTECH Corporation Gulfstream Aerospace Corporation Hancock Holding Company Hercules Offshore Herman Miller, Inc. Hertz Hitachi America, Ltd. HMSHost Houghton Mifflin Harcourt Humana Huron Consulting Group IDEX Corporation IHS IngramMicro Insperity, Inc. Integrys Intel Corp InterContinental Hotels Group Iron Mountain JC Penney JDSU
WorldatWork and Deloitte Consulting Incentive Pay Practices Survey: Publicly Traded Companies
42
Kimberly Clark Kraft Foods Group L Brands, Inc. Leidos (formerly SAIC) LexisNexis Risk Solutions LG&E Lincoln Financial Group Littelfuse, Inc. Lockheed Martin Corporation Lonza Lowe's Companies, Inc. LSI Luxottica Retail Macy's Inc. ManpowerGroup North America Marathon Petroleum Company Marriott Vacations Worldwide Corporation Meadwestvaco Medtronic Micron Microsoft Corporation Mine Safety Appliances Nautilus, Inc. Neustar, Inc Norfolk Southern Corporation Northrop Grumman Corporation NuStar Energy NXP Semiconductors Office Depot PACCAR Peabody Energy PolyOne Corporation Procter & Gamble Progressive Protiviti PTC QEP Resources, Inc. Questar Corporation Red Robin Regency Centers Republic Airways Holdings Republic Services, Inc. Rexnord Ricoh Rogers Corporation Ryder System, Inc Salo LLC Sanmina Sasol North America Scripps Networks Interactive Sears Holdings Company Silicon Image, Inc. Southern Company
Speedway LLC StanCorp Financial Group STMicroelectronics, Inc SunGard Data Systems SuperValu Talisman Energy USA, Inc. Target Corporation TD Ameritrade Texas Instruments The ADT Corp The Boeing Company The Hanover Insurance Group, Inc. The Northern Trust Company The TJX Companies, Inc. The Walt Disney Co The Wendy's Company Time Warner Cable Tredegar Corporation Trimble Navigation Tyson Foods, Inc Under Armour United Stationers Veolia Water North America Verizon Vistaprint Vulcan Materials Company We Energies Western Union Williams-Sonoma, Inc. WMS YRC Freight