Embed Size (px)
Citation preview
Secretariat of the Convention on Biological Diversity
Incentive measures for the conservation and sustainable use of biological diversityCase studies and lessons learned
56CBD Technical Series No. 56
Incentive measures for the conservation and sustainable use of biological diversity
Case studies and lessons learned
Secretariat of the Convention on Biological Diversity
Montreal
CBD Technical Series No. 56

Secretariat of the Convention on Biological DiversityUnited Nations Environmental Programme413 St. Jacques Street West, Suite 800Montreal, Quebec, Canada H2Y 1N9Phone: +1 (514) 288 2220Fax: +1 (514) 288 6588E-mail: [email protected]: www.cbd.int
© 2011 by the Secretariat of the Convention on Biological DiversityAll rights reserved. Published 2011Printed in CanadaISBN: 92-9225-304-2
The designations employed and the presentation of material in this publication do not imply the expression of any opinion whatsoever on the part of the Secretariat of the Convention on Biological Diversity concerning the legal status of any country, territory, city or area or of its authorities, or concerning the delimitation of its frontiers or boundaries.
This publication may be reproduced for educational or non-profit purposes without special permission from the copyright holders, provided acknowledgement of the source is made. The Secretariat of the Convention would appreciate receiving a copy of the publications that use this document as a source.
Local catalogue record:Incentive measures for the conservation and sustainable use of biological diversity : Case studies and lessons learned / Secretariat of the Convention on Biological Diversity.Summary: “This publication addresses incentives that are harmful for biodiversity, promotes positive incentive measures, and provides case studies, which include good practice cases.”—Provided by publisher. ISBN 92-9225-304-2 Includes bibliographical references.1. Biodiversity conservation – International cooperation. 2. Biodiversity conservation – International cooperation – Case studies. 3. Incentives in conservation of natural resources – International cooperation. 4. Incentives in conservation of natural resources – International cooperation – Case studies.I. Convention on Biological Diversity (1992). II. United Nations. III. Series.QH75 2011
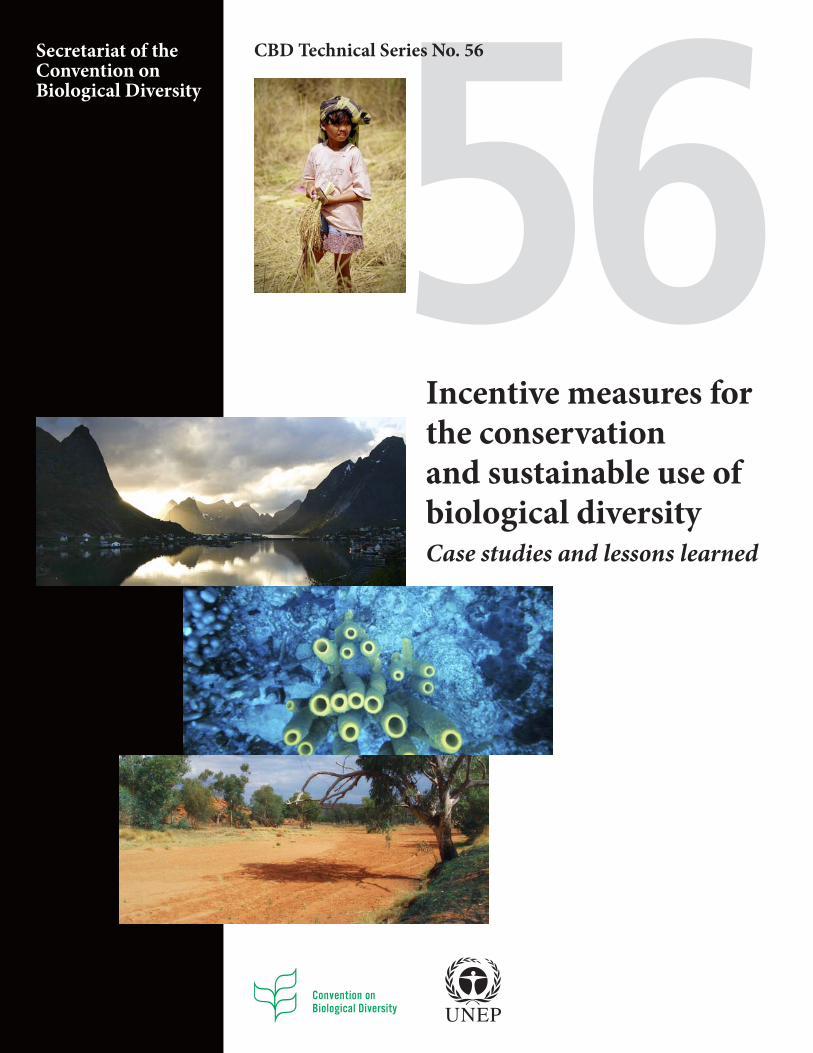
Cover photos courtesy of (top to bottom):Georges Malempré, Woman in Rice Field, Celebs Island, Toraja, Indonesia, 1999. © UNESCO/ Georges Malempré.Svein-Magne Tunli. Traditional Fishing Village, Rein, Norway, May 2007. © Svein-Magne Tunli - www.tunliweb.noAnthony R. Picciolo, Yellow Tube Sponge (Aplysina Fistularis) St. Lucia, Caribbean Sea, August 1988.
© Dr. Anthony R. Picciolo and NOAA NODC.Unattributed. Dry Riverbed, Todd River, Australia, 2006. © freeaussiestock.com.
For further information please contact the Secretariat of the Convention on Biological Diversity
Incentive measures for the conservation and sustainable use of Biological Diversity
TABLE OF CONTENTS
Acknowledgments.. . . . . . . . . . . . . . . . . . . . . . . . . . . . . . . . . . . . . . . . . . . . . . . . . . . . . . . . . . . . . . . . . . . . . . . . . . . . . . . . . . . . . . . . . . . . . . . . . . . . . . . . . . . . . . . . . . . . . . . . . . . . . . . . . . . . . . . . . . . . . . . . . . . . . . . . . . . . . . . . . . . . . . . . . . . . . 4
Foreword. . . . . . . . . . . . . . . . . . . . . . . . . . . . . . . . . . . . . . . . . . . . . . . . . . . . . . . . . . . . . . . . . . . . . . . . . . . . . . . . . . . . . . . . . . . . . . . . . . . . . . . . . . . . . . . . . . . . . . . . . . . . . . . . . . . . . . . . . . . . . . . . . . . . . . . . . . . . . . . . . . . . . . . . . . . . . . . . . . . . . . . . . . . . . . . . . . . . . . . . . . 5
I. INTRODUCTION.. . . . . . . . . . . . . . . . . . . . . . . . . . . . . . . . . . . . . . . . . . . . . . . . . . . . . . . . . . . . . . . . . . . . . . . . . . . . . . . . . . . . . . . . . . . . . . . . . . . . . . . . . . . . . . . . . . . . . . . . . . . . . . . . . . . . . . . . . . . . . . . . . . . . . . . . . . . . . . . . . . . . . . . . . . . . . . . . . 6
II. Addressing incentives that are harmful for biodiversity.. . . . . . . . . . . . . . . . . . . . . . . . . . . . . 7Overview.. . . . . . . . . . . . . . . . . . . . . . . . . . . . . . . . . . . . . . . . . . . . . . . . . . . . . . . . . . . . . . . . . . . . . . . . . . . . . . . . . . . . . . . . . . . . . . . . . . . . . . . . . . . . . . . . . . . . . . . . . . . . . . . . . . . . . . . . . . . . . . . . . . . . . . . . . . . . . . . . . . . . . . . . . . . . . . . . . . . . . . . . . . . . . . . . . . . . . . . . . . 7Environmentally harmful subsidies.. . . . . . . . . . . . . . . . . . . . . . . . . . . . . . . . . . . . . . . . . . . . . . . . . . . . . . . . . . . . . . . . . . . . . . . . . . . . . . . . . . . . . . . . . . . . . . . . . . . . . . . . . . . . . . . . . . . . . . . . . . . . . . . . . . . . . . . . . . . . . . . . . . . 7Other perverse incentives. . . . . . . . . . . . . . . . . . . . . . . . . . . . . . . . . . . . . . . . . . . . . . . . . . . . . . . . . . . . . . . . . . . . . . . . . . . . . . . . . . . . . . . . . . . . . . . . . . . . . . . . . . . . . . . . . . . . . . . . . . . . . . . . . . . . . . . . . . . . . . . . . . . . . . . . . . . . . . . . . . . . . . .10Conclusions and consolidated lessons learned.. . . . . . . . . . . . . . . . . . . . . . . . . . . . . . . . . . . . . . . . . . . . . . . . . . . . . . . . . . . . . . . . . . . . . . . . . . . . . . . . . . . . . . . . . . . . . . . . . . . . . . . . . . . . . . . . . . . . . . . . . . . .12
III. Promoting positive incentive measures.. . . . . . . . . . . . . . . . . . . . . . . . . . . . . . . . . . . . . . . . . . . . . . . . . . . . . . . . . . . . . . . . . . . . . . . . . . . . . . . . . . . . . . . . . . 14Overview.. . . . . . . . . . . . . . . . . . . . . . . . . . . . . . . . . . . . . . . . . . . . . . . . . . . . . . . . . . . . . . . . . . . . . . . . . . . . . . . . . . . . . . . . . . . . . . . . . . . . . . . . . . . . . . . . . . . . . . . . . . . . . . . . . . . . . . . . . . . . . . . . . . . . . . . . . . . . . . . . . . . . . . . . . . . . . . . . . . . . . . . . . . . . . . . . . . . . . . . . .14Direct approaches.. . . . . . . . . . . . . . . . . . . . . . . . . . . . . . . . . . . . . . . . . . . . . . . . . . . . . . . . . . . . . . . . . . . . . . . . . . . . . . . . . . . . . . . . . . . . . . . . . . . . . . . . . . . . . . . . . . . . . . . . . . . . . . . . . . . . . . . . . . . . . . . . . . . . . . . . . . . . . . . . . . . . . . . . . . . . . . . . . . . . . . .14Indirect approaches.. . . . . . . . . . . . . . . . . . . . . . . . . . . . . . . . . . . . . . . . . . . . . . . . . . . . . . . . . . . . . . . . . . . . . . . . . . . . . . . . . . . . . . . . . . . . . . . . . . . . . . . . . . . . . . . . . . . . . . . . . . . . . . . . . . . . . . . . . . . . . . . . . . . . . . . . . . . . . . . . . . . . . . . . . . . . . . . . . . 16Conclusions and consolidated lessons learned.. . . . . . . . . . . . . . . . . . . . . . . . . . . . . . . . . . . . . . . . . . . . . . . . . . . . . . . . . . . . . . . . . . . . . . . . . . . . . . . . . . . . . . . . . . . . . . . . . . . . . . . . . . . . . . . . . . . . . . . . . . . .17
IV. Case studies including good-practice cases.. . . . . . . . . . . . . . . . . . . . . . . . . . . . . . . . . . . . . . . . . . . . . . . . . . . . . . . . . . . . . . . . . . . . . . . . . . 20Identification and removal of incentives harmful for biodiversityAustria.. . . . . . . . . . . . . . . . . . . . . . . . . . . . . . . . . . . . . . . . . . . . . . . . . . . . . . . . . . . . . . . . . . . . . . . . . . . . . . . . . . . . . . . . . . . . . . . . . . . . . . . . . . . . . . . . . . . . . . . . . . . . . . . . . . . . . . . . . . . . . . . . . . . . . . . . . . . . . . . . . . . . . . . . . . . . . . . . . . . . . . . . . . . . . . . . . . . . . . . . . . . . . 20Cambodia.. . . . . . . . . . . . . . . . . . . . . . . . . . . . . . . . . . . . . . . . . . . . . . . . . . . . . . . . . . . . . . . . . . . . . . . . . . . . . . . . . . . . . . . . . . . . . . . . . . . . . . . . . . . . . . . . . . . . . . . . . . . . . . . . . . . . . . . . . . . . . . . . . . . . . . . . . . . . . . . . . . . . . . . . . . . . . . . . . . . . . . . . . . . . . . . . . . . . . . .21Denmark.. . . . . . . . . . . . . . . . . . . . . . . . . . . . . . . . . . . . . . . . . . . . . . . . . . . . . . . . . . . . . . . . . . . . . . . . . . . . . . . . . . . . . . . . . . . . . . . . . . . . . . . . . . . . . . . . . . . . . . . . . . . . . . . . . . . . . . . . . . . . . . . . . . . . . . . . . . . . . . . . . . . . . . . . . . . . . . . . . . . . . . . . . . . . . . . . . . . . . . . . 23European Union.. . . . . . . . . . . . . . . . . . . . . . . . . . . . . . . . . . . . . . . . . . . . . . . . . . . . . . . . . . . . . . . . . . . . . . . . . . . . . . . . . . . . . . . . . . . . . . . . . . . . . . . . . . . . . . . . . . . . . . . . . . . . . . . . . . . . . . . . . . . . . . . . . . . . . . . . . . . . . . . . . . . . . . . . . . . . . . . . . . . . . . . . . 24Ghana. . . . . . . . . . . . . . . . . . . . . . . . . . . . . . . . . . . . . . . . . . . . . . . . . . . . . . . . . . . . . . . . . . . . . . . . . . . . . . . . . . . . . . . . . . . . . . . . . . . . . . . . . . . . . . . . . . . . . . . . . . . . . . . . . . . . . . . . . . . . . . . . . . . . . . . . . . . . . . . . . . . . . . . . . . . . . . . . . . . . . . . . . . . . . . . . . . . . . . . . . . . . . . . 25India. . . . . . . . . . . . . . . . . . . . . . . . . . . . . . . . . . . . . . . . . . . . . . . . . . . . . . . . . . . . . . . . . . . . . . . . . . . . . . . . . . . . . . . . . . . . . . . . . . . . . . . . . . . . . . . . . . . . . . . . . . . . . . . . . . . . . . . . . . . . . . . . . . . . . . . . . . . . . . . . . . . . . . . . . . . . . . . . . . . . . . . . . . . . . . . . . . . . . . . . . . . . . . . . . . 26Indonesia. . . . . . . . . . . . . . . . . . . . . . . . . . . . . . . . . . . . . . . . . . . . . . . . . . . . . . . . . . . . . . . . . . . . . . . . . . . . . . . . . . . . . . . . . . . . . . . . . . . . . . . . . . . . . . . . . . . . . . . . . . . . . . . . . . . . . . . . . . . . . . . . . . . . . . . . . . . . . . . . . . . . . . . . . . . . . . . . . . . . . . . . . . . . . . . . . . . . . . . . 27Namibia.. . . . . . . . . . . . . . . . . . . . . . . . . . . . . . . . . . . . . . . . . . . . . . . . . . . . . . . . . . . . . . . . . . . . . . . . . . . . . . . . . . . . . . . . . . . . . . . . . . . . . . . . . . . . . . . . . . . . . . . . . . . . . . . . . . . . . . . . . . . . . . . . . . . . . . . . . . . . . . . . . . . . . . . . . . . . . . . . . . . . . . . . . . . . . . . . . . . . . . . . . . 28New Zealand.. . . . . . . . . . . . . . . . . . . . . . . . . . . . . . . . . . . . . . . . . . . . . . . . . . . . . . . . . . . . . . . . . . . . . . . . . . . . . . . . . . . . . . . . . . . . . . . . . . . . . . . . . . . . . . . . . . . . . . . . . . . . . . . . . . . . . . . . . . . . . . . . . . . . . . . . . . . . . . . . . . . . . . . . . . . . . . . . . . . . . . . . . . . . . . . . 29Norway.. . . . . . . . . . . . . . . . . . . . . . . . . . . . . . . . . . . . . . . . . . . . . . . . . . . . . . . . . . . . . . . . . . . . . . . . . . . . . . . . . . . . . . . . . . . . . . . . . . . . . . . . . . . . . . . . . . . . . . . . . . . . . . . . . . . . . . . . . . . . . . . . . . . . . . . . . . . . . . . . . . . . . . . . . . . . . . . . . . . . . . . . . . . . . . . . . . . . . . . . . . . . . 31Uganda.. . . . . . . . . . . . . . . . . . . . . . . . . . . . . . . . . . . . . . . . . . . . . . . . . . . . . . . . . . . . . . . . . . . . . . . . . . . . . . . . . . . . . . . . . . . . . . . . . . . . . . . . . . . . . . . . . . . . . . . . . . . . . . . . . . . . . . . . . . . . . . . . . . . . . . . . . . . . . . . . . . . . . . . . . . . . . . . . . . . . . . . . . . . . . . . . . . . . . . . . . . . . 32Positive incentives measuresAustralia.. . . . . . . . . . . . . . . . . . . . . . . . . . . . . . . . . . . . . . . . . . . . . . . . . . . . . . . . . . . . . . . . . . . . . . . . . . . . . . . . . . . . . . . . . . . . . . . . . . . . . . . . . . . . . . . . . . . . . . . . . . . . . . . . . . . . . . . . . . . . . . . . . . . . . . . . . . . . . . . . . . . . . . . . . . . . . . . . . . . . . . . . . . . . . . . . . . . . . . . . . 33Bolivia.. . . . . . . . . . . . . . . . . . . . . . . . . . . . . . . . . . . . . . . . . . . . . . . . . . . . . . . . . . . . . . . . . . . . . . . . . . . . . . . . . . . . . . . . . . . . . . . . . . . . . . . . . . . . . . . . . . . . . . . . . . . . . . . . . . . . . . . . . . . . . . . . . . . . . . . . . . . . . . . . . . . . . . . . . . . . . . . . . . . . . . . . . . . . . . . . . . . . . . . . . . . . . . 36Botswana.. . . . . . . . . . . . . . . . . . . . . . . . . . . . . . . . . . . . . . . . . . . . . . . . . . . . . . . . . . . . . . . . . . . . . . . . . . . . . . . . . . . . . . . . . . . . . . . . . . . . . . . . . . . . . . . . . . . . . . . . . . . . . . . . . . . . . . . . . . . . . . . . . . . . . . . . . . . . . . . . . . . . . . . . . . . . . . . . . . . . . . . . . . . . . . . . . . . . . . . . 38Cameroon.. . . . . . . . . . . . . . . . . . . . . . . . . . . . . . . . . . . . . . . . . . . . . . . . . . . . . . . . . . . . . . . . . . . . . . . . . . . . . . . . . . . . . . . . . . . . . . . . . . . . . . . . . . . . . . . . . . . . . . . . . . . . . . . . . . . . . . . . . . . . . . . . . . . . . . . . . . . . . . . . . . . . . . . . . . . . . . . . . . . . . . . . . . . . . . . . . . . . . . 39Colombia. . . . . . . . . . . . . . . . . . . . . . . . . . . . . . . . . . . . . . . . . . . . . . . . . . . . . . . . . . . . . . . . . . . . . . . . . . . . . . . . . . . . . . . . . . . . . . . . . . . . . . . . . . . . . . . . . . . . . . . . . . . . . . . . . . . . . . . . . . . . . . . . . . . . . . . . . . . . . . . . . . . . . . . . . . . . . . . . . . . . . . . . . . . . . . . . . . . . . . . . 41Costa Rica.. . . . . . . . . . . . . . . . . . . . . . . . . . . . . . . . . . . . . . . . . . . . . . . . . . . . . . . . . . . . . . . . . . . . . . . . . . . . . . . . . . . . . . . . . . . . . . . . . . . . . . . . . . . . . . . . . . . . . . . . . . . . . . . . . . . . . . . . . . . . . . . . . . . . . . . . . . . . . . . . . . . . . . . . . . . . . . . . . . . . . . . . . . . . . . . . . . . . . . 42Cuba.. . . . . . . . . . . . . . . . . . . . . . . . . . . . . . . . . . . . . . . . . . . . . . . . . . . . . . . . . . . . . . . . . . . . . . . . . . . . . . . . . . . . . . . . . . . . . . . . . . . . . . . . . . . . . . . . . . . . . . . . . . . . . . . . . . . . . . . . . . . . . . . . . . . . . . . . . . . . . . . . . . . . . . . . . . . . . . . . . . . . . . . . . . . . . . . . . . . . . . . . . . . . . . . . .44Ecuador.. . . . . . . . . . . . . . . . . . . . . . . . . . . . . . . . . . . . . . . . . . . . . . . . . . . . . . . . . . . . . . . . . . . . . . . . . . . . . . . . . . . . . . . . . . . . . . . . . . . . . . . . . . . . . . . . . . . . . . . . . . . . . . . . . . . . . . . . . . . . . . . . . . . . . . . . . . . . . . . . . . . . . . . . . . . . . . . . . . . . . . . . . . . . . . . . . . . . . . . . . . . 45Egypt.. . . . . . . . . . . . . . . . . . . . . . . . . . . . . . . . . . . . . . . . . . . . . . . . . . . . . . . . . . . . . . . . . . . . . . . . . . . . . . . . . . . . . . . . . . . . . . . . . . . . . . . . . . . . . . . . . . . . . . . . . . . . . . . . . . . . . . . . . . . . . . . . . . . . . . . . . . . . . . . . . . . . . . . . . . . . . . . . . . . . . . . . . . . . . . . . . . . . . . . . . . . . . . . . 47France.. . . . . . . . . . . . . . . . . . . . . . . . . . . . . . . . . . . . . . . . . . . . . . . . . . . . . . . . . . . . . . . . . . . . . . . . . . . . . . . . . . . . . . . . . . . . . . . . . . . . . . . . . . . . . . . . . . . . . . . . . . . . . . . . . . . . . . . . . . . . . . . . . . . . . . . . . . . . . . . . . . . . . . . . . . . . . . . . . . . . . . . . . . . . . . . . . . . . . . . . . . . . . .49India. . . . . . . . . . . . . . . . . . . . . . . . . . . . . . . . . . . . . . . . . . . . . . . . . . . . . . . . . . . . . . . . . . . . . . . . . . . . . . . . . . . . . . . . . . . . . . . . . . . . . . . . . . . . . . . . . . . . . . . . . . . . . . . . . . . . . . . . . . . . . . . . . . . . . . . . . . . . . . . . . . . . . . . . . . . . . . . . . . . . . . . . . . . . . . . . . . . . . . . . . . . . . . . . . . 52Japan.. . . . . . . . . . . . . . . . . . . . . . . . . . . . . . . . . . . . . . . . . . . . . . . . . . . . . . . . . . . . . . . . . . . . . . . . . . . . . . . . . . . . . . . . . . . . . . . . . . . . . . . . . . . . . . . . . . . . . . . . . . . . . . . . . . . . . . . . . . . . . . . . . . . . . . . . . . . . . . . . . . . . . . . . . . . . . . . . . . . . . . . . . . . . . . . . . . . . . . . . . . . . . . . . . 53Mexico.. . . . . . . . . . . . . . . . . . . . . . . . . . . . . . . . . . . . . . . . . . . . . . . . . . . . . . . . . . . . . . . . . . . . . . . . . . . . . . . . . . . . . . . . . . . . . . . . . . . . . . . . . . . . . . . . . . . . . . . . . . . . . . . . . . . . . . . . . . . . . . . . . . . . . . . . . . . . . . . . . . . . . . . . . . . . . . . . . . . . . . . . . . . . . . . . . . . . . . . . . . . . . 55Nepal.. . . . . . . . . . . . . . . . . . . . . . . . . . . . . . . . . . . . . . . . . . . . . . . . . . . . . . . . . . . . . . . . . . . . . . . . . . . . . . . . . . . . . . . . . . . . . . . . . . . . . . . . . . . . . . . . . . . . . . . . . . . . . . . . . . . . . . . . . . . . . . . . . . . . . . . . . . . . . . . . . . . . . . . . . . . . . . . . . . . . . . . . . . . . . . . . . . . . . . . . . . . . . . . . 56Peru.. . . . . . . . . . . . . . . . . . . . . . . . . . . . . . . . . . . . . . . . . . . . . . . . . . . . . . . . . . . . . . . . . . . . . . . . . . . . . . . . . . . . . . . . . . . . . . . . . . . . . . . . . . . . . . . . . . . . . . . . . . . . . . . . . . . . . . . . . . . . . . . . . . . . . . . . . . . . . . . . . . . . . . . . . . . . . . . . . . . . . . . . . . . . . . . . . . . . . . . . . . . . . . . . . . . 58Philippines. . . . . . . . . . . . . . . . . . . . . . . . . . . . . . . . . . . . . . . . . . . . . . . . . . . . . . . . . . . . . . . . . . . . . . . . . . . . . . . . . . . . . . . . . . . . . . . . . . . . . . . . . . . . . . . . . . . . . . . . . . . . . . . . . . . . . . . . . . . . . . . . . . . . . . . . . . . . . . . . . . . . . . . . . . . . . . . . . . . . . . . . . . . . . . . . . . . . . 59Saint Lucia.. . . . . . . . . . . . . . . . . . . . . . . . . . . . . . . . . . . . . . . . . . . . . . . . . . . . . . . . . . . . . . . . . . . . . . . . . . . . . . . . . . . . . . . . . . . . . . . . . . . . . . . . . . . . . . . . . . . . . . . . . . . . . . . . . . . . . . . . . . . . . . . . . . . . . . . . . . . . . . . . . . . . . . . . . . . . . . . . . . . . . . . . . . . . . . . . . . . . .60
References. . . . . . . . . . . . . . . . . . . . . . . . . . . . . . . . . . . . . . . . . . . . . . . . . . . . . . . . . . . . . . . . . . . . . . . . . . . . . . . . . . . . . . . . . . . . . . . . . . . . . . . . . . . . . . . . . . . . . . . . . . . . . . . . . . . . . . . . . . . . . . . . . . . . . . . . . . . . . . . . . . . . . . . . . . . . . . . . . . . . . . . . . . . . . . . . . . . . 61

4 CBD Technical Series No. 56
ACkNOwLEdgmENTS
The participants of the third CBD workshop on incentive measures shared their significant experience and expertise, and provided considerable input into the identification of lessons learned and of the case studies: Ms. Sandra Lucia Aristizabal Buitrago, Mr. Anthony Cox, Mr. Abakar Doungous, Mr. Eduardo Escobedo, Dr. Asish Kumar Ghosh (who also chaired the meeting), Prof. Kiichiro Hayashi, Mr. Ronald Kaggwa Kiragga, Ms. Sylvie Lefranc, Dr. Antonio C. Manila, Mr. Srey Marona, Prof. Anton D. Meister, Ms. Mokgadi Monamati, Mr. Steven Njinyam Ngwa, Ms. Nathalie Olsen, Ms. Marisol Rivera Planter, Dr. Renat Perelet, Dr. Jerzy Pienkowski, Mr. John Reid, Ms. Ala Rotaru, Dr. Helmut Röscheisen, Mr. Patrick ten Brink, Mr. Raul Garrido Vazquez, Ms. Vera Weick, and Ms. Tomme Young.
Invaluable support in reviewing earlier versions of this report, supplying additional and updated information, and/or revising the case studies, was also provided by Mr. Tim Christophersen, Prof. Stefanie Engel, Mr. Atef Gehiny, Ms. Lovisa Hagberg, Dr. Josef Hoppichler, Mr. Finn Katerås, Dr. Kasami Kojima, Ms. Hilde Kyrkjebø, Dr. Daniele Perrot-Maître, Ms. Jutta Stadler, Dr. Charlie Zammit, participants of the Expert Meeting in Preparation of SBSTTA-14, held 15 to 19 March 2010 on the island of Vilm, Germany, as well as several anonymous reviewers.
The report was drafted by Dr. Markus Lehmann and Ms. Nathalie Olsen, with valuable assistance provided by Ms. Namita Kallianpurkar and Ms. Nicole de Paula Domingos.
The support provided by the United Nations Environment Programme (UNEP) and International Union for the Conservation of Nature (IUCN) is gratefully acknowledged.
Last but not least, the Secretariat also wishes to acknowledge the financial support provided by the government of Spain as well as, through UNEP’s trade and biodiversity initiative, by the European Union and Sida.
Incentive measures for the conservation and sustainable use of biological diversity 5
FOrEwOrd
Measures that provide incentives to conserve biodiversity and use its components in a sustain-able manner are increasingly recognized as an important tool to ensure that biodiversity considerations are reflected in all relevant economic sectors — that they are “mainstreamed” across government and society. Contracting Parties to the Convention have identified the absence of such economic incentives as one of the leading causes for the loss of biodiversity and associated ecosystem services that we are currently experiencing — a loss that is ongoing and unprecedented since the dawn of time.
The new Strategic Plan for biodiversity for the period 2011–2020, which was adopted by the Conference of the Parties to the Convention at its tenth meeting, held in Nagoya, Japan, in October 2010, acknowledges that there is now some understanding of the linkages between biodiversity, ecosystem services and human well-being, but also recognizes that the value of biodiversity is still not reflected in broader policies and incentive structures. The Strategic Plan reflects the urgent need to act on incentive measures by calling for the removal, phasing out, or reform, by 2020, of incentives, including subsidies, that are harmful to biodiversity, and for the development and application of positive incentives for the conservation and sustainable use of biodiversity.
Many countries are already reforming harmful incentives and implementing positive incentive measures, often with significant conceptual and financial support of a broad range of international and regional organizations and initiatives. In order to tap into the considerable wealth of practical experience gained in this process, the Convention’s programme of work on incentive measures puts emphasis on enhancing information-sharing on good practices, lessons learned, difficulties encountered, and other practical experience in its implementation. The present publication is the latest product of this work. Initiated at a request of the Conference of the Parties at its ninth meeting, it is the result of the hard work of a group of eminent experts from governments, academia, and relevant national, regional and international organizations and initiatives. It provides key background information on the reform of harmful incentives and the promotion of positive incentive measures, identifies succinct lessons learned, and presents a geographically balanced set of concrete cases.
It is my hope that this publication will make a practical and substantive contribution towards building or enhancing capacities of, and promote common understanding among, practitioners on incentive measures, and towards taking effective and urgent action to halt the loss of biodiversity, as foreseen by the Strategic Plan on biodiversity.
Dr. Ahmed DjoghlafExecutive SecretaryConvention on Biological Diversity
6 CBD Technical Series No. 56
I. INTrOdUCTION
Article 11 of the Convention on Biological Diversity, on incentive measures, creates an obligation for Contracting Parties to, “as far as possible and as appropriate, adopt economically and socially sound measures that act as incentives for the conservation and sustainable use of biological diversity.” The Conference of the Parties at its sixth meeting, in 2001, adopted a programme of work on incentive measures, and the issue has been firmly on the agenda of the Conference of the Parties since then.
The present report is the final output of the third international workshop on incentive measures, which was held from 6 to 8 October 2009, with financial assistance from the Government of Spain, at the premises of the Division of Technology, Industry and Economics of the United National Environment Programme (UNEP-DTIE) in Paris, France. Its task, as requested by the Conference of the Parties at its ninth meeting, was to collect, exchange and analyse information, including case-studies- on, good practices for, and lessons learned from, concrete and practical experiences in identifying and removing or mitigating so-called perverse incentive measures — that is, incentive measures that have harmful effects on biodiversity, and in promoting positive incentive measures, and to identify a limited number of good-practice cases from different regions. 1 The participants in the Workshop were selected from among government-nominated practitioners, taking into account their expertise and the need to ensure balanced geographical distribution, and with due regard to gender balance. Representatives of the following stake-holder organizations and international organizations and initiatives were also attending the meeting: the Scientific and Technical Advisory Panel of the Global Environment Facility (GEF-STAP), the United Nations Conference on Trade and Development (UNCTAD), the United Nations Environment Programme (UNEP), the initiative on the Economics of Ecosystem Services and Biodiversity (TEEB), the International Union for the Conservation of Nature (IUCN), the Organization of Economic Co-operation and Development (OECD), the German League for Nature and Environment (DNR), the Institute for European Environmental Policy (IEEP), and the International Research Institute for Sustainability.2
The report of the workshop was considered by the Subsidiary Body on Scientific, Technical and Technological Advice at its fourteenth meeting, and revised and finalized in accordance with its recommendations.3 The Conference of the Parties at its tenth meeting, in October 2010, subsequently reviewed the report and, by decision X/44, welcomed the work of the workshop and invited Parties and other governments to take it into consideration in their work on incentive measures, bearing in mind that the possible impacts of incentive measures can vary from country to country, in accordance with national circumstances.
The next two sections provide concise key observations as well as critical conclusions and consolidated lessons learned on, respectively, the identification and removal or mitigation of incentives with harmful effects for biodi-versity, and on the promotion of positive incentive measures. Section IV presents case studies, including good practice cases, from different regions.
1 See decision IX/6, paragraph 6.2 See also Annex II of the formal report of the meeting (UNEP/CBD/SBSTTA/14/INF/26), available under www.cbd.int/incentives/documents.shtml.3 See recommendation XIV/14, paragraph 16.
Incentive measures for the conservation and sustainable use of biological diversity 7
II. AddrESSINg INCENTIvES ThAT ArE hArmFUL FOr BIOdIvErSITy
Overview
Incentives that are harmful for biodiversity (or, as they also have been called under the Convention in the past, ‘perverse’ incentives) emanate from policies or practices that induce unsustainable behaviour that destroys biodi-versity, often as unanticipated side-effects of policies designed to attain other objectives. Subsidies with harmful effects on biodiversity are an important example of such perverse incentives. Moreover, perverse incentives may also emanate from some laws or regulations governing resources uses. For instance, many countries had, or still have, “beneficial use” rules that require land holders to make productive use of resources such as water or forests, which may under certain circumstances generate a perverse incentive to continue using the resource in a non-sustainable manner instead of switching to more adapted use patterns. And finally, perverse incentives may sometimes also result from environmental regulations, or from measures that were introduced to act as a positive incentive for the conservation and sustainable use of components of biodiversity. For example, the protection of species living on private land without compensation for habitat provision has, in some case, resulted in efforts to eliminate those protected species.
Environmentally harmful subsidies
Some subsidy types have been identified as critical drivers of activities that are harmful to ecosystems and biodiversity. They negatively impact the environment in two ways.
▶ Under-pricing the use of natural resources. Even without subsidies, the price charged for using natural resources, if any, rarely reflects their real value in terms of the ecosystem services that they provide. However, too low a price leads to over-consumption. This can result from free markets that fail to incorporate negative externalities and from poorly defined property rights (see below). Subsidies can aggravate this problem by reducing the price even further, to below extraction or provisioning cost. Such subsidies often benefit consumers of services (e.g. provision of water and energy at low prices) which can in turn lead to increased production where subsidized resources are used as an input, to excessive consumption, or to outright waste.
▶ Increasing production. Many policies providing subsidies are implemented to support environmentally sensitive sectors e.g. agriculture, fisheries, energy production, transport and heavy industry. Support measures that reduce costs or enhance revenue for producers provide incentives to produce in larger quantities than in the absence of the subsidy. This leads to increased use of possibly polluting inputs (e.g. pesticides, fertilizers) and higher production levels, which in turn aggravates the risk of environmental damage. Subsidies that are not conditional on production or input levels tends to be less environmentally damaging than other support mechanisms, although the overall level of the subsidy is also relevant.
The size of a subsidy does not necessarily reflect the extent of its harmful effect.4 Even relatively small subsidies can have a major negative impact. For example, while the amount of subsidies paid to high seas bottom trawl fleets operating outside the Exclusive Economic Zones (EEZ) of maritime countries is relatively small,5 bottom trawling practices have a major impact on the habitat of deep-sea fish species which, with their long life span and low growth rate, are particularly vulnerable.
4 OECD (2003).5 Around US$152 million/year according to Sumaila et al. (2006).
8 CBD Technical Series No. 56
It is noteworthy that subsidies provided and their effects, including the possible perverse effects for biodiversity conservation and sustainable use, differ largely between countries. It is important to recognize the regionally uneven distribution of subsidies and their effects, particularly regarding developed countries and developing countries. For instance, the overexploitation of fish stocks is partly due to agreements between developing countries and foreign fleets which seek new waters to fish as their over-capitalised national fleets compete for dwindling fish stocks in their own waters. These problems are likely to be exacerbated by changing fish migration pattern associated with climate change. In terrestrial ecosystems, current trends in contract farming also tend to exacerbate the impacts of subsidy regimes.
Existing research suggests that subsidies have a depressing effect on world market prices for primary commodi-ties, to the detriment of agricultural exporters from southern countries. While it is important not to overstate or oversimplify the case of environmentally harmful subsidies, evidence suggests that production-inducing subsidies to agriculture, provided mainly in developed countries, have a negative impact on biodiversity domestically and a negative impact on trade and poverty reduction globally.
The international dimension of subsidy reform needs therefore to be taken into account, bearing in mind that progress can only be achieved if it is helpful to all countries involved. Current negotiations at the World Trade Organization, under the Doha work programme, are important, and in particular the negotiations on domestic support in the agricultural negotiations and the negotiations on fisheries subsidies.
Regarding the environmental harmful effects of certain subsidies, the workshop observed that similar conclusions could be drawn for many OECD and non-OECD countries. While findings would vary from sector to sector and country to country, because of other resource endowments and social outcomes, there is a significant number of examples on environmentally harmful subsidies not just in OECD countries, but also in many non-OECD countries — in particular subsidies to fertilizers and irrigation water. This includes cases of successful identifica-tion and removal or reform (see section IV). Further identifying and removing or mitigating the perverse effects associated with these subsidies is an important area for further work.
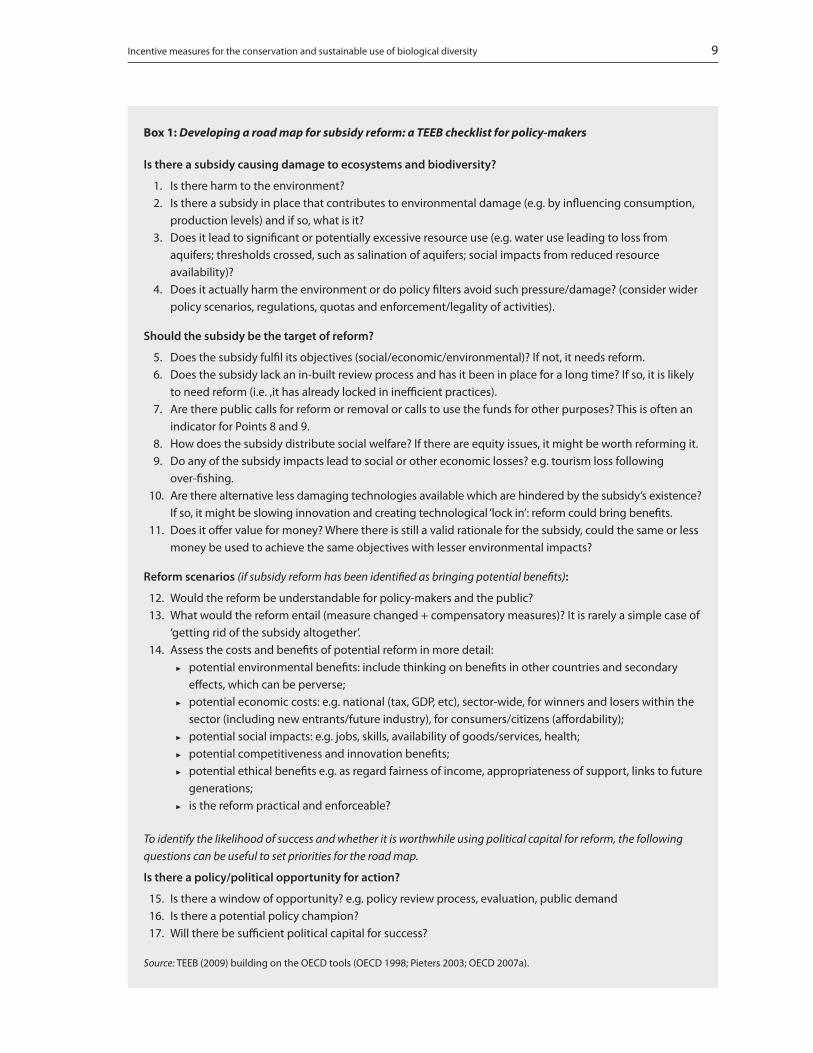
The OECD checklist is a useful tool to address the biodiversity impacts of subsidies. It provides some policy guidance by addressing the question: ‘is the subsidy removal likely to have significant environmental benefits?6 Whenever the checklist delivers a positive result, the integrated assessment methodology7 will help to analyse the effectiveness of the subsidy in a comprehensive manner and to identify alternative policies. (See box 1 for a TEEB synthesis using the OECD tools).
The assessment of subsidies and their effects should not just address environmentally harmful effects, but rather take a multi-criteria, holistic approach, which should also include the cost-effectiveness and the social effects of subsidies. The whole chain of cause and effect matters and could also be addressed through sensitivity analysis. This aim for a more comprehensive review process is useful because:8
▶ the identification and reform or removal of ineffective and inefficient subsidies, even if not environmental harmful as such, can free up considerable funds which could be used for more pressing environmental needs;
▶ For subsidies that are provided to support environmentally-friendly activities, ensuring that these subsidies are targeted and cost-effective will strengthen their case in the eternal tug-of-war over scarce public resources.
6 Pieters (2003).7 OECD (2007).8 See TEEB (2009).
Incentive measures for the conservation and sustainable use of biological diversity 9
Box 1: Developing a road map for subsidy reform: a TEEB checklist for policy-makers
Is there a subsidy causing damage to ecosystems and biodiversity?
1. Is there harm to the environment? 2. Is there a subsidy in place that contributes to environmental damage (e.g. by influencing consumption,
production levels) and if so, what is it? 3. Does it lead to significant or potentially excessive resource use (e.g. water use leading to loss from
aquifers; thresholds crossed, such as salination of aquifers; social impacts from reduced resource availability)?
4. Does it actually harm the environment or do policy filters avoid such pressure/damage? (consider wider policy scenarios, regulations, quotas and enforcement/legality of activities).
Should the subsidy be the target of reform?
5. Does the subsidy fulfil its objectives (social/economic/environmental)? If not, it needs reform. 6. Does the subsidy lack an in-built review process and has it been in place for a long time? If so, it is likely
to need reform (i.e. ,it has already locked in inefficient practices). 7. Are there public calls for reform or removal or calls to use the funds for other purposes? This is often an
indicator for Points 8 and 9. 8. How does the subsidy distribute social welfare? If there are equity issues, it might be worth reforming it. 9. Do any of the subsidy impacts lead to social or other economic losses? e.g. tourism loss following
over-fishing. 10. Are there alternative less damaging technologies available which are hindered by the subsidy’s existence?
If so, it might be slowing innovation and creating technological ‘lock in’: reform could bring benefits. 11. Does it offer value for money? Where there is still a valid rationale for the subsidy, could the same or less
money be used to achieve the same objectives with lesser environmental impacts?
Reform scenarios (if subsidy reform has been identified as bringing potential benefits):
12. Would the reform be understandable for policy-makers and the public? 13. What would the reform entail (measure changed + compensatory measures)? It is rarely a simple case of
‘getting rid of the subsidy altogether’. 14. Assess the costs and benefits of potential reform in more detail:
▶ potential environmental benefits: include thinking on benefits in other countries and secondary effects, which can be perverse;
▶ potential economic costs: e.g. national (tax, GDP, etc), sector-wide, for winners and losers within the sector (including new entrants/future industry), for consumers/citizens (affordability);
▶ potential social impacts: e.g. jobs, skills, availability of goods/services, health; ▶ potential competitiveness and innovation benefits; ▶ potential ethical benefits e.g. as regard fairness of income, appropriateness of support, links to future
generations; ▶ is the reform practical and enforceable?
To identify the likelihood of success and whether it is worthwhile using political capital for reform, the following questions can be useful to set priorities for the road map.
Is there a policy/political opportunity for action?
15. Is there a window of opportunity? e.g. policy review process, evaluation, public demand 16. Is there a potential policy champion? 17. Will there be sufficient political capital for success?
Source: TEEB (2009) building on the OECD tools (OECD 1998; Pieters 2003; OECD 2007a).
10 CBD Technical Series No. 56
Other perverse incentives
In addition to environmentally harmful subsidies, perverse incentives are sometimes also generated by other policies and laws, such as policies and laws governing land and tenure systems. For instance, requirements to remove forest cover have in some countries been a precondition for receiving land title, and such requirements have driven land conversion in a number of countries. ‘Beneficial-use’ laws that threaten “idle” lands with expropria-tion or higher taxes have also encouraged deforestation and subsequent economic activities, even when market forces would dictate otherwise.
As explained above, incentives to overuse natural resources with a subsequent decline in biodiversity can also result from the underpricing of natural resources, due to a failure to incorporate negative external costs into market prices. Under some circumstances, prices can also be corrected by assigning well-defined and stable property rights on certain natural assets, and subsequent trading; for instance in the form of individually transferable quotas (ITQs) in fisheries management (see the case from New Zealand in section IV).
Considerable efforts have been made in a number of countries to remove those perverse incentives; see for instance the cases, summarized in section IV, from Denmark with regard to land-clearing or land use requirements as well as from Cambodia and Uganda for policies that seek to correct prices. In order to substantially improve the state of biodiversity, commentators have underlined that there is frequently a need to combine such efforts with the reform of traditional macro-economic and sectoral policies that encourage the unsustainable use of biodiversity resources. As the case from Uganda shows, this is particularly true if the surrounding socio-economic environ-ment is highly dynamic.
Perverse incentives may also arise from environmental policies and/or regulations. For instance, the establish-ment of protected areas without effective monitoring and enforcement may generate perverse results as adjacent land users or owners — who have no possibilities of acquiring legal titles — have greater incentives to mine the protected resource. Similarly, assigning protection status to species whose habitat is on private land does as such not generate incentives to start using the habitat of the species in a sustainable manner — and, in the case of nuisance wildlife, may even create an incentive to (illegally) remove the species (reactions which are sometimes described as ‘shoot, shovel and shut up’). In consequence, these incentives make enforcement more costly, or may pre-empt effective enforcement altogether.
When policies use pricing instruments, e.g. license or user fees, adverse effects for biodiversity may result if fees are set too low or do not increase with inflation, but also if they are set too high. In Cambodia for instance, the royalty for timber harvesting was initially too low and overharvesting resulted; however, a subsequent reform in the forestry sector raised the fee to very high levels, which was argued in turn to encourage illegal logging. This case shows that economic instruments need to be carefully calibrated to produce the desired effect on harvesting levels.
In response to such perverse incentives, many countries (see as examples the cases from Botswana, Cambodia, India, or Uganda in section IV) have developed policies to strengthen community involvement and capacity in managing natural resources, particularly in protected-area management. Moreover, incentive programmes have compensated local communities for the loss of revenue associated with species protection programmes or rewarded the presence of wild animals on private lands through public payments. Such measures are further examined in the next section.
A number of observations can be made with regard to the removal or mitigation of perverse incentives in general.
Sometimes, perverse incentives are identified and removed or policies reformed but, because of other intervening factors, environmental quality is not improved, or only to a limited extent. Hence, removing or mitigating single perverse incentives may not be sufficient if further distortions exist, for instance in form of macro-economic and sectoral policies that continue to encourage the unsustainable use of biodiversity resources. In these cases, further
Incentive measures for the conservation and sustainable use of biological diversity 11
assessments are needed in order to disentangle the complex relationship between these policies, and to identify the adequate policy response.
Perverse incentives are frequently the un-anticipated result of policies with well-intentioned objectives — for instance, ‘beneficial-use’ laws, as discussed above, seek to promote the productive use of land as a contribution to economic development. In order to avoid adverse effects on biodiversity and ecosystem services, assessments should be undertaken to analyse the implications of new, proposed policies prior to their implementation (for instance in form of strategic impact assessment).
Access to, and the provision of, relevant data is often insufficient, and enhancing transparency is an important step, and critical precondition, for identifying and reforming perverse incentives, in particular environmentally harmful subsidies. The workshop welcomed initiatives taken by countries to enhance transparency, including on subsidies (see the case from the European Union as an example). In this context, there is a need to recognize that OECD subsidy estimates are conservative ones.
Policy guidance that is already available should be put to good use. With regard to environmentally harmful subsidies for instance, the results of the EU Green Paper on the Reform of the Common Fisheries Policy may already be used to develop a credible process towards subsidy reform. With regard to fish exports to the European Union and sustainability in export zones, the Green Paper notes that European fish stocks are so overfished that imports are increasingly coming from outside the EU.
Ad hoc political interventions are sometimes an important barrier to the effective reform of perverse incentives. This is due to the complex nature of the reform process. On the one hand, those benefiting from an existing policy generating perverse incentives will typically resist reform, and such resistance may be effective in particular if the benefits are concentrated in the hands of specific well-organized groups whereas the costs are spread widely across (poorly-organized) taxpayers and sometimes consumers. On the other hand, the removal of such policies can raise legitimate concerns regarding affordability.
The reform of policies generating perverse incentives is also an issue of scale, in particular with regard to social implications. For instance, support to the livelihoods of small and artisanal fisheries may have adverse effects on biodiversity, but may provide a critical source of income. While in the long run, reform can generate new opportuni-ties, individuals and communities may find it difficult to re-orient economic decisions and livelihoods in the short run, in particular without active transition management. Identifying, understanding and adequately responding to, the very real short-term social impacts of reforming policies is one of the most difficult aspects of reform.
There remains an important role for subsidies as they can be a useful tool to protect the environment, if properly designed and targeted towards environmental objectives (see next section). A specific checklist has been developed by UNEP that provides minimum criteria any subsidy should fulfil to prevent it from turning perverse in the long-run (UNEP 2008):
▶ Targeted: Subsidies should go only to those who they are meant for and who deserve to receive them;
▶ Efficient: Subsidies should not undermine incentives for suppliers or consumers to provide or use a service efficiently;
▶ Soundly based: Subsidies should be justified by a thorough analysis of the associated costs and benefits;
▶ Practical: The amount of subsidy should be affordable and it must be possible to administer the subsidy in a low-cost way;
▶ Transparent: The public should be able to see how much a subsidy programme costs and who benefits from it;
12 CBD Technical Series No. 56
▶ Limited in time: Subsidy programmes should have limited duration, preferably set at the outset, so that consumers and producers do not get ‘hooked’ on the subsidies and the cost of the programme does not spiral out of control.
Conclusions and consolidated lessons learned
1. Support provided and its effects differ largely between countries and sectors, and there are be other resource endowments, leading to different biodiversity impacts and social outcomes. There are however generally ample opportunities for identifying and removing or mitigating perverse incentives, both in developed and in developing countries.
2. Reforming perverse incentives, in particular environmentally harmful subsidies, has multiple benefits. It stops encouraging environmentally harmful behaviour, may remove wider economic distortions, and, in case of harmful subsidies, may free up scarce fiscal resources. Moreover, removing or mitigating perverse incentives can reduce the need to introduce positive incentive measures.
3. In some circumstances, establishing property rights can contribute to remove perverse incentives and manage natural resources more sustainably. Procedures for allocating property rights should be transparent — political allocation will not improve resource management. Allowing trade in property rights, like ITQs in fisheries management, can improve efficiency if clearly defined property rights are established and upheld, transaction costs are low, and interested buyers and sellers are numerous enough to allow for regular trade.
4. The reform of perverse incentives has the potential to make a critical contribution to reducing current rates of biodiversity loss. The analytical and policy guidance tools developed by OECD and UNEP (see above) are useful in addressing biodiversity impacts.
5. Assessing the effectiveness of policy reform should be done cautiously. A complex range of factors affect ecosystem conditions simultaneously, and a limited environmental recovery does not necessarily indicate ineffective reform policies, but rather a need for more comprehensive assessments of all relevant policies and their interactions, and more comprehensive policy action.
6. Assessments also need to be extended to new, proposed policies in order to prevent further adverse effects on biodiversity and ecosystem services (strategic impact assessments).
7. A number of lessons learned can be identified on how to organize the removal or mitigation of perverse incentives, including how to address obstacles to reform:
(a) Some sectoral policies create dependency in the targeted sector. Attention should be paid to where vested interests lie, and respond accordingly. The social implications of reform policies must also be taken into account. For instance, an environmentally harmful subsidy may be linked to a resource used in particular by indigenous and local communities and/or marginalized segments of society;
(b) Improved transparency is essential to identify the impacts of policies or regulations that creating perverse incentives, including on their beneficiaries. For environmentally harmful subsidies for instance, enhanced transparency on what amount of subsidies is given to whom can help to better assess how funding alloca-tions affect biodiversity loss, and to mobilize support for subsidy reform. Increasing transparency can also assist in ensuring a policy’s effectiveness against its stated objective, cost efficiency, and minimizing environmental impacts;
(c) A strong leadership and broad coalition based on broad stakeholder engagement, combined with a well-managed process, is necessary to stage reform and take advantage of new opportunities;
Incentive measures for the conservation and sustainable use of biological diversity 13
(d) Improved data and analysis are needed, including more comprehensive assessments on the complex interactions between different programmes and policies. Such assessments can indicate where reforming perverse incentives can remove price distortions that cause overuse of biodiversity or conversion of nature beyond the socially optimal level. This can release funds for positive incentives, or simply alleviate the need for a positive incentive;
(e) Improved communication and coordination among policy/decision-makers, as well as between policy/decision-makers and relevant stakeholders, should showcase the potential benefits of identifying and removing or mitigating perverse incentives, and/or should ensure coherent implementation of reforms at governmental levels.
14 CBD Technical Series No. 56
III. PrOmOTINg POSITIvE INCENTIvE mEASUrES
Overview
Positive incentive measures encourage the achievement of biodiversity-friendly outcomes or support activities that promote the conservation and sustainable use of biodiversity. They can be further differentiated into direct and indirect approaches.9 Direct approaches typically (but not always) provide monetary incentives which seek to emulate market prices — they generally involve ‘paying’ relevant actors to achieve biodiversity-friendly outcomes or, conversely, to not achieve biodiversity-harmful outcomes. Examples include long-term retirement (or set aside) schemes; conservation leases, covenants or easements; and schemes providing payments for ecosystem services. In many countries, such incentives are also generated through the use of breaks on governmental levies such as taxes, fees or tariffs that grant advantages or exemptions for activities that are beneficial for conservation and/or sustainable use.
Indirect approaches seek to support activities or projects that are not designed exclusively to conserve or promote the sustainable use of biodiversity, but have the effect of contributing to these objectives. Many of these incentives are non-monetary (or ‘non-market’) in nature (although they may have financial implications for the provider); for instance, the official recognition of the role of local communities in the context of community-based natural resource management programmes.
Direct approaches
With the recent advent of programmes implementing payments for ecosystem services (PES schemes), direct incentive measures are increasingly applied in both developed and developing countries, in the latter case frequently with the support of multilateral and bilateral donor organizations. Such direct approaches typically involve the acquisition, based on a voluntary programme offered by private or public actors, of certain or all use and develop-ment rights of an area in exchange for a payment, which is in many cases monetary but sometimes also in-kind (see the cases from Ecuador and Japan in section IV).10
The first PES programmes implemented in developing countries formed part of forest conservation initiatives in Latin America, and FAO notes that PES schemes in developing countries are still focused on forest-related ecosystem services.11 Both globally as well as in OECD countries, these monetary positive incentive measures are one of the most frequently used economic instruments in biodiversity management.12 While they are used exten-sively across all policy areas, they are mostly applied in agriculture and forestry. In agriculture for instance, many OECD countries have increased payments under agri-environmental programmes in recent years and, according to OECD, this gives an example of the potential for integrating biodiversity concerns into a broader policy context.13
The increasing application of these schemes can be explained by, inter alia, high enforcement and monitoring costs of regulations and access restrictions.14 Moreover, land users may cooperate more easily when they are offered carrots rather than threatened with sticks.15 However, payments tend to be expensive for tax payers16 and
9 See for instance Ferraro and Kiss (2002), Ferraro and Simpson (2002).10 See the ‘classical’ definition by Wunder (2005): payments for ecosystem services are (a) a voluntary transaction where (b) a well-defined
environmental service (ES) or a land use likely to secure that service (c) is being ‘bought’ by a (minimum one) service buyer (d) from a (minimum one) service provider (e) if and only if the service provider secures service provision (conditionality).
11 FAO (2006), quoting Landell-Mills and Porras (2002). For instance, one of the most notable early programmes, initiated in Costa Rica in 1996, was designed to enhance various forest environmental services.
12 See UNEP/CBD/COP/9/12/Add.1 for an analysis of information on positive incentive measures provided by Parties in their third national reports, as well as OECD (2008) for an analysis of OECD countries.
13 OECD (2009).14 OECD (2008).15 Engel et al. (2008).16 OECD (2008).
Incentive measures for the conservation and sustainable use of biological diversity 15
other risks and limitations were also identified in the literature: (i) they can suffer from a lack of additionality (i.e., paying for activities that would have been conducted anyway); (ii) they can suffer from leakage (i.e., shifting environmentally-damaging activities elsewhere); (iii) they can also create perverse incentives (e.g., inducing an expansion of environmentally destructive activities to obtain higher payments later on); (iv) they may be misused for protectionist purposes.17
Positive incentives are frequently provided in combination with use-restricting regulatory approaches, such as the assignment of protection status to species or areas, thus helping to alleviate enforcement challenges. Examples include payments for wildlife and wildlife-habitat conservation such as the compensation of losses in crop or lifestock due to wildlife, or conservation leases for wildlife-migration corridors. Other examples of positive measures include: performance payments for sustainable agricultural practices regarding endangered species or ecosystem restoration; payments for the use of endangered local varieties; or payments for the improved provision of ecosystem services such as for instance the hydrological services provided by forests.
For many of those payment programmes, targets are defined in the form of a specific practice rather than a specific (measurable) environmental outcome, and the need to improve targeting is a recurrent theme in the literature. While the use of ‘proxy indicators’ is sometimes more practical and easier to monitor, in particular in light of existing deficiencies in biodiversity indicators and associated data sets, it may give rise to a certain lack of effectiveness and also risks to lock-in practices or technologies rather than encouraging innovation and new management techniques.18 The targeting of payments and of tailoring programmes to local conditions and needs proved to be challenging for many payment programmes, in particular in their initial stages — some programmes are now moving towards more differentiated and targeted payments.19 It can be concluded that cost-effective PES programmes require careful design based on the characteristics of the service and the biophysical and socio-economic context.20
Economic instruments (taxes or user fees), possibly coupled with the establishment of earmarked funds, can play an important role in adjusting price signals to appropriate levels and as a source of revenue for ecosystem management, including the funding of positive incentive measures. However, economic instruments are in some cases set too low to effectively change behaviour or to meet financial requirements for resource management. The calibration of economic instruments needs to be improved, both in developing and developed countries, to ensure that prices reflect a resource’s full economic value and the social costs of resource and ecosystem degradation.
Assessing the economic value of biodiversity and ecosystem services, and complementing existing national accounts to reflect depreciation of natural capital, can play an important role in calibrating economic instruments and positive incentive measures for the conservation and sustainable use of biodiversity. Economic valuation can raise awareness about the often unrecognised values of biodiversity and ecosystem services. The initiative on The Economics of Ecosystems and Biodiversity (TEEB) aims to promote understanding and broader application of valuation tools. There is an information gap in this regard between developing and developed countries.
Payment schemes are most effective when seeking to cover, to the extent feasible, all ecosystem services provided by a particular ecosystem. For example, in India, developers are required to compensate the full net present value of forest ecosystems in cases of forest loss or degradation.
In developing countries, negotiations for voluntary PES schemes are typically with the authorities (both formal and traditional), and it is very rare that all voices are heard. This may lead to equity issues as well as limited value of PES
17 Engel et al. (2008).18 OECD (2008).19 Wunder et al. (2008b).20 FAO (2006).
16 CBD Technical Series No. 56
schemes for poverty alleviation objectives. In particular, land ownership plays an important role in designing PES schemes. The allocation of formal land titles may generate important equity effects when introducing such schemes.
While PES schemes can be designed in a pro-poor manner, it is important to recognize that PES schemes are not a poverty alleviation tool. In general terms, FAO concludes that the poor are likely to be affected and implications for them must be considered, and that PES programmes if properly designed have been shown to be potentially accessible and beneficial to the poor.21
In the context of the international discussion on payments for ecosystem services, biodiversity offsets are a tool which is also met with increasing interest. Biodiversity offsets are conservation activities, funded typically by project developers, that are designed to compensate for the residual adverse biodiversity impacts arising from project development and persisting after appropriate prevention and mitigation measures have been implemented. The goal of biodiversity offsets is to achieve no net loss, or preferably a net gain, of biodiversity on the ground with respect to species composition, habitat structure and ecosystem services, including livelihood aspects.22
While biodiversity offsets may be generally a valuable tool for biodiversity conservation, their applicability may be limited in certain situations. For example, some areas with important cultural and ecological values (sacred areas and groves, areas with high levels of endemism) should be off-limits for development and offsets. Furthermore, it is important that offsets should only be considered at the end of the mitigation hierarchy where unavoidable residual impacts remain.
Other issues that need to be addressed and resolved the context of offsets relate to: (i) equivalence (biodiversity values should be the same as those that are offset), (ii) additionality (biodiversity benefits should be a direct result of the offset project), (iii) ratio (the biodiversity benefits of the offset should be greater than the biodiversity costs the offset addresses in order to internalize the risk of offset failure), and (iv) timing/duration (the biodiversity offset is implemented when negative impacts to biodiversity begin, and lasts for the duration of the impacts — the offset is managed in perpetuity if project impacts are permanent). For instance, when the offset activity consists in the restoration of a degraded wetland, these issues would arise because of the important time lags before the wetland ecosystem is restored completely.
Indirect approaches
A number of countries use measures which support activities or projects that are not specifically designed to conserve or promote the sustainable use of biodiversity, but nevertheless contribute to these objectives. Examples of such indirect positive incentives include support to the development or commercialization of biodiversity-based products or services, such as sustainable or eco-tourism in biodiversity-rich regions, or the marketing of biodiver-sity-related goods and services e.g. non-timber forest resources (‘biotrade’). Such market promotion frequently includes non-monetary (or ‘non-market’) means, such as: the removal of barriers to trade; public procurement policies; education and research; or the provision of consumer information through certification and eco-labelling.
Business-driven initiatives, like large retail chains requiring inputs to come from sustainable sources guaranteed through certification and eco-labelling, can play a positive role in providing incentives for conservation and sustainable use. Changing patterns of demand in the pharmaceutical and cosmetic industries, which rely increas-ingly on biodiversity-based products, indicate opportunities to provide biodiversity and ecosystem friendly goods and services. However, there may be limitations — leakage may occur resulting in more harmful effects from products that are not covered by certified products.
21 FAO (2006).22 See for further information the webpage of the Business and Biodiversity Offsets Programme (BBOP): http://bbop.forest-trends.org.
Incentive measures for the conservation and sustainable use of biological diversity 17
The UNCTAD Bio-Trade initiative has developed methodologies and capacity-building activities to enable organi-zations (companies, producers associations and projects) to incorporate sustainable practices within business activities, particularly in the sustainable sourcing of raw material coming from wild-collected species. Biotrade has also contributed to strengthening the capacity of public and academic institutions in facilitating the development of initiatives that sustainably use native biodiversity (see the biotrade case from Nepal in section IV).23
Community-based natural resource management programmes are another type of indirect incentive measure. They rely on the involvement of traditional or local communities in wildlife conservation or sustainable forestry management, often in protected-area management. Evidence suggests that the generation and sharing of revenue with local communities is a key element in these programmes. This may involve the generation of revenue and livelihoods for communities living adjacent to protected areas, for instance through the promotion of eco-tourism in the protected area. In this case, supporting activities include the training of locals as eco-guides (paid partly by entry fees), the provision of food and lodging, and the promotion of local arts and crafts (see cases from Egypt and India) Benefits may be shared through the use and commercialization of genetic resources or traditional knowledge associated with traditional medicinal plants or landraces (see the case from Peru).
Difficult decisions arise in designing and implementing community-based natural resource management in the context of establishing protected areas, in particular with regard to the role of human settlements in protected areas and potential relocation decisions. There is a need to carefully balance objectives of biodiversity conserva-tion and sustainable use, taking into account poverty alleviation and livelihood development objectives. The UNESCO Man and Biosphere Programme (MAB) aims to reconcile protected areas and human settlements and activities in buffer zones.
Community recognition can act as an important non-monetary (or ‘non-market’) incentive, in particular in the context of community-based natural resource management programmes. The involvement and empowerment in natural resource management alone generates awareness and a sense of responsibility, with positive impacts on patterns of natural resource use. Transparency, participation, inclusion and ownership are important factors in the effective empowerment of communities. Collaborative management schemes in Uganda and community based wildlife management in Botswana have ceded control of resources to local communities who are able to use these resources to generate income.
In this context, environmental awards can act as another important non-market incentive. They are frequently used to encourage good corporate and other governance favorable for the conservation and sustainable use of biodiversity. While awards usually have a monetary component, the formal recognition by the community or society alone is an important (non-monetary) incentive for the conservation and sustainable use of biodiversity.
Conclusions and consolidated lessons learned
1. There is a wide range of positive incentive measures available and applied to encourage the conservation and sustainable use of biodiversity. They need to be applied in a flexible manner and tailored to local conditions. One size does not fit all.
2. The measures need to be well targeted. Particular attention needs to be given to defining clear terms of reference including objectives, measurable targets, associated indicators as well as baseline standards or benchmarks for eligibility for the incentive provided. Clear rules and criteria reduce the risk of unexpected reactions by target actors of the programme, with possibly adverse consequences for biodiversity and ecosystem services.
23 See http://www.biotrade.org/ .
18 CBD Technical Series No. 56
3. Assessing the economic value of biodiversity and ecosystem services, and complementing existing national accounts to reflect depreciation of natural capital, can play an important role in better calibrating economic instruments and positive incentive measures for the conservation and sustainable use of biodiversity.
4. The provision of positive incentive measures, whether monetary or not, requires adequate funding. Economic instruments (taxes and/or charges/fees) need to be calibrated carefully so that they can play their role, whenever planned, as a source of revenue for funding the provision of positive incentive measures, while not gener-ating too strong incentives for evasion and illegal resource exploitation. In any case, the effective monitoring of resource extraction operations remains essential even when incentives for sustainable management are provided. Adequate levels of resources are also required to set up effective monitoring systems.
5. A long-term commitment to provide positive incentives is important. Securing long-term financial sustain-ability of positive incentives is critical, since positive effects on biodiversity will require time to take effect and since maintaining these positive effects requires the continuation of policies that encourage environmentally sustainable behaviour.
6. Positive incentive measures are typically complex undertakings, and not necessarily only for financial reasons. They typically involve the building of institutions and trust. The different mandates and interests, and subsequent dynamics, for instance among and between government representatives and stakeholders, must be taken into account.
7. The important relationship between the provision of positive incentives and the removal of perverse incen-tives must be taken into account. The prior removal of perverse incentives will make positive incentives more effective, and can even reduce the need for providing positive incentives.
8. Designers of positive incentive measures need to understand the life-choices of the target groups. If the design of positive incentives does not reflect a sufficient understanding of communities and their relationship with the resources, they run the risk of not achieving their goals and harming already sensitive bonds of trust between communities and formal institutions.
9. Gender issues need to be taken fully into account when designing and implementing positive incentive measures, for instance, the impact of community forestry programmes on rural and forest-dwelling women, through the redistribution of forest resources.
10. In some cases, incentives in kind are more acceptable than cash payments as the perception of a sale of a good or service is avoided. Community or society recognition, for instance by environmental awards, and the raising of awareness of the value of biodiversity and ecosystem services can act as important incentives in their own right.
11. The incentive provided must ensure no loss of income, as there would be no incentive for behavioural change otherwise and as this could also impact the trust built between actors. More generally, equity considerations need to be taken into account, since poverty and widespread inequality often impede biodiversity conservation. In particular, there is a need to recognize that measures such as payments for ecosystem services are not poverty alleviation tools and synergies with social objectives are not automatic. Poverty alleviation measures may, however, generate additional benefits for biodiversity conservation and sustainable use.
12. Some positive incentive measures, such as payments for ecosystem services, can generate additionality issues and leakage, which must be taken into account at the design stage to ensure that they are cost-efficient and effective.
Case studies and lessons learned 19
13. Positive incentive measures can generate perverse effects when not properly designed and implemented. Understanding the relationship between perverse and positive incentives is also important in this context. Applying the guidance developed by UNEP can be useful in this regard (see above).
14. For these reasons, effective monitoring and regular review of incentive measures is essential. Measures should be reviewed regularly to ensure that they have generated the intended impacts in a cost-effective manner and within a reasonable amount of time.
15. Many positive incentive measures are based on the active involvement of traditional or local communities, particularly in the context of community-based natural resource management. In these cases:
(a) Community participation needs to start early and be a long-term commitment. This ensures that incen-tives can be monitored for effectiveness and that the programme gains credibility;
(b) Inputs, whether monetary or non-monetary, have to be sustained to gain the trust and confidence of local people and build credibility;
(c) Benefits do not necessarily need to be monetary — they must be tangible, tailored and appropriately scaled, to maintain stakeholder enthusiasm and to ensure communities to remain committed to the projects;
(d) The responsibility of local people as traditional resource managers must be acknowledged and used, as these communities often have a deeper understanding of how to maintain biodiversity and use it in a sustainable manner;
(e) The devolution of power can pose practical challenges. Local participatory decision-making institu-tions can be fragile and external safeguards to maintain good governance and adequate capacity may be required, as well as possibly continuing external support;
(f) Sustaining the effectiveness of co-management institutions and mechanisms in a high-growth environment, resulting in an ever-increasing pressure on the resource, can amount to a considerable challenge.
16. Capacity is frequently an important bottleneck in designing and implementing effective measures, and it is therefore important to enhance capacity in, and provide training for, the design and implementation of positive incentive measures. Recent efforts to expand university curricula on environmental economics and to build regional programmes and networks24 should be replicated and broadened.
24 E.g., the Latin American and Caribbean Environmental Economics Programme, or the Economy and Environment Programme for Southeast Asia.
20 CBD Technical Series No. 56
Iv. CASE STUdIES INCLUdINg gOOd-PrACTICE CASES
In light of the request of the Conference of the Parties to identify “a limited number” of good-practice cases, the following list is by necessity not comprehensive. The absence of a particular case from the compilation below does not imply that such a case could not also be considered good practice.
Identification and removal of incentives harmful for biodiversity
Austriaremoval of subsidies for wetland drainage
The establishment of the National Park Neusiedler See in Austria was accompanied by a package of incentive measures aimed at supporting the effective management of the protected area and the reedbelt which has been a UNESCO biosphere reserve since 1977. Subsidies for the drainage of wetlands for agricultural cultivation were removed. Additional incentives to promote conversation included: the compensation of owners ceding land, restricting access to hunters (including compensation to hunters with licenses), cessation of stocking the lake with non-native species, and banning the burning of reeds, but promoting the sustainable harvest of reeds.
The policy reform was innovative in that it combined a range of instruments to address competing uses and interests in the area. Establishment of the national park affected over 1500 land owners and negotiations had to address the competing interests/uses associated with agriculture, hunting, fishing, the reed industry, the local population and tourism.
Impact on biodiversity
The area is currently effectively protected. While there is limited quantitative information available on actual measured biodiversity gains, the protection of the threatened ecosystem has resulted in net gains for biodiversity and the ecosystems that benefit people.
replicability
Rather than impose regulation which would have been resisted, the government’s approach was to provide a range of positive incentives, together with subsidy removal, to change the use of natural resources in the National Park. In parallel to the removal of subsidies for the drainage of wetlands, incentives for ecologically sound farming were implemented with the provision of financial resources (lease, compensation, subsidies) for practices conforming to National Park standards. There seems to be promising scope for replicability whenever the reform of pre-existing environmental harmful subsidies can leverage sufficient funds for effectively addressing competing uses and interests in and around the protected area.
Lessons learned
The use of a combination of economic incentives, information dissemination and paying individuals compensation for restricting land use were critical to success.
In a context of falling agricultural prices and increasing intensification of agriculture, the National Park was regarded as a positive economic alternative to agriculture.
Compensation seemed to be necessary, in particular where pressures on biodiversity came from outside Park boundaries.
Sources: Hubacek, K. and W. Bauer (1999).
Case studies and lessons learned 21
CambodiaCorrecting perverse incentives for unsustainable logging and raising royalties on forest exploitation
In many countries, publically owned or controlled resources are inefficiently exploited as a result of operators not paying a price that reflects the full social value of the resources they extract. Cambodia has a long history of conflict and political instability which has had adverse impacts on its forests. Cambodia had in the past charged very low royalty rates for timber concessions, which made commercial logging and processing profitable and attractive for entry and expansion. However, this also encouraged the wastage of valuable timber, over-cutting and the depletion of forests (Karsenty 2000 cited in FAO 2002) Moreover, during the Khmer conflict, both the Khmer and the military logged illegally to finance their operations.
In early 2000, the government undertook important reforms in the forestry sector. Forest concessions had been reintroduced in Cambodia in 1991 in order to (i) bring larger forest areas under active management, and reduce illegal logging; (ii) accelerate the growth of domestic processing of timber and value addition; and (ii) increase royalty revenues while maintaining the existing ban on the export of unprocessed timber (logs). However, conces-sion fees/royalty rates had been set too low in 1991. Under the 2000 reform, royalty fees were raised from 14 to 54 USD per cubic metre of timber, a number of concessions were cancelled, the activities of other concessions curtailed, and logging in protected areas was restricted.
Moreover, logging companies were required to improve forest management, by preparing forest management plans in accordance with international standards, and to renegotiate forest management investment contracts. A Forest Concession Management and Control Pilot Project was implemented in order to strengthen institutional capacity to monitor and regulate forest concession operations.
The 2000 reform maintained the rights of local communities to participate in decisions concerning the allocation of forest concessions, the preparation of forest management plans and the development of systems for monitoring and controlling operations in forest concessions. It required the establishment of a permanent consultative communal committee to facilitate discussions on issues affecting local communities living in or near forest concession areas.
Impact on biodiversity
Overall, the introduction of community forestry has been successful in both improving the livelihoods of forest communities and in protecting forest biodiversity, and, by raising royalties, contributed to maintain government revenue (at 0.5% of GDP an important share of government expenditure). However, the allocation of concessions and the ongoing unsustainable management of concessions, with limited concern for impacts on biodiversity and on local and indigenous communities, are sources of concern and hamper progress in the sector. For example, there has been significant conflict between concessionaires and indigenous communities over the harvest of high value resin trees whose resin provides a significant source of income for many forest communities. Similarly, the existence of spirit forests and spirit trees for local communities has been ignored in granting concessions, as has the identification of forests of high ecological value.
Deforestation increased from 1.09 percent per annum in 1990–2000 to 1.90 percent from 2000–05. While this is in large part due to the large share of logging which is illegal and therefore not affected by the reforms listed above, it has also been argued that the royalty rate was set too high and that, as a result, companies which had previously logged in concessions may have begun to log illegally to avoid high royalty fees.
replicability
Many countries struggle to manage forests sustainably and to balance the need for income and growth in the sector with the needs and rights of local communities and the maintenance of biodiversity. Cambodia’s reform efforts were successful to some extent although illegal logging, unsustainable timber extraction and negative impacts on local communities and on biodiversity are still challenges.
22 CBD Technical Series No. 56
Lessons learned
Royalties for the use of natural resources are frequently set too low, but setting them too high is also bad policy as it encourages illegal resource extraction.
The continued problem of illegal logging suggests that reforming concession policies, charges and management in the forest sector is not sufficient to improve the overall environmental performance of the sector, in particular when not accompanied by effective monitoring and enforcement.
The identification of all stakeholders and the distribution of the costs and benefits of policy reform are essential for successful reform of perverse incentives and the development of incentives at all levels that encourage sustain-able and equitable resource use.
Sources: Kim Phat, N., Ouk, S., Uozumi, Y., and Ueki, T. (2001); FAO (2002 and 2005); World Bank (2005 and 2006).

Case studies and lessons learned 23
Denmarkremoval of perverse incentives in the forest sector
Denmark is a forest-poor country with a long-standing national commitment to increase forest cover. A national Strategy for Natural Forests and Other Types of Forests with High Conservation Value in Denmark was launched in 1992. A prerequisite for its successful implementation was to include both public and privately owned areas. Privately owned forest areas in Denmark contain a high level of biodiversity as these areas are often among the most untouched forests in Denmark. Private forest owners had conserved natural forests in the past, but in many cases were no longer able or willing to continue covering the costs of managing forests for biodiversity rather than for timber production on their own.
One regulation, contained in the Forest Act of 1989, had been a major source of forest degradation for many years. This provision made it illegal to leave areas of potentially productive forest ‘unproductive’, and consequently created a strong disincentive for ‘unproductive’ conservation activities — in fact, it created a perverse incentive to deforest in order to maintain land rights. The reform of this requirement was a key element in the efforts to increase the area of natural forests in Denmark. By allowing exemptions from the Forest Act, it became possible for private forest owners to protect natural forests and other forests with high biodiversity content as non-inventory (untouched) forest.
Complementary to the removal of this perverse incentive, positive measures were introduced in order to promote expansion of forests on private land. These included a special grant-scheme to compensate for the direct financial losses associated with the set aside of untouched forests on private land and to finance the costs of any special management required. The government also combined grants for reforestation and compensation for the voluntary conversion of private forests into strictly protected reserves.
Impact on biodiversity
The system of grant-aid for untouched forest was introduced in 1994 and has been assessed to have been very effective in creating incentives for the transformation of cultivated forest areas into untouched forest areas (6,500 hectares in 2000). While no targeted assessment of biodiversity per se has been undertaken, biodiversity has most likely benefitted significantly by increasing the area of natural protected forest.
replicability
This case should be replicable in countries where there is significant private ownership of forest resources, a national commitment to maintain or increase forest cover, and sufficient financial resources available for compensation.
Lessons learned
The policy measures addressed forest holdings on both public and private land. The success of policy reform is increased when a package of policy measures is adopted with different tools targeted at different stakeholders.
Broad political support for this reform was contingent on the fact that the scheme was voluntary, reflecting the limitations as regards the level and degree of regulation that landholders are ready to accept on their private property.
Sources: OECD (1999); Strange et al. (2004).
24 CBD Technical Series No. 56
European UnionEnhanced transparency on subsidy measures in the European Union and its member States
Enhancing the transparency of subsidy programmes has been recognized as an important prerequisite for effectively removing or reforming environmentally harmful subsidies and, promoted by important regional instruments such as the UNECE Convention on Access to Information, Public Participation in Decision-making and Access to Justice (Aarhus Convention), and European Regulation 1049/2001 regarding public access to European Parliament, Council and Commission documents, a number of governments had already taken steps to publicly disclose information on their subsidy programmes. The European Commission, in its 2006 Green Paper on the European Transparency Initiative, proposed the mandatory disclosure of beneficiaries of EU funds by the Member States, such as structural funds and agriculture and fisheries subsidies, arguing that beneficiaries of EU funds receive money to fulfil public policy objectives, and that EU citizens are therefore entitled to information on who receives how much. A EU regulation agreed in December 2006 requires ‘adequate ex-post disclosure’ of the recipients of all EU funds, with agricultural spending transparency to begin in the 2008 budget.
Compliance of Member States with the regulation is still uneven; and concerns have been raised in particular with regard to inconsistent data formats, including sometimes insufficient levels of disaggregation, and a general lack of user-friendliness, due to the fact that the information provided is scattered across websites operated by the Member States and provided under different standards and different formats, some of which are not searchable by electronic means. However, the regulation, together with the instruments referenced above, has spurred important watchdog initiatives such as farmsubsidy.org, caphealthcheck.eu or fishsubsidy.org, which seek to closely monitor compliance by EU Member States and assess the quality of the released data. These initiatives also develop and provide search engines to better use the raw data supplied by the Commission and the EU Member States.
Impact on biodiversity
It is expected that transparency in allocation of funds to the agriculture and fisheries sectors will increase awareness of both decision-makers and the general public on the effects of these subsidies and their effectiveness in reaching stated targets and, consequently, increase pressures for reform of environmentally harmful subsidies.
replicability
Improved transparency in policy making has already been sought by many governments and financing agencies to promote the efficiency and equity of the allocation of national, regional and global financial resources, in particular with regard to the beneficiaries of subsidy programmes. Assessing the precise scope for replicability would require a careful analysis of these efforts but they should be replicable in particular when the existing legal, institutional and administrative framework already promotes transparency in national policy and decision making (e.g. through general access to information requirements, and/or the existence of watchdog organizations).
Lessons learned
Minimum requirements on data types, standards and formats of disclosed information can be helpful for achieving user-friendly access to information.
Source TEEB (2009).
Case studies and lessons learned 25
Ghanaremoval of fuel subsidies
In 2004, faced with persistently high oil prices, Ghana experienced serious fiscal constraints and was forced to discontinue subsidizing petroleum products. The government launched a poverty and social impact assessment (PSIA) for fuel, including all stakeholders. The PSIA found that price subsidies predominantly benefitted the better-off in society. When the government eliminated fuel subsidies in 2005 and set price ceilings in line with world prices, leading to a 50 percent price increase in fuel, the government simultaneously launched a campaign explaining the need for price rises and announcing mitigation measures. These measures included the elimina-tion of government run primary and junior secondary school fees and a programme to improve public transport. As a result of adequate compensation measures, the transparency of the process of removing subsidies and the public information campaign, the public generally accepted the measures despite opposition from trade unions.
Further developments illustrate that policy reform is an ongoing process rather than an on-off activity. When the population was faced with high food and energy prices from 2006 to 2008, the government was forced to intervene to keep prices at acceptable levels. Facing high and increasing fuel and food prices, Ghana froze price ceilings between May and November 2008, and also introduced mitigation measures focusing on energy conservation. Ghana continued to reduce fuel taxes even after the oil price collapsed in late 2008, lowering fuel taxes in March 2009 as part of a pledge to alleviate the financial burden on its citizens (Kojima 2009, Ghana News 2009 quoted in Kojima 2009). However the financial burden of keeping fuel prices low has been so great that Ghana was forced to close its refinery from February to October 2009 due to high levels of debt (Reuters, 29.10.2009).
Impact on biodiversity
The impact of removing fuel subsidies on biodiversity is indirect working through the links between fuel subsidies increasing fuel consumption increasing GHG emissions and pollution with negative effects on biodiversity via the negative impacts of climate change and contamination of ecosystems from pollution. Moreover, investment in transport-related infrastructure in economies which have fuel subsidies will be greater than is socially optimal and results in too much conversion of natural areas and in habitat fragmentation.
replicability
Experience has shown that removing fuel subsidies is difficult due to vested interests which resist reform. The early positive experience of Ghana suggests that making the public aware of precisely who benefits from fuel subsidies can be critical for minimizing resistance from vested interests. Successful elements of this strategy can also be found in the Indonesia case.
Lessons learned
Policies aiming at reducing or removing subsidies can be more effective if the public understands who is receiving the subsidy and how much.
Compensatory spending should be transparent, immediate, effective and pro-poor.
Sources: ESMAP (Energy Sector Management Assistance Programme) (2006) cited in Bacon and Kojima (2006); Bacon and Kojima (2006); Kojima (2009).
26 CBD Technical Series No. 56
Indiareform of subsidy for chemical fertilizer
In India, large areas of farmland have become barren due to excessive use of a single fertilizer, urea. A recent reform of the fertilizer pricing policy seeks to remedy this problem. The existing subsidy regime was skewed in favour of urea and consequently led to urea overuse by farmers to the detriment of other essential nutrients. Moreover, it was very expensive as the subsidy was offered at a uniform rate irrespective of varying costs of production.
In February 2009, the Indian Cabinet decided to relax controls on the prices of fertilizers, with the exception of urea, whose price was increased by 10 percent. By partially liberalising the prices of potassic (K) and phosphate (P) fertilizers, while still maintaining control through a more flexible subsidy regime, the government seeks to keep the relative prices of these nutrients low compared to urea, and to induce farmers to use more P, K and micro-nutrient based fertilizers.
Under the new Nutrient Based Subsidy Scheme (NBS), subsidies for the period 2010–11 will now be fixed on the basis of the concentration of each nutrient, N (nitrogen), P (phosphate), K (potash) and S (sulphur). The amount of the subsidy is to be worked out with regard to international prices and the need to avoid domestic price shocks to the agriculture sector and to food consumers. In addition, the new policy allows fertilizer manufacturers to mix nutrients needed for different kinds of soil and to sell them as separate products.
The government expects the new scheme to encourage fertilizer firms to offer more competitive prices based on the costs of production. In fiscal terms, the government hopes to dramatically reduce expenditure on fertilizer subsidies.
The financial impact on farmers will be minimised as the fertiliser industry will be incited to design more efficient products choosing the right combination of nutrients. It is expected that the increased efficiency of fertiliser at farm level should compensate for the reduced subsidy and the higher cost of fertiliser to farmers — that is, farmers should be able to use less fertiliser because by being more targeted to local conditions, fertiliser use will be more effective. In addition, the Department of Finance is considering giving the Nutrient Based Subsidy only to targeted segments of the population, that is, small and marginal farmers. However, in the current transition phase of subsidy reform, all farmers will receive the new type of subsidy.
Impact on biodiversity
The new policy is intended to protect biodiversity and agricultural biodiversity in particular, by encouraging more appropriate and balanced fertilizer use and thereby maintaining soil biodiversity (bacteria, earthworm, micro-arthropods). In light of the continuing need to maintain and increase agricultural productivity, the aim is not to reduce fertiliser consumption as such — as the government has argued that fertilizer consumption in India, despite historically high subsidy levels, remains comparatively low (at 113 kg per hectare compared to, for instance, 289 kg per hectare in China).
Source: Ghosh, A. (2009).
Case studies and lessons learned 27
Indonesiaremoval of pesticide subsidies
As a low income country with a large and fast-growing population, Indonesia has traditionally put high priority on achieving growth in agricultural output and rice self-sufficiency. To this end, agricultural policy promoted the use of high-yielding varieties and pesticides via direct subsidies on pesticide sales, government spraying and favourable credit packages.
The heavy use of pesticides caused considerable harm to the environment, to human health and ultimately to rice production itself. By the mid-eighties, a drop in rice production had been observed resulting from the overuse of pesticides which had wiped out the natural enemies of many pests, including the brown rice planthopper. US$1.5 billion worth of damage to the rice sector resulted directly from pest infestations.
Further triggered by the oil shock in 1986 and the subsequent strain on the public budget, Indonesia has signifi-cantly reduced support to agriculture including:
▶ the removal of pesticide subsidies in 1986, combined with a ban on the import of broad spectrum pesticides in 1986; and
▶ the removal of fertilizer subsidies in 1998.
Following pesticide subsidy removal in 1986, pesticide applications halved while rice production grew by three million tons over four years. A well-funded and widely disseminated national programme of Integrated Pest Management (IPM) was a critical factor in the maintenance of rice production and farm incomes. An additional benefit was the US$100 million fiscal saving resulting from subsidy elimination.
Impact on biodiversity
The reduced use of pesticides is thought to have reduced the flow of toxins to the environment and their negative impact on biodiversity and human health.
replicability
This experience suggests that subsidy removal is feasible even when there is strong opposition from some stake-holders. Subsidy removal was undertaken at the same time as a national programme of integrated pest management (IPM) was implemented. In parallel, agricultural research and extension was decentralized from national to province level. The financial stress associated with declining oil prices after 1984 provided further justification for cuts to government budgets.
Lessons learned
Fiscal crises often present opportunities and strong arguments for subsidy removal that facilitate reform at a political level.
Subsidy removal may generate fiscal as well as environmental benefits. In this case, the treasury saved over US$100 million per year from subsidy removal while the IPM programme cost roughly US$5 million per year.
Subsidy reform coupled with supporting institutional changes is more likely to succeed. Pesticide subsidy removal occurred at the same time as adoption of IPM as a national policy and the decentralization of many government functions, including agricultural extension.
The adoption of integrated pest management as a national policy provided farmers with information and tools to maintain (and increase) rice production thereby minimizing the potential costs of subsidy removal to certain stakeholders while maintaining national food security.
Sources: Moor and Calamai (1997); Pasandaran et al. (2003); World Bank (1997, 2005).
28 CBD Technical Series No. 56
NamibiaIntroducing sustainable fisheries management
Prior to independence, Namibia’s coastal waters were heavily overfished due to uncontrolled access allowing distant water fleets to fish beyond catch limits. At independence in 1990, the new government introduced a fisheries policy including new legal and management frameworks. One of the first acts of the new Parliament was to declare Namibia’s 200 mile Exclusive Economic Zone (EEZ). A system of fishing rights was introduced to limit entry to the fisheries sector within the EEZ. All vessels had to obtain a license to fish within the EEZ. Total Allowable Catches (TAC) were set each year based on the best available scientific evidence. The TAC was distributed among rights-holders in the form of non-transferable quotas.
Implementation of the new policies and the EEZ was effective and based on a rigorous system of monitoring, control, and surveillance. The monitoring system included dockside monitoring of all landings, the placement of observers on most major vessels (costs are charged to the industry) and deployment of three fisheries patrol vessels, an aircraft, and a helicopter. As a result, foreign trawlers were prosecuted for illegal fishing and illegal, unreported and unregulated (IUU) has declined dramatically. The fisheries sector is currently more than 90 percent Namibian owned and processing fish domestically has created value added and employment. Revenue from licences and quotas is used to finance the state of the art monitoring, control and surveillance system.
Rather than introduce subsidies to encourage national capacity in the fisheries sector after independence, Namibia used taxation, particularly quota fees in the context of a rights-based system. It has been argued that the imple-mentation of a rights-based system has led to larger fish stocks, improved compliance, and an efficient industry that supports the sound management of fish stocks and earns healthy profits (Nichols 2004). Moreover, limiting access to the resource for each participant has allowed the government to extract some of the profits in the sector, which have been channelled back into the sector.
Impact on biodiversity
The recovery of fish stocks has been variable, with some stock recovering well (hake and horse mackerel) while others, despite reduced harvesting levels, are adversely affected, due to other environmental factors (sardines).
replicability
Namibia has successfully reformed the management of fish stocks and focused on developing the fishery sector as a national asset in terms of sound management of fish stocks and promoting national employment in the sector via domestic fishing effort and processing. The legal framework exists for other countries to follow suit — however, sustainable management of the fisheries sector requires institutional capacity to effectively implement sound management practices.
Lessons learned
Resources and technology are essential to set up effective monitoring, control and surveillance systems which are essential to manage fishing effort and harvest at sustainable levels. In general, sound fisheries management requires sufficient resources and political will.
Management strategies need to be refined to cope with the impact of environmental conditions on fish stocks.
Sustainable marine resource management relies on collaboration with neighbouring states (in this case, Angola and South Africa). International collaboration can still be improved as can the consultative process between the Government, industry and other stakeholders.
Sources: Kashindi, M. (1999); Nichols, P. (2004); World Bank (2005).
Case studies and lessons learned 29
New Zealandremoval of agricultural and fisheries subsidies
The economy of New Zealand has historically been highly dependent on agriculture and food exports. Prior to 1984, agriculture was heavily protected via subsidies and price and income support. Protection led to market distortions, over- production and degradation of marginal lands. Subsidies encouraged large areas of marginal land to be brought into production and by 1984 over two million hectares of marginal land were being farmed only because subsidies made it profitable. Production no longer matched demand as subsidy-based production soared; the government paid for the slaughter of sheep that could not be sold and in 1983, 6,000 tons of surplus sheep meat was turned into fertilizer. By 1984, agricultural output was worth less than the costs of producing and processing it.
In 1984, the government faced a severe fiscal crisis and implemented an ambitious deregulation programme, which also included devaluation and subsequent floating of the New Zealand dollar and the liberalization of capital markets.
As part of this economy-wide reform, the government removed all agricultural subsidies (price support for wool, beef, sheep meat and dairy products, income support, fertilizer, irrigation, transport and land develop-ment subsidies). Tax concessions and free government services for farmers were eliminated. Producer Boards lost access to concessionary Reserve Bank funding. Land development loans, fertilizer and irrigation subsidies, and subsidized credit were reduced and eventually phased out after 1987, as was assistance for flood control, soil conservation, and drainage schemes.
In 1986, New Zealand removed all subsidies to the fishing industry. The financial and social distress that would have been caused by the virtually overnight subsidy removal was dampened by a major change in fishery management regime. Rights based management was introduced along with a system of individual transferable quotas (ITQs) and a buy-out of existing rights. The improved management of the fishery sector provided those who wished to remain in the newly unsubsidised, efficiency-focused fishery sector with the opportunity to do so while those who wished to leave were compensated through buy-out payments.
Sectoral adjustment in the agriculture sector took seven years, but the government supported the farming sector through the transition with loan restructuring and social welfare payments. Farm land prices fell by 60 percent and fertiliser used declined by 50 percent. Approximately 1 percent of farmers left farming. The number of sheep fell sharply from 70 million in 1983 to 40 million in 2004; by 2007 there were 31 percent fewer sheep and beef farms.
By 1995, farm land prices had recovered to 86 percent of their pre-reform levels. Today, the agriculture sector is larger than when it was heavily supported; it is more profitable, efficient and innovative. The meat industry has developed from the least efficient to the second most efficient in the world. Employment in the sector has actually increased. The rural economy has diversified to include tourism and other services which have made rural communities less vulnerable to cyclical downturns in agriculture. The support of farmers’ organizations and consumer groups contributed greatly to reform success.
Impact on biodiversity
Reform had a positive impact on biodiversity by reducing the use of fertilizers and pesticides, decreasing pollution levels in rivers and reducing the farming of marginal land. There was a halt to land clearance and overstocking, which had been major causes of high levels of soil erosion. Livestock production has now been intensified on better land rather than hills prone to erosion, and hills have been reforested leading to a 50 percent increase in area under plantations.
30 CBD Technical Series No. 56
It should be noted however, that agriculture in New Zealand has in recent years intensified significantly, especially in the dairy sector, which has caused renewed concerns about pollution and loss of biodiversity.
In the fisheries sector, as a result of both subsidy removal and the introduction of the new management regime, fish stocks were managed more effectively and in some cases recovered from overexploitation.
replicability
The success of New Zealand’s reform provides encouraging evidence that it is possible to reform policies in economic sectors of critical importance in terms of contribution to GDP, employment and foreign exchange. However, New Zealand is a small, isolated, relatively homogeneous, well-educated, and affluent society, which may have helped win political support with arguments based on the fiscal crisis and the need for sustainability.
Lessons learned
The existence of a fiscal crisis required cuts in government expenditure and provided justification for reductions in financial support to the agriculture and fisheries sectors.
Involvement of stakeholders, farmers and fishers, at early stage of the reform process and in decision-making greatly improves the likelihood of acceptance and success.
Removal of subsidies must be implemented within an agreed and transparent timetable. Certainty of reform, its scope and pace is essential for success. Farmers and fishers were given sufficient information about the pace, breadth and depth of reform.
Farmers and fishers can adapt to lower support and increase profitability, particularly if they and others believe that government will not make a U-turn on policy reform.
Adjustment takes time. Although farmers and fishers acted quickly to improve profitability in New Zealand, it took considerably longer for economic growth to return and for unemployment to subside.
During the adjustment period, there is an important role for government assistance measures, decoupled from production decisions, to support household consumption.
Agricultural reforms can have a positive environmental impact. In New Zealand, subsidies encouraged the use of marginal land, higher stocking rates and the overuse of fertilizers. With the removal of support, production has become more extensive, chemical use has declined, and marginal land has been taken out of production.
Sources: Myers and Kent (1998); OECD (2006) and (2007); Ray and Blandford (2004); TEEB (2009); Vitalis (2007).

Case studies and lessons learned 31
NorwaySignificant reduction of fisheries subsidies
Between 1981 and 1994, Norway reduced subsidies to fisheries by 85 percent from US$ 150 million to US$ 30 million. More effective management measures were adopted simultaneously and have helped the sector to become self-supporting. The reduction in subsidies occurred at a time when Norway was under financial pressure from falling oil prices. Moreover, significant external political pressure to reduce direct price support to fisheries was also associated with the development of multilateral agreements, namely, the Oporto Agreement on the European Economic Area, which was signed in 1992 between the Member States of the European Union and of the European Free Trade Association (EFTA).
The successful reduction in subsidies has been attributed to a number of factors. First, the timing of the reform was important — subsidy reduction occurred in the context of falling oil prices which reduced government revenues and encouraged political support for reform by convincing stakeholders of the need for fiscal restraint. Second, various measures to reduce capacity and to increase the productivity of the industry had been developed and implemented in the last decades. Compensation in the form of publicly-financed programmes for decommis-sioning fishing vessels in both the ocean-going and coastal fishing fleet were used up to the 1980s and allowed the fishing fleet to downsize without significant negative impacts on local livelihoods. From the 1980s and onwards various consolidation schemes based on consolidation of license capacity were implemented. These schemes have in effect been privately financed efficiency programmes.
The current structural quota system is designed to take economic considerations into account, and to provide for a profitable fishing fleet. Harvest capacity is primarily an economic issue if output is strictly controlled. Regional considerations are also an important part of Norwegian fisheries policies. Some restrictions are therefore imple-mented including maximum quotas, geographically limited markets, transactions only within the vessel groups, and scrapping requirements.
Impact on biodiversity
Existing evidence suggests that subsidies in the 1970s and 1980s promoted higher levels of exploitation and a decline in fish stocks. While this effect has been estimated to not be very strong, this is largely due to its dissipation in a common-pool resource: it is generally difficult to detect the impact of one country’s fishing effort on fish stocks when fish stocks are affected by the exploitation of other countries and by exogenous environmental factors as well.
replicability
Subsidies to the fishery sector were completely removed in New Zealand. The more gradual approach to fisheries subsidies reform taken by Norway (compared with the brisker pace taken by New Zealand) suggests that there is scope for the replication of reform policies even when the political opportunities for swift reform do not arise.
Sources: OECD (2006); The Norwegian Ministry of Fisheries and Coastal Affairs (2010).

32 CBD Technical Series No. 56
UgandaCorrecting the undervaluation of property rights in fisheries
With a fish population density of between 47,000 and 55,000 fish/hectare, and a fish biomass of 23.5 t/km2, Lake
George was considered, in the late 1960s, being the most productive lake in Africa and perhaps in the world. Located in the Queen Elizabeth Protected Area, it is known for its flagship bird species such as the Shoebill Balaeniceps rex, and it became the first Ramsar site in Uganda because of its rich biological diversity.
The lake has supported livelihoods and licenced commercial fisheries since the 1950s. By the end-1990s, Lake George was severely overfished resulting in de declining volumes of catch and average fish catch size. Overfishing was attributed to the undervaluation of prices charged for the 145 fishing licenses for Lake George issued each year, as well as to illegal fishing. Limited monitoring and enforcement capacity was a direct result of the insufficient revenue collected via the license fee. The lack of resources for effective monitoring was aggravated by the lack of institutional mechanisms for the local communities to support in enforcement initiatives. As a result, illegal fishing — both by licensed and non- licensed fishermen — was widespread, with the number of canoes fishing in the lake being three times the permitted number.
To remedy the situation, a reform in 1998 introduced the co-management of local fishing communities by establishing Beach Management Units (BMUs) which are financed by retaining 25 percent of revenues from the issuance of fish movement permits at the landing sites. A lake-wide organization called Lake George Integrated Management Organisation (LAGBIMO) was established with a view to harmonise fishing practices across the BMUs and to provide a framework for coordination and coherence in policy planning and implementation. It is composed of representatives of the BMUs and of local governments. Moreover, the number of licenses was significantly increased — from 142 to 326 in 2001.
The higher revenue from the licenses and the landing fees allowed more effective monitoring and enforcement. Together with the co-management implemented, this temporarily reduced the number of illegal fishermen operating on the lake and created incentives for legally licensed fishermen to stop illegal fishing (out of season, at night).
In the past years, illegal fishing and the utilization of illegal gear has increased again and constitutes an ever more serious challenge to the resource, including severe negative impacts on landing volumes in recent years. The increasing pressure on the resource has to be understood against the backdrop of a dramatically growing fisheries sector in the last decade in Uganda, with export revenues increasing from US-$ 400,000 in 1998 to over US-$ 145m in 2008. According to the government, due to overfishing and a decline in fish production from natural stocks, the Uganda fishery sector is currently facing a crisis. In order to address this crisis, measures currently under consideration or already being implemented include: (i) the temporary closure of fisheries in order to allow the resource to recover; (ii) enhanced monitoring and enforcement (e.g., through the issuance of license plates for fishing vessels); (iii) further productivity increases by promoting aquaculture (currently non-developed).
Lessons learned
Incentive-based instruments must be regularly reviewed for continued relevance, efficiency and cost-effectiveness. Special effort needs to ensure that fiscal instruments are calibrated to ensure that prices continue to reflect the resource’s true economic value and the real cost of resource and ecosystem degradation.
The establishment of co-management institutions and of mechanisms to sustain monitoring and enforcement expenditures is generally recognized as good practice. However, in the context of a high-growth environment, resulting in an ever-increasing pressure on the resource, sustaining the effectiveness of these institutions and mechanisms for managing a finite (although renewable) resource remains a considerable challenge.
Sources: Bahiigwa et al. (2003); Government of Uganda (2009); Kaggwa, R. (2009); Kazoora, C. (2010); New Vision (2010).
Case studies and lessons learned 33
Positive incentives measures
AustraliaBush Tender Programme
In Australia voluntary, market-based incentive programmes have become an increasingly important tool to achieve environmental objectives. Several state governments and the Commonwealth government now use a mix of incentive approaches to secure targeted management actions that retain and improve biodiversity conserva-tion on private lands. A national web-based information resource has been created to support these initiatives (http://www.marketbasedinstruments.gov.au/).Starting in 2001, the State government of Victoria commenced a series of Bush Tender trials through which the government paid landowners to enter into three to six year contracts to adopt a range of vegetation management practices. Reverse auctions are used in specific regions to minimise the cost of conservation actions. As a consequence of the trial programme, under which about 125 contract bids were signed covering about 4800 hectares, the use of reverse auctions is receiving increasing attention as a promising method to obtain biodiversity conservation at least cost, and was subsequently expanded and scaled up to other programmes. In 2008 the EcoTender programme was released, an auction-based approach that expands BushTender to include multiple environmental outcomes and that includes a more detailed way to evaluate tenders (www.dse.vic.gov.au/EcoTender).
Discriminative-price reverse auctions, together with other mechanisms, are also used for disbursing funds of the Forest Conservation Fund, which was created in 2005 by the Commonwealth government to protect up to 45,600 hectares of old-growth and other high conservation value forests on private land in Tasmania. A total of four reverse auction rounds secured 88 contracts to protect 13,779 hectares of forest. Fixed price offers provided a further 26 contracts to protect 2,996 hectares and direct negotiations a further eight contracts and 5,657 hectares. The cost of designing and administering the market components of the Fund was 10.5 percent of the total programme budget. Using the metric, an additional 18.6 percent in conservation outcomes are achieved. The additional conservation gains are valued at approximately $3.3 million, while the cost of achieving those benefits is only $0.5 million. The ratio of benefits to costs from investing in the metric is 6.9.
In 2008, the Australian Government commenced a market-based Environmental Stewardship Programme as part of the national Caring for our Country environmental initiative of more than $2 billion over five years (http://www.nrm.gov.au/stewardship/index.html). The Program’s investment focus is Matters of National Environmental Significance identified under the Environmental Protection & Biodiversity Conservation Act (1999), specifically nationally endangered ecological communities. The Programme continues the use of discriminative-price reverse auctions to protect high conservation value assets on private land, and it provides for 15 year funding contracts with private land managers to ensure long term protection and restoration of targeted endangered communities. The Programme initially targeted endangered box gum woodlands in south eastern Australia and by the end of 2009 has completed four auctions for a total of 161 contracts and over 17,000 hectares of woodland protected. The Programme used an ecological state-and-transition model to develop an investment management framework for achieving specific improvements in the condition and extent of endangered ecological communities.
In 2007, the New South Wales government commenced a Biodiversity Banking and Offsets Scheme (Biobanking) to help address the loss of threatened species and other biodiversity. The scheme only addresses biodiversity values, including threatened species listed under the New South Wales Threatened Species Conservation Act 1995. The aim of biobanking is to generate conservation gains while streamlining the biodiversity assessment process for developments. Under the scheme landowners manage their biobank site to either maintain or improve the site’s overall biodiversity values. Developers can offset the impacts of their development site — after they have minimised and mitigated the impacts on the site — by purchasing matching biodiversity credits from the biobank site owner (www.environment.nsw.gov.au/biobanking).
34 CBD Technical Series No. 56
Impact on biodiversity
The programmes use quantitative indicators (quality-adjusted hectares of biodiversity restored or protected) in order to measure biodiversity impacts effectively. BushTender uses a habitat-hectares methodology to assess vegetation condition and EcoTender has introduced more details including potential improvements in salinity, biodiversity, carbon sequestration and water quality. The Forest Conservation Fund used a conservation value metric based on an assessment of the ecological significance of the forest proposed; the conservation manage-ment provided by the proposal; and the security of conservation outcomes as measured by covenant length to determine value-for-money. Overall, the careful assessment of area and quality of conservation implies that there are significantly positive impacts on biodiversity.
replicability
Biodiversity stewardship payments seem to be suitable in situations where managing threats to biodiversity requires monitoring and management effort from private landholders and outcomes are difficult and/or costly to monitor. These include the restoration and management of habitat for threatened species and ecological communities, and specific issues, for example fire management.
The expanded use of reverse auctions suggests that the tool is replicable in a range of circumstances where there is a sufficient private market for competitive tenders to operate.
A mix of market based programmes is effective, as in the Forest Conservation Fund. A mix of innovative financing mechanisms is now becoming more common in Australia.
Lessons learned
Market-based competitive auctions are popular with landholders: biodiversity conservation is translated from a complex and abstract idea to practical actions from which local results can be seen. All conservation market programmes have been oversubscribed. As voluntary payments maintain the autonomy of the landholder, they are perceived as being fair, which reduces enforcement costs.
There was strong community and landholder interest in better understanding how reverse auctions and other mechanisms operate, which has required effective communications, information management and capacity building efforts by governments to support emerging markets.
In general, the best strategy is to reveal all information to landholders. Experience has shown that there is a lot of economic surplus (or rent) and it is reasonable to share this between government and landholders. Payments need to be demonstrably above legal environmental obligations on private land managers.
Collusion has not been a problem — experience suggests it is almost impossible to collude because bids are formed on an action basis, but assessed competitively on value for money.
Results suggest that using auctions to reveal individual landholder opportunity costs improves the cost effectiveness of conservation expenditure up to seven fold over what a non-competitive grants based scheme would have cost.
While auctions have focussed on improving the cost efficiency of publicly funded conservation, most schemes have two weaknesses. First, most payment schemes are for short periods of time so long term gains to biodiversity remain uncertain (see Environmental Stewardship for a different approach). Second, most schemes do not suffi-ciently consider the spatial configuration of bids, so ecosystem and landscape scale benefits, including through improved habitat connectivity, are missed.
Contract design is an important and relatively undeveloped area for managing sovereign risks for environmental investments. Contracts may be designed differently according to the environmental and economic context thus providing a more efficient incentive instrument.
Case studies and lessons learned 35
Reliable scientific knowledge and tools for ecological valuation are critical for running effective biodiversity markets, as are robust monitoring and reporting systems. Use of fit-for-purpose conservation metrics has allowed government investors to assess and prioritise competing proposals using a simple cost-efficiency formula ($/metric score). As biodiversity markets progress into more complex markets for ‘bundles of ecosystem services’ to deliver multiple policy objectives, there will be a need to develop appropriate metrics and mechanisms that provide for differentiated co-investments.
Sources: Binney and Zammit C (2010); Department of Sustainability and Environment (2008); Parkes D et al. (2003); Stoneham G et al. (2002); Zamitt (2010); Zammit C et al. (in press).
36 CBD Technical Series No. 56
BoliviaPaying for ecosystem services
Local water users often fail to manage water resources in an optimal manner because they lack the informa-tion, institutional mechanisms and incentives to do so. A scheme of payments for ecosystem services (PES) in the Los Negros valley in Bolivia is trying to address these issues by introducing an incentive-based transparent system of watershed management. The scheme includes 46 farmers bordering the Amborò National Park who are given incentives to protect 2,774 ha of watershed containing the threatened cloud-forest habitat of 11 species of migratory birds.
The scheme is unusual in that it is financed by two ecosystem service buyers: the US Fish and Wildlife Service, which is interested in biodiversity conservation, and the municipality representing downstream irrigators who benefit from stabilised dry season water flows. The Municipality of Pampagrande paid for upstream watershed management: US$2000 in 2004 and US$2,500 in 2007 to purchase bee boxes on behalf of downstream irrigators. In addition, a small group of irrigators paid per diem and food for independent monitors, but other than this, water users and water user associations are not yet contributing directly to the scheme.
Payments are made in kind (bee hives, apiculture training and barbed wire). The use of non-cash compensation was requested by local environment committees during the negotiation stage. Apparently participants feared cash payments might end up being spent unproductively. Moreover, it seems that payment via beehives rather than cash minimised local concerns about land expropriation.
All upper watershed landowners have been invited to participate in the scheme. Participants are not allowed to cut trees, hunt or clear forest on enrolled land. Monitoring takes place on an annual basis and payments are denied in cases of non-compliance. Landowners are able to select which plots to enrol and the duration of the contract, ranging from 1–10 years. Payments are made annually. Total payments are roughly US$5,000 per year.
An unexpected consequence has been reduced colonisation by landless people; the formal contracts with maps and demarcation required for the scheme have helped institutionalise de facto land-tenure security and raised local ability to resist invasions. Of the fifteen new participants to the scheme in 2005, 14 chose payment in the form of barbed wire rather than bee hives due to the value of wire in strengthening land tenure claims.
Impact on biodiversity
Compliance in the scheme has been good –only a single landholder has been denied payments for allowing the construction of a road on enrolled land. The precise impact on biodiversity is difficult to measure as the scheme has not addressed additionality or leakage issues. Overall, the threat level after the implementation of the PES programme was much reduced with positive conservation effects in some cases and negligible conservation effects in others.
replicability
The local NGO which has supported the development of this PES scheme is replicating the Los Negros scheme in the nearby Comarapa and Quirusillas watersheds which have been identified as highly suitable areas for the development of PES systems. Both areas are made up of cloud forests at high risk of deforestation from the local expansion of cattle ranching. Downstream, large areas of irrigated agriculture farmed by relatively well-off farmers rely heavily on dry season water flows.
Case studies and lessons learned 37
Lessons learned
Marketing a number of ecosystem services from the same area is a successful strategy to attract additional financial resources by making conservation a more competitive land use relative to alternative uses for threatened ecosystems. In this case, the international biodiversity buyer provided large up-front payments to cover start-up and transactions costs. Local water user services were less willing to fund set-up and transactions costs, but may be more likely to produce a sustainable stream of revenue in the future. Given that forests provide a number of ecosystem services which can be “used” individually without compromising the supply of other services, exploring mechanisms to sell individual services to different buyers may, in some cases, provide additional financial resources.
It can be very difficult to build trust between service buyers and providers which takes times and investment, but it is critical to do so for a successful user financed PES scheme. Demonstration activities can also overcome such constraints, i.e. a three year pilot scheme to be assessed on the basis of upstream forest maintained in its natural state and delivery of promised environmental services
Successful implementation of watershed PES scheme is promoted by the existence of a credible downstream institution to ensure service buyers will contribute to the scheme.
In some cases, payments in kind are more acceptable than cash payments as the perception of a sale of a good or service is avoided. A continued presence in the community, working with farmers, and communicating the positive experiences of participating farmers, is useful to gain acceptance of the scheme.
PES are not a poverty alleviation tool and synergy with overarching social objectives will not result automatically. Clear and secure land tenure is important for successful implementation of PES. Poverty alleviation needs to be tackled as a separate issue and will in many cases generate additional benefits for biodiversity conservation and sustainable use, for instance by encouraging more productive investment in the productive capacity of not enrolled land in order to reduce pressure on enrolled land.
While a number of PES observers advocate intensive data collection prior to PES implementation, the Los Negros scheme attempted to win local goodwill by introducing biodiversity payments before baseline data were available. The idea was to learn by doing and use adaptive management to be able to get started and to change the structure of the scheme as and when required. This strategy has been relatively successful in that the significant changes as the initiative has developed have not overly disruptive. Even reducing per hectare payments in a switch to a more differentiated system was not resisted by landowners. This learning by doing approach allows PES schemes to get off the ground quickly; lessons can be integrated while payments are being made and schemes can avoid delay in trying to design all important features in advance. The national PES scheme in Mexico has also initiated payments before all necessary data had been collected.
Source: Asquith et al. (2008).

38 CBD Technical Series No. 56
BotswanaCommunity-based wildlife management
In 1989, the Botswana government launched a new natural resource management programme based on the realiza-tion and acknowledgement that conservation of wildlife resources in Botswana was neither practical nor possible without active involvement of rural communities that reside within or adjacent to the conservation designated areas such as Wildlife Management Areas (WMAs) and Controlled Hunting Areas (CHAs). The Community Based Natural Resource Management (CBNRM) policy was designed and approved by Parliament in 2007. The policy empowers communities to derive benefits from CBNRM with support from the Government. Community Boards, Technical Advisory Committees and the Kgotla (a place where everyone in the village has a voice) are used to implement the CBNRM policy. The Ministry of Environment, Wildlife and Tourism (MEW&T) spear-heads the activities of the CBNRM with the Department of Wildlife and National Parks as the secretariat for all CBNRM activities.
The government programme rests on the recognition that local communities must be actively involved in the management and utilization of natural resources (namely, wildlife and veld products) and derive a livelihood from them in order to value them in a sustainable manner. Consequently, the programme involves community mobilization and organization, institutional development, comprehensive training, enterprise development, and monitoring of the natural resource base.
The village of Sankuyo stands out as a good practice case for CBNRM as the community derives a significant amount of benefits from their biodiversity-based enterprises. Local communities operate a lodge (Santawani) and a camp site (Kaziikini) and they derive additional revenue from safari drives, basket weaving and game walks.
Impact on biodiversity
Communities covered by the programme developed a different view of elephants and predators which used to destroy their crops and prey on their livestock. Today, the communities relying on wildlife for local livelihoods view wildlife as a resource rather than an enemy.
Lessons learned
CBNRM projects demonstrated the utility value of traditional ecological knowledge in sustainable natural resource management. Traditional ecological knowledge systems and institutions can serve as entry points into sustainable natural resource utilisation and management.
Devolution of power can pose practical challenges, due to the different expectations and interpretations of stake-holders, power imbalances including at the local level, etc. Local participatory decision-making institutions can be fragile and external safeguards to maintain good governance and adequate capacity will then be required, as well as possibly continuing external support.
Sources: Monamati (2009); Phuthego, T. C. and R. Chanda (2006); Twyman, C. (2000).
Case studies and lessons learned 39
CameroonCane rat domestication Programme
The bush meat trade in Central and West Africa is seriously threatening regional wildlife and biodiversity as harvest levels grow to unsustainable levels and threatened/endangered species (mountain gorillas, monkeys) are killed for food. With longer life expectancy and population growth, raising demand for traditional bush meat led to increased trade volumes in Central and West Africa. This trend is causing rapid biodiversity loss, as illegal hunting is reaching unsustainable levels and many endangered species are threatened, despite laws enacted and trained Forest Guards deployed by the government to protect wildlife in Cameroon.
To address the threats posed by the bush meat trade, the Government of Cameroon has initiated the domestica-tion and commercial production of the rodent “cane rat” (Thryonomys Sp). The Ministry of Forestry and Wildlife has created at the local council level official markets in order to stop the illegal hunting of endangered species. Farmers are trained in cane rat raising, animal health and marketing. A small number of farmer “leaders” are chosen and trained to serve as model cane rat farmers. After training, they are given two or three pairs of cane rats, and monitoring through follow-up visits is to ensure good husbandry and success. Just as in any livestock practice, competition prizes and other incentives are awarded to high quality producers.
The overall objective of the scheme is that commercial production of cane rats should provide a substitute for bush meat. The objective is to protect wildlife by providing a substitute source of protein in a region where bush meat is an important source of food and income. In parallel, the scheme aims to alleviate rural poverty and promote self-employment by providing alternative sources of livelihoods.
Impact on biodiversity
The programme is still limited to certain areas but expanding. Positive impacts of this programme on the illegal harvest of wildlife and the regional bush meat trade can thus be expected but, in light of its early stage, there is little data available on its precise quantitative impact.
replicability
Based on lessons from the cane rat domestication in the savanna regions of Cameroon, the “Bush-Tailed Rat” Porcupine (Atherurus Sp) and other species of cane rats are now being domesticated by local communities in tropical humid forest zones. Due to limited financial resources, the cane rat domestication programme has not yet been promoted on a wider scale.
The green Sahel reforestation Programme
The Lake Chad basin lies in the Saduno-Sahelian climatic zone of Africa with average annual rainfall ranging from 400 mm in the north and 1100 mm in the south. Severe climatic conditions and changes associated with global warming have contributed to desertification, rendering the ecosystems of this zone increasingly fragile and posing a serious threat to biodiversity and human survival in the area. as As Lake Chad has increasingly dried up, the Lake Chad basin area has decreased from 26,000 km2 in 1963 to barely 1,500 km2 in 2001.
The government of Cameroon has initiated broad support for forest landscape restoration in the Lake Chad region in order to raise water levels, encourage sustainable agro-pastoral activities and conserve dwindling biodiversity. The main activities focus on encouraging local production of tree seedlings, buying seedlings from farmers and employing local communities and organizing labour for afforestation/reforestation programmes by youths and NGOs. By financing ecosystem restoration, the Government is seen to be re-investing in natural capital and “paying” for ecosystem services and the restoration of biodiversity (e.g. fish, fauna, flora) in order to re-create local conditions which are suitable for sustainable agro-pastoral production, to re-establish the area as suitable for human habitation (to prevent further out-migration) and to promote food security.

40 CBD Technical Series No. 56
The Ministry of Environment and Nature Protection and the Specialized Institute (IRAD) of the Ministry of Scientific Research have identified suitable natural drought resistant tree species, tested for their viability and other environmental comportment factors. Field experts from other ministries were co-opted and the programme of activities was established. Participation of local communities has been essential for success and includes the production of seedlings by the local population and NGOs, and providing labour for planting and maintenance of restored areas.
The Ministry of Youth Affairs in collaboration with institutions of secondary and higher education have developed a programme for “national youth voluntary service” which organizes for young people to plant trees seedlings in North Cameroon during the summer holidays. Over 2.5 million youths are to participate every year.
The Biodiversity Development and Conservation Programme of Cameroon (BDCP-C), a local NGO, has initiated several biodiversity conservation projects, focusing on restoration of natural sacred forests (shrines) which have been degraded by desertification. Related projects have worked with local women to encourage the adoption of shrub–like vegetable plants husbandry which can help to raise the level of the water table and to promote the progressive restoration of agro-pastoral production.
replicability
Ecosystem and forest landscape restoration are being introduced in degraded areas globally. Although it is generally more cost-effective to conserve intact ecosystems than to restore degraded ones, in many situation, such as in Lake Chad, there is no alternative to restoration or rehabilitation which can have significant and positive impacts on local livelihoods.
Source: Njinyam, S.N. (2009, 2010).
Case studies and lessons learned 41
ColombiaForestry project for the basin of Chinchina river (PrOCUENCA)
This PES scheme in the basin of the Chinchina River in Colombia involves payments for reforestation in a critical watershed in order to secure the water supply and to promote biodiversity conservation and carbon sequestration. The sellers of ecosystem services include 232 rural land owners covering 3,427 ha. The ecosystem service buyer is the Manizales Municipality Water Supply Company, a mixed public/private water utility company. The water company has a 30 year concession and 10 percent of net revenue is allocated to payments for ecosystem services in the water basin. Payments are made to promote both the conservation and sustainable use of 15,000 hectares of natural forest in the basin and the establishment of a further 15,000 hectares of commercial forest plantations. Overall, the objective is to improve water quality and hydrological regulation in the water basin, to develop the forest production sector, and to generate 1,500 new and permanent jobs in the sector.
The payments are used to support reforestation on private lands. Participation is voluntary, but certain criteria are to be met. The project investigates the suitability of applicants based on type of property title, the technical conditions of the farm, potential ecosystem services provided, road infrastructure, etc. If the plot is considered suitable, a sustainable forest management scheme for the farm (OFSF) is developed which identifies the type of forest to establish, including species and management.
Because this scheme has focused on reforestation rather than forest conservation, there has been the opportunity to expand into a CDM Carbon Sequestration project. As a result, the project will be able to issue Certified Emissions Reductions (CERs) and benefit from the revenue from the sale of CERs.
Similar schemes are replicated in other watersheds:
▶ In the Chaina micro-basin, community associations made direct payments to upstream landholders to maintain forest cover to ensure the provision of water from the rural water distribution systems (2001–07).
▶ The environmental impact of cattle ranching in Colombia has triggered the search for tools to identify and promote land uses that are profitable for landholders and that promote the continued provision of important ecosystem services. In the La Vieja watershed, GEF has financed payments for reforestation with native species, in order to increase biodiversity and carbon sequestration. The scheme includes 80 livestock ranchers and offers direct payments up to $6,500 per year depending on the type of reforestation package adopted.
Impact on biodiversity
The environmental outcome is positive with an increase in area under native forest, reduced pressure on natural forests, and reduced erosion.
The payments to cattle famers resulted in a decrease in the area of degraded pasture on each property and increased the area of improved pastures with low to high tree density.
Lessons learned
Previous experience has shown that when there is a single user or a small number users of watershed services, it is more likely that ecosystem service beneficiaries will be willing to pay for these services. The PROCUENCA scheme confirms this finding.
Sources: Aristizabal Buitrago, S.L. (2009); Ocampo (2008); Zapata et al. (2007).

42 CBD Technical Series No. 56
Costa RicaPayments for environmental services
The PSA (Pago por Servicios Ambientales) programme in Costa Rica is a national payment programme for carbon storage, hydrological services, and the protection of biodiversity and landscapes. This scheme has been credited with reducing the rate of deforestation in Costa Rica from one of the world’s highest to net negative deforestation by the start of the 2000s. Between 1997 and 2004, approx. US$ 200 million was invested in PES to protect over 460,000 hectares of forests, to establish forestry plantations and to provide additional income to more than 8,000 forest owners (TEEB 2009). PSA is managed by FONAFIFO, a semi-autonomous agency.
PES have been predominantly financed by receiving 3.5 percent of revenues from a sales tax on fossil fuels, but the objective is that all beneficiaries of environmental services eventually pay for the services they receive. While there has been some success charging water users for upstream watershed management services, there has been more limited success charging for biodiversity and carbon. The proportion of the programme’s costs financed with direct payments will increase as a new water tariff is implemented.
Water service payments. PSA intended that payments from hydroelectric power producers and other water users would at least partly finance PES. However, as there is no legal requirement, FONAFIFO negotiates with water users and has reached a number of agreements. While the start was slow, the process has been streamlined based on environmental services certificates (standardised instruments that pay for conservation of a hectare of forest in a particular area). Both the number of agreements and the amounts paid has risen sharply. In the past, water users paid only one quarter of conservation costs (based on the idea that watershed management is one of four ecosystem services provided by forests), but recent agreements pay the full cost of conservation in addition to FONAFIFO’s administrative costs.
Biodiversity payments. Biodiversity payments have been predominantly financed by the Global Environment Facility (GEF). In contrast to agreements with water users, financing for biodiversity is not renewable. Efforts to make is sustainable by generating financing from local tourism industry have not been successful. This situation is acceptable in areas where financing based on carbon or water management is possible, but there is a large area (roughly 900,000 hectares) which has been identified as priority area for biodiversity conservation, but which lies outside protected areas and does not have the potential for either water or carbon financing. An endowment fund is being created as a partial solution.
Carbon payments. While use of the fuel tax revenue can be considered to be a payment from carbon users to carbon suppliers, because the tax is mandatory and because the revenue is used for payments to a range of environ-mental services, the link is weak. Since its inception, PSA has sought to sell carbon emission reduction credits. PSA contracts clearly state that FONAFIFO owns the right to emissions reductions. FONAFIFO developed the Certifiable Tradable Offset (CTO) equal to an externally certified one ton net reduction in carbon emissions. The programme successfully sold 200,000 CTOs for US$ 2 million to the Norwegian government and a consortium of Norwegian power producers. However, no additional sales of CTOs have been made as emissions reductions are predominantly based on avoided deforestation and only reforestation and afforestation are considered eligible under the Kyoto Protocol’s Clean Development Mechanism (CDM). Costa Rica has since sold 0.61 million tons of CO2e to the World Bank BioCarbon Fund, based on a mix of planting trees in agroforestry systems, natural regeneration and commercial plantations. In order to better deliver Kyoto-eligible carbon emission reductions, PSA is introducing a new type of contract based on assisted natural regeneration.
Landscape payments. The Forest Law which provides the legal basis for the PSA scheme mentions scenic beauty as an environmental service provided by forests. While there have been negotiations with hotels and a rafting company for payments for scenic beauty, no agreements have been reached. Users of landscape services are numerous and fragmented, and problems of collective action make implementing PES for landscape beauty difficult.
Case studies and lessons learned 43
Impact on biodiversity
Despite the difficulty in charging for biodiversity services, because biodiversity is “bundled” with other ecosystem services, there are significant biodiversity benefits associated with forest conservation for watershed management. The PES scheme has helped slow deforestation, added monetary value to forests and biodiversity, and increased understanding of the economic and social contribution of natural ecosystems.
Identifying the specific results of PES schemes can be tricky when a number of policy changes are introduced simultaneously and it has proven difficult to determine precisely the extent to which the PSA programme has generated ecosystem services. While studies have found that PSA recipients had a higher proportion of forest on their land than non-recipients, other research had questioned additionality, that is, it suggested that participants would have protected their forest even in the absence of the PSA programme.
replicability
The number of PES schemes in Latin America is growing, suggesting good scope for replicability when there are clearly identifiable suppliers and intermediary institutions to facilitate payment. Costa Rica’s PSA scheme has been much studied and imitated. Many countries already have similar schemes in place, and these have often been used following policy reform including a shift from subsidies to PES.
Lessons learned
PES schemes are easier to introduce if they build upon existing systems of payments. In fact, Costa Rica’s PSA was based on a reform of an existing forest subsidy programme. In the 1970s Costa Rica had begun to provide incentives for timber plantations through tax rebates, due to concerns over shrinking timber supplies. The Forest Credit Certificate expanded the programme which continued to evolve to support forest conservation as well as timber production. When introduced, the PSA programme built on the base of this payment scheme, with two major changes:
▶ payments were to be based on the provision of environmental services instead of timber, and
▶ financing would change from the government budget to an earmarked tax and payments from beneficiaries.
While PES schemes are proliferating in Central and Latin America, it is proving more difficult to implement user-financed PES schemes than government financed schemes. This limits the sustainability of these schemes.
It is easier to implement PES schemes for watershed management than for biodiversity (difficult to measure) and for carbon (difficult to identify beneficiaries).
Effective targeting and differentiated payments are important to allow for differences in the level of and the opportunity cost of service provision.
PES schemes need to monitor and document how activities are generating environmental services. This is particularly important for carbon sequestration projects intending to sell carbon offsets in the emerging global carbon market.
Due to the new and innovative nature of PES, schemes need to be flexible and need to adapt to lessons learned and constantly changing circumstances. Costa Rica’s experience was broadly positive, yet PSA was (and is) evolving and improving in response to experience and feedback.
Sources: Pagiola (2008); TEEB (2009).
44 CBD Technical Series No. 56
Cubahavana Bay User Tax
The Cuban government uses environmental taxes and fees to generate disincentives towards environmentally harmful activities. These taxes provide revenue which is channelled into funds that can be used for providing positive incentives. Since 2002, the government has applied a tax on harbour users in order to promote conser-vation in Havana Bay. The tax is applied to anyone (local and foreign) who uses the Bay for tourism, recreation, and commercial activities which have an impact on the harbour. The tax rate is calculated based on the use of the entrance channel, the use of the shore including use of harbour infrastructure. Revenue (roughly 1.6 to 2.6 million Cuban Nonconvertible Pesos (CUP) per year) is earmarked for an environmental fund which finances cleanup activities in the Bay.
A similar scheme is applied in forest policy: A tax partly finances a forestry fund, which is used for reforestation and sustainable forestry management activities.
Impact on biodiversity
Following implementation of the tax, hydrocarbon concentrations in the bay were reduced as industry effluent emissions were cut by 50 percent. Signs of the recovery of the ecosystem include the reappearance of fish and phytoplankton species thought to be lost. Sports fishermen are now more common.
replicability
The experience of environmental taxation has been very positive. It was recently decided to replicate the use of this instrument in other Cuban bays, and also to increase the rate of the tax and to target a greater number of users. The extension of this economic instrument to cover all the hydrological basins associated with bays and the introduction of an additional payment associated with waste water disposal in the basin will increase the number of contributors to this tax under the “polluter pays” principle. The additional payment will be calculated on a volumetric basis of cubic metres disposed and on the basis of the level of hazard of the waste water.
This additional measure will increase the collected revenue to four million CUP, revenue that will be earmarked for cleaning up other damaged bays.
The country is preparing a set of new economic instruments to support not only biodiversity, but the environ-ment more broadly.
Lessons learned
A high level of coordination between economic and environmental policy makers enabled the introduction of the tax. The tax was designed and promoted by an interministerial group created for the specific purpose of cleaning up the Bay. The “Grupo Estatal para el Trabajo (GET) de Saneamiento de la Bahía de la Habana” linked the efforts of the ministries of Transport and CITMA and the Havana city government. The Environmental Authority, to which the Havana Bay tax revenues accrue, finances the activities of this group.
Source: Garrido (2009).
Case studies and lessons learned 45
Ecuadordecentralised environmental payments
Historically, programmes for environmental payments in Ecuador were implemented in a decentralised manner, that is, at the local level and without central government coordination. The Pimampiro Municipal Watershed Protection Scheme and the Forests Absorbing Carbon Dioxide Emissions Forestation Program, PROFAFOR have become models for successful local level PES programs in the region. More recently, Ecuador has developed national PES programmes, e.g. the Socio Bosque programme.
Pimampiro
In 2000, as part of a forest management plan, the municipality of Pimampiro set up a system of payments covering the Palaurco River upper watershed that delivered drinking water to Pimampiro residents. A drought in 1999 and the subsequent construction of a canal to increase water flow provided an opportunity to introduce PES — the dramatic improvement in local water supplies greatly increased the Willingness to Pay (WTP) of commercial and domestic water users. The recipients of PES were 27 households owning 638 hectares of land upstream. The PES programme was designed to halt and reverse the conversion of forests and native Andean alpine grasslands to annual crops and pasture which adversely affected the supply and quality of water downstream.
Currently, 19 Nueva América households (70% of targeted household) participate in PES, with 550 ha enrolled (87% of targeted area). PES contracts initially lasted for five years, but were renewed indefinitely in 2005. Households receive US$6/year/ha for intervened forest, US$8/year/ha for mature secondary forest, and US$12/year/ha for primary forest. Payments are financed by users through a 20 percent water consumption surcharge on 1350 families in Pimampiro with water meters, in addition to the interest (US$500 per annum) generated by a water fund of US$15,000.
PrOFAFOr
PROFAFOR is an Ecuadorean company created by the Forests Absorbing Carbon-dioxide Emissions (FACE) consortium financed by Dutch electricity companies to offset their carbon emissions. Since 1993, over 22,000 hectares of land under 152 contracts have been afforested or reforested, mostly in the highlands of coastal areas, resulting in approx. 2.23 million tons carbon sequestered.
Following contract signature between landowners and PROFAFOR, landowners plant trees to (re)establish and maintain tree cover. Contracts were initially valid for 15–20 years, but are now normally valid for 99 years.
Initial payments of US$100–150/ha for seedling production and plantation cover roughly 80 percent of estimated plantation and management costs. The remaining 20 percent is paid after three years contingent upon a minimum survival rate of 75 percent. Participants receive in-kind benefits from forest by-products (thinning, pruning). The most important incentive is the receipt of 70 percent of revenues from the sale of harvested trees at the end of the cycle (15–20 years). If they reforest the area, as stipulated in the 99-year contracts, they receive the full revenue. However, if landowners fail to replant, they must pay 30 percent of sales revenues to PROFAFOR.
replicability
The NGO that assisted in establishing the PES scheme in Pimampiro is replicating its experience in other municipali-ties (El Chaco and Celica). In other cases, spontaneous replication is occurring, e.g. emerging PES-like programmes in El Angel and in the municipalities of Loja and Zamora. Overall, in Ecuador, an additional handful watershed protection PES programmes are being implemented while another is currently being designed.
Impact on biodiversity
Both Pimampiro and PROFAFOR have been effective in reaching their environmental objectives and have shown high levels of additionality and low leakage effects. Both schemes have improved the welfare of participants,
46 CBD Technical Series No. 56
mostly through higher incomes. In the Pimampiro programme, not only has deforestation been halted, but native vegetation cover has increased significantly.
While reforestation under PROFAFOR was not able to keep up with FACE’s original rather ambitious schedule, the 22,287 ha planted in the 13 years since its inception constitute almost half of all reforestation in Ecuador. The biodiversity impact of PROFAFOR is less significant than that of Pimampiro because only rapid growth exotic tree species (pine and eucalyptus) were planted initially. However, more recently native tree species are being experimented with.
Lessons learned
Success has been attributed to a focus on targeted ecosystem services and strict conditionality.
PES programmes should complement rather than replace more command and control measures for environ-mental conservation.
While there was no specific pro-poor mechanism built into the programmes, in general, the poor did benefit through net income gains. Moreover, as both schemes focused on economically marginal lands where the poor generally operate, it is likely that most relevant disadvantaged groups had access to the PES schemes.
Users of ecosystem services and landowners continue to have different interests — these differences are bridged by PES through compensations but they do not vanish. Service users will need to continue to pay for ecosystem services for the services to be sustained.
Sources: Wunder and Alban (2008); Wunder (2010).
Case studies and lessons learned 47
Egyptdevelopment of community-based eco-tourism
The government of Egypt is promoting Bedouin-managed tourism enterprises in pristine wilderness areas in protected areas. Conservation and sustainable tourism in St. Katherine Protectorate is intended to provide a model for how to conserve natural and cultural resources and provide benefits to local communities while also enhancing tourism quality. The programme includes the reconstruction of a Bedouin habitation into an eco-lodge, establishing nature trails, revitalizing traditional craft skills, constructing a visitor centre, publishing tourist maps and nature guidebooks.
The lodge was designed in the vernacular style and built by local Bedouin artisans using local materials. It operates on the principle of minimal environmental impact and offers very basic facilities - it has waterless composting toilets and the showers are water efficient and solar heated. A dam has been built upstream to recharge groundwater supplies. Grey waste water is filtered through a ‘fat’ trap and then used to irrigate Bedouin gardens. Guests bring their own bedding, so no laundry is done on site, and firewood comes from a sustainable source.
Interconnected trekking routes and various itineraries have been created. It is encouraged that local management and implementation be based on orfi tradition (customary law). The income generation programme, based on local stakeholder participation, redistributes entry fees for the Protectorate by promoting eco-tourism businesses via training and technical support, thus providing local incentives to conserve the wildlife base of these revenues, and by paying community guards who represent local communities, liaise between management units and communi-ties and support monitoring, research and eco-tourism in their region.
The traditions and indigenous knowledge and customary skills of local people have become central to the devel-opment and management of the St. Katherine Protectorate. The craft programme was initiated in the belief that the maintenance of cultural diversity and the conservation of biological diversity are interconnected, and that biodiversity can be conserved through a broader effort to promote and sustain human welfare and culture. The Bedouin Craft programme was started in 1997 to assist in particular women to preserve, develop and market traditional skills in order to generate income. In 2002, a Bedouin owned company (Fansina) was established to produce and commercialize Bedouin crafts involving over 400 Bedouin women.
The Medicinal Plants Conservation Project (MPCP) component was initiated in 2007 to strengthen the in situ conservation management of medicinal and aromatic plants (MAP).
Impact on biodiversity
Local communities have realised that the protected area is of great interest to visitors. They are now interested and empowered to maintain and protect the area by reporting violations and using peer pressure to prevent degrading activities. The major opinion leader in the community is also a Protectorate Community Guard who helps enforce regulations and is a conduit between the Protectorate management and the community.
replicability
The government of Egypt has provided an enabling environment and technical support to provide positive incen-tives to set up biodiversity and cultural based businesses and to protect the ecosystems on which these businesses are based.
48 CBD Technical Series No. 56
Lessons learned
The effective integration between tourism, local economic development and protected area management, which is the basis for nature-based tourism, can direct economic benefits to remote rural areas and increase incentives for conservation in state protected lands.
Conservation projects can help to catalyze associated rural development activities by other agencies.
It is essential to involve and benefit local people at an early stage in the process. Community participation and support for conservation activities requires time.
The traditional responsibility of local people as the resource managers in the area should be acknowledged and built upon.
Inputs and benefits have to be tangible and be sustained to gain the trust and confidence of local people. This should also extend to the long-term involvement and accountability of individual rangers and managers.
Sources: Egypt (2009); Gehiny, A. T. (2010).
Case studies and lessons learned 49
FrancePayments for improved watershed management practices
The French legislation for “natural mineral” water is very strict. Each brand name is associated with maximum allowed levels of nitrates and, importantly, water treatment is not allowed: if water quality is not achieved naturally, the brand name and the business associated with it are lost. Protecting the ecosystems providing water filtration and purification services in the catchment where the springs are located is therefore critical for reducing business risks and maintaining the profitability of the operation.
In the early 1980s, Vittel, a subsidiary of Nestlé Waters and a world leader in natural mineral water, was faced with the increasing rate of nitrates and pesticides level in an important artesian spring in the Vittel catchment. Promoted the European Common Agricultural Policy, the traditional hay-based cattle ranching system had been increasingly replaced by a maize-based system, with limited free-range grazing and increased stocking rates. The increased nitrate and pesticides rates were caused by leaching of fertilizer and pesticides from the maize fields, overstocking, and poor management of animal waste.
Vittel considered a range of options. Doing nothing was too costly and implied closing the business. Relocating implied losing the brand name and the associated premium. Purchasing all land in the 3,500 ha catchment was socially, legally and economically not feasible. Use of legal action to force the 40 farmers to change their practices was not practicable since it was not technically possible to demonstrate the responsibility of individual farmers. The only alternative was to establish an incentive scheme for farmers to voluntarily change their practices, which would essentially involve going back to extensive dairy cattle ranching.
Farmers were asked to give up maize cultivation for animal feed, and to adopt extensive cattle ranching pasture management by reducing carrying capacity, composting animal waste, giving up agro chemicals, balancing animal rations to reach optimal milk productivity and farm profitability, and by modernising farm buildings accordingly. In return, farmers were provided with a long-term incentive package that included: (i) 18 to 30 year contracts; (ii) the abolition of debt linked with land acquisition; (iii) the acquisition of 1,450 ha of land which was left in usufruct to farmers for up to 30 years; (iv) an annual subsidy of about 200 Euros per ha over seven years to ensure guaranteed income during transition period (which corresponded to about 75% of disposable income); (v) the reimbursement of farmers’ debt up to 150,000 euro per farm to invest in new equipment and buildings; (vi) free labour to apply compost in farmers’ field and free technical assistance.
The total cost of the programme for the first seven years was about 24 million Euros (= 980 Euro/ha/yr).
Vittel was originally confronted with resistance from farmers. It took ten years to convince farmers to change practices. Partnerships with the Rhin Meuse River Basin Agency and the French National Institute of Agronomic Research, which co-financed four years of research to identify optimal agricultural practices, were critical to the success of the scheme. The municipality (which benefited from tax revenue and employment) was also supportive. An intermediary institution (Agrivair), located in the heart of the watershed, was created in 1992 to work with farmers. By 2004, the 26 remaining farms (several had chosen early retirement) had adopted the new practices and 92 percent of the basin was protected.
New challenges have caused the programme to evolve over time. For example, urbanisation in the area has increased and, in order to maintain groundwater quality in the catchment, Agrivair had to expand its programme to non-farm municipal lands. Agrivair now manages 300 ha of city parks, 200 ha of golf courses, a horse racing track, and the Vittel thermal park.
50 CBD Technical Series No. 56
Impact on biodiversity
Although protection of biodiversity was not the objective of the initial programme, in particular the new challenges as described above led the programme to incorporate practices that benefit biodiversity. For instance, herbicides have been replaced by thermal weeding in school yards, railroad tracks, airport grounds, paths and parking lots. Some farms have turned to organic dairy production, and Vittel established 140 hectares of organic apple orchards. Ladybirds, a natural predator of crops pests, are bred in Agrivair laboratories and released at strategic times during the year. Biodiversity is also encouraged through the planting of flower rows and the establishment of bird houses and bird refuges. Agrivair personnel work with farmers to plant and maintain 40 kms of hedgerows to keep a balanced population of foxes and birds of prey (the natural predators of field mice that ravage crops).
The performance of the programme is evaluated through a strict monitoring programme. Water quality from surface and groundwater is monitored daily. On-farm practices are also monitored and Agrivair has access to all farm accounts (a clause in the contract between farmers and Vittel) to ensure compliance with farming practices. An observation network monitors all activities in the catchment area to quickly identify pollution risks and preventive measures are taken when required. Biodiversity, especially insects, bird populations and diversity of wild flowers is also regularly monitored. Plans for the future include the expansion of organic agriculture, which will improve biodiversity in the area even further.
replicability
Nestlé Waters expanded the approach to a total of 10,000 hectares by including the contiguous Contrex/ Hepar catchment. Forest is a major land use in this catchment and Agrivair introduced a forest management programme which aims to maintain a balance of trees to maximize nitrate uptake.
The scheme was replicated in the Perrier spring in Vergèze in southern France where organic wheat and wine were successfully introduced. In this drought-prone area, fire prevention measures are a key component of water protection as destruction of the vegetal cover affects surface water run-off and infiltration patterns, and chemicals used by fire fighters affect groundwater quality. In collaboration with l’Institut Méditerranéen du Patrimoine Cynégétique et Faunistique (Mediterranean Institute for Hunting and Wildlife Heritage), Nestlé established a research programme to protect water resources, prevent fires and safeguard wildlife habitat in an area (40 ha). As the Perrier company has recently experienced financial difficulties, the long-term continuation of the agricultural component of its water protection programme is not clear.
Nestlé Waters further replicated the approach in Argentina, in partnership with a municipality where a source spring was located. Evian, a subsidiary of Danone, has adopted a similar approach (and entered into partnership with the Ramsar Convention to protect wetlands in their catchments of operation).
Lessons learned
Establishing PES programmes is a complex undertaking. There are no blueprints or quick fixes. Programmes must be adaptive and innovate constantly as new threats to water quality appear.
The ability to maintain farmers’ income at all times and finance all technological innovation was important, but it was not sufficient. The primary reasons for the success of the programme were not financial. The attention given to the complex interactions between technical, economic, social, legal, geographic, sociological and political issues (land market, debt cycle, labour constraints, future of farm family, role of farmers unions) was key to understanding farmers’ livelihood strategies.
The mediation and communication provided by the multidisciplinary research team allowed the company to establish a dialogue with farmers based on trust. It enabled the identification of a set of incentives and practices that were mutually acceptable.
Case studies and lessons learned 51
An important reason for success was that, in contrast to annual European subsidies, annual contracts offered were long-term (valid for 30 years) and provided more income security while engaging in innovation.
It was necessary for all farmers to participate in order to eliminate the threat of contamination of the groundwater. In some situations, the approach may not be feasible if the number of farmers is very large and there is disagree-ment within the group. In such a case, the cost of payments and the risk of not being able to target a critical mass of farmers in sensitive areas may be too high.
There is a business case for private sector participation in financing the protection of ecosystem services. The Vittel scheme has demonstrated that food production and biodiversity can be reconciled and the multiple uses of agricultural landscapes can be enhanced or restored. To succeed, a broad range of partnerships was indispen-sable, involving individual farmers, the National Agronomic Research Institute, the Water Catchment Agency and the municipalities.
The case also demonstrated that local economic development and conservation can go hand in hand. In Vittel, protecting water quality and biodiversity meant protecting economic activities that provided the bulk of employ-ment in an area which had suffered from with high unemployment rates.
Sources: Benoit (2008); Nestec Ltd. Environmental Affairs Department (2003); Nestlé (2002); Pierre (2009); Perrot-Maître, D. (2006); Perrot-Maître, D. (2010).

52 CBD Technical Series No. 56
IndiaJoint forest management and biodiversity conservation by eco-development projects
Roughly 100 million people, including 50 million tribal people, depend on forests for their livelihoods. The Indian Forest Policy (1988) made a shift in forest management from near exclusion of people from use of forest resources to the protection of forests through the people. It now recognizes the customary rights and privileges of forest dwelling communities. The Ministry of Environment and Forests has issued policy guidelines for the involvement of village communities and voluntary agencies in the regeneration of degraded forest lands for strengthening Joint Forest Management (JFM). These guidelines emphasize the involvement of local communities in the protection, afforestation, and development of degraded areas and benefit sharing with communities.
In 2007, there were over a million Joint Forest Management Committees (JFMCs) involving 22 million people managing 22 million hectares of forest area. The nature of JFMCs varies between States with respect to their membership, the participation of women and other weak sections of society, and benefit sharing. In almost all the States, JFMCs have full rights over all non-timber forest products (NTFPs) except the nationalized Minor Forest Produce i.e. tendu leaves, sal seeds, cashew etc. In Andhra Pradesh, 50 per cent of the net proceeds from sale of tendu leaves are shared with JFMCs. In Madhya Pradesh and Chhatisgargh, 100 percent of net profit goes to the collectors of NTFPs. In most States, JFMCs retain about half of the net benefits from the final felling of trees.
In many cases, joint forest management is complemented by programmes addressing important local peculiari-ties. For instance, a World Bank-funded participatory biodiversity conservation programme is geared towards supporting the Periyar Wildlife Sanctuary in Kerala. A primary objective is to reduce the negative impact of local people on the sanctuary and to involve encroachers in conservation instead of exploitation. This was done by addressing the economic needs of those living in and around the protected area by funding viable innovative livelihood alternatives. Local communities living off the forest were organized into eco-development commit-tees. The people who had been involved in the illegal debarking of cinnamon trees, sandalwood smuggling and poaching formed an eco-development committee. They pledged to protect the forests in return for withdrawal of all cases against them, and by providing income-generating eco-tourism services like day treks through the forest, nature camps, and horse riding.
Similarly, at Kumbhakarnan Falls in Tamil Nadu, over 100 tribal people and members of Village Forest Councils have been trained as eco-tourism guides. These guides regulate tourists, maintain the surroundings and implement eco-conservation measures. Fees are collected from visitors to finance amenities and to cover part of the expenses of the tribal peoples as eco-guards.
Sources: India (2004); India (2009); Thampi (2009).
Case studies and lessons learned 53
JapanPayments for forest and agriculture land management
Japan suffers frequent natural disasters, such as earthquakes, typhoons, or floods. In Japanese culture, people live within nature and have great respect for it. Against this background, payments for ecosystem service have taken place for over a hundred years, particularly for ecosystem services associated with forests. For example, the local government of Tokyo has held and managed forest in the upstream basin since 1901 to ensure that the watershed continues to provide water filtration and avoided soil erosion services.
Japan has mountainous landscapes and almost two-thirds of land is covered by forest. However, half of forest area is planted forest. In the past, the forestry sector expanded rapidly to support Japanese industrialization and urbanization after World War II and during the period of high economic growth from 1950s to 1960s. The current situation is very different. Japan imports cheap foreign timber, has an aging population and a declining domestic forestry sector. This has resulted in an expansion in the area of unmanaged plantation forests. Currently most of Japan’s forests are unmanaged and the ecosystem services provided by forests are degrading. The challenge for Japan is not decreasing forest area, but the degradation of plantation forest ecosystems through insufficient management, particularly on privately-owned land.
Payment schemes for ecosystem services have been implemented by both local governments and companies. Ecosystem service payment agreements are of three types. There has been direct negotiation between ecosystem service suppliers and beneficiaries, e.g. the local government of Tokyo has paid several companies for the conservation of watershed forest. Second, the government has applied earmarked taxes and/or charges, for water consumption for example, and payments are subsequently made to landholders in watersheds who adopt forest management practices that ensure the provision hydrological regulation. Third, there is small amount of trade in ecosystem services, for instance, a pilot carbon trading scheme organized by Ministry of the Environment.
A good example of a payment scheme based on direct negotiations between buyers (a company) and sellers (farmers) is implemented in Kyushu area. A company has introduced the concept of “returning groundwater that is consumed in a manufacture factory”. The company uses groundwater extracted from the aquifer under the factory. The company makes a contract with several farmers which allows the company to flood nearby agriculture fields between crop cultivation periods in summer. The flooded water filters down through the ground and recharges the groundwater aquifer. Payments are made from the company to farmers via local intermediaries. The payment is 11,000 JYen /10ha for 30 days of flooding and 16500JYen/10ha for 60 days. The payment is based on the farmers‘ costs associated with the preparation of land and flood management. There are several other direct negotiation examples in which companies provide monetary and/or non-monetary contribution to conserve forest ecosystems in upstream watersheds, on a voluntary basis.
Since 2003, 29 prefectures have introduced earmarked environmental fees on beneficiaries of forest ecosystem services. Part of the revenue is earmarked for direct payments to forest owners for forest management practices that protect critical watershed areas. Such a PES scheme is implemented in Toyota city in Aichi prefecture (adjacent to the COP-10 host city of Nagoya). 78 percent of tap water in Toyota city comes from Yasaku River. A surcharge on tap water (1 JYen/m3) was introduced in 1994 and its revenue is earmarked for the Toyota city tap water conser-vation fund, constituting, depending on the volume of water usage, 0.3 to 1.2 percent of the total water usage fee. Since 2000, the fund has financed water resource conservation projects in privately-owned plantation forests, such as tree thinning which is required in unmanaged plantations to reduce water uptake of young trees. Forest owners have to agree to halt clear-cutting of forest in order to receive payments from the fund. Similar tap water fees for conservation purpose have been introduced by other local governments, e.g. in Fukuoka.
In many prefectures, forest management is partly funded by earmarked local taxes. Kochi prefecture, in the south-west of Japan, was the first prefecture to introduce a local tax for protecting forest ecosystem service. The tax ranges from 500 to 1000 JYen per person, depending on the prefecture. Revenue generated from the tax is used for tree
54 CBD Technical Series No. 56
thinning and for transforming unmanaged plantation forests into natural mixed forests (broadleaf and coniferous trees) through enrichment planting. In Kanagawa prefecture, near Tokyo, a forest management tax was introduced in 2007. The tax rate was based on a study of willingness to pay and estimates of the expenditure required for the conservation project. There was extensive participation and public consultation with citizens on issues relating to the costs to households of the tax and on the use of tax revenue. Revenue is also used for household wastewater management, water conservation measures, and forest conservation and restoration.
However, there are several issues to be tackled. Most taxes earmarked for forest management are set at levels which are very low compared to willingness to pay. Because tax rates are low, little revenue for improving ecosystem management is generated. Moreover, these taxes are generally levied on all citizens in a prefecture and are not targeted to beneficiaries of ecosystem services. Finally, in some cases revenue earmarked for ecosystem manage-ment is used for non-forest management purposes.
In addition, Japan has introduced a number of PES-like systems at the local level, some of which also relate to payments for agriculture ecosystem services. For example, payments from local governments to farmers to encourage biodiversity friendly rice production are made to compensate for the additional costs even though biodiversity friendly rice sells at a premium.
replicability
The proliferation of PES schemes in Japan suggests that this experience is replicable.
Lessons learned
It is important to set the taxes that finance PES schemes at a level that approaches the marginal value of the ecosystem service used and which provides a level of revenue which can contribute to effective sustainable resource management.
In Japan each PES system is implemented independently, with no coordination amongst schemes. This negatively affects the effectiveness of schemes.
There seems to be considerable scope for bundling ecosystem service payments.
Source: Hayashi (2010).
Case studies and lessons learned 55
MexicoPayments for hydrological environmental services (PSAh) programme
Mexico’s predominant environmental issues are water scarcity and deforestation. Challenges associated with limited water supplies have been aggravated by (i) subsidies to electricity for pumping water and (ii) the failure to price water according to its scarcity. In order to combat problems of high deforestation and water scarcity, the govern-ment of Mexico developed a Programme of Payment for Hydrological Environmental Services of Forest (PSAH). This scheme was developed to make payments to forest owners to conserve forest in order to ensure watershed protection and aquifer recharge in areas where forestry was not commercially viable. The scheme is financed by increasing the already existing federal water fee paid by water consumers and earmarking a percentage to pay for environmental services. This mechanism to link those who benefit from environmental services to those who provide them was rather innovative at the time.
Two eligibility criteria were applied in order to ensure that payments covered the forests that are most important for water supply and at risk: participants had to be (i) located in over-exploited watershed areas (ii) at risk of deforestation. Research was undertaken to quantify opportunity costs near forested areas in order to estimate the amount per hectare that should be paid to compensate landholders. The objective was to maximise the area protected for a given budget. While the use of auctions was considered, they were not used because they were considered to be too innovative, difficult for potential participants to understand and, therefore, could potentially have very high transactions costs. A fixed price two-tiered payment approach was adopted with a base rate (US$18/ha) paid for most forest and a higher rate (US$27/ha) paid for cloud forest due to its important role in capturing water from fog in the dry season. Payments were made annually and contracts were signed for five years. Payment was conditional on performance, i.e. no payment was made if any deforestation took place in contracted areas.
First experience suggested that many payments had initially been made in areas of low deforestation risk and that improved targeting was needed to produce a greater environmental impact and to improve the cost-effectiveness of payments. The scheme has since introduced a series of weights for water scarcity, deforestation risk and poverty in the application grading system in order to improve targeting and efficiency.
Impact on biodiversity
Deforestation rates on land included in the scheme are very low (in fact the programme reported no deforestation in participating areas, but as this is unlikely it is thought that monitoring is not as rigorous as would be desired). The scheme is popular and is generally oversubscribed. In 2003, 127,000 ha were accepted for five years and in 2004 another 180,000 ha were enrolled. In 2005 a further 169,000 ha were included.
Lessons learned
Early evidence suggested that little additionality had been achieved. As a result, the scheme’s targeting and use of criteria in the selection of applications has been improved with a focus on developing an indicator for deforestation risk.
Rather than a providing a uniform payment to landholders who face different costs, a high degree of targeting should be combined, when possible, with a payment mechanism that reveals the true costs of conservation to different landholders. By paying landholders the minimum amount of compensation they need, PES schemes are able to maximise the area included in the scheme and thereby maximise their environmental effectiveness.
Sources: Muñoz-Piña et al. (2008).
56 CBD Technical Series No. 56
Nepalhimalayan biotrade
The Asia Network for Sustainable Agriculture and Bioresources (ANSAB) in Nepal created Himalayan Bio Trade Private Limited (HBTL) to market non timber forest products (NTFPs) to national and international markets. HBTL is a consortium of community-based enterprises that specialise in natural and sustainably sourced NTFPs (essential oils, handmade paper, and medicinal and aromatic plants) that hold organic and/or Forest Stewardship Council (FSC) certification. The scheme targets supply chains of multinational companies committed to sustain-ability and willing to pay price premiums for sustainably sourced material (Aveda, S&D Aroma, Altromercato).
At the local level, ANSAB favours incentive-based resource management strategies such as enterprise oriented community forestry. This approach links enterprise creation to forest management in an effort to ensure the sustainable use of forest resources. Local communities are therefore responsible for protecting and monitoring the resources which they are then able to harvest/sell. The scheme also ensures that communities are empowered to run the enterprises and manage the forest through capacity building to community members. ANSAB then facilitates the implementation of both a forest management plan and an enterprise development plan. Additional incentives are provided further up the supply chain by linking community enterprises so they are better able to compete and obtain higher returns internationally. Another form of ensuring a premium for the community products as well as an incentive to conserve the resources is to achieve Forest Stewardship Council or Organic Certification.
This integrated model of enterprise development and forest conservation has been successful and suggests that market creation may improve the financial sustainability of conservation/sustainable use efforts by harnessing a broad range of resources that do not rely on government financed direct payments. Such programmes also operate as an important means to changing local attitudes to conservation and hence increase buy-in for protecting local biodiversity. Besides the economic incentives that are created, improved social conditions for local communities also work in favour of protecting the local environment.
At the policy level, this initiative has succeeded in improving the policy environment for the sustainable manage-ment and use of forest resources as well as raising awareness of how policy-making is reflected on the ground. ANSAB has become a very well-reputed organisation at the national level being able to influence the government and other stakeholders on the non-timber forest product agenda. Through this programme, ANSAB has also intro-duced forest certification as a tool to promote sustainable forest management and sustainable business practices.
Impact on biodiversity
In developing enterprise-oriented community forestry and the Himalayan Bio Trade, ANSAB aimed to create economic and social incentives for biodiversity conservation in the rural areas of Nepal. Biodiversity in these areas was under threat due to the need for local people to secure their livelihoods and the lack of viable alterna-tives for doing so.
As a result of this programme, 80,000 hectares of forest land are currently under improved management, out of which 14,000 hectares are certified by the FSC. The programme has also led to the adoption of improved collection and trading practices by individuals and community groups. There have also been significant benefits associated with improved livelihoods for 15,000 households. In addition, the Aveda partnership has generated 30,000 jobs in rural areas.
replicability
ANSAB began testing the model of integrating enterprise development with forest management in a few rural villages and has continued to replicate this model in many of Nepal’s regions. Continued replication has then allowed the organisation to scale up the project through the creation of Himalayan Bio Trade. This has in turn added value to local products and therefore created additional incentives for conservation at the local level.
Case studies and lessons learned 57
From a global perspective, the number of biodiversity-based businesses focusing on the sustainable harvesting of natural products and NTFPs is steadily increasing (see http://www.iucn.org/about/work/programmes/business/bbp_our_work/biobusiness/). Examples of such businesses are becoming widespread: In Lebanon’s largest nature reserve, the Al Shouf Cedar Society works with local communities to produce and market the products that showcase the area’s traditions and the reserves resources. In the greater Mekong region, WWF and IKEA are working together to develop a model for sustainable rattan production and commercialisation that improves community welfare. In South Africa, the Flower Valley Conservation Trust works to ensure that flowers from the mega-biodiverse Cape Floral Kingdom are sustainably managed and harvested for sale to the retail flower industry.
Lessons learned
Devote time to developing appropriate business and forest management plans, including mechanisms for economic incentives that reward creativity and hard work
Stakeholder buy-in, involvement and collaboration are necessary for the long-haul.
It is essential to look at the bigger picture, think about the end-product and envisage the place where the business will end up. The market is complex and an effort should be made in understanding and responding to it.
Partnerships are crucial and can make the enterprise more competitive.
It is important to manage expectations, particularly from local communities.
It is necessary to think about scaling up early on and to ensure that the business has the capacity to do this without compromising the resources upon which it depends.
Sources: IUCN (2009); Subedi (2009).
58 CBD Technical Series No. 56
PeruPotato Park
In the Andes region, the place of origin for the potato, a wide diversity of potato species and varieties is still culti-vated and used, representing a gene reservoir of inestimable value for global food security. Even in this centre of diversity, however, there has been a dramatic decline in the cultivation of traditional varieties in recent decades, and some are on the verge of disappearing.
The Parque de la Papa, the Potato Park, was created with the help of the Quechua-Aymara Association for Nature and Sustainable Development (ANDES in Spanish) in order to address the dramatic decline in the cultivation of traditional varieties in recent decades. The Park covers, and is self-managed by, six Quechua communities on 12,000 ha, and contributes to preserving the 1,200 different potato varieties used in the region. A typical family farm grows 20 to 80 potato varieties, and more than 600 varieties of native potatoes are grown in the Park, most of them unique to this particular habitat.
The park also seeks to re-introduce varieties that have already disappeared from the region. An agreement of 2004 with the International Potato Center (CIP, part of CGIAR) committed CIO to repatriate and restore potato diversity. Since then, CIP has contributed hundreds of virus-free native potato varieties from its ex-situ collection. These varieties, according to CIP, yield 10% to 30% more than varieties that have not been cleaned of viruses. Importantly, the agreement foresees that the indigenous knowledge and ancestral technologies related to the Park’s varieties remain under local control.
Most potatoes in the Park are produced for the consumption of the Park’s inhabitants, while a small part of the produce is exchanged for other products through a barter system. To ensure the continued existence of the project, income-generating measures were taken together with efforts to further the awareness among producers and consumers of the importance of potato diversity. Activities include: the development of agro-tourism, a visitors’ centre with a potato exhibit and restaurant, better storage options and the sale of colourful potato mixes at the local supermarket chain.
Impact on biodiversity
By repatriating a large number of potato varieties, the project made a significant positive contribution to the in-situ conservation of plant-genetic biological diversity while, at the same time, contributing to an increase in yield (due to the fact that these varieties were disease-free). Efforts to raise awareness and marketing contributed to the success of the project as it increased popularity of the older potato varieties among farmers.
Lessons learned
Ex-situ conservation through gene banks can contribute to repatriating large amounts of plant varieties if farmers are willing to invest in them. Marketing and awareness raising can be useful, in particular if there is a potential for tourism development.
Partnerships between indigenous and local communities can contribute to the effective sharing and repatriation of knowledge and technologies while safeguarding community control in maintaining and utilizing plant genetic resources and associated traditional knowledge.
Sources: CIP (2008); Nill (2007).
Case studies and lessons learned 59
PhilippinesEnvironmental tax
The Laguna de Bay Region covers an area of about 3,800 square kilometers and includes the Philippines’ capital Manila as well as many smaller cities and around 360 square kilometers of urban and industrial area that spread outward from Manila. Twenty-one major rivers flow into the 90,000-hectare lake, which is the second largest inland water body in Southeast Asia. Laguna de Bay is the receiving water body for the entire watershed and of great importance for inland fish production (aquaculture in from of fish pens occupy a major part of the lake’s generally shallow surface area), irrigation uses, power generation and industrial cooling. Rapid urban and industrial growth has led to considerable environmental degradation, and continues to be an important threat to the lake’s ecosystem.
At the end-nineties, an industrial wastewater effluent fee programme was developed in order to create economic incentives for industry to reduce discharges and to raise revenues for financing the management of the programme and for environmental activities by local governments. The Environment User Fees System (EUFS) was designed to complement the dominant command-and-control approach to environmental policy. Reflecting the quantity of discharges, the costs of environmental externalities created by industrial discharges, and the budget requirements to administer the program, the fee comprises a fixed fee — designed to cover the administrative cost of running the programme — and a two-tiered variable fee based on the unit load of pollution of BOD (biological oxygen demand — an indicator for biological pollution). Covering around 900 companies at the end of the pilot phase in 2002, the programme is implemented by the Laguna Lake Development Authority (LLDA), the government agency responsible for protecting and managing the watershed. As in other cases, the introduction of disincentives through taxes or fees was combined with the provision of positive incentives on the expenditure side. In the EUFS case, twenty percent of the fee revenue are earmarked for local environmental projects such as the establishment of sewage plants, while eighty percent are used for monitoring and enforcement of the programme by the LLDA.
Impact on biodiversity
The pilot test of the EUFS programme resulted in a 88 percent reduction of BOD from direct discharges between 1997 and 1999 of affected companies. The regulatory monitoring and enforcement components of the programme led to closure of around 50 companies by LLDA between 1998 and 1999 for significant violations. Despite these successes, the ongoing and dynamic immigration to the Manila agglomeration continues, with a considerable degree of uncontrolled human settlement along river banks and the lakeshore areas, and the rapid development of economic activities. Consequently, the degradation of the lake’s ecosystem through pollution and siltation — including solid and liquid wastes from households, nutrient loading from agricultural and aquaculture activities, and industrial pollution — remains a major and ongoing challenge.
replicability
The EUFS is planned to eventually cover all water pollution sources from industrial, commercial, domestic and even agricultural sources. In light of the competing interest of a multitude of stakeholders, as a matter of strategy, LLDA seeks to implement the EUFS cautiously and by stages — for instance, a fee on fish pens was subsequently introduced and covers a significant part of the LLDA’s budget.
Lessons learned
Adaptive management is critical when introducing measures that are highly innovative against the pre-dominant regulatory style. In the EUFS case, some perverse incentives for dilution were detected because the variable fee rate was designed to also rely on concentration levels. Applying total pollution load management principles or the pricing of input water were suggested as possible responses.
Managing a lake basin in a highly dynamic socio-economic environment is an ongoing challenge. Keeping pace with rapid demographic growth and economic development requires continued work with the different stakeholders.
Sources: Manila, A. (2009); Nepomuceno D. (2004); Santos-Borja, A. and D. Nepomuceno (2004); UNESCAP and KOICA (w.d.).
60 CBD Technical Series No. 56
Saint LuciaSoufriere marine management Area
The establishment of Marine Management Areas (MMAs) is designed to reduce resource degradation and user conflicts through co-management arrangements and consultation among stakeholders. When the Soufriere Marine Management Area (SMMA) in Saint Lucia was officially established in 1995, local fishers lost many of their prime reef fishing areas. Evidence suggests that it takes several years for spill-over benefits, in form of increased fish production in marine reserves leading to emigration of fish to multiple use areas, to spread from newly protected area. Compensation and incentive-based measures were developed accordingly.
To mitigate the negative impact on the livelihoods of Soufriere fishers and to pre-empt increased fishing pressure on near shore resources, several initiatives were introduced to compensate local communities. During periods of hardship, temporary stipends and limited fishing rights were granted. The stipend aimed to discourage fishers from trying to earn a living by illegally fishing in the marine reserves. Repeat offenders would be fined, their gear confiscated and the stipend stopped.
A gillnet buy-back scheme was set-up after gill-nets were clearly linked to significant damage to coral reefs within the SMMA. Coastal fisher folk were provided with training to enable them to take up alternative employment opportunities, if desired. An investment fund was set up to provide fisher folk with loans to invest in activities other than coastal demersal fishing, e.g. deep sea fishing and tourism-related activities. User permits were sold for diving and sailing in the SMMA and increased recreational use generated income for the SMMA (through the user permits) and for the Soufriere community at large (through tourism).
The introduction of user fees provided revenue sufficient to finance most of the costs associated with the marine management area.
Impact on biodiversity
Evidence suggested that stocks of fish populations within the MMA increased significantly. However, fish landings from fished zones did not increase suggesting that it takes time for enhanced productivity in MMAs to spill over to neighbouring areas. The gains made to date are limited to areas within the MMA and still rely on a complete ban on fishing in reserves.
replicability
Additional MMA are envisaged in St. Lucia’s National Management Plan and Recovery Efforts for Marine Turtles. There was some conflict between stakeholders and as a result, institutions were reformed to better represent local needs a few years after establishment.
Lessons learned
The SMMA has allowed drawing useful lessons for effective stakeholder participation and conflict management:
the direct participation of resource users can be preferable. Community institutions do not always provide adequate representation and because stakes/interests often vary from individual to individual within the community.
Facilitating direct communication among stakeholder groups can be beneficial; for example, by allowing fishers to directly address conflicting interests to others, such as divers or yachts people.
The SMMA has functioned at the institutional level as long as the principles of participatory planning were followed.
Sources: Soufriere Marine Management Association (2010); St. Lucia Submission to the Executive Secretary of the Convention on Biological Diversity.
References 61
rEFErENCES
Aristizabal Buitrago, S.L. (2009): personal communication, October 2009.
Australia (2004): Biodiversity Stewardship Payments in Australia. Submission to the Executive Secretary of the Convention on Biological Diversity.
Hubacek, K. and W. Bauer (1999): Economic Incentive Measures in the Creation of the National Park Neusiedler See — Seewinkel. Submission of Austria to the OECD, https://www.cbd.int/doc/case-studies/inc/cs-inc-oecd-17-en.pdf
Asquith, N. M., M. T. Vargas, S. Wunder (2008): “Selling two environmental services: In-kind payments for bird habitat and watershed protection in Los Negros, Bolivia”. Ecological Economics 65: 675–684.
Asquith, N. and S. Wunder (2008): Payments for Watershed Services. The Bellagio Conversations. Fundacion Natura Bolivia: Santa Cruz de la Sierra.
Bahiigwa, G., K. Mugambe and E. Keizire (2003): Fiscal Reforms in Fisheries in Uganda. Presentation at Workshop on Fiscal Reforms in Fisheries, Rome, October 13–15, 2003.
Bacon, R. and M. Kojima (2006): Phasing Out Subsidies. Recent Experiences with Fuel in Developing Countries. World Bank Group, Financial and Private Sector Development Vice Presidency, Note 310.
Benoit (2008): Personal communication to Perrot-Maître from Marc Benoit, Researcher, INRA-Unité de recherche SAD (Sciences pour l’Action et le Développement), Mirecourt, 8 October 2008.
Binney, J and C. Zammit C (2010): Australian case study: the Tasmanian Forest Conservation Fund & Environmental Stewardship Program. Report to the OECD Working Group on Economic Aspects of Biodiversity, Paris.
CIP (2008): Potato Park could be secondary center of origin of the potato. Press release, 31 January 2008. International Potato Center, Lima.
Colombia (2004): Information on incentive measures for the conservation and sustainable use of biodiversity in Colombia. Submission to the Executive Secretary of the Convention on Biological Diversity.
Cutbush, G. (2006): Incentives for natural and cultural heritage conservation, prepared for the State of the Environment Report 2006. Dept of the Environment, Water, Heritage and the Arts.
Department of Sustainability and Environment (2008): BushTender: Rethinking investment for native vegetation outcomes. The application of auctions for securing private land management agreements. State of Victoria, Department of Sustainability and Environment, Melbourne.
De Moor, A.P.G. and P. Calamai (1997): Subsidizing Unsustainable Development: Undermining the Earth with Public Funds. The Earth Council, San Jose, Costa Rica.
Denmark (1998): Economic Incentives for the Transformation of Privately Cultivated Forest Areas into Forest Reserves.Submission to OECD the Expert Group on Economic Aspects of Biodiversity, Paris.
Egypt (2009): Promotion of positive incentive measures in Egypt. Submission to the Executive Secretary of the Convention on Biological Diversity.
Engel, S., S. Pagiola, S. Wunder (2008): “Designing payments for environmental services in theory and practice: An overview of the issues”. Ecological Economics 65, pp. 663–674.
European Community (2004): Incentive measures in the European Union and some of its Member States. Submission to the Executive Secretary of the Convention on Biological Diversity.
FAO (2002). Forest Policy in Cambodia. Proceedings of the Forest Policy Workshop Kuala Lumpur, Malaysia 22–24 January, 2002.
FAO (2005) Global Forest Resources Assessment. Rome.

62 CBD Technical Series No. 56
FAO (2006): Paying Farmers for Environmental Services. The State of Food and Agriculture 2006. Food and Agriculture Organization of the United Nations, Rome.
Frost, Peter G.H., Ivan Bond (2008). “The CAMPFIRE programme in Zimbabwe: Payments for wildlife services”. Ecological Economics 65 (2008): 776–787.
Gehiny, Atef Darwish (2010): personal communication, February 2010.
Ghosh, A. (2009): personal communication, November 2009.
Government of Uganda (2009): Water and Environment Sector Performance Report 2009. Ministry of Water and Environment, Kampala.
Hayashi, K. (2009): The Japanese Approach on Positive Incentives for Biodiversity. Presentation made at CBD Workshop on Perverse and Positive Incentives, Paris, October 2009.
Hayashi, K. (2010): personal communication, February 2010.
India (2004): Case-study on incentive based mechanisms for watershed management. Submission to the Executive Secretary of the Convention on Biological Diversity.
India (2009): Implementation of Article 11 of CBD. Submission to the Executive Secretary of the Convention on Biological Diversity.
International Union for Conservation of Nature (2009). The Time for Biodiversity Business. Gland, Switzerland: IUCN. 20pp.
Kaggwa, R. (2009): personal communication. NEMA, Uganda.
Kashindi, M. (1999). Management of the Deep-Sea Fishery of Namibia Orange Roughy . United Nations University, Fisheries Training Programme.
Kazoora, C. (2010): Policy, market and institutional failure undermine fisheries sustainability of Lake George. Mimeo. Kampala.
Kim Phat, N., Ouk, S., Uozumi, Y., and Ueki, T. (2001) A case study of the current situation for forest concessions in Cambodia — Constraints and prospects. Journal of Forest Planning 7 (2), 59–67.
Kojima, M. (2009). Government response to oil price volatility. Extractive Industries for Development Series No. 10, July 2009. World Bank, Washington D.C. http://siteresources.worldbank.org/INTOGMC/Resources/10-govt_response-hyperlinked.pdf
Landell-Mills, N. and I.T. Porras (2002): Silver bullet or fools’ gold? A global review of markets for forest environmental services and their impact on the poor. International Institute for Environment and Development: London.
Latacz-Lohmann, U. and Schilizzi, S. (2005). Auctions for Conservation Contracts: A Review of the Theoretical and Empirical Literature. Report to the Scottish Executive Environment and Rural Affairs Department.
Manila, A. (2009): Philippines’ Initiative on the Implementation of CBD Article 11 “Incentives Measures”. Presentation made at CBD Workshop on Perverse and Positive Incentives, Paris, October 2009.
Monamati, M. (2009): personal communication, October 2009.
Muñoz-Piña, C., A. Guevara, J.M. Torres, and J. Braña (2008): “Paying for the hydrological services of Mexico’s forests: Analysis, negotiations and results”. Ecological Economics 65 (2008): 725–736.
Myers, N., with J. Kent (1998): Perverse Subsidies — Tax Dollars Undercutting our Economies and Environments Alike. International Institute for Sustainable Development, Winnipeg, Manitoba, Canada.
Nepomuceno, D. (2004): The Environmental User Fee System in the Laguna de Bay Region. A Pioneer Market-based Instrument for Pollution Prevention and Abatement in the Philippines. Mimeo. Asian Development Bank.
Nestlé, S.A. (2002): Nestlé Sustainability Review, Nestlé, Vevey Switzerland. Available at: http://www.nestle.com/Resource.axd?Id=3510946B-2D94-4348-8AB1-BBF5E1D89583
References 63
Nestec Ltd. Environmental Affairs Department (2003): Nestlé and water: sustainability, protection, stewardship Switzerland. Available at http://www.nestle.com/Resource.axd?Id=86CD1825-A3AB-44AC-946C-FC8EDC0E86BF
New Vision (2010): Uganda: Government set to revamp fish sector. New Vision (Uganda), Wednesday, 06 January 2010.
Nichols, P. in U.R. Sumaila, David Boyer, Morten D. Skogen and Stein Ivar Steinshamn. (Editors). 2004. Namibia’s Fisheries: Ecological, economic and social aspects. Eburon Academic Publishers: Netherlands.
Njinyam, S. (2009): Bioresources Development and Conservation Programme, Cameroon. Personal communication, October 2009.
The Norwegian Ministry of Fisheries and Coastal Affairs (2010): Personal communication, February 2010.
Ocampo, F. (2008): Forestry Project for Chinchiná River Basin. Environmental and Productive Alternative for the City and the Region. Paper presented at International Seminar on CDM projects and voluntary markets in the forestry sector - a tool to address global climate change, Bogota 7–9 April, 2008.
OECD (1999): Handbook of Incentive Measures for Biodiversity. OECD, Paris.
OECD (2003): Subsidy Reform and Sustainable Development: Economic, Environmental and Social Aspects. OECD, Paris.
OECD (2005): Environmentally Harmful Subsidies: Challenges for Reform. OECD, Paris.
OECD (2006): Subsidy Reform and Sustainable Development: Economic, Environmental and Social Aspects. OECD Sustainable Development Studies, Paris.
OECD (2007): Subsidy Reform and Sustainable Development: Political economy aspects. OECD, Paris.
OECD (2008): Implementation of the 2004 OECD Council recommendation on the use of economic instruments in promoting the conservation and sustainable use of biodiversity. OECD, Paris.
OECD (2009): Agricultural Policies in OECD Countries. Monitoring and Evaluation. OECD, Paris.
Pagiola, Stefano (2008): “Payments for environmental services in Costa Rica”. Ecological Economics 65.
Parkes D., G. Newell and D. Cheal (2003): “Assessing the quality of native vegetation: the habitat-hectares approach”. Ecological Management & Restoration 4: Supplement: 29–38.
Pasandaran, E., M. Rantetana, and Iqbal (2003). Economic and Agricultural Policy Development in Indonesia: Summary. Paper prepared for Roles of Agriculture project. FAO.
Perrot-Maître, D. (2006) The Vittel payments for ecosystem services: a “perfect” PES case? International Institute for Environment and Development, London, UK.
Perrot-Maître, D. (2010): Personal communication, February 2010.
Phuthego, T. C. and R. Chanda (2006): “Traditional ecological knowledge and community-based natural resource management: lessons from a Botswana wildlife management area”. Applied Geography 24, 57–76.
Pierre (2009): Personal communication to Perrot-Maître from Philippe Pierre, Agrivair Director, 24 March 2009.
Pieters, J. (2003) “When removing subsidies benefits the environment: Developing a checklist based on the conditionality of subsidies”. In: OECD (2003): Environmentally Harmful Subsidies: Policy Issues and Challenges. OECD, Paris.
Porras, I., M. Grieg-Gran, and N. Neves (2008): All that glitters — A review of payments for watershed services in developing countries. IIED, London, UK.
Rae, A. and D. Blandford (2004): Adjustment to Agricultural Policy Reform- Issues and Lessons from the New Zealand Experience. Massey University, New Zealand, and Pennsylvania State University, USA.
64 CBD Technical Series No. 56
St. Lucia: Submission to the Executive Secretary of the Convention on Biological Diversity. St. Lucia: Adjusting to a new way of life — Management areas and fishers. By D. Pierre.
Santos-Borja, A., and D. Nepomuceno (2004): Experience and Lessons Learned Brief for Laguna de Bay. Mimeo.
Soufriere Marine Management Association. http://www.smma.org.lc/Activities.htm. Accessed July and August 2010.
Stoneham G., V. Chaudri, A. Ha, and L. Strappazon (2003): “Auctions for conservation contracts: an empirical examination of Victoria’s BushTender trial”. Australian Journal of Agricultural and Resource Economics 47: 477–500.
Subedi, B. (2009): Personal communication from Bhishma Subedi, Executive Director, ANSAB.
TEEB (2009): “Reforming Subsidies”. TEEB Report for National and International Policy Makers, chapter 6. The Economics of Ecosystems and Biodiversity (TEEB), United Nations environment Programme, Bonn.
The Telegraph (Calcutta), 07.07.09.
Thampi, S. (2009): “Ecotourism in Kerala: Lessons from Eco-Development Project in Periyar Tiger Reserve”, http://ecoclub.com.library/epapers/13pdf. Part of India submission to Executive Secretary of the Convention on Biological Diversity.
Twyman, C. (2000): “Participatory conservation? Community-based natural resource management in Botswana”. Geographical Journal 166, 323–35.
UNEP (2008): Reforming Energy Subsidies - Opportunities to Contribute to the Climate Change Agenda. United Nations Environment Programme, Geneva.
UNESCAP and KOICA (w.d.): Good Practices on Eco-efficient Approaches for Water Resource Planning and Management. Prepared by B. Sinha and T. H. Kim for the United Nations Economic and Social Commission for Asia and the Pacific and the Korea International Cooperation Agency.
Vasquez, R. G. (2009): “The Cuban Environmental Policy: Experiences on Positive Measures for Biodiversity”. Submission to the Executive Secretary of the Convention on Biological Diversity.
Vitalis, V. (2007). “Agricultural subsidy reform and its implications for sustainable development: the New Zealand experience.” Journal of Integrative Environmental Sciences 4, 21–40.
World Bank (1997): Expanding the Measure of Wealth — Indicators of Environmentally Sustainable Development. Environmentally Sustainable Development Studies and Monographs Series No. 17. Washington, D.C.
World Bank (2005): Environmental Fiscal Reform. What Should be Done and How to Achieve It. International Bank for Reconstruction and Development, Washington, D.C.
World Bank Inspection Panel (2006). Investigation Report, Cambodia: Forest Concession Management and Control Pilot Project. Report No. 35556.
Wunder, S. and M. Albán (2008a): “Decentralized payments for environmental services: The cases of Pimampiro and PROFAFOR in Ecuador”. Ecological Economics 65 (2008): 685–698.
Wunder, S., S. Engel, S. Pagiola (2008b): “Taking stock: A comparative analysis of payments for environmental services programs in developed and developing countries.” Ecological Economics 65.4 (2008): 834–852.
Zammit C, Attwood S & Burns E (in press) “Using markets for woodland conservation on private land: lessons from the policy-research interface”. In: Lindenmayer, D., A. Bennett and R. Hobbs (eds.): Temperate Woodland Conservation and Management, CSIRO Publishing, Melbourne.
Zammit, C. (2010): personal communication, March 2010.
Zapata, A., E. Murgueition, C. Mejia, A.F Zuluaga, and M. Ibrahim, M. (2007): “Efecto del pago por servicios ambientales en la adopciòn de sistemas silvopastoriles en paisajes ganaderos de la cuenca media del rìo La Veija, Colombia». Agroforesteria en las Américas 45.

Financial support for printing this document is provided by the
European Union and Sida.