Embed Size (px)
Citation preview
Incentive compensation schemes:Experimental calibration of the rationality
hypothesis*
ALISON J. KIRBY University of California, Berkeley
Abstract. Behavior inconsistent with expected utility maximization is widely observedand explanations for it abound. The purpose of this research is to identify conditionsunder which choice behavior is most likely to be consistent with EUM predictions, inorder to ensure the successful implementation of economic prescriptions derived underthe assumption of EUM rationality. Specifically, a laboratory experiment is used to testthe hypothesis that the distinctness between alternatives in a menu of contracts is crucialin determining the likelihood that agent choices are consistent with EUM predictions, andconsequently, in the case of incentive compatible contracts, leads to accurate revelationof private information. The results support this hypothesis.
Resume. L'on observe frequemment des comportements incompatibles avec la maximi-sation esperee de l'utilite, et les explications a ce sujet foisonnent. L'etude qui suit apour but de determiner dans quelles conditions le comportement de choix est le plus sus-ceptible d'etre conforme aux predictions relatives a la maximisation esperee de l'utilite(MEU), et de garantir ainsi le succes de 1'implantation des prescriptions economiquesderivees de I'hypothese de la rationalite de la MEU. De fa§on plus precise, l'auteureprocede a une experience de laboratoire pour verifier I'hypothese selon laquelle la clartedes differentes possibilites d'un menu de contrats est cmciale dans la determination dela probabilite que les choix du mandataire soient conformes aux predictions relatives ala MEU et qu'en consequence, dans le cas de contrats qui se pretent a l'application demesures d'incitation, cette clarte ne masque pas la revelation de la veritable infonnationpdvilegiee. Les resultats de I'etude confirment cette hypothese.
IntroductionJust as researchers have shed the world of perfectly competitive markets andsytnmetric, perfect information to analyze more interesting and general imper-fect competition and asyrometric information models, this paper represents anattempt to step away from the expected utility-maximizing (EUM) rationality as-sumption prevalent in the literature. Behavior inconsistent with EUM is widely
* Helpful comments by the discussants Nick Dopuch and John O'Brien, and by Stan Baiman,Nils Hakansson, Russell Lundholm, Steve Penman, Stefan Reichelstein, Janet Yellen, andseminar participants at the University of California Berkeley, the University of Oklahoma,and the 1990 CAR Conference are gratefully acknowledged, as is the research assistance ofRanjan Sinha, Laude Morgan, Tae-Young Paik, and Changyong Ham.
Contemporary Accounting Research Vol. 8 No. 2 pp. 374-408
The Rationality Hypothesis 375
cbserved, and explanations for it abound.' For example, individuals make noia-liL•^4 choices because they are insufficiently rewarded irt making their choicesto overcome fhe cost involved in processing all the infonnation required to repli-CH?e BUM choice behavior. Aitematively, the behavior is attributed to inherentMmitaiions m humans' abilily to perceive differences between very similar al-icfnacives, whether the alternatives are gambles or simply physical stimuli.
Tbe raotivation tor considering issues of non-EUM behavior derives fromthe wish to impiement a particular class of compensation schemes derived inOsbsrid arid Reichelstein (Oi&R) (i984).^ The compensation schemes proposedb;' O&R elicit from an EUM agent the mean of his privately known prob-ai'.iiirv distribution about some parameter. These compensation schemes eachconsist of a inenu of linear compensation functions.^ Each compensation func-tion is paiasiielerized by a particular report of the agent's private informationard is a Hnear function of the ultimately observed outcome. Several accountingresea;cher.s have proposed the use of menus of compensation functions for elic-it;'ig private information from subordit^ates for purposes such as setting morerealistic standards and budgets. "
Tlie concern regarding implementation is the following. If an agent facingKfi O&R scheme makes choices between the items on the menu in a mannerihii: is not consistent wiih EUM predictions, then there is no guarantee thatthe resiiiting choices reflect his private information. Consequently, the primarypiirpose i.r. implementing the O&R schemes is lost. TMs concern provides theri'iiitivation for this reseajxii. The objective is to predict when choice behavior;:• :ikely to be consistent with BUM predictions in the context of agents' re-actioiis 10 menus of compensation contracts. If we are able to predict whenagii-nLs' choices aie most iike]y to be consistent with EUM predictions, we canadjust the implementation enyironmenr for the O&R compensation schemes so•is. :.o optimize the probability of HUM reactions by the agents and consequentlya'.&'j Qptimaii; ' rsalize the prcdictv;d desirable theoretical outcome (in this case,optimaliy accurately re.vealed private information at minimum cost).^
The theory used in directing the search for predictability of non-EUM versusEUfvi choices derives froiii the literature on probabilistic choice, contributed to'jy esiononsists. tnathemat;ca.i pisychologists, and psychophysicists.* This litera-
' 'Ve ..haii i!f.e the shorthand "noTi-^i'J^! hdiavior" to refer to choice behavior inconsistent with• '.LWi j;reiji;'tions.
2 ' 'hh particular ciasa of compeiiiatiors vdiemes is now being implemented. (See Reichelstein,•C9C).
?. Mere pi'S'jiseiv, liie compensetion functions dvc linear only if the agent is assumed risk neutral." !iiri, Kina:-d, anc- Pumey (i968), Gonik (I\m).. and Kaplan (1989) also describe a class of
i'ie;ii.s, men nizna :?ieing composed of a sot cf kinked compensation functions. Such menus•;.'e des.-gned ;o elicit the median (or any otner percentile) of a privately known distribution.i Wdizr'ian, )976, refers li> th-s class oi' schemes as "Soviet Incentive Schemes.")
'• r-u: exampk, if knowledge of the private information is sufficiently valuable to the principali]! h'li- c'ecis!on-m:iking (planning) roie. she may wish to design the implementation environ-" cnr tr. gisuraniec that the rigcint is able ;o react as if he is perfectly EUM, and consequentlyyi-r!eci.l: '.cveal his private inJormation about the mean.
,':• Hii'cn {198.1) provides ar. extensive di cussiOT of probabilistic choice models and their impli-
376 A.J. Kirby
ture models the observation that when faced with the same alternatives, underseemingly identical conditions, people do not always make the same choice. Toaccount for this inconsistency in individual choice behavior, the choice processis modeled as if it were probabilistic.^ The idea that indifference between twoidentical alternatives results in random selection of either altemative and thatsuch choices are well represented by a choice probability (namely 0.5) is intu-itive.^ The probabilistic choice model (PCM) literature also hypothesizes thatchoice between altematives may be modeled as if it is probabilistic even whenone is not strictly indifferent but when preferences only marginally favor one ofthe altematives. Such behavior is represented by choice probabilities other thanone-half.
Branches of the PCM literature differ as to the hypothesized nature of theprobabilistic element in the decision maker's choice behavior. However, a ro-bust prediction is that the probability of choosing one altemative over anotheris a function of the distance between them.' With reference to the situationof an agent selecting between contracts on a menu, the distance between twocontracts could be measured by the positive difference in expected utilities ofthe contracts, normalized by the greater expected utility. The specific researchquestion addressed can now be stated. In the context of selecting a compensa-tion contract from a menu of such contracts, are agents more likely to selectthe EUM choice when the normalized difference in expected utilities betweenaltematives is greater than some threshold level? This question is addressedempirically using a laboratory experiment.
The results of the experiment confirm that the proportion of choices con-forming to EUM predictions is strongly correlated with the distinctness of theexpected utilities of the particular altematives involved as measured by the nor-malized difference. How the probability of EUM rational choices increases withthe normalized difference in expected utilities between altematives on the menuis also calibrated. The experimental results thus provide evidence that successfulimplementation of the O&R schemes requires treating the normalized differencesin expected utilities between items on the menu as choice variables themselvessince they affect the reliability and hence value of the information revealed.
The results of this research may also be applicable to the implementationof other economic prescriptions derived under the assumption of EUM agent
cations for classical itiformation economics results important in the accounting literature.For the most part, however, it treats the actual choice process as a black box.There are two cotnmon interpretations of a choice probability. First, it may be viewed as therelative frequency with which x. is chosen in repeated identical choice opportunities withthe choice set {x,y}. Second, a choice probability may be viewed as the decision maker'sconfidence judgment that x would be chosen from the choice set C in a unique hypotheticalchoice opportunity. The distinction between these is analogous to the familiar distinctionbetween objective and subjective probabilities. In the experiment, relative frequencies are usedto measure the choice probabilities.These models are closely related to psychophysical theories in which the probability of judgingone object as heavier than another, for instance, is assumed expressible as a monotonic func-tion of the difference between their scale values. (See Luce, 1959.)
The Rationality Hypothesis 377
behavior, especially where the choice alternatives are also gambles. Further-more, these results may ultimately provide clues for refining the assumptionsabout individual choice behavior used in economic modeling. Laboratory testingwas chosen as the appropriate vehicle for researching this issue in light of theexperimental control it offers over variables such as dispersion of information,environmeotal uncertainty, and preferences and incentives of those whose actionsare being monitored.
The remainder of the paper is organized as follows. The tlieory underlyingthe paper is described in the next section, which also includes a numericalexample showing how the preference between altemative menus is a function ofthe degree to which agent behavior is predicted to be EUM. The third sectioncontains a description of the experimental design together with justifications forits major features. Results are summarized in the fourth section and conclusionsin the fifth.
Theoretical backgroundThis section describes in more detail the theory underlying the O&R class ofcompensation schemes and PCMs. It also shows how the probabilistic natureof choice behavior can be included as a choice variable in the design of menusof contracts so as to ensure efficient implementation of O&R compensationschemes.
0<kR compen.saiion schemesThe particular class of compensation schemes examined is that developed byO';band and Reicheistein (1984). They examine a principal-agent setting with.x';\ nimetric information, in which only the agent knows the distribution of a;ii>en paranieter. For her decision-making purposes, the principal wants to knowfhc expected value of the distribution. For ease of translation to the experimentaljcc; ario, ihe description of O&R's theoretical results is couched in a salesmaisager/deraarifi information setting.
Suppose that the random variable actual sales. A, has a cumulative probabilitydisr.ibution Fi;^.) on the interval [A*, A*}, which only the agent knows. Supposethe ageni is to be compensated according to the following scheme, which canbfi -.riought cf as a .menu of contracts, where B is a value to be supplied by the
, B) = v{B) + wiB)iA - B].
A risk-tieutral EUM agent selects a value of B (or, equivalently, a particularcontract) so as to maximize his expected compensation:
max EA(H{A, B)) = max EAHB) + wiB)(A - B)]
= max v{B) + w{B)[E{A) - B]B
378 AJ. Kirby
The first-order condition for the solution requires
v'{B) + [£(A) - B]w'(B) - wiB) = 0.
For the contract to be incentive compatible, the agent must be motivated toannounce B = E{A). Consequently, it must be the case that w(B) = v'(B).Furthermore, the second-order condition for a maximum requires
v"{B) + w"{B)[E{A) ~B]- w'{B) - w'{B) < 0.
Substituting the conditions implied by the first-order condition therefore requiresthat w'{B) = v"{B) > 0 (i.e., v(-) must be convex), and
H{A, B) = v(B) + v'(B)[A - B]. (1)
In addition, compensation is designed to increase in A conditional on B byassuming that v'(B) > 0. This class of compensation schemes will be referredto as O&R compensation schemes. Compensation schemes within this classdiffer in terms of the particular form of their v(-) functions, but they all havethe property of motivating an EUM agent to reveal accurately the mean of hisprivately known distribution. " The results derived under the assumption of arisk-neutral agent are easily extended to the case of an agent with a genericutility function. (See Appendix A for details.'')
Regarding optimality within the class of O&R schemes, if there is no reasonto expect misstatement of the private information, the cost-minimizing scheme(in which the slope and convexity of the v{B) function is minimized) is alsooptimal. However, agents whose behavior is not perfectly consistent with EUMpredictions may misstate their private information, for reasons such as thosegiven in the introduction. In this case, the optimal O&R scheme is unlikely tobe the cost-minimizing one. '
As with other communication-based compensation schemes, these O&Rschemes can be implemented either by asking the agent directly for a budgetvalue, B, or by asking the agent to select from the menu of contracts, whereeach contract is parameterized by a possible B value.'^
10 A litniting case in this class of schemes is the compensation contract, which is a constantfunction of B.
11 It should also be noted that although other compensation schemes may induce a partial sepa-ration of types, if the class of admissible probability distributions is sufficiently rich, then onlythe O&R schemes will achieve incentive compatibility for all types.
12 The desire to conceal shirking behavior in the presence of moral hazard provides an additional,independent motive for the agent to misrepresent his private information. (In such a case, themisstatement would be intentional and strategic on the part of the agent.) How the O&Rschemes fare in a setting of moral hazard is addressed in Kirby et al. (1990). It is shown thatagents have incentives to reveal accurately their expectation conditional on the level of effortthey provide. Furthermore, it is shown that under some circumstances, these schemes are alsoefficient. Further comments on how the introduction of moral hazard into the setting affectsthe results of this experiment are given in the conclusion.
13 Although these methods of implementation are theoretically assumed equivalent in terms oftheir incentives, practically speaking, this may not be the case. For example, the results in
The Rationality Hypothesis 379
Probabilistic choice modelsMany PCMs are described in the literature (see Hilton, 1985; Coombs, Dawes,and Tversky, 1970). Many of these are special cases of the following strong(binary-) expected utility model. Let Xjj be elements of the choice set C, withp{x,y) the probability of selecting x from the choice set {x,y}. The set S = {s}is the set of states, r denotes the outcome function (i.e., r:CxS —^ r(C,S)), andr{C, S) denotes the set of possible outcomes from dsky choices in C.
A strong binary-expected utility model (of risky choice) is a set of binat}'choice probabilities for which there exists a real-valued function u with domainr(C\S) and a nondecreasing function/ such that for all p(i;,y)c(0,1):
i p(x, y) ^flEuirix, s)) - Eu(r(y, s))], and
a lim /(v) = 0, lim /(v) = 1, and/(v) + / ( - v ) = 1 for all v
Tw.s model claims that the probabiiity of selecting the EUM alternative fromthe menu is an increasing function of the degree to which the payoff to the agentof rbe .EUlVs aheraative dominates that of another alternative.
Such a pic'babi'iistic choice model may be used to describe the behavior of anageril vvho js iirnited in his ability to combine and condense all the informationavailable to him in a manner that is consistent with EUM, and consequentlyoccisicnatly "rajikes mistakes" because the effort of processing is perceivedi':> iiutv/eigh the gain from selecting the alternative that will in fact provide£ g;e;alei expected uliliiy payoff to the agent. ' Alternatively, such a modelis iiiso consistersL '.vith the idea tliat there is a physical limit to our ability todiscriminate between aUcrnalives These explanations are referred to as constantitiii'iy rnodeL. (See Luce, 1959.) The underlying idea is that the decision problem:,• viewsd as a. discrimination problem where the individual is trying to determinev/hich alternative v.'ould be more satisfying. If the agent is unable or unwilling'c; choose strategically, he is assumed to choose randomly.
'ihe sfong expected utiiky model is also consistent with the hypothesis that• he Jtilitj' an agent assigns ia a particuhir outcome is a random variable. Ifihi< is the case, the expected yttUiy associated with a particular gamble is also ar: r!C!;o.rTi vanable. This too may give rise to observed inconsistencies in behavior,
Baiman and Lewis (1989) suggest that asking the agent directly for an estimate is preferableif an agent is motivated by ethical concerns. Similarly, there may be situations in which onlythe iattei implementation is feasible. Inability to provide a direct revelation together with easeof selecting from a menu is common. For example, menu-driven DOS instructions can becoixectiy selected by individuals who have no idea of the language of DOS commands; identi-fication of a criminal from a Kneup is possible where complete description of the individual isrice.
14 Many alternative explanations for probabilistic choice behavior exist Imiividuals make mis-takes due to the complexity of choice problems and these are random. Individuals simplifythe choice process in a way that is random across choice opportunities. Choice alternativesgenerally have multiple attributes that may be tended to in random sequence across choice op-porturiities. The point is that choice may be probabilistic because of the cognitive limitationsof iiuiBan decision makers.
380 A.J. Kirby
which can be described and predicted by a probabilistic choice model such asthe one above. In this situation although the expected utility that the individualassigns to a particular altemative is random, he may have no trouble discerningwhich altemative provides the greater expected utility on a given choice occasion(i.e., his choice is not random), although repeated choices between the samegambles may be inconsistent. Models based on this type of explanation aretermed random utility models. (See Luce and Suppes, 1965.)
Implementation of the O&R class of schemesConsider the implications of probabilistic agent choice behavior for efficientimplementation of the O&R compensation schemes. It is conjectured that if themenu contains contracts (gambles) that are "sufficiently" distinct, the agent'schoices will replicate those of an EUM decision maker, and the agent's privateinfonnation about the mean will be perfectiy revealed. If, on the other hand,the altemative contracts are very similar in terms of their consequences to theagent, he may not be willing or able to discem the EUM one and may onoccasion choose the non-EUM altemative, thereby only probabilistically (i.e.,imperfectly) revealing his private information.
In the following discussion, the selection of a particular O&R compensationscheme from the whole O&R class corresponds to the selection of the v(B)function from equation (1), or equivalently as the selection of a set of contractswhose envelope is convex and has positive slope. The principal is clearly notindifferent between all O&R schemes: the more convex is a particular scheme'sv{B) function (for a given intercept), the greater is the associated expected costof compensating the agent. It is shown below, however, that the benefits to theprincipal may also be a function of the convexity of the v{B) function.
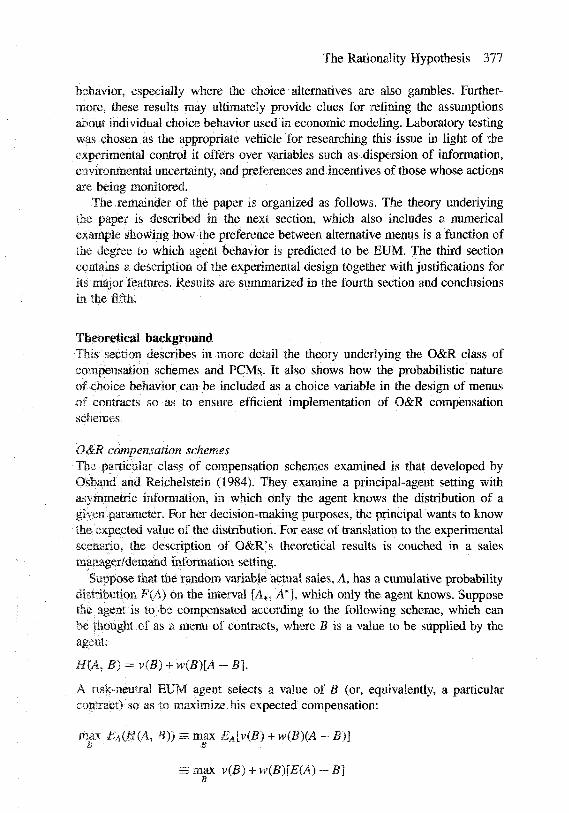
Example. Compare retums to a principal from two potential two-contract menus,both consistent with O&R specifications. The agent's private information, thedistribution of actual sales, may take on two possible mean values, either 10or 12, and the principal places equal priors on these two possibilities. A is theactual jointly observed level of sales.
E{Hi\E{A) = 10] E{Hi\E{A) = 12] £E(A)max[£[/f,-|£(A)]]Menu 1:
1122
1142
Note that both menus motivate a separation of types. For example, if and
Hi = 900 + 20A
H2 = 856 + 24A
Menu 2:
Hi=900 + 20A
H3 = 800 + 32A
1100
1096
1100
1020
1140
1144
1140
1184
The Rationality Hypothesis 381
only if the agent's private information about the distribution of A has a mean of10 does an EUM agent have an incentive to select contract Hi (in both menus).Furthermore, these two menus can be characterized by the distinctness of theirconstituent altematives. The expected payoffs of menu l's altematives are lessdistinct than those of menu 2 (i.e., a normalized difference of 44/1144 versus84/1184).
The value of infonnatioji is a function of its reliability. In this example, ifChe principal can rely on ihe mean having been perfectly revealed, we assumeihai she enjoy.s expected returns of $1200. However, the expected retums underimperfect (80 percent reliable) information is assumed to be only $1150.
Consider two scenarios, fn the first, the agent always makes choices as if he isma::;.iri)i/ing expected utility. In the second scenario, the agent's choices are notalway:; coiLsJstent with EUM behavior and his choices therefore only imperfectlyrev;ja] the mean of bis privately known distribution. Specifically, the agent selects;hs EUVi choice with probability 80 percent if the normalized difference inexpected utilities is less than 2 percent. However, differences greater than 2perceri'i; are peiiectly disceraibie by the agent and generate EUM choice behaviorori his part.
Scenario I: BUM agent. In this case, the expected retum to the principal istbe same 'ibr both menus: SJ2(K). The expected cost of compensation is $1122ur cier me:au 1 and $1142 under menu 2. The principal's preference betweenthe iv.C! rneaus is driven by the comparative cost. Menu 1 would be preferred,generating a net benefit of $T^. (In fact, most preferred would, be a menu inv.'hit;.h the distinctness between the contracts was minimal, implying a net benefitapproaching $100, given contract Hi)-
Sccnarif.) II: Probabilisticaily EUM agent. Under this scenario, since the dis-linctness i etvveen the two contracts in the second menu exceeds 2 percent forbc-ti'. typci, k is riui'ficient 'or ihe agent to be able to choose as if he is EUM;cor: .iquenily, he reveals the mean perfectly to the principal. However, the lesserdegree of distinctness between the contracts in the first menu is assumed tocad so choices by the agent that are described as if they are probabilistic: the
probability of his picking the contract that reveals his type is only 80 percent.C(:ij;.eo;ue.ntiy, t ic returTi to the principal generated by menu 1 is $1150 and byQisn-.i 2 h $1200. The e.Kpected costs of the menus differ from each other andiilso .slightly from those in scenario 1. The expected cost of menu 1 is $1121.2,'^•.vhiJe the expected cost of '.nenu 2 is the same as in scenario I = $1142. Thus,..mde: scenario JJ, the principal is better off with the second menu, since the netoeruifn of menu i =~ SI ]5()-$ll21.2 = $28.8, which is less than that of menu2 =• is!2(K)-$u42 =: S58..
Vadtr: scenario fl, the dtslinctness of menu l's altematives generated only
15 The expected cost of menu I is 0.5 x [0.8 x £(choosing Hi\ private information of E{A) =IG) + 0.2 X £(choosing H2I private infonnation of E(A} = 10)] + 0.5 x [0.8 x E{H2\E(A) =12)+ 0.2 X E(HilE(A) = 12)], which is $1121.2.
382 A.J. Kirby
an 80 percent probability that the agent would "recognize" the EUM choice,but the distinctness between items on menu 2 was sufficient to guarantee thatthe agent would recognize and choose as if he were EUM. Under an incentive-compatible compensation scheme such as the O&R scheme, this probability ofEUM choice is exactiy the probability of the agent revealing the mean accuratelyand can be interpreted as a likelihood function by the principal. The aboveexample showed how these probabilities in tum affect the expected retumsgenerated by the two menus, the expected cost of compensation, and ultimatelythe principal's preference between the menus; thus, the degree of distinctnessis not just costly as in the case of scenario 1, but it also affects the expectedvalue of the infonnation. In this tj^e of scenario, the cost-minimizing menu isnot necessarily optimal.
More specifically, this example shows that if agent choice behavior is incon-sistent with EUM choices, identification of the optimal menu relies on knowing(1) the link between the distinctness of the choices on the menu and the prob-ability of EUM choice and (2) the link between the probability of EUM choice(i.e., the reliability of the information) and the expected retums of the informa-tion. Although the second of these links is clearly situation specific, the objectiveof this experiment is to gamer infonnation on the first link under the conjecturethat it has some degree of universal applicability across individuals and acrosssettings. The final step in choosing the optimum is in trading off these expectedretums against the expected cost.
In summary, the hypothesis under test is that choice behavior between itemson a menu of contracts is guaranteed under all circumstances to be consistentwith EUM predictions. The altemative hypothesis is that the probability of EUMchoice is a function of the degree of distinctness between altematives. Withrespect to the problem of implementation of O&R compensation schemes, it isimportant (as was shown above) to understand the nature of this relationship, sothat the optimal v(B) function can be selected. Thus, in addition to testing theabove hypothesis, we are interested in calibrating the nature of this relationship.
Experimental designTo test the experimental hypothesis, the basic experimental design simply re-quires endowing the subjects with private information, and then asking them toselect their preferred contract from an O&R menu. However, to really exercisethe desired experimental control and to maximize the extemal validity of theresults, several other features were brought into the final experimental designaround this basic design.
First, to extrapolate the experimental results to situations in which economicincentives are known to drive behavior, it was desirable also to drive behaviorin the laboratory by economic incentives. This requires that subjects experiencereal consequences of their choices. For example, subjects could have been re-warded using a payoff scheme linear in their experimental performance (e.g.,1 cent cash per 50 experimental dollars). Making behavioral predictions would
The Rationality Hypothesis 383
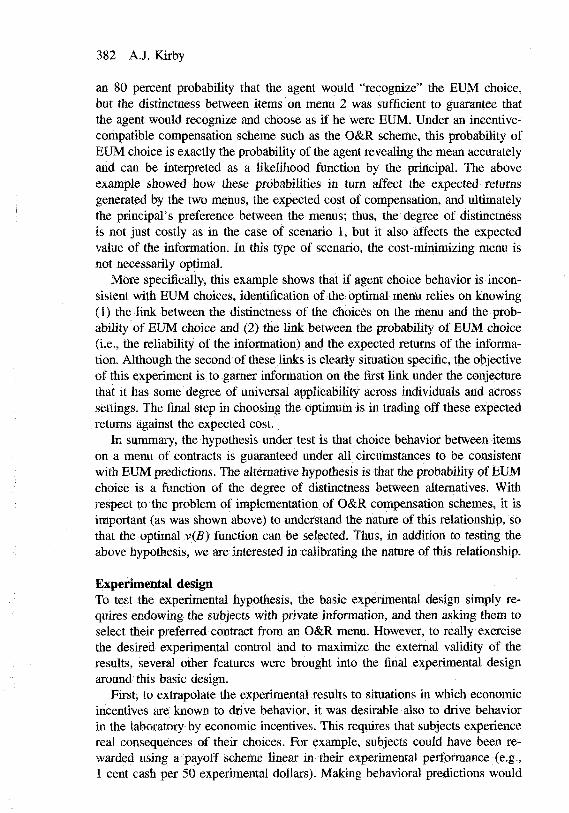
then require knowing individual utility functions for cash for all the subjects. Al-ternatively, if subjects are rewarded using a two-prize lottery whose probabilitiesare a function of experimental performance, the expected utility for all subjectsfor all gambles is linear in their utility for the preferred prize, and behavioralpredictions can easily be made. The latter was the refinement chosen. '^ Theresulting sequence of experimental events is depicted below. Those elements ofthe design relating to the experimental hypothesis form the central segment ofthe time line.
Riskattitudesinduced.
Subjectsreceiveprivate
info andmenu.
Subjectsselect
contractfrommenu.
Uncertaintyresolved andexperimental
payoffrevealed.
Conversionto cash
prizes vialottery.
There are several maisitained hypotheses in using this setup. Two importantone.; £ife the following. First, subject behavior is driven by economic incen-livsi Hi, opposed to ethical considerations. To ensure this, the experiment wascesrgiied so thai subjects were tioi aware that their choices were revealing in-fsinviation.. Furthermore, rrsenus oi contracts that were not incentive compatiblewer- included to provide an ex posi test of the maintained hypothesis. The main-•:£in'-;d hypothesis would predici greater deviations between revealed and privateinfi.irmfition for such menuM than for O&R menus.
The second important maintained hypothesis is that the procedure used to in-duct: speciric ri.sk preferences worked.'^ This was tested by splitting the subjectsiitD "tvc groups and inducing differerri risk attitudes in each. The choices facing
eac": group were., however, adjusted to take account of tbe differing risk pref-ereniXK and altimately to generate identical alternatives (in terms of expectedifri'ijiers), 5f the risk prefefersce-inducing procedure worked, the choices made byrae tv-o gvoups shouki be identica;. This prediction was used to test this secondrnairiiairied hypothesis
r.i£ experinicntai design is described in greater detail in four stages: generalsnviroriment (.4) nianipuiated variables (B), experimental apparatus
;vs;i experivpentai task (D).
Gent-m; ec .onomsc environment/\ scenario was described to student subjects in which they were sales managers.*:;r t;:..;Wjipi.per& operating in mdeperident geographical regions. They would re-.>;;. ye iriibrmaticn about 'be prospective level of subscription sales based on the
16 See Appendix B for details.17 This is tantamount to assuming that subjects' behavior conforms to the compound lottery
axiom.
384 A.J. Kirby
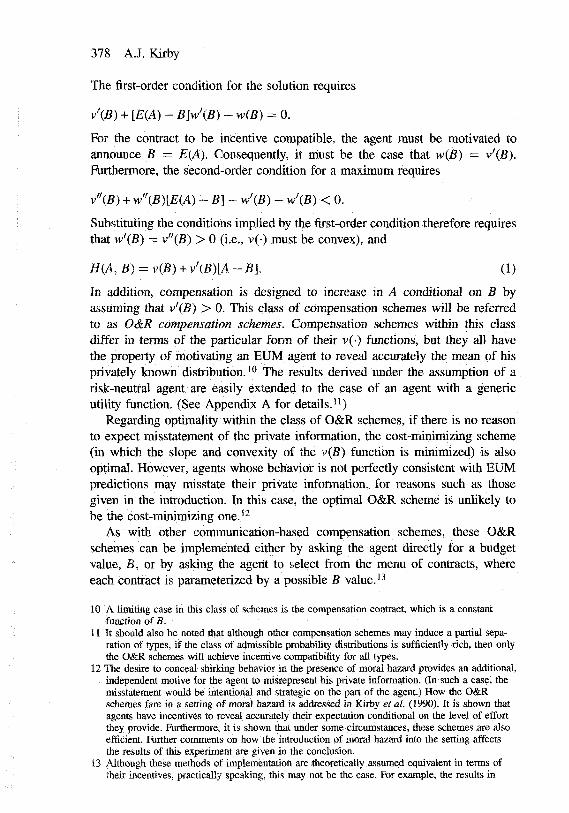
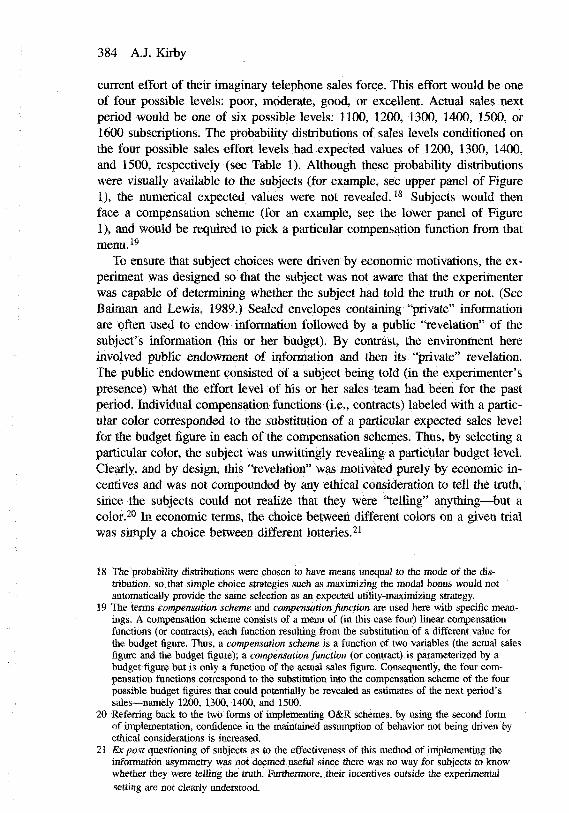
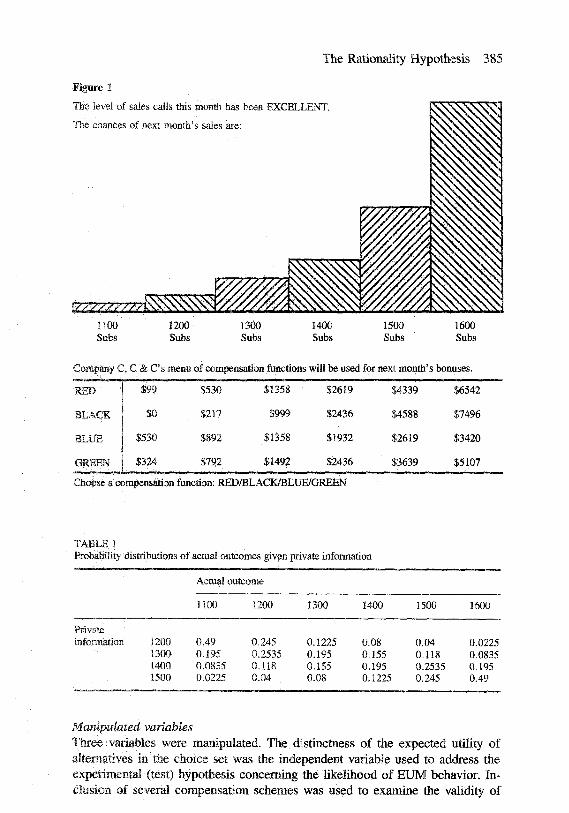
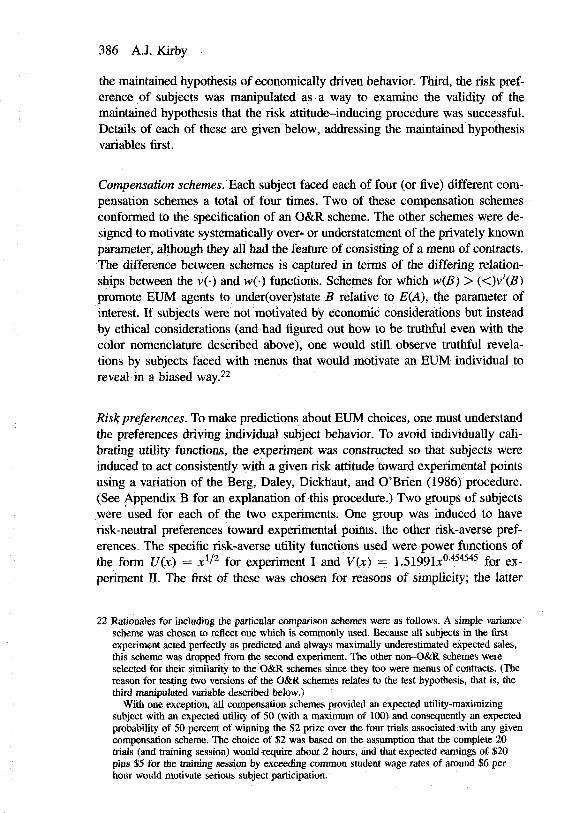
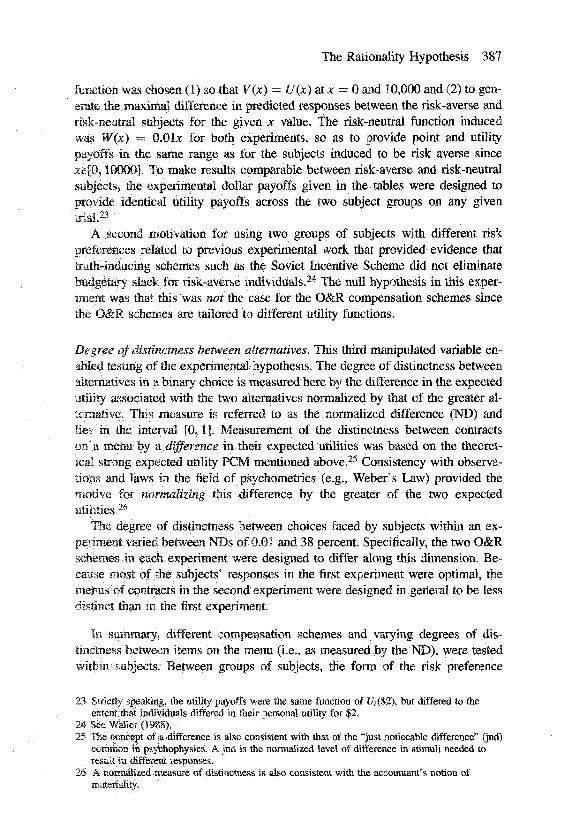
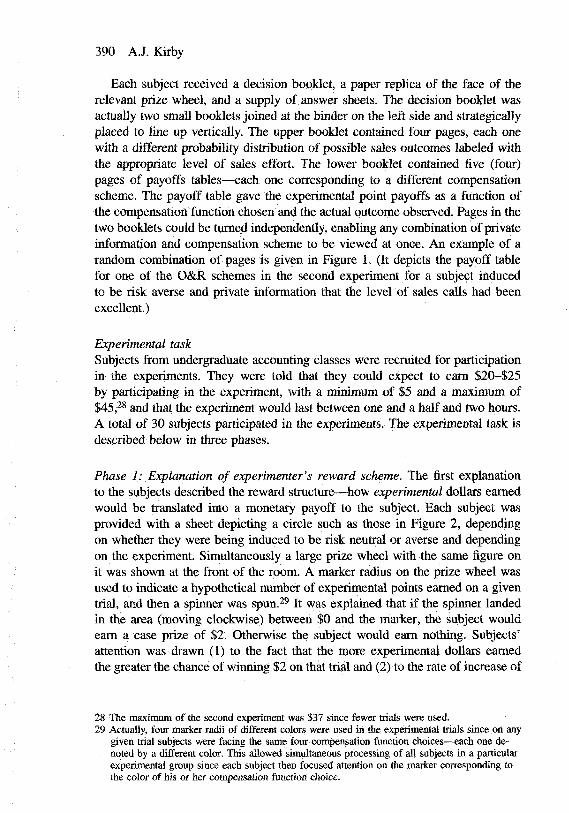
cturent effort of their imaginary telephone sales force. This effort would be oneof four possible levels: poor, moderate, good, or excellent. Actual sales nextperiod would be one of six possible levels: 1100, 1200, 1300, 1400, 1500, or1600 subscriptions. The probability distributions of sales levels conditioned onthe four possible sales effort levels had expected values of 1200, 1300, 1400,and 1500, respectively (see Table 1). Although these probability distributionswere visually available to the subjects (for example, see upper panel of Figure1), the numerical expected values were not revealed. ' Subjects would thenface a compensation scheme (for an example, see the lower panel of Figure1), and would be required to pick a particular compensation function from that
menu. 19
To ensure that subject choices were driven by economic motivations, the ex-periment was designed so that the subject was not aware that the experimenterwas capable of determining whether the subject had told the truth or not. (SeeBaiman and Lewis, 1989.) Sealed envelopes containing "private" infonnationare often used to endow information followed by a public "revelation" of thesubject's information (his or her budget). By contrast, the environment hereinvolved public endowment of information and then its "private" revelation.The public endowment consisted of a subject being told (in the experimenter'spresence) what the effort level of his or her sales team had been for the pastperiod. Individual compensation functions (i.e., contracts) labeled with a partic-ular color corresponded to the substitution of a particular expected sales levelfor the budget figure in each of the compensation schemes. Thus, by selecting aparticular color, the subject was unwittingly revealing a particular budget level.Clearly, and by design, this "revelation" was motivated purely by economic in-centives and was not compounded by any ethical consideration to tell the truth,since the subjects could not realize that they were "telling" anything—^but acolor. 2'' In economic terms, the choice between different colors on a given trialwas simply a choice between different lotteries.'^'
18 The probability distributions were chosen to have means unequal to the mode of the dis-tribution, so that simple choice strategies such as maximizing the modal bonus would notautomatically provide the same selection as an expected utility-maximizing strategy.
19 The terms compensation scheme and compensation function are used here with specific mean-ings. A compensation scheme consists of a menu of (in this case four) linear compensationfunctions (or conttacts), each function resulting from the substitution of a different value forthe budget figure. Thus, a compensation scheme is a function of two variables (the actual salesfigure and the budget figure); a compensation function (or contract) is parameterized by abudget figure but is only a function of the actual sales figure. Consequently, the four com-pensation functions correspond to the substitution into the compensation scheme of the fourpossible budget figures that could potentially be revealed as estimates of the next period'ssales—namely 1200, 1300, 1400, and 1500.
20 Referring back to the two forms of implementing O&R schemes, by using the second formof implementation, confidence in the maintained assumption of behavior not being driven byethical considerations is increased,
21 Ex post questioning of subjects as to the effectiveness of this method of implementing theinformation asymmetry was not deemed useful since there was no way for subjects to knowwhether they were telling the truth. Furthermore, their incentives outside the experimentalsetting are not clearly understood.
The Rationality Hypothesis 385
Figure 1
The level of sales calls this month has been EXCELLENT.
The chances of next month's sales are:
1200Subs
13fX)Subs Subs
1500Subs
1603Subs
Company C, C & C s menu of compensation fimctions will be used for next month's bonuses.
RED
BLACK
BLUE
GREEN
$99 $530 $1358 $2619 $4339 $6542
$0 $217 $999 $2436 $4588 $7496
$530 $892 $1358 $1932 $2619 $3420
$324 $792 $1492 $2436 $3639 $5107
Choese a compensation function: RED/BLACK/BLUE/GREEN
TABLE 1Probability distributions of actual outcomes given private information
Actual outcome
Privateinfomiation 1200
130014001500
1100
0.490.1950.08350.0225
1200
0.2450.25350.1180.04
1300
0.12250.1950.1550.08
1400
0.080.1550.1950.1225
1500
0.040.1180.25350.245
1600
0.02250.08350.1950.49
Manipulated variablesThree vadables were manipulated. The distinctness of the expected utility ofaltematives in the choice set was the independent variable used to address theexperimental (test) hypothesis conceming the likelihood of EUM behavior. In-clusion of several compensation schemes was used to examine the validity of
386 A.J. Kirby
the maintained hypothesis of economically driven behavior. Third, the risk pref-erence of subjects was manipulated as a way to examine the validity of themaintained hypothesis that the risk attitude-4nducing procedure was successful.Details of each of these are given below, addressing the maintained hypothesisvariables first.
Compensation schemes. Each subject faced each of four (or five) different com-pensation schemes a total of four times. Two of these compensation schemesconformed to the specification of an O&R scheme. The other schemes were de-signed to motivate systematically over- or understatement of the privately knownparameter, although they all had the feature of consisting of a menu of contracts.The difference between schemes is captured in terms of the differing relation-ships between the v(-) and w(-) functions. Schemes for which w(B) > (<)v'(B)promote EUM agents to under(over)state B relative to E(A), the parameter ofinterest. If subjects were not motivated by economic considerations but insteadby ethical considerations (and had figured out how to be truthful even with thecolor nomenclature described above), one would still observe tmthful revela-tions by subjects faced with menus that would motivate an EUM individual toreveal in a biased
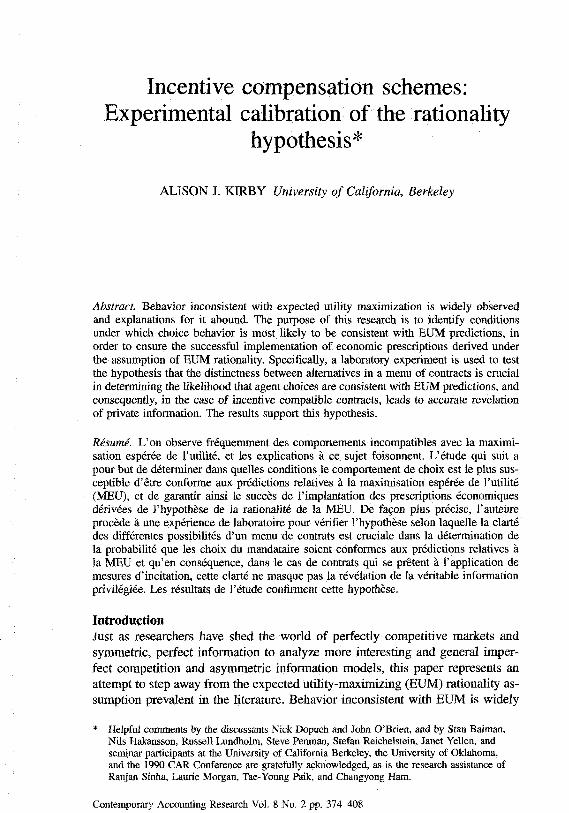
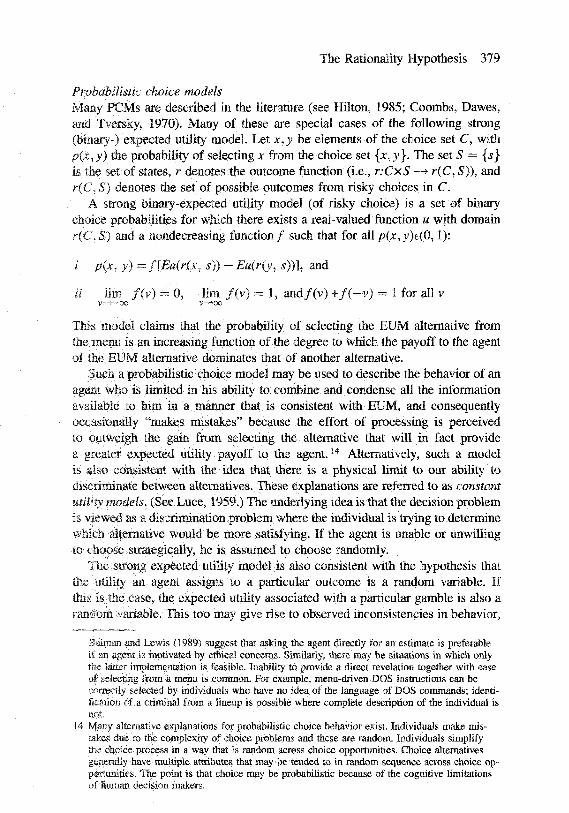
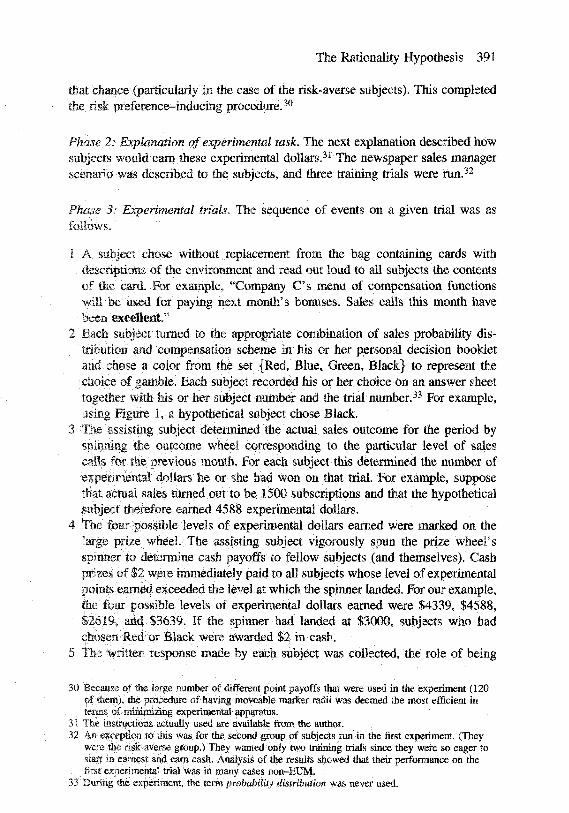
Risk preferences. To make predictions about EUM choices, one must understandthe preferences driving individual subject behavior. To avoid individually cali-brating utility functions, the experiment was constructed so that subjects wereinduced to act consistently with a given risk attitude toward experimental pointsusing a variation of the Berg, Daley, Dickhaut, and O'Brien (1986) procedure.(See Appendix B for an explanation of this procedure.) Two groups of subjectswere used for each of the two experiments. One group was induced to haverisk-neutral preferences toward experimental points, the other risk-averse pref-erences. The specific risk-averse utility functions used were power functions ofthe form Uix) = x^^ for experiment I and Vix) = 1.51991;c"'* '* * for ex-periment II. The first of these was chosen for reasons of simplicity; the latter
22 Rationales for including the particular comparison schemes were as follows. A simple variancescheme was chosen to reflect one which is commonly used. Because all subjects in the firstexperiment acted perfectly as predicted and always maximally underestimated expected sales,this scheme was (topped from the second experiment. The other non-O&R schemes wereselected for their similarity to the O&R schemes since they too were menus of contracts. (Thereason for testing two versions of the O&R schemes relates to the test hypothesis, that is, thethird manipulated variable described below.)
With one exception, all compensation schemes provided an expected utility-maxitnizingsubject with an expected utility of 50 (with a maximum of 100) and consequently an expectedprobability of 50 percent of wimiing the $2 prize over the four trials associated with any givencompensation scheme. The choice of $2 was based on the assumption that the complete 20trials (and training session) would require about 2 hours, and that expected earnings of $20plus $5 for die training session by exceeding common student wage rates of around $6 perhour would motivate serious subject participation.
The Rationality Hypothesis 387
function was chosen (1) so that V(x) — U{x) at x = 0 and 10,000 and (2) to geo-etate the maximal difference in predicted responses between the risk-averse andrisk-neutral subjects for the given x value. The risk-neutral function inducedwas W{x) — 0.0lx for both experiments, so as to provide point and utilitypayoffs in Hie same range as for the subjects induced to be risk averse sincexfifO, 1(XX)O]. To make results comparable between risk-averse and risk-neutralsubjects, the experimental dollar payoffs given in the tables were designed toprovide identical utility payoffs across the two subject groups on any giventrial.23
A second motivation for using two groups of subjects with different riskpreferences related to previous experimental work that provided evidence thattroth-inducing schemes such as the Soviet Incentive Scheme did not eliminatebudgetary slack for risk-averse individuals. '* The null hypothesis in this exper-iment was that this was not the case for the O&R compensation schemes sincethe O&R schemes are tailored to different utility functions.
Degree of distinctness between altematives. TMs third manipulated variable en-abled testing of the experimental hypothesis. The degree of distinctness betweenaltematives in a binary choice is measured here by the difference in the expectedutility associated with the two altematives normalized by that of the greater al-ternative. This measure is referred to as the normalized difference (ND) andlies in the interval [0,1]. Measurement of the distinctness between contractson a menu by a difference in their expected utilities was based on the theoret-ical strong expected utility PCM mentioned above.^' Consistency with observa-tioas and laws in the field of psychometrics (e.g., Weber's Law) provided the
for normalizing this difference by the greater of the two expected
The degree of distinctness between choices faced by subjects within an ex-periment varied between NDs of 0.01 and 38 percent. Specifically, the two O&Rschemes ia each experiment were designed to differ along this dimension. Be-cause most of the subjects' responses in the first experiment were optimal, themems of contracts in the second experiment were designed in general to be lessdislmct than in the first experiment.
In sammarj; different compensation schemes and varying degrees of dis-tinctness between items oo the menu (i.e., as measured by the ND), were testedwithin subjects. Between groups of subjects, the form of the risk preference
23 Strictly speaking, the utility payoffs were the same function of J/,($2), but differed to theextent tl at individuals differed in their personal utility for $2.
24 See WaHer (1988).25 The concept of a difference is also consistent with that of the "just noticeable difference" (jnd)
cctnmon in psybhophysics. A jnd is the normalized level of difference in stimuli needed toresttlt in different responses.
26 A normalized measure of distinctness is also consistent with the accountant's notion ofmateriality.

388 A.J. Kirby
Figure 2a Risk neutral
S10,000/$0
$9000
Figure 2b Risk averse (I)
$10,000/$0$1000
$8000
$7000
$8100 $100
$2000 $6400
$3000 $4900
$6000 \ ^ ^ $4000
$5000
$400
$900
$3600 \ ^ ^ $1600
$2500
Figure 2c Risk averse (II)
$1000
$2000
induced was varied. The number of subjects in each experimental condition isgiven below. 27 Each of the 30 subjects faced either 16 or 20 trials.
Risk neutral Risk averse
Experiment I: iVZ>e[0.15, 0.5] n = 5 « = 65 compensation schemes
Experiment II: iVDe[O, 0.15] n = 10 n = 94 compensation schemes
Experimental apparatusSome of the experimental apparatus was used jointly by all subjects present in thegroup. This included a prize wheel, four outcome wheels, and a bag containingdescriptions of the environment. The prize wheel's demarcations depended on
27 Strictly speaking, the difficulty of choice was tested both within and between subjects sincethe general level of normalized differences differed between experiments.
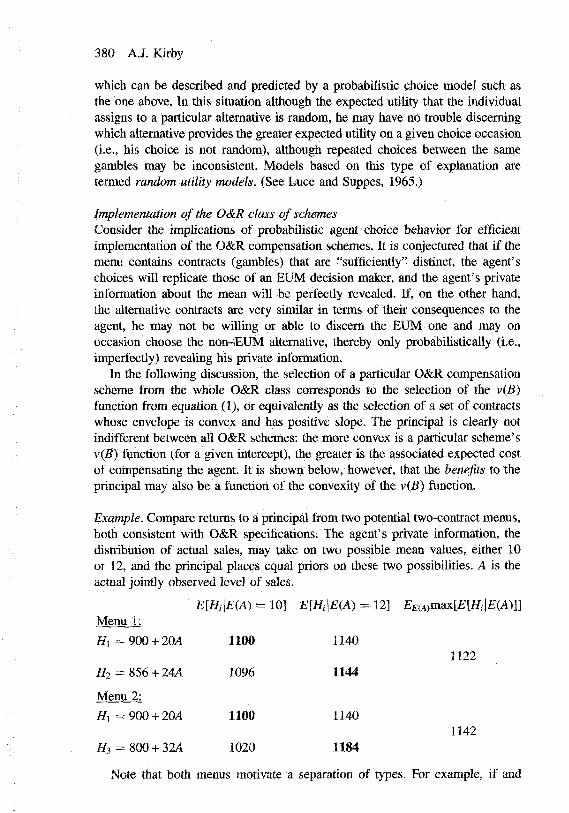
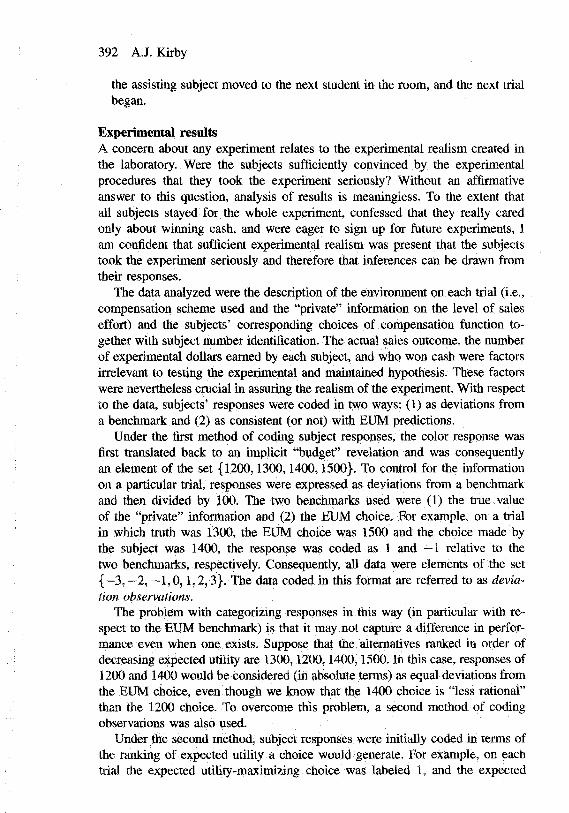
Flgare 3a Poor
1500
The Rationality Hypothesis 389
Figure 3b Moderate
Subs
Figure 3c Good Figure 3d Exellent
1100Subs 1200
Subs
1300 Subs
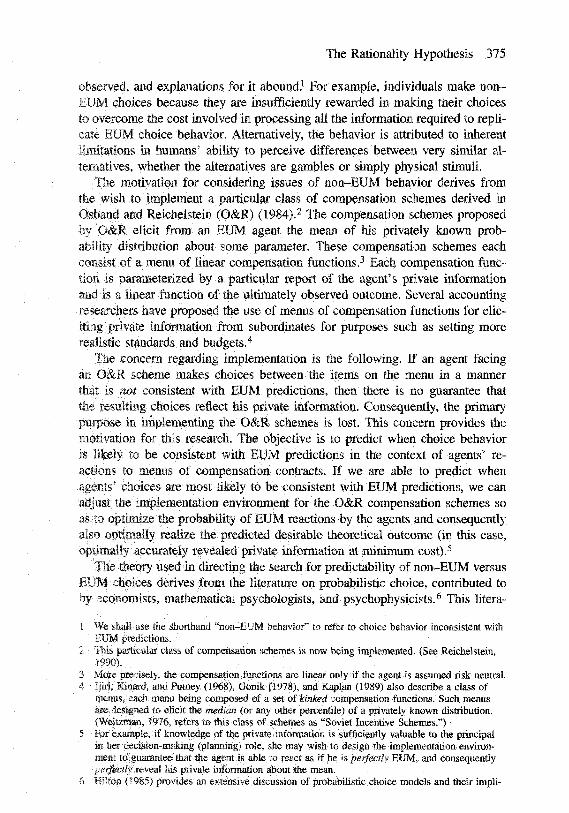
the risk preferences being induced and for a given group of subjects was identicalto eoe of those shown in Figure 2, parts a, b, and c. Further details on the prizewheel are given in the next section. The four outcome wheels correspondedto the four possible probability distributions of sales. They were labeled poor,moderate, good, and excellent and were simple shaded pie charts with the wedgescorresponding to the six possible sales levels (1100 through 1600). (See Figure3.) Finally, the bag of descriptions of the environment contained 20 (or 16)different cards, depending on the experiment. Each card had written on it (1)OHC of the four types of private information (poor, moderate, good, or excellentsales effort) and (2) the identification of one of the five (four) compensationschemes (menu A, B, C, D, or E).
390 A.J. Kirby
Each subject received a decision booklet, a paper replica of the face of therelevant prize wheel, and a supply of answer sheets. The decision booklet wasactually two small booklets joined at the binder on the left side and strategicallyplaced to line up vertically. The upper booklet contained four pages, each onewith a different probability distribution of possible sales outcomes labeled withthe appropriate level of sales effort. The lower booklet contained five (four)pages of payoffs tables—each one corresponding to a different compensationscheme. The payoff table gave the experimental point payoffs as a function ofthe compensation function chosen and the actual outcome observed. Pages in thetwo booklets could be tumed independently, enabling any combination of privateinformation and compensation scheme to be viewed at once. An example of arandom combination of pages is given in Figure 1. (It depicts the payoff tablefor one of the O&R schemes in the second experiment for a subject inducedto be risk averse and private information that the level of sales caUs had beenexcellent.)
Experimental taskSubjects from undergraduate accounting classes were recruited for participationin the experiments. They were told that they could expect to eam $20-$25by participating in the experiment, with a minimum of $5 and a maximum of$45, ^ and that the experiment would last between one and a half and two hours.A total of 30 subjects participated in the experiments. The experimental task isdescribed below in three phases.
Phase 1: Explanation of experimenter's reward scheme. The first explanationto the subjects described the reward stmcture—how experimental dollars eamedwould be translated into a monetary payoff to the subject. Each subject wasprovided with a sheet depicting a circle such as those in Figure 2, dependingon whether they were being induced to be risk neutral or averse and dependingon the experiment. Simultaneously a large prize wheel with the same figure onit was shown at the front of the room. A marker radius on the prize wheel wasused to indicate a hypothetical number of experimental points eamed on a giventrial, and then a spinner was spun. ^ It was explained that if the spinner landedin the area (moving clockwise) between $0 and the marker, the subject wouldeam a case prize of $2. Otherwise the subject would eam nothing. Subjects'attention was drawn (1) to the fact that the more experimental dollars eamedthe greater the chance of winning $2 on that trial and (2) to the rate of increase of
28 The maximum of the second experiment was $37 since fewer trials were used.29 Actually, fotir marker radii of different colors were used in the experimental trials since on any
given trial subjects were facing the same four compensation function choices—each one de-noted by a different color. This allowed simultaneous processing of all subjects in a particularexperimental group since each subject then focused attention on the marker corresponding tothe color of his or her compensation function choice.
The Rationality Hypothesis 391
that chance (particularly in the case of the risk-averse subjects). This completedthe risk preference-inducing procedure.^'*
Phase 2: Explanation of experimental task. The next explanation described howsubjects would eam these experimental dollars.'* The newspaper sales managerscenario was described to the subjects, and three training trials were mn.^^
Phase 3: Experimental trials. The sequence of events on a given trial was asfollows.
; A ST-.bjec* chose without replacement from the bag containing cai-ds withdeicripdonK of the environment and read out loud to all subjects the contentscf the card. F-ov exainpif., "Csxmpany Ca menu of compensation functionsvviji be used for paying next month s bonuses. Sales calls this month havebuen excellent."
2 Each «iibie.cr. tumed to the appropriate combination of sales probability dis-tribution and compensation scheme in his or her personal decision bookletafk'i choif; a color trom the set {Red, Biue, Green, Black} to represent thed'icice of gamble. Bach subject recorded his or her choice on an answer sheettc-geiber witli his or her frubject number and the trial number.^^ For example,•iting Figure J, a hypothetical subject chose Black.
3 Tbe as.sisting subject determined the actual sales outcome for the period byspinmng the outcome wheei corresponding to the particular level of salescalk for the previous montii. For each subject this determined the number ofii'AOiun'ientcd dollars he or she had won on that trial. For example, suppose:,hai .ictuai sales turned out to be 1500 subscriptions and that the hypothetical>.u*jject rherefore ejimed 4588 experimental dollars.
-• The tour possible levels of experinsentai dollars earned were marked on thelarge prize wheeL The assisting subject vigorously spun the prize wheel's:-:p'-nner ro deteiniine cash payoffs to fellow subjects (and themselves). Cashprzes of $2 were immediately paid to ail subjects whose level of experimentalpcint. : eamed e>!ceeded ttie ieve! at which the spinner landed. For our example,tCF. f-';iir possible levels ot experimental dollars eamed were $4339, $4588,$2519., and $3639. if the spinner had landed at $3000, subjects who hadch'jsevi 3ed or Black were awarded $2 in cash.
5 Th:- v^riiteii response made by each subiect was collected, the role of being
30 B^^.iX'js-; ot fhe ?arge n.Dniber o: different pomt payoffs that were tjsed in the experiment (120of •ti'i-.rrs), me vsrocedure of havj-ig moveabie murker radii was deemed the most efficient intfi;r.s cf minimizing experimer.-ai apparutus,
3! The ins'ruclions actually ut-ied u'e available from the author.32 Af! sxccpiic-R ic- ibis was for the second group of subjects run in the first experiment. (They
were the. risfc-averee amup.) They wanteo only fwo training trials since they were so eager toifir; •;; ^a.'Tiest arsd earn CKsh. Analysis of tks re.sijts .showed that their performance on the,';-!r. txperlmente; trial was in tnany cases non-EUM.
33 Dijrng she sxpenmerit. the term prohahilhy distribution *as never used.
392 A.J. Kirby
the assisting subject moved to the next student in the room, and the next trialbegan.
ExperimenM resultsA concem about any experiment relates to the experimental realism created inthe laboratory. Were the subjects sufficiently convinced by the experimentalprocedures that they took the experiment seriously? Without an affirmativeanswer to this question, analysis of results is meaningless. To the extent thatall subjects stayed for the whole experiment, confessed that they really caredonly about winning cash, and were eager to sign up for future experiments, Iam confident that sufficient experimental realism was present that the subjectstook the experiment seriously and therefore that inferences can be drawn fromtheir responses.
The data analyzed were the description of the environment on each trial (i.e.,compensation scheme used and the "private" information on the level of saleseffort) and the subjects' corresponding choices of compensation function to-gether with subject number identification. The actual sales outcome, the numberof experimental dollars eamed by each subject, and who won cash were factorsirrelevant to testing the experimental and maintained hypothesis. These factorswere nevertheless cmcial in assuring the realism of the experiment. With respectto the data, subjects' responses were coded in two ways: (1) as deviations froma benchmark and (2) as consistent (or not) with EUM predictions.
Under the first method of coding subject responses, the color response wasfirst translated back to an implicit "budget" revelation and was consequentiyan element of the set {1200,1300,1400,1500}. To contirol for the infonnationon a particular trial, responses were expressed as deviations from a benchmarkand then divided by 100. The two benchmarks used were (1) the tme valueof the "private" information and (2) the EUM choice. For example, on a trialin which tmth was 1300, the EUM choice was 1500 and the choice made bythe subject was 1400, the response was coded as 1 and —1 relative to thetwo benchmarks, respectively. Consequently, all data were elements of the set{—3,—2,—1,0,1,2,3}. The data coded in this format are referred to as devia-tion observations.
The problem with categorizing responses in this way (in particular with re-spect to the EUM benchmark) is that it may not capture a difference in perfor-mance even when one exists. Suppose that the altematives ranked in order ofdecreasing expected utility are 1300,1200,1400,1500. In this case, responses of1200 and 1400 would be considered (in absolute terms) as equal deviations fromthe EUM choice, even though we know that the 1400 choice is "less rational"than the 1200 choice. To overcome this problem, a second method of codingobservations was also used.
Under the second rnethod, subject responses were initially coded in terms ofthe ranking of expected utility a choice would generate. For example, on eachtrial the expected utility-maximizing choice was labeled 1, and the expected
The Rationality Hypothesis 393
utilirv-niinimizing choice 4, with corresponding expected utilities denoted byFJ.J 1 and EU4. Consequently, all data were elements of the set {1,2,3,4}. Nextthe dava were transfomied in a way that decomposed each single observation ofa f.;.b.okc from four compensation functions (colors) into three inferred binar]>'cu.:>ices. For example, if a subject chose the EUM choice (i.e., 1), then he orshe irnpijciiiy chose il over ail three other options. In effect, three simultaneousbiliary EUN'T choices were made: the first-best choice over the second best, theriisi r3est over the third best., and the first best over the fourth best. Each ofih.:Si: "A'as treated as an independent observation.^'' Each binary choice was alsochiiracterized in tenns of its associated level of distinctness as measured by thencTuaiized difference m expected utility. The normalized differences for tJieib.3se binary choices for this case were (EUl - EU2)/EU1, (EUl - EU3)/EU1,anc* (BUi — EU4)/EUi, respectively.^^ Thus, on any given trial for an individualsubject, ihree of a potential six observations are made. Binary EUM (non-EUM)choices were designated with a 1(0). The results represented in this form arerefii'Tftd to as binary choice observations.
The experimenta! results are described as they relate to the hypotheses main-;;airied aDci tested.
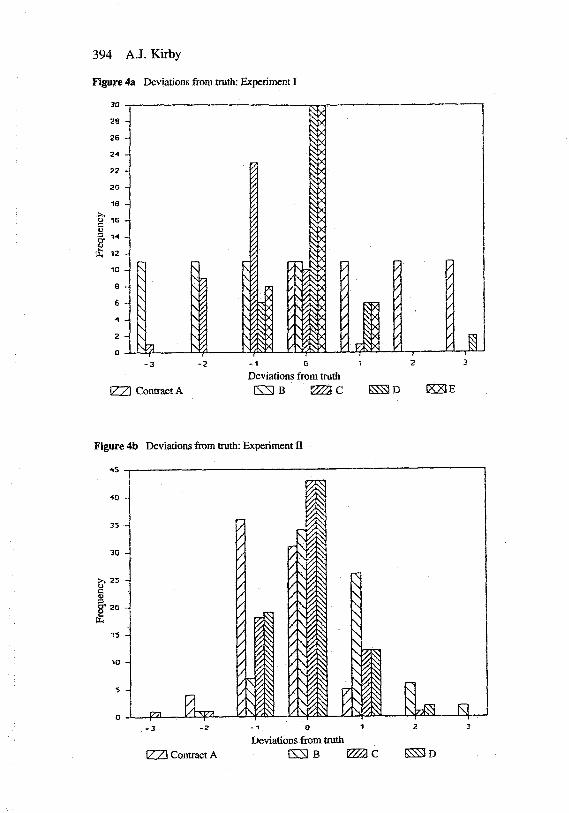
Ec<>no;nically driven behavior (Maintained hypothesis)The use of a variet;*'- of compensation schemes attempted to address this hy-puvheiiis. The frequency disvributions of deviation observations using truth as;he beacfimark are given in Figure 4 parts a and b, for the two experiments,resoectn'eiy. They clearly show that the O&R contracts (D and E in experimentI ai-,d C and D ifl experiment IF) resulted in the most accurate responses. Signedrarik tvsu were used lo test whether the sample of deviated responses under ac-arr:.;ii-ar compensation scheme had a median significandy different fxom zero.ra.b.'e 2 shows that the O&R schemes were the only ones for which the nulli"ypo!hesiLs of a zero median could not be rejected. These results indicate thatsi;b;erts' responses are sensitive to changes in the parameter values assumed in:ne :.'f: mpensatioa schemes, even though the fundamental form of the compensa-vior. contract is ver\' similar to that of the O&R schemes. This allows increasedzcnMs-nce: in the maintained hypothesis that behavior was driven by economicLncea'd-ies as opposed to ethical considerations of truthtelling.
Ri'ik pfeference-inducing procedure (Maintained hypothesis)T.he experiment was designed so that the two groups of subjects split accordingto risk, preferences would face exactly the same choices in terms of utilities. Toinvc'itigate whether there was any difference in the ability of the O&R schemes
3't :'",eepetids;jce of the.ie three "separaie" observations is assumed.35 ?5> contrast. .1 subject who chcse the second-best choice from the four compensation functions
jvaiiabk .'i.?.t in affect made one iion-BUM choice (the second best choice over the firstrsjst) ?j>G twc HUM choices (the second best choice over the third and fourth best choices).Tlie corsespondinfi norraaiizej differences for the second subject would have been (EUl —3.;;;•)./?;;'.' {EL'.2'- EL;3)/fclJ2 and (EU2 - EU4)/EU2 respectively.
394 A.J. Kirby
Figure 4a Deviations from truth: Experiment I
28 -
ZB -
20 -
18 .-
10 -
8 -
6 - V^
\ / ;
I
iZZl Contract A
f-1 0
Deviations from truthc K21E
Figure 4b Deviations from truth: Experiment n
Deviations from truth
1771 Contract A
The Rationality Hypothesis 395
Table 2Ability of different schemes to induce truthful revelation
Contract
IAIAIBIBICICID&EID&E
2A2A2B2B2C2C2D2D2C&D2C&D
Test
SigBSRanksSignsRanksSigtisRanksSignsRanis
SignsRanksSignsRanksSignsRatiksSignsRanksSignsRanks
Risk averserisk neutral
Z-Score
5.575.0215.575.0215.3164.881
-0.1890.33
5.0684.6623.8583.7011.0441.1350.6960.4291.3541.096
and
P-Value
0.0000.0000.0000.0000.0000.0000.8500.741
0.0000.0000.0000.0000.2960.2570.4860.6680.1760.273
Risk neutral
Z-Score
3.6153.4363.6153.4363.6153.43600.355
4.05 J;3.7820.8731.0251.3761.1670.8340.7151.6971.282
P-Vaiue
0.0000.0000.0000.0000.0000.0001.0000.722
0.0000.0000.383*0.305*0.1690.2430.4040.4750.0900.200
Risk averse
Z-Score
4.0073.4364.0073.7453.6713.54100.22!
2.9192.8744.3644.032
-0.2670.471
-0.3160.306
-0.2040.2
F-Value
0.0000.0000.0000.0000.0000.0001.0000.825
0.0000.0000.0000.0000.7890.6380.7520.760.8380.841
H^: Median (Deviation from tnith) — 0H,: Median (Deviation from truth) i= 0*For this group. Contract B appeared in three of the first four trials. This unexpected
beliavior is likely due to training still affecting performance.
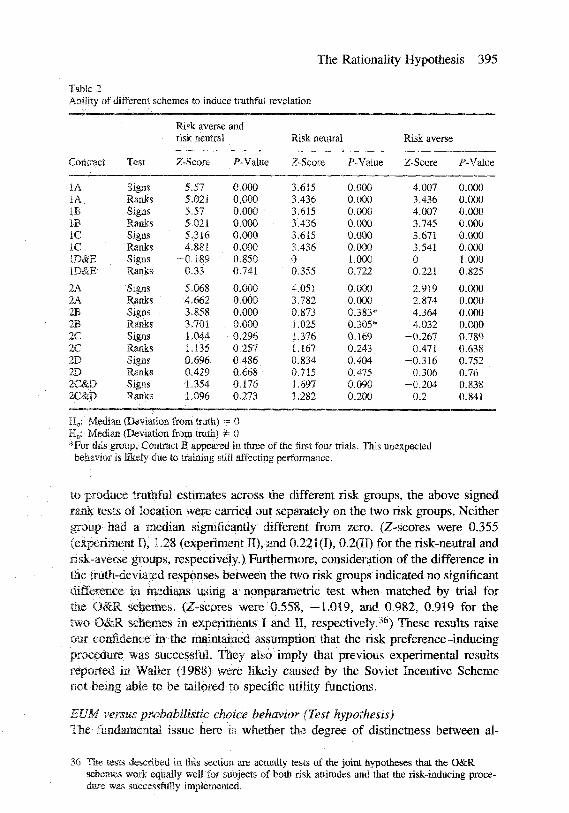
to produce truthful estimates across the different risk groups, the above signedrank tests of location were carried out separately on the two risk groups. Neitliergroup had a median significantly different from zero. (Z-scores were 0.355(experiment I), 1.28 (experiment II), and 0.221(1), 0.2(11) for the risk-neutral andrisk-averse groups, respectively.) Furthermore, consideration of the difference inthe truth-deviated responses between the two risk groups indicated no significantdiffercBce in medians using a nonparametric test when matched by trial forthe O&R schemes. (Z-scores were 0.558, -1.019, and 0.982, 0.919 for thetwo O&R schemes in experiments I and H, respectively. 3 ) These results raiseoar eonfideoce in the maintained assumption that the risk preference-inducingprocedure was successful. They also imply that previous experimental resultsreported in Waller (1988) were likely caused by the Soviet Incentive SchemeDot being able to be tailored to specific utility functions.
EUM versus probabilistic choice behavior (Test hypothesis)The fundamental issue here is whether the degree of distinctness between al-
36 Tbe tests described in. this section are actually tests of the joint hypotheses that the O&Rschemes work equally well for subjects of both risk attitudes and that the risk-inducing proce-dure was successfully implemented.
396 A.J. Kirby
temative contracts in a menu significantly affects subjects' ability to performas expected utility maximizers. On the basis of evidence from an initial set oftests (described below) rejecting the hypothesis of strict EUM behavior, furtheranalysis calibrated those critical levels of distinctness above which one can beincreasingly sure of an EUM response.
Testing significance of the distinctness variable. First, the correlation was cal-culated between the distinctness of altematives and the size of the deviationusing the EUM benchmark and was tested for significance against the null hy-pothesis that it was zero. The ND in expected utility was calculated using thefirst and second best choices on a particular trial normalized by the expectedutility of the first best choice. On the basis of all 524 data points, the Spearmanrank correlation coefficient was —0.29 (p-value < O.(X)1), enabling rejection ofthe hypothesis that behavior is always consistent with EUM predictions and pro-viding support for the hypothesis that the degree of distinctness between choicesaffects the likelihood of choices consistent with EUM predictions.
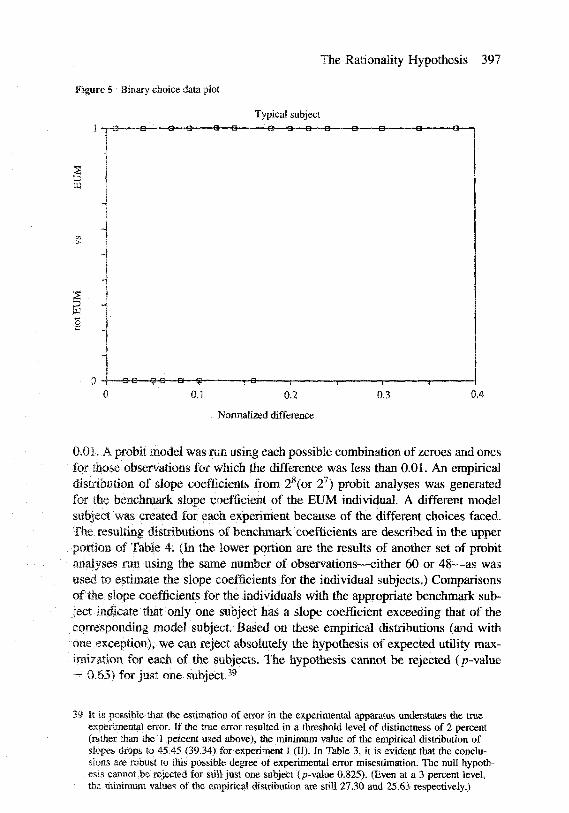
A second test examined whether individuals differed in the degree to whichtheir choices were EUM by analyzing the data in inferred binary choice form.(There were 3 x 20 (3 x 16) data points for each subject from the first (second)experiments.) Each data point was described in terms of the normalized differ-ence between the altematives and whether the binary choice made was EUM(1) or not (0). The data plot for a typical subject is given in Figure 5. Sincethere was measurement error in the experimental apparatus resulting from finitewidths of lines indicating the prize wheel win areas, it was hypothesized thateven EUM behavior would include a random component when NDs were verysmall. The level of ND below which it was estimated that this would occur was1 percent. ^
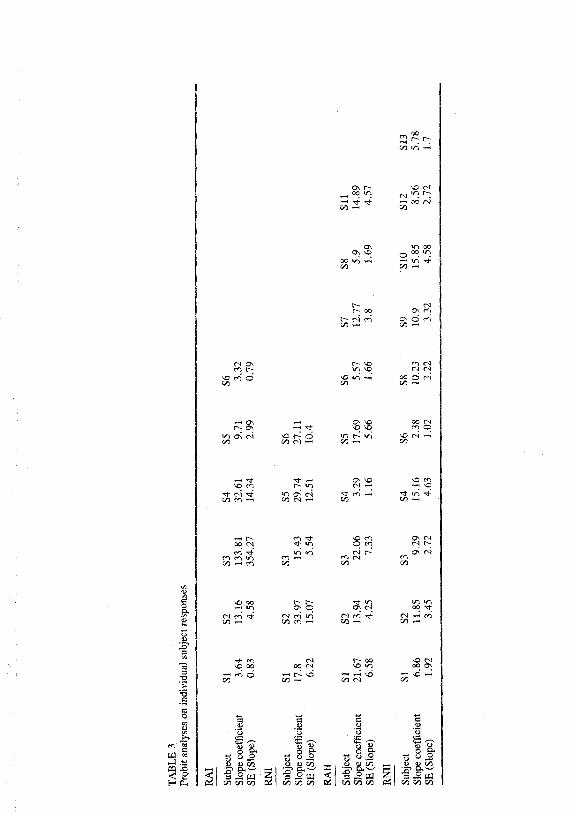
For each subject, a probit analysis was performed on the binary choice datapoints. This resulted in the coefficient estimates listed in Table 3.^^ The slopecoefficients are of particular interest. A perfectly EUM individual would have aninfinitely large true slope coefficient since his or her data plot would have non-EUM points only at a normalized difference of zero. However, as a benchmarkthat recognizes the measurement error in the experimental apparatus, we gen-erated an empirical distribution of slope values for a model subject as follows.The model subject's responses were EUM (and assigned 1) for all choices forwhich the normalized difference exceeded 0.01 and were randomly chosen (i.e.,assigned randomly 0 or 1) for all trials for which the difference was less than
37 It is estimated that the measurement error on the large wheel due to the non-zero width of themarker radius was about 1.8 degrees (i.e., 360°/200), which in ttun corresponds to a utility of0.5 since the whole circle corresponds to utility of 100. Normalizing this measurement errorby the expected utility of 50 gives 0.01 as the level of normalized difference below whicheven expected utility-maximizing subjects might choose non—EUM choices.
38 The probit analyses were run suppressing the intercept to reflect the fact that at a normalizeddifference of zero, the expected probability of being EUM is 0.5.
The Rationality Hypothesis 397
Figure 5 Binary choice data plot
Typical subjectj _pe_-_-a a—a——a—B— -e—-a—B—B a a- -a —a-
0 •+—a-e—^-a—a—#— -r-e-0 0.1 0.2 0.3 0.4
Normalized difference
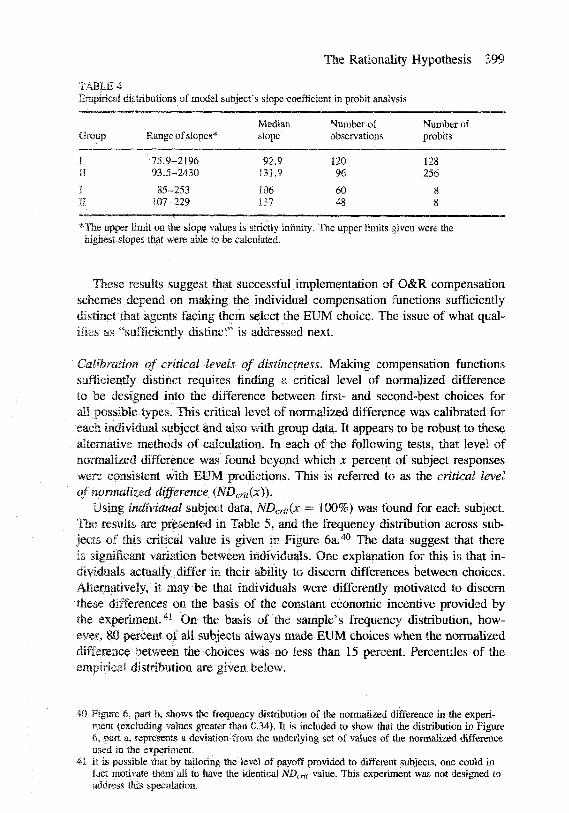
0.01. A probit model was rue using each possible combination of zeroes and onesfor those observations for which the difference was less than 0.01. An empiricaldistribution of slope coefficients from 2*(or 2') probit analyses was generatedfor the benchmark slope coefficient of the EUM individual. A different modelsubject was created for each experiment because of the different choices faced.The resulting distributions of benchmark coefficients are described in the upperportion of Table 4. (In the lower portion are the results of another set of probitanalyses run using the same number of observations—either 60 or 48—as wasused to estimate the slope coefficients for the individual subjects.) Comparisonsof the slope coefficients for the individuals with the appropriate benchmark sub-ject indicate that only one subject has a slope coefficient exceeding that of thecorresponding model subject. Based on these empirical distributions (and withone exception), we can reject absolutely the hypothesis of expected utility max-imization for each of the subjects. The hypothesis cannot be rejected (p-value= 0.65) for just one subject.^'
39 It is possible that the estimation of error in the experimental apparatus understates the tmeexperimental error. If the true error resulted in a threshold level of distinctness of 2 percent(rather tlian the 1 percent used above), the minimum value of the empirical distribution ofslopes drops to 45.45 (39.34) for experiment I (II). In Table 3, it is evident that the conclu-sions are robust to this possible degree of experimental error misestimation. The null hypoth-esis cannot be rejected for still just one subject (p-value 0.825). (Even at a 3 percent level,the miramum values of the empirical distribution are still 27.30 and 25.63 respectively.)
UJ «
The Rationality Hypothesis 399
TABLE 4Empirical distributions of model subject's slope coefficient in probit analysis
Mediae Number of Number ofGroup Range of slopes* slope observations probits
I 75.9-2196 92.9 120 128II 93.5-2430 131.9 96 256
I 85-253 106 60 8II 107-229 137 48 8
*The upper limit on the slope values is strictly infinity. The upper limits given were thehighest slopes that were able to be calculated.
These results suggest that successful implementation of O&R compensationschemes depend on making the individual compensation functions sufficientlydistinct that agents facing them select the EUM choice. The issue of what qual-ifies as "sufficiently distinct" is addressed next.
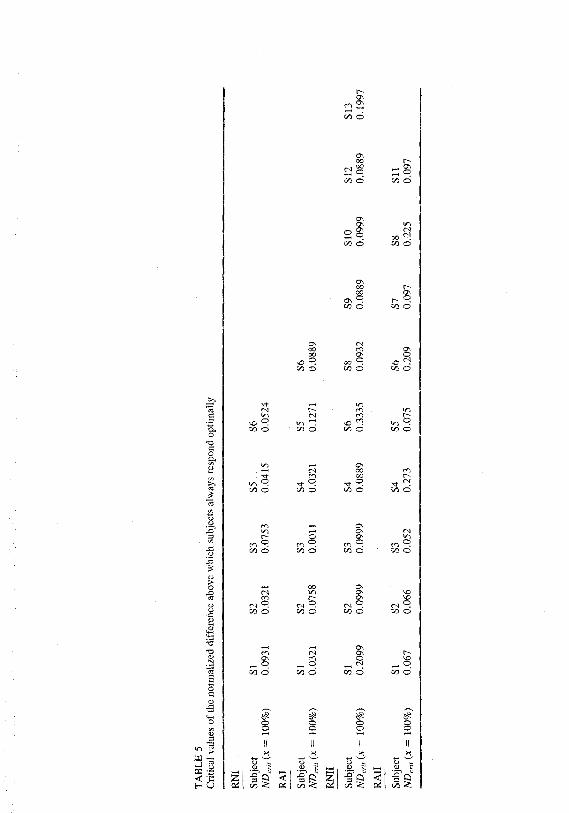
Calibration of critical levels of distinctness. Making compensation functionssufficiently distinct requires finding a critical level of normalized differenceto be designed into the difference between first- and second-best choices forall possible types. This critical level of normalized difference was calibrated foreach individual subject and also with group data. It appears to be robust to thesealternative methods of calculation. In each of the following tests, that level ofnormaiized difference was found beyond which x percent of subject responseswere consistent with EUM predictions. This is referred to as the critical levelof normalized difference (NDcrnix)).
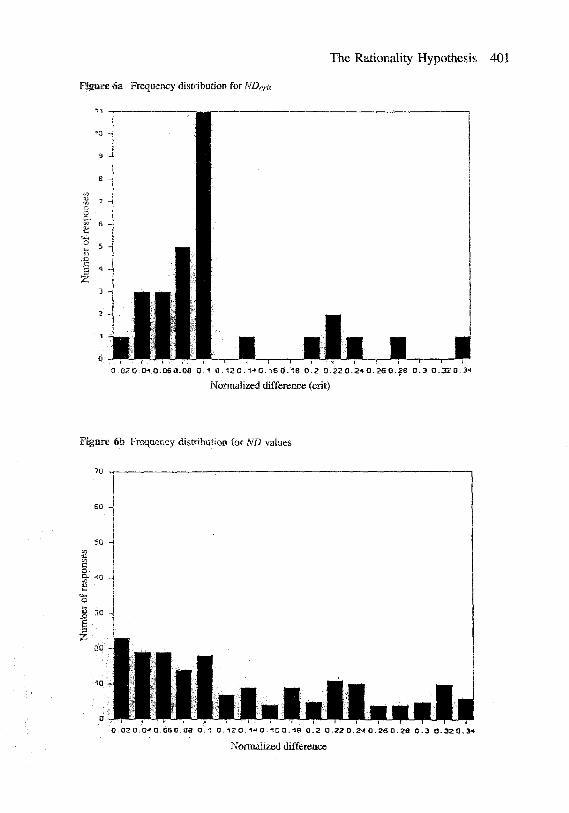
Using individual subject data, NDcntix = 100%) was found for each subject.The results are presented in Table 5, and the frequency distribution across sub-jects of this critical value is given in Figure 6a. " ' The data suggest that thereis significant variation between individuals. One explanation for this is tbat in-dividuals actually differ in their ability to discern differences between choices.Alternatively, it may be that individuals were differently motivated to discernthese differences on the basis of the constant economic incentive provided bythe experiment.'*' On the basis of the sample's frequency distribution, how-ever, 80 percent of all subjects always made EUM choices when the normalizeddifference between the choices was no less than 15 percent. Percentiles of theempirical distribution are given below.
40 Figure 6, part b, shows the frequency distribution of the normalized difference in the experi-ment (excluding values greater than 0.34). It is included to show that the distribution in Figure6, part a, represents a deviation from the underlying set of values of the normalized differenceused in the experiment.
41 It is possible that by tailoring tfie level of payoff provided to different subjects, one could infact motivate them ali to have the identical NDcHt value. This experiment was not designed toaddress this speculation.
C/5 O
2 oCfl d
00O ^ 9tn o
r- P
'II
IN
1 d
o
„ qCO O
The Rationality Hypothesis 401
Figure 6a Frequency distribution for NDc
0 . 0 2 0 . 0 . 1 0 . 0 6 0 - 0 8 O.- l 0 . 1 2 0 . 1 - 1 0 . 1 6 0 . 1 8 O .Z 0 . 2 2 0 . 2 1 0 . 2 6 0 . 2 8 0 . 3 0 . 3 2 0 . 3 - <
Normalized difference (cdt)
Figure 6b Frequency distribution for ND values
Q .02 0.0.« G.OSO.Oe 0 .1 O. 12 0. 1.? a. T6 0.18 0 .2 0.
Normalized difference
.2.^0.26 0.28 0 .3 0 . 3 2 0 . 3 4
402 A.J. Kirby
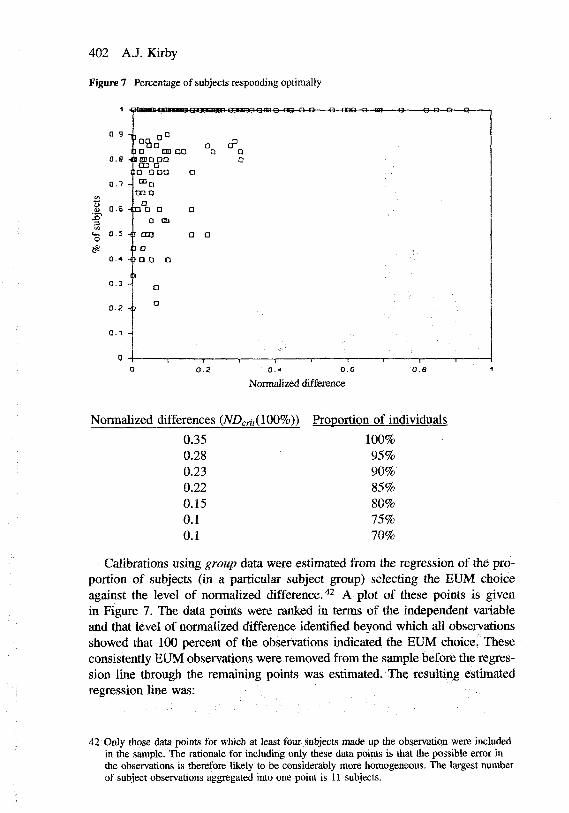
Figure 7 Percentage of subjects responding optimally
0.9
0.8 -I
0.7 -
0.6 H
D.3
0.3 -
0.!
0.1 -
o o o — a -
: l a inn I
cn aD ODD a
DDO
HD D O aa ca
023 Q D
o cfa Q•
0.1 -!io a D
ta
0 0.2
Normalized differences
0.350.280.230.220.150.10.1
O.'" 0 . 6 O.B
Nonnalized difference
iNDcrit(iO0%)) Proportion of individuals
100%95%90%85%80%75%70%
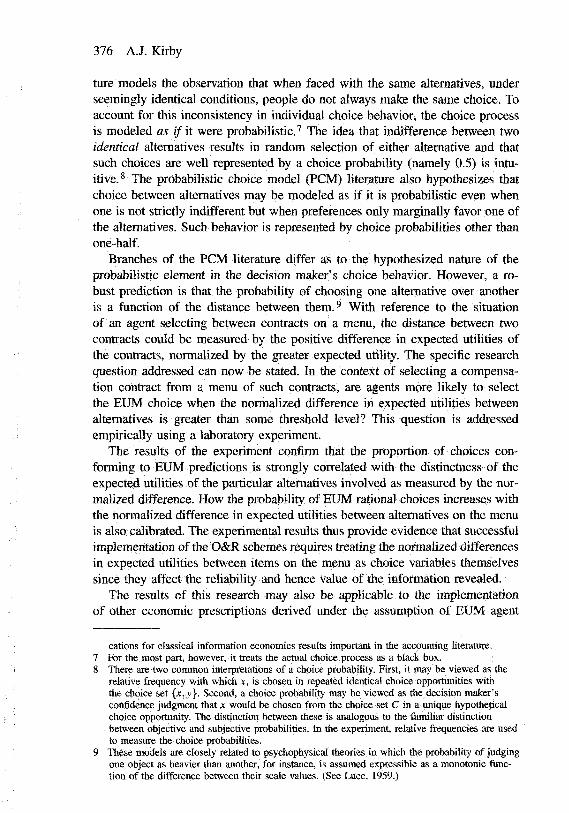
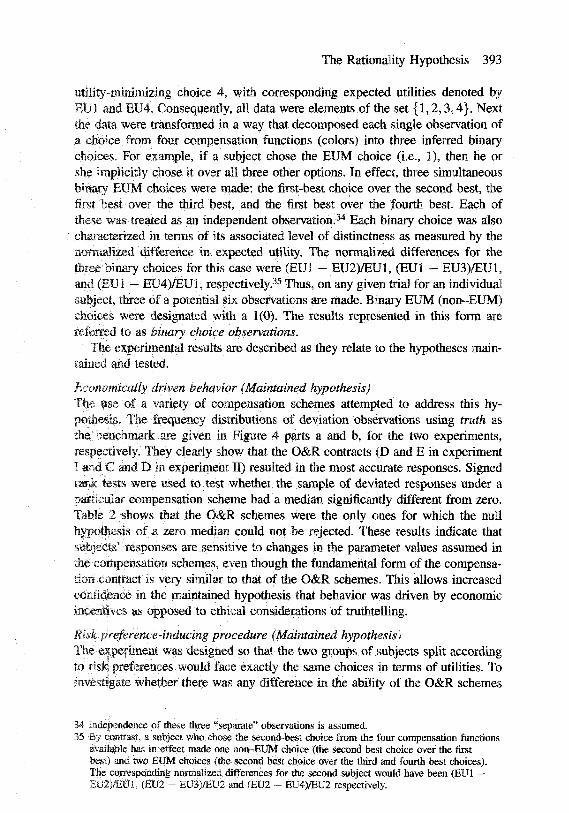
Calibrations using group data were estimated from the regression of the pro-portion of subjects (in a particular subject group) selecting the EUM choiceagainst the level of nonnalized difference. ^^ A plot of these points is givenin Figure 7. The data points were ranked in terms of the independent variableand that level of nonnalized difference identified beyond which all observationsshowed that 100 percent of the observations indicated the EUM choice. Theseconsistently EUM observations were removed from the sample before the regres-sion line through the remaining points was estimated. The resulting estimatedregression line was:
42 Only those data points for which at least four sobjects made up the observation were includedin the sample. The rationale for including only these data points is that the possible error inthe observations is therefore likely to be considerably more homogeneous. The largest numberof subject observations aggregated into one point is 11 subjects.
The Rationality Hypothesis 403
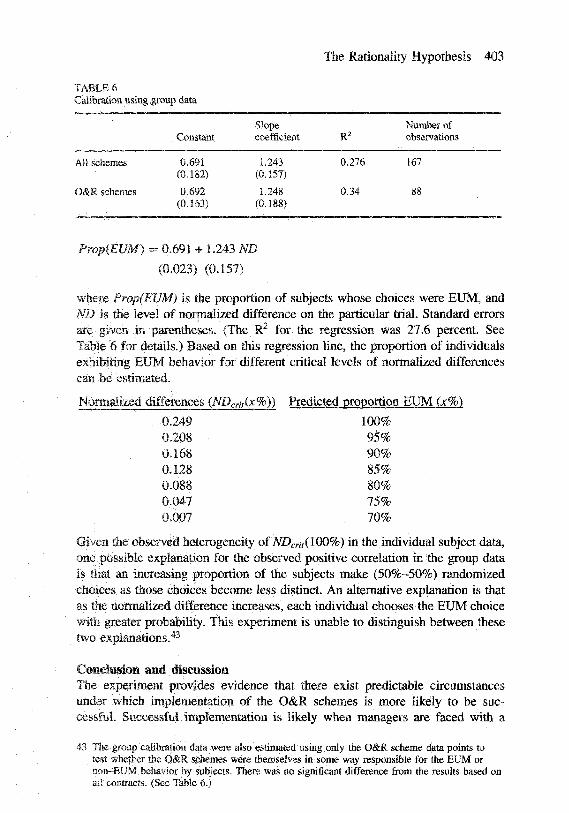
TABLE 6CaUbratisjn using group data
Slope Number ofConstant coefficient R^ observations
All schemes 0.691 1.243 0.276 167(0.182) (0.157)
O&R schemes 0.692 1.248 0.34 88(0.163) (0.188)
PropiEVM) = 0.691 + 1.243 ND
(0.023) (0.157)
where Prop(EUM) is the proportion of subjects whose choices were EUM, andND is the level of normalized difference on the particular trial. Standard errorsare given ia parentheses. (The R^ for the regression was 27.6 percent. SeeTable 6 for details.) Based on this regression line, the proportion of individualsexhibiting EUM behavior for different critical levels of normalized differencescan be estimated.
Normalized differences {NDcritix%)) Predicted proportion EUM (x%)
. 0.249 100%0.208 95%0.168 90%0.128 85%0.088 80%0.047 75%0.007 70%
Given the observed heterogeneity of NDcrit(iOO%) in the individual subject data,one possible explanation for the observed positive correlation in the group datais tbat an increasing proportion of the subjects make (50%-50%) randorrdzedchoices as those choices become less distinct. An alternative explanation is thatas the normalized difference increases, each individual chooses the EUM choicewith greater probability. This experiment is unable to distinguish between thesetwo explanations.*^
Conclusiioii and discussionThe experiment provides evidence that there exist predictable circumstancesunder which implementation of the O&R schemes is more likely to be suc-cessful. Successful implementation is likely when managers are faced with a
43 The group calibration data were also estimated using only the O&R scheme data points totest whether the O&R schemes were themselves in some way responsible for the EUM ornon-EUM behavior by subjects. There was no significant difference from the results based onai! contracts. (See Table 6.)
404 A.J. Kirby
menu of contracts in which the individual contracts are sufficiently distinct thatthe expected utility-maximizing contract is clearly superior. A critical level ofdifference for 85 percent of responses to be EUM was calibrated as approxi-mately 13 percent. Guaranteed perfectly EUM choices would require a differenceon the order of 35 percent. If the true relationship involves only the normalizeddifference in expected utilities as the measure of distinctness, this calibrationshould robust to changes in the general level of payments.
With respect to the implementation of O&R compensation schemes, thisprimary result of the experiment has several implications. First, the number ofitems on the O&R menu becomes an issue. Although more contracts can reducethe cost to the principal for low types, the need for sufficient distinction betweenitems may increase the expected cost of all but the lowest type by more than theamount of the savings. This effect might be mitigated if the extra contracts alsoallow marginal changes in the decision strategy of the principal in her planningproblem (i.e., if there is strict value to the extra infonnation). These results alsosuggest that in situations where there is value to the separation between manytypes, this infonnation might be elicited more efficiently by several rounds ofelicitatioo (i.e., a menu of menus) rather than by a single elicitation using onevery large menu.
More generally, these results have potential implications for other practicalsituations requiring individuals to make choices between gambles (e.g., invest-ment choices) and for refining theoretical modeling. For example, if it wereascertained that the source of the probabilistic element in choice behavior wasthat of costly processing (as conjectured by the constant utility PCMs), the ex-perimental results could be interpreted as shedding light on the form of the costof processing.
The results also showed that individuals differ in the extent to which theyneed options to be distinct before they can perceive that difference. Furthertesting is required to determine whether this is caused by differential motivationacross subjects provided by the constant level of prizes or differential abilitiesacross subjects to perceive differences. The existence of heterogeneity acrossindividuals in NDcritix — 100%), however, has important implications from theperspective of implementation of the O&R schemes regardless of the cause ofthe heterogeneity. For example, if designing larger normalized differences intothe O&R schemes is prohibitively expensive, one might consider selecting outindividuals with large NDcrit values and using the O&R compensation schemesonly for the remaining individuals.
This experiment required subjects to choose from menus of compensationcontracts in an environment lacking moral hazard. Theoretically, it has beenshown in a moral hazard setting that the O&R schemes retain their desirablereporting incentives and in addition motivate efficient provision of effort levelsby the agent under some circumstances (Kirby, Reichselstein, Sen, and Paik,1991). However, the issue of whether the results generated in this experimentare also valid under moral hazard is an open one. If it is the case that inability
The Rationality Hypothesis 405
to perceive small differences causes probabilistic choice behavior, one wouldexpect the results of the calibration to be robust to the incorporation of moralhazard since an environment incorporating moral hazard and adverse selectionis still one in which the agent chooses a contract from a menu.*^ Altematively,suppose that probabilistic choice behavior is due to excessive difficulty or costof processing infonnation by the agent (i.e., unwillingness). To the extent thatthe simultaneous selection by the agent of his effort level and a budget is asignificantly more costly (i.e., difficult) choice to make than is that of choosingsimply a "budget," even though botli are embodied in the selection of one con-tract from the menu, one would be skeptical of the robustness of the calibrationresults to the introduction of moral hazard. Further experimentation is neces-sary to detemiine which of these conjectures is appropriate and, consequentl)?,whether the results of the specific setting here are valid in a moral hazard setting.
In summary, evidence has been provided that optimal design and implemen-tation of O&R compensation schemes must consider the fact that under certainpredictable circumstances, individual choice behavior is better represented asprobabilistic rather than as consistent with EUM predictions.
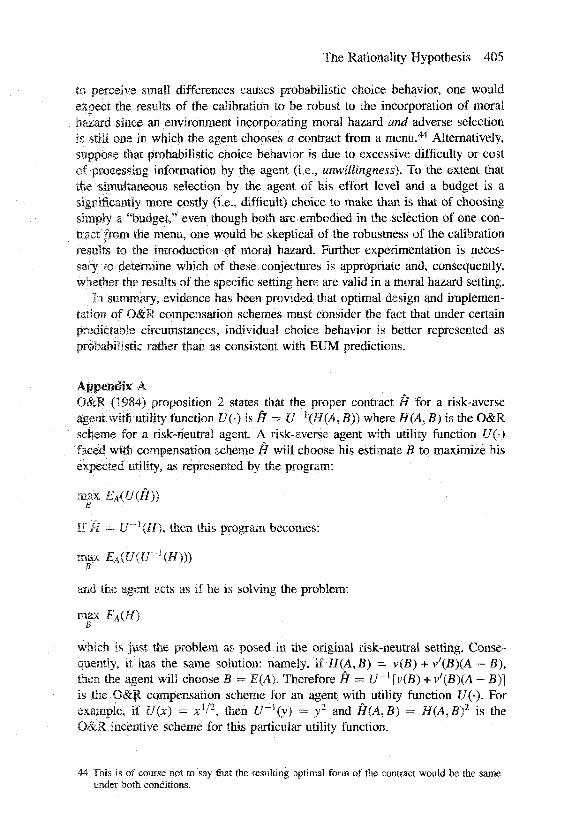
Appeniiix AO&R (1984) proposition 2 states that the proper contract H for a risk-averseagent with utility function £/(•) is ^ = £/~'(H(A, B)) where H(A, B) is the O&Rscheme for a risk-neutra! agent. A risk-averse agent with utility function U(-)faced with compensation scheme H will choose his estimate B to maximize hisexpected utility, as represented by the program:
max EAiU{H))
If H — U'~'\H), then this program becomes:
max
and the agent acts as if he is solving the problem:
max EA{H)B
which is just the problem as posed in the original risk-neutral setting. Conse-quently, it has the same solution: namely, if H{A,B) = v(B) + v'(B)(A — B),then the agent will choose B = £(A). Therefore H = U"'^ [v{B) + v'(B)(A - B)]is the O&R compensation scheme for an agent with utility function [/(•). Forexample, if Uix) = x'/2, then U'^(y) = y^ and H{A,B) = HiA^B)^ is theO&R incentive scheme for this particular utility function.
44 This is of course not to say that the resulting optimal form of the contract would be the sameunder both conditions.
406 A.J. Kirby
Appendix B
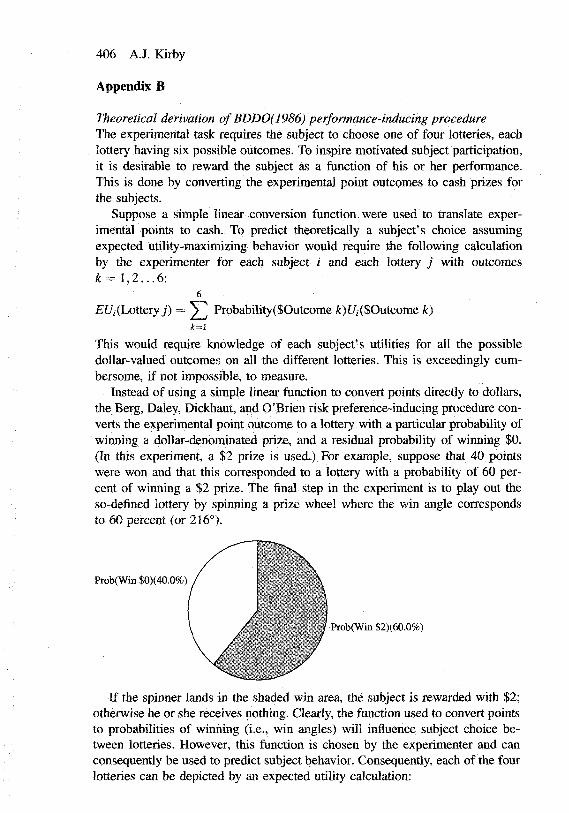
Theoretical derivation of BDDO(1986) performance-inducing procedureThe experimental task requires the subject to choose one of four lotteries, eachlottery having six possible outcomes. To inspire motivated subject participation,it is desirable to reward the subject as a function of his or her performance.This is done by converting the experimental point outcomes to cash prizes forthe subjects.
Suppose a simple linear conversion function were used to translate exper-imental points to cash. To predict theoretically a subject's choice assumingexpected utility-maximizing behavior would require the following calculationby the experimenter for each subject ? and each lottery j with outcomesk^ 1,2...6:
6
Ef/KLottery j) = ^ Probability($Outcome ;t)[/i($Outcome k)k=l
This would require knowledge of each subject's utilities for all the possibledollar-valued outcomes on all the different lotteries. This is exceedingly cum-bersome, if not impossible, to measure.
Instead of using a simple linear function to convert points directly to dollars,the Berg, Daley, Dickhaut, and O'Brien risk preference-inducing procedure con-verts the experimental point outcome to a lottery with a particular probability ofwinning a dollar-denominated prize, and a residual probability of winning $0.(In this experiment, a $2 prize is used.) For example, suppose that 40 pointswere won and that this corresponded to a lottery with a probability of 60 per-cent of winning a $2 prize. The final step in the experiment is to play out theso-defined lottery by spinning a prize wheel where the win angle correspondsto 60 percent (or 216°).
Prob(Win $0)(40.0%)
l>rob(Win $2)(60.0%)
If the spinner lands in the shaded win area, the subject is rewarded with $2;otherwise he or she receives nothing. Clearly, the function used to convert pointsto probabilities of winning (i.e., win angles) will influence subject choice be-tween lotteries. However, this function is chosen by the experimenter and canconsequently be used to predict subject behavior. Consequently, each of the fourlotteries can be depicted by an expected utility calculation:
The Rationality Hypothesis 407
6
ft/,-(Lottery j) = ^ Prob(Outcome k) • £•£/,-(Outcome k)k=i
where £(/j(Outcome k) = [J7($2)Prob(Win $21 Outcome k)
+ l/($O)[l - ProbCWin $21 Outcome k)]]
Since utility functions are defined up to a positive affine transformation, wecan set t/($0) = 0 for all subjects so that:
£t/,-(Lottery j ) = ^ Prob(Outcome k) • [/($2)Prob(Win $21 Outcome k)k=l
Now the lotteries can be ranked for a given subject since the expected utility ofeach lottery is a linear function of a single unknown quantity, U{$2), and thesubject's choice can be predicted.
/kltering the conversion function from points to probabilities of winning $2should affect subject preferences over the lotteries. A linear conversion functionis equivalent in terms of its incentives for an EUM individual to assuming a risk-neutral attitude toward point outcomes. Similarly, a concave conversion functionwiirinduce a risk-averse attitude toward the accumulation of experimental points.In this experiment, two groups of subjects are used. One group is induced tobe risk neutral toward points (by using a linear conversion function), and theother group is induced to act as if it has a power utility function with respectto experimental points. The latter is induced by using the following conversionfunction:
Prob(Win $21 Earning y points) =U(100)
U(y) = _y is used to induce risk neutrality in subjects, and the concavefunction U(y) = y^l^ is osed induce subjects to be risk averse with respect topoints. To equalize the expected dollar reward to all subjects, the utility functionshave been calibrated to give an expected probability of winning of 50 percent
for a given trial and subject type, ^suming that subjects behave as expectedatilitj' max.imizers.
ReferencesBaiman, S. and B.L. Lewis, "An Experiment Testing the Behavioral Equivalence of
Strategically Equivalent Employment Cotitracts," Journal of Accounting Research(Spring 1989) pp. 1-20.
Berg, I.E., L.A. Daley, J.W. Dickhaut, and J.R. O'Bdeti, "Controlling Preferences forLotteries on Units of Experimental Exchange," Quarterly Journal of Economics(May 1986) pp. 281-306.
Coombs, C.H., R.M. Dawes, and A. Tversky, Mathematical Psychology (EnglewoodCliffs, N.J.: Prentice Hall, 1970).
408 A.J. Kirby
Gonik, J., "Tie Salesmen's Bonuses to Their Forecast," Harvard Business Review(May-June 1978) pp. 116-123.
Hilton, R.W., Probabilistic Choice Models and Infonnation, SAR #24 (Sarasota, Fla.:American Accounting Association, 1985).
Hochberg, J.E., Perception (Englewood Cliffs, N.J.: Prentice-Hall, 1964).Hollander, M. and D.A. Wolfe, Nonparametric Statistical Methods (New York: Wiley,
1973).Ijiri, Y., J.C. Kinard, and F.B. Putney, "An Integrated Evaluation System for Budget
Forecasting and Operating Performance," Journal of Accounting Research (Spring1968) pp. I - l l .
Kaplan, R.S. and A.A. Atkinson, Advanced Management Accounting (EnglewoodCliffs, N.J.: Prentice Hall, 1989).
Kirby, A.J., S. Reichelstein, P.K. Sen, and T.Y. Paik, "Participation, Budgetary Slack,and Managerial Perfonnance Evaluation," Journal of Accounting Research (Spring1991). pp. 109-128.
Luce, R.D., Individual Choice Behavior (New York: Wiley, 1959).Luce, R.D. and P. Suppes, "Preference, Utility and Subjective Probability," in: R.D.
Luce, R. Bush, and B. Galanter (eds.). Handbook of Mathematical Psychology:Volume 111 (New York: Wiley, 1965).
Osband, K. and S. Reichelstein, "Incentives in Government Contracts," Journal ofPublic Economics (July 1984) pp. 257-270.
Reichelstein, S., "Constructing Incentive Schemes for Government Contracts: AnApplication of Agency Theory," Working Paper, Stanford University (November1990).
Waller, W.S., "Slack in Participative Budgeting: The Joint Effect of a Truth-InducingPay Scheme and Risk Preferences," Accounting, Organizations and Society, vol. 13,no. 1 (1988) pp. 87-100.
Weitzman, M.L., 'The New Soviet Incentive Model," Bell Journal of Economics(Spring 1976) pp. 251-257.