Embed Size (px)
Citation preview
Incentives for Tax Planning andAvoidance: Evidence from the Field
The MIT Faculty has made this article openly available. Please share how this access benefits you. Your story matters.
Citation Graham, John R., Michelle Hanlon, Terry Shevlin, and Nemit Shroff.“Incentives for Tax Planning and Avoidance: Evidence from theField.” The Accounting Review 89, no. 3 (May 2014): 991–1023.
As Published http://dx.doi.org/10.2308/accr-50678
Publisher American Accounting Association
Version Author's final manuscript
Citable link http://hdl.handle.net/1721.1/98857
Terms of Use Creative Commons Attribution-Noncommercial-Share Alike
Detailed Terms http://creativecommons.org/licenses/by-nc-sa/4.0/

Electronic copy available at: http://ssrn.com/abstract=2148407 Electronic copy available at: http://ssrn.com/abstract=2148407
Incentives for Tax Planning and Avoidance: Evidence from the Field
John R. Graham Duke University
Michelle Hanlon Massachusetts Institute of Technology
Terry Shevlin University of California, Irvine
Nemit Shroff Massachusetts Institute of Technology
September 13, 2013 – Forthcoming at The Accounting Review
ABSTRACT: We analyze survey responses from nearly 600 corporate tax executives to investigate firms’ incentives and disincentives for tax planning. While many researchers hypothesize that reputational concerns affect the degree to which managers engage in tax planning, this hypothesis is difficult to test with archival data. Our survey allows us to investigate reputational influences and indeed we find that reputational concerns are important – 69% of executives rate reputation as important and the factor ranks second in order of importance among all factors explaining why firms do not adopt a potential tax planning strategy. We also find that financial accounting incentives play a role. For example, 84% of publicly traded firms respond that top management at their company cares at least as much about the GAAP ETR as they do about cash taxes paid and 57% of public firms say that increasing earnings per share is an important outcome from a tax planning strategy.
Keywords: Tax avoidance, Tax planning, Reputation, Financial accounting incentives, JEL Classification: D83; G31; M41.
Data availability: Survey responses are confidential. Other data are available from public sources identified in the paper. We appreciate helpful comments from Harry Evans (senior editor), Dave Guenther (editor), two anonymous referees, Jennifer Blouin, Jeff Hoopes, Pei Hui Hsu (discussant), Allison Koester, Becky Lester, Pete Lisowsky, Ed Maydew, Ryan Wilson, Ben Yost, and participants at the 2011 UNC Doctoral Course, 2011 AAA Western Regional Meetings, University of Nebraska, University of Texas Tax Readings Group, and University of Washington Brownbag presentation. Thanks to the following people for helpful comments on the development of survey questions: Jennifer Blouin, Merle Erickson, Ken Klassen, Peter Merrill, Lil Mills, Sonja Rego, Richard Sansing, Stephanie Sikes, Joel Slemrod, and Ryan Wilson. We also appreciate the support of PricewaterhouseCoopers, especially Peter Merrill, and the Tax Executives Institute, especially Tim McCormally, in asking firms to participate and in reviewing the survey document. Finally, each author is grateful for the financial support of the Fuqua School of Business, Paton Accounting Fund at the University of Michigan, and the Paul Merage School of Business at the University of California-Irvine. A previous version of this paper was entitled “Inside the Corporate Tax Department: Insights on Corporate Decision Making and Tax Planning.”

Electronic copy available at: http://ssrn.com/abstract=2148407 Electronic copy available at: http://ssrn.com/abstract=2148407
1
I. INTRODUCTION
In this paper, we examine the determinants of managers’ willingness to engage in tax
planning strategies by directly asking tax executives about their incentives via a survey.1 Although
prior research discusses some of the incentives for firms to engage (or not engage) in tax planning,
the empirical evidence on these incentives is mixed, likely because of difficulties in measuring tax
planning strategies and managerial incentives using archival data (Hanlon and Heitzman 2010).
The primary benefit of using survey methodology is that we gain direct insights about (stated)
managerial motives, which are unobservable using archival data.2 Our intent is to conduct new
tests, as well as complement and extend the predictions and evidence found in empirical-archival
studies. Accordingly, we use prior literature as the basis for our survey questions and focus on
research questions that are difficult to address with archival data or that have mixed and
conflicting empirical evidence.
Our first objective is to investigate whether reputational concerns are a significant factor
when firms make decisions about tax planning. Some have conjectured that reputational concerns
lead some firms to limit tax planning. For example, Bankman (2004) suggests that a firm that
aggressively avoids taxes may be labeled a “poor corporate citizen,” which might adversely affect
product market outcomes. In addition, an Ernst & Young (2011) report discusses a new breed of
tax activism where activist groups and the media bring attention to companies not paying ‘their
fair share’ as discussed further below. Hanlon and Slemrod (2009) attempt to test the hypothesis
that reputation matters using both a sample of firms accused of tax sheltering as well as a sample
1 Throughout this paper we use the terms “tax avoidance” and “tax planning” interchangeably. We follow Hanlon and Heitzman (2010) and define tax avoidance broadly as the reduction of explicit cash taxes, which includes all transactions from investing in a municipal bond to engaging in tax shelters. 2 We recognize that the survey approach has limitations as well, such as a potential reluctance to truthfully disclose tax planning and avoidance activity. Below we discuss both the benefits and costs of the survey approach.
Electronic copy available at: http://ssrn.com/abstract=2148407 Electronic copy available at: http://ssrn.com/abstract=2148407
2
of firms listed by the Citizens for Tax Justice as being poor corporate citizens for having low tax
rates. The authors find some limited evidence consistent with reputational concerns being a viable
disincentive to tax plan. They document a more negative market reaction to news of using a tax
shelter for firms in the retail industry relative to firms in non-consumer products industries.3
However, in a study of 113 firms subject to public scrutiny for having engaged in tax shelters,
Gallemore, Maydew, and Thornock (2013) find no evidence of a reputation effect in terms of
CEO and CFO turnover, auditor turnover, lost sales, increased advertising costs, and decreased
media attention. Indeed, doubts about whether reputation effects for tax avoidance exist are
conveyed by Alan Murray in a Wall Street Journal article who states “Lying to the IRS doesn’t
generate the same public outrage as lying to shareholders. In some quarters of the country, it is
almost seen as a patriotic act” (Murray 2002, A4).
An important limitation of tests that examine the reputational consequences for firms that
were publicly identified as engaging in tax shelters is that the sample includes firms that chose to
engage in the shelter and were caught. The researchers in these studies cannot account for the
possibility that ex ante reputation concerns deter the firms and the strategies that are most likely to
result in reputation penalties. In other words, whether reputation concerns constrain tax planning is
not measurable in archival tests of tax shelter firms because strategies that firms do not employ
because of reputational concerns are not observed.4 Another method of testing reputation and tax
planning would be to correlate proxies of reputation and tax planning measures. Tests of this
3 Hanlon and Slemrod (2009) also test advertising and brand value but find insignificant results. Hanlon, Mills, and Slemrod (2007) examine corporate tax non-compliance and report a negative and significant coefficient on advertising expense (scaled by assets) in a regression where tax deficiency (scaled by sales) is the dependent variable. While not their central hypothesis, the authors offer an ex post explanation that this result may be due to negative publicity from being a bad corporate citizen (Hanlon et al. 2007, 201). 4 The limitation of the absence of a counterfactual is recognized by these previous authors. In addition, as the other authors also note, some firms engage in tax shelters but are not caught, and thus are not identified as shelter firms in archival-empirical papers.
3
nature are useful but identification is difficult because reputation as a construct is difficult to
measure and outcomes of tax planning strategies are not always reflected in financial statements,
as discussed by McGill and Outslay (2004), particularly their discussion of how Enron’s tax
strategies were not reflected in financial statement measures.5
The survey approach is valuable in this setting because we can directly ask tax executives
“why did your company not engage in a tax strategy.” Our survey results provide evidence that the
potential for an adverse effect on company reputation significantly constrains firms’ incentives to
engage in tax planning strategies, with 69% of our survey respondents, including 72% of publicly
traded respondents, indicating that reputation concerns are ‘important’ or ‘very important.’ Indeed,
concern about reputation ranks second only to the concern that a tax strategy might not pass the
judicial standard of “business purpose/economic substance.”6
We then use our data to examine the determinants of these reputation concerns in terms of
the types of firms that are concerned about reputation. We find that publicly traded companies,
larger companies, more profitable companies, and companies in the retail industry are significantly
more concerned about the adverse reputation consequences of tax planning. We also test whether
concerns about reputation are associated with higher tax rates, measured several ways. We find
evidence consistent with reputation concerns being significantly associated with higher long-run
cash ETRs and lower probabilities of engaging in tax shelters as measured by the Lisowsky (2010)
score.
Our second objective is to examine the role of financial accounting effects in tax planning
decisions. Primarily, we are referring to the fact that when reported tax expense (i.e., the GAAP
5 Although not testing reputation per se, related studies have tested the effect of political costs on effective tax rates using size as a proxy for political costs (Zimmerman 1983) and whether or not the company is in the defense industry (McIntyre et al. 2011 and Mills et al. 2012). We discuss anecdotal evidence below. 6 We discuss business purpose and economic substance below.
4
ETR) is lower, reported financial accounting earnings are higher.7 There is a long book-tax
tradeoff literature on how tax planning is affected by accounting method and reporting choices
(Shackelford and Shevlin 2001). In addition, recent studies suggest that tax departments are often
operated as profit centers (Robinson, Sikes, and Weaver 2010), tax strategies are engaged in with
the goal of improving accounting outcomes (e.g., Desai and Dharmapala 2006), and tax policy
responsiveness is constrained by accounting effects (Shackelford, Slemrod, and Sallee 2011). We
extend this line of inquiry by asking companies directly about their prioritization of tax and
accounting goals. We find that 47% of the tax executives in publicly traded companies state that
top management values the GAAP ETR more than the cash taxes paid and in another 37% of
public firms the two metrics are equally valued by top management. Thus, in 84% of the public
companies, the accrual accounting measure of taxes that affects reported accounting earnings is at
least as important as the cash taxes paid. In cross-sectional analyses, we find evidence consistent
with the prioritization of accounting earnings over cash taxes being significantly more likely when
the firm is under greater capital market scrutiny, as proxied by being publicly traded, having high
analyst following, or having high institutional ownership. For example, as compared to the 84% of
public companies noted above, only 48% of private firms respond that the GAAP ETR is at least
as important as cash taxes paid. Thus, our data provide direct evidence about how important
accounting earnings are to companies with capital market incentives.
We also ask the respondents 1) about the frequency with which tax planning strategies are
pitched to their firm by accounting, law, investment or tax consulting firms as a way to increase
financial accounting earnings, 2) whether accounting concerns are important when deciding
7 Engle et al. (1999) examine companies’ use of debt-equity hybrid securities and how these securities allowed the firm to treat the security as debt for tax purposes (i.e., deduct interest expense for tax purposes) but treat the security as equity for financial accounting purposes thus improving their debt-equity ratios, thus also highlighting the balance sheet ratio focus in that setting.
5
whether to engage in tax planning, and 3) about the trade-off between cash taxes and financial
accounting earnings per share (EPS) in the context of tax planning. Our survey evidence suggests
that financial accounting earnings are important. For example, 32% of all firms in our sample
(35% of the public firms) indicate that the tax planning strategies marketed to their firm were
‘always’ or ‘often’ marketed as a way to increase earnings. Further, we find that 61% of the
surveyed companies (71% of the public and 23% of the private companies) say that it is important
that a tax strategy does not reduce EPS and 49% of the surveyed companies (57% of the public
and 22% of the private companies) respond that it is important that the strategy actually leads to
higher EPS.8 The stated importance of financial accounting earnings on the incentive to engage in
tax planning provides direct evidence on the predictions and hypotheses about the interaction of
financial statement effects and tax planning put forth in recent studies.9
We also examine determinants of the importance rating of financial concerns and find that
the primary driver is capital market incentives. Publicly traded firms, larger firms, firms with high
analyst following, and firms with high institutional ownership are significantly more concerned
than other firms about the financial reporting effects of tax planning strategies. Overall, we
conclude that capital market scrutiny is the primary determinant of the extent to which financial
reporting considerations affect tax planning incentives. With respect to the consequences, we do
not find consistent evidence that firms that say financial reporting considerations are important for
tax planning have different outcomes in terms of their GAAP or cash ETRs and tax sheltering
probabilities as conventionally measured in the literature.
Our paper contributes to the literature on determinants of corporate tax avoidance by
directly asking tax executives about reputational concerns – a factor difficult to test with empirical 8 Note that the differences in importance ratings between public and private companies are statistically significant at the p<0.10 level or better in the tests above. 9 Examples include Robinson et al. (2010), Shackelford et al. (2011), Graham et al. (2011), Hanlon (2012), and Desai and Dharmapala (2009a).
6
data. We provide evidence that reputational concerns are an important factor that limits the extent
to which companies engage in tax planning. Our paper also contributes to the book-tax tradeoff
literature through our direct inquiry of executives about the effects of financial accounting on tax
planning decisions.
Next, Section II discusses the survey methodology. Section III provides descriptive
statistics about our sample firms and discusses tests of nonresponse bias. Section IV presents
survey questions and results and Section V concludes.
II. SURVEY METHODOLOGY AND SAMPLE10
We developed our survey instrument with the support of the Tax Executives Institute (TEI)
and PricewaterhouseCoopers (PWC).11 We solicited feedback from several academic researchers,
TEI, and PWC on the survey content and design. Survey Sciences Group (SSG), a survey research
consulting firm, assisted with the survey formatting and programed an online version. We had two
companies beta test the survey and we made revisions based on their suggestions. The final survey
contained 64 questions, most with subparts. The paper version of the survey was 12 pages long.
There were many branching questions and, as a result, many firms were directed to answer only a
portion of the questions. See www.ssgresearch.com/taxsurvey for the online version of the survey.
The paper version is available upon request.
10 The survey has four parts. One section asks detailed questions about reputational and financial accounting concerns, the subject of the current paper. Another section gathers general demographic and descriptive questions about the companies, which we use for conditional analyses. A third section of the survey explores location and reinvestment/repatriation decisions, which is the focus of Graham, Hanlon, and Shevlin (2011). A fourth section focuses on the 2004 American Jobs Creation Act and repatriation decisions in response to that Act including, sources and uses of cash repatriated. The analyses of the data from this fourth part of the survey is summarized and discussed in Graham, Hanlon, and Shevlin (2010). The discussion in this section closely follows that in Graham et al. (2011) and Graham et al. (2010) because the survey instrument is the same across the three papers. 11 TEI is an association whose members are top executives responsible for the tax affairs of U.S. and foreign businesses. The member companies are from a wide range of industries. TEI was founded in 1944 and provides networking opportunities, conferences, and educational opportunities for its members.
7
We emailed an invitation initially on August 9, 2007 to the 2,794 member firms of TEI.
We examined the list of Fortune 500 companies and identified 45 firms that were not members of
TEI. For these firms, PWC supplied the tax executive’s name and email address. Three email
invitations were returned as undeliverable. On August 15, 2007, we sent a letter via two-day
express mail to 15 companies for which we did not have email addresses. A total of 2,806
companies received invitations to complete the survey. SSG sent three email reminders throughout
August and September. We then sent a paper version of the survey along with a letter with
instructions of how to complete the questionnaire online during the last week of September and
the first week of October. We closed the online survey on November 9, 2007.
A total of 804 firms accessed the survey. Sixty of these companies entered no more than
two responses and thus we delete them from our sample, leaving 744 usable responses. The
response rate for our survey is 26.5%, which compares favorably to many prior survey studies.12
Because our interests are about U.S. firms incentives for tax planning and avoidance, we eliminate
11 firms that indicate they are not subject to the U.S. corporate income tax (i.e., businesses not
taxed at the entity level, such as S corporations and other flow-through entities). We also eliminate
29 companies that indicate that they did not file a corporate income tax return based on the
assumption that these companies are not C corporations. We restrict the sample further by
eliminating firms that are subsidiaries of foreign parents since their tax planning incentives are
likely to be affected by the tax rules and enforcement in the parent’s home country. This leaves
595 remaining firms on which we conduct our analyses. The sample size varies across questions
due to branching or incomplete responses for a particular question.
12 For example, Graham, Harvey, and Rajgopal (2005), Brav et al. (2005), Slemrod and Venkatesh (2002), Graham and Harvey (2001), Slemrod and Blumenthal (1996), and Trahan and Gitman (1995) report response rates of 10.4%, 16%, 9-12%, 9%, 21.8%, and 12%, respectively.
8
There are caveats and limitations to survey research. First, firms that decide to answer the
survey may be systematically different than firms that do not answer the survey. We address this
concern by comparing our survey respondents to the typical Compustat firm to get a sense of the
size and other characteristics of our sample firms relative to the typical sample of firms included in
the extant literature. In addition, we also compare firms that responded to the survey with firms
that did not respond, with the data tabulated and discussed below in Section III.
Another concern with survey based research is that it is plausible that survey respondents do
not answer truthfully. There is no way to completely eliminate this possibility; however, we took
many precautions in an effort to encourage truthful responses. For example, when asking about an
aggressive tax strategy, we did not directly ask whether the firm of the survey respondent engaged
in tax shelters. Rather, we asked how often tax strategies were marketed to the firm, did the extent
of marketing change over time, and what factors affected firms’ choices to not engage in such a
strategy. Thus, we are able to gather insightful data while at the same time mitigating the
inclination to lie or to simply not respond to the survey.13
Finally, other concerns about surveys include the possibility that respondents may not have
understood some questions or may have answered questions randomly. We attempted to mitigate
these concerns by having academics, practitioners, and a set of beta firms carefully review the
survey before it was distributed. We also employed a professional survey consulting firm to assist
in programming the survey online and in designing the questions. We employ cross-sectional tests
that suggest that respondents did not answer the questions randomly. However, our results should
still be interpreted cautiously in light of these potential caveats.
13 We took the efforts just described to avoid untruthful responses, but realistically we have no reason to believe that tax directors colluded and lied about the relative importance of financial accounting and reputation effects in their tax planning activities. Our survey results obtained through direct questioning of tax executives triangulate and confirm archival empirical literature on book-tax tradeoffs and go one step further to ask about the importance of reporting increases in after-tax reported earnings when tax planning.
9
III. DESCRIPTIVE STATISTICS AND RESPONSE BIAS TESTS
We gather demographic information on the survey instrument and merge the survey
responses of public firms with data from Compustat to obtain more detailed information. Table 1
presents the descriptive statistics of our sample firms. Survey responses indicate that 76.6% of our
sample firms are publicly listed. The average firm in our sample has $8.8 billion in assets (Assets),
with the average public (private) firm having $10.4 billion ($2.3 billion) in assets (untabulated).
Survey responses also indicate that the average firm in our sample has 19.2% of its assets in
foreign locations (Foreign Assets) and a GAAP ETR of 30.5%.14 Finally, our survey data indicate
that 46.3% of our sample firms have a U.S. net operating loss carryforwards (US NOL).15
Additional data from Compustat indicate that the average public firm in our sample has
$5.7 billion in sales (Sales), a market capitalization (MVE) of $8.3 billion and earns a 6.5% return
on assets (ROA). The sales and asset growth (Sales Growth; Asset Growth) for the average public
firm in our sample are 14.1% and 13.6%, respectively. Only 25% of the public firms in our sample
invest in R&D or advertising (R&D Intensity; Advertising Intensity) and the average R&D
Intensity (Advertising Intensity) is 2.6% (1.4%), where R&D Intensity (Advertising Intensity) is
R&D (advertising) expense scaled by assets. The average public firm in our sample is followed by
nine analysts (Analyst Following) and has 50.7% institutional ownership (Institutional
14 GAAP ETR is defined as the total income-tax expense scaled by pre-tax book income. 15 We compare our data to Compustat and find that 39% of Compustat firms in 2006 report an NOL carryforward (measured as having a positive tax loss carryforward, which when measured by Compustat does not distinguish among state, federal or foreign). Next, we find that of our survey respondents that are also on Compustat, 40% have NOLs (per the Compustat variable) and this percentage is statistically indistinguishable from the 39% reported for the entire Compustat population. Thus, our sample is similar to the Compustat population with respect to reported net operating loss carryovers. Upon further examination, we find that a substantial number of these firms have a positive federal current tax expense. Thus, it appears that these firms pay U.S. taxes despite the federal net operating loss carryover. One explanation is that the firms have acquired losses that are not immediately available for use against the acquiring company’s taxable income (e.g., the losses are limited under Section 382). We recognize also though that current tax expense may not be equivalent to cash taxes paid and may represent some accounting accruals. Overall, to the extent that the NOLs are not immediately usable, the firms that have these NOLs are not non-tax paying firms and the results should be interpreted with this in mind.

10
Ownership). Further, the average public firm has unsigned abnormal accruals (|Abnormal
Accruals|) amounting to 9% of its total assets and a financial distress score (Altman’s Z-Score) of
4.4 based on Altman (1968 and 2000).
In terms of tax planning proxies used in prior research, we find that the average public firm
in our sample has an annual cash ETR (Cash ETR) of 28.2%, a 3-year cash ETR (3-Yr Cash ETR)
of 27.4%, a 94.4% probability of investing in a tax shelter using Lisowsky’s (2010) measure
[P(Tax Shelter)], and tax aggressiveness score of 0.03 based on the discretionary permanent book-
tax differences (DTAX) measure proposed by Frank, Lynch, and Rego (2009).16 These values are
largely consistent with that documented in prior research. For example, Chyz (2012) finds that the
median P(Tax Shelter) in his sample ranges from 80% to 94% with higher values for larger firms
and Rego and Wilson (2008) find a median value of 0.04 for DTAX in their sample. Although
consistent with prior research, the high probability of engaging in tax shelters [P(Tax Shelter)]
raises questions about the interpretation of the variable. We note that for the purpose of our paper,
we are interested in capturing the cross-firm variation in the probability of engaging in tax shelters
with P(Tax Shelter) rather than the absolute magnitude of this variable.
Table 2 presents descriptive statistics for the average Compustat firm, the average survey
respondent, and the average survey non-respondent.17 Our average surveyed firm is larger than the
average Compustat firm in terms of Assets, MVE, and Sales. Our average surveyed firm has a
smaller cash-to-asset ratio (Cash), and a smaller market-to-book (MB) ratio relative to the average
Compustat firm. Further, the firms we surveyed have on average a higher ROA, a higher GAAP
ETR, a higher P(Tax Shelter), and lower Asset Growth and Sales Growth rates. However, we find
16 Cash ETR is defined as total income taxes paid scaled by pre-tax income. 3-Yr Cash ETR is defined as the sum of the numerator over the preceding three years scaled by the sum of the denominator of the same three years (Dyreng, Hanlon, and Maydew 2008). All variables are described in the Appendix. 17 Where the survey respondent or non-respondent is publicly traded and on Compustat, we gather data for the company from Compustat.
11
that the average survey respondent and the average Compustat firm are similar in terms of
Leverage, the probability of having a net operating loss carryforward (US NOL), and 3-Yr Cash
ETR. Overall, the firms we surveyed and our respondents are different than Compustat firms along
many dimensions, and, therefore, our results might not generalize to all Compustat firms.
Comparing respondents to non-respondents with Compustat data, we find that the average
respondent firm is statistically no different than the average non-respondent firm in terms of firm
size (i.e., Assets, MVE and Sales), Leverage, Cash, MB, NOL, GAAP ETR, 3-Yr Cash ETR, and
growth. However, the respondent firms have, on average, a higher ROA and a higher P(Tax
Shelter) than non-respondent firms. We know of no obvious biases that arise for our tests because
of these differences. However, we recognize that it is possible that the companies that decided to
answer the survey are different than those that did not. If there is such a difference, our results may
not generalize to all firms.
IV. INCENTIVES AND DISINCENTIVES OF TAX PLANNING
Reputational Concerns
A great deal remains unknown about firms’ incentives for tax planning and avoidance
(Hanlon and Heitzman 2010). One of the primary factors of interest in our study is whether
reputational concerns are an important factor for firms when considering tax planning strategies.
Bankman (2004) suggests that a firm that aggressively avoids taxes may be labeled a “poor
corporate citizen,” which might adversely affect product market outcomes. Indeed, some anecdotal
evidence is consistent with such statements. For example, a recent New York Times article
profiled GE and their tax avoidance activities (Kocieniewski 2011). GE responded on their
webpage claiming they do not avoid taxes and pay the legally owed amount. In the public

12
comments on the webpage, several people made statements such as “I will never buy GE products
again” (http://www.gereports.com/setting-the-record-straight-ge-and-taxes/).18
Prior research examines reputational effects for firms accused of engaging in tax shelters,
but the evidence is somewhat mixed. Specifically, Hanlon and Slemrod (2009) use a sample of
109 events to investigate the market reaction to the news of a firm engaging in a tax shelter. Their
tests document relatively small negative market reactions and, in some cases, a positive market
reaction if the company was not previously thought to be a “tax avoider.” The authors also
document that firms in retail industries have more negative market reactions to news of tax
sheltering, consistent with the likelihood of a consumer backlash for retail firms.
Two concurrent papers provide mixed evidence. Gallemore et al. (2013) employs a
database of 113 firms that were subject to public scrutiny for having engaged in tax shelters and
find no evidence that firms or CEOs/CFOs bear significant reputational costs. They measure
reputational costs in terms of CEO and CFO turnover, changes in advertising expense, auditor
turnover, or decrease in sales. Further, they find no decrease in firms’ tax avoidance activities after
being accused of tax shelter activity. A working paper by Austin and Wilson (2013) examines the
tax reporting behavior of firms with greater customer orientation based on the hypothesis from
Hanlon and Slemrod (2009) that such firms will bear higher reputational consequences from
engaging in tax avoidance. While they find no evidence of differences in cash taxes paid between
firms labeled consumer oriented and firms that are not labeled consumer oriented, the authors find
that consumer oriented firms report higher GAAP ETRs. The authors interpret their evidence as
18 Interestingly, GE’s reported effective tax rate on their financial statements went from 7.4% on their 2010 annual report to 21.6% on their 2011 annual report, which GE released after the press coverage. Another example is found in the experience of Starbucks in the UK in 2012. Starbucks was the subject of intense scrutiny in the UK for its lack of tax payments in the country. Picketers went to the Starbucks stores and the topic was often in the UK press. Starbucks responded by saying they would “voluntarily” pay additional taxes in the UK in the amount of $16 million (http://money.cnn.com/2012/12/06/news/companies/starbucks-uk-taxes/index.html).
13
suggesting that firms use the discretion inherent in financial reporting to report benefits of tax
planning more conservatively.
These conflicting results in part reflect the limitations of the empirical-archival
methodology for examining reputational consequences of tax planning and avoidance. For
example, empirical-archival studies such as Hanlon and Slemrod (2009) and Gallemore et al.
(2013) only examine firms whose tax strategies were discovered.19 However, if firms that have the
most to lose from a reputational hit simply refrain from engaging in aggressive tax planning for
fear of its adverse consequences, studies that address only firms with identified tax strategies
might underestimate the effect of adverse reputation concerns on tax avoidance. For example, it is
plausible that firms publicly identified as engaging in tax shelters are the firms for whom
reputation concerns are the least important.
To address these limitations and to contribute to this line of inquiry, we directly ask tax
executives why they do not engage in tax planning strategies.20 First, we ask “Has your company
ever considered but decided not to implement a tax planning strategy proposed and/or marketed by
an accounting, law, investment, or tax consulting firm?” Out of the 509 companies that responded,
77.6% or 395 firms answered yes (untabulated). Of these respondents that answered yes, we then
asked “What factors were important in your company’s decision not to implement the tax planning
19 As discussed in the introduction, tests of the effective tax rate and the relation to reputation are sparse in the literature likely because reputation is difficult to measure and because an event to make the low rates salient is necessary to conduct an empirical test. 20 We note that Ernst & Young (2011) report that 57% of tax directors state that threat of negative media attention is a somewhat or significant concern. They report that 58% of companies with annual revenues of at least $5 billion report that negative media attention is a significant concern, consistent with our results. However, we note that the E&Y results are published in a marketing brochure that states that E&Y can help to proactively manage tax risk. Second, the report does not provide any details on how the questions were asked or what types of companies answered the questions in a particular way. Third, the E&Y report attributes part of the focus by the media to the financial crisis bailouts (2011, 28) whereas our survey was conducted prior to the financial crisis and thus shows that the concerns about reputation existed before the crisis. Fourth, we ask questions about reputation generally and about media attention separately because only a subset of firms are big enough to attract media attention but most firms have a reputation to protect.
14
strategy that was proposed?” The responses are presented in Figure 1 and in Table 3, Panel A. The
most important reason for not implementing a tax strategy is because “the transaction lacked
business purpose or economic substance,” with 86.1% of respondents saying it is important.21 This
result is reasonable because the IRS often uses general doctrines such as business purpose and
economic substance to deny tax benefits for transactions that may be technically legal but contrary
to the intent of the tax law (see Scholes et al. 2014).
The second most important reason preventing firms from engaging in tax planning is
“potential harm to firm reputation,” with 69.5% of the firms responding that this is important or
very important.22 This evidence supports Bankman’s (2004) claim and the hypothesis and
evidence in Zimmerman (1983) that firms may bear reputational and political costs for being
labeled a “poor corporate citizen.” Related to reputation, the factor “risk of adverse media
attention,” received a relatively high importance rating with 57.6% of firms answering that this
factor is important or very important (see Figure 1 and Table 3, Panel A). Concern over media
coverage is consistent with statements made by companies about a ‘Wall Street Journal test’ – that
is, if the strategy would look bad on the front page of the Journal then the company should not do
it.23 Table 3, Panel A, also shows that among public firms, both “potential harm to reputation” and
21 For the judiciary to recognize a transaction or business choice as valid according to tax law, the action must be deemed to have a genuine business purpose (i.e., above and beyond the avoidance or reduction of tax) and economic substance (i.e., a meaningful change to the taxpayer’s economic position other than reducing income taxes). We note that after our survey period, the U.S. codified the economic substance doctrine. Related to our discussion of financial accounting incentives to tax plan below, interestingly, the codification i) mentions financial accounting benefits as a business purpose, but ii) prohibits financial accounting benefits that arise solely from federal income tax savings as providing a valid business purpose. Thus, it seems it would likely be much more difficult now to pitch tax planning strategies to increase reported earnings; now the tax plan must have a valid business purpose other than financial accounting benefits that arise solely from tax savings. 22 We report results for statistical differences across the rankings of the factors at the bottom of Table 3, Panel A. The tests generally indicate that the importance rank of the higher listed factor is significantly greater than that for all lower listed factors. 23 As stated publicly by a GE company representative, “At the same time, from a somewhat more defensive perspective, a key role of the tax department, a key part of the mission statement, is to manage risks, both legal and

15
“adverse media attention” is considered significantly more important (p<0.05) than at private
firms with 72.2% and 60% of public firms giving these factors a rating of important or very
important compared to 58.9% and 48% of private firms, respectively. This difference between
public and private firms is consistent with the additional scrutiny that public firms are under from
investors and other market participants. We note that the percent of firms concerned about media
attention is significantly lower (p<0.10) than the percent concerned about reputation generally,
likely because only a sub-set of firms are prominent enough to be mentioned in the media.
“Risk of detection and challenge by the IRS” is the third most important reason executives
give for not engaging in tax planning strategies, with 62.1% of the firms rating the factor as
important or very important. This result is related to prior work that finds that IRS scrutiny
discourages tax avoidance (Hoopes, Mescall, and Pittman 2012; Mills and Sansing 2000; Mills
1998, 1996). There is not a statistical difference between public and private firms for this factor.
The remaining factors deal with financial reporting incentives; we discuss these factors below
along with other related questions about financial accounting.
Table 3, Panel B presents the descriptive characteristics for firms based on their responses
to the survey question detailed in Table 3, Panel A along with univariate tests of differences in
these characteristics. We focus on the reputation factors in this section and discuss the financial
accounting factors below, generally not discussing other factors because they are not our primary
research interest in this paper.
Firms that responded that reputation and adverse media attention are important in their
decision to not engage in a tax planning strategy are larger on average (significantly so for the
adverse media attention factor) and have significantly higher Analyst Following than firms rating
reputational, whether it's… a "Wall Street Journal" test or simply wondering whether, if it were discussed publicly, would this strategy, whether legal or not, hurt the company's reputation” (Larsen et al. 2007).

16
these factors as unimportant, consistent with the former firms being more in the public eye and
under more scrutiny. The data also reveal that the firms that rate reputation and adverse media
attention as important are more likely to be in the retail industry – although the difference in the
likelihood is not statistically significant. Another characteristic that is statistically different
between the firms that rated the reputation related factors as important and those that did not is
R&D Intensity, although we offer no explanation for this result. We now turn to multivariate tests
of determinants of high reputation concerns when firms engage in a tax planning strategy.
Determinants of Reputation Concerns
In order to examine the determinants of rating reputation concerns as important, we
construct two indicator variables for firms indicating that “potential harm to firm reputation” and
“risk of adverse media attention” are important or very important reasons for not engaging in a tax
planning strategy. We then estimate separate probit regressions with these indicator variables as
the dependent variable and firm characteristics as the independent variables. Table 3, Panel C
presents the marginal effects from the regressions with the variable definitions in the Appendix
and all variables winsorized at the 1% and 99% level.24
Column (1) of Table 3, Panel C presents the regression results when the factor “potential
harm to firm reputation” is the dependent variable. We find that the marginal effects for
Log(Assets), ROA, and Retail Industry Indicator are positive and statistically significant at the
p<0.05 level or better (see Column (1)). The positive relation between retail industry membership
and reputation concerns suggests that firms with more consumer orientation are more worried 24 We cluster the standard errors in the regression by industry to deal with residual correlation in the standard errors. However, we do not include industry fixed effects because we are interested in the characteristics of the firms that are the underlying determinates of the reputation concerns and because we want to test the effect of being in the retail industry relative to other industries. In untabulated tests we estimate the regressions with industry fixed effects and find that our inferences are unaffected (i.e., the coefficients on our test variables are significant at the one-tail 10% level or better and have similar magnitudes as those reported in the paper). Note also that we only have one observation per firm in time so firm and time fixed effects cannot be included.
17
about reputation, for example, in the form of a consumer backlash, consistent with Hanlon and
Slemrod (2009). We also find that firms with larger magnitudes of abnormal accruals (|Abnormal
Accruals|) are marginally less concerned about potential harm to their reputation from tax
planning. This result is potentially consistent with the notion that firms that are not worried about
reputation are also not worried about engaging in aggressive financial accounting.
Column (2) presents the regression results when the factor “risk of adverse media
attention” is the dependent variable. Consistent with the discussion above, we find that large firms
and more profitable firms rate adverse media attention as a significantly more important reason not
to engage in tax planning strategies relative to small firms and less profitable firms. While the data
show that retail industry membership is positively related to the factor rating, the coefficient is not
statistically significant (estimated coefficient=0.10; one-tail p-value=0.154).
The Effect of Reputation Concerns on Measures of Tax Planning
We next correlate the survey responses with tax planning outcomes using standard
measures from prior literature. To the extent that reputation concerns limit tax planning activities,
we should observe less tax avoidance as measured by the common proxies that are observed by
external parties. However, to the extent the proxies used in the literature do not measure the effects
of tax planning strategies precisely and/or the effect of reputation on turning down marketed tax
planning strategies is not correlated with other more generic tax planning, we may not observe a
relation in the archival data. We employ regression analysis to examine the effect of ‘harm to firm
reputation’ (i.e., the rating from our survey data) on firms’ tax planning behavior as measured by
their 3-Yr Cash ETRs, P(Tax Shelter), DTAX (from Frank, Lynch, and Rego 2009), and the firm’s
GAAP ETR.
18
The results in Table 3, Panel D are consistent with firms worried about reputation having a
higher cash effective tax rate and a lower likelihood of engaging in a tax shelter as reflected by the
significant coefficients for ‘Rank “Harm to Reputation” as Important’ in Columns (1), (4), and
(5)). Because Lisowsky (2010) computes the predicted value of the probability of a tax shelter
(P(Tax Shelter)) with a model that includes the following variables that we use as control
variables, ROA, R&D Intensity, Leverage, Foreign Income, NOL Indicator, and Log(Assets), we
estimate our regression both with and without these control variables. We find that our main test
variable, the ranking of ‘harm to reputation,’ is statistically significant in the predicted direction in
both specifications. The data in Columns (2) and (3) of Table 3 Panel D show that the relation of
the reputation factor rating to the DTAX measure and GAAP ETR is insignificant.25 Overall, we
interpret the evidence as consistent with firms more concerned about reputation being less likely to
engage in tax shelters and somewhat more likely to report a higher cash effective tax rate. Table 3,
Panel D also reports the incremental R-squared obtained by adding the reputation factor in the
above regressions. We find that reputation concerns increase the explanatory power of the 3-Yr
Cash ETR model by 9.4% (i.e., from 8.5% to 9.3%) and the explanatory power of the P(Tax
Shelter) model by 8.1% (i.e., from 32.7% to 35.3%).26
In summary, our evidence is consistent with reputation concerns being important for
corporate decision making with respect to tax planning. Reputational concerns are significantly
25 We also estimate the regressions using the rating for the factor ‘risk of adverse media attention’ from the survey as the independent test variable. In these untabulated regressions, the rating reaches statistical significance only when P(Tax Shelter) is the dependent variable (coef. = -0.023; t-stat = -1.41) – i.e., when firms fear adverse media attention, they are less likely to engage in a tax shelter. 26 Our overall explanatory power is marginally lower than prior research, in part because we do not include year or industry fixed effects. For example, Armstrong et al. (2012) obtain R-squareds around 9.4%, Rego and Wilson (2012) obtain R-squareds around 14.9%, and Chen et al. (2010) obtain R-squareds around 12.5% in their regression of cash ETR after including year and industry fixed effects. The R-squared in our regression increases to 13.5% when we include industry fixed effects. We are unable to include year fixed effects because we have just one observation per firm.
19
more important for firms under capital market pressure in terms of being publicly traded, larger,
and having more analyst following and with a greater chance of consumer backlash, such as, in the
retail industry. Further, tax executives who say reputation concerns have prevented them from
engaging in a tax planning strategy do have a significantly lower likelihood of engaging in a tax
shelter as measured by Lisowsky’s tax shelter score and some evidence of a higher long-run cash
ETR.
Financial Accounting Concerns
Financial reporting incentives often conflict with incentives to lower taxes because
reductions in taxable income frequently result in lower financial accounting earnings (Scholes,
Wilson, and Wolfson 1992; Shackelford and Shevlin 2001). Thus, a stream of literature has
focused on what is known as the book-tax tradeoff documenting that companies often choose
accounting methods and or forgo taking actions that would lower taxes because they do not want
to report lower accounting earnings (or that the companies take actions to increase accounting
earnings at the cost of increased taxes). For example, early studies on whether to adopt or abandon
LIFO (Dhaliwal et al. 1994) document that companies with financial reporting incentives (e.g.,
risk of violating debt covenants) are more likely to forgo the tax benefits of the LIFO method.
Matsunaga, Shevlin, and Shores (1992) similarly show that companies will forgo the tax benefits
of disqualifying incentive stock options to avoid the associated financial statement costs. In
addition, Erickson et al. (2004) show that firms that fraudulently overstate financial accounting
earnings pay cash taxes on those overstated earnings at a median rate of eight cents on the dollar to
increase “paper” earnings.27 Finally, although not in the line of book-tax tradeoff literature,
27 Studies that demonstrate that accounting earnings are affected when tax planning is done include Maydew (1997), who provides evidence that firms shifted taxable income to maximize the tax value of net operating losses in the face of tax rate changes by testing the shifting of financial accounting income, and Guenther (1994) who examines
20
Graham et al. (2005) and Bens et al. (2003) both provide evidence consistent with managers being
willing to spend cash to increase accounting earnings and earnings per share.
Indeed, recent research takes this idea further, conjecturing that some tax planning is
engaged in, and incentives are provided specifically with the objective of, affecting financial
reporting. For example, Robinson et al. (2010) report that some firms view their tax department as
a profit center (i.e., “a contributor to the bottom line”). They state that “…a profit center
performance model is effective in motivating tax departments to reduce financial ETRs, but
ineffective in motivating tax departments to reduce cash ETRs.” In addition, Armstrong et al.
(2012) examine the association between tax executive incentives (via compensation packages) and
corporate tax planning. They find evidence that tax director compensation is associated with lower
GAAP ETRs but has no relation with Cash ETR. They conclude that tax executives are
incentivized to focus on the GAAP ETR rather than narrowly focus on cash taxes paid.28
Why the focus on financial accounting tax rates? Graham et al. (2011, 141-142) suggest
several reasons why top managers are concerned about GAAP ETR and reported earnings. First, a
lower GAAP ETR increases reported after-tax earnings and earnings have been shown to be
positively associated with firms’ stock returns and market value. Some managers likely believe
stock prices are inefficient in the sense that investors fixate on reported earnings without
adjustment thus motivating these firms’ managers to focus on financial statement effects of their earnings management around the Tax Reform Act of 1986. See Shackelford and Shevlin (2001) for a complete review of the literature. In addition, for a review of the literature on earnings management and some of the determinants of earnings management, e.g., debt or compensation contracts, avoiding reporting a loss, meeting or beating analysts’ forecasts, maintaining credit ratings, etc. see Dechow et al. (2010). 28 Desai and Dharmapala (2009a) discuss Enron in this context stating that “In summarizing various transactions, the JCT concluded that Enron’s management set high financial accounting goals and realized quickly that tax–motivated transactions could generate sizable financial accounting benefits. Accordingly, Enron looked to its tax department to devise transactions that increased financial accounting income. In effect, the tax department was converted into an Enron business unit, complete with annual revenue targets. The tax department, in consultation with outside experts, then designed transactions to meet or approximate the technical requirements of tax provisions with the primary purpose of manufacturing financial statement income.” (They also use Dynegy as an example as well. See their paper for details as well as Desai and Dharmapala (2006 and 2008) for further discussion.)
21
tax plans. Second, GAAP based financial accounting numbers are often used in contracts to
determine covenant thresholds in debt contracts and bonuses paid to managers. Finally, Graham et
al. (2011) highlight that the GAAP ETR is an important benchmark that is compared across firms.
While there is prior research on the topic of the book-tax tradeoff, and the evidence is
generally consistent that financial accounting outcomes are important in tax reporting decisions,
the validity of the evidence is often debated. For example, in many studies the researcher must
estimate what the companies’ results would have looked like had an alternative action been taken
(see Erickson et al. (2004) and Shackelford and Shevlin (2001) for discussions) and in some
studies the sample size is small (Erickson et al. 2004) casting doubt on the conclusion that firms
will sacrifice cash taxes to increase accounting earnings. Thus, to provide direct evidence on the
relative importance of accounting earnings and cash taxes (i.e., the importance of accounting
effects when firms tax plan), we ask tax executives several questions on the topic.29
We first examine the financial accounting related responses to the question discussed in the
previous section, “Has your company ever considered but decided not to implement a tax planning
strategy proposed and/or marketed by an accounting, law, investment, or tax consulting firm?”
The data show (Figure 1 and Table 3, Panel A) that the factor, “risk of having to later restate
financial statements,” was rated by 54.2% of the firms (58% of public firms) as very important or
important. In addition, the factors “negative pre-tax impact on financial statement income” and
29 The exact methods managers use to reduce the GAAP ETRs are not completely known. We do not ask about specific transactions in our survey. At a basic level, we conjecture that the manager will prioritize tax strategies that generate a permanent book-tax difference (or tax credit) over strategies that generate a temporary book-tax difference where possible since the former not only reduces taxable income but also lowers the GAAP ETR increasing after-tax accounting earnings. Managers may also engage in transactions (real or accrual) that primarily serve to lower the GAAP ETR. For example, if they re-structure their foreign operations or indeed even start foreign operations in order to defer the U.S. income tax, this will allow them the flexibility to choose to designate the foreign earnings as permanently reinvested. In such a case, the company does not have to accrue the future U.S. taxes that would be due upon repatriation, increasing after-tax accounting earnings (see Shackelford, Slemrod, and Sallee (2011) and Graham, Hanlon, and Shevlin (2011) for additional details).

22
“tax benefit could not be recorded for GAAP” garner ratings of 43.8% and 39.2%, respectively
(46.2% and 42.8% for public firms, respectively). Thus, a large minority of firms – roughly 40 to
45% – are less likely to tax plan if there is a risk that financial statements will have to be restated
as a result or if they cannot record the tax savings for accounting purposes.30 The test statistics in
Table 3 reveal that public firms rate financial accounting concerns as significantly more important
than do private firms, as one would expect.
Next, we examine responses to the question “Which metric is more important to top
management in your company?” The possible answers to the question as listed in the survey
instrument are 1) GAAP ETR, 2) cash taxes paid, or 3) both are equally important. Figure 2 and
Table 4, Panel A present these data. Of the 513 firms that responded to this question, 40% of the
respondents indicate that the GAAP ETR is the most important metric, a number significantly
larger than the 23.7% of firms that state that the cash taxes paid is the most important metric.
36.4% report that the two metrics are equally important. Thus, many of the firms rate the GAAP
ETR as more important, or at least equally important, as cash taxes to top management of the
company. The data also reveal that, consistent with expectations, management at public companies
is significantly more likely to place a higher value on the GAAP ETR, and managers at private
companies are significantly more likely to place a higher value on cash taxes paid. Specifically,
47.1% of public companies rate the GAAP ETR as the more important metric compared to only
15.5% of them indicating that cash taxes is the more important metric. In sharp contrast, 52.3% of
30 We also included a space for respondents to fill in labeled ‘other.’ Forty-four firms listed a response in this ‘other’ space. Of these responses, 16 mention that the fees, administration, and personnel costs were too high; six respondents answered that the strategy was not in line or conflicted with operational goals; along the lines of reputation, two answered that their company wanted to be a ‘good corporate citizen,’ one answered they were worried about their image in front of employees, and one said ‘we didn’t want to draw attention to ourselves’; two said the transaction had low merit; one said they tried to get approval from a private letter ruling and failed; one said it would have hurt relations with the government; and one said the result of the transaction would violate debt covenants. The complete text of these and the remaining responses are available upon request.
23
the private companies rate cash taxes paid as more important compared to only 14.7% of private
companies rating the GAAP ETR as most important (the percentages are statistically different).
Overall, our finding that top management at 76.4% of our sample firms (84.5% of public firms)
value the GAAP ETR metric at least as much or more than cash taxes provides direct evidence on
the importance of accounting earnings and GAAP ETRs specifically.
We also ask questions to directly address the hypotheses put forth in Robinson et al.
(2010), Armstrong et al. (2012) and Desai and Dharmapala (2006, 2009a, b). Each of these studies
suggests that tax avoidance strategies are engaged in with a primary motivation to improve
accounting performance metrics. We begin by asking managers: “how often are tax planning
strategies proposed [by an accounting, law, investment, or tax consulting firm] as a way to
increase financial accounting earnings?” Table 4, Panel B indicates that 5.2% of our respondents
answered that tax planning strategies are “always” pitched as a way to increase earnings, 26.8%
said it was “often” the case, 50.7% responded that this was “sometimes” the marketing strategy,
and 17.4% said that this “never” was part of the pitch. Partitioning the firms into public and
private indicates that the “increase financial accounting earnings” pitch was significantly more
often made to public firms (34.6% of public firms responded it was “always” or “often” the pitch
while for 22.4% of private firms this was the case).
To further examine the importance of financial accounting effects when considering a tax
planning strategy, we examine the responses to the question “when evaluating a tax planning
strategy that saves cash taxes, how important is it that the tax planning strategy…1) does not
reduce EPS, or 2) leads to reporting a higher EPS.” The results from these questions are reported
in Figure 3 and Table 4 Panel C. We find that 60.8% of surveyed companies say that it is
important (rating of 3 or 4) that a tax strategy does not reduce EPS, and 49.5% respond that it is
important that the strategy actually leads to higher EPS. The right most columns of Panel C (and
24
Figure 3) present the data for public and private firms separately. Public firms, not surprisingly,
attach significantly higher importance ratings to both EPS questions relative to private firms. The
stated importance of financial accounting factors on a corporate decision contributes to the recent
literature emphasizing the importance of the interaction of financial statement effects and tax
planning (e.g., Robinson et al. 2010; Shackelford et al. 2011).
Determinants and Tax Planning Consequences of Financial Accounting Concerns
Table 3 Panel B (Columns (5), (6), and (7)) and Table 4 Panel D present descriptive
statistics and univariate tests for the sample firms based on how they responded to questions
related to the importance of financial accounting effects. Table 3, Panel B reveals that firms that
rated the risk of a negative financial accounting impact as important (Column (6)) have
significantly higher Analyst Following and Institutional Ownership than firms not rating the risk
of a negative financial accounting outcome as important. This result is consistent with increased
capital market pressure leading to greater weights put on financial accounting. Otherwise, beyond
the public/private split in Table 3 Panel A and these two characteristics, the groups of firms in
Table 3, Panel B, Columns (5) – (7) look similar in their characteristics whether they answered
that financial accounting was important or not important (i.e., these other characteristics are not
significantly different across the two groups). We note that Table 3, Panel B includes only public
firms, thus, the most important driver of capital market pressure is held constant.31
Table 4 Panel D presents descriptive data for the remaining questions about the importance
of financial accounting effects. We first examine the differences in firm characteristics based on
their stated relative importance of GAAP ETR and cash taxes paid. Note that we can only present
the descriptive statistics for publicly traded firms because these data are obtained from Compustat
and only 15% (i.e., 61 firms) of the public firms responded that top management at their company 31 The 3-Yr Cash ETRs are statistically different – we investigate the consequences of financial accounting concerns below.
25
values cash taxes paid the most. Thus, in some cases inferences are based on fairly small samples
(e.g., due to data constraints the three year cash ETR is only available for 31 of the 61 firms that
said cash taxes paid are important).
Beyond being publicly traded, Firm Size, Analyst Following, and Institutional Ownership
are also significantly higher for the firms that answered that GAAP ETR is more important than
cash taxes paid. Thus, we conclude that the primary determinant of rating the GAAP ETR as more
important than cash taxes paid is being under capital market scrutiny. The data also reveal that
firms that rate GAAP ETR as more important than cash taxes paid have a significantly higher
ROA, less Leverage, and fewer US NOLs. That these firms have lower leverage is not surprising
because debt does not generally affect GAAP ETRs. More specifically, because the interest on
debt is generally deductible/expensed for both tax and book purposes, it affects both the numerator
and denominator of GAAP ETR creating no additional incentive to lever up. In terms of the other
characteristics in Panel D, there do not appear to be consistently significant differences between
the sub-samples of firms based on whether they answered financial accounting concerns are
important or not important.
Panel E of Table 4 presents probit regression results of determinants of rating GAAP ETR
as more important than cash taxes (dependent variable set to 1 if the company rated GAAP ETR as
most important to top management). The data are consistent with higher ROA, lower Leverage,
lower Foreign Income, lower R&D Intensity, and higher Institutional Ownership being
significantly associated with rating the GAAP ETR as important (note again all firms are publicly
traded in this test). The association of higher ROA and higher Institutional Ownership are
indicative of greater capital market pressures. Analyst Following is positive but insignificant (the
variable is correlated with size and institutional ownership, however). The Leverage result is
consistent with the univariate result described above and likely due to the fact that leverage
generally provides a debt shield and saves cash taxes but does not generally affect a GAAP ETR

26
to a great extent because the interest is expensed from financial accounting income as well as
deducted from taxable income. Thus, increasing leverage would be valuable for tax purposes to
firms that rate cash taxes as more important but as not valuable to firms that rate the GAAP ETR
as more important.32
We also examine consequences of rating a certain metric as important via univariate tests
of data in Table 4 Panel D. We examine four common tax planning outcome variables commonly
used in the literature: 3-Yr Cash ETR, P(Tax Shelter), DTAX, and the GAAP ETR (same as we did
in the reputation tests). One might expect that firms responding that the top management cares
about the GAAP ETR have lower GAAP ETRs as a result of their active efforts to reduce it.
However, there are a number of reasons why we may not observe such an effect in the data. With
respect to the relation between financial reporting incentives and tax planning proxies, there is a
potential endogeneity problem. For example, firms that have a high GAAP ETR may respond that
top management values the GAAP ETR because they want to lower the rate. In other words, top
management cares about the GAAP ETR because their company has not been able to lower it to
the target level. Another potential problem is that firms may want a low GAAP ETR but this is not
easily achieved (Hanlon and Heitzman 2010).
Univariate tests of the tax planning variables are in Table 4 Panel D. The data reveal that
firms that rate the GAAP ETR as most important have the same GAAP ETR but a significantly
lower 3-Yr Cash ETR relative to firms where top management values cash taxes as the most
important metric. To the extent one expects a high rating of the GAAP ETR to manifest in lower
32 Note that many studies in the book-tax tradeoff literature use leverage as a proxy for likelihood of covenant violations (under the contracting view of accounting) and find that firms with more leverage are often more willing to trade cash taxes for higher accounting earnings to avoid covenant violations. Our results are not necessarily inconsistent with this prior literature. The prior studies examined the book-tax tradeoff for pre-tax accounting earnings effects (LIFO vs. FIFO, disqualifying stock options and paying additional cash compensation). We asked about the GAAP ETR not pre-tax accounting earnings. Most income based covenants for debt contracts are based on earnings before taxes and thus the GAAP ETR is not as important for debt contracting purposes (see Hanlon and Heitzman (2010) for a discussion).
27
GAAP ETRs and a high rating of cash taxes paid to manifest in lower 3-Yr Cash ETRs, these
results are counter intuitive.33 To examine these data further, we first compare the medians for the
sub-samples to mitigate concerns of outliers in our potentially small sub-samples. We find
different inferences for the 3-Yr Cash ETR when we look at the medians – the median 3-Yr Cash
ETR is significantly lower for firms indicating that cash taxes paid is more important than GAAP
ETR, consistent with expectations (untabulated). Specifically, the median 3-Yr Cash ETR is 26.1%
(19.5%) for firms rating GAAP ETR (cash taxes paid) as the more important metric. This
difference is statistically significant at the 10% level (one-tail p-value = 0.085). Thus, the medians
in our data reveal that firms that say top management cares more about cash taxes paid have lower
median cash effective tax rates.
We also examine forward looking tax planning metrics in the event that past ETRs do not
reflect current preferences (untabulated). We find that the mean (median) GAAP ETR in the year
following the survey is 28.6% (32.6%) for firms that rate the GAAP ETR as important and 34.5%
(35.1%) for firms that rate cash taxes paid as important. The forward looking 3-Yr Cash ETRs for
these groups are 39.4% (30.9%) and 33.2% (28.2%), respectively. However, the differences in
cash and GAAP ETRs are not statically significant across the groups at conventional levels of
significance. In summary, using forward-looking measures, the data are consistent with
expectations (albeit insignificantly) – i.e., companies that say the GAAP ETR is important have a
lower GAAP ETR relative to firms that say the cash taxes are more important and companies that
say the cash tax paid is important have a lower 3-Yr Cash ETR relative to firms that say the
GAAP ETR is more important.
33 We note, however, that we asked about cash taxes paid and not the Cash ETR and thus the higher importance rating for cash taxes paid may not necessarily manifest in a lower Cash ETR since they are not exactly the same measure. We also estimate regressions of the tax metrics (separately) on the rating of the importance of the GAAP ETR and Cash ETR and find similarly insignificant results. In the interest of space, we do not tabulate these results.
28
V. CONCLUSIONS
Our paper uses a survey to ask nearly 600 tax executives about their firms’ experiences
with respect to tax planning and avoidance. We focus on questions that are difficult to address
using archival data. The executives indicate that reputation is very important, with 70% of firms
rating it as important or very important in their decision to avoid a tax planning strategy and 58%
of firms rating the risk of adverse media attention as important or very important. The use of
survey data for such a research question is critical because the archival data employed in most of
the extant literature contains only firms that engaged in a strategy and were subsequently caught.
If firms that are worried about adverse reputation effects do not engage in tax planning, these
firms are not in the archival data and this could affect inferences. We also find that financial
accounting concerns are important, with 61% of firms (71% of public firms) stating that it is
important that a tax planning strategy not harm reported earnings per share. In addition, 76% of
firms rate the GAAP ETR as being at least as important as cash taxes paid.
Our study contributes to the literature on determinants of tax avoidance by providing
evidence consistent with reputation effects being an important factor in tax planning decisions.
Bankman (2004) speculates that reputation effects are important and points to some state tax
authorities’ use of lists of shame of noncompliant taxpayers (e.g.,
http://www.revenue.wi.gov/html/delqlist.html). However, the role of reputation has been debated
in the literature and has resulted in conflicting evidence (see Hanlon and Slemrod (2009) and
Gallemore et al. (2013) for discussions). Our survey enables us to ask tax directors directly
whether reputation matters and to conduct cross-sectional tests regarding the type of company for
which reputation concerns are most important, which we find to be public firms, retail firms,
larger firms, and more profitable firms.

29
Our study also contributes to the literature on the book-tax tradeoff and the importance of
financial accounting earnings versus cash flows. While there is a long line of literature on the
book-tax tradeoff, there are many concerns about ‘as if’ computations by researchers and small
sample sizes. Our study triangulates these prior studies and uses responses directly from company
representatives to evaluate their prioritization of cash taxes paid versus the accounting measure of
income tax expense.
30
REFERENCES Altman, E., 1968. Financial ratios, discriminant analysis and the prediction of corporate
bankruptcy. Journal of Finance 23,589–609. Altman, E., 2000. Predicting financial distress of companies: Revisiting the Z-score and Zeta
models, Working Paper, Stern School of Business, New York University Armstrong, C., J Blouin, and D. Larcker. 2012. The incentives for tax planning. Journal of
Accounting and Economics 53: 391-411. Austin, C., and R. Wilson. 2013. Are reputational costs a determinant of tax avoidance? Working
paper, University of Iowa. Bankman, J., 2004. An academic's view of the tax shelter battle. In: Aaron, H.J., Slemrod, J.
(Eds.), The Crisis in Tax Administration. Brookings Institution,Washington, D.C., pp. 9–37.
Bens, D., V. Nagar, D. Skinner and F. Wong. 2003. Employee stock options, EPS dilution, and
stock repurchases. Journal of Accounting and Economics, 36: 51-90. Brav, A., J. Graham, C. Harvey, and R. Michaely. 2005. Payout policy in the 21st century.
Journal of Financial Economics 77: 483-527. Chen, S., X. Chen, Q. Cheng, and T. Shevlin. 2010. Are family firms more tax aggressive than
non-family firms? Journal of Financial Economics 95 (1): 41–51. Chyz, J., 2012. Personally tax aggressive executives and corporate tax sheltering. Working
paper. University of Tennessee. Dechow, P., W. Ge and C. Schrand, 2010. Understanding earnings quality: A review of the
proxies, their determinants and their consequences. Journal of Accounting and Economics 50, 344-401.
Desai, M., and D. Dharmapala. 2006. Corporate tax avoidance and high-powered incentives.
Journal of Financial Economics 79: 145-179. Desai, M. and D. Dharmapala. 2008. Taxation and Corporate Governance: An Economic
Approach, in Wolfgang Schöen (ed.), Tax and Corporate Governance, Springer, 13-30. Desai M. A., and D. Dharmapala, 2009a. Earnings management, corporate tax shelters, and
book–tax alignment. National Tax Journal, 169-186. Desai M. A., and D. Dharmapala, 2009b. Corporate tax avoidance and firm value. Review of
Economics and Statistics 91(3), 537-546.

31
Dhaliwal, D., Frankel, M., Trezevant, R., 1994. The taxable and book income motivations for a LIFO layer liquidation. Journal of Accounting Research 32 (2), 278–289.
Dyreng, S., M. Hanlon, and E. Maydew. 2008. Long-run corporate tax avoidance. The
Accounting Review 83: 61-82. Engle, E., M. Erickson, and E. Maydew. 1999. Debt-equity hybrid securities. Journal of
Accounting Research 37: 249-274. Erickson, M., Hanlon, M., Maydew, E., 2004. How much will firms pay for earnings that do not
exist? Evidence of taxes paid on allegedly fraudulent earnings. The Accounting Review 79 (2), 387-408.
Ernst & Young, 2011. 2011-2012 Tax risk and controversy survey: A new era of global risk and
uncertainty. Frank, M. L., Lynch, and S. Rego, 2009. Tax reporting aggressiveness and its relation to
aggressive financial reporting. The Accounting Review 84: 467-496. Gallemore, J., E. L. Maydew, and J. R. Thornock, 2013. The reputational costs of tax avoidance
and the under-sheltering puzzle. Contemporary Accounting Research, forthcoming. Gleason, C., and L. Mills. 2002. Materiality and contingent tax liability reporting. The
Accounting Review 77(2): 317–342. Graham, J. and C. Harvey. 2001. The theory and practice of corporate finance: evidence from the
field. Journal of Financial Economics 60: 187-243. Graham, J.R., C. Harvey, and S. Rajgopal. 2005. The economic implications of corporate
financial reporting. Journal of Accounting and Economics 40: 3-73. Graham, J., M. Hanlon, and T. Shevlin. 2010. Barriers to mobility: the lockout effect of U.S.
taxation of worldwide corporate profits.” National Tax Journal 63: 1111-1144. Graham, J. M. Hanlon, and T Shevlin. 2011. Real effects of accounting rules: evidence from
multinational firms’ investment location and profit repatriation decisions. Journal of Accounting Research 49: 137-185.
Guenther, D., 1994. Earnings management in response to corporate tax rate changes: evidence
from the 1986 Tax Reform Act. The Accounting Review 69 (1), 230–243. Hanlon, M., 2012. Testimony before the U.S. House of Representatives Committee on Ways and
Means, February 8, 2012. Hanlon, M. and S. Heitzman. 2010. A review of tax research. Journal of Accounting and
Economics 50: 127-178.
32
Hanlon, M., L. Mills, and J. Slemrod. 2007. An empirical examination of corporate tax
noncompliance. In: Auerbach, A., Hines, J., Slemrod, J., (Eds.) Taxing Corporate Income in the 21st Century. Cambridge University Press, New York.
Hanlon, M. and J. Slemrod. 2009. What does tax aggressiveness signal? Evidence from stock
price reactions to news about tax shelter involvement. Journal of Public Economics 93 (February): 126-141.
Hoopes, J.L., D. Mescall and J. Pittman. 2012. Do IRS audits deter corporate tax avoidance? The
Accounting Review 87, 1603-1639. Kocieniewski, D., G.E.’s strategies let it avoid taxes altogether. The New York Times, March 24,
2011. Larsen, R.G., R.D. Beran, R. D’Avino, W.D. Hawkins. 2007. Session 5: developing a global
corporate tax risk strategy. Taxes–The Tax Magazine (June): 83-94. Lisowsky, P. 2010. Seeking shelter: Empirically modeling tax shelters using financial statement
information. The Accounting Review 85 (5): 1693–1720. Matsunaga, S., Shevlin, T., Shores, D., 1992. Disqualifying dispositions of incentive stock
options: tax benefits versus financial reporting costs. Journal of Accounting Research 30 (Suppl.), 37–76.
Maydew, E., 1997. Tax-induced earnings management by firms with net operating losses.
Journal of Accounting Research 35 (1), 83–96. McGill, G. and E. Outslay, 2004. Lost in Translation: Detecting Tax Shelter Activity in Financial
Statements, National Tax Journal 57(3), 739-756. McIntyre, R., M. Gardner, R. Wilkins, and R. Phillips. 2011. Corporate Taxpayers & Corporate
Tax Dodgers 2008-10. A Joint Project of Citizens for Tax Justice & the Institute on Taxation and Economic Policy.
Mills, L., S. Nutter, and C. Schwab. 2012. The effect of political sensitivity and bargaining
power on taxes: evidence from Federal contractors. The Accounting Review, forthcoming. Mills, L., and R. Sansing. 2000. Strategic tax and financial reporting decisions: Theory and
evidence. Contemporary Accounting Research 17 (Spring): 85–106. Mills, L., 1998. Book-tax differences and Internal Revenue Service adjustments. Journal of
Accounting Research, 36 (2): pp. 343–356. Mills, L. 1996. Corporate tax compliance and financial reporting. National Tax Journal 49 (3):
421–435.

33
Murray, Alan. 2002. “Inflated Profits in Corporate Books is Half the Story.” The Wall Street
Journal (July 2): A4.
Rego, S., and R. Wilson. 2008. Executive compensation, tax reporting aggressiveness, and future firm performance. Working paper.
Rego, S., and R. Wilson. 2012. Equity Risk Incentives and Corporate Tax Aggressiveness.
Journal of Accounting Research 50, 775–810. Robinson, J., Sikes, S., Weaver, C. 2010. Performance measurement of corporate tax
departments. The Accounting Review 85: 1035-1064. Scholes, M., P. Wilson, and M. Wolfson. 1992. Firms responses to anticipated reductions in tax
rates: The Tax Reform Act of 1986. Journal of Accounting Research 30: 161-187. Scholes, M., M. Wolfson, M. Erickson, M. Hanlon, E. Maydew, and T. Shevlin. 2014. Taxes and
Business Strategy: A Planning Approach. Fifth Edition. Pearson, Upper Saddle River, New Jersey 07458.
Shackelford, D., and T. Shevlin. 2001. Empirical research in accounting. Journal of Accounting
and Economics 31: 321-387. Shackelford, D., J. Slemrod and J. Sallee. 2011. A unifying model of how the tax system and
accounting rules affect corporate behavior. Working paper, University of Michigan. Slemrod, J. and M. Blumenthal. 1996. The income tax compliance cost of big business. Public
Finance Quarterly (October) 24: 411-438. Slemrod, J. and V. Venkatesh. 2002. The income tax compliance cost of large and midsize
businesses. A Report to the IRS LMSB Division. Trahan, E.A. and L.J. Gitman. 1995. Bridging the theory-practice gap in corporate finance: a
survey of chief financial officers. Quarterly Review of Economics and Finance 35 (Spring): 73-87.
Zimmerman, J. 1983.Taxes and firm size. Journal of Accounting and Economics 5, 119–149.
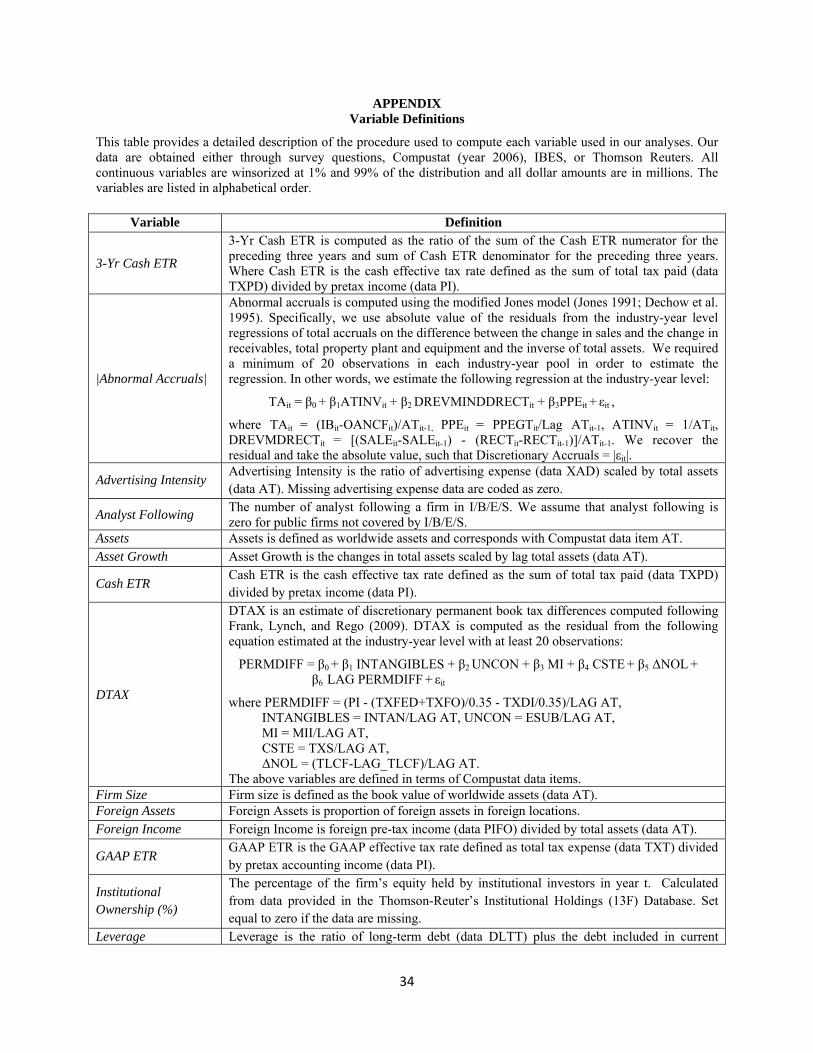
34
APPENDIX Variable Definitions
This table provides a detailed description of the procedure used to compute each variable used in our analyses. Our data are obtained either through survey questions, Compustat (year 2006), IBES, or Thomson Reuters. All continuous variables are winsorized at 1% and 99% of the distribution and all dollar amounts are in millions. The variables are listed in alphabetical order.
Variable Definition
3-Yr Cash ETR
3-Yr Cash ETR is computed as the ratio of the sum of the Cash ETR numerator for the preceding three years and sum of Cash ETR denominator for the preceding three years. Where Cash ETR is the cash effective tax rate defined as the sum of total tax paid (data TXPD) divided by pretax income (data PI).
|Abnormal Accruals|
Abnormal accruals is computed using the modified Jones model (Jones 1991; Dechow et al. 1995). Specifically, we use absolute value of the residuals from the industry-year level regressions of total accruals on the difference between the change in sales and the change in receivables, total property plant and equipment and the inverse of total assets. We required a minimum of 20 observations in each industry-year pool in order to estimate the regression. In other words, we estimate the following regression at the industry-year level:
TAit = β0 + β1ATINVit + β2 DREVMINDDRECTit + β3PPEit + εit ,
where TAit = (IBit-OANCFit)/ATit-1, PPEit = PPEGTit/Lag ATit-1, ATINVit = 1/ATit, DREVMDRECTit = [(SALEit-SALEit-1) - (RECTit-RECTit-1)]/ATit-1. We recover the residual and take the absolute value, such that Discretionary Accruals = |εit|.
Advertising Intensity Advertising Intensity is the ratio of advertising expense (data XAD) scaled by total assets (data AT). Missing advertising expense data are coded as zero.
Analyst Following The number of analyst following a firm in I/B/E/S. We assume that analyst following is zero for public firms not covered by I/B/E/S.
Assets Assets is defined as worldwide assets and corresponds with Compustat data item AT. Asset Growth Asset Growth is the changes in total assets scaled by lag total assets (data AT).
Cash ETR Cash ETR is the cash effective tax rate defined as the sum of total tax paid (data TXPD) divided by pretax income (data PI).
DTAX
DTAX is an estimate of discretionary permanent book tax differences computed following Frank, Lynch, and Rego (2009). DTAX is computed as the residual from the following equation estimated at the industry-year level with at least 20 observations:
PERMDIFF = β0 + β1 INTANGIBLES + β2 UNCON + β3 MI + β4 CSTE + β5 ΔNOL + β6 LAG PERMDIFF + εit
where PERMDIFF = (PI - (TXFED+TXFO)/0.35 - TXDI/0.35)/LAG AT, INTANGIBLES = INTAN/LAG AT, UNCON = ESUB/LAG AT, MI = MII/LAG AT, CSTE = TXS/LAG AT, ΔNOL = (TLCF-LAG_TLCF)/LAG AT. The above variables are defined in terms of Compustat data items.
Firm Size Firm size is defined as the book value of worldwide assets (data AT). Foreign Assets Foreign Assets is proportion of foreign assets in foreign locations. Foreign Income Foreign Income is foreign pre-tax income (data PIFO) divided by total assets (data AT).
GAAP ETR GAAP ETR is the GAAP effective tax rate defined as total tax expense (data TXT) divided by pretax accounting income (data PI).
Institutional Ownership (%)
The percentage of the firm’s equity held by institutional investors in year t. Calculated from data provided in the Thomson-Reuter’s Institutional Holdings (13F) Database. Set equal to zero if the data are missing.
Leverage Leverage is the ratio of long-term debt (data DLTT) plus the debt included in current

35
liabilities (data DLC) to total assets (data AT). MB MB is the market-to-book ratio (MVE/data CEQ).
MVE MVE is the market value of equity (data PRCC_F multiplied by data CSHO). Sales are total sales (data SALE) of the firm.
PPE PPE is defined as the book value of gross property, plant and equipment scaled by total assets (data PPEGT / AT).
P(Tax Shelter) The likelihood that a firm is participating in a tax shelter in a given year computed using the methodology in Lisowsky (2010). We obtain these data from Pete Lisowsky.
Public Public is an indicator variable that takes on the value of one for publicly traded firms.
R&D Intensity R&D Intensity is the ratio of research and development expense (data XRD) scaled by total assets (data AT). Missing R&D data are coded as zero.
Retail Industry An indicator variable that takes on the value of one if the firm is the retail industry (based on two digit SIC codes between 52 and 59) and zero otherwise.
ROA ROA is return-on-assets defined as net income (data NI) divided by total assets (data AT). Sales Sales is defined as worldwide net sales and corresponds to Compustat data item SALE. Sales Growth Sales Growth is the changes in sales scaled by lag sales (data SALE).
US NOL US NOL is an indicator variable that equals one if the firm has a US net operating loss carryforward (from survey responses).
Altman’s Z-Score Z Score is the bankruptcy score from Altman (1968 and 2000). In terms of Compustat data items it equals: 1.2 × [ACT - LCT]/AT + 1.4 × RE/AT + 3.3 × EBIT/AT + 0.6 [PRCC_F × CSHO]/LT + 0.999 × SALE/AT.
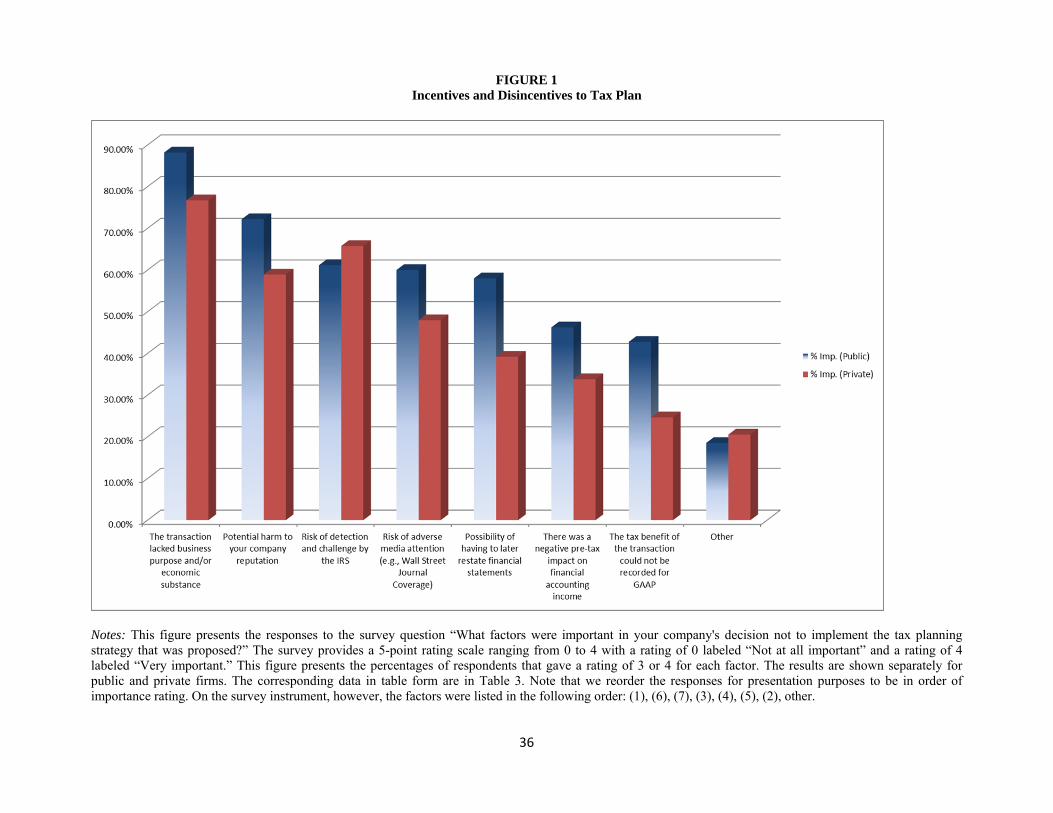
36
FIGURE 1 Incentives and Disincentives to Tax Plan
Notes: This figure presents the responses to the survey question “What factors were important in your company's decision not to implement the tax planning strategy that was proposed?” The survey provides a 5-point rating scale ranging from 0 to 4 with a rating of 0 labeled “Not at all important” and a rating of 4 labeled “Very important.” This figure presents the percentages of respondents that gave a rating of 3 or 4 for each factor. The results are shown separately for public and private firms. The corresponding data in table form are in Table 3. Note that we reorder the responses for presentation purposes to be in order of importance rating. On the survey instrument, however, the factors were listed in the following order: (1), (6), (7), (3), (4), (5), (2), other.

37
FIGURE 2 Importance of Financial Accounting vs. Tax Minimization Incentives to Tax Plan
Notes: This figure presents the responses to the survey question “Which metric is more important to the top management at your company?” The available answers included (1) GAAP ETR, (2) Cash Taxes Paid and (3) Both are equally important. This figure presents the percentages of respondents that answered GAAP ETR or Cash Taxes Paid. The corresponding data in table form are in Table 4, Panel A.

38
FIGURE 3 Financial Accounting Incentives and Disincentives to Tax Plan
Notes: This figure presents the responses to the survey question “At your company, when evaluating a tax planning strategy that saves cash taxes, how important is it that the tax planning strategy…(1) …does not reduce earnings per share (EPS) and (2) …leads to reporting a higher earnings per share (EPS).” The survey provides a 5-point rating scale ranging from 0 to 4 with a rating of 0 labeled “Not at all important” and a rating of 4 labeled “Very important.” This figure presents the percentages of respondents that gave a rating of 3 or 4 for each factor. The results are shown separately for public and private firms. The corresponding data in table form are in Table 4 Panel C.

39
TABLE 1 Descriptive Statistics and Survey Responses
Variable Source N Mean SD P25 P50 P75
Firm Characteristics
Public Survey 594 0.766 0.424 1.000 1.000 1.000
Assets Survey 561 8,762 24,569 461 1,264 4,895
MVE Compustat 396 8,283 20,150 678 1,872 5,976
Sales Compustat 400 5,718 11,550 546 1,491 5,281
MB Compustat 387 3.316 2.861 1.704 2.380 3.818
ROA Compustat 396 0.065 0.085 0.024 0.063 0.108
Foreign Income Compustat 400 0.021 0.037 0.000 0.002 0.028
Foreign Assets Survey 538 0.192 0.219 0.000 0.100 0.320
Leverage Compustat 400 0.206 0.187 0.044 0.173 0.316
Sales Growth Compustat 395 0.141 0.223 0.036 0.095 0.187
Asset Growth Compustat 396 0.136 0.276 -0.004 0.068 0.184
US NOL Survey 527 0.463 0.499 0.000 0.000 1.000
R&D Intensity Compustat 400 0.026 0.044 0.000 0.000 0.036
Advertising Intensity Compustat 400 0.014 0.034 0.000 0.000 0.010
Financial Reporting Incentives
Analyst Following Compustat 455 9.114 8.361 2.000 7.000 14.000
Institutional Ownership (%) Compustat 455 0.507 0.412 0.000 0.652 0.869
|Abnormal Accruals| Compustat 376 0.090 0.087 0.029 0.064 0.122
Altman's Z-Score Compustat 369 4.404 3.411 2.314 3.840 5.569
Tax Planning Proxies
GAAP ETR (survey response) Survey 439 0.305 0.162 0.273 0.339 0.376
GAAP ETR Compustat 349 0.307 0.168 0.273 0.334 0.375
Cash ETR Compustat 345 0.282 0.245 0.152 0.251 0.352
3-Yr Cash ETR Compustat 351 0.274 0.233 0.149 0.250 0.335
P(Tax Shelter) Compustat 358 0.944 0.143 0.966 0.992 0.999
DTAX Compustat 219 0.029 0.124 -0.019 0.007 0.069
Notes: The above data are obtained either through survey questions or from Compustat (year 2006). All continuous variables are winsorized at 1% and 99% of the distribution and all dollar amounts are in millions. All variables are defined in the Appendix.
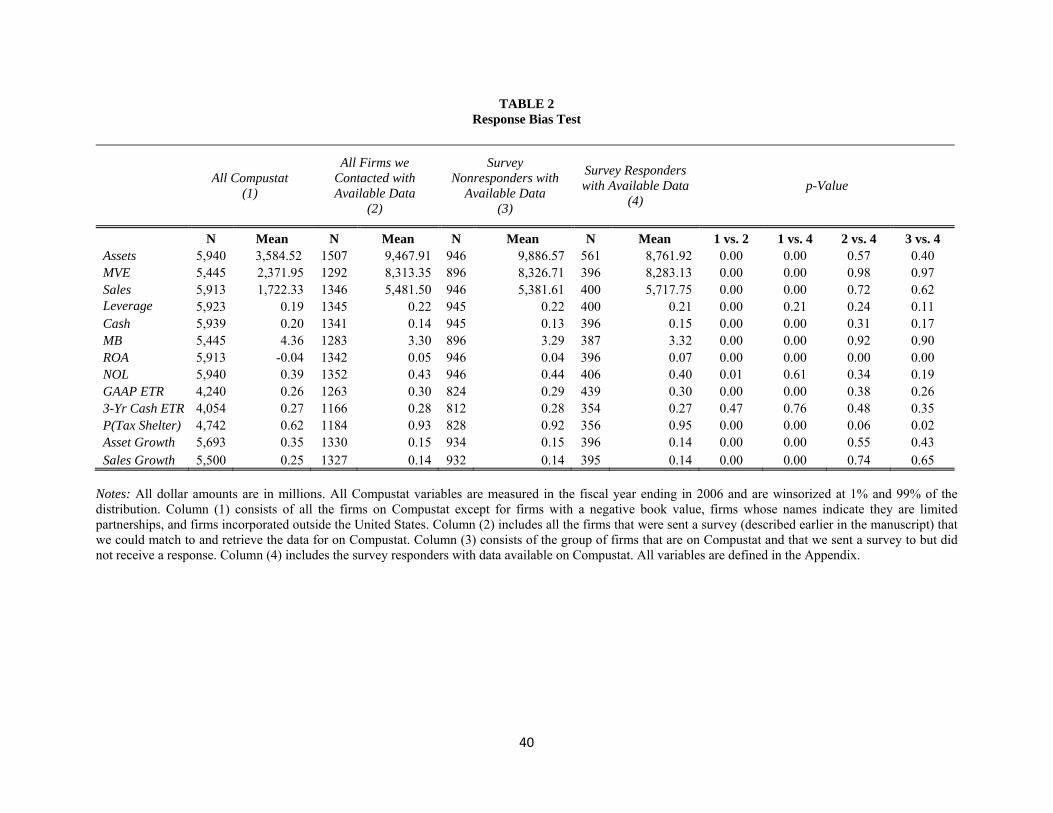
40
TABLE 2 Response Bias Test
All Compustat
(1)
All Firms we Contacted with Available Data
(2)
Survey Nonresponders with
Available Data (3)
Survey Responders with Available Data
(4) p-Value
N Mean N Mean N Mean N Mean 1 vs. 2 1 vs. 4 2 vs. 4 3 vs. 4 Assets 5,940 3,584.52 1507 9,467.91 946 9,886.57 561 8,761.92 0.00 0.00 0.57 0.40 MVE 5,445 2,371.95 1292 8,313.35 896 8,326.71 396 8,283.13 0.00 0.00 0.98 0.97 Sales 5,913 1,722.33 1346 5,481.50 946 5,381.61 400 5,717.75 0.00 0.00 0.72 0.62 Leverage 5,923 0.19 1345 0.22 945 0.22 400 0.21 0.00 0.21 0.24 0.11 Cash 5,939 0.20 1341 0.14 945 0.13 396 0.15 0.00 0.00 0.31 0.17 MB 5,445 4.36 1283 3.30 896 3.29 387 3.32 0.00 0.00 0.92 0.90 ROA 5,913 -0.04 1342 0.05 946 0.04 396 0.07 0.00 0.00 0.00 0.00 NOL 5,940 0.39 1352 0.43 946 0.44 406 0.40 0.01 0.61 0.34 0.19 GAAP ETR 4,240 0.26 1263 0.30 824 0.29 439 0.30 0.00 0.00 0.38 0.26 3-Yr Cash ETR 4,054 0.27 1166 0.28 812 0.28 354 0.27 0.47 0.76 0.48 0.35 P(Tax Shelter) 4,742 0.62 1184 0.93 828 0.92 356 0.95 0.00 0.00 0.06 0.02 Asset Growth 5,693 0.35 1330 0.15 934 0.15 396 0.14 0.00 0.00 0.55 0.43 Sales Growth 5,500 0.25 1327 0.14 932 0.14 395 0.14 0.00 0.00 0.74 0.65
Notes: All dollar amounts are in millions. All Compustat variables are measured in the fiscal year ending in 2006 and are winsorized at 1% and 99% of the distribution. Column (1) consists of all the firms on Compustat except for firms with a negative book value, firms whose names indicate they are limited partnerships, and firms incorporated outside the United States. Column (2) includes all the firms that were sent a survey (described earlier in the manuscript) that we could match to and retrieve the data for on Compustat. Column (3) consists of the group of firms that are on Compustat and that we sent a survey to but did not receive a response. Column (4) includes the survey responders with data available on Compustat. All variables are defined in the Appendix.
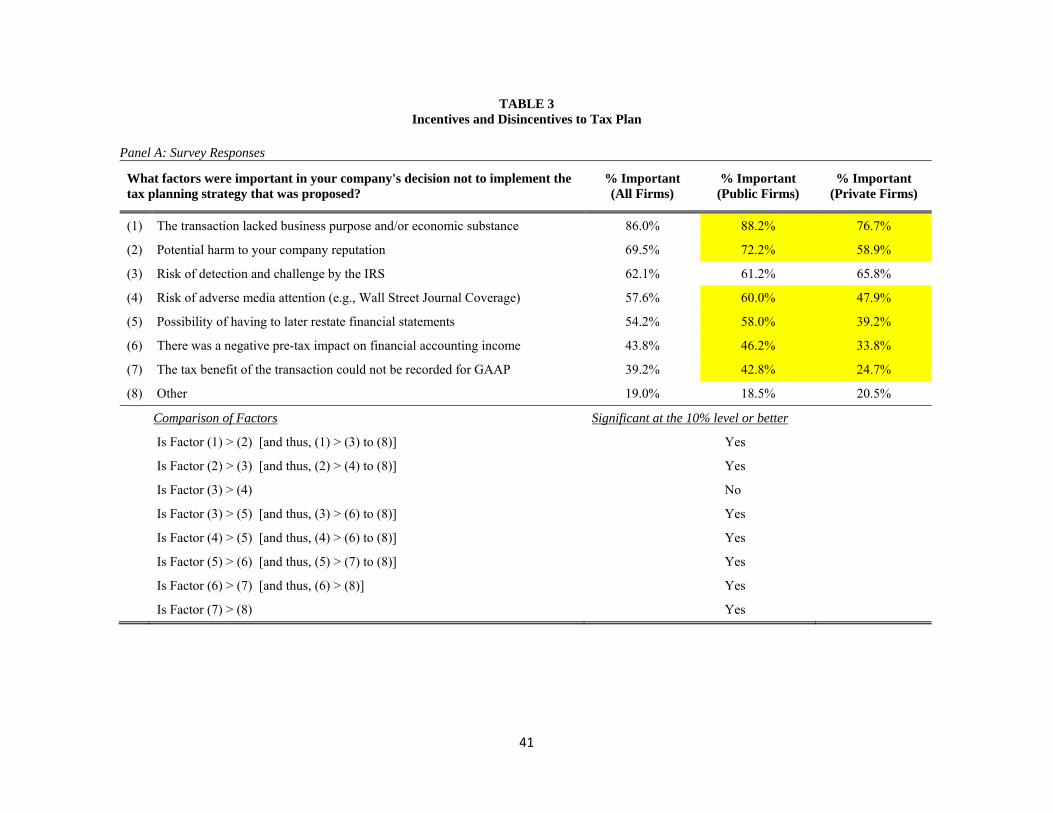
41
TABLE 3 Incentives and Disincentives to Tax Plan
Panel A: Survey Responses
What factors were important in your company's decision not to implement the tax planning strategy that was proposed?
% Important (All Firms)
% Important (Public Firms)
% Important (Private Firms)
(1) The transaction lacked business purpose and/or economic substance 86.0% 88.2% 76.7%
(2) Potential harm to your company reputation 69.5% 72.2% 58.9%
(3) Risk of detection and challenge by the IRS 62.1% 61.2% 65.8%
(4) Risk of adverse media attention (e.g., Wall Street Journal Coverage) 57.6% 60.0% 47.9%
(5) Possibility of having to later restate financial statements 54.2% 58.0% 39.2%
(6) There was a negative pre-tax impact on financial accounting income 43.8% 46.2% 33.8%
(7) The tax benefit of the transaction could not be recorded for GAAP 39.2% 42.8% 24.7%
(8) Other 19.0% 18.5% 20.5%
Comparison of Factors Significant at the 10% level or better
Is Factor (1) > (2) [and thus, (1) > (3) to (8)] Yes
Is Factor (2) > (3) [and thus, (2) > (4) to (8)] Yes
Is Factor (3) > (4) No
Is Factor (3) > (5) [and thus, (3) > (6) to (8)] Yes
Is Factor (4) > (5) [and thus, (4) > (6) to (8)] Yes
Is Factor (5) > (6) [and thus, (5) > (7) to (8)] Yes
Is Factor (6) > (7) [and thus, (6) > (8)] Yes
Is Factor (7) > (8) Yes
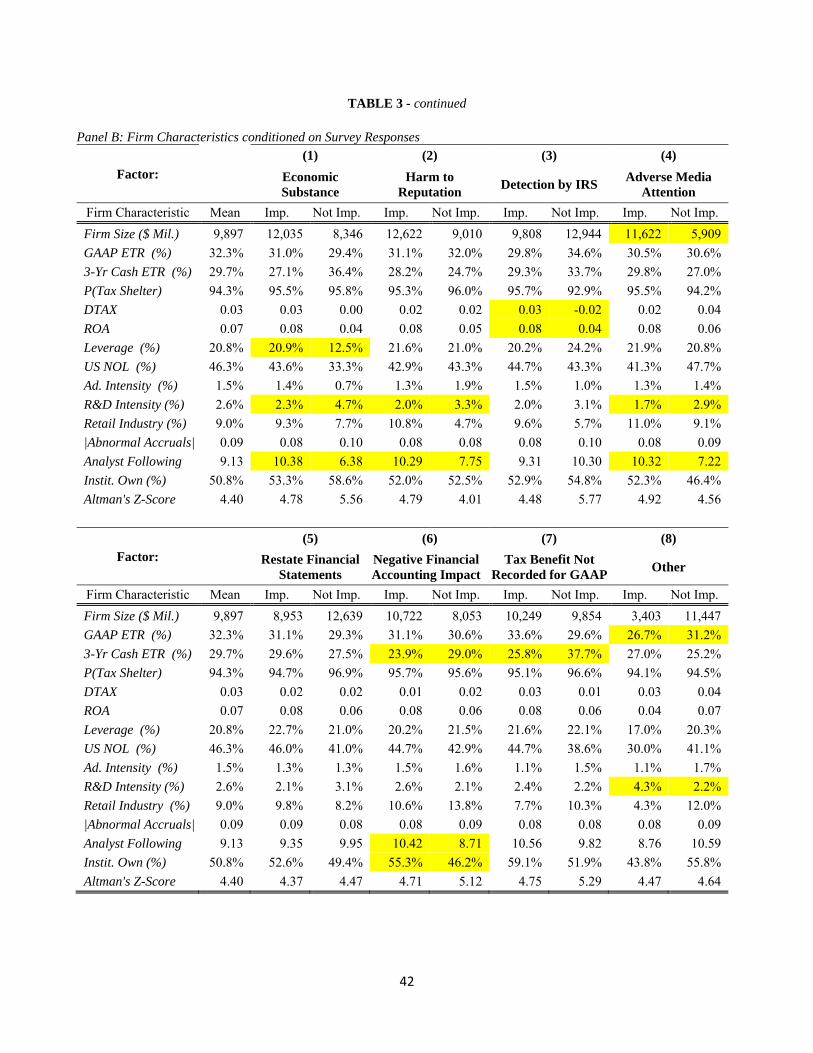
42
TABLE 3 - continued Panel B: Firm Characteristics conditioned on Survey Responses
Factor:
(1) (2) (3) (4)
Economic Substance
Harm to Reputation
Detection by IRS Adverse Media
Attention
Firm Characteristic Mean Imp. Not Imp. Imp. Not Imp. Imp. Not Imp. Imp. Not Imp.
Firm Size ($ Mil.) 9,897 12,035 8,346 12,622 9,010 9,808 12,944 11,622 5,909
GAAP ETR (%) 32.3% 31.0% 29.4% 31.1% 32.0% 29.8% 34.6% 30.5% 30.6%
3-Yr Cash ETR (%) 29.7% 27.1% 36.4% 28.2% 24.7% 29.3% 33.7% 29.8% 27.0%
P(Tax Shelter) 94.3% 95.5% 95.8% 95.3% 96.0% 95.7% 92.9% 95.5% 94.2%
DTAX 0.03 0.03 0.00 0.02 0.02 0.03 -0.02 0.02 0.04
ROA 0.07 0.08 0.04 0.08 0.05 0.08 0.04 0.08 0.06
Leverage (%) 20.8% 20.9% 12.5% 21.6% 21.0% 20.2% 24.2% 21.9% 20.8%
US NOL (%) 46.3% 43.6% 33.3% 42.9% 43.3% 44.7% 43.3% 41.3% 47.7%
Ad. Intensity (%) 1.5% 1.4% 0.7% 1.3% 1.9% 1.5% 1.0% 1.3% 1.4%
R&D Intensity (%) 2.6% 2.3% 4.7% 2.0% 3.3% 2.0% 3.1% 1.7% 2.9%
Retail Industry (%) 9.0% 9.3% 7.7% 10.8% 4.7% 9.6% 5.7% 11.0% 9.1%
|Abnormal Accruals| 0.09 0.08 0.10 0.08 0.08 0.08 0.10 0.08 0.09
Analyst Following 9.13 10.38 6.38 10.29 7.75 9.31 10.30 10.32 7.22
Instit. Own (%) 50.8% 53.3% 58.6% 52.0% 52.5% 52.9% 54.8% 52.3% 46.4%
Altman's Z-Score 4.40 4.78 5.56 4.79 4.01 4.48 5.77 4.92 4.56
Factor: (5) (6) (7) (8)
Restate Financial Statements
Negative Financial Accounting Impact
Tax Benefit Not Recorded for GAAP
Other
Firm Characteristic Mean Imp. Not Imp. Imp. Not Imp. Imp. Not Imp. Imp. Not Imp.
Firm Size ($ Mil.) 9,897 8,953 12,639 10,722 8,053 10,249 9,854 3,403 11,447
GAAP ETR (%) 32.3% 31.1% 29.3% 31.1% 30.6% 33.6% 29.6% 26.7% 31.2%
3-Yr Cash ETR (%) 29.7% 29.6% 27.5% 23.9% 29.0% 25.8% 37.7% 27.0% 25.2%
P(Tax Shelter) 94.3% 94.7% 96.9% 95.7% 95.6% 95.1% 96.6% 94.1% 94.5%
DTAX 0.03 0.02 0.02 0.01 0.02 0.03 0.01 0.03 0.04
ROA 0.07 0.08 0.06 0.08 0.06 0.08 0.06 0.04 0.07
Leverage (%) 20.8% 22.7% 21.0% 20.2% 21.5% 21.6% 22.1% 17.0% 20.3%
US NOL (%) 46.3% 46.0% 41.0% 44.7% 42.9% 44.7% 38.6% 30.0% 41.1%
Ad. Intensity (%) 1.5% 1.3% 1.3% 1.5% 1.6% 1.1% 1.5% 1.1% 1.7%
R&D Intensity (%) 2.6% 2.1% 3.1% 2.6% 2.1% 2.4% 2.2% 4.3% 2.2%
Retail Industry (%) 9.0% 9.8% 8.2% 10.6% 13.8% 7.7% 10.3% 4.3% 12.0%
|Abnormal Accruals| 0.09 0.09 0.08 0.08 0.09 0.08 0.08 0.08 0.09
Analyst Following 9.13 9.35 9.95 10.42 8.71 10.56 9.82 8.76 10.59
Instit. Own (%) 50.8% 52.6% 49.4% 55.3% 46.2% 59.1% 51.9% 43.8% 55.8%
Altman's Z-Score 4.40 4.37 4.47 4.71 5.12 4.75 5.29 4.47 4.64
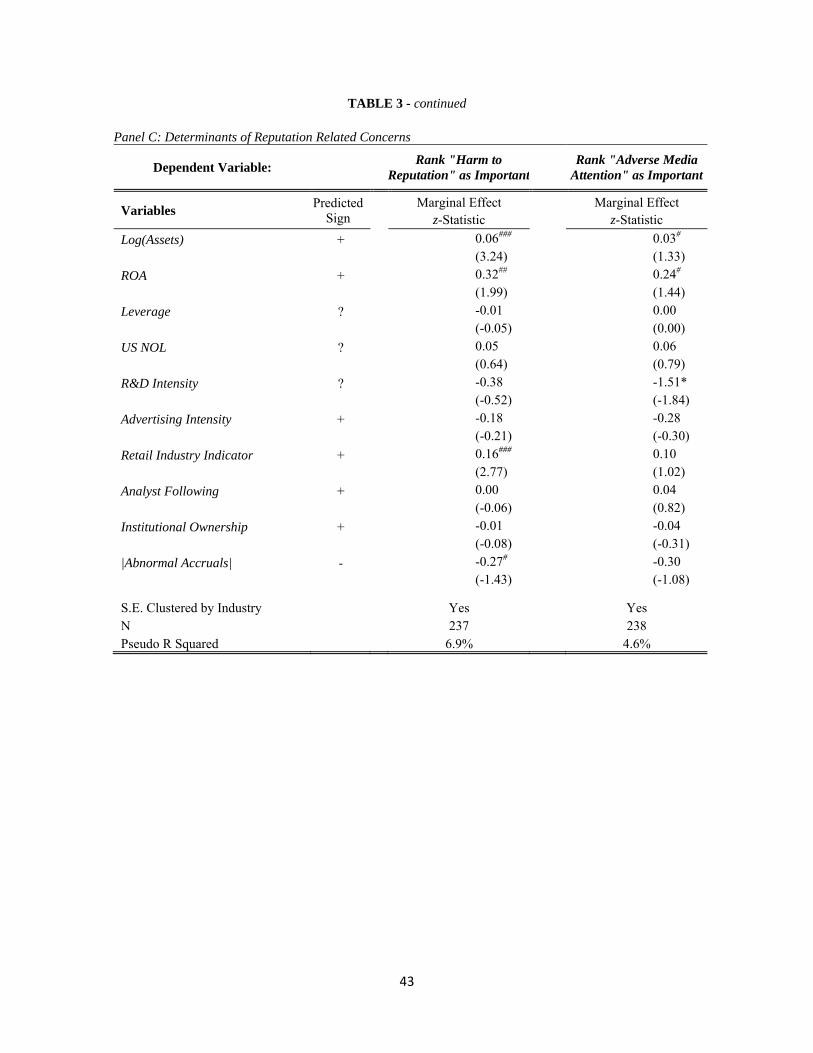
43
TABLE 3 - continued Panel C: Determinants of Reputation Related Concerns
Dependent Variable:
Rank "Harm to Reputation" as Important
Rank "Adverse Media Attention" as Important
Variables Predicted
Sign Marginal Effect Marginal Effect
z-Statistic z-Statistic
Log(Assets) + 0.06### 0.03# (3.24) (1.33)
ROA + 0.32## 0.24# (1.99) (1.44)
Leverage ? -0.01 0.00 (-0.05) (0.00)
US NOL ? 0.05 0.06 (0.64) (0.79)
R&D Intensity ? -0.38 -1.51* (-0.52) (-1.84)
Advertising Intensity + -0.18 -0.28 (-0.21) (-0.30)
Retail Industry Indicator + 0.16### 0.10 (2.77) (1.02)
Analyst Following + 0.00 0.04 (-0.06) (0.82)
Institutional Ownership + -0.01 -0.04 (-0.08) (-0.31)
|Abnormal Accruals| - -0.27# -0.30 (-1.43) (-1.08)
S.E. Clustered by Industry Yes Yes N 237 238 Pseudo R Squared 6.9% 4.6%
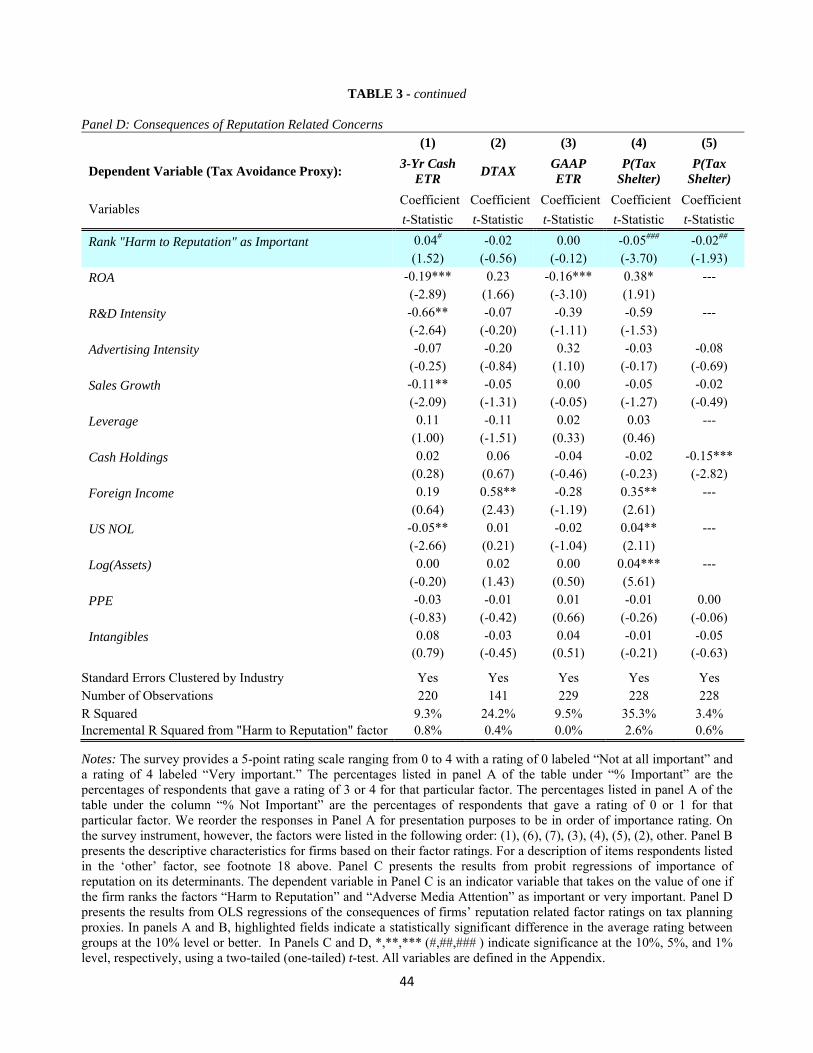
44
TABLE 3 - continued Panel D: Consequences of Reputation Related Concerns
(1) (2) (3) (4) (5)
Dependent Variable (Tax Avoidance Proxy): 3-Yr Cash
ETR DTAX
GAAP ETR
P(Tax Shelter)
P(Tax Shelter)
Variables Coefficient Coefficient Coefficient Coefficient Coefficient
t-Statistic t-Statistic t-Statistic t-Statistic t-Statistic
Rank "Harm to Reputation" as Important 0.04# -0.02 0.00 -0.05### -0.02## (1.52) (-0.56) (-0.12) (-3.70) (-1.93)
ROA -0.19*** 0.23 -0.16*** 0.38* --- (-2.89) (1.66) (-3.10) (1.91)
R&D Intensity -0.66** -0.07 -0.39 -0.59 --- (-2.64) (-0.20) (-1.11) (-1.53)
Advertising Intensity -0.07 -0.20 0.32 -0.03 -0.08 (-0.25) (-0.84) (1.10) (-0.17) (-0.69)
Sales Growth -0.11** -0.05 0.00 -0.05 -0.02 (-2.09) (-1.31) (-0.05) (-1.27) (-0.49)
Leverage 0.11 -0.11 0.02 0.03 --- (1.00) (-1.51) (0.33) (0.46)
Cash Holdings 0.02 0.06 -0.04 -0.02 -0.15*** (0.28) (0.67) (-0.46) (-0.23) (-2.82)
Foreign Income 0.19 0.58** -0.28 0.35** --- (0.64) (2.43) (-1.19) (2.61)
US NOL -0.05** 0.01 -0.02 0.04** --- (-2.66) (0.21) (-1.04) (2.11)
Log(Assets) 0.00 0.02 0.00 0.04*** --- (-0.20) (1.43) (0.50) (5.61)
PPE -0.03 -0.01 0.01 -0.01 0.00 (-0.83) (-0.42) (0.66) (-0.26) (-0.06)
Intangibles 0.08 -0.03 0.04 -0.01 -0.05 (0.79) (-0.45) (0.51) (-0.21) (-0.63)
Standard Errors Clustered by Industry Yes Yes Yes Yes Yes Number of Observations 220 141 229 228 228 R Squared 9.3% 24.2% 9.5% 35.3% 3.4% Incremental R Squared from "Harm to Reputation" factor 0.8% 0.4% 0.0% 2.6% 0.6%
Notes: The survey provides a 5-point rating scale ranging from 0 to 4 with a rating of 0 labeled “Not at all important” and a rating of 4 labeled “Very important.” The percentages listed in panel A of the table under “% Important” are the percentages of respondents that gave a rating of 3 or 4 for that particular factor. The percentages listed in panel A of the table under the column “% Not Important” are the percentages of respondents that gave a rating of 0 or 1 for that particular factor. We reorder the responses in Panel A for presentation purposes to be in order of importance rating. On the survey instrument, however, the factors were listed in the following order: (1), (6), (7), (3), (4), (5), (2), other. Panel B presents the descriptive characteristics for firms based on their factor ratings. For a description of items respondents listed in the ‘other’ factor, see footnote 18 above. Panel C presents the results from probit regressions of importance of reputation on its determinants. The dependent variable in Panel C is an indicator variable that takes on the value of one if the firm ranks the factors “Harm to Reputation” and “Adverse Media Attention” as important or very important. Panel D presents the results from OLS regressions of the consequences of firms’ reputation related factor ratings on tax planning proxies. In panels A and B, highlighted fields indicate a statistically significant difference in the average rating between groups at the 10% level or better. In Panels C and D, *,**,*** (#,##,### ) indicate significance at the 10%, 5%, and 1% level, respectively, using a two-tailed (one-tailed) t-test. All variables are defined in the Appendix.

45
TABLE 4 Financial Accounting Incentives and Disincentives to Tax Plan
Panel A
(Q1) Which metric is more important to the top management at your company? (N=503) All Firms Public Firms Private Firms
GAAP ETR 40.0% 47.1% 14.7%
Cash Taxes Paid 23.7% 15.5% 52.3%
Both are equally important 36.4% 37.4% 33.0%
Comparison of Factors p-Value p-Value p-Value
GAAP ETR = Cash Taxes Paid 0.000 0.000 0.000
GAAP ETR = Both are equally important 0.359 0.037 0.005
Cash Taxes Paid = Both are equally important 0.000 0.000 0.029
Panel B
(Q2) How often are (were) the tax planning strategies proposed as a way to increase financial accounting earnings? (N=501)
% of Firms % of Public Firms % of Private Firms
Always 5.2% 6.4% 0.9%
Often 26.8% 28.2% 21.5%
Sometimes 50.7% 50.9% 49.5%
Never 17.4% 14.5% 28.0%
Panel C
(Q3) At your company, when evaluating a tax planning strategy that saves cash taxes, how important is it that the tax planning strategy… (N=501)
% Important (All Firms)
% Important (Public Firms)
% Important
(Private Firms)
A …does not reduce earnings per share (EPS) 60.8% 71.2% 23.4%
B …leads to reporting a higher earnings per share (EPS) 49.5% 57.0% 22.4%
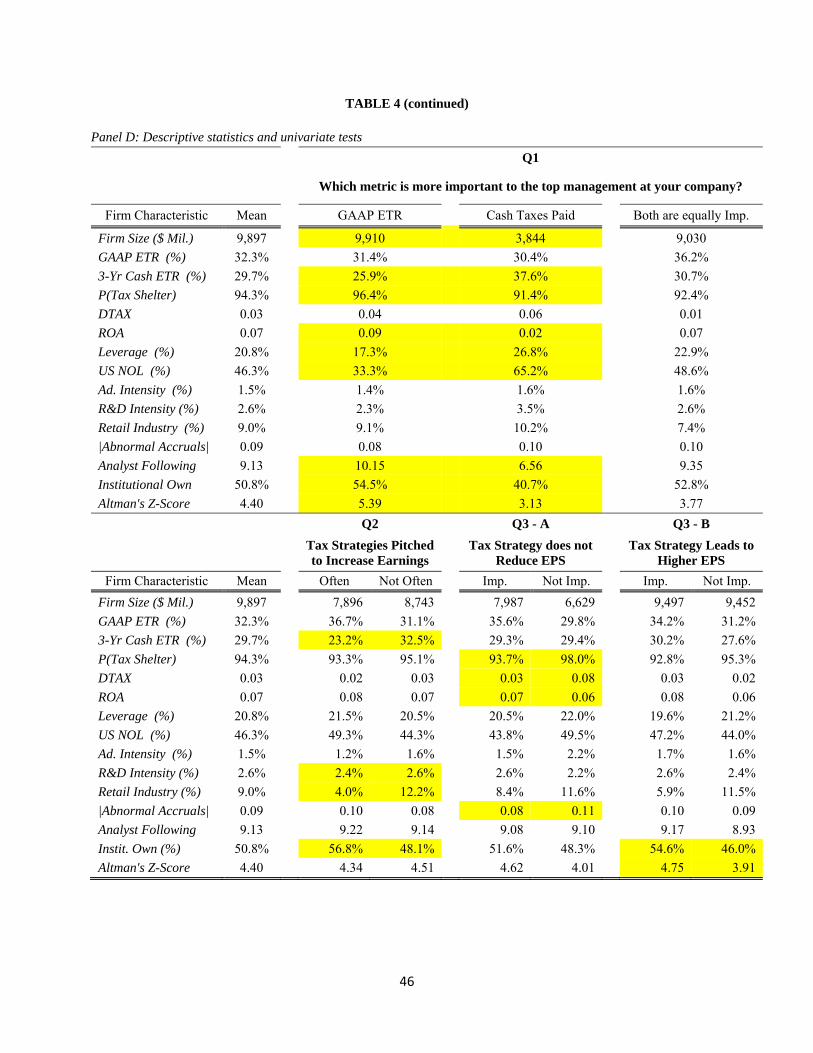
46
TABLE 4 (continued) Panel D: Descriptive statistics and univariate tests
Q1
Which metric is more important to the top management at your company?
Firm Characteristic Mean GAAP ETR Cash Taxes Paid Both are equally Imp.
Firm Size ($ Mil.) 9,897 9,910 3,844 9,030
GAAP ETR (%) 32.3% 31.4% 30.4% 36.2%
3-Yr Cash ETR (%) 29.7% 25.9% 37.6% 30.7%
P(Tax Shelter) 94.3% 96.4% 91.4% 92.4%
DTAX 0.03 0.04 0.06 0.01
ROA 0.07 0.09 0.02 0.07
Leverage (%) 20.8% 17.3% 26.8% 22.9%
US NOL (%) 46.3% 33.3% 65.2% 48.6%
Ad. Intensity (%) 1.5% 1.4% 1.6% 1.6%
R&D Intensity (%) 2.6% 2.3% 3.5% 2.6%
Retail Industry (%) 9.0% 9.1% 10.2% 7.4%
|Abnormal Accruals| 0.09 0.08 0.10 0.10
Analyst Following 9.13 10.15 6.56 9.35
Institutional Own 50.8% 54.5% 40.7% 52.8%
Altman's Z-Score 4.40 5.39 3.13 3.77
Q2 Q3 - A Q3 - B
Tax Strategies Pitched to Increase Earnings
Tax Strategy does not Reduce EPS
Tax Strategy Leads to Higher EPS
Firm Characteristic Mean Often Not Often Imp. Not Imp. Imp. Not Imp.
Firm Size ($ Mil.) 9,897 7,896 8,743 7,987 6,629 9,497 9,452
GAAP ETR (%) 32.3% 36.7% 31.1% 35.6% 29.8% 34.2% 31.2%
3-Yr Cash ETR (%) 29.7% 23.2% 32.5% 29.3% 29.4% 30.2% 27.6%
P(Tax Shelter) 94.3% 93.3% 95.1% 93.7% 98.0% 92.8% 95.3%
DTAX 0.03 0.02 0.03 0.03 0.08 0.03 0.02
ROA 0.07 0.08 0.07 0.07 0.06 0.08 0.06
Leverage (%) 20.8% 21.5% 20.5% 20.5% 22.0% 19.6% 21.2%
US NOL (%) 46.3% 49.3% 44.3% 43.8% 49.5% 47.2% 44.0%
Ad. Intensity (%) 1.5% 1.2% 1.6% 1.5% 2.2% 1.7% 1.6%
R&D Intensity (%) 2.6% 2.4% 2.6% 2.6% 2.2% 2.6% 2.4%
Retail Industry (%) 9.0% 4.0% 12.2% 8.4% 11.6% 5.9% 11.5%
|Abnormal Accruals| 0.09 0.10 0.08 0.08 0.11 0.10 0.09
Analyst Following 9.13 9.22 9.14 9.08 9.10 9.17 8.93
Instit. Own (%) 50.8% 56.8% 48.1% 51.6% 48.3% 54.6% 46.0%
Altman's Z-Score 4.40 4.34 4.51 4.62 4.01 4.75 3.91

47
TABLE 4 (continued) Panel E: Determinants of rating GAAP ETR as important
Dependent Variable: GAAP ETR Rating Variables Coefficient z-Statistic
Log(Assets) -0.008 -0.33
ROA 1.604 *** 3.50
Leverage -0.303 ** -2.06
US NOL 0.053 0.52
R&D Intensity -0.773 * -1.66
Analyst Following 0.016 0.49
Institutional Ownership 0.138 * 1.54
|Abnormal Accruals| -0.434 -1.14
Altman's Z-Score 0.006 0.45
Pseudo R Squared 23.83%
N 174
Notes: Panel A includes responses to the question listed in the top half of the panel and statistical tests between the factors in the bottom half of the panel. For the questions in Panel C, the survey provides a 5-point rating scale ranging from 0 to 4 with a rating of 0 labeled “Not at all important” and a rating of 4 labeled “Very important.” The percentages listed in panel C of the table under “% Important” are the percentages of respondents that gave a rating of 3 or 4 for that particular factor. Definitions of the variables listed in Panel D are in the appendix. Panel E includes probit regression results where the dependent variable is one if the company rated the GAAP ETR as the most important metric to top management relative to cash taxes paid; the dependent variable is set to zero if cash taxes paid was the most important metric (firms that said both metrics are equally important are excluded from the analysis). Highlighted fields indicate a statistically significant difference in the average rating between public and private firms at the 10% level or better. All variables are defined in the Appendix.


![[31] D. T - Cornell University · 1998. 10. 9. · terface Sp eci cation V ersion 3.0, Pr entic e Hal l, Septem b er 1993 [13] V. Jacobson, \Congestion Av oidance and Con trol," Pr](https://img.pdfslide.us/doc/110x75/60cb3944369c971eb006314e/31-d-t-cornell-1998-10-9-terface-sp-eci-cation-v-ersion-30-pr-entic.jpg)