Embed Size (px)
Citation preview
Electronic copy available at: http://ssrn.com/abstract=2021994
Inflation Risk in Corporate BondsJournal of Finance forthcoming
JOHNNY KANG and CAROLIN E. PFLUEGER*
ABSTRACT
We argue that corporate bond yields reflect fears of debt deflation. When debt is nominal, un-
expectedly low inflation increases real liabilities and default risk. In a real business cycle model
with optimal but infrequent capital structure choice, more uncertain or pro-cyclical inflation leads
to quantitatively important increases in corporate log yields in excess of default-free log yields.
A panel of credit spread indexes from six developed countries shows that credit spreads rise by
14 basis points if inflation volatility or the inflation-stock correlation increases by one standard
deviation.
*Kang: AQR Capital Management, Greenwich CT 06830. [email protected]. Pflueger: University of BritishColumbia, Vancouver BC V6T 1Z2, Canada. [email protected]. We are grateful to an anonymous AE,an anonymous referee, Shai Bernstein, Harjoat Bhamra, Murray Carlson, Anna Cieslak, Josh Coval, Adlai Fisher, BenFriedman, Josh Gottlieb, Francois Gourio, Robin Greenwood, Cam Harvey, Robert Hall, Sam Hanson, Peter Hordahl,Stephanie Hurder, Jakub Jurek, Jacob Leshno, Robert Merton, Nick Roussanov, Alp Simsek, Jeremy Stein, Jim Stock,Adi Sunderam, Yaniv Yedid-Levi, seminar participants at the University of British Columbia, Brown University, theFederal Reserve Board, the Federal Reserve Bank of Chicago, Harvard University, the University of Illinois at Urbana-Champaign, London Business School, the University of Michigan, the University of Rochester, Washington Universityin St. Louis, the University of Wisconsin-Madison, and the Yale School of Management for helpful comments andsuggestions. We thank Ari Achiaz and Roni Michaely for help with Israeli corporate bond data. We thank StephenZhang for able research assistance. We are especially grateful to John Campbell, Erik Stafford, and Luis Viceira forinvaluable advice and guidance.

Electronic copy available at: http://ssrn.com/abstract=2021994
Corporate and sovereign bonds in developed countries are overwhelmingly nominal. Firms are
therefore exposed to the possibility of “debt deflation”, when a surprise drop in inflation leads to
increases in real liabilities and corporate default risk (Fisher (1933)). The literature has argued that
corporate bonds price the volatility of real firm values as proxied by equity volatility (Campbell
and Taksler (2003), Collin-Dufresne, Goldstein, and Martin (2001)). We find that inflation risk can
explain at least as much variation in credit spreads as can equity volatility and the dividend-price
ratio. In a panel of credit spread indexes from six developed countries, a one standard deviation
move in either inflation volatility or the inflation-stock correlation increases credit spreads by 14
basis points (bps), relative to average credit spreads around 100 bps.
This paper identifies a new link between inflation risk and the credit component in corpo-
rate bond yields. This channel is on top of and separate from any inflation risk premia in nomi-
nal default-free bonds.1 In contrast to corporate bonds, nominal government bonds are plausibly
default-free if governments can inflate away their own debt. We argue theoretically and confirm
empirically that inflation risk is priced into corporate bond log yields above and beyond its im-
pact on nominal default-free log yields. Indeed, we find that inflation risk affects empirical credit
spreads even after controlling for the term structure of nominal government log yields.
Corporate bond spreads price two types of inflation risk: inflation volatility and inflation cycli-
cality. First, more volatile inflation increases the ex-ante probability that firms will default due to
high real liabilities. Second, when inflation and real cash flows are highly correlated, there is a risk
of low inflation recessions. In this case, low real cash flows and high real liabilities tend to hit firms
at the same time, and this interaction increases default rates and real investor losses. Moreover,
inflation cyclicality may also increase the default risk premium in credit spreads if investors are
risk averse.
[FIGURE 1 ABOUT HERE]
1

Figure 1A illustrates the close historical relation between time-varying inflation uncertainty
and firms’ cost of debt finance in the United States.2 Figure 1B shows that the relation between the
lower tail of inflation uncertainty and credit spreads is even stronger, consistent with our intuition
that lower than expected inflation raises credit risk. In Section III of this paper, we confirm the
relation between credit spreads and inflation uncertainty in a panel of six developed countries,
controlling for proxies for business conditions, real uncertainty, and time-varying risk aversion.
It might at first seem surprising that the risk of debt deflation should have been salient during
the high inflation 1970s and 1980s. However, debt deflation can occur whenever inflation is lower
than expected, even if the level of inflation remains high. In 1982, the New York Times argued:
“Among those most distressed by slowing inflation are individuals and businesses that took out
large loans in the past few years based on the assumption that inflation would remain at very high
levels. . . . The farmer’s new, expensively financed machinery is harvesting crops fetching lower
market prices.”3
Not only inflation volatility but also inflation cyclicality have varied over time in the U.S.
Moreover, high inflation cyclicality can rationalize investors’ recent relative reluctance to hold
corporate bonds. When inflation dropped to extremely low levels during the financial crisis, our
measure of inflation pro-cyclicality—the inflation-stock correlation—reached a peak and captured
significant public concerns about debt deflation. In contrast, investors in the 1970s feared high
inflation recessions—or “stagflations”—implying countercyclical inflation.
While concerns about a deflationary drop in U.S. aggregate demand have been especially strong
over the past three years, our measure suggests that they have been present since at least the early
2000s. They have also been salient, as evidenced by a widely noted 2002 speech by then-Federal
Reserve Governor Ben Bernanke.4 Concerns about debt deflation are also evident in recent news
reporting. For instance, ProQuest reports 230 news mentions of the key word “debt deflation”
2

versus only 132 for the keyword “stagflation” over 2000 to 2009. Internationally, the Japanese
experience during the 1990s provides one of the more salient examples of recent debt deflation
(Kuttner and Posen (2001)).
As of December 2010, the U.S. Baa-Aaa Moody’s log yield spread was close to its historical
average over the period 1969.Q4 to 2010.Q4.5 On the other hand, equity valuations were high,
with the S&P 500 index dividend-price ratio a full standard deviation below its sample average.
Based on our estimates, 34 bps of the 104 bps U.S. Baa-Aaa log yield spread in December 2010
were due to above average inflation pro-cyclicality.
We develop a model with stochastic productivity and optimal but infrequent capital structure
choice. This model provides new, testable, and quantitative predictions. Regressions of model
credit spreads onto inflation volatility and the inflation-stock correlation predict that the impact
of inflation volatility and the inflation-stock correlation on credit spreads should be substantial,
while controlling for equity volatility, the dividend yield, inflation surprises, and equity returns.
Simulated credit spreads increase by 27 bps if the annualized standard deviation of inflation shocks
increases by 1 percentage point and by 20 bps if the inflation-stock correlation increases by 100
percentage points.
Three key features in our model generate large, dynamic responses of credit spreads to inflation
risk. First, we model both the size of inflation shocks and their correlation with real outcomes as
varying over time independently of real activity.
Second, we assume that firms issue nominal long-term bonds and that expected inflation is
persistent, consistent with U.S. and international evidence (Ball and Cecchetti (1990), Stock and
Watson (2007)). The assumption that debt is nominal is plausible for developed countries, where
bonds are denoted in nominal terms by historical convention, and where inflation-indexed cor-
porate debt plausibly carries a substantial liquidity premium. In our calibrated model, a liquidity
3
premium comparable to that documented for U.S. inflation-indexed government bonds during their
first few years of issuance (D’Amico, Kim, and Wei (2009), Pflueger and Viceira (2011)) deters
firms from switching to inflation-indexed bonds.
The combination of long-term nominal bonds and persistent inflation implies that small per-
manent shocks to inflation can have large effects on real liabilities. For instance, a permanent
decrease in log inflation from three to one percent per annum increases the expected real principal
repayment on a ten-year nominal bond by 22%. Surprise inflation matters for credit spreads above
and beyond shocks to the real economy. In contrast, a decrease in the real interest rate also affects
credit risk, but it does so because it reflects expected real growth and real risk premia.
Third, firms in our model choose leverage optimally but infrequently, according to a textbook
tradeoff theory (Modigliani and Miller (1958), Modigliani and Miller (1963), Kraus and Litzen-
berger (1973)). Tax and other debt benefits create an incentive for taking on debt, while bankruptcy
costs discourage taking on debt. When the ex-ante risk-adjusted cost of bankruptcy increases due
to inflation risk, young firms in our overlapping generations model respond by reducing leverage.
However, old firms’ inability to respond magnifies the increase in credit spreads. The empirically
well-founded assumption of infrequent capital structure adjustment helps generate a realistic level
of credit spreads.
We provide new empirical evidence that corporate bond investors price the risk of debt deflation
in a panel of corporate bond spread indexes from Australia, Canada, Germany, Japan, the United
Kingdom, and the United States over four decades. Following authors such as Chen, Collin-
Dufresne, and Goldstein (2009), we compute U.S. corporate bond spreads in excess of the Moody’s
Aaa log yield. Due to their worldwide benchmark status, U.S. Treasuries may enjoy extreme
liquidity and therefore the Moody’s Aaa yield may provide a better proxy of the long-term default-
free bond yield.6 We calculate spreads in excess of duration-matched government bond log yields
4

for all non-U.S. countries.
In a pooled regression, one standard deviation increases in inflation volatility or the inflation-
stock correlation are associated with spread increases of 14 bps. Our proxies for inflation risk
explain as much variation in credit spreads as do equity volatility and the dividend-price ratio, our
proxies for real uncertainty and risk aversion. Consistent with model predictions, the empirical
impact of inflation risk is especially large when real stock returns are low or when inflation shocks
are low.
Our empirical evidence from corporate bond spreads is both consistent with predicted model
magnitudes and with ex-post realized corporate bond credit losses and risk premia. We test whether
inflation risk raises physical expected credit losses, default risk premia, or both, using U.S. data
on Baa-rated corporate defaults, loss given default, and long-term corporate log returns in excess
of government log returns. We find that a one standard deviation move in U.S. inflation volatility
(58 bps) predicts a 10 bps increase in the annual credit loss rate over the next five years, while
controlling for the equity volatility, the dividend-price ratio, and business cycle controls. A one
standard deviation move in the U.S. inflation-stock correlation (34 percentage points) predicts a 6
bps increase in the annual credit loss rate over the next five years. We find that the inflation-stock
correlation, but not the inflation volatility, forecasts excess log returns on long-term corporate
bonds over long-term government bonds.
Our results suggest that the inflation-stock correlation raises both expected physical loss rates
and default risk premia, and that both channels are quantitatively important. On the other hand,
inflation volatility appears to raise expected physical credit loss rates, but not default risk premia.
These findings are consistent with our proposed mechanism, where an increase in the inflation-
stock correlation should make corporate defaults more likely to occur in the worst economic states
when marginal utility is high.
5
Evidence from the Israeli inflation-indexed corporate bond market provides additional direct
evidence that the nominal nature of U.S. and international corporate bonds generates time-varying
risk of debt deflation. In contrast to the other financial markets in our sample, Israeli govern-
ment and corporate bonds have been conventionally inflation-indexed since the 1950s (Koninsky
(1997)). Consistent with our proposed theory, we find no evidence that Israeli inflation-indexed
corporate bond spreads are driven by time-varying risk of debt deflation. On the contrary, invest-
ment grade Israeli inflation-indexed corporate bond spreads increased from 54 bps in 2000.Q1 to
146 bps in 2010.Q4 while inflation volatility decreased from 283 bps to 155 bps.
The findings in this paper have broad implications not only for asset pricing, but also for pol-
icy, macroeconomic research, and corporate finance. For instance, firms might optimally want to
decrease their share of long-term nominal debt when inflation risk is high.
The remainder of the paper is organized as follows. After a brief literature review, Section I
introduces the model. Section II argues that inflation risk should be quantitatively important for
credit spreads in a calibrated version of the model. Section III tests the model predictions in an
international panel of credit spread indexes, and Section IV concludes.
A. Literature Review
Time variation in inflation volatility was first modeled by Engle (1982). There is also sub-
stantial bond market evidence of time-varying inflation cyclicality (Li (2002), Baele, Bekaert, and
Inghelbrecht (2010), David and Veronesi (2013), Viceira (2012), Wright (2011), Campbell, Sun-
deram, and Viceira (2013)).
We add to previous structural models of credit risk such as Merton (1974), and Longstaff and
Schwartz (1995) by allowing the risk of inflation to vary over time. We also contribute to the
literature on asset pricing models with optimal leverage and default by arguing that firms should
6
adjust their capital structure in response to time-varying inflation risk (Leland and Toft (1996),
Goldstein, Ju, and Leland (2001), Hackbarth, Miao, and Morellec (2006), Chen, Collin-Dufresne,
and Goldstein (2009), Bhamra, Kuehn, and Strebulaev (2010a), Bhamra, Kuehn, and Strebulaev
(2010b), Gomes and Schmid (2010), Gourio (2013)). Our model of optimal firm capital structure
has analogies to optimal household mortgage choice under inflation risk (Campbell and Cocco
(2003), Koijen, van Hemert, and van Nieuwerburgh (2009)), but it differs in that all assets are
priced by the same representative investor.
This paper is closely related to recent models of monetary policy when firms’ liabilities are
nominal (Bhamra, Fisher, and Kuehn (2011), De Fiore and Tristani (2011)). Our model highlights
inflation volatility and inflation cyclicality as driving credit risk, and has directly testable predic-
tions. Transition dynamics in our model increase the quantitative impact of inflation risk on credit
spreads.
Ferson and Harvey (1991) estimate the risk premium for exposure to inflation surprises using
government bond, corporate bond, and stock portfolio returns for the period 1964 to 1986. We add
to their analysis by arguing that the time-varying second moments of inflation surprises are priced
into corporate bonds.
I. A Dynamic Model of Inflation Risk in Corporate Bonds
We model production and the optimal choice of capital structure in a standard manner, similarly
to Gourio (2013). We depart from standard practice by assuming that corporate debt is nominal
and long-term, and by assuming that the second moments of inflation are time-varying. We model
7

overlapping generations of firms to tractably capture infrequent debt refinancing.
A. Intuition: Contingent Claim Payoff Profiles
We illustrate the main model intuition using contingent claim payoff profiles. Black and Sc-
holes (1973) and Merton (1974) model a corporate bond as a default-free bond minus a put option
on the underlying firm’s assets. In such a framework, credit spreads decrease in the underlying
firm’s asset value and increase in the volatility of the firm’s assets. In our proposed mechanism,
an unexpected drop in inflation increases the default probability. Inflation volatility and inflation
cyclicality should therefore increase the corporate bond spread. This effect is similar to but sepa-
rate from the effect of real asset volatility on the credit spread.7
[FIGURE 2 ABOUT HERE]
Figure 2 shows conditional expected real payoffs on nominal corporate and default-free bonds
for different inflation risk scenarios. In Figure 2B, inflation is uncertain and uncorrelated with real
asset values. The default probability is nonzero for any underlying real asset value, and the payoff
gap increases relative to Figure 2A.
Comparing Figures 2C and 2D shows that when inflation is pro-cyclical, credit spreads should
be higher. In Figure 2C, firms get hit twice during recessions because they experience low real
asset values and high real liabilities at the same time. The gap between default-free and corporate
bonds is especially large when real asset values are low and risk-averse investors’ marginal utility is
likely to be high, so credit spreads should increase further to include a larger default risk premium.
B. Timing of Cohort t
[FIGURE 3 ABOUT HERE]
8

Figure 3 illustrates the timing for a firm that enters at the end of period t and produces for
two periods. At the end of period t, the firm chooses its face value of nominal two-period debt B$t
and purchases capital Kyt+1, which will be available for production at time t +1. The firm’s newly
issued corporate bonds have two periods remaining to maturity.
In period t +1, aggregate productivity and inflation shocks are realized. The firm experiences
an idiosyncratic shock to its capital stock and produces. The firm cannot modify its capital struc-
ture, so leverage is sticky. The firm’s seasoned corporate bonds have one period remaining to
maturity.
In period t +2, the firm again receives shocks and produces. At the end of period t +2, equity
holders decide whether to default. Equity and debt holders then receive payments.
C. Production
Firms have a standard Cobb-Douglas production function with capital and labor inputs. At
time t, firm i with capital Kit and labor Ni
t produces output Y it :
Y it =
(ztNi
t)1−α (
Kit)α
. (1)
Total factor productivity (TFP) zt is independently and identically distributed with a trend:
zt+1 = exp(µt)exp(
εT FPt+1 −
12
σ2)
with εT FPt+1
iid∼ N(0,σ2) . (2)
We calibrate one time period to equal five years, which is close to business cycle frequency, so
independent TFP shocks are a reasonable approximation. TFP trend µ is also the equilibrium trend
growth rate for output and consumption in the economy.
Firm i chooses labor optimally to maximize single period operating revenue, while taking the
9

aggregate wage as given. We assume that the aggregate supply of labor is fixed at 1, abstracting
from unemployment. The equilibrium wage adjusts to clear the labor market.
We define aggregate output, capital, and investment at time t by integrating over all firms:
Yt =∫
iY i
t di, Kt =∫
iKi
t di, Nt =∫
iNi
t di, It =∫
iIit di. (3)
Capital depreciates at a constant rate δ and we impose the resource constraint that total output
equals aggregate consumption plus investment:
Kt+1 = It +(1−δ)Kt , (4)
Yt = Ct + It . (5)
Solving for the equilibrium hiring policy, total output at time t is given by Yt = z1−αt Kα
t . Young
and old firms are heterogeneous in their capital stock, but constant returns to scale imply that for
any firm the return on capital from time t to time t +1 equals:
RKt+1 =
[α
(zt+1
Kt+1
)1−α
+(1−δ)
]. (6)
From (6) the expected level and the volatility of real returns on capital are endogenously higher
when the capital stock Kt+1 is low relative to trend.
D. Inflation
Let Pt denote the price level at time t and πt log inflation from time t−1 to time t:
πt = log(Pt/Pt−1) . (7)
10

Consistent with U.S. and international empirical evidence (e.g., Stock and Watson (2007), Ball
and Cecchetti (1990)), we model expected log inflation as following a random walk. The dynamics
of expected inflation resemble a backward-looking Phillips curve, consistent with empirical evi-
dence (Fuhrer (1997)). Inflation persistence implies that uncertainty about the price level increases
with the time horizon, so inflation risk should be larger for longer maturity bonds:8
πt+1 = πt + επt+1, (8)
επt+1∣∣σπ
t+1 ∼ N(
0,(σ
πt+1)2), (9)
Corr(
επt+1,ε
T FPt+1∣∣ρπ
t+1)
= ρπt+1. (10)
Higher σπt implies more uncertainty about the price level. When ρπ
t is positive, the relation
between inflation and real activity slopes upward, similarly to an upward-sloping Phillips curve.
When ρπt is negative, the Phillips curve is unstable—potentially due to supply shocks or to shifting
inflation expectations.
The magnitude of inflation surprises and their relation with productivity shocks can vary over
time. We model time variation in σπt and ρπ
t in the simplest possible manner by assuming that they
follow two-state Markov switching processes, independent of each other and of all other shocks in
the economy. Inflation uncertainty σπt and inflation cyclicality ρπ
t each take a low or a high value:
σπt ∈
σπ,L,σπ,H , ρ
πt ∈
ρπ,L,ρπ,H . (11)
The probabilities of going from state σπ,X to σπ,Y and of going from state ρπ,X to ρπ,Y are:
p(σ
π,X → σπ,Y) , p
(ρ
π,X → ρπ,Y) . (12)
11

E. Default Decision
A firm’s default decision depends on the initial level of debt, aggregate real shocks, aggregate
nominal shocks, and idiosyncratic real shocks.
Corporate debt promises a fixed nominal payment after two periods, when the firm pays a
liquidating dividend. We denote logs by small letters throughout. All firms in cohort t are identical
ex-ante. Denote the initial log nominal face value of debt by b$t and initial log leverage adjusted
for expected inflation by lt . Then firms choose:
lt = b$t −2πt− ky
t+1. (13)
Inflation persistence implies that the inflation shock in period t + 1 enters twice into the log
real liabilities of an old firm:
breal,oldt+2 = lt + ky
t+1−2επt+1− ε
πt+2. (14)
Firm i in cohort t experiences identical and independent idiosyncratic shocks to log capital at
times t +1 and t +2, ai,1t+1 and ai,2
t+2. We assume:
ai,idt+2 = ai,1
t+1 +ai,2t+2, (15)
ai,1t+1,a
i,2t+2
ind∼ N(−1
4
(σ
id)2
,12
(σ
id)2). (16)
Using (6) the log real value of an old firm at the end of period t +2 equals:
vi,oldt+2 = ky
t+1 + rKt+1 + rK
t+2 +ai,idt+2. (17)
12

Equity holders have the option to default on debt payments and to receive a zero liquidating
dividend. They optimally decide to default if and only if the real value of the firm (17) is less than
its real liabilities (14).9 Conditional on aggregate shocks, firms with the most adverse idiosyncratic
shocks default:
ai,idt+2 < lt−2ε
πt+1− ε
πt+2− rK
t+1− rKt+2︸ ︷︷ ︸
Survival Threshold a∗t+2
. (18)
Equation (18) formalizes the intuition that low inflation shocks επt+1 and επ
t+2 increase the survival
threshold a∗t+2 and defaults. Low productivity shocks at times t +1 and t +2 lower real returns on
capital and also increase defaults. The real interest rate does not enter into the default threshold
directly. However, a drop in real interest rates either reflects a fall in expected real growth rates or
a change in real risk premia, which can affect default risk.
F. Stochastic Discount Factor
We model a representative consumer with expected power utility over consumption, risk aver-
sion γ, and discount rate β:
Ut = Et
∞
∑s=t
exp(−β(s− t))C1−γ
s
1− γ. (19)
The two-period stochastic discount factors for pricing two-period real and nominal payoffs are:
Mt,t+2 = exp(−2β)(Ct+2/Ct)−γ , (20)
M$t,t+2 = Mt,t+2/exp
(2πt +2ε
πt+1 + ε
πt+2). (21)
13

G. Corporate Bond Prices
Let the functions H(a∗t+2), Ω(a∗t+2) denote the time t + 2 default probability and average de-
faulted firm value conditional on the survival threshold a∗t+2. Let G(a∗t+1,ai,1t ) and W (a∗t+1,a
i,1t )
denote the time t + 1 default probability and average defaulted firm value of a cohort t − 1 firm
conditional on the survival threshold a∗t+1 and on the firm’s first-period idiosyncratic shock ai,1t :
H(a∗t+2
)= P
(ai,id
t+2 < a∗t+2
), (22)
Ω(a∗t+2
)= E
(exp(
ai,idt+2
)I(
ai,idt+2 < a∗t+2
)), (23)
G(
a∗t+1,ai,1t
)= P
(ai,id
t+1 < a∗t+1
∣∣∣ai,1t
), (24)
W(
a∗t+1,ai,1t
)= E
(exp(
ai,idt+1
)I(
ai,idt+1 < a∗t+1
)∣∣∣ai,1t
). (25)
Here, I denotes the indicator function. The prices of a new corporate bond at time t and a
duration-matched two-period government bond then equal:
qcorp,newt = Et
M$t,t+2
1− H(a∗t+2
)︸ ︷︷ ︸Default Rate
+θΩ(a∗t+2
)exp(a∗t+2
)︸ ︷︷ ︸Recovery Rate
, (26)
qgov,2t = Et
[M$
t,t+2
]. (27)
Similarly, firm i’s seasoned corporate bond and a duration-matched one-period government bond
14

are then priced according to:
qi,seast = Et
M$t,t+1
1−G(a∗t+1,ai,1t )︸ ︷︷ ︸
Cond. Def. Rate
+θW (a∗t+1,a
i,1t )
exp(a∗t+1
)︸ ︷︷ ︸Cond. Recovery
, (28)
qgov,1t = Et
[M$
t,t+1
]. (29)
Let logqi,seast denote the log seasoned corporate bond price averaged across firms. We define credit
spreads as the average log yield spread:
spreadnewt = −1
2logqcorp,new
t +12
logqgov,2t , (30)
spreadseast = −logqi,seas
t + logqgov,1t (31)
Note that these measures are not mechanically linked to the level of inflation expectations in the
nominal stochastic discount factor.
H. Capital Structure Choice
Firms choose leverage according to a standard tradeoff view of capital structure. We follow
Gourio (2013) in assuming that firms receive benefits χ > 1 for each dollar of debt issued. Eq-
uity holders of cohort t firms choose capital Kyt+1 and nominal liabilities B$
t subject to the budget
constraint:
Kyt+1 = St︸︷︷︸
Value of New Equity
+ χ × qcorp,newt︸ ︷︷ ︸
New Nominal Bond Price
× B$t . (32)
Higher χ increases the incentive to raise leverage. There is a debate whether tax benefits are suf-
ficiently large to explain observed leverage ratios (Graham (2000), Almeida and Philippon (2007)).
15

We interpret χ broadly to include more general benefits and costs of debt, such as constraining
managers from empire-building and reducing informational asymmetries (Jensen and Meckling
(1976), Myers (1977), Myers and Majluf (1984), Jensen (1986)).
Equity holders trade off the benefits of debt with expected bankruptcy costs. We assume that
debt investors only recover a constant fraction θ < 1 of firm value in bankruptcy, see also Leland
(1994). A lower recovery rate θ reduces the incentive to lever up. There exists an interior opti-
mal leverage ratio if bankruptcy costs are sufficiently large relative to debt benefits. We formally
assume that θχ < 1 (Gourio (2013)).
By imposing the resource constraint (5), we follow Gourio (2013) in assuming that bankruptcy
costs and debt benefits are redistributive and do not have a direct effect on output. This simplifying
assumption should not substantially affect the model results, as long as time variation in default
rates is small relative to aggregate output fluctuations.
We define the marginal default probability:
h(a∗t+2
)= H ′
(a∗t+2
). (33)
Equity holders equate the marginal benefit of raising another dollar of debt with the increase in
bankruptcy costs according to the first-order condition:
0 =−χ(1−θ)Et
(M$
t,t+2h(a∗t+2
))︸ ︷︷ ︸
Marginal Bankruptcy Cost
+(χ−1)Et
(M$
t,t+2(1−H
(a∗t+2
)))︸ ︷︷ ︸
Marginal Benefit of Debt
. (34)
16

Firms choose the optimal level of capital, yielding the first-order condition:
1 = Et[Mt,t+2RK
t+1RKt+2Ft+2
], (35)
Ft+2 = 1− (1−θχ)Ω(a∗t+2
)︸ ︷︷ ︸Bankruptcy Cost
+(χ−1)exp(a∗t+2
)(1−H
(a∗t+2
))︸ ︷︷ ︸Benefit of Debt
. (36)
The Euler equation (35) says that the expected discounted return on capital, adjusted for
bankruptcy costs and benefits of debt by the factor Ft+2, equals 1. Inflation affects the first-order
conditions (34) and (35) through the survival threshold a∗t+2. When inflation is more volatile or
more pro-cyclical, the default threshold becomes more volatile and marginal bankruptcy costs in-
crease. While equity holders do not incur any bankruptcy costs upon default, debt investors require
compensation for bankruptcy costs ex-ante, incentivizing firms to reduce leverage ratios.
II. Calibrated Model
A. Parameter Values and Model Moments
We show two model calibrations, which separately capture time-varying inflation volatility
and time-varying inflation cyclicality. Model 1 focuses on stochastic inflation volatility and holds
the correlation between inflation shocks and TFP shocks constant at 0. Model 2 holds inflation
volatility constant, but allows the inflation-TFP correlation to vary.
We focus on moderate inflation volatility to highlight the relevance of inflation risk for credit
spreads even in a stable inflation environment. In Model 1, the standard deviation of annual in-
flation expectation shocks switches between 0% and 2%. The higher volatility of 2% corresponds
approximately to the U.S. experience in the early 1980s, and is half as large as our estimate of
U.K. inflation volatility during the late 1970s. To focus on the impact of inflation volatility, we
17

set the inflation-TFP correlation to zero. Volatility states are persistent, consistent with a five-year
autoregressive coefficient for U.S. inflation volatility of 0.5. The volatility process spends about
two-thirds of its time in the low state.
In Model 2, we assume that the inflation-TFP correlation follows a symmetric process, switch-
ing between−0.6 and 0.6, within the range of our empirical estimates for the inflation-stock return
correlation in developed countries.10 We study the impact of inflation cyclicality with moderate
inflation uncertainty of 1% per annum (p.a). The average duration for each state is 15 years, con-
sistent with three different regimes over a forty-year period.
[TABLE I ABOUT HERE]
Parameter values are summarized in Table I. We face a tradeoff in choosing the length of the
time period. Five-year time periods imply that seasoned corporate bond durations are slightly
shorter than their empirical counterparts, and that firm leverage and investment are constant for
ten-year periods.11 We choose standard values for the capital share, depreciation, and the discount
rate (Cooley and Prescott (1995)). We choose a risk aversion of 10, the upper bound of plau-
sible coefficients of risk aversion considered by Mehra and Prescott (1985). We constrain trend
growth to be equal to average U.S. real GDP growth between 1970 and 2009. The recovery rate
in bankruptcy equals 40%, consistent with the empirical evidence in Altman (2006).12 The debt
benefit parameter is a free parameter, and we choose χ = 1.4 to generate empirically plausible
default rates. Almeida and Philippon (2007) calculate that tax benefits account for approximately
16% of the debt value, so our high benefits incorporate significant agency benefits of debt.
[TABLE II ABOUT HERE]
Table II reports calibrated asset price moments together with empirical U.S. moments from
1970 to 2009.13 The high volatility of TFP shocks and idiosyncratic shocks generate plausi-
18
ble levels of aggregate and idiosyncratic equity market volatility. We do not attempt to explain
the equity volatility puzzle (Shiller (1981), LeRoy and Porter (1981)), which can be resolved if
consumption and dividend growth contain a time-varying long-run component (e.g., Bansal and
Yaron (2004)), or if preferences induce persistent fluctuations in risk premia (e.g., Campbell and
Cochrane (1999)).
Unexpectedly low inflation also increases real off-balance sheet liabilities, such as defined ben-
efit pension plans, health care obligations, and operating leverage. Pension obligations were espe-
cially salient during the United Airlines bankruptcy negotiations in the 2000s (Maynard (2005)).
Jin, Merton, and Bodie (2006) argue that a firm’s equity risk reflects the risk of its pension plan.
Shivdasani and Stefanescu (2010) and Bartram (2012) calculate that consolidating post-retirement
benefits can increase leverage by about a third. We interpret model leverage of 41% broadly to
include off-balance sheet liabilities.
We compare the seasoned model credit spread to the average Moody’s Baa over Aaa log yield,
which is based on secondary market prices rather than prices at issuance. Recent papers have
argued that structural models of credit risk can only explain a small portion of empirical credit
spreads while matching historically low default rates (Huang and Huang (2012)). We obtain high
credit spreads with plausible default rates due to volatile TFP shocks and to high risk aversion.
Leverage ratios of model seasoned firms are heterogeneous across firms, and credit spreads are con-
vex in leverage ratios, so the cross-section of firms further raises average credit spreads (Bhamra,
Kuehn, and Strebulaev (2010a), Bhamra, Kuehn, and Strebulaev (2010b)).
Our model raises the question of why firms do not issue inflation-indexed debt. If bond issuance
in our sample countries is nominal by historical convention, it is plausible that inflation-indexed
corporate bond yields would contain a liquidity premium. Such a liquidity premium could capture
investors’ and issuers’ increased accounting and training expenses from holding both nominal and
19

indexed bonds at the same time. U.S. government inflation-indexed bond yields, first issued in
1997, initially contained a substantial liquidity premium of over 50-100 bps (Pflueger and Viceira
(2011)).
Our model is consistent with a nominal-only corporate bond market for plausible liquidity
premia. Consider the problem of an infinitely small firm, which can deviate from the nominal-only
equilibrium by issuing inflation-indexed bonds. In our calibrated model, such a firm finds it optimal
to continue issuing nominal debt as long as the liquidity premium in corporate inflation-indexed
bond yields is at least 29 bps. For the derivation of the optimality condition, see Supplementary
Appendix C.
B. Model Implications for Credit Spreads
[TABLE III ABOUT HERE]
Table III shows that calibrated credit spreads are highly sensitive to both inflation volatility
and the inflation-stock correlation, even for moderate levels of inflation volatility. We focus on
seasoned credit spreads, which take into account non-optimal and heterogeneous firm leverage
ratios and correspond most closely to empirical secondary market prices of corporate debt. We
estimate the following model regressions:
Model 1: spreadseast = λ
01 +λ
σπ
1 σπt +λ
σeq
1 σeqt +λ
DP1 DPseas
t +λeq1 req
t +λπ
1επt +η1,t ,
Model 2: spreadseast = λ
02 +λ
ρπ
2 ρπt +λ
σeq
2 σeqt +λ
DP2 DPseas
t +λeq2 req
t +λπ
2επt +η2,t .
(37)
We report means and standard deviations of regression coefficients from 500 simulated time se-
ries of length 100. The simulation length corresponds to approximately forty years of independent
bi-annual data from five countries. Since our empirical quarterly observations are likely correlated
20

over time and across countries, we have to exercise caution in relating the model standard errors to
empirical standard errors.14
A one percentage point increase in the standard deviation of annual inflation shocks leads to an
economically significant increase in credit spreads of 27 bps (Panel A). Credit spreads increase by
20 to 27 bps as the inflation-stock return correlation increases by 100 percentage points. As we go
from column (1) to column (2) in Panel A, we add inflation volatility as an explanatory variable,
and the regression R2 increases by four percentage points. Adding the inflation-stock correlation
in Panel B similarly increases the regression R2 by two percentage points.
Equity returns, inflation shocks, equity volatility, and the dividend-price ratio enter with the
expected signs in Table III. Capital structure adjustments are slow and therefore high equity returns
and high inflation shocks decrease seasoned firms’ leverage and credit risk. Model real interest
rates reflect time-varying expected consumption growth and time-varying precautionary savings,
and are highly correlated with the dividend-price ratio and equity volatility, so controlling for real
interest rates would not explain any additional variation in model credit spreads.
Our right-hand side variables can jointly account for over 80% of the variation in credit spreads,
which is unsurprising because the simulated model credit spreads are a function of real shocks,
nominal shocks, and the inflation risk regime. We would not expect an equally high R2 in our
empirical results, especially if empirical nominal and real shocks were imperfectly measured.
[FIGURE 4 ABOUT HERE]
Intuitively, inflation risk matters most when stock returns are low or when inflation is unexpect-
edly low. Figure 4 shows that inflation volatility and the inflation-TFP correlation increase credit
spreads especially strongly when stock returns and inflation surprises are low.15 The asymmetry in
Figure 4 is large relative to the average effect of inflation risk on credit spreads. For instance, the
21

difference between high inflation volatility credit spreads and low inflation volatility credit spreads
is 133 bps larger in the lowest stock return quintile than in the middle stock return quintile.
III. Empirical Inflation Risk and Corporate Bonds
A. Data Description
We compute credit spreads as the continuously compounded (or log) corporate bond index yield
over the log default-free yield, analogously to model corporate bond spreads. This credit spread
also equals the log of (one plus) the proportional credit spread, and is therefore not mechanically
linked to inflation expectations.
U.S. Treasury yields may not equal the risk-free rate due to their benchmark status in worldwide
financial markets. Following authors such as Chen, Collin-Dufresne, and Goldstein (2009), we use
the Moody’s Baa over Aaa log yield spread as a measure of credit risk in long-term U.S corporate
bonds. Subtracting the Aaa log yield should also help adjust for tax and callability effects on
corporate bond yields, if those are similar for corporate bonds with different ratings. Historical
defaults of Aaa rated bonds have been extremely rare, but any default component in Aaa bond
yields should bias us against finding an empirical result. Our results become even stronger using
the Baa-Treasury spread, as shown in Table B.IV in the Supplementary Appendix. Non-U.S. credit
spreads are computed in excess of a duration-matched government bond yield.
We obtain corporate bond yield indexes, government bond yields, GDP growth, stock returns,
and CPI inflation from Global Financial Data (GFD).16
We obtain empirical proxies for each country’s standard deviation of equity returns, standard
deviation of inflation surprises, and inflation-stock correlation from a rolling three-year backward-
looking window of quarterly log real stock return surprises and log inflation surprises. Unexpected
22

log inflation is the residual from a regression of quarterly log inflation onto its own four lags, the
lagged log T-bill, and seasonal dummies. The quarterly log real stock return shock is the residual
from regressing the quarterly log real stock return onto its own first lag. Real GDP growth surprises
are estimated analogously to inflation surprises by regressing log real GDP growth onto its own
four lags, the lagged log T-bill, and seasonal dummies.
Our baseline inflation forecasting regression follows Campbell, Sunderam, and Viceira (2013)
and Campbell and Shiller (1996). A number of different inflation forecasting relations have been
proposed in the literature. Atkeson and Ohanian (2001) argue that inflation over the past year
outperforms Phillips curve-based inflation forecasts, which also include a measure of real activity,
in the U.S. after 1984. We verify in the Supplementary Appendix Table B.V that our empirical
results are robust to including lagged log real stock returns and to excluding the nominal T-bill;
the results are also robust to rolling forecasts, the Atkeson and Ohanian (2001) model, and a wide
range of reasonable inflation forecasting models considered in Stock and Watson (2007). We use
consumer prices to measure inflation risk, but our results are robust to using a producer price index.
We control for lagged stock returns, real GDP growth, unemployment, and lagged inflation sur-
prises. We explicitly control for equal-weighted market leverage ratios of non-financial Compustat
firms over a shorter time period.17
We control for the volatility of real quarterly stock returns and the volatility of real quarterly
GDP growth. We also control for idiosyncratic stock return volatility, when available. We follow
Campbell, Lettau, Malkiel, and Xu (2001) in decomposing individual daily stock returns into a
market component, an industry component, and a firm component. Idiosyncratic volatility is cal-
culated as the volatility of the firm component over the past quarter, averaged over all individual
stocks.18
In our model the dividend-price ratio helps capture the time-varying risk of equity returns,
23

while in a model of time-varying risk aversion, such as in Campbell and Cochrane (1999), it serves
as a proxy for aggregate risk aversion. We therefore control for the dividend-price ratio from
Datastream.19
Campbell, Sunderam, and Viceira (2013) have argued that the comovement between nomi-
nal government bond returns and stock returns reflects time-varying inflation risk. If nominal
long-term bond yields reflect long-term inflation expectations, the correlation between changes in
nominal government log yields and log real stock returns should reflect investors’ perception of
inflation cyclicality. Similarly, the volatility of changes in nominal government log yields should
reflect inflation volatility. However, bond volatility and the bond-stock correlation may also reflect
real interest rate risk, and it is therefore important to control for them. We construct the bond-stock
correlation and bond volatility using daily or weekly government bond and stock returns over the
past quarter, using the highest frequency available.20
The difference between nominal and inflation-indexed bond yields, or breakeven inflation, is
the inflation rate that would equalize ex-post returns on nominal and inflation-indexed bonds. If
inflation risk and liquidity components in breakeven change only slowly over time, the correlation
between changes in breakeven and stock returns should give a high-frequency, financial markets-
based measure of the inflation-stock correlation. Indeed, Figure B.3 in the Supplementary Ap-
pendix shows that the nominal bond-stock correlation tracks the breakeven-stock correlation very
closely over the available samples 1999 to 2010 in the U.S. and 1985 to 2010 in the U.K, sug-
gesting that much of the time-variation in the nominal bond-stock correlation reflects time-varying
inflation risk.
B. Summary Statistics
[TABLE IV ABOUT HERE]
24

Summary statistics in Table IV reveal that both the volatility and the cyclicality of inflation
have varied substantially over time in each country. Average annualized inflation volatility ranges
from 101 bps for Germany to 161 bps for the U.K., consistent with the average inflation volatility
in our calibrated model. Inflation volatility displays significant time variation within each country
with standard deviations around the U.S. value of 58 bps. Inflation volatility in our sample reached
a peak of 412 bps in the U.K. during the 1970s, which exceeds the largest inflation volatility in our
calibrated model by a factor of two.
The inflation-stock correlation, our measure of the slope of the Phillips curve, is negative or
zero on average in every country. Its time variation within each country is substantial, with standard
deviations close to the U.S. value of 0.34.
Credit spreads average around 100 bps and have within country standard deviations between 32
bps and 98 bps. Rare negative values are most likely due to measurement error. The correlations
of international credit spreads with U.S. credit spreads, shown in Table B.2 in the Supplementary
Appendix, range from -0.17 for Japan to 0.71 for Australia, so international credit spreads are not
perfectly correlated.
[FIGURE 5 ABOUT HERE]
Figure 5 shows the clear time-series comovement between international credit spreads and
inflation volatility in each country. Figure 5 indicates that when a country has higher inflation
volatility, it also has higher credit spreads. U.S. inflation volatility and credit spreads were both
high in the 1970s and 1980s. Both inflation volatility and credit spreads were even more elevated
in the U.K. during the same period.
[FIGURE 6 ABOUT HERE]
25

Figure 6 visually illustrates the positive relation between international credit spreads and the
inflation-stock correlation. The U.S. inflation stock correlation was at an all-time high at the end of
2010, indicating procylical inflation. At the same time, credit spreads peaked during the financial
crisis. In contrast, the U.S. inflation-stock return correlation was mostly negative during the 1970s
and 1980s, indicating that supply shocks and shifting inflation expectations moved inflation and
real outcomes in opposite directions.21
C. Benchmark Results
Our main empirical tests in Table V proceed as follows. We first report a pooled regression of
credit spreads against business cycle controls.22 We then add inflation risk proxies, equity volatil-
ity, and the dividend-price ratio. Finally, we add time fixed effects and investigate the robustness
of our results to additional controls and sub-periods.
We estimate a pooled regression of the country i quarter t credit spread, spreadi,t , on country
fixed effects, λ0i , measures of inflation volatility, σπ
i,t , the inflation-stock correlation, ρπi,t , equity
volatility, σeqi,t , the dividend yield, DPi,t , and a vector of control variables, Xi,t :
spreadi,t = λ0i +λ
σπ
σπi,t +λ
ρπ
ρπi,t +λ
σeqσ
eqi,t +λ
DPDPi,t +Λ×Xi,t +ηi,t . (38)
The standard errors take into account potential cross-country correlation, heteroskedasticity, and
serial autocorrelation. We use Driscoll and Kraay (1998)’s extension of Newey and West (1987)
standard errors with 16 lags, as implemented by Hoechle (2007). Corporate bond markets vary
significantly across countries. Our regressions therefore contain country fixed effects.23
[TABLE V ABOUT HERE]
Table V shows that inflation volatility and the inflation-stock correlation are important in
26

explaining the time- and cross-country variation in credit spreads. Inflation volatility and the
inflation-stock correlation both enter with positive, large, and significant coefficients, which are
close to the model coefficients in Table III.
We note the following results in Table V. First, inflation volatility and the inflation-stock cor-
relation jointly increase the residual R2 by nine percentage points relative to a regression of credit
spreads onto business cycle controls. In comparison, equity volatility and the dividend-price ratio
raise the residual R2 only by three percentage points. Including inflation volatility and the inflation-
stock correlation in addition to equity volatility and the dividend-price ratio raises the residual R2
by eight percentage points. Taken together, the regressions in columns (1) through (5) show that
inflation risk can explain at least as much variation in credit spreads as equity volatility and the
dividend-price ratio.
Second, our benchmark estimation in column (5) shows that a 58 bps move in inflation volatil-
ity, or one standard deviation in U.S. inflation volatility, is associated with a 14 bps increase in
empirical credit spreads. A one standard deviation move in the inflation-stock correlation (34
percentage points) is associated with a 14 bps increase in credit spreads. The magnitudes are eco-
nomically meaningful relative to average credit spreads of around 100 bps. The empirical effect
of inflation volatility on credit spreads is extremely close to the theoretical magnitude in Table III.
The empirical slope coefficient of the inflation-stock correlation is somewhat larger, but within two
standard deviations of the theoretical slopes in Table III.
The sensitivities of credit risk with respect to real growth shocks and inflation shocks play
crucial roles in our proposed mechanism. We include inflation surprises to disentangle the effect
of news about the level of inflation and inflation risk, which is especially important if inflation
surprises and the second moments of inflation are correlated. Quarterly and three-year inflation
shocks enter negatively, and in some specifications significantly, with magnitudes comparable to
27

model slopes in Table III. Our measures of inflation surprises could plausibly contain larger mea-
surement error than the second moments of inflation if the timing of inflation surprises is impre-
cisely measured. Quarterly real GDP growth enters with a large and negative coefficient, but the
coefficients on real growth variables need to be interpreted with caution because of collinearity
between different real activity controls.
The coefficients on inflation volatility and the inflation-stock correlation are remarkably stable
across different specifications. Including time fixed effects in column (6) shows that the results are
not driven by any global omitted variable, such as global real interest rate risk, global growth risk,
or global time-varying liquidity. From our theoretical analysis, we would expect that inflation risk
should have especially large effects on credit spreads during crises. Excluding the financial crisis in
column (7), we find that the inflation volatility and inflation-stock correlation coefficients decrease
by about 35% relative to their full-sample values, but that they remain positive and statistically
significant. In column (8) we find that GDP volatility does not enter significantly in addition to our
main control for uncertainty about long-term real asset values, equity volatility, and other control
variables.
We include the slope of the yield curve and the nominal T-bill in column (8), and find that
our benchmark results are unchanged. Empirical credit spread indexes contain both callable and
non-callable bonds. Duffee (1998) shows that callability features can substantially affect credit
spreads, and that the T-bill and the slope of the nominal yield curve can help capture the value
of the call option. To the extent that controlling for the slope of the yield curve and the nominal
T-bill captures the value of the corporate bond call features, column (8) indicates that our empirical
results are not driven by the value of corporate bond call options.
Nominal government bond yields should reflect inflation expectations, inflation risk premia,
and real interest rates. The results in column (8) therefore indicate that corporate bond yields price
28

inflation risk above and beyond the effect of inflation risk on nominal government bond yields.
Interestingly, the slope coefficients for the log T-bill and log yield curve slope are within two stan-
dard deviations of the theoretical inflation shock coefficient in Table III, which is what we would
expect if inflation expectations are an important determinant of long-term nominal government
bond yields.
In column (9) we include as additional control variables idiosyncratic equity volatility, market
leverage, the nominal government bond volatility, and the bond-stock correlation over a shorter
sample period starting in 1989. The bond-stock correlation and the bond volatility enter positively
and significantly with large regression coefficients, while inflation volatility and the inflation-stock
correlation remain statistically significant. The bond-stock correlation and the bond volatility con-
trol for real interest rate risk. However, to the extent that these variables reflect inflation risk, we
interpret the results in column (9) as additional evidence that inflation risk is priced into credit
spreads.
Having estimated the pooled regression (38) in an international panel of forty years of quarterly
data, we now estimate the same relation for the U.S. time series of credit spreads. This time series
is likely to be especially familiar to readers, and we can include additional liquidity controls for
the U.S. Campbell and Taksler (2003) have argued forcefully that idiosyncratic equity volatility is
an important determinant of credit spreads and we control for it in our U.S. time series regressions
throughout.
[TABLE VI ABOUT HERE]
Table VI shows that U.S. credit spreads are clearly related to inflation risk, although the smaller
sample size reduces the statistical power relative to Table V. Inflation volatility enters with a posi-
tive and significant coefficient, which is slightly larger than the comparable coefficient in the pooled
29

international regression. The inflation-stock correlation coefficient is positive, but not significant
for the full time series. However, for the pre-crisis sub-sample it is positive and indistinguishable
from the model coefficient in Table III. The different result for the full sample could potentially
reflect a small number of observations during the financial crisis when measurement error was ar-
guably substantial. Going from column (4) to column (5) shows that inflation risk increases the
regression R2 from 61% to 73%.
Given that our time series includes the financial crisis of 2008 to 2009, it is important to control
for time-varying corporate bond liquidity using several liquidity proxies. We follow Garleanu and
Pedersen (2011) by including the three-month Eurodollar over T-bill spread as a liquidity control.
Garleanu and Pedersen (2011) argue that funding constraints and margin requirements can create a
price wedge between assets with identical cash flows but different margin requirements. Garleanu
and Pedersen (2011) predict that the Eurodollar over T-bill spread and the price gap between credit
default swaps and corporate bonds should be tightly linked and provide empirical evidence in the
time series and in the cross-section. Intuitively, larger corporate bond mispricings can persist when
hedge funds and other arbitrageurs face tight funding constraints, as proxied by the Eurodollar
over T-bill spread. Using the Eurodollar over T-bill spread as a corporate bond liquidity proxy is
also consistent with previous work on the determinants of corporate bond spreads (Campbell and
Taksler (2003)).24
We also include the off-the-run on-the-run U.S. nominal Treasury yield spread, which reflects
liquidity in the U.S. Treasury market (Krishnamurthy (2002)). We think of the off-the-run spread as
capturing a liquidity component that is common across U.S. Treasury and corporate bond markets,
consistent with the evidence in Ericsson and Renault (2006).25 Both the Eurodollar over T-bill
spread and the off-the-run spread enter with positive coefficients, as we would expect, but they
leave the inflation volatility coefficient unchanged.
30

[FIGURE 7 ABOUT HERE]
We next explore the asymmetric model implications: the impact of inflation risk on credit
spreads should be especially strong when either real stock returns or inflation surprises are low.
Figure 7 shows empirical analogues to the theoretical relations in Figure 4, using a non-parametric
approach.
We construct the top left panel in Figure 7 by splitting observations in each country into quin-
tiles of real stock returns and into equal-sized subsamples for high and low inflation volatility. We
sort by three-year real stock returns for consistency with the construction of the inflation risk vari-
ables. The panel averages credit spreads across all countries within each inflation risk regime and
quintile and shows credit spreads relative to the middle quintile credit spread. The other panels are
constructed similarly.
The empirical relationships between credit spreads, stock returns, and inflation shocks in Figure
7 bear striking resemblance to the theoretical relationships in Figure 4. The top left panel in Figure
7 shows that the gap between credit spreads in the high and low inflation volatility regimes widens
by 30 bps in the lowest stock return quintile, indicating a larger put option in defaultable bonds
when inflation uncertainty is greater. This number is smaller, but a substantial fraction of the
theoretical analogue in Figure 4 of 133 bps.
The top right panel of Figure 7 similarly suggests that the impact of inflation volatility on credit
spreads is larger when inflation is surprisingly low, even if the largest difference in credit spreads
obtains in the second-lowest quintile of inflation shocks rather than the lowest.
In our benchmark empirical results, a one standard deviation move in either inflation volatility
or the inflation-stock correlation is associated with a credit spread increase of 14 bps. In com-
parison, the empirical magnitudes in Figure 7 are large. However, the magnitudes in Figure 7 are
smaller than the theoretical magnitudes in Figure 4. Besides measurement error, one reason is that
31

in Figure 7 we average the above median and below median inflation risk regimes, while in Figure
4 we compare credit spreads at the largest and the smallest values of inflation risk.
Further robustness checks, including individual country regressions, different inflation indexes,
inflation forecasting models, and HP filtered explanatory variables are reported in the Supplemen-
tary Appendix. Table B.IV in the Supplementary Appendix in particular shows that our bench-
mark results in Table V become stronger when we compute the U.S. credit spread with respect to
a duration-matched government bond log yield instead of the Moody’s long-term Aaa log yield.
D. Expected Credit Losses and Default Risk Premia
The mechanism we propose predicts that both inflation volatility and the inflation-stock corre-
lation raise expected losses from bond defaults. An increase in the inflation-stock correlation also
increases the likelihood that credit losses will occur in stock-market downturns, when marginal
utility of risk-averse investors is likely to be high. An increase in the inflation-stock correlation
should therefore raise the required excess return on corporate bonds over default-free bonds and
the default risk premium in corporate bond yields. In contrast, an increase in inflation uncertainty
may raise defaults and credit losses in both high and low marginal utility states, such as in the
contingent claim payoff profile depicted in Figure 2B. Therefore, an increase in inflation volatility
does not need to give rise to a default risk premium.
We estimate the effect of inflation volatility and the inflation-stock correlation on the n-year
credit loss rate lossUS,t→t+n, defined as the product of default rates and loss given default.26 Table
VII regresses annual credit loss rates on inflation volatility, the inflation-stock correlation, and
32
control variables:
lossUS,t→t+n︸ ︷︷ ︸Loss rate
= λ0US +λ
σπ
σπUS,t +λ
ρπ
ρπUS,t +λ
σeqσ
eqUS,t +λ
DPDPUS,t +ΛXUS,t +ηUS,t . (39)
[TABLE VII ABOUT HERE]
Columns (1) through (5) of Table VII show that both inflation volatility and the inflation-stock
correlation predict credit losses positively and significantly over the next two through five years
while controlling for idiosyncratic equity volatility, the dividend-price ratio, inflation surprises,
stock return surprises, GDP growth, and unemployment. The inflation volatility and inflation-
stock correlation coefficients are positive at all horizons and largest at the three-year forecasting
horizon. A one standard deviation move in U.S. inflation volatility (58 bps) predicts a 10 bps
increase in the annual credit loss rate over the next five years. This magnitude is statistically
indistinguishable from our baseline results on credit spreads, indicating that investors accurately
price expected credit losses due to increased inflation uncertainty. A one standard deviation move
in the U.S. inflation-stock correlation (34 percentage points) predicts a 6 bps increase in the annual
credit loss rate over the next five years. This magnitude is about half the empirical effect of the
inflation-stock correlation on credit spreads documented in Table V.
Columns (6) through (10) show that including a comprehensive set of control variables leaves
the inflation volatility and inflation-stock correlation coefficients unaffected. Inflation volatility
remains a strongly significant forecaster of credit losses at the three- and four-year horizons, while
the inflation-stock correlation remains significant at the three-year forecasting horizon. Column
(10) shows that at the five-year forecasting horizon, inflation volatility and the inflation-stock cor-
relation remain marginally significant while none of the additional control variables enters signif-
icantly. Supplementary Appendix Table B.VIII shows that the results are robust to using default
33
rates.
[TABLE VIII ABOUT HERE]
Table VIII predicts U.S. long-term corporate bond log returns in excess of long-term govern-
ment bond log returns using lagged inflation volatility, the lagged inflation-stock correlation, and
control variables.27 We estimate the regression:
retcorpUS,t→t+n− retgov
US,t→t+n = λ0US +λ
σπ
σπUS,t +λ
ρπ
ρπUS,t
+λσeq
σeqUS,t +λ
DPDPUS,t +Λ×XUS,t +ηUS,t . (40)
Table VIII shows that a one standard deviation move in the inflation-stock correlation (34 percent-
age points) predicts an increase in corporate bond excess returns of 51 bps over the next quarter
and of 126 bps over the next five years. On the other hand, Table VIII provides no evidence that
inflation volatility predicts corporate bond excess returns.
A rough calculation allows us to compare the magnitudes in Table VIII to those in Table
V. If the duration of the Ibbotson long-term corporate bond index is comparable to that of the
Moody’s long-term corporate bond index (10.7 years), then a one standard deviation move in
the U.S. inflation-stock correlation (34 percentage points) corresponds to an increase of (0.34×
370.6/10.7) bps = 12 bps in the five-year corporate default risk yield premium.
To summarize, the empirical results on credit losses and corporate bond risk premia indicate
that the effect of inflation volatility on corporate bond spreads acts largely through expected credit
losses. On the other hand, the inflation-stock correlation affects corporate bond spreads through
both the expected credit loss and the default risk channels and both channels are similarly quanti-
tatively important.
34

E. Inflation-Indexed Corporate Bonds in Israel
Theory predicts that corporate bond spreads and inflation risk should be unrelated in financial
markets with conventionally inflation-indexed liabilities. We study this prediction using Israeli data
for the period 2000 to 2010. Israeli government and corporate bonds have conventionally been
inflation-indexed since the 1950s (Koninsky (1997)) providing an ideal setting for this placebo
test.28 Moreover, Israeli inflation was low and comparable to the U.S. during 2000 to 2010, so
differing findings cannot be attributed to fundamentally different inflation environments.
We construct an index of Israeli corporate bond spreads over maturity-matched government
bonds for 2000.Q1 to 2010.Q4. Individual bond yields are from Bloomberg and a proprietary data
source. We include non-convertible bonds issued by non-financial firms with five to eleven years
remaining to maturity. All included corporate bonds are rated A- or higher by the rating agency
S&P Maalot or A3 or higher by the rating agency Midroog. Maturity-matched government bond
yields are from the Bank of Israel. For a detailed data description see Supplementary Appendix
C.4.
In contrast to the findings for nominal corporate bonds, we find no evidence that inflation-
indexed corporate bond spreads increase in either inflation volatility or the inflation-stock corre-
lation. On the contrary, Israeli inflation-indexed corporate bond spreads increased from 54 bps
to 146 bps over the sample while inflation volatility decreased from 283 bps to 155 bps. At the
same time, daily turnover in corporate bonds increased almost tenfold, so liquidity is not a likely
explanation for the increase in credit spreads.29
We test the relation between Israeli inflation-indexed corporate bond spreads and inflation
volatility and the inflation-stock correlation analogously to the baseline empirical results in Ta-
ble V. Table IX regresses Israeli inflation-indexed corporate log yield spreads onto inflation risk
variables and controls as in (38). Due to the limited sample size, we restrict the set of control
35

variables to those included in the model regressions in Table III, and we use Newey-West standard
errors with four lags. Including a reduced number of control variables is conservative in that it
might bias us against finding zero slope coefficients.
[TABLE IX ABOUT HERE]
Table IX column (5) shows that inflation volatility and the inflation-stock correlation do not
enter significantly while controlling for equity volatility, the dividend-price ratio, and inflation and
stock return surprises. Inflation volatility enters negatively both for the full sample and for a pre-
crisis sample shown in column (6). The inflation-stock correlation’s slope estimate is positive but
insignificant for the full sample, and it becomes negative for the pre-crisis sample.
While inflation risk does not appear to drive inflation-indexed corporate bond spreads, Israel
as a small open economy is especially exposed to international macroeconomic risks. The Euro-
pean debt crisis was likely an important determinant of Israeli corporate bond spreads during our
sample, as evidenced by the fact that the Israeli inflation-indexed corporate bond spread is 68%
correlated with the log yield spread of 10 year Italian government bonds over German government
bonds.30 Table IX column (7) shows that the regression R2 increases by 15 percentage points and
both the inflation volatility and the inflation-stock correlation enter with negative and insignificant
coefficients when we include the Italy-Germany sovereign log yield spread. The role of global risk
factors for Israeli corporate bonds underscores the importance of controlling for such factors in our
benchmark empirical results. Table V shows that results for nominal corporate bond spreads are
robust to flexibly controlling for time-varying global risks with time fixed effects.
Taken together, we find no evidence that Israeli inflation-indexed corporate bond spreads in-
crease in either inflation volatility or the inflation-stock correlation. The evidence from Israeli
inflation-indexed corporate bonds supports the view that time-varying risk of debt deflation, rather
36
than omitted variables, drives the positive empirical relation between inflation risk and nominal
corporate bond spreads in our benchmark results.
IV. Conclusion
While during the 1970s and 1980s investors and policy makers were concerned about stagfla-
tion, the two most recent U.S. recessions have been accompanied by low inflation. This paper
argues that uncertainty about the long-run price level and the changing relationship of inflation
with the business cycle are major macroeconomic determinants of corporate bond spreads. Recent
high inflation cyclicality can help understand the high level of corporate bond spreads.
In a real business cycle model with time-varying inflation risk, inflation persistence generates
large effects of inflation risk on credit spreads. Using data on international corporate bond spreads,
we provide new evidence that corporate bond investors price the time-varying risk of debt deflation.
Our results have broader implications for the macroeconomic determinants of optimal capital
structure of firms and households. While our model only allows for one dimension of capital
structure choice, in reality firms and households might adjust to changing inflation risk along
a rich number of dimensions. Firms could issue inflation-indexed corporate debt, floating-rate
debt, callable debt, or shorter term debt in response to inflation risk. However, each of these
adjustments is likely to come at a cost, such as rollover risk (He and Xiong (2012), Acharya, Gale,
and Yorulmazer (2011)), short-term variability in real payments (Campbell and Cocco (2003)), or
agency costs (Bodie and Taggart (1978)).
The results in this paper highlight the importance of better understanding the macroeconomic
and monetary policy determinants of bond and inflation risks. A decomposition of time-varying
inflation risk into macroeconomic shocks, such as cost push shocks and shocks to aggregate de-
37

mand, and time-varying monetary policy, could be of particular interest to central banks around
the world.
From a policy point of view, our results indicate that policy makers should take the possibil-
ity of debt deflation as seriously as investors appear to do so. Concerns about debt deflation are
especially relevant given the potentially important macroeconomic feedback effects of debt defla-
tion (Bernanke and Gertler (1989), Kiyotaki and Moore (1997)) and renewed concerns about a
deflationary drop in aggregate demand in the U.S.
38

References
Acharya, Viral V., Douglas Gale, and Tanju Yorulmazer, 2011, Rollover risk and market freezes,
Journal of Finance 66, 1177–1209.
Almeida, Heitor, and Thomas Philippon, 2007, The risk-adjusted cost of financial distress, Journal
of Finance 62, 2557–2586.
Altman, Edward, 2006, Default recovery rates and lgd in credit risk modeling and practice: An
updated review of the literature and empirical evidence, Mimeo, New York University.
Atkeson, Andrew, and L. E. Ohanian, 2001, Are Phillips curves useful for forecasting inflation?,
Federal Reserve Bank of Minneapolis Quarterly Review 25, 2–11.
Baele, Lieven, G. Bekaert, and Koen Inghelbrecht, 2010, The determinants of stock and bond
return comovements, Review of Financial Studies 23, 2374–2428.
Baker, Malcolm, and Jeffrey Wurgler, 2002, Market timing and capital structure, Journal of Fi-
nance 57, 1–32.
Ball, Laurence, and Stephen G. Cecchetti, 1990, Inflation and uncertainty at long and short hori-
zons, Brookings Papers on Economic Activity 1, 215–254.
Bansal, Ravi, and Amir Yaron, 2004, Risks for the long run: A potential resolution of asset pricing
puzzles, Journal of Finance 59, 1481–1509.
Bartram, Sohnke M., 2012, Post-retirement benefit plans, leverage, and real investment, Mimeo,
Warwick Business School.
Bernanke, Ben, and Mark Gertler, 1989, Agency costs, net worth, and business fluctuations, Amer-
ican Economic Review 79, 14–31.
39
Bhamra, Harjoat S., Adlai J. Fisher, and Lars-Alexander Kuehn, 2011, Monetary policy and cor-
porate default, Journal of Monetary Economics 58, 480–494.
Bhamra, Harjoat S., Lars-Alexander Kuehn, and Ilya A. Strebulaev, 2010a, The levered equity risk
premium and credit spreads: A unified framework, Review of Financial Studies 23, 645–703.
Bhamra, Harjoat S., Lars-Alexander Kuehn, and Ilya A. Strebulaev, 2010b, Long run risks, credit
markets, and financial structure, American Economic Review: Papers and Proceedings 100,
547–551.
Black, Fischer, and Myron Scholes, 1973, The pricing of options and corporate liabilities, Journal
of Political Economy 81, 637–654.
Bodie, Zvi, and Robert A. Taggart, 1978, Future investment opportunities and the value of the call
provision on a bond, Journal of Finance 33, 1187–1200.
Campbell, John Y., and Joao F. Cocco, 2003, Household risk management and optimal mortgage
choice, Quarterly Journal of Economics 118, 1449–1494.
Campbell, John Y., and John H. Cochrane, 1999, By force of habit: A consumption-based expla-
nation of aggregate stock market behavior, Journal of Political Economy 107, 205–251.
Campbell, John Y., Martin Lettau, Burton G. Malkiel, and Yexiao Xu, 2001, Have individual stocks
become more volatile? An empirical exploration of idiosyncratic risk, Journal of Finance 56,
1–43.
Campbell, John Y., Andrew W. Lo, and A. Craig MacKinlay, 1997, The Econometrics of Financial
Markets (Princeton University Press, Princeton, New Jersey).
40

Campbell, John Y., and Robert J. Shiller, 1996, A scorecard for indexed government debt, in Ben S.
Bernanke, and Julio Rotemberg, ed.: National Bureau of Economic Research Macroeconomics
Annual 1996 (MIT Press, Cambridge, MA).
Campbell, John Y., Adi Sunderam, and Luis M. Viceira, 2013, Inflation bets or deflation hedges?
The changing risks of nominal bonds, Mimeo, Harvard University.
Campbell, John Y., and Glen B. Taksler, 2003, Equity volatility and corporate bond yields, Journal
of Finance 58, 2321–2349.
Chen, Long, Pierre Collin-Dufresne, and Robert S. Goldstein, 2009, On the relation between the
credit spread puzzle and the equity premium puzzle, Review of Financial Studies 22, 3367–
3409.
Christensen, Jens H. E., Jose A. Lopez, and Glenn D. Rudebusch, 2010, Inflation expectations and
risk premiums in an arbitrage-free model of nominal and real bond yields, Journal of Money,
Credit and Banking 42, 143–178.
Collin-Dufresne, Pierre, R. S. Goldstein, and J. S. Martin, 2001, The determinants of credit spread
changes, Journal of Finance 56, 2177–2207.
Cooley, Thomas F., and Edward C. Prescott, 1995, Frontiers of Business Cycle Research (Princeton
University Press, Princeton, New Jersey).
Coval, Joshua D., Jakub W. Jurek, and Erik Stafford, 2009, Economic catastrophe bonds, American
Economic Review 99, 628–666.
41
Cremers, K. J. Martijn, Joost Driessen, and Pascal Maenhout, 2008, Explaining the level of credit
spreads: Option-implied jump risk premia in a firm value model, Review of Financial Studies
21, 2209–2242.
D’Amico, Stefania, Don H. Kim, and Min Wei, 2009, Tips from TIPS: The informational content
of Treasury Inflation-Protected Security prices, Federal Reserve Board Finance and Economics
Discussion Series No. 2010-19.
David, Alexander, and Pietro Veronesi, 2013, What ties return volatilities to price valuations and
fundamentals?, Journal of Political Economy 121, 682–746.
De Bondt, Gabe, and Jung-Duk Lichtenberger, 2003, The Euro area corporate bond market: Where
do we stand since the introduction of the Euro?, European Business Organization Law Review
4, 517–539.
De Fiore, Fiorella, Pedro Teles, and Oreste Tristani, 2011, Monetary policy and the financing of
firms, American Economic Journal: Macroeconomics 3, 112–142.
Driscoll, John C., and Aart C. Kraay, 1998, Consistent covariance matrix estimation with spatially
dependent panel data, Review of Economics and Statistics 80, 549–560.
Duffee, Gregory R., 1998, The relation between Treasury yields and corporate bond yield spreads,
Journal of Finance 53, 2225–2241.
Duffie, Darrell, and Kenneth J. Singleton, 1997, An econometric model of the term structure of
interest-rate swap yields, Journal of Finance 52, 1287–1321.
42

Engelberg, Joseph, Charles F. Manski, and Jared Williams, 2009, Comparing the point predictions
and subjective probability distributions of professional forecasters, Journal of Business and
Economic Statistics 27, 30–41.
Engle, Robert F., 1982, Autoregressive conditional heteroskedasticity with estimates of the vari-
ance of united kingdom inflation, Econometrica 50, 987–1007.
Ericsson, Jan, and Olivier Renault, 2006, Liquidity and credit risk, Journal of Finance 61, 2219–
2250.
Feldhutter, Peter, and David Lando, 2008, Decomposing swap spreads, Journal of Financial Eco-
nomics 88, 375–405.
Ferson, Wayne E., and Campbell R. Harvey, 1991, The variation of economic risk premiums,
Journal of Political Economy 99, 385–415.
Fisher, Irving, 1933, The debt-deflation theory of great depressions, Econometrica 1, 337–357.
Fuhrer, Jeffrey C., 1997, The (un)importance of forward-looking behavior in price specifications,
Journal of Money, Credit, and Banking 29, 338–350.
Galati, Gabriele, and Kostas Tsatsaronis, 2003, The impact of the Euro on Europe’s financial
markets, Financial Markets, Institutions and Instruments 12, 165–222.
Garleanu, Nicolae, and Lasse Heje Pedersen, 2011, Margin-based asset pricing and deviations
from the law of one price, Review of Financial Studies 24, 1980–2022.
Glover, Brent, 2011, The expected cost of default, Mimeo, Carnegie Mellon University.
Goldstein, Robert, Nengjiu Ju, and Hayne Leland, 2001, An EBIT-based model of dynamic capital
structure, Journal of Business 74, 483–512.
43

Gomes, Joao F., and Lukas Schmid, 2010, Levered returns, Journal of Finance 65, 467–494.
Gourio, Francois, 2013, Credit risk and disaster risk, American Economic Journal: Macroeco-
nomics 5, 5(3): 1–34.
Graham, John R., 2000, How big are the tax benefits of debt?, Journal of Finance 60, 1901–1941.
Grinblatt, Mark, 2001, An analytical solution for interest rate swap spreads, International Review
of Finance 2, 113–149.
Gurkaynak, Refet S., Brian Sack, and Jonathan H. Wright, 2007, The U.S. Treasury yield curve:
1961 to the present, Journal of Monetary Economics 54, 2291–2304.
Hackbarth, Dirk, Jianjun Miao, and Erwan Morellec, 2006, Capital structure, credit risk, and
macroeconomic conditions, Journal of Financial Economics 82, 519–550.
Hattori, Masazumi, Koji Koyama, and Tatsuya Yonetani, 2001, Analysis of credit spread in Japan’s
corporate bond market, Bank for International Settlements Papers No. 5.
Haubrich, Joseph G., George G. Pennacchi, and Peter H. Ritchken, 2012, Inflation expectations,
real rates, and risk premia: Evidence from inflation swaps, Review of Financial Studies 25,
1588–1629.
He, Zhiguo, and Wei Xiong, 2012, Rollover risk and credit risk, Journal of Finance 67, 391–430.
Hoechle, Daniel, 2007, Robust standard errors for panel regressions with cross-sectional depen-
dence, Stata Journal 7, 281–312.
Huang, Jing-Zhi, and Ming Huang, 2012, How much of the corporate-Treasury yield spread is due
to credit risk?, Review of Asset Pricing Studies 2, 153–202.
44

Jensen, Michael C., 1986, Agency costs of free cash flow, corporate finance, and takeovers, Amer-
ican Economic Review 76, 323–329.
Jensen, Michael C., and William H. Meckling, 1976, Theory of the firm: Managerial behavior,
agency costs and ownership structure, Journal of Financial Economics 3, 305–360.
Jin, Li, Robert C. Merton, and Zvi Bodie, 2006, Do a firm’s equity returns reflect the risk of its
pension plan?, Journal of Financial Economics 81, 1–26.
Kiyotaki, Nobuhiro, and John Moore, 1997, Credit cycles, Journal of Political Economy 105, 211–
248.
Koijen, Ralph S. J., Otto van Hemert, and Stijn van Nieuwerburgh, 2009, Mortgage timing, Journal
of Financial Economics 93, 292–324.
Koninsky, Danny, 1997, The bond markets of Israel, in Nick Battley, ed.: The European Bond
Markets (Sixth Edition) (McGraw-Hill, New York) 6 edn.
Kraus, Alan, and Robert H. Litzenberger, 1973, A state-preference mode of optimal financial lever-
age, Journal of Finance 28, 911–922.
Krishnamurthy, Arvind, 2002, The bond/old-bond spread, Journal of Financial Economics 66,
463–506.
Krishnamurthy, Arvind, and Annette Vissing-Jorgensen, 2012, The aggregate demand for Treasury
debt, Journal of Political Economy 120, 233–267.
Kung, Howard, 2013, Equilibrium growth, inflation, and bond yields, Mimeo, University of British
Columbia.
45

Kuttner, Kenneth N., and Adam Simon Posen, 2001, The Great Recession: Lessons for macroeco-
nomic policy from Japan, in William C. Brainard, and George L. Perry, ed.: Brookings Papers
on Economic Activity: Fall 2001 (Brookings Institution Press, Washington, D.C.).
Leary, Mark T., and M. R. Roberts, 2005, Do firms rebalance their capital structures?, Journal of
Finance 60, 2575–2619.
Leland, Hayne E., 1994, Corporate debt value, bond covenants, and optimal capital structure,
Journal of Finance 49, 1213–1252.
Leland, Hayne E., and K. B. Toft, 1996, Optimal capital structure, endogenous bankruptcy, and the
term structure of credit spreads, Journal of Finance 51, 987–1019.
LeRoy, Stephen F., and Richard D. Porter, 1981, The present value relation: Tests based on implied
variance bounds, Econometrica 49, 555–574.
Li, Lingfeng, 2002, Macroeconomic factors and the correlation of stock and bond returns, Yale
ICF Working Paper No. 02-46.
Longstaff, Francis A., 2004, The flight-to-liquidity premium in us treasury bond prices, Journal of
Business 77, 511–26.
Longstaff, Francis A., and Eduardo S. Schwartz, 1995, A simple approach to valuing risky fixed
and floating rate debt, Journal of Finance 50, 789–819.
Maynard, Micheline, 2005, United Air wins right to default on its employee pension plans, The
New York Times, May 11.
Mehra, Rajnish, and Edward C. Prescott, 1985, The equity premium: A puzzle, Journal of Mone-
tary Economics 15, 145–161.
46

Merton, Robert C., 1974, On the pricing of corporate debt: The risk structure of interest rates,
Journal of Finance 29, 449–470.
Modigliani, Franco, and Merton H. Miller, 1958, The cost of capital, corporation finance and the
theory of investment, American Economic Review 48, 261–297.
Modigliani, Franco, and Merton H. Miller, 1963, Corporate income taxes and the cost of capital:
A correction, American Economic Review 53, 433–443.
Myers, Stewart C., 1977, Determinants of corporate borrowing, Journal of Financial Economics
5, 147–175.
Myers, Stewart C., and Nicholas S. Majluf, 1984, Corporate financing and investment decisions
when firms have information that investors do not have, Journal of Financial Economics 13,
187–221.
Newey, Whitney K., and Kenneth D. West, 1987, A simple, positive semi-definite, heteroskedas-
ticity and autocorrelation consistent covariance matrix, Econometrica 55, 703–708.
Pflueger, Carolin E., and Luis M. Viceira, 2011, An empirical decomposition of risk and liquidity
in nominal and inflation-indexed government bonds, NBER Working Paper w16892.
Reserve Bank of Australia, 2001, Corporate bond yields in Australia, Reserve Bank of Australia
Bulletin, June 2001, http://www.rba.gov.au/publications/bulletin/2001/index.html.
Shiller, Robert J., 1981, Do stock prices move too much to be justified by subsequent changes in
dividends?, American Economic Review 71, 421–436.
Shivdasani, Anil, and Irina Stefanescu, 2010, How do pensions affect corporate capital structure
decisions?, Review of Financial Studies 23, 1287–1323.
47

Stock, James H., and Mark W. Watson, 2007, Why has US inflation become harder to forecast?,
Journal of Money, Credit and Banking 39, 3–33.
Tel-Aviv Stock Exchange, 2009, Tel-Aviv Stock Exchange Annual Review 2009,
http://www.tase.co.il.
Viceira, Luis M., 2012, Bond risk, bond return volatility, and the term structure of interest rates,
International Journal of Forecasting 28, 97–117.
Welch, Ivo, 2004, Capital structure and stock returns, Journal of Political Economy 112, 106–131.
Wright, Jonathan H., 2011, Term premia and inflation uncertainty: Empirical evidence from an
international panel dataset, American Economic Review 101, 1514–1534.
48

Notes
1A number of recent papers on inflation risk premia in government bonds include D’Amico,
Kim, and Wei (2009), Christensen, Lopez, and Rudebusch (2010), Haubrich, Pennacchi, and
Ritchken (2012), Campbell, Sunderam, and Viceira (2013), Pflueger and Viceira (2011), and Kung
(2013).
2The Survey of Professional Forecasters provides forecasters’ average survey probabilities that
annual-average over annual-average GDP index inflation will fall into a particular range. Panel
A shows the difference between the 90th and the 10th inflation distribution percentiles smoothed
over the past eight quarters. Panel B shows the smoothed difference between the 50th and the
10th percentiles. When the lowest probability range receives a weight of more than 10%, we fit
a unimodal beta distribution following Engelberg, Manski, and Williams (2009). Supplementary
Appendix C.1 provides a detailed variable description.
3Hershey, Robert D. Jr., 1982, Inflation hurts, but deflation could be worse, The New York
Times, April 18.
4Bernanke, Ben, 2002, Deflation: Making sure that ‘it’ doesn’t happen here, Remarks Before
the National Economists Club, Washington D.C., November 21.
5Throughout the paper we refer to the log of the gross yield as the log yield. That is, if we have
a bond that yields 3%, we obtain the log yield as log(1.03) ≈ 0.03. We measure the U.S. credit
spread as the difference between the log Moody’s Baa long-term yield over the log Aaa long-term
yield. Moody’s long-term corporate bond yields are based on seasoned bonds with 20 to 30 years
remaining to maturity.
49

6See e.g. Duffie and Singleton (1997), Grinblatt (2001), Krishnamurthy (2002), Krishnamurthy
and Vissing-Jorgensen (2012), Longstaff (2004), and Feldhutter and Lando (2008).
7For simplicity, in Figure 2 both the defaultable and default-free bonds are zero coupon with
fixed and equal nominal face values. The representative firm defaults when the real asset value
falls below the real face value of liabilities. In default bond holders become the residual claimants
on the firm’s assets.
8It is important for our quantitative results that expected inflation is persistent. The assumption
of an exact random walk is primarily for analytical tractability.
9The firm never finds it optimal to default in its intermediate period because no debt payments
come due during the intermediate period.
10See Table IV.
11Welch (2004) finds that the mechanistic effects of stock returns can explain about 40% of
movements in leverage ratios over a five-year horizon. Baker and Wurgler (2002) find that corpo-
rations are likely to raise more equity when their market valuations are relatively higher, and that
these effects can explain leverage ten years out. For empirical evidence on sticky leverage, also
see Leary and Roberts (2005).
12A recovery rate in the range of 40% to 50% is also consistent with the evidence in Cremers,
Driessen, and Maenhout (2008), Glover (2011) and Coval, Jurek, and Stafford (2009).
13We simulate 250 runs of length 100. Both model and empirical equity returns are defined as
ten-year log nominal equity returns in excess of the continuously compounded ten-year nominal
interest rate.
50

14To ensure that regressors are never perfectly collinear, we add small measurement errors to
the inflation shock and inflation risk variables. The standard deviations of the model measurement
errors are approximately 2% of the standard deviations of the underlying parameters.
15Figure 4 plots average seasoned credit spreads for different inflation risk regimes against
lagged stock returns and inflation surprises. We average credit spreads within stock return and
inflation shock quintiles and within inflation risk regimes. We simulate 500 runs of length 100. We
use quintile cutoffs from Model 2 for both Models 1 and 2, because inflation quintiles in Model 1
are not well defined.
16According to GFD, the original sources for government bond yields and T-bill rates are the Re-
serve Bank of Australia, Bank of Canada, Deutsche Bundesbank, Bank of Japan, Bank of England,
and Federal Reserve Bank. The original inflation sources are the Australian Bureau of Statistics,
Statistics Canada, German Statistisches Bundesamt, Japanese Statistics Bureau, UK Central Statis-
tical Office, and U.S. Bureau of Labor Statistics. Quarterly GDP in millions of national currency,
volume estimates, OECD reference year, annual levels, seasonally adjusted is from OECD Stat.
Stock returns correspond to the following equity indexes: Australia ASX Accumulation Index,
Canada S&P/TSX-300 Total Return Index, Germany CDAX Total Return Index, Japan Topix To-
tal Return Index, United Kingdom FTSE All-Share Return Index, and United States S&P 500 Total
Return Index. We are extremely grateful to Yoichi Matsubayashi for providing us with Japanese
corporate bond yield data. Durations are estimated from bond maturities, assuming that bonds
sell at par following Campbell, Lo, and MacKinlay (1997), p. 408. For a description of Moody’s
corporate bond indexes, see http://credittrends.moodys.com/chartroom.asp?r=3. Table B.1 in the
Supplementary Appendix lists further details on the corporate bond data sources and durations.
17Data for the U.S. and Canada is from Compustat North America and the Center for Research in
51

Security Prices (CRSP). Data for all other countries is from Compustat Global. We divide annual
book debt values from the previous year end by the sum of the same book debt and quarterly market
equity. Following Baker and Wurgler (2002), we define book debt as the sum of total liabilities
and preferred stock minus deferred taxes and convertible debt. When preferred stock is missing,
we use the redemption value of preferred stock. Corporate bond yield indexes, such as Moody’s
long-term yield indexes, weight observations equally, and therefore we control for equal-weighted
market leverage.
18We obtain U.S. stock returns from CRSP, Canadian stock returns from Datastream, and all
other country stock returns from Compustat Global. Industries are defined according to GIC clas-
sification codes.
19For a given MSCI index, the dividend yield is computed as the market-value weighted average
dividend yield of all constituents. The dividend yield for an individual stock is based on its most
recent annualized dividend rate (i.e., dividends per share) divided by the current share price.
20Bond volatility and the bond-stock correlation report the annualized standard deviation of
changes in long-term nominal government bond log yields and the correlation between changes in
nominal government bond log yields and log stock returns, respectively. These measures are also
equal to the volatility of government bond log returns scaled by the bond duration and the negative
of the correlation between government bond log returns and log stock returns, where bond returns
are approximated using changes in yields.
21Using bond-market derived measures, Wright (2011) argues that inflation cyclicality has in-
creased since 1990 in most developed countries.
22We use the sum of log inflation surprises and log real stock return surprises over the past three
52

years and over the past quarter, quarterly and three-year log real GDP growth, and the three-year
change in unemployment.
23For an analysis of the Japanese corporate bonds market, see Hattori, Koyama, and Yonetani
(2001), who argue that the default risk of the individual issuer is the most important determinant
of corporate bond spreads in Japan after 1997. Reserve Bank of Australia (2001) provides an
overview of the Australian corporate bond market. Galati and Tsatsaronis (2003) and De Bondt
and Lichtenberger (2003) study Euro corporate bonds during the Euro introduction.
24We obtain the three-month BBA LIBOR Rate from Bloomberg as ”US0003m Index” available
starting 1971.Q1.
25We obtain the off-the-run bond yield by pricing the on-the-run bond cash flows with the off-
the-run bond yield curve of Gurkaynak, Sack, and Wright (2007). On-the-run bond yields and
issue characteristics are from the monthly CRSP Treasury master file. The off-the-run spread is the
difference between the off-the-run and on-the-run bond yields, both continuously compounded.
The Supplementary Appendix provides a detailed variable description.
26We use the Moody’s Corporate Default Risk Service database to compute loss rates corre-
sponding as closely as possible to the Moody’s long-term Baa corporate bond yield. We compute
annualized issuer-weighted loss rates as the product of average default rates times average loss
given default. We consider U.S. domiciled firms in the industrial and public utilities sectors with a
senior long-term Baa rating. lossUS,t→t+n includes all defaults of firms that were rated Baa in year t
and defaulted in years t+1 through t+n. Because of the lag between credit loss rates and inflation
risk variables, the five year default forecasts effectively only use data on inflation volatility and the
inflation-stock correlation until 2005.
53

27We obtain long-term corporate and government bond return indexes from Ibbotson Associates.
28The proportion of non-linked corporate bond issuances has increased over time, but the ma-
jority of corporate debt raised on the Tel Aviv Stock Exchange in 2007, 2008, and 2009 was still
CPI-linked (Tel-Aviv Stock Exchange (2009)).
29Annual statistics from the Tel Aviv Stock Exchange
http://www.tase.co.il/Eng/Statistics/AnnualTables/Pages/Annual Tables.aspx.
30Italian and German benchmark yields from Datastream (TRBD10T, TRIT10T).
54

Figure 1: U.S. Credit Spreads and Survey Inflation Uncertainty
Panel A: Inflation Uncertainty
Panel B: Lower Tail Inflation Uncertainty
Average log yield spread on Moody's long-term Baa-rated corporate bonds over long-term Aaa-ratedcorporate bonds and survey inflation uncertainty. The Survey of Professional Forecasters providesforecasters' average survey probabilities that annual-average over annual-average GDP index inflationwill fall into a particular range. We interpolate the cumulative density function linearly and smoothquantiles over the past eight quarters. When the lowest inflation range receives a weight of more than10%, we infer quantiles from a fitted beta distribution following Engelberg, Manski, and Williams(2009). Supplementary Appendix C.1 provides a detailed variable description. Panel A shows thesmoothed difference between the 90th and the 10th inflation percentiles. Panel B shows the smootheddifference between the 50th and the 10th percentiles.
1.5
2
2.5
3
3.5
4
4.5
5
0
1
2
3
1965 1970 1975 1980 1985 1990 1995 2000 2005 2010NBER Recession Baa-Aaa Log Yield Spread90-10 Infl. Quantile Spread (Right Axis)
Correlation=43%
End of Bretton Woods
Volcker DisinflationFinancial
Crisis
0.5
1.0
1.5
2.0
2.5
3.0
0
1
2
3
1965 1970 1975 1980 1985 1990 1995 2000 2005 2010NBER Recession Baa-Aaa Log Yield Spread50-10 Infl. Quantile Spread (Right Axis)
Correlation=51%
End of Bretton Woods
Volcker DisinflationFinancial
Crisis
Percent (%)Percent (%)
Percent (%) Percent (%)
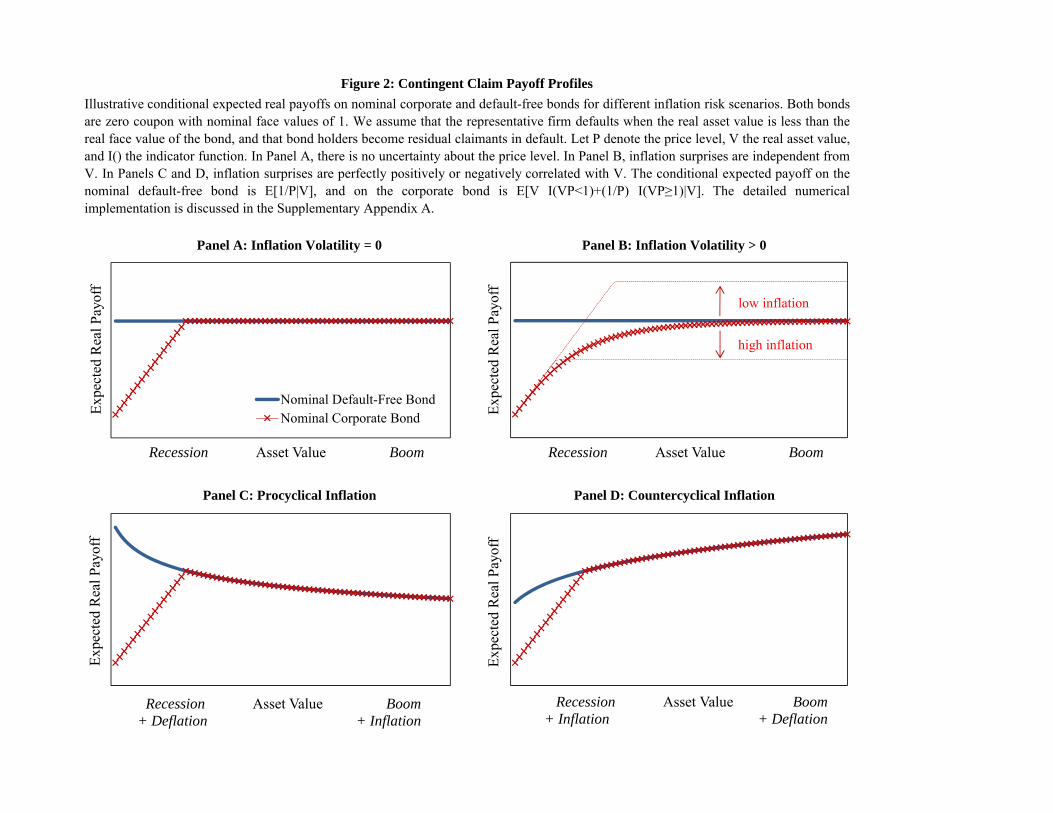
Figure 2: Contingent Claim Payoff Profiles
Panel B: Inflation Volatility > 0
Panel D: Countercyclical Inflation
Panel A: Inflation Volatility = 0
Panel C: Procyclical Inflation
Illustrative conditional expected real payoffs on nominal corporate and default-free bonds for different inflation risk scenarios. Both bondsare zero coupon with nominal face values of 1. We assume that the representative firm defaults when the real asset value is less than thereal face value of the bond, and that bond holders become residual claimants in default. Let P denote the price level, V the real asset value,and I() the indicator function. In Panel A, there is no uncertainty about the price level. In Panel B, inflation surprises are independent fromV. In Panels C and D, inflation surprises are perfectly positively or negatively correlated with V. The conditional expected payoff on thenominal default-free bond is E[1/P|V], and on the corporate bond is E[V I(VP<1)+(1/P) I(VP≥1)|V]. The detailed numericalimplementation is discussed in the Supplementary Appendix A.
Exp
ecte
d R
eal P
ayof
f
Recession Asset Value Boom
Nominal Default-Free BondNominal Corporate Bond
Exp
ecte
d R
eal P
ayof
f
Recession Asset Value Boom
low inflation
high inflation
Exp
ecte
d R
eal P
ayof
f
Recession Asset Value Boom+ Deflation + Inflation
Exp
ecte
d R
eal P
ayof
f
Recession Asset Value Boom+ Inflation + Deflation

t t + 1 t + 2
· Young firm · Seasoned firm · Old firm
· Choose nominal debt B$t · Real aggregate TFP shock εTFP
t+1 · Real aggregate TFP shock εTFPt+2
· Purchase capital Kyt+1 · Nominal aggregate shock επt+1 · Nominal aggregate shock επt+2
· New credit spreads · Real idiosyncratic shock ai,1t+1 · Real idiosyncratic shock ai,2
t+2
· Seasoned credit spreads · Default decision
· Liquidating dividend
Figure 3: Timeline of Firm i Cohort t

Figure 4: Asymmetric Model Predictions
Simulated average seasoned corporate log yield spreads versus stock returns and inflation shocks. Lowand high inflation volatility corresponds to 0% p.a. and 2% p.a., while inflation is uncorrelated withTFP shocks (Model 1). High and low inflation-TFP correlation corresponds to 0.6 and -0.6, whileinflation volatility is constant at 1% p.a. (Model 2). We average credit spreads within real stock returnquintiles and inflation shock quintiles over 500 simulations of length 100. Quintile cutoffs in all panelsare based on the simulated Model 2 stock return and inflation shock distributions. We normalize creditspreads to zero in the middle quintile of each panel and show a horizontal line at 0.
-1.0
0.0
1.0
2.0
1 2 3 4 5Cor
pora
te L
og
Yie
ld S
prea
d (%
)
Real Stock Return Quintile
Low Infl. Vol.High Infl. Vol.
-1.0
0.0
1.0
2.0
1 2 3 4 5Cor
pora
te L
og
Yie
ld S
prea
d (%
)
Inflation Shock Quintile
Low Infl.-TFP Corr.High Infl.-TFP Corr.
-1.0
0.0
1.0
2.0
1 2 3 4 5Cor
pora
te L
og
Yie
ld S
prea
d (%
)
Inflation Shock Quintile
Low Infl. Vol.High Infl. Vol.
-1.0
0.0
1.0
2.0
1 2 3 4 5Cor
pora
te L
og
Yie
ld S
prea
d (%
)
Real Stock Return Quintile
Low Infl.-TFP Corr.High Infl.-TFP Corr.

Figure 5: International Credit Spreads and Inflation Volatility
This figure shows the comovement of quarterly credit spreads (solid) and inflation volatility (dashed) for Australia, Canada, Germany, Japan, the U.K., andthe U.S. Credit spreads are computed as investment grade corporate bond index log yields in excess of duration-matched nominal government bond logyields, except for the U.S. credit spread, which is the Moody's Baa minus Aaa log yield spread. Inflation volatility is computed using a three-year backward-looking window of quarterly inflation surprises.
-0.5
0.5
1.5
2.5
3.5
4.5
1970 1980 1990 2000 2010
Australia
-0.5
0.5
1.5
2.5
3.5
4.5
1970 1980 1990 2000 2010
Canada
-0.5
0.5
1.5
2.5
3.5
4.5
1970 1980 1990 2000 2010
Japan
-0.5
0.5
1.5
2.5
3.5
4.5
1970 1980 1990 2000 2010
U.K.
-0.5
0.5
1.5
2.5
3.5
4.5
1970 1980 1990 2000 2010
Germany
-0.5
0.5
1.5
2.5
3.5
4.5
1970 1980 1990 2000 2010
U.S.
Corporate Log Yield Spread (% Ann.) Inflation Volatility (% Ann.)
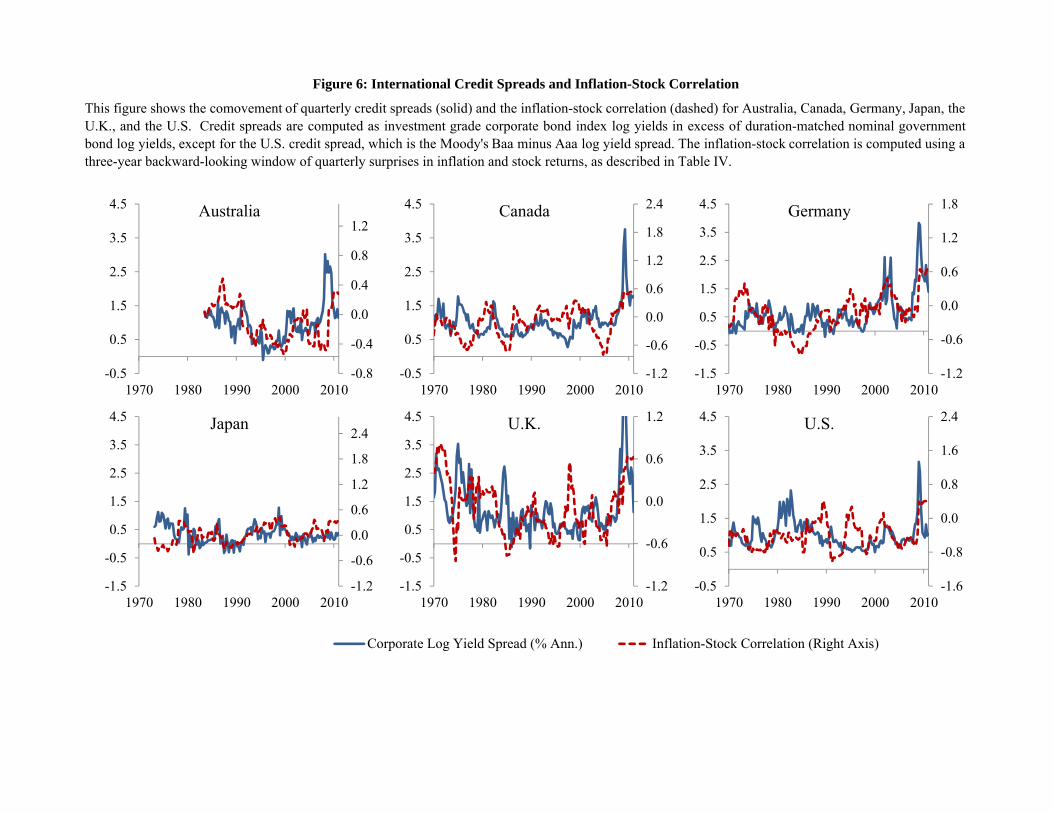
Figure 6: International Credit Spreads and Inflation-Stock Correlation
This figure shows the comovement of quarterly credit spreads (solid) and the inflation-stock correlation (dashed) for Australia, Canada, Germany, Japan, theU.K., and the U.S. Credit spreads are computed as investment grade corporate bond index log yields in excess of duration-matched nominal governmentbond log yields, except for the U.S. credit spread, which is the Moody's Baa minus Aaa log yield spread. The inflation-stock correlation is computed using athree-year backward-looking window of quarterly surprises in inflation and stock returns, as described in Table IV.
-0.8
-0.4
0.0
0.4
0.8
1.2
-0.5
0.5
1.5
2.5
3.5
4.5
1970 1980 1990 2000 2010
Australia
Corporate Log Yield Spread (% Ann.) Inflation-Stock Correlation (Right Axis)
-1.2
-0.6
0.0
0.6
1.2
1.8
2.4
-0.5
0.5
1.5
2.5
3.5
4.5
1970 1980 1990 2000 2010
Canada
-1.2
-0.6
0.0
0.6
1.2
1.8
-1.5
-0.5
0.5
1.5
2.5
3.5
4.5
1970 1980 1990 2000 2010
Germany
-1.2
-0.6
0.0
0.6
1.2
1.8
2.4
-1.5
-0.5
0.5
1.5
2.5
3.5
4.5
1970 1980 1990 2000 2010
Japan
-1.2
-0.6
0.0
0.6
1.2
-1.5
-0.5
0.5
1.5
2.5
3.5
4.5
1970 1980 1990 2000 2010
U.K.
-1.6
-0.8
0.0
0.8
1.6
2.4
-0.5
0.5
1.5
2.5
3.5
4.5
1970 1980 1990 2000 2010
U.S.

Figure 7: Empirical Credit Spreads, Stock Returns and Inflation Shocks
International empirical credit spreads versus stock returns and inflation shocks. The top left panelaverages credit spreads within quintiles of lagged three-year real stock returns and two inflationvolatility regimes. The other panels are constructed similarly by sorting credit spreads into quintiles oflagged three-year inflation shocks and two inflation-stock return correlation regimes, as indicated.Inflation risk regimes are defined relative to the country-specific median. We normalize credit spreadsto zero in the middle quintile of each panel and show a horizontal line at 0.
-0.20.00.20.40.60.8
1 2 3 4 5
Cre
dit S
prea
d (%
)
Real Stock Return Quintile
Low Infl. Vol.High Infl. Vol.
-0.20.00.20.40.60.8
1 2 3 4 5Cre
dit S
prea
d (%
)
Inflation Shock Quintile
Low Infl. Stock Corr.High Infl. Stock Corr.
-0.20.00.20.40.60.8
1 2 3 4 5
Cre
dit S
prea
d (%
)
Inflation Shock Quintile
Low Infl. Vol.High Infl. Vol.
-0.20.00.20.40.60.8
1 2 3 4 5
Cre
dit S
prea
d (%
)
Real Stock Return Quintile
Low Infl.-Stock Corr.High Infl.-Stock Corr.

General ParametersPeriod length 5 yearsDiscount rate β 3%*Risk aversion γ 10Capital share α 0.33Depreciation δ 8%*Trend growth μ 2.8%*Volatility of TFP shock σ 26%*Recovery rate θ 0.40Tax benefit of debt χ 1.40
Idiosyncratic volatility σid 17%*
Model 1: Time-Varying Inflation Volatility
Inflation-TFP correlation ρπ 0.00
High inflation volatility σπ,H 2%*
Low inflation volatility σπ,L 0%*
Persistence of σπ,H p (σπ,H→ σπ,H) 0.60
Persistence of σπ,L p (σπ,L→ σπ,L) 0.80
Model 2: Time-Varying Inflation TFP Correlation
Inflation volatility σπ 1%*
High inflation-TFP correlation ρπ,H 0.60
Low inflation-TFP correlation ρπ,L -0.60
Persistence of ρπ,H p (ρπ,H→ ρπ,H) 0.70
Persistence of ρπ,L p (ρπ,L→ ρπ,L) 0.70
Table I: Model Parameters
We show model parameters used in our calibrations. * denotes per annumunits. Annualized inflation volatility is the standard deviation of a one-year inflation shock. p(X→X) denotes the probability that the state at timet+1 will be X conditional on the time t state being X.

Empirical Model 1 Model 2
U.S. 1970-2009 Time-Varying σπ Time-Varying ρπ
Equity volatility (% Ann.) 18.4% 18.5% 18.0%Firm volatility (% Ann.) 47.2% 29.3% 29.0%Equity premium (% Ann.) 2.90% 7.82% 7.83%
ytgov,10 - πt 2.50% 2.80% 2.72%
ytgov,10 - yt
gov,5 0.25% 1.16% 1.08%
New corporate log yield spread 1.18% 1.23%Seasoned corporate log yield spread 1.01% 1.64% 1.53%Default probability 0.52% 0.45% 0.40%Leverage 25% 41% 40%
We compare simulated moments of calibrated Models 1 and 2 with empirical U.S. moments estimated between1970-2009. Equity volatility is the standard deviation of 10 year log nominal equity returns in excess of the 10 yearlog nominal government yield. Firm volatility is the standard deviation of idiosyncratic 10 year log nominal stockreturns for non-defaulted firms. The equity premium is the average 10 year log nominal equity return in excess ofthe 10 year log nominal government yield (adjusted for Jensen's inequality). The average seasoned credit spread iscomputed as the average Moody's Baa- Aaa corporate log yield spread. We use the historical U.S. 10-yearinvestment grade bond default probability 1970-2001 reported by Almeida and Philippon (2007). We report theaggregated book leverage ratio, computed as long-term debt plus short-term debt divided by total assets fromCompustat. For a detailed description of model moments see Supplementary Appendix E.
Table II: Empirical and Model Moments

Seas. corporate log yield spread (% Ann.) (1) (2) (3) (4)Inflation volatility (Ann.) 27.10 27.13
(9.37) (8.51)Equity volatility (Ann.) 8.69 2.27
(6.67) (6.96)Dividend-price ratio (Ann.) 17.51 30.16
(14.12) (14.63)Equity return -1.36 -1.36 -1.71 -1.45
(0.21) (0.21) (0.34) (0.34)Inflation shock -10.75 -10.76 -10.58 -10.70
(2.39) (2.16) (2.30) (2.11)Constant 2.27 2.09 1.03 1.29
(0.12) (0.09) (0.50) (0.50)
R2 0.75 0.79 0.81 0.85
Seas. corporate log yield spread (% Ann.) (1) (2) (3) (4)Inflation-stock correlation 26.62 19.70
(9.75) (11.94)Equity volatility (Ann.) 10.84 4.91
(4.19) (6.12)Dividend-price ratio (Ann.) 12.96 24.00
(10.53) (14.17)Equity return -1.41 -1.40 -1.85 -1.61
(0.21) (0.20) (0.26) (0.32)Inflation shock -9.29 -9.31 -9.11 -9.20
(1.14) (1.09) (0.97) (0.96)Constant 2.18 2.15 0.83 1.21
(0.11) (0.11) (0.31) (0.42)
R2 0.72 0.74 0.80 0.81
Panel A: Time-Varying Inflation Volatility (Model 1)
Table III: Model Credit Spread Regressions
Panel B: Time-Varying Inflation-TFP Correlation (Model 2)
We estimate the sensitivity of model seasoned corporate log yield spreads to inflationvolatility and the inflation-stock correlation in the calibrated models. In Panel A, inflationvolatility switches between 0% p.a. and 2% p.a., and the inflation-TFP correlation is zero.In Panel B, inflation volatility is constant at 1% p.a., and the inflation-TFP correlationswitches between -0.6 and 0.6. We use log seasoned equity returns and one-period changesin log inflation expectations as control variables. We also control for the dividend-priceratio, defined as the expected return on seasoned equity. The inflation-stock correlation isdefined as the correlation between log seasoned equity returns and shocks to log inflationexpectations. Equity volatility is defined as the standard deviation of log real returns onseasoned equity.

Australia Canada Germany Japan U.K. U.S.Start date 1983.Q3 1969.Q4 1969.Q4 1973.Q1 1969.Q4 1969.Q4End date 2010.Q2 2010.Q4 2010.Q4 2010.Q2 2010.Q4 2010.Q4Credit spread (%) mean 0.99 1.02 0.65 0.33 1.28 1.02
std 0.56 0.45 0.67 0.32 0.98 0.42min -0.10 0.28 -0.20 -0.38 -0.16 0.50max 3.02 3.76 3.83 1.28 6.25 3.17
Avg. corp. bond duration (years) 6.9 10.1 5.1 8.2 8.5 10.7Inflation vol. (%, Ann.) mean 1.26 1.19 1.01 1.33 1.61 1.23
std 0.40 0.43 0.36 0.77 0.88 0.58min 0.70 0.45 0.48 0.42 0.70 0.42max 2.09 1.97 2.11 3.72 4.12 2.93
Inflation-stock correl. mean -0.09 -0.03 -0.15 0.00 -0.12 -0.26std 0.31 0.34 0.32 0.27 0.31 0.34min -0.61 -0.77 -0.83 -0.56 -0.70 -0.90max 0.64 0.66 0.63 0.51 0.59 0.55
Equity Vol. (%, Ann.) mean 16.72 16.19 19.50 19.61 18.57 16.06std 8.35 5.55 7.62 6.32 8.09 5.34min 6.72 7.87 7.80 5.51 5.85 5.66max 37.57 27.40 40.20 36.04 44.41 27.99
Div.-price ratio (%, Ann.) mean 3.86 2.96 3.39 1.30 4.26 3.12std 0.80 1.00 1.12 0.66 1.24 1.32min 2.60 0.99 1.67 0.43 2.11 1.14max 6.95 5.67 6.20 2.86 10.46 6.14
Panel A: Long Sample Period Variables
We report summary statistics for the spread of investment grade corporate bond log yields in excess ofduration-matched nominal government bond log yields. For the U.S., we show the spread betweenMoody's Baa long-term log yields over Moody's Aaa long-term log yields. Corporate bond yields fromthe Economist (Australia), Bank of Canada and Datastream (Canada), Bundesbank (Germany), NikkeiCorporate Bond Index (Japan), Financial Times and the Economist (U.K.), and Moody's (U.S.).Average corporate bond durations are estimated assuming that bonds sell at par (Campbell, Lo, andMacKinlay (1997)). The annualized standard deviation of inflation surprises, the inflation-stockcorrelation, and the annualized standard deviation of real stock return surprises use a moving three-year window of quarterly inflation and stock return surprises. Inflation surprises are residuals fromregressing quarterly log inflation onto its own four lags, the lagged log T-bill, and seasonal dummies.Stock return surprises are residuals from regressing the quarterly log real stock return onto its own lag.Dividend-price ratios from MSCI. Panel B reports additional control variables only available for ashorter time period. Idiosyncratic volatility is the standard deviation of daily firm stock returns inexcess of market and sector returns using GIC sector classifications (Campbell et al. (2001)). Equal-weighted market leverage from Compustat. Bond volatility is the annualized standard deviation ofdaily or weekly changes in nominal government bond log yields over the past quarter. The bond-stockcorrelation reports the correlation between real log stock returns and changes in nominal governmentbond log yields over the past quarter.
Table IV: Summary Statistics

Australia Canada Germany Japan U.K. U.S.Start date 1989.Q1 1989.Q1 1990.Q1 1989.Q1 1989.Q1 1989.Q1End date 2010.Q2 2010.Q2 2010.Q2 2010.Q2 2010.Q2 2010.Q2Bond vol. (%, Ann.) mean 0.80 0.66 0.54 0.49 0.66 0.72
std 0.22 0.18 0.17 0.20 0.21 0.22min 0.42 0.28 0.28 0.19 0.30 0.40max 1.62 1.32 0.97 1.18 1.42 1.54
Bond-stock correl. mean -0.04 0.00 -0.09 0.11 -0.03 -0.04std 0.35 0.32 0.39 0.31 0.41 0.42min -0.65 -0.62 -0.84 -0.69 -0.80 -0.77max 0.78 0.68 0.72 0.64 0.72 0.77
Idiosync. vol. (%, Ann.) mean 22.23 26.80 26.24 31.28 18.28 25.95std 12.03 5.20 9.02 7.46 12.36 7.61min 5.02 19.69 15.91 19.08 4.04 16.26max 57.68 54.67 54.95 58.00 52.75 50.39mean 17.89 22.58 41.23 34.28 21.45 23.11std 6.25 6.11 13.51 6.69 3.94 3.91min 8.69 12.70 21.72 19.59 13.84 16.84max 40.76 35.53 63.12 47.40 31.67 33.67
Panel B: Shorter Sample Period Variables
Equal-Weighted Mkt. Leverage (%)

(1) (2) (3) (4) (5) (6) (7) (8) (9)Inflation risk
Inflation volatility (Ann.) 29.71** 28.04** 24.61** 12.49** 15.09** 22.94** 22.76**(8.36) (6.96) (6.97) (4.30) (4.50) (6.22) (5.66)
Inflation-stock correlation 40.42** 42.37** 39.99** 27.80** 44.88** 26.81**(9.10) (10.22) (8.62) (9.65) (7.66) (3.94)
Real uncertainty and other control variablesEquity volatility (Ann.) 1.26 0.86 1.52* 1.35* 1.62* -0.18
(0.86) (0.88) (0.59) (0.66) (0.62) (0.85)Dividend-price ratio (Ann.) 8.68* 8.41 14.65** 4.65 26.00** 28.77**
(4.32) (4.50) (5.28) (3.43) (7.42) (10.22)GDP vol. 6.77
(4.68)
Log T-bill -11.78**(3.46)
Log yield curve slope -9.64*(4.36)
Idiosyncratic volatility (Ann.) 0.87(0.58)
Leverage -1.19**(0.44)
Bond volatility (Ann.) 56.21*(23.28)
Bond-stock correlation 71.35**(19.66)
Business cycle and inflation shock variables (Logs)3-Year inflation shock 2.27 -0.98 -0.89 1.02 -1.69 -2.29* 0.79 -1.04 -3.54
(1.90) (1.95) (1.72) (1.88) (1.88) (1.13) (1.23) (1.51) (1.80)3-Year real stock return -0.36** -0.36** -0.32* -0.20 -0.19 0.04 -0.10 0.11 0.01
(0.12) (0.12) (0.12) (0.11) (0.11) (0.14) (0.10) (0.12) (0.10)3-Year GDP growth -2.58 -2.51* -1.32 -2.96* -1.66 -0.49 -0.41 0.68 0.34
(1.31) (1.07) (0.85) (1.41) (0.91) (1.37) (0.74) (0.70) (1.14)3-Year change unemployment -1.82 -5.51 -3.03 -3.04 -3.72 -1.24 1.08 0.07 0.48
(3.39) (3.81) (3.40) (3.75) (3.72) (2.12) (2.02) (2.28) (2.43)Quarterly inflation shock -5.67 -4.20 -5.01 -4.93 -4.51 0.91 -0.37 -6.26* -3.89
(3.99) (3.62) (3.65) (3.74) (3.35) (2.11) (1.62) (2.91) (2.03)Quarterly real stock return -0.47 -0.50 -0.51 -0.44 -0.48 0.52 -0.02 -0.52 -0.51
(0.43) (0.43) (0.43) (0.43) (0.43) (0.28) (0.22) (0.36) (0.30)Quarterly GDP growth -11.00* -10.87* -11.13* -10.50* -10.44* -2.81 -4.98** -10.08** -15.33**
(5.54) (5.25) (5.00) (5.02) (4.40) (2.39) (1.63) (3.43) (3.42)
Residual R2 0.19 0.25 0.28 0.22 0.30 0.30 0.27 0.41 0.55Time fixed effects YesPeriod Full Full Full Full Full Full 69.Q4-07.Q4 Full 89.Q1-09.Q4
Table V: International Credit Spreads and Inflation Risk (1969.Q4-2010.Q4)Quarterly pooled regressions of Australia, Canada, Germany, Japan, U.K., and U.S. corporate log yield spreads (% Ann.) against inflation volatility, theinflation-stock correlation, and control variables. We report Driscoll and Kraay (1998) standard errors accounting for cross-country correlation and 16
lags. All regressions contain country fixed effects. The residual R2 reflects explanatory power in excess of fixed effects. Japan data starts in 1973.Q1.Australia data starts in 1983.Q3. Variables are constructed as described in Table IV. * and ** denote significance at the 5% and 1% levels,respectively.
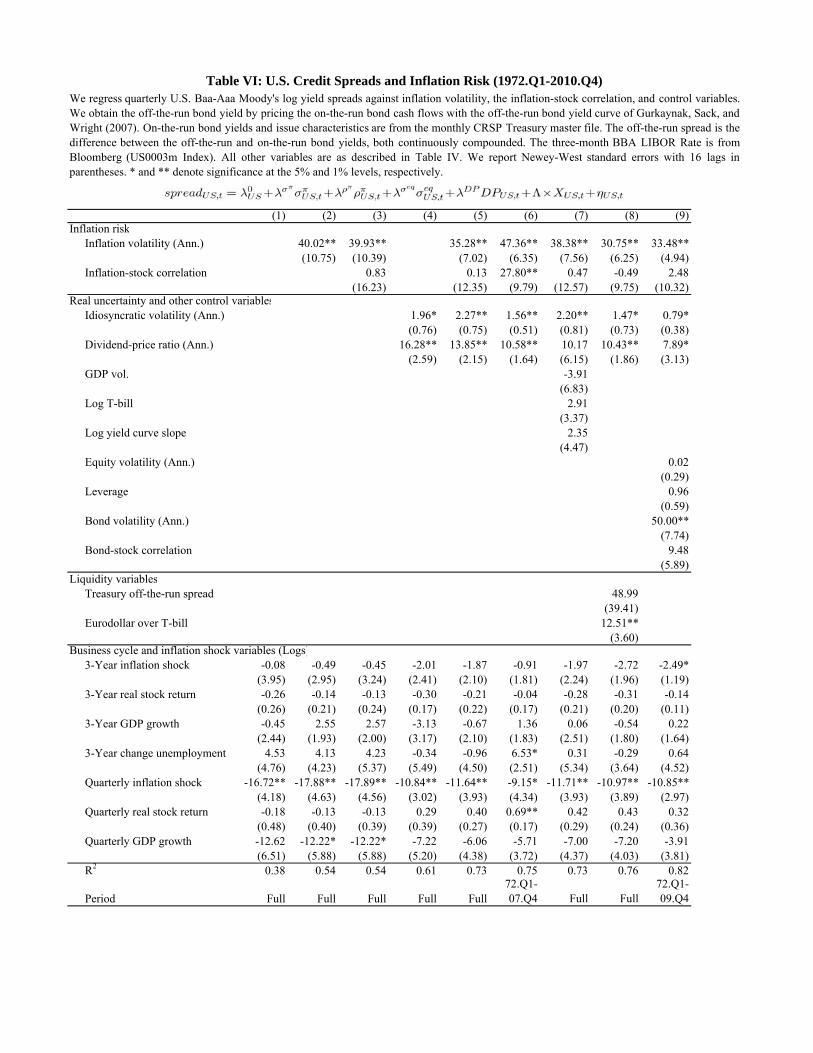
(1) (2) (3) (4) (5) (6) (7) (8) (9)Inflation risk
Inflation volatility (Ann.) 40.02** 39.93** 35.28** 47.36** 38.38** 30.75** 33.48**(10.75) (10.39) (7.02) (6.35) (7.56) (6.25) (4.94)
Inflation-stock correlation 0.83 0.13 27.80** 0.47 -0.49 2.48(16.23) (12.35) (9.79) (12.57) (9.75) (10.32)
Real uncertainty and other control variablesIdiosyncratic volatility (Ann.) 1.96* 2.27** 1.56** 2.20** 1.47* 0.79*
(0.76) (0.75) (0.51) (0.81) (0.73) (0.38)Dividend-price ratio (Ann.) 16.28** 13.85** 10.58** 10.17 10.43** 7.89*
(2.59) (2.15) (1.64) (6.15) (1.86) (3.13)GDP vol. -3.91
(6.83)Log T-bill 2.91
(3.37)Log yield curve slope 2.35
(4.47)Equity volatility (Ann.) 0.02
(0.29)Leverage 0.96
(0.59)Bond volatility (Ann.) 50.00**
(7.74)Bond-stock correlation 9.48
(5.89)Liquidity variables
Treasury off-the-run spread 48.99(39.41)
Eurodollar over T-bill 12.51**(3.60)
Business cycle and inflation shock variables (Logs)3-Year inflation shock -0.08 -0.49 -0.45 -2.01 -1.87 -0.91 -1.97 -2.72 -2.49*
(3.95) (2.95) (3.24) (2.41) (2.10) (1.81) (2.24) (1.96) (1.19)3-Year real stock return -0.26 -0.14 -0.13 -0.30 -0.21 -0.04 -0.28 -0.31 -0.14
(0.26) (0.21) (0.24) (0.17) (0.22) (0.17) (0.21) (0.20) (0.11)3-Year GDP growth -0.45 2.55 2.57 -3.13 -0.67 1.36 0.06 -0.54 0.22
(2.44) (1.93) (2.00) (3.17) (2.10) (1.83) (2.51) (1.80) (1.64)3-Year change unemployment 4.53 4.13 4.23 -0.34 -0.96 6.53* 0.31 -0.29 0.64
(4.76) (4.23) (5.37) (5.49) (4.50) (2.51) (5.34) (3.64) (4.52)Quarterly inflation shock -16.72** -17.88** -17.89** -10.84** -11.64** -9.15* -11.71** -10.97** -10.85**
(4.18) (4.63) (4.56) (3.02) (3.93) (4.34) (3.93) (3.89) (2.97)Quarterly real stock return -0.18 -0.13 -0.13 0.29 0.40 0.69** 0.42 0.43 0.32
(0.48) (0.40) (0.39) (0.39) (0.27) (0.17) (0.29) (0.24) (0.36)Quarterly GDP growth -12.62 -12.22* -12.22* -7.22 -6.06 -5.71 -7.00 -7.20 -3.91
(6.51) (5.88) (5.88) (5.20) (4.38) (3.72) (4.37) (4.03) (3.81)R2 0.38 0.54 0.54 0.61 0.73 0.75 0.73 0.76 0.82
Period Full Full Full Full Full72.Q1-07.Q4 Full Full
72.Q1-09.Q4
We regress quarterly U.S. Baa-Aaa Moody's log yield spreads against inflation volatility, the inflation-stock correlation, and control variables.We obtain the off-the-run bond yield by pricing the on-the-run bond cash flows with the off-the-run bond yield curve of Gurkaynak, Sack, andWright (2007). On-the-run bond yields and issue characteristics are from the monthly CRSP Treasury master file. The off-the-run spread is thedifference between the off-the-run and on-the-run bond yields, both continuously compounded. The three-month BBA LIBOR Rate is fromBloomberg (US0003m Index). All other variables are as described in Table IV. We report Newey-West standard errors with 16 lags inparentheses. * and ** denote significance at the 5% and 1% levels, respectively.
Table VI: U.S. Credit Spreads and Inflation Risk (1972.Q1-2010.Q4)

(1) (2) (3) (4) (5) (6) (7) (8) (9) (10)Horizon n (Years) 1 2 3 4 5 1 2 3 4 3Inflation risk
Inflation volatility (Ann.) 2.66 13.89* 19.34** 16.97** 17.31** -0.61 6.24 16.53** 14.96* 16.97(4.89) (5.69) (2.71) (3.61) (5.58) (4.43) (5.32) (3.79) (6.09) (10.32)
Inflation-stock correlation 7.52 11.74** 21.83** 17.05** 18.47** 1.57 5.69 17.10* 11.32 13.06(6.84) (3.71) (7.85) (5.51) (6.52) (6.61) (3.25) (6.60) (7.00) (6.46)
Real uncertainty and other control variablesIdiosyncratic volatility (Ann.) 0.19 0.51* 0.62* 0.52* 0.20 -0.21 0.09 0.16 -0.16 -0.43
(0.36) (0.23) (0.24) (0.25) (0.34) (0.87) (0.38) (0.20) (0.31) (0.36)Dividend-price ratio (Ann.) -0.20 -1.45 -1.65 -0.53 -0.81 -9.04 -9.01 -8.82** -8.17 -8.49
(1.33) (1.78) (1.07) (1.04) (0.94) (12.95) (5.35) (2.57) (4.54) (5.33)GDP vol. 15.93 18.66* 7.21* 3.61 1.74
(8.58) (6.90) (2.94) (5.94) (8.36)Equity volatility (Ann.) 0.81 0.18 -0.16 -0.36 -0.38
(0.82) (0.50) (0.24) (0.35) (0.49)Leverage -0.24 0.26 0.59 1.10* 0.97
(1.76) (0.93) (0.36) (0.45) (0.62)Bond volatility (Ann.) 11.95 5.08 13.55* 20.16* 21.49
(20.14) (8.51) (5.25) (8.63) (12.15)Bond-stock correlation -14.79 -3.08 -7.60 -2.34 -5.91
(20.37) (9.68) (5.73) (12.60) (13.28)Business cycle and inflation shock variables (Logs)
3-Year inflation shock -0.83 -0.43 0.68 0.49 -0.14 -1.60 -1.21 -0.36 -1.02 -1.61(0.69) (0.51) (0.69) (0.69) (0.96) (1.78) (0.80) (0.63) (0.98) (1.23)
3-Year real stock return -0.03 0.13 0.26** 0.30** 0.31** -0.04 0.13 0.23** 0.28** 0.27*(0.11) (0.08) (0.08) (0.07) (0.10) (0.11) (0.07) (0.06) (0.10) (0.12)
3-Year GDP growth 3.66* 3.47** 3.97** 4.33** 3.44** 2.28 1.05 3.31** 3.71** 3.36(1.33) (0.99) (0.71) (0.43) (0.82) (1.70) (1.58) (0.96) (1.21) (1.87)
3-Year change unemployment 4.47 5.95** 7.23** 7.13** 4.61** -0.57 -0.76 4.74 4.72 3.38(3.21) (2.01) (1.75) (1.25) (1.35) (3.89) (3.87) (2.43) (3.23) (3.45)
Quarterly inflation shock -3.25 4.13 2.43 0.78 3.85 1.12 5.02 3.52 2.29 5.94(5.93) (6.28) (3.69) (3.12) (4.08) (5.07) (5.25) (2.93) (3.99) (6.59)
Quarterly real stock return 0.76* 0.52 0.39* 0.34* 0.32 0.37 0.29 0.17 0.14 0.09(0.30) (0.35) (0.16) (0.15) (0.16) (0.46) (0.30) (0.11) (0.19) (0.25)
Quarterly GDP growth -0.64 -0.08 -2.55 -2.72 -4.13 -5.28 -1.94 -3.73* -3.18 -5.02(2.32) (1.91) (1.52) (2.38) (2.50) (4.69) (3.12) (1.33) (2.44) (3.04)
R2 0.29 0.48 0.75 0.69 0.59 0.37 0.61 0.83 0.78 0.67
Table VII: Predicting U.S. Baa Credit Loss Rates (1969-2010)
We regress annual data on annualized issuer-weighted credit loss rates of Baa-rated U.S. issuers in the industrial and publicutility sectors onto lagged end-of-year inflation volatility, the inflation-stock correlation, and control variables. Loss rates arecalculated as the product of default rates and loss given default based on post default trading prices. The n-year loss rate in-yeart includes all defaults of firms with a senior long-term Baa rating in year t and at least one default during years t+1 through t+n.Our data source is the Moody's default risk database. We report Newey-West standard errors with 6 lags. Variables areconstructed as described in Table IV. * and ** denote significance at the 5% and 1% levels, respectively.

(1) (2) (3) (4) (5) (6) (7) (8)
Horizon (Quarters) 1 4 12 20 1 4 12 20Inflation risk
Inflation volatility (Ann.) 18.07 -42.65 -187.92 98.86 -25.26 -74.42 -123.08 227.28(35.24) (92.40) (196.22) (255.45) (59.21) (140.95) (165.92) (223.61)
Inflation-stock correlation 149.52** 349.56** 452.86* 370.62** 60.29 347.14** 466.53** 427.03**(53.11) (126.05) (206.14) (140.50) (66.92) (69.35) (123.23) (130.39)
Real uncertainty and other credit risk variablesIdiosyncratic vol. (Ann.) 3.70 14.98* 33.81** 36.10** 3.01 31.87** 19.24* 27.37**
(2.99) (5.86) (7.14) (9.89) (3.40) (7.84) (9.70) (5.91)Dividend-price ratio (Ann.) 20.05 68.49* 162.45** 185.62* 67.40* 356.86** -29.59 27.12
(18.14) (34.48) (49.01) (92.72) (33.50) (111.40) (119.21) (95.54)GDP vol. 4.16 -44.68 -57.03 269.69
(69.74) (158.23) (176.29) (191.81)Log T-bill 6.40 28.44* 17.24* -2.18
(6.02) (13.65) (8.69) (11.06)Log yield curve slope -57.44** -142.70** 25.86 -33.86
(11.69) (36.79) (60.10) (22.98)Equity volatility (Ann.) -115.98** -197.68** 55.38 -34.75
(27.74) (61.15) (56.69) (47.21)Leverage 6.68 -26.12 42.11** 43.69**
(6.26) (23.17) (14.27) (13.50)Bond volatility (Ann.) 331.33** -156.93 404.73** -92.13
(99.95) (252.25) (103.58) (205.00)Bond-stock correlation -141.93 -333.09 -19.63 29.27
(116.43) (238.45) (107.05) (188.17)Liquidity variables
Treasury off-the-run spread -295.37** -185.49 89.73 1,031.13(102.73) (325.84) (346.55) (711.30)
Eurodollar over T-bill -60.71** 24.22 16.75 16.35(17.66) (82.13) (47.72) (73.04)
Business cycle and inflation shock variables (Logs)3-Year inflation shock -15.11 -18.46 -1.47 28.17 -35.82* -22.30 -23.88 0.31
(9.61) (15.08) (17.49) (22.26) (16.73) (28.31) (18.60) (27.69)3-Year real stock return -0.57 -2.54 -3.51 3.86 -0.16 -1.57 -1.55 6.36*
(0.68) (1.77) (2.30) (3.10) (1.07) (1.39) (2.81) (2.61)3-Year GDP growth 4.52 17.64 76.88* 154.60** -5.87 21.35 34.14 30.21
(6.92) (25.11) (29.75) (32.14) (11.31) (48.94) (47.98) (56.15)3-Year change unemploymen 38.24** 93.52 211.38** 305.93** 26.83 124.97 103.33 52.13
(13.55) (50.36) (46.41) (75.15) (25.03) (98.10) (94.53) (131.93)Quarterly inflation shock 39.37 -119.96* -170.78** -176.81 61.54 -100.27** -125.23** -142.03
(63.98) (53.07) (43.47) (102.45) (65.30) (26.75) (38.21) (94.28)Quarterly real stock return 1.72 -1.53 1.37 -4.67 1.22 -1.70 3.01 -4.88
(3.13) (2.74) (4.22) (6.35) (3.43) (2.54) (4.69) (5.51)Quarterly GDP growth -3.05 -20.94 -91.17 -77.22 12.50 -31.93 -80.04 -35.68
(22.69) (40.58) (62.58) (44.33) (23.30) (63.09) (55.44) (37.00)
R2 0.14 0.32 0.52 0.50 0.28 0.49 0.64 0.63
Period Full Full Full Full72.Q1-09.Q4
72.Q1-09.Q4
72.Q1-09.Q4
72.Q1-09.Q4
We regress quarterly U.S. long-term corporate bond log returns in excess of long-term government bond log returns against lagged inflationvolatility, the inflation-stock correlation, and control variables. Corporate and government bond return indices are from Ibbotson. For a laghorizon of n quarters, we report Newey-West standard errors with 16+n lags. * and ** denote significance at the 5% and 1% levels,respectively.
Table VIII: Predicting U.S. Corporate Bond Excess Returns (1969.Q1-2009.Q4)
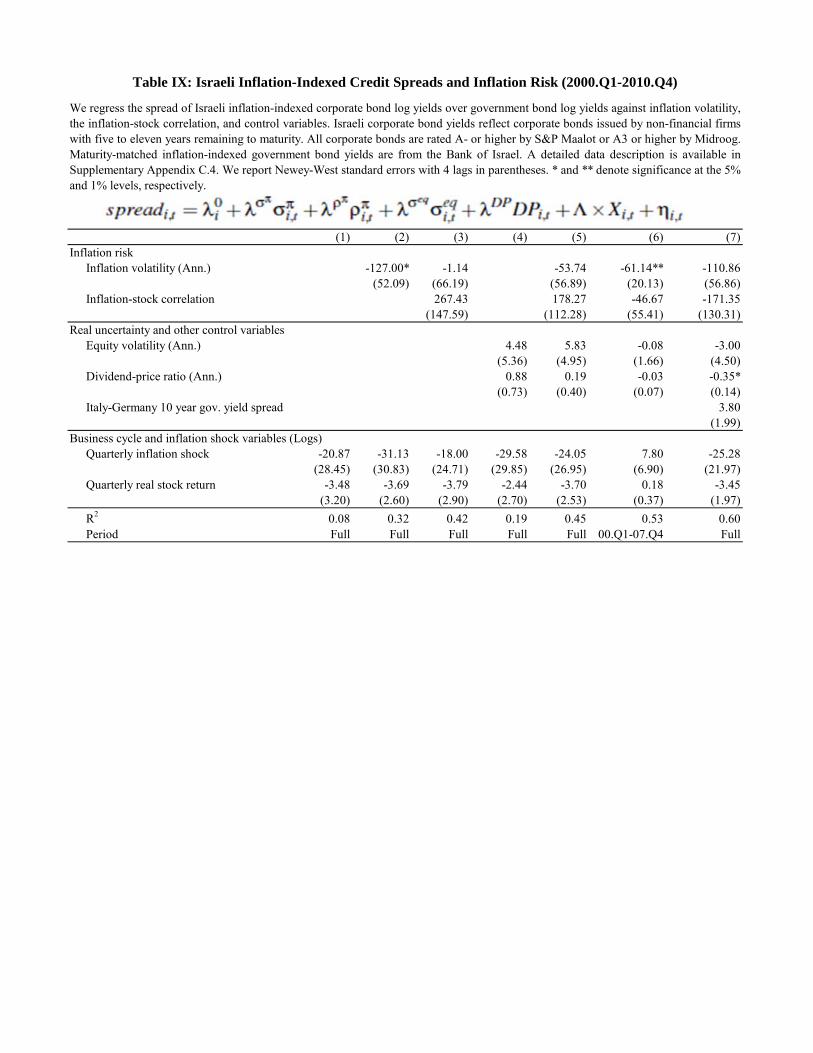
(1) (2) (3) (4) (5) (6) (7)Inflation risk
Inflation volatility (Ann.) -127.00* -1.14 -53.74 -61.14** -110.86(52.09) (66.19) (56.89) (20.13) (56.86)
Inflation-stock correlation 267.43 178.27 -46.67 -171.35(147.59) (112.28) (55.41) (130.31)
Real uncertainty and other control variablesEquity volatility (Ann.) 4.48 5.83 -0.08 -3.00
(5.36) (4.95) (1.66) (4.50)Dividend-price ratio (Ann.) 0.88 0.19 -0.03 -0.35*
(0.73) (0.40) (0.07) (0.14)Italy-Germany 10 year gov. yield spread 3.80
(1.99)Business cycle and inflation shock variables (Logs)
Quarterly inflation shock -20.87 -31.13 -18.00 -29.58 -24.05 7.80 -25.28(28.45) (30.83) (24.71) (29.85) (26.95) (6.90) (21.97)
Quarterly real stock return -3.48 -3.69 -3.79 -2.44 -3.70 0.18 -3.45(3.20) (2.60) (2.90) (2.70) (2.53) (0.37) (1.97)
R2 0.08 0.32 0.42 0.19 0.45 0.53 0.60Period Full Full Full Full Full 00.Q1-07.Q4 Full
We regress the spread of Israeli inflation-indexed corporate bond log yields over government bond log yields against inflation volatility,the inflation-stock correlation, and control variables. Israeli corporate bond yields reflect corporate bonds issued by non-financial firmswith five to eleven years remaining to maturity. All corporate bonds are rated A- or higher by S&P Maalot or A3 or higher by Midroog.Maturity-matched inflation-indexed government bond yields are from the Bank of Israel. A detailed data description is available inSupplementary Appendix C.4. We report Newey-West standard errors with 4 lags in parentheses. * and ** denote significance at the 5%and 1% levels, respectively.
Table IX: Israeli Inflation-Indexed Credit Spreads and Inflation Risk (2000.Q1-2010.Q4)